THE COSTING OF OPERATING THEATRE TIME IN A SECONDARY …
36
THE COSTING OF OPERATING THEATRE TIME IN A SECONDARY LEVEL, STATE SECTOR HOSPITAL A QUANTITATIVE OBSERVATIONAL STUDY Dr John Philip Samuel SMLJOH016 Thesis Presented for the Degree of Masters of medicine (Mmed) In the Department of Anaesthesia and Perioperative Medicine Faculty of Health Sciences UNIVERSITY OF CAPE TOWN Supervisor: Dr ANTHONY REED University of Cape Town
Transcript of THE COSTING OF OPERATING THEATRE TIME IN A SECONDARY …

THE COSTING OF OPERATING THEATRE TIME IN A SECONDARY LEVEL, STATE
SECTOR HOSPITAL
A QUANTITATIVE OBSERVATIONAL STUDY
Dr John Philip Samuel
SMLJOH016
Thesis Presented for the Degree of
Masters of medicine (Mmed)
In the Department of Anaesthesia and Perioperative Medicine
Faculty of Health Sciences
UNIVERSITY OF CAPE TOWN
Supervisor:
Dr ANTHONY REED
Universi
ty of
Cape T
own

The copyright of this thesis vests in the author. No quotation from it or information derived from it is to be published without full acknowledgement of the source. The thesis is to be used for private study or non-commercial research purposes only.
Published by the University of Cape Town (UCT) in terms of the non-exclusive license granted to UCT by the author.
Universi
ty of
Cape T
own

The Costing of Operating Theatre time in a Secondary Level, State Sector Hospital
2

The Costing of Operating Theatre time in a Secondary Level, State Sector Hospital
3
Declaration
I, John Philip Samuel, hereby declare that the work on which this dissertation is based is my
original work (except where acknowledgements indicate otherwise) and that neither the
whole work nor part of it has been, is being, or is to be submitted for another degree in
University of Cape Town or any other university.
This dissertation has been submitted to the Turnitin module (or equivalent similarity and
originality checking software) and I confirm that my supervisor has seen my report and any
concerns revealed by such have been resolved with my supervisor.
This thesis is presented in fulfilment of the requirements for the degree of MMed
I empower the University of Cape Town to reproduce, for the purposes of research, either the
whole or any portion of the contents in any manner whatsoever.
(name)
John Philip Samuel
Date:
___17 September 2020_______________
Signature Removed

The Costing of Operating Theatre time in a Secondary Level, State Sector Hospital
4
Acknowledgments, format and contributions
This thesis is presented in a publication ready format, with the aim of publication being the
South African Medical Journal (SAMJ).
The SAMJ formatting style and referencing convention is used. This includes the font being
Times New Roman (size 12), using UK English as the language and applying the Vancouver
convention style for references.
This thesis would not have been possible without the vital support of my supervisor, Dr
Anthony Reed. His guidance based on his vast experience and knowledge in the field of
hospital and theatre economics was invaluable for the direction of this thesis.
Special thanks to Prof Romy Parker who provided indispensable input regarding the literature
review and finalization of the manuscript.
I also have to thank the Ex-Chief Director Health Infrastructure and Technical Management ,
Western Cape DOH, Mr Andy Cunninghame, for his help and technical expertise in
measuring and calculating the electricity usage in the operating theatre complex, CSSD and
air conditioning units.
Lastly, my deepest thanks to my wife, Frances, and three daughters, for their immeasurable
patience and uplifting presence that carried me through these four years of grinding registrar
work.
The Costing of Operating Theatre time in a Secondary Level, State Sector Hospital
5
Contents
PAGE
List of Appendices 6
List of Tables 7
Abstract 9
Chapter 1 – Introduction and Literature Review 11
Chapter 2 – Publication ready manuscript 17
Appendices 31
Instruction to Authors 33

The Costing of Operating Theatre time in a Secondary Level, State Sector Hospital
6
List of Appendices
Appendix A - Ethics Approval Letter
Appendix B1 - Costing Model Spreadsheet
Appendix B2 - NSH Asset costing list
Appendix B3 - NSH Theatre electricity measurement
Appendix B4 - NSH CSSD electricity measurement
Appendix B5 – NSH Aircon power analysis
Appendix C – Instructions to Authors

The Costing of Operating Theatre time in a Secondary Level, State Sector Hospital
7
List of Tables
1. Table 1 – Costing model method
2. Table 2 – Final costing model

The Costing of Operating Theatre time in a Secondary Level, State Sector Hospital
8
List of Figures
None
Abbreviations:
OTs – Operating Theatres
OT – Operating Theatre
R/min – Rand per minute
UPFS – Uniform Patient Fee Schedule
NSH – New Somerset Hospital
FBU – Functional Business Unit
HR – Human Resources
CSSD – Central Sterilising and Supply Department
SCM – Supply Chain Management
CMS – Costing Model Spreadsheet
ST – Shorter-Term
LT – Longer-Term
EAC – Equivalent Annualised Cost
ABC – Activity Based Costing
ICU – Intensive Care Unit
EC – Emergency Centre
NHI – National Health Insurance

The Costing of Operating Theatre time in a Secondary Level, State Sector Hospital
9
Abstract
Title: The costing of operating theatre time in a secondary level, state sector hospital
Author(s): Dr JP Samuel - SMLJOH016
Date: 2 July 2020
Background: There is no established costing model for operating theatres in South Africa,
yet both sectors have existing charges for operating theatre (OT) time: in the state sector,
Uniform Patient Fee Schedule (UPFS) rates, and in the private sector, Rands/minute (R/min)
rates for OT time. Understanding the cost of providing the separate components of a health
service is important for planning and funding purposes.
Objective: The primary objective of this study was to develop a costing model that would
allow the calculation of the R/min cost of OT time. The secondary objective was to determine
the actual costs, in order to establish the comparable costs that would be included in the
R/min charges for OTs in the private health sector.
Method: The OTs in a secondary level, state sector hospital in Cape Town were used in this
quantitative observational study to develop a top-down costing model for OTs in South
Africa. The inclusive costing model was developed in a consultative process with
professionals, managers and experts from the state and private sector. The model was then
populated with utility measurements (water and electricity) for the month of August 2018,
staff salaries, excluding surgeons and anaesthetists, and other costs for the 2018/19 financial
year.
Results: Costs were considered in the categories of full costs, shared costs and capital or
annualised costs. Due to uncertainty in costing of OTs, two models - with different
annualisation times assigned to the capital costs - were developed to demonstrate the
difference. For shared costs, correction factors were determined using either an activity based
(work-load) factor, or a more generic estimation of workload using theatre nursing staff as a
percentage of total hospital nursing staff. To determine a R/min cost of creating a minute of
available theatre time, all the annual costs were divided by minutes that the OTs are explicitly
available, each year, to provide patient care. The model was then populated with costs using

The Costing of Operating Theatre time in a Secondary Level, State Sector Hospital
10
the appropriate correction factors. The longer annualisation model costed OT time at R31,46
per minute, and the shorter annualisation model at R33,77 per minute.
In both the longer and shorter capital annualisation models, nursing was the largest
contributor to costs at 36% and 33% respectively, followed by construction costs at 9% and
11%, and then OT equipment at 8% and 11%.
Conclusion: An inclusive, top-down costing model for OTs in South Africa was developed.
This costing model will support work to develop costing for individual procedures, the
appropriate charge for planned and emergency OT time, and to better determine budgeting
for OT services. Meaningful critique of the model will improve its fidelity, and likely
increase its utility, especially as SA moves towards universal health coverage.

The Costing of Operating Theatre time in a Secondary Level, State Sector Hospital
11
Chapter One:
INTRODUCTION & LITERATURE REVIEW:
It is estimated that more than 300 million surgical procedures are performed each year
globally [1]. There are no published data that provide the specific number of operations done
in South Africa annually. However, surgical volumes by country have been estimated by the
National Institute for Health Research Global Research Unit on Global Surgery [2]. These
authors estimated a minimum of 735 697 operations annually in South Africa.
There are multiple economic implications of these number of operations being conducted
annually in South Africa to both the state and private health sector. South Africa’s separate
public and private healthcare systems also means that, in the public system, taxpayer money
is spent to provide the service, and in private, surgical services are provided in order to
generate income and, ultimately, profit for a corporation. While the underlying philosophy of
these separate systems is different, the need for cost efficient, evidence-based and justifiable
services remain the same.
South African private hospitals are run, primarily, as businesses with the hospital’s operating
theatres (OTs) possibly one of the most significant generators of income. In the private
system, when a patient undergoes a surgical procedure, they are charged a flat fee, per
minute, for OT time. Patients are billed separately by the surgeon and anaesthetist, as well as
for consumables used during their case. These fees are not included in the per-minute OT
time. The per-minute OT fees charged are needed to recoup the costs of building the
operating theatres, the central sterilising and supply department (CSSD), the recovery
facilities, staffing, cleaning and maintaining all the areas; and supplying all the equipment
needed to provide surgical care. In addition, the fees include a profit margin.
State-funded government hospitals such as New Somerset Hospital (NSH) are mandated to
provide healthcare services to its citizens and receive a budget from government and allocate
these funds appropriately to the different departments within the hospital. A review of the
South African National Department of Health budget for 2018/19 reveals that the total budget
was approximately R200 billion [3]. The Western Cape Department of Health’s budget
allocation in 2017/18 for provincial hospitals was R3.423 billion. New Somerset Hospital
received a budget of R435.637 million. A breakdown of the national budget reveals that 62%
was allocated for salary payments, 30% on goods/services and 3% on buildings/fixed
structures. This budget includes funding for health care services from the primary to the
tertiary level, including surgical services. Unfortunately, the cost of surgical services in the
state sector is difficult to determine based on the figures available with no per-minute OT
costs available.
Despite conducting a thorough search of databases including PubMed, Medline and Cinahl, a
paucity of literature could be found describing costing models to determine per-minute OT
costs. Thus, a narrative review has been performed to explore the individual cost items which
may need to be accounted for when determining per-minute OT costs in a state-funded
hospital such as NSH.

The Costing of Operating Theatre time in a Secondary Level, State Sector Hospital
12
Categories of costs
In order to provide surgical services, the system must provide (i) staff, both medical (nursing,
surgeons and anaesthetists) and non-medical staff (clerks, cleaners, technicians and porters);
(ii) fixed structures like hospitals and operating theatres; (iii) goods/services, such as
equipment and consumables and, finally (iv) provide maintenance of all relevant structures
and equipment. It would therefore be reasonable to propose that a significant portion of the
expenditure for each of these categories could be attributed to providing surgical services. It
is evident that in evaluating the cost of surgical services, multiple categories need to be
evaluated. Healthcare costing models can be divided into two main categories: Capital and
Recurring [4]. Capital costs referring to assets that have a working life of at least one year.
Capital costs in setting up an OT include examples such as a standard anaesthetic machine
that costs approximately R1 million, an anaesthetic monitor (R300 000) and an operating
table (R950 000). It is easy to see that the input costs involved to furnish a theatre with the
necessary equipment will be substantial. Staffing costs may be one of the highest cost factors
as many clinical and non-clinical staff are required in the running of an OT complex.
Recurring costs refer to resources that are consumed within one year or that need regular
replacement. Recurring costs can be classified into Full and Shared costs.
Recurring costs: Full and Shared
Full costs incurred in the provision of surgical services include salaries for essential theatre
staff, electricity use of the OT complex, consumables like chlorhexidine and surgical
protective wear as well as the laundry cost incurred to clean all theatre linen. These are costs
that can be 100% attributable to providing services in an OT complex.
Shared costs may not be as obvious. Not only are maintenance services essential, an
effectively run OT complex also requires that the CEO and hospital top management execute
their duties effectively, along with a well-functioning provincial health management [5]. It
requires that the hospital supply chain management system runs smoothly and competently.
The Engineering department needs skilled staff for minor repairs and maintenance of
structure and equipment [4]. The HR department needs to effectively manage all staff
contracts, overtime and leave etc. in order for theatre staff to rotate effectively and remain
productive [6]. Hospitals spent money on hiring security staff and this security also benefits
the staff and equipment in the OT complex. All of these costs are not directly attributable to
providing surgical services but need to be accounted for in order to obtain a fair financial
picture.
The capital costs are the initial input costs necessary to set up an appropriate OT environment
and are depreciated, or annualized, over time to obtain an annual cost [7]. These costs usually
include the construction costs of theatre, all surgical, anaesthesia and theatre equipment as
well as the linen, drapes and surgical scrubs.
Private Costing models
In private healthcare, a hospital is an important revenue generator for the healthcare company
with the provision of surgical services generating 50-60% of a hospital’s revenue [8]. There is
a paucity of peer-reviewed literature confirming these figures in the private healthcare sector.
However, there appears to be anecdotal consensus that surgical theatres account for the
majority of a private hospital’s income [8,9]]. The advantage of the profit-driven private
healthcare system is that the charges for theatre time are known and generally well laid out

The Costing of Operating Theatre time in a Secondary Level, State Sector Hospital
13
on a relevant company’s tariff schedule which can be found online [10,11]. Private hospitals
divide their theatre time into major and minor theatre time. Minor theatre refers to less
invasive procedures that require minimal nursing support and that are done under local
anaesthesia, while major theatre refers to invasive surgery, requiring full theatre staffing and
general or regional anaesthesia. For the purposes of our model we focused on major theatre
time as this is the primary use of the OT complex at NSH. The tariffs for major theatre time
ranges from R197 to R250 per minute.
In the private healthcare system, patients are billed, by the hospital, for the amount of time
spent in the operating theatre [10,11]. We were unable to find any model for how this fee is
calculated. However, these charges should cover the input costs of buildings, equipment,
maintenance, insurance, nursing staff and include a profit margin. The challenge in drawing
comparisons between these costs in the South African private healthcare system and the
public system comes in evaluating the costs of the surgeon, anaesthetist and consumables.
There are other factors to consider when trying to compare private and public healthcare
costs [12,13]: (i) Private hospitals pay VAT and state hospitals do not. (ii) The consumables in a
public hospital are obtained at state tender prices which are cheaper than prices in the private
sector. (iii) Private hospitals have to pay shareholder returns. (iv) Public hospitals receive
money from the Government budget and do not need to generate income in order to cover
expenses or cost of capital. Therefore, the public health costing models have a different
architecture.
Public health Costing models
As mentioned in the introduction, the only available guide, in state sector, for the costs of
surgical services are found in the Uniform Patient Fee Schedule (UPFS) [14]. The aim of this
schedule is to set a tariff that patients in government hospitals can be charged, according to
their income level, the category of medical staff providing the treatment and the level of
hospital providing care. According to this fee schedule flat fees are charged for certain
surgical services with the time spent in theatre having no influence on the fees. Public
hospitals have the right to charge these tariffs to full paying patients, as well as subsidised
(partially or fully) patients [14]. However, the reality is that public health services are mostly
provided free of charge with the revenue collected being less than 1% of total public sector
expenditure [15,16].
Some of the categories are specified in the UPFS which contribute to the calculation of the
flat fees, namely:
“The fees have been calculated to include overheads cost such as electricity and provision of
general equipment as well as the cost of consumables. The methodology has also taken into
account the salaries of support staff.” [Quote from UPFS user guide]
We could find no other published data on how these fees were calculated. Further
demonstrating the paucity of data that exists surrounding the cost implications, to
government, of providing surgical services to South Africans. The cost implication of theatre
efficiency is one aspect which has been investigated specifically.
Theatre utilisation and efficiency
The cost of providing surgical care is greatly influenced by the efficiency of an OT complex
[17]. The available literature in South Africa seem to suggest that the utilisation rate in public
hospitals is approximately 55% [18]. This figure shows the percentage of total available theatre
time that is being used to provide service. It would also mean that the theatre is ‘standing

The Costing of Operating Theatre time in a Secondary Level, State Sector Hospital
14
empty’ for 45% of the available time. In order to maximise surgical service delivery, an OT
needs to be in use for as much time as is practical with literature recommending optimal
efficiency at 70-80% [18]. The cost for providing the service remains constant but with every
minute that a theatre is empty, money is spent on no service provision and, hence, the true
cost of providing the theatre time increases.
Although theatre efficiency did not form part of our study objective it remains a crucial
component in calculating the true per-minute cost of providing surgical services in public and
private healthcare.
To illustrate this: If it costs R100 per minute to provide surgical services in a theatre that is
staffed and stocked for an eight-hour (480 minutes) workday, then the cost is R48 000 for the
workday, regardless of any surgery being performed. This means R48 000 spent in vain if no
surgery is performed with a utilisation factor of 0. If the theatre has 50% utilisation then it
was used for only 4 hours to provide care and, thus, R48 000 was still spent to cover 240
minutes of service. Therefore, the true cost of providing the surgical services is R200 per
minute. If the utilisation is 70%, then the theatre was used for 336 minutes and the true cost
comes down to R142 per min. A 100% utilisation rate is not deemed possible therefore the
true cost of providing theatre time will always be higher than the baseline cost. This also
illustrates the reason behind the charges for theatre time having to be more than the costs of
theatre time, even if the aim is to ‘break even’ in financial terms.
With the prospect of a National Health Insurance, one could foresee that the government
might want to determine what the cost of providing surgical services are, as there may arise a
situation where a national insurance provider has to be charged for these services. However,
no costing model or economic studies in South Africa could be found that specifically
attempt to calculate this amount. We sincerely hope that our costing model may be a first step
towards the accumulation of useful economic data that will assist policymakers and officials
in implementing effective and efficient surgical services.

The Costing of Operating Theatre time in a Secondary Level, State Sector Hospital
15
REFERENCES
1. Meara JG, Greenberg SLM. The Lancet Commission on Global Surgery Global
surgery 2030: Evidence and solutions for achieving health, welfare and economic
development. Surgery [Internet]. Elsevier BV; 2015 May;157(5):834–835.
http://dx.doi.org/10.1016/j.surg.2015.02.009
2. Elective surgery cancellations due to the COVID-19 pandemic: global predictive
modelling to inform surgical recovery plans. British Journal of Surgery [Internet].
Wiley; 2020 Jun 13. http://dx.doi.org/10.1002/bjs.11746
3. UNICEF. Health Budget Brief – South Africa 2018/19. Pretoria; UNICEF 2018.
https://www.unicef.org/esa/sites/unicef.org.esa/files/2019-03/UNICEF-South-
Africa-2018-Health-Budget-Brief.pdf
4. Özaltın, A, Cashin C. Costing of Health Services for Provider Payment: A
Practical Manual Based on Country Costing Challenges, Trade-offs, and
Solutions. Joint Learning Network for Universal Health Coverage, 2014.
https://www.jointlearningnetwork.org/wp-
content/uploads/2019/11/JLN_Costing_Manual.pdf
5. Weiner BJ, Shortell SM, Alexander J. Promoting clinical involvement in hospital
quality improvement efforts: the effects of top management, board, and physician
leadership. BMC Health Services Research. 1997;32(4):491
6. Kabene SM, Orchard C, Howard JM, Soriano MA, Leduc R. The importance of
human resources management in health care: a global context. Human Resources
for Health [Internet]. Springer Science and Business Media LLC; 2006 Jul
27;4(1). http://dx.doi.org/10.1186/1478-4491-4-20
7. Sinclair DR. Equivalent annual cost: a method for comparing the cost of multi-use
medical devices. Canadian Journal of Anesthesia/Journal canadien d’anesthésie
[Internet]. Springer Science and Business Media LLC; 2010 Mar 2;57(5):521–
522. http://dx.doi.org/10.1007/s12630-010-9287-3
8. Nepogodiev D, Bhangu A. SA hospital groups pinched as elective surgeries end
and occupancies plummet. Medical Brief: Medical Brief.co.za; 2020 May 20.
https://www.medicalbrief.co.za/archives/sa-hospital-groups-pinched-as-elective-
surgeries-end-and-occupancies-plummet/
9. Eustace L. The impact of Covid-19 on the SA private healthcare sector. Absa
healthcare review: Absaafrica; 2020 May 15.
https://www.absa.africa/absaafrica/our-stories/covid-19/the-impact-of-covid-19-
on-the-healthcare-sector/
10. Netcare. Tariff Schedule 2019. Netcare.co.za [Internet]; 2019 Jan.
https://www.netcarehospitals.co.za/Portals/3/Images/Content-images/PDF/2019-
Private-Paying-Patients.pdf

The Costing of Operating Theatre time in a Secondary Level, State Sector Hospital
16
11. Mediclinic. The Mediclinic Southern Africa Private Tariff Schedule 2020.
Mediclinic.co.za [Internet]; 2020 Jan.
https://www.mediclinic.co.za/content/dam/mc-sa-corporate/downloads/stay-and-
visit/Mediclinic%20Southern%20Africa%20Private%20Tariff%20Schedule%20(
South%20Africa%20only)%20-%201%20Jan%202020.pdf
12. Ramjee S. Comparing the Cost of Delivering Hospital Services across the Public
and Private Sectors in South Africa. The Hospital Association of South
Africa(HASA); University of Cape Town; 2013 October
https://www.insight.co.za/wp-content/uploads/2015/07/Comparing-the-cost-of-
hospitalisation-across-the-public-and-private-sectors-in-South-Africa-October-
24.pdf
13. Health Portfolio Committee. Tariff structure setting of the private sector. HASA;
Presentation to Parliamentary Monitoring Group; 2011 July 27.
https://www.google.com/url?sa=t&rct=j&q=&esrc=s&source=web&cd=&ved=2a
hUKEwiat_bWqc3rAhUvZxUIHWosBI0QFjABegQIARAB&url=https%3A%2F
%2Fpmg.org.za%2Ffiles%2Fdocs%2F110727hasa.ppt&usg=AOvVaw3M768hxS
I8iIo2ZrWjsnuW
14. National Department of Health, South Africa. User Guide – UPFS 2018. South
Africa: Pretoria: National Department of Health; 2018
15. Erasmus D, Ranchod S, Abraham M, Bloch J, Carvounes A, Dreyer K.
Challenges and opportunities for health finance in South Africa: a supply and
regulatory perspective. Johannesburg: FinMark Trust; 2016
16. Ranchod S, Adams C, Burger R, et al. South African Health Review 2017.
Durban: Health Systems Trust; 2017; 101-110.
http://www.hst.org.za/publications/south-african-health-review-2017
17. Archer T, Macario A. The drive for operating room efficiency will increase
quality of patient care. Curr Opin Anesthesiol 2006;19(2):171-176.
https://doi.org/10.1097/01.aco.0000192796.02797.82
18. Asmal I, Keerath K, Cronjé L. An audit of operating theatre utilisation and day-
of-surgery cancellations at a regional hospital in the Durban metropole. S Afr Med
J 2019;109 (10): 765-770.
https://doi.org/10.7196/SAMJ.2019.v109i10.13815

The Costing of Operating Theatre time in a Secondary Level, State Sector Hospital
17
Chapter Two: Publication-ready Manuscript
INTRODUCTION:
The development of Global Surgery has highlighted both the crucial role of surgery in health
systems [1] and the financial challenges in developing and growing surgical services [2], of
which a key cost is creating operative time in operating theatres (OTs). Operating theatres are
an expensive component of any acute hospital due to their specialised infrastructure and
equipment requirements [3], coupled with high nurse ratios per patient, and an intensive
requirement for support services such as portering, linen and environmental hygiene.
There is no costing model published for operating theatres in South Africa, from either the
state sector or the private sector. State sector hospitals do not routinely charge for OT time,
there is no available Rand per minute (R/min) cost of their OT time, or indication as to what
portion of their budget is spent on OT. There are however, at least two levied amounts for
operating theatre time in South Africa:
i. Uniform Patient Fee Schedule (UPFS) [4] rates were established using a ‘basket’ of
costs, representative for each surgical procedure, divided into two levied amounts: A
facility fee and a Professional fee, that both depend on the type of professional, and
the level of hospital providing the service. Whilst it is not clear how the UPFS fees
were calculated, the UPFS user guide offers some explanation, stating that the ‘fees
have been calculated to include overheads cost such as electricity and provision of
general equipment as well as the cost of consumables. The methodology has also
taken into account the salaries of support staff.’
ii. Billing rate, per minute, for theatre time in the private health sector, for which we can
find no available costing model. Private hospitals providers have defined charges for
OT time, that funders, or patients, will pay. These charges must incorporate the entire
costs of building, equipping, staffing, operating and maintaining their operating
theatres. This per minute rate must include a profit margin; information used to
determine the, per minute, rate is not freely available.
The recent Health Market Inquiry (HMI) reported that theatre and ward fees had increased
the most from 1997 to 2013. [5] The cost of theatre usage overtook the combined expenses of
medicines and consumables, as a percentage of total costs, in 2006; although the other
combined costs may have been influenced by the growing category of global fees.
The HMI’s final report highlighted the cost contributions due to a lack of reference prices,
combined with reimbursement at cost for all prescribed minimum benefits. [6] The HMI
authors propose an independent and impartial supply-side regulator for healthcare costs, to
determine what are affordable and sustainable charges. The lack of a model to determine the
cost for theatre time, will hamper efforts to regulate charges, and to fund the proposed
National Health Insurance (NHI) plan.
It is important to understand the cost of providing the separate components of a health
service, as is distinguishing the costing from the charge that is levied for such services. [7] The
charge being an amount that will be levied, or billed, for that unit of service, that would
usually include a profit margin.
The primary objective of this study, was to develop a costing model that would allow us to
calculate the R/min cost of OT time, at New Somerset Hospital (NSH), a state sector regional
The Costing of Operating Theatre time in a Secondary Level, State Sector Hospital
18
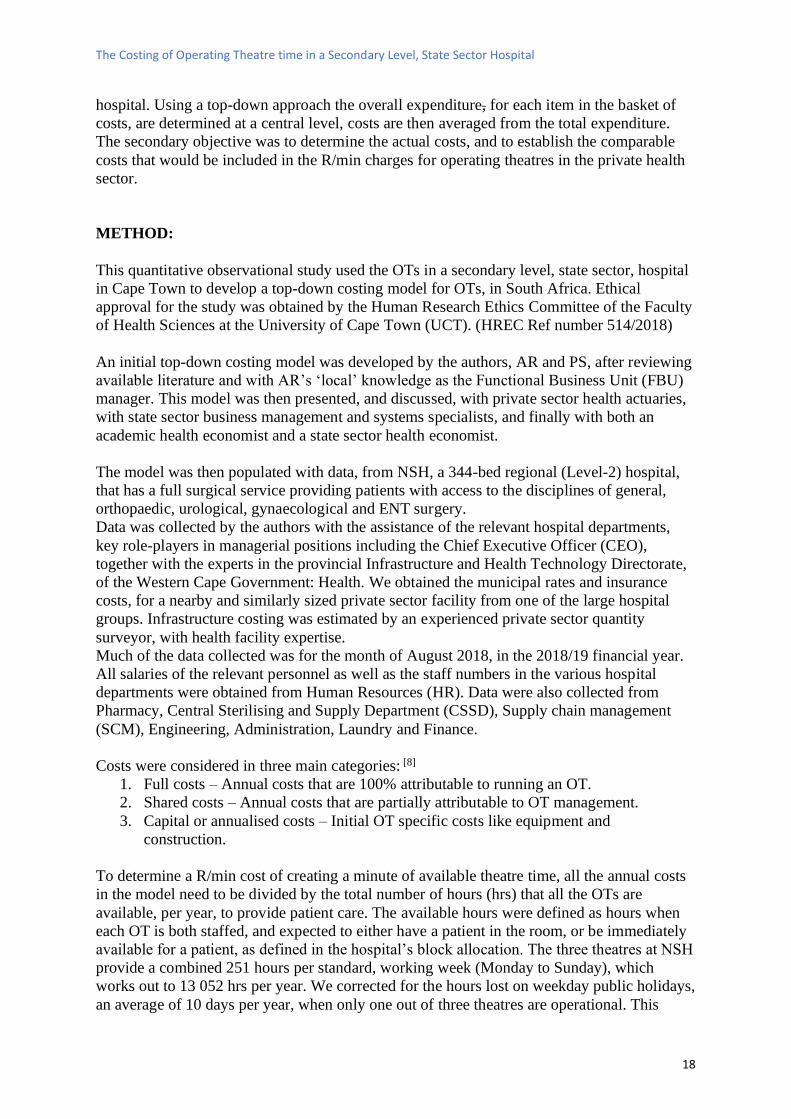
hospital. Using a top-down approach the overall expenditure, for each item in the basket of
costs, are determined at a central level, costs are then averaged from the total expenditure.
The secondary objective was to determine the actual costs, and to establish the comparable
costs that would be included in the R/min charges for operating theatres in the private health
sector.
METHOD:
This quantitative observational study used the OTs in a secondary level, state sector, hospital
in Cape Town to develop a top-down costing model for OTs, in South Africa. Ethical
approval for the study was obtained by the Human Research Ethics Committee of the Faculty
of Health Sciences at the University of Cape Town (UCT). (HREC Ref number 514/2018)
An initial top-down costing model was developed by the authors, AR and PS, after reviewing
available literature and with AR’s ‘local’ knowledge as the Functional Business Unit (FBU)
manager. This model was then presented, and discussed, with private sector health actuaries,
with state sector business management and systems specialists, and finally with both an
academic health economist and a state sector health economist.
The model was then populated with data, from NSH, a 344-bed regional (Level-2) hospital,
that has a full surgical service providing patients with access to the disciplines of general,
orthopaedic, urological, gynaecological and ENT surgery.
Data was collected by the authors with the assistance of the relevant hospital departments,
key role-players in managerial positions including the Chief Executive Officer (CEO),
together with the experts in the provincial Infrastructure and Health Technology Directorate,
of the Western Cape Government: Health. We obtained the municipal rates and insurance
costs, for a nearby and similarly sized private sector facility from one of the large hospital
groups. Infrastructure costing was estimated by an experienced private sector quantity
surveyor, with health facility expertise.
Much of the data collected was for the month of August 2018, in the 2018/19 financial year.
All salaries of the relevant personnel as well as the staff numbers in the various hospital
departments were obtained from Human Resources (HR). Data were also collected from
Pharmacy, Central Sterilising and Supply Department (CSSD), Supply chain management
(SCM), Engineering, Administration, Laundry and Finance.
Costs were considered in three main categories: [8]
1. Full costs – Annual costs that are 100% attributable to running an OT.
2. Shared costs – Annual costs that are partially attributable to OT management.
3. Capital or annualised costs – Initial OT specific costs like equipment and
construction.
To determine a R/min cost of creating a minute of available theatre time, all the annual costs
in the model need to be divided by the total number of hours (hrs) that all the OTs are
available, per year, to provide patient care. The available hours were defined as hours when
each OT is both staffed, and expected to either have a patient in the room, or be immediately
available for a patient, as defined in the hospital’s block allocation. The three theatres at NSH
provide a combined 251 hours per standard, working week (Monday to Sunday), which
works out to 13 052 hrs per year. We corrected for the hours lost on weekday public holidays,
an average of 10 days per year, when only one out of three theatres are operational. This

The Costing of Operating Theatre time in a Secondary Level, State Sector Hospital
19
amounted to 166 hours lost per year and this was deducted from the total available annual
hours to give 12 886 hours which calculates to 773 160 minutes. Please see the Costing
Model Spreadsheet (CMS) for more information.
Patients in private facilities are billed for theatre time separately from the consumables used
for their surgery, and the professional fees of the surgeon and anaesthesiologist, we excluded
the salaries of state employed medical personnel, and only included the general use
consumables required to run operating theatres, that cannot be charged for separately in the
private sector.
It is important to account for the depreciation of infrastructure (building and construction)
capital costs. Private healthcare providers usually annualise their buildings over 20 to 30
years. [9] Medical equipment, including anaesthetic and theatre equipment is usually
annualised over 7 years according to manufacturer’s specifications and according to
advisories produced by American Hospital Association, the Biomedical Advisory Group of
South Australia and the Emergency Care Research Institute (ERCI), an independent not-for-
profit corporation that works to improve the quality of patient care. [10]
In reality, most equipment is used for as long as functional and supported and will frequently
be used for longer than ‘the estimated useful life’. [11,12]
We created a model with two different depreciation times assigned to the capital costs. We
selected to annualise these costs instead of depreciating them, over time, to a zero value.
The higher cost, shorter-term (ST) model contains a 7-year annualisation for surgical and
theatre equipment and a 20-year building annualisation cost; the longer-term (LT) model
contains a 10-year annualisation for equipment and a 30-year building and construction
annualisation.
The Information & Technology (IT) equipment was annualised over three years in both ST
and LT models and the linen cost was the only cost depreciated, to a zero value, over three
years.
The Formula utilised to calculate the Equivalent Annualised Cost (EAC) was: [13]
EAC = Asset price x Discount rate
1-(1+discount rate)-n
Discount rate = return required to make project viable
n = annualised period in years
Purchase cost of the land (7,5%) for a facility should be considered in costing models, but
there is no agreement about costing this price in costing models for 3 reasons: [8] the land
value is dependent on the location, it typically will escalate in value, and the cost is shared
across the whole facility. Our model used a quantity surveyor, ‘normal’ factor, of 7.5% of the
infrastructure cost, as an estimate for the cost of the land.
Table 1 below provides information on how the data was collected and used in the costing
model.
Table 1: Costing Model Method

The Costing of Operating Theatre time in a Secondary Level, State Sector Hospital
20
Costs: Data obtained from: Percentage used for model:
FULL:
Theatre staff* HR (Persal system) 100%
Electricity
Direct measurement of
Theatre and CSSD usage
measured directly by
engineers
100%
Air conditioning energy use
Calculated using hourly
ambient temperatures, to a
control temperature of 18-
21oC for a full year.
100%
Chlorhexidine FBU JAC pharmacy data 100%
Essential Consumables Data from LOGIS system 100%
Laundry
Linen audit from laundry
manager
Capital and “cost per wash”
costing from Provincial
Laundry manager
Daily usage from
Operational manager:
Theatres
100%
SHARED:
HR staff HR - Persal 4%
Supply chain mx staff HR - Persal 23%
CSSD staff HR - Persal 62%
Engineers HR - Persal 40%
Hospital managers HR - Persal 6,8%
Security NSH Budget 6,8%
Head office Provincial Budget 6,8%
Municipal Rates
Private hospital in Cape
Town 6,8%
Insurance
Private hospital in Cape
Town 6,8%
Water
City of Cape Town water
bills 6,8%
Air Conditioning filters and
maintenance
Engineering Dept estimates -
applied to main OT complex
only 50%
CAPITAL:
General Equipment Full theatre inventory
replacement cost Annualised over 7/10 yrs
Surgical packs/trays Inventory from Instrument
Management System Annualised over 7/10 yrs
CSSD equipment Inventory replacement costs Annualised over 7/10 yrs
IT Equipment IT Department Annualised over 3 yrs
Linen
Linen inventory replacement
cost from Provincial
Manager: Laundry Services
Depreciated over 3 yrs

The Costing of Operating Theatre time in a Secondary Level, State Sector Hospital
21
Construction cost
Theatre construction cost/m2
multiplied by theatre and
CSSD floor area. Landcost
(7,5%) added
Annualised over 20/30 yrs
* - Includes theatre nurses,
clerk, cleaners and porters
Shared costs correction factors:
The following explains the correction factors used in our shared costs, as these factors may
be unique to each hospital.
Human Resources (HR):
New Somerset Hospital employs 736 employees, of whom 30 (4%) are employed in the OR.
Thus, a 0.04 factor, of the total employee cost of the HR component, was used to determine
the HR cost.
Supply Chain Management (SCM) and finance staff:
The hospital CEO calculated the percentage of the hospital’s goods and services, and capital
expenditure budgets, allocated to the main theatre suite, from April 2018 to March 2019.
Twenty three percent of the hospitals monetary value, goods and services expenditure, was
related to the main theatre, so a factor of 0.23 was applied, to the total employee cost, of the
hospital’s SCM and finance components.
CSSD staff:
Using a recently installed Instrument Management system in the CSSD, it was determined
that in a typical month, 1860 surgical packs and trays were prepared, of which 1149 (62%)
were for main theatre. The remainder were used in the obstetric theatre complex, and were
excluded in our model. Hence our model used a 0.62 factor against the all-inclusive cost of
the CSSD.
Clinical engineering staff:
A job-card is completed for all work performed by the clinical engineers. Using these job-
cards we determined that 40% of the engineer’s work is done for the main theatre complex,
hence a 0.4 factor was used for the salary costs of the engineers.
Air conditioning plant filters and maintenance
The clinical building has single air conditioning plant providing ducting to 2 equivalent
clinical areas, the filters and annual maintenance costs were obtained from the hospital’s
workshop, and a factor of 50% was utilised.
Workforce correction factor:
Throughout the hospital, the nursing staff are a relatively evenly spread workforce and
therefore the ratio of theatre nurses to total hospital nurses gives us a reasonable idea of the
workforce requirements, or activity-based costing (ABC), of this specific area. [14] The
nursing ratio across the hospital do give a measure of the patient workload intensity,
including the acuity of clinical work in different units, is a key cost driver, and can be broadly

The Costing of Operating Theatre time in a Secondary Level, State Sector Hospital
22
correlated with the hourly billing possible with the highest acuity being the operating
theatres, followed by ICU, High Care, the Emergency Centre (EC), and then the wards. [14,15]
The nursing workforce of the hospital is constituted of 366 nurses, of which 25 (6.8%) are
allocated to the main operating theatre. This correction factor of 0.068 was used throughout
the costing as ‘the workforce correction factor’. We applied this factor to the costs when we
felt no clear method existed to determine the portion specifically attributable to theatre
management.
After the total annual cost was calculated, it was divided by 773 160 minutes of OT time
available in a year, to calculate the R/min cost.
RESULTS:
The full costing model is presented in Table 1, that includes both the LT and ST models. The
LT model calculated one minute of theatre time, at NSH, to cost R31,46 if the relevant
equipment and construction are annualised over 10 and 30 years respectively. The ST model,
annualising equipment over 7 years, and construction over 20 years, showed a cost of R33,77
per minute.
In both models the largest contributor to costs was the cost of nursing, comprising
R11.30/min, and accounted for 36% of the costs in the longer-term model, and 33% in the
shorter-term model. Construction costs comprised the second largest cost component,
comprising 9% in the LT model, and 11% in the ST model. The third largest cost
contribution came from the theatre equipment at R2,66/min (8%) in the LT model, and
R3.65/min (11%) in the ST model. Fourth largest contributor to per minute cost was Head
Office support at R2,12 per minute (7% in LT model and 6% in ST model).
The total costs of our three main categories are presented in Table 2: Final Costing Model

The Costing of Operating Theatre time in a Secondary Level, State Sector Hospital
23
Table 2: Final Costing Model
FULL COSTS: TOTAL AMOUNT (ZAR): Correction Factor
Factored Amount per year
(ZAR)
RAND PER
MINUTE: (ST)
Equipment -
7 yrs
Construction -
20 yrs
RAND PER
MINUTE:
(LT)
Equipment -
10 yrs
Construction -
30 yrs
Nursing staff 8 736 699,34 1,00 8 736 699,34 11,30 11,30
Porters 326 876,42 1,00 326 876,42 0,42 0,42
Theatre Clerk 254 005,12 1,00 254 005,12 0,33 0,33
Cleaners 357 310,04 1,00 357 310,04 0,46 0,46
Electricity 849 205,00 1,00 849 205,00 1,10 1,10
Chlorhexidine 52 904,33 1,00 52 904,33 0,07 0,07
Essential Consumables 1 085 427,00 1,00 1 085 427,00 1,40 1,40
Laundry 907 850,40 1,00 907 850,40 1,17 1,17
SHARED COSTS: Human Resources staff 3 618 088,72 0,040 144 723,55 0,19 0,19
Supply chain
management 4 841 001,89 0,230 1 113 430,43 1,44 1,44
CSSD staff 2 415 577,61 0,620
1 497 658,12
1,94 1,94
Engineers 763 238,22 0,400 305 295,29 0,39 0,39
Hospital Managers (top
7) 8 036 180,00 0,068 546 460,24 0,71 0,71
Security 5 809 000,00 0,068 395 012,00 0,51 0,51
Head Office 24 160 000,00 0,068 1 642 880,00 2,12 2,12
Municipal Rates 6 147 996,16 0,068 418 063,74 0,54 0,54

The Costing of Operating Theatre time in a Secondary Level, State Sector Hospital
24
Insurance 1 131 870,24 0,068 76 967,18 0,10 0,10
Water 1 079 165,11 0,068 73 383,23 0,09 0,09
Air Con
filters/maintenance 164 800,00 0,50 82 400,00 0,11 0,11
CAPITAL COSTS: Equipment in 3 theatres 17 573 890,00 Annualised 7yrs 2 819 340,69 3,65 2,66
CSSD Equipment 2 210 300,00 Annualised 7yrs 354 593,59 0,46 0,34
Surgical packs/trays 5 572 650,00 Annualised 7yrs 894 008,04 1,16 0,84
Construction (Theatre +
CSSD) 42 662 731,65 Annualised 20yrs 2 869 690,30 3,71 2,81
IT Equipment (3 yr
depr) 57 000,00 Annualised 3yrs 20 117,65 0,03 0,03
Linen (3 yr depr) 858 480,86 Depreciated 3yrs 286 160,29 0,37 0,37
Total Annual Cost 26 110 461,97
TOTAL RAND/MIN 33,77 31,46

The Costing of Operating Theatre time in a Secondary Level, State Sector Hospital
25
A full breakdown of the complete costing model can be seen on the CMS.
DISCUSSION:
We developed an inclusive, top-down costing model, approach exploring the costs of
building, equipping, staffing, operational running, and maintenance of, an OT complex. The
model allowed us to estimate the average costs, for each minute in a year, for OTs in a busy
regional hospital, and provides useful data to determine the actual costs of creating OT time.
It should also assist in determining what proportion of a facility’s budget is spent on running
and maintaining their OT.
After the model was populated with costs from all of the categories, a total cost of
approximately R32 per/minute could be calculated for OTs in this state sector hospital.
We included as many relevant costs, as we could, and preferred to overestimate costs in order
to be as inclusive as possible. It can be seen from the available theatre minutes that any
additional annual amount of approximately R700 000 will influence the per minute cost by
approximately R1/min, and therefore a change in costs of R50 000 per year will only
influence the R/min by approximately 6 cents.
One of the strengths of our study was that it was conducted at NSH and there are several
reasons that the Main OTs at NSH were an appropriate site for developing a model for
costing OT time, and for populating that model, as the unit:
• Operates as a discrete unit with a ring-fenced, permanent nursing staff complement
• Has clearly defined hours of operation, with defined blocks available for scheduling cases
in
• Has a low reliance on agency staff
Further strengths included a 2016 audit (unpublished) demonstrating a high raw and adjusted
utilisation, suggesting that they can be classified as a well performing unit, using allocated
daytime blocks well. [16]
The hospital had data to allow a reasonable estimation of the proportion of work that the
main OT required, from the various shared service providers and services within the hospital.
These included:
• Job cards for clinical engineering workload
• CSSD packs from the Instrument Management System
• Electrical reticulation allowed separate measurement of electricity use for both the main
operating theatre and the CSSD
• Data on laundry stock and linen costs was available
• The hospitals FBU structure gave access to budget expenditure, with the assistance of the
CEO
• Pharmacy costs were available from the provincial JAC pharmacy management system
Limitations to our model are the fact that we are designing an original model, that uses
correction factors, none of which have been validated. Air conditioning is from a shared
system, so air conditioning costs were calculated using hourly ambient temperatures, to a
control temperature of 18-21oC for a full year.

The Costing of Operating Theatre time in a Secondary Level, State Sector Hospital
26
In order to meet our secondary objective, we included costs like insurance and municipal
rates that we received from a similar sized private hospital in Cape Town, which we believe
was fair, and utilising these values allowed a better comparison with private sector charges.
Other challenges included methods to fairly include costs like construction and the cost of
land in a hospital built almost 40 years ago. For the cost of the head-office component, only
their annual operating budget was considered, and this does not account for the construction
costs of the head-office infrastructure.
Meaningful critique of the costing model, will improve its fidelity, and will likely increase its
future utility. Tools to measure the cost for individual facilities should prove useful as South
Africa moves towards universal health coverage, and potentially a dominant funder model,
like National Health Insurance (NHI).
The two main approaches in costing studies are, ‘top-down’ or ‘bottom-up’ [8].
Bottom-up costing uses detailed activity and input usage data from records or observed usage
at the service provider level to estimate unit costs.
A bottom-up costing is more appropriate for determining the actual costs of individual
surgical procedures is a much more time and resource intensive method and would not be
possible without the overall cost of establishing and running an operating theatre.
We utilised a top-down approach, to explore the costs of building, equipping, staffing and
running an OT. This approach allows us to estimate the average running costs of the OT and
will provide useful data to determine the actual costs of creating OT time, and to assist in
determining what proportion of a facility’s budget is spent establishing, running and
maintaining their OTs. Others have shown that bottom-up may be more accurate than top-
down costing, but in the setting of costing the generation of a unit of available time,
independent of utilisation rates, top-down may be better. [14]
Our proposed model uses an economic based approach taking into account the cost
(depreciation and interest) of the capital, using a discount factor. The economic approach
includes the opportunity cost of the funds invested, and is distinct from a simple accounting-
based approach (averaging the capital cost over the useful life), and tends to provide a 10-
15% higher annual cost as seen in this model costing theatre time. Variations in the discount
factor used in the economic-based approach has much less of an effect than the difference
between the accounting and economic approaches. [17]
It’s important to consider the difference between the cost and the charge of a service.
Costs are the expenses incurred by the hospital in order to provide a patient service.
Charges are the list prices a hospital must set for the services it provides.
So, whilst we have modelled, and determined a cost per minute of theatre time, that cost
cannot be simply multiplied by the time a patient is in the operating theatre, because of the
utilisation factor [18]. Very efficiently run theatres are occupied by patients for approximately
70% of the time, during allocated daytime blocks, so charges for their use should, at least
include the costs of the ‘unoccupied’ time. Offering an urgent or emergency theatre, will
likely have a much lower utilisation factor, and therefore the availability cost will be
significantly higher than more efficient, allocated, day-time blocks. Previous unpublished
data from these operating theatres demonstrated a raw utilisation of 83% for the weekday
block allocations, the one theatre with a significant emergency case load having a lower raw

The Costing of Operating Theatre time in a Secondary Level, State Sector Hospital
27
utilisation than the 2 theatres with almost entirely scheduled cases. After hours utilisation has
not been formally quantified, but will be far lower.
To demonstrate the impact of utilisation, using the data from our LT model, costing R32/min
at NSH, if we factor in different raw utilisation factors through a 24-hour, 7-day work week:
• A 50% utilisation would cost R64/min
• A 40% utilisation would cost R80/min
• A 30% utilisation would cost R106/min
• A 20% utilisation would cost R160/min
The utilisation factor demonstrates the importance of measuring, and improving utilisation, a
factor controlled by both resource allocation, and daily block allocation and management.
Comparative charges of two major private healthcare companies, for major theatre time were
between R200 to R240/min in 2018 [19,20]. The state sector could create this service, at NSH,
at a cost of approximately R32/min, unadjusted for utilisation, according to our study. The
commercial imperative of private sector healthcare demands a premium added as a profit
margin for shareholders. Therefore, from a business perspective, the charge for theatre time
must be more than the cost for providing the service, as discussed above.
Our model, can be further developed to explore the full costs of procedures taking into
account medical staff, drugs and consumables, but this initial work should prove to be
extremely beneficial. Further research into costing of individual surgical procedures will help
to determine the cost/benefit intervention of surgery in the setting of patient centred
healthcare.
CONCLUSION:
Our costing model provides the first published attempt to create a basket of costs for
calculating the R/min cost of creating the availability of an OT service, in South Africa, and
allows for the reasonable determination of the money spent by the state to provide operating
theatre services in a secondary level hospital. This amount appears to be significantly less
than what is charged for these services in the private sector, however, the difference between
costs and charges for a service must be appreciated. Critique of the model is likely to enhance
its fidelity, thereby improving its utility for future use.
This is the first study in South Africa, as far as we know, that specifically examines the cost
to government to provide an operating theatre service. Further development of OT costing
models will be useful when with the proposed implementation of the NHI, and in determining
the value of individual surgical procedures.

The Costing of Operating Theatre time in a Secondary Level, State Sector Hospital
28
REFERENCES:
1. Meara JG, Greenberg SLM. The Lancet Commission on Global Surgery Global
surgery 2030: Evidence and solutions for achieving health, welfare and economic
development. Surgery [Internet]. Elsevier BV; 2015 May;157(5):834–835.
http://dx.doi.org/10.1016/j.surg.2015.02.009
2. Chao TE, Sharma K, Mandigo M, et al. Cost-effectiveness of surgery and its policy
implications for global health: a systematic review and analysis. The Lancet Global Health
[Internet]. Elsevier BV; 2014 Jun;2(6):e334–e345.
http://dx.doi.org/10.1016/s2214-109x(14)70213-x
3. Childers CP, Maggard-Gibbons M. Understanding Costs of Care in the Operating
Room. JAMA Surgery [Internet]. American Medical Association (AMA); 2018 Apr 18;153
(4): e176233. http://dx.doi.org/10.1001/jamasurg.2017.6233
4. National Department of Health, South Africa. User Guide – UPFS 2018. South
Africa: Pretoria: National Department of Health; 2018.
5. Competition Commission of South Africa. Health Market Inquiry Provisional
Findings and Recommendations Report. July 2018. Page 60.
6. Competition Commission of South Africa. Health Market Inquiry Final Findings and
Recommendations Report. September 2019. Government Gazette No. 42861, 29 November
2019.
https://www.gov.za/sites/default/files/gcis_document/201911/42861gon1533.pdf
7. Macario A. What does one minute of operating room time cost? Journal of Clinical
Anesthesia [Internet]. Elsevier BV; 2010 Jun;22(4):233–236.
http://dx.doi.org/10.1016/j.jclinane.2010.02.003
8. Özaltın, A, Cashin C. Costing of Health Services for Provider Payment: A Practical
Manual Based on Country Costing Challenges, Trade-offs, and Solutions. Joint Learning
Network for Universal Health Coverage, 2014.
https://www.jointlearningnetwork.org/wp-
content/uploads/2019/11/JLN_Costing_Manual.pdf
9. Cunnama L, Sinanovic E, Ramma L, et al. Using Top-down and Bottom-up Costing
Approaches in LMICs: The Case for Using Both to Assess the Incremental Costs of New
Technologies at Scale. Health Economics [Internet]. Wiley; 2016 Jan 14; 25:53–66.
https://doi.org/10.1002/hec.3295
10. Biomedical Engineering Advisory Group. Life span of biomedical devices 2004.
South Australia, BEAG 2004.
http://cedglobal.org/download/Life%20Span%20of%20Biomedical%20Devices%20-
%20Guidance%20Paper%20Final.pdf (accessed 14 June 2019).
11. Prowse P, Kelso S, Austman R. Implementation of a Useful Life Reference for
Medical Devices in Canada. CMBES [Internet]; 2018 May 08; 41.
https://proceedings.cmbes.ca/index.php/proceedings/article/view/688
The Costing of Operating Theatre time in a Secondary Level, State Sector Hospital
29
12. Halbwachs, H. Maintenance and the life expectancy of healthcare equipment in
developing economies. Health estate; 2000 Mar; 54(2): 26-31.
https://pubmed.ncbi.nlm.nih.gov/10915307/
13. Sinclair DR. Equivalent annual cost: a method for comparing the cost of multi-use
medical devices. Canadian Journal of Anesthesia/Journal canadien d’anesthésie [Internet].
Springer Science and Business Media LLC; 2010 Mar 2;57(5):521–522.
http://dx.doi.org/10.1007/s12630-010-9287-3
14. Öker F, Özyapici H. A New Costing Model in Hospital Management. The Health
Care Manager [Internet]. Ovid Technologies (Wolters Kluwer Health); 2013;32(1):23–36.
http://dx.doi.org/10.1097/hcm.0b013e31827ed898
15. Stey AM, Brook RH, Needleman J, et al. Hospital Costs by Cost Center of Inpatient
Hospitalization for Medicare Patients Undergoing Major Abdominal Surgery. J Am Coll
Surg. [Internet]. Elsevier BV; 2015 Feb;220(2):207–217.e11.
http://dx.doi.org/10.1016/j.jamcollsurg.2014.10.021
16. Arcidiacono G, Wang J, Yang K. Operating room adjusted utilization study.
International Journal of Lean Six Sigma [Internet]. Emerald; 2015 Jun;6(2):111–137.
http://dx.doi.org/10.1108/ijlss-02-2014-0005
17. Riewpaiboon A, Malaroje S, Kongsawatt S. Effect of costing methods on unit cost of
hospital medical services. Tropical Medicine & International Health [Internet]. Wiley; 2007
Feb 19;12(4):554–563. http://dx.doi.org/10.1111/j.1365-3156.2007.01815.x
18. Hartmann D, Sunjka B. Private theatre utilisation in South Africa: A case study.
South African Medical Journal [Internet]. South African Medical Association NPC; 2013
Mar 13;103(5):285. http://dx.doi.org/10.7196/samj.6460
19. Netcare. Tariff Schedule 2019. Netcare.co.za [Internet]; 2019 Jan.
https://www.netcarehospitals.co.za/Portals/3/Images/Content-images/PDF/2019-Private-
Paying-Patients.pdf
20. Mediclinic. The Mediclinic Southern Africa Private Tariff Schedule 2020.
Mediclinic.co.za [Internet]; 2020 Jan.
https://www.mediclinic.co.za/content/dam/mc-sa-corporate/downloads/stay-and-
visit/Mediclinic%20Southern%20Africa%20Private%20Tariff%20Schedule%20(South%20A
frica%20only)%20-%201%20Jan%202020.pdf

The Costing of Operating Theatre time in a Secondary Level, State Sector Hospital
30
31
Appendices:
Appendix A: Ethical Approval Letter
Signature Removed

The Costing of Operating Theatre time in a Secondary Level, State Sector Hospital
32
Appendix B: Data Collection Documents
B1 – Costing Model Spreadsheet (CMS) Cost ing Model
Spreadsheet .xlsx
(Also contains tabs that describe the cost calculations of the different categories in more
detail)
B2 – NSH Asset list NSH Asset
list .xlsx
(Contain the full asset list of the NSH OT complex with replacement costs indicated for each
item by Engineering dept.)
B3 – NSH Theatre electricity analysis NSH Theat res
power analysis 27
(Contains the main OT complex electricity usage as measured and calculated by Engineering
dept)
B4 – NSH CSSD electricity analysis NSH CSSD power
analysis 27 Aug
(Contains the electricity usage requirements and cost calculation of CSSD)
B5 – NSH Aircon power analysis NSH AC cost
calculat ion 2018 -
(Contains the measurement and calculation of the electricity usage of the OT complex
airconditioning unit)

The Costing of Operating Theatre time in a Secondary Level, State Sector Hospital
33
Appendix C: Instructions to authors – SAMJ Guidelines
Research
Guideline word limit: 4 000 words
Research articles describe the background, methods, results and conclusions of an original research study. The article should contain the following sections: introduction, methods,
results, discussion and conclusion, and should include a structured abstract (see below). The introduction should be concise – no more than three paragraphs – on the background to the research question, and must include references to other relevant published studies that clearly lay out the rationale for conducting the study. Some common reasons for conducting a study are: to fill a gap in the literature, a logical extension of previous work, or to answer
an important clinical question. If other papers related to the same study have been published previously, please make sure to refer to them specifically. Describe the study methods in as much detail as possible so that others would be able to replicate the study should they need to. Results should describe the study sample as well as the findings from the study itself, but all interpretation of findings must be kept in the discussion section, which should consider primary outcomes first before any secondary or tertiary findings or
post-hoc analyses. The conclusion should briefly summarise the main message of the paper and provide recommendations for further study.
Select figures and tables for your paper carefully and sparingly. Use only those figures that provided added value to the paper, over and above what is written in the text.
Do not replicate data in tables and in text .
Structured abstract
• This should be 250-400 words, with the following recommended headings: o Background: why the study is being done and how it relates to other published work. o Objectives: what the study intends to find out
o Methods: must include study design, number of participants, description of the intervention, primary and secondary outcomes, any specific analyses that were done on the data.
o Results: first sentence must be brief population and sample description; outline the results according to the methods described. Primary outcomes must be described first, even if they are not the most significant findings of the study.
o Conclusion: must be supported by the data, include recommendations for further study/actions.
• Please ensure that the structured abstract is complete, accurate and clear and has been approved by all authors.
• Do not include any references in the abstracts.
Main article
All articles are to include the following main sections: Introduction/Background, Methods, Results, Discussion, Conclusions.
The following are additional heading or section options that may appear within these:
• Objectives (within Introduction/Background): a clear statement of the main aim of the study
and the major hypothesis tested or research question posed
• Design (within Methods): including factors such as prospective, randomisation, blinding, placebo control, case control, crossover, criterion standards for diagnostic tests, etc.
• Setting (within Methods): level of care, e.g. primary, secondary, number of participating centres.

The Costing of Operating Theatre time in a Secondary Level, State Sector Hospital
34
• Participants (instead of patients or subjects; within Methods): numbers entering and completing the study, sex, age and any other biological, behavioural, social or cultural factors (e.g. smoking status, socioeconomic group, educational attainment, co-existing disease
indicators, etc)that may have an impact on the study results. Clearly define how participants were enrolled, and describe selection and exclusion criteria.
• Interventions (within Methods): what, how, when and for how long. Typically for randomised controlled trials, crossover trials, and before and after studies.
• Main outcome measures (within Methods): those as planned in the protocol, and those ultimately measured. Explain differences, if any.
Results
• Start with description of the population and sample. Include key characteristics of comparison groups.
• Main results with (for quantitative studies) 95% confidence intervals and, where appropriate,
the exact level of statistical significance and the number need to treat/harm. Whenever possible, state absolute rather than relative risks.
• Do not replicate data in tables and in text.
• If presenting mean and standard deviations, specify this clearly. Our house style is to present this as follows:
• E.g.: The mean (SD) birth weight was 2 500 (1 210) g. Do not use the ± symbol for mean (SD).
• Leave interpretation to the Discussion section. The Results section should just report the findings as per the Methods section.
Discussion
Please ensure that the discussion is concise and follows this overall structure – sub-headings are not needed:
• Statement of principal findings
• Strengths and weaknesses of the study
• Contribution to the body of knowledge
• Strengths and weaknesses in relation to other studies
• The meaning of the study – e.g. what this study means to clinicians and policymakers
• Unanswered questions and recommendations for future research
Conclusions
This may be the only section readers look at, therefore write it carefully. Include primary conclusions and their implications, suggesting areas for further research if appropriate. Do not go beyond the data in the article.
Tables
• Tables should be constructed carefully and simply for intelligible data representation.
Unnecessarily complicated tables are strongly discouraged.
• Large tables will generally not be accepted for publication in their entirety. Please consider shortening and using the text to highlight specific important sections, or offer a large table as an addendum to the publication, but available in full on request from the author
• Embed/include each table in the manuscript Word file - do not provide separately as supplementary files.
• Number each table in Arabic numerals (Table 1, Table 2, etc.) and refer to consecutively in the text.

The Costing of Operating Theatre time in a Secondary Level, State Sector Hospital
35
• Tables must be cell-based (i.e. not constructed with text boxes or tabs) and editable.
• Ensure each table has a concise title and column headings, and include units where necessary.
• Footnotes must be indicated with consecutive use of the following symbols: * † ‡ § ¶ || then ** †† ‡‡ etc.
Do not: Use [Enter] within a row to make ‘new rows’:
Rather:
Each row of data must have its own proper row:
Do not: use separate columns for n and %:
Rather:
Combine into one column, n (%):
Do not: have overlapping categories, e.g.:
Rather:
Use <> symbols or numbers that don’t overlap:
References
NB: Only complete, correctly formatted reference lists in Vancouver style will be accepted. Reference lists must be generated manually and not with the use of reference manager software. Endnotes must not be used.
• Authors must verify references from original sources.
• Citations should be inserted in the text as superscript numbers between square brackets, e.g. These regulations are endorsed by the World Health Organization,[2] and others.[3,4-6]
• All references should be listed at the end of the article in numerical order of appearance in the Vancouver style (not alphabetical order).
• Approved abbreviations of journal titles must be used; see the List of Journals in Index Medicus.
• Names and initials of all authors should be given; if there are more than six authors, the first three names should be given followed by et al.
• Volume and issue numbers should be given.
• First and last page, in full, should be given e.g.: 1215-1217 not 1215-17.
• Wherever possible, references must be accompanied by a digital object identifier (DOI) link).
Authors are encouraged to use the DOI lookup service offered by CrossRef: o On the Crossref homepage, paste the article title into the ‘Metadata search’ box. o Look for the correct, matching article in the list of results. o Click Actions > Cite o Alongside 'url =' copy the URL between { }. o Provide as follows, e.g.: https://doi.org/10.7196/07294.937.98x