The Cost of Unemployment Insurance: Part IIThe Cost of Unemployment Insurance: Part II . By. W. S....
10
The Cost of Unemployment Insurance: Part II By W. S. Woytinsky* In this article, the second of two, the author discusses the effect of statutory and administrative factors on the operation of an unemployment insurance system and outlines the implications of the findings on cost estimates for the future development of a rounded social security program. As in all Bulletin articles, the opinions expressed are those of the author and do not necessarily reflect the official views of the Social Security Administration. THE PRECEDING ARTICLE dealt with esti- mates of the volume of compensable unemployment in relation to long- range cost estimates of an unemploy- ment insurance program. By means of simplified "models" it showed how the volume of compensable unemploy- ment was affected by possible combi- nations of labor-market conditions, in terms of rates of unemployment and labor turn-over, changes in the level of employment, and heterogeneity of the labor force. This article is con- cerned with the effect of administra- tive factors on the operation of the program and with estimates of the possible average volume of compensa- ble unemployment in the course of a business cycle. In conclusion, an at- tempt is made to translate those find- ings into tentative cost estimates for various benefit formulas and for vari- ous assumptions related to the avail- able reserve funds that can be utilized as an auxiliary source for financing the program under unfavorable busi- ness conditions. Impact of Administrative Factors Since all State unemployment in- surance laws provide benefits for a limited duration of unemployment, we started our study of costs of un- employment insurance with an anal- ysis of the proportion of unemployed workers in specified duration inter- vals. Actually, however, compens- able unemployment is not identical with unemployment in a definite du- *Formerly Principal Consulting Econ- omist, Bureau of Employment Security; now Visiting Professor, Johns Hopkins University. The first article appeared in the May 1948 Bulletin. ration interval. The most important administrative factors that cause compensable unemployment to deviate from the strict duration pattern as discussed in the first article are the method of measuring the duration of benefits and the provisions in State unemployment insurance laws for the variable maximum and for disallow- ances and disqualifications. Effect of Benefit-Year Concept on Duration of Benefits State unemployment insurance laws determine the duration of benefits either uniformly for all eligible claim- ants (uniform maximum duration) or in accordance with the employment and earnings experience of the indi- vidual claimant in a preceding 12- month period (variable duration). In either case the statutory duration relates to a period of 52 consecutive weeks, which in some States is a spe- cific period set by the State law (uni- form benefit year) and in other States varies for the individual claimant (individual benefit year), most com- monly starting with the first week for which he files a valid claim for benefits. All State unemployment insurance laws but one provide for a maximum cumulative amount or duration of benefits during the benefit year, in- stead of relating these maximums to a single spell of unemployment. Only the first spell of unemployment dur- ing a benefit year, therefore, is com- pensable for the duration indicated by the benefit formula (for example, 14, 20, or 26 weeks). If a claimant returns to work after exhausting his benefit rights and becomes unem- ployed again during the same benefit year, he is not eligible for benefits un- til the beginning of a new benefit year. However, if his benefit rights were not completely exhausted in his first spell of unemployment, he is entitled to the remaining benefits up to the cumulative maximum or up to the end of the benefit year. Thus, in States that provide a uni- form duration, the potential duration of a claimant's benefits during a single spell of unemployment amounts to the statutory duration minus the duration of any unemployment for which he had already obtained bene- fits in the same benefit year. On the other hand, the method of defining the eligibility of unemployed workers for a 12-month period (benefit year) on the basis of their employment ex- perience in a preceding 12-month pe- riod (base year) may make workers who were unemployed longer than the statutory maximum duration eligible for benefits in a new benefit year with- out intervening employment. Even in States with uniform dura- tion and individual benefit years, therefore, the potential compensable interval—in terms of the number of weeks elapsed after separation—is longer than the statutory maximum in some cases and shorter in others. The cumulative effect of the fac- tors curtailing the duration of bene- fits and those tending to increase the duration depends on business condi- tions. In prosperous times, when relatively few workers are without jobs and the employed labor force is fluid, many workers may have short spells of unemployment during a year; only a few will remain out of work for any appreciable period, how- ever, and the previous compensable unemployment of the separated work- ers cannot be substantial on the ave- rage. A similar situation develops at the depth of a depression—when more than 20 percent of all workers are un- employed, for example, and the labor market is extremely rigid. In these circumstances, there are few shifts between employment and unemploy- ment; single spells of unemployment are long, and few persons are likely to have more than one spell of com- pensable unemployment during the same benefit year. When a worker loses his job for the second time during the benefit year, however, he is likely
Transcript of The Cost of Unemployment Insurance: Part IIThe Cost of Unemployment Insurance: Part II . By. W. S....

The Cost of Unemployment Insurance: Part II
By W. S. Woytinsky* In this article, the second of two, the author discusses the
effect of statutory and administrative factors on the operation of an unemployment insurance system and outlines the implications of the findings on cost estimates for the future development of a rounded social security program. As in all Bulletin articles, the opinions expressed are those of the author and do not necessarily reflect the official views of the Social Security Administration.
T H E PRECEDING ARTICLE dealt w i th estimates of the volume of compensable unemployment i n relat ion to long-range cost estimates of an unemployment insurance program. B y means of simplified "models" i t showed how the volume of compensable unemployment was affected by possible combinations of labor-market conditions, i n terms of rates of unemployment and labor turn-over, changes i n the level of employment, and heterogeneity of the labor force. This art icle is concerned w i t h the effect of administrative factors on the operation of the program and w i t h estimates of the possible average volume of compensable unemployment i n the course of a business cycle. I n conclusion, an attempt is made to translate those f ind ings in to tentative cost estimates for various benefit formulas and for v a r i ous assumptions related to the avai l able reserve funds t h a t can be util ized as an auxi l iary source for financing the program under unfavorable business conditions.
Impact of Administrative Factors
Since a l l State unemployment i n surance laws provide benefits for a l i m i t e d dura t ion of unemployment, we started our study of costs of u n employment insurance w i t h an analysis of the propor t ion of unemployed workers i n specified dura t ion in tervals. Actual ly, however, compensable unemployment is not identical w i t h unemployment i n a definite du -
*Formerly Principal Consulting Economist, Bureau of Employment Security; now Visiting Professor, Johns Hopkins University. The first article appeared in the May 1948 Bulletin.
ra t ion interval . The most impor tan t administrative factors t ha t cause compensable unemployment to deviate from the s t r ic t dura t ion pat tern as discussed i n the first ar t icle are the method of measuring the dura t ion of benefits and the provisions i n State unemployment insurance laws for the variable max imum and for disallowances and disqualifications.
Effect of Benefit-Year Concept on Duration of Benefits
State unemployment insurance laws determine the dura t ion of benefits either un i formly for al l eligible c la imants (uni form max imum durat ion) or i n accordance w i t h the employment and earnings experience of the i n d i vidual claimant i n a preceding 12-month period (variable dura t ion) . I n either case the s tatutory durat ion relates to a period of 52 consecutive weeks, which i n some States is a specific period set by the State law ( u n i form benefit year) and i n other States varies for the ind iv idua l claimant (individual benefit year ) , most commonly s tar t ing w i t h the first week for which he files a va l id c la im for benefits.
A l l State unemployment insurance laws but one provide for a m a x i m u m cumulative amount or dura t ion of benefits dur ing the benefit year, i n stead of relat ing these maximums to a single spell of unemployment. Only the first spell of unemployment during a benefit year, therefore, is compensable for the dura t ion indicated by the benefit formula (for example, 14, 20, or 26 weeks). I f a claimant returns to work after exhausting his benefit r ights and becomes unemployed again dur ing the same benefit year, he is not eligible for benefits u n
t i l the beginning of a new benefit year. However, i f his benefit r ights were not completely exhausted i n his first spell of unemployment, he is enti t led to the remaining benefits up to the cumulative maximum or up to the end of the benefit year.
Thus, i n States tha t provide a u n i fo rm duration, the potential dura t ion of a claimant's benefits dur ing a single spell of unemployment amounts to the statutory durat ion minus the durat ion of any unemployment for which he had already obtained benefits i n the same benefit year. On the other hand, the method of defining the el igibi l i ty of unemployed workers for a 12-month period (benefit year) on the basis of their employment experience i n a preceding 12-month per iod (base year) may make workers who were unemployed longer than the statutory maximum durat ion eligible for benefits i n a new benefit year w i t h out intervening employment.
Even i n States w i t h un i form durat ion and individual benefit years, therefore, the potential compensable in terval—in terms of the number of weeks elapsed after separation—is longer than the statutory maximum i n some cases and shorter i n others.
The cumulative effect of the factors cur ta i l ing the duration of benefits and those tending to increase the durat ion depends on business conditions. I n prosperous times, when relatively few workers are wi thou t jobs and the employed labor force is fluid, many workers may have short spells of unemployment during a year; only a few w i l l remain out of work for any appreciable period, however, and the previous compensable unemployment of the separated workers cannot be substantial on the average.
A similar situation develops at the depth of a depression—when more than 20 percent of a l l workers are u n employed, for example, and the labor market is extremely r ig id . I n these circumstances, there are few shifts between employment and unemployment; single spells of unemployment are long, and few persons are l ikely to have more than one spell of compensable unemployment dur ing the same benefit year. When a worker loses his job for the second time dur ing the benefit year, however, he is l ikely

to discover tha t his benefit r ights were largely or completely exhausted dur ing the previous spell of unemployment.
On the other hand, i f a moderate unemployment rate—for example, about 10 percent—is combined w i t h a h igh separation rate—say, more than 5 percent per 4 weeks—two or more spells of unemployment w i t h i n a benefit year become more usual, and an appreciable proport ion of the separated workers are l ikely to have exhausted at least pa r t of their benefit r ights during an earlier spell of u n employment w i t h i n the same benefit year.
The relative number of persons whose benefit r ights are prolonged beyond the statutory max imum because they are entit led to benefits i n 2 consecutive benefit years likewise varies w i t h changing business conditions. Under typical conditions, this proport ion is unlikely to exceed 2 percent when unemployment is low, and i t may reach 4 or 5 percent when unemployment is heavy—15 percent or more. The probable net balance of the two factors depends on the level of unemployment. I f unemployment is low, both factors are practically negligible. W i t h mount ing unemployment the practical significance of the cur ta i lment of the potential durat ion increases and tends to outweigh the effect of the extension of benefits beyond a benefit year. A l l i n al l , when more than 15 percent of the labor force is out of work, compensable unemployment may be 3 to 6 percent less than the to ta l volume of unemployment i n the statutory benefit-duration interval .
Impact of the Heterogeneity of the Labor Force
The impact of the e l iminat ion of the assumption of perfect homogenei t y of the labor force (equal chance of reemployment for a l l unemployed persons and equal risk of te rminat ion of jobs for a l l employed workers) remains to be examined. I t seems plausible t ha t a newly hired worker has a greater probabil i ty of being separated t h a n does an old employee of a f i rm . This factor tends to i n crease the proport ion of persons w i t h several spells of unemployment dur ing a single benefit year. I n other words,
the spells of unemployment w i l l be distributed not at random but among a narrower circle of individuals ; when one of this group becomes unemployed, he has probably exhausted a large part of his benefit r ights i n the preceding spells of unemployment. I n addit ion, the new assumption suggests that , among the persons who are out of work at the close of the benefit year, the proportion who have insufficient wage credits to qualify for benefits i n the new year just beginning is higher than among a l l persons covered by the program. Thus , the u n even distributions of the risks of unemployment and the chances of reemployment tend to reduce the average potential durat ion of benefit payments and consequently the volume of compensable unemployment. The effect of this factor on the volume of compensable unemployment cannot be estimated exactly since the computat ion would necessarily rest on a number of more or less a rb i t ra ry assumptions. A rough and purely tentative estimate of the impact of this factor at 3 to 6 percent seems to be on the conservative side.
Variable Maximum Duration I n adopting the principle of the
variable max imum durat ion, which relates the claimant's potent ial m a x i m u m durat ion of benefits to his employment and earnings i n his base period, the aim is to reduce the probab i l i ty t ha t the unemployment t rus t fund w i l l be drained by persons who are loosely attached to the labor market and have comparatively long interrupt ions between short spells of employment. This principle is applied i n 37 States tha t include more than 75 percent of the t o t a l covered labor force, while the principle of u n i fo rm durat ion is used i n the other 14 States, w i t h less t h a n 25 percent of al l covered employment.
The impact of a variable m a x i m u m durat ion varies widely f rom State to State and f rom year to year. I t may be measured by comparing the statutory max imum w i t h the average actual durat ion for claimants who exhausted their benefit r ights . I n 1941, for example, Alabama and Rhode Island had the same m a x i m u m durat ion of 20 weeks of benefits for c la imants who qualified for the max imum,
but the average actual dura t ion for claimants who exhausted their r ights i n the benefit year was 17.3 weeks i n Alabama and 9.2 weeks i n Rhode Island. Bo th Iowa and Vermont i n tha t year had a statutory max imum duration of 15 weeks, but the average actual durat ion for claimants exhausting the i r rights was 8.5 and 13 weeks, respectively. The weighted-average statutory maximum for a l l States w i t h variable m a x i m u m prov i sions amounted i n 1941 to 17.4 weeks, but the average actual durat ion for al l persons who exhausted their benefits was only 10.4 weeks. The impact of a variable maximum-dura t ion provision is conditioned to a large extent by the eligibil i ty requirements i n State laws.
The statutory maximum of 26 weeks, therefore, does not necessarily imply tha t a l l the unemployment i n the durat ion brackets of 2 to 28 weeks is compensable. The statutory provision of a variable max imum entitles workers strongly attached to the labor market to benefits dur ing 26 weeks, but i t does not promise the same protection to persons w i t h lower earnings, who constitute a substantial proport ion of the unemployed. As a rule, therefore, the average potential du ra t ion for al l claimants under such a program is substantially lower t h a n 26 weeks. A program w i t h a variable durat ion and a statutory max imum of 26 weeks must be fa i r ly l iberal for persons w i t h irregular employment i f a l l the claimants are to have an average benefit durat ion of 22 weeks-
A l l i n a l l , the experience of States w i t h a variable max imum dura t ion suggests tha t the principle of adjusting the durat ion of benefits to the employment and earnings records of individual claimants may reduce the volume of compensable unemployment significantly. I n estimating costs of an unemployment insurance program, serious at tention should be paid, therefore, to provisions reducing the maximum duration of benefits for definite groups of claimants. The present article, however, deals w i t h a program providing only u n i f o r m durat ion of benefits.
Disallowances and Disqualifications When an i n i t i a l c la im is filed i n a
local office, the agency must f i rs t of

al l determine whether the claimant is ent i t led to benefits. Often the c la imant may not have sufficient wage credits to be eligible. His previous earnings i n covered industries may prove to be insufficient, the establishment by which he was employed may not have been covered by the State unemployment insurance law, or he may have exhausted his benefit r ights dur ing an earlier spell of unemployment i n the same benefit year. I n brief, not al l i n i t i a l claims mark the beginning of a spell of unemployment tha t is compensable i n the statutory dura t ion interval .
The propor t ion of i n i t i a l claims disallowed i n a State because of insufficient wage credits depends on a great variety of factors, such as the qual i fy ing earnings requirement itself, the composition of the labor force, the coverage of the State law, the procedure of claims t ak ing and disposit ion of new claims, and the extent to which workers are famil iar w i t h the State law and aware of their rights. The proport ion of disallowances may also vary w i t h business conditions.
I n a l l , 6.3 percent of a l l i n i t i a l claims were disallowed i n 1945 and 8.5 percent i n 1946 because of insufficient wage credits. I n individual States the percentage of i n i t i a l claims disallowed i n 1945 ranged f rom an estimated 0.6 percent i n Wisconsin to 13.9 percent i n Mary land . I n 1946 the estimated range was f rom 1.6 percent i n Wisconsin to 18.4 percent i n Florida.
T o the disallowances because of the lack or insufficiency of wage credits are added denials of benefits because of the claimant's unavailabil i ty for work and disqualifications for volunt a r i l y leaving the job wi thout good cause, misconduct, refusal of suitable work, and other reasons. The respective provisions of State laws are far f r o m un i fo rm, and administrative practices vary widely. The proport ion of denials and disqualifications may be affected also by changing business conditions. The proport ion of eligible i n i t i a l claims denied on the issue "able to work and available for work" amounted to 5.8 percent i n 1945 and 6.9 percent i n 1946. Disqualif icat ion determinations as a proport i on of a l l such claims were 5.3 and 6.2 percent, respectively, i n the same 2-year period.
Table 10.—Unemployment rate,1 in a hypothetical 10-year business cycle
End of year
Favorable conditions Medium conditions Unfavorable conditions
End of year Pattern
(1) Pattern
(2) Pattern
(1) Pattern
(2) Pattern
(1) Pattern
(2)
1 5 5 5 5 5 5 2 5 5 5 15 10 15 3 5 10 12.5 15 20 15 4 10 10 20 15 25 25 5 10 10 20 20 25 25 6 10 10 20 15 25 25 7 5 10 12.5 15 20 15 8 5 5 5 15 10 15 9 5 5 5 5 5 5 10 5 5 5 5 5 5
Average rate for the period 6.5 7.5 11 12.5 15 15
1 Employed persons as percent of labor force.
The impact of disallowances and disqualifications on benefit disbursements may be roughly estimated as follows. Denials usually refer to a single week. Assuming tha t on the average each beneficiary is on the rolls for 10 weeks, 5 denials per 100 in i t i a l claims would mean about 0.5 denials per 100 compensable claims and would reduce the to ta l number of compensable weeks propor t ionately. Disqualifications may affect the benefit r ights of beneficiaries for several weeks and may represent a reduction i n benefits even when the penalty is only postponement of payments. Assuming t h a t each disqualification is equivalent to a net loss of 3 to 5 weeks of benefits, the cumulative effect of disqualifications of about 5 percent of a l l claimants may reduce the to ta l amount of the i r benefits by 1.5 to 2.5 percent. Thus, denials and disqualifications may have cut the benefit load by 2 to 3 percent.
The impact of these administrative factors on the volume of compensable unemployment may be summarized as follows:
Total 15 to 23 percent
The effect of measurement of cumulative duration of benefits 3 to 6 percent
The effect of measurement of cumulative duration of benefits 3 to 6 percent
The effect of measurement of cumulative duration of benefits 3 to 6 percent
The impact of accumulation of repeated spells of unemployment among the same persons (heterogeneity of the labor force) 3 to 6 percent
The impact of accumulation of repeated spells of unemployment among the same persons (heterogeneity of the labor force) 3 to 6 percent
The impact of accumulation of repeated spells of unemployment among the same persons (heterogeneity of the labor force) 3 to 6 percent
The impact of accumulation of repeated spells of unemployment among the same persons (heterogeneity of the labor force) 3 to 6 percent
The impact of accumulation of repeated spells of unemployment among the same persons (heterogeneity of the labor force) 3 to 6 percent
The impact of accumulation of repeated spells of unemployment among the same persons (heterogeneity of the labor force) 3 to 6 percent
Disallowances 7 to 8 percent Denials and disqualifica
tions 2 to 3 percent Denials and disqualifica
tions 2 to 3 percent
This estimate does no t take in to account the effect of var iabi l i ty i n the max imum durat ion.
Unemployment Insurance in a Business Cycle
To estimate the long-range cost of unemployment insurance i t is necessary to visualize the operation of the program throughout a typical business cycle. There is no compelling reason why this cycle should repeat the pat tern of 1923-33. Economic developments i n tha t period appear to have been exceptional, and their repetit ion i n the coming years is not very probable. I n developing models of a more or less typical and probable cycle, various assumptions may be used and some of them are i l lustrated i n chart 5.1
The types of economic development presented i n this chart are described as "favorable," "medium," and " u n favorable," depending upon the severi t y of the economic set-back i n the depression phase of the cycle. The shape of the patterns examined is irrelevant for the subsequent discussion. Only three general characteristics are essential: (a) the assumpt ion of a satisfactory level of employment at the beginning and at the end of the 10-year period; (b) the assumpt ion tha t employment declines i n the early phase of the cycle and rises i n its later phase; and (c) the range of var iat ion i n the average volume of unemployment i n the three types of economic development—favorable, medium, and unfavorable.
The rate of unemployment according to these patterns averages 6.5 to 7.5 percent under favorable conditions, 11 to 12.5 percent under medium
1 Charts 1-4 and tables 1-9 appeared in the first article.

conditions, and 15 percent i n the event of an exceptionally severe depression i n the middle of the 10-year period.
Variations i n the unemployment rate for the 10 years of the hypothet ical business cycle are shown i n table 10. These figures require substantial adjustment, however, i f changes i n the size of the labor force are taken in to consideration. On the assumption tha t there were 60 mi l l i on persons i n the labor force at the beginning of the 10-year cycle and 66 mi l l i on at its end, 63 m i l l i o n persons would be i n the labor force i n the middle of the period, under normal conditions. This may be the case i n the pat tern exemplified i n panel A of chart 5. Independently of the gradual growth of the labor force (at the rate of 1 percent a year) , however, new job seekers invade the labor market during a protracted depression and constitute a steadily growing f ract ion of the unemployed labor force. A t the depth of a depression— i f we assume an unemployment rate of 25 percent for several years as i n the unfavorable pattern—the labor force would be much larger t h a n at the beginning of the 10-year period and migh t decline i n the more advanced phase of the cycle, when conditions improve. Assuming tha t when unemployment rises by 1 m i l l i o n its increase includes 150,000 to 200,000 "addit ional workers," i t is l ikely t ha t the labor force would be inflated by 1.5 to 2 mi l l ion under medium conditions (when the unemployment rate is supposed to reach 20 percent) and by 3 mi l l ion under unfavorable conditions (when unemployment rises to 25 percent) . Under this assumption, the labor force migh t vary dur ing the 10-year cycle somewhat as shown i n chart 6.
I f this pat tern of var ia t ion i n the labor force is combined w i t h the changes i n the unemployment rate suggested by chart 5, the average absolute volume of unemployment throughout the 10-year period w i l l appear higher than suggested above. The impact of changes i n the labor force on covered unemployment and its relat ion to the covered labor force is very different, however. Since new entrants into the labor market—not only emergency workers but also boys and girls graduating from school—are
jo in ing the ranks of the unemployed but, having no wage credits, are not pa r t of the covered labor force, the ra t io of covered unemployment to covered employment i n the advanced phase of a depression is lower t h a n the corresponding rat io for the non-covered labor force. I t is conceivable, i n fact, tha t under unfavorable business conditions the covered labor force would decline from m o n t h to m o n t h while the total labor force was expanding through the inf lux of "addi t i ona l " workers.
Though this reaction can hardly be measured statistically, i t seems sound to assume that the growth of the covered labor force w i l l stop when the
unemployment rate is as h igh as 15 percent and the number covered w i l l decline i f the t ide of unemployment mounts above this mark.
I f covered unemployment is defined as including al l unemployed persons w i t h some work experience i n covered industries and s t i l l seeking work i n these industries, i t is likely to change th rough a heavy depression as shown i n chart 7.
This chart portrays the development i n the labor market through a 10-year period when the unemployment rate varies as i n the panels B and C of chart 5 and the total labor force changes as i n chart 6. I t is assumed tha t under favorable em-
Chart 5.—Hypothetical variations in the rate of unemployment* during a 10-year cycle
PERCENT 100
•Employed persons as percent of labor force.

Chart 6.—Hypothetical variations in the size of the labor force in a 10-year cycle, assuming considerable unemployment in the middle of the period
ployment conditions (at the beginning and at the end of the cycle) ha l f of the to ta l labor force is attached to covered industries. Excluding 500,-000 unemployed persons seeking work i n these industries but lacking work experience, the covered labor force would amount to 29.5 mi l l i on
(60,000,000 \2 -500,000) at the beginning of the surveyed period and 32.5 mil-lion (66,000,000 \2 -500,000) 10 years later. The half of the total labor force represented by the upper curve
on each plot i n chart 7 is assumed to fo rm a hump above the hypothetical long-range t rend line, whi le the line of the covered labor force deviates downward. The re tardat ion i n the growth of the covered labor force cuts covered unemployment to almost ha l f at the deep point of the depression. 2
The hypothet ical pa t t e rn of v a r i ations i n the ra t io of covered unemployment to covered labor force, u n -
2 For a fuller discussion see the author's monograph, Principles of Cost Estimates in Unemployment Insurance, ch. 7. :
der these conditions, is i l lustrated i n table 11.
To estimate the compensable u n employment dur ing these hypothet i cal business cycles, definite assumptions had to be made regarding the probable effective separation rates.3
A n examination of the ratios of i n i t i a l claims to average covered employment dur ing past periods i n d i cates that , for the Nat ion as a whole, an average effective separation rate of 2 percent for the 10-year hypothetical cycles is reasonable. Assuming a 2-percent separation rate and the covered unemployment rates presented i n table 11, i t is possible to estimate the average annual compensable unemployment per 100,000 workers, under unemployment insurance programs providing benefits for 14, 20, and 26 weeks for a l l eligible c la imants after a 1-week wai t ing period. Such estimates are shown i n table 12.4 From this table, hypothetical
3 In the first article, the "effective" separation rate was defined as the ratio of initial claims filed during a year to average employment.
4 For more detailed discussion, see the monograph.
Table 11.—Variations in covered unemployment rates (percent) in a hypothetical 10-year cycle
End of year
Favorable conditions Medium conditions Unfavorable conditions
End of year Pattern
(1) Pattern
(2) Pattern Pattern
(2) Pattern
(1) -Pattern
(2)
1 3.4 3.4 3.4 3.4 3.4 3.4 2 3.4 3.4 3.4 12.1 7.0 10.7 3 3.4 8.5 9.1 10.8 14.2 9.4 4 8.5 8.5 15.1 10.1 16.3 16.9 5 8.5 8.5 13.6 14.4 15.0 15.0 6 8.6 8.6 15.9 8.2 16.0 15.3 7 3.5 8.6 7.3 9.2 12.7 12.2 8 3.5 3.5 3.5 10.9 6.3 12.0 9 3.5 3.5 3.8 3.5 3.3 3.1 10 3.5 3.5 3.5 3.5 3.5 3.5 Average rate during period 5.0 6.0 7.9 8.6 9.8 10.1

Chart 7.—Hypothetical variations in the size of the covered labor force in a 10-year cycle, assuming considerable unemployment in the middle of the period
average annual ratios of compensable unemployment per 100,000 persons i n covered employment may be readily derived (table 13).
A t first sight i t may seem puzzling tha t the average compensable unemployment under the most unfavorable conditions differs so l i t t l e f rom tha t anticipated for the favorable course of events. This difference does not appear understated i f the contrast between favorable and unfavorable business conditions is examined more closely. The difference lies i n the number of workers laid off i n the decl ining phase of the business cycle. I n both the unfavorable and the fa vorable patterns, these workers are added to the number suffering f r i c -
t ional unemployment. T h e incre-, ment may be measured as the difference between the volume of unem-ployment at the deepest p o i n t of the depression "and tha t assumed for the" same period under favorable condi-tions. For the pat tern discussed, the difference between favorable and u n -favorable conditions is 15 percent of the total labor force or 15,000 per 100,000 workers, but only about 8 percent of the covered labor force or 8,000 per 100,000 covered workers. I f throughout the whole 10-year cycle f r ic t ional unemployment remained the same as under the most favorable assumption and the workers la id off because of deteriorating business con- ;
ditions had no chance of f inding jobs
before the end of the depression, the • additional load of compensable u n
employment would amount to 8,000 times the statutory maximum durat ion of benefit payments. For a program w i t h a max imum durat ion of 14 weeks, the addit ional load would be 112,000 weeks, for one w i t h a 26-week maximum, 208,000. Distr ibuted over a period of 10 years, the addit ional weekly load would approximate 215 per 100,000 workers i n the first case and 400 per 100,000 i n the second.
Adminis t ra t ive factors tend to reduce this addi t ional load, while the decline i n work opportunities for the workers who are assumed to be out of work under any business conditions acts i n the opposite direction.
Cost of Unemployment Insurance
Most benefit formulas under State unemployment insurance laws are designed to furnish compensation amounting to 50 percent of the earnings lost by an individual worker because of unemployment. This does not mean, however, tha t the weekly benefits paid by the States to unemployed beneficiaries amount on the average to 50 percent of the weekly earnings of employed workers i n covered industries. I n fact, unemployment is not distr ibuted at random among workers i n different earnings classes. Those i n the higher wage brackets, such as skilled factory workers, foremen, high-grade whi te-collar employees, and officials w i t h executive and managerial responsibility, are no t exposed to the same risk of u n employment as the rest of the covered labor force. On the other hand, manual laborers and young workers wi thou t experience or special skills are exposed to a higher-than-average risk of unemployment. The seniori t y rule and indiv idual selection operate i n the same direct ion: persons who have been w i t h the same f i r m many years are l ikely to earn more than those whose work is interrupted t ime and again by spells of unemployment.
Al though available unemployment insurance statistics provide no direct comparison between average earnings of claimants and those of other covered workers, they show conclusively

Table 12.—Average annual compensable unemployment per 100,000 workers in a hypothetical 10-year cycle, with allowance for heterogeneity of the labor force and administrative factors
Business conditions
Uniform duration of benefits (after a 1-week waiting period)
Business conditions
14 weeks 20 weeks 26 weeks
Favorable: Pattern (1) 2,430 2,715 3,000 Pattern (2) 2,805 3,080 3,475
Medium: Pattern (1) 2,775 3,230 3,685 Pattern (2) 2,910 3,568 4,080
Unfavorable: Pattern (1) 2,805 3,450 3,995 Pattern (2) 2,815 3,490 4,030
t h a t benefit payments of unemployed workers average less than 50 percent of the average weekly earnings of workers i n covered employment. I f the max imum weekly benefit amount payable under each State law i n effect at the close of 1946 were increased to $25 and wages paid by an employer to an employee were taxed up to $3,600, instead of $3,000, dur ing a calendar year the average weekly benef i t rate could safely be estimated at 45 percent of average weekly taxable earnings for the Nat ion as a whole.
The cost rate—benefit expenditures as a percent of taxable wages—can be estimated f r o m the fol lowing for m u l a : (compensable unemploymentx average weekly benefit amount) ./. (average covered employment X average taxable weekly wage). This formula is identical w i t h the product of two ra t ios : (compensable unemployments ./. average covered employment) and (average weekly benefit amounts ./. average taxable weekly wage).
B y substi tut ing 45 percent for the ra t io of average weekly benefits to average taxable weekly wages in the second formula , the cost rate is found to be equal to 45 percent of the ra t io of compensable unemployment to average covered employment. B y app ly ing the mul t ip l ier 0.45 to the ratios of compensable unemployment to 100 persons i n covered employment, der ived f r o m table 13, the probable average annual cost of unemployment insurance through the hypothetical 10-year cycle as a percent of taxable wages is determined (table 14).
I t should be borne i n m i n d tha t these figures refer to benefit load and
include no allowance for the administ rat ive cost of the program. Neither do they make allowance for the possible changes i n the pa t tern of t u r n over of unemployment, such as an agreement of employers and labor unions on ro ta t ing employed workers dur ing a depression.
Fur thermore the cost rates i n table 14 are hypothetical averages; the actual cost for a single year i n an i n dividual State may be considerably lower or higher. The extremes tend to offset each other i n the course of a cycle, however, and the ul t imate cost of a program w i t h benefits at 50 percent of wages up to a m a x i m u m of $25, a wai t ing period of 1 week, plus 26 •weeks' dura t ion is l ikely to average about 1.5 percent of pay r o l l s 5 under favorable conditions, 1.9 percent i f a depression develops i n which 20 percent of the labor force is unemployed, and perhaps sl ight ly more t h a n 2.0 percent i f the depression is more severe and about 25 percent of the labor force is unemployed. A program provid ing benefit payments for 20 weeks w i l l cost 1.3 to 1.5 percent of taxable pay rolls under favorable business conditions and 1.8 percent under the most unfavorable conditions. The average cost of a program w i t h 14 weeks' dura t ion may range, under the two extreme sets of assumptions, between 1.2 percent and somewhat less than 1.5 percent. The cost rates should be raised by 0.1 or 0.2 percent i f the program also provides for part i a l and pa r t - to ta l benefits.
Al though the difference between the unfavorable and medium patterns i n table 14 is not large, i t Is w o r t h stressi n g the poin t tha t the perspectives exemplified by the unfavorable patterns are no t very probable for the next decade. I n a realistic appraisal of the probable unemployment load, an unemployment rate of more than 15 percent i n the near future should be discarded. W i t h this correction, 2 percent of taxable pay rolls appears as the probable l i m i t of the cost of benefits under a program w i t h a u n i fo rm m a x i m u m dura t ion of benefits of 26 weeks and a weekly benefit rate averaging 45 percent of average taxable weekly wages.
* Includes wages paid by an employer to an employee up to $3,600 per year.
Table 13.—Average compensable unemployment per 100,000 persons in covered employment in a 10-year cycle, with allowance for heterogeneity of the labor force and administrative factors 1
Business conditions
Uniform duration of benefits (after a 1-week waiting period)
Business conditions
14 weeks 20 weeks 26 weeks
Favorable: Pattern (1) 2,558 2,858 3,158 Pattern (2) 2,984 3,277 3,697
Medium: Pattern (1) 3,013 3,507 4,001 Pattern (2) 3,184 3,904 4,464
Unfavorable: Pattern (1) 3,109 3,825 4,429 Pattern (2) 3,131 3,882 4,483
1 Figures in this table derived by dividing the figures in table 12 by following ratios: favorable conditions, 0.950 and 0.940; medium conditions, 0.921 and 0.914; unfavorable conditions, 0.902 and 0.899.
I n brief, the long- run cost of u n employment insurance seems to be less than one- th i rd of the estimates made when the original Social Security Act was being drafted.
Reserve Funds The accumulation of reserve funds
by State unemployment insurance agencies has introduced a new and impor tan t factor i n long-range cost estimates of the program. I t is generally recognized t h a t a reserve fund bui l t up i n a period of prosperity should serve to ensure the solvency of the program i n t ime of depression. Such a contingency reserve is part icu lar ly necessary i f the program is financed by moderate current contr ibutions. Reserve funds serve their purpose, however, only i f they are actually used f rom t ime to t ime: current contributions should be kept just above the l i m i t of expenditures i n good years. A program w i t h huge reserves tha t continue to rise through al l the phases of a business cycle is overflnanced and may exercise a deflat ionary effect on the economic system. I t may even contribute to a rise of unemployment, by withholding f rom circulat ion a pa r t of the current purchasing power. B y the end of 1947, more t h a n $7.3 bi l l ion—or the equivalent of 10 percent of taxable wages dur ing tha t year—had been accumulated by the States i n their unemployment insurance funds. The smallest reserves—in relat ion to tax-
able pay rolls—were i n Michigan (5.7 percent) , Massachusetts (5.8 percent) , Alabama (6.9 percent) , Delaware (7.4 percent) , and Oklahoma and Texas (7.9 percent) . Eleven States—Florida, I l l inois , Indiana, New Mexico, N o r t h Dakota, Pennsylvania, South Carolina, South Dakota, V i r ginia, West Virgin ia , and Wyoming— had reserves ranging between 8.4 and 9.9 percent of taxable pay rolls. I n 33 States, the ratios ranged f rom 10.0 to 14.2 percent, and one State—New Jersey—had a ra t io of 15.2 percent.
So long as reserves of individual States are not pooled, each State must rely on i ts own reserve fund i n p lanning its unemployment insurance system. Such planning should take account of the possibility tha t the reserve fund may be depleted i n the lean years but w i l l be at least par t ly restored dur ing the recovery tha t is supposed to characterize the final phase of the cycle i n our six hypothetical patterns. I n other words, a t the end of the 10-year period, the reserve fund should not have fal len below a specified l i m i t .
The difference between the i n i t i a l size of the fund and the hypothet ical m i n i m u m to which the fund may be reduced at the end of the period may be prorated over 10 years as the cont r ibu t ion of the reserve to financing the program. For example, i f the reserve fund amounted to 15 percent of annual taxable pay rolls at the beginn ing of operations and migh t be reduced over the period to 10 percent, the annual contr ibut ion f rom this source to financing the program would be equivalent to 0.5 percent of pay rolls. To this amount the interest earned by the fund should be added, say 0.3 percent of pay rolls i n the first year of the cycle and 0.2 percent i n the last year, or an average of 0.25 percent annually for the whole per iod . I n this instance, the cont r ibut i on of the reserve and interest earned would average 0.75 percent of taxable pay rolls annually.
These general considerations may be applied to different levels of reserve funds at the beginning of the hypothetical 10-year period. I f the period begins w i t h a reserve fund amounting to 5 percent of taxable pay rolls, this fund w i l l probably suffice as a cont ingency reserve dur ing a depression.
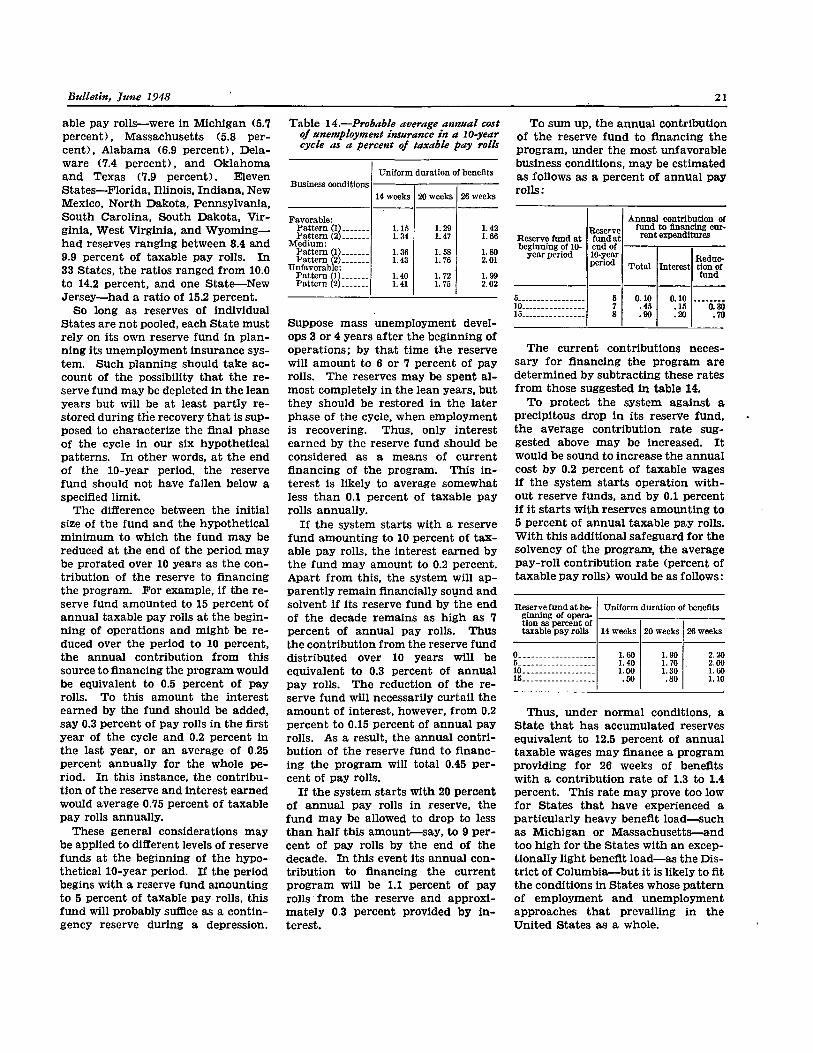
Table 14.—Probable average annual cost of unemployment insurance in a 10-year cycle as a percent of taxable pay rolls
Business conditions Uniform duration of benefits
Business conditions 14 weeks 20 weeks 26 weeks
Favorable: Pattern (1) 1.15 1.29 1.42 Pattern (2) 1.34 1.47 1.66
Medium: Pattern (1) 1.36 1.58 1.80 Pattern (2) 1.43 1.76 2.01
Unfavorable: Pattern (1) 1.40 1.72 1.99 Pattern (2) 1.41 1.75 2.02
Suppose mass unemployment develops 3 or 4 years after the beginning of operations; by tha t t ime the reserve w i l l amount to 6 or 7 percent of pay rolls. The reserves may be spent a l most completely i n the lean years, but they should be restored i n the later phase of the cycle, when employment is recovering. Thus, only interest earned by the reserve fund should be considered as a means of current financing of the program. This i n terest is l ikely to average somewhat less t h a n 0.1 percent of taxable pay rolls annually.
I f the system starts w i t h a reserve fund amounting to 10 percent of t axable pay rolls, the interest earned by the fund may amount to 0.2 percent. Apar t f rom this , the system w i l l apparent ly remain financially sound and solvent i f i ts reserve fund by the end of the decade remains as h igh as 7 percent of annual pay rolls. Thus the contr ibut ion f rom the reserve fund distr ibuted over 10 years w i l l be equivalent to 0.3 percent of annual pay rolls. The reduction of the reserve fund w i l l necessarily cur ta i l the amount of interest, however, f r o m 0.2 percent to 0.15 percent of annual pay rolls. As a result, the annual c o n t r i but ion of the reserve fund to financi n g the program w i l l to ta l 0.45 percent of pay rolls.
I f the system starts w i t h 20 percent of annual pay rolls i n reserve, the fund may be allowed to drop to less t h a n ha l f this amount—say, to 9 percent of pay rolls by the end of the decade. I n this event its annual cont r ibu t ion to financing the current program w i l l be 1.1 percent of pay rolls f rom the reserve and approximately 0.3 percent provided by i n terest.
To sum up, the annual contr ibut ion of the reserve fund to financing the program, under the most unfavorable business conditions, may be estimated as follows as a percent of annual pay ro l l s :
Reserve fund at beginning of 10-
year period
Reserve fund at end of 10-year period
Annual contribution of fund to financing current expenditures Reserve fund at
beginning of 10-year period
Reserve fund at end of 10-year period Total Interest
Reduction of fund
5 5 0.10 0.10 ---
10 7 .45 .15 0.30 15 8 .90 .20 .70
The current contributions necessary for financing the program are determined by subtracting these rates f rom those suggested i n table 14.
To protect the system against a precipitous drop i n i t s reserve fund, the average contr ibut ion rate suggested above may be increased. I t would be sound to increase the annual cost by 0.2 percent of taxable wages i f the system starts operation w i t h out reserve funds, and by 0.1 percent i f i t starts w i t h reserves amounting to 5 percent of annual taxable pay rolls. W i t h this addit ional safeguard for the solvency of the program, the average pay- ro l l contr ibut ion rate (percent of taxable pay rolls) would be as follows:
Reserve fund at beginning of operation as percent of taxable pay rolls
Uniform duration of benefits Reserve fund at beginning of operation as percent of taxable pay rolls 14 weeks 20 weeks 26 weeks
0 1.60 1.90 2.20 5 1.40 1.70 2.00 10 1.00 1.30 1.60 15 .50 .80 1.10
Thus, under normal conditions, a State t h a t has accumulated reserves equivalent to 12.5 percent of annual taxable wages may finance a program providing for 26 weeks of benefits w i t h a contr ibut ion rate of 1.3 to 1.4 percent. This rate may prove too low for States tha t have experienced a par t icu lar ly heavy benefit load—such as Mich igan or Massachusetts—and too h i g h for the States w i t h an except ional ly l igh t benefit load—as the Dist r i c t of Columbia—but i t is l ikely to fit the conditions i n States whose pat tern of employment and unemployment approaches tha t prevail ing i n the Uni ted States as a whole.

How To Utilize Unemployment Insurance Reserves
The conclusion is inescapable: the existing system of State unemployment insurance, which at the t ime of its inauguration seemed to be threa t ened by insolvency, has proved to be overfinanced. I t is s t i l l overfinanced i n many States, despite the increased durat ion of benefits, shortened wai t ing period, and curtai led contr ibut ion rates i n a l l State programs.
Several factors have been responsible for this s i tuat ion: the extreme, though defensible, conservatism of the unemployment insurance program as incorporated i n the original Social Security Act; the sudden up tu rn i n la bor-market conditions under the i m pact o f the defense program and war boom; the comparatively l igh t unemployment dur ing mobil ization and reconversion; the favorable employment outlook for the coming years.
Because of the concurrence of a l l these factors, the aggregate reserve funds of State unemployment insurance agencies are now about $5 b i l l ion larger than they need be as a comfortable contingency reserve. Even i f a l l the State programs were revised to provide for 26 weeks of benefits and i f contribution rates were curtai led as suggested i n this article, the reserve funds would not decline much dur ing the next 10 years. Furthermore, i t is not certain tha t they w i l l decline at a l l . I f unemployment is stabilized on a level slightly higher than now, i f the cyclical set-backs i n production i n the coming years are not very severe and are par t ly absorbed by the practice of sharing the work, and i f Federal and State public works are t imed i n such a way as to offset the business cycle, the suggested contr ibut ion rates may prove to be too h igh and the Federal-State unemployment insurance system would have, by the end of the 1950's, the same amount of reserves as now. Under par t icular ly favorable conditions, the reserve may even rise by tha t t ime to $10 bi l l ion .
I t may be argued tha t no h a r m was done by the accumulation of reserves dur ing the war and tha t no h a r m w i l l result f rom their further rise u n der the hypothetical conditions described. Dur ing the war the surplus of collections over outlays i n the u n
employment insurance system acted as a deflationary (ant i - inf lat ionary) measure. As long as there was a surplus of purchasing power i n the N a t ion t h a t could not be used because of the shortage of consumer goods, ext rac t ion f rom circulation of a few b i l l i on dollars of idle money tended to d iminish the inflat ionary pressure on the economic system and had no adverse effect on the real earnings of workers or the standard of l iv ing of other consumers.
I t may be argued also tha t the hypothet ical conditions tha t migh t result i n a fur ther growth of reserve funds i n the coming years presume the predominance of inflat ionary forces i n our economy, and i n such a si tuation a program w i t h a surplus of collections over disbursements would be preferable to one operating i n the red.
F rom the standpoint of economic theory, these are very serious arguments. I t should be borne i n mind , however, t ha t unemployment insurance is essentially a tool of social po l icy rather than pa r t of an economic program. The purely economic effect of an unemployment insurance program of the usual type is necessarily l imi ted by the fact that , i n the event of a heavy and long depression, the benefit payments can offset only a small fraction of the losses i n earnings and purchasing power of the population. W i t h contributions amounting to 1.3 percent of taxable wages and outlays f luctuat ing between 1 and 2 percent of wages, the con t r i but ion of such a program to the N a tion's economic equil ibrium throughout a business cycle cannot be very impor tan t . I ts contr ibut ion to the security of individuals exposed to the r isk of unemployment, however, is considerable. Not only does i t protect mill ions of temporari ly unemployed workers and their families f r o m need and destitution, but i t also gives a feeling of security to scores of mil l ions of persons who are threatened by the possible in ter rupt ion of their earnings.
Unemployment insurance has the same purpose as other branches of social security: to ensure a m i n i m u m income to those suffering the risk at the t ime the risk is incurred. I t contributes to the general welfare by the
fact t ha t i n terms of satisfaction of needs, each dollar, i n its operation, weighs more when i t reaches the claimant than i t weighed when i t was collected.
F r o m this point of view, accumulat ion and perpetuation of huge reserves constitute a serious shortcoming i n the present program. W h y should bil l ions and billions of dollars be kept sterile when they could be put to work for the advantage of the community?
There is no formula tha t shows the op t imum level of the unemployment insurance funds and how they should be used to serve most effectively the goals of social policy and the general welfare. A strong argument migh t be made, however, i n favor of u t i l iz ing the surpluses of the funds for promoting the security of the work ing population w i t h respect to those risks tha t are not covered by the present program. Temporary disabil i ty is such a risk and one tha t f rom the point of view of the affected individuals is not essentially different f rom the risk of unemployment. The main difference between the two hazards is that , i n the case of temporary disability, the in ter rupt ion of current earnings is combined w i t h addi t ional expenditures for doctors' bills and medicine.
I t is realized tha t the issue of heal th protect ion and medical help to low-income groups of the population is too complex to be handled i n connection w i t h the problem of reserve funds of the unemployment insurance system. But at least one aspect of this issue— the problem of in te r rupt ion i n the flow of earnings—is very close to the objective of unemployment insurance. A worker can be protected against the risk of temporary disability i n the same way as against the risk of unemployment and under the same program, properly amended.
Three States have already expanded their unemployment insurance programs to include temporary disability insurance. Unemployment insurance protection for ra i l road workers has also been extended to cover the risk of illness. I n a dozen more States the problem is under consideration, i n various phases of discussion and legislat ive action. The t rend i n this direct i on is perfectly clear, and i t seems

appropriate to stress here how the discussion of the cost of unemployment fits into this new development i n social security i n the United States.
The conclusion of our analysis of the long-range costs of unemployment insurance is that this fo rm of social insurance is much less expensive than i t was believed to be 10 years ago and tha t i t can be made st i l l less expensive by the proper ut i l izat ion of existing reserve funds. This conclusion implies tha t i f , i n the future, the community is wi l l ing to spend for the social security program the same fract ion of current incomes as i t was ready to put aside for unemployment insurance i n 1935, i t can protect i ts workers not only against the risk of unemployment but also against the risk of temporary disability.
According to the opinion of experts, satisfactory insurance against tempora ry disability migh t be financed by contributions at a rate of 1 percent of pay rolls, whether split between employers and employees as i n old-age and survivors insurance or collected by a pay- ro l l tax on employers. The wr i te r believes tha t a spli t arrangement is preferable because i t would encourage direct par t ic ipat ion of employees and employers i n the program's operation. Star t ing w i t h a reserve fund amounting to 10 percent of annual taxable pay rolls, a j o i n t program of unemployment and temporary disabili ty insurance—for 26 weeks of benefits—might be financed i n this case by a combination of a 2-percent pay- ro l l tax and an 0.5-per
cent employee contr ibut ion, w i t h the provision tha t , i f disbursements are larger than collections, the difference w i l l be met dur ing the next 5 or 10 years from the reserve fund.
Such an arrangement would require, of course, a revision of certain provisions of the Social Security Ac t and of State laws, and enactment of measures to protect the solvency of States tha t would start operation w i t h insufficient reserves. The problem might be solved i n different ways which cannot be discussed i n detail i n the present article. I t suffices to state here t h a t the difficulties are t r i v i a l i n comparison w i t h those the Nat ion has surmounted since the i n auguration of its social security p ro gram.