The Cost of Quality Standards in the CYFD Quality Rating ...€¦ · 2 | page table of contents the...
59
Technical Report Prepared for Children, Youth and Families Department State of New Mexico Kate Krause, Department of Economics University of New Mexico May 29, 2009 The Cost of Quality Standards in the CYFD Quality Rating System
-
Upload
vuongthuan -
Category
Documents
-
view
214 -
download
0
Transcript of The Cost of Quality Standards in the CYFD Quality Rating ...€¦ · 2 | page table of contents the...

1 | P a g e
Technical Report Prepared for Children,
Youth and Families Department State of
New Mexico
Kate Krause, Department of Economics
University of New Mexico
May 29, 2009
The Cost of Quality Standards in the CYFD Quality Rating System

2 | P a g e
TABLE OF CONTENTS THE COST OF QUALITY STANDARDS IN THE CYFD QUALITY RATING SYSTEM ............................... 5
Introduction ..................................................................................................................................... 5
1. TTAP Insight .............................................................................................................................. 7
1.1. Perceived financial costs ...................................................................................................... 7
1.2. Perceived non-financial challenges, 2-STAR facilities ....................................................... 7
1.3. Perceived non-financial challenges, 3-STAR facilities ....................................................... 8
1.4. Perceived non-financial challenges, 4-STAR facilities ....................................................... 8
2. Provider Interviews .................................................................................................................... 8
2.1. Interview methodology ........................................................................................................ 8
2.2. Two-Star facilities ................................................................................................................ 8
2.2.1. Narrative comments ...................................................................................................... 9
2.2.2. Quantifiable data ........................................................................................................... 9
2.3. Three-Star facilities ............................................................................................................ 11
2.3.1. Narrative comments .................................................................................................... 11
2.3.2. Quantifiable data ......................................................................................................... 11
2.4. Four-Star facilities ............................................................................................................. 13
2.4.1. Narrative comments .................................................................................................... 13
2.4.2. Quantifiable data ......................................................................................................... 13
3. Cost Estimates ........................................................................................................................... 13
3.1 Differences in Costs by Star Level: Business costs ............................................................ 14
TABLE 1: ANNUAL BUSINESS COSTS TO MAINTAIN STAR LEVEL (EXCLUDING LABOR COSTS) .. 14
3.2. Labor costs ......................................................................................................................... 14
TABLE 2A: ANNUAL ESTIMATED LABOR COSTS FOR A HYPOTHETICAL PROVIDER CARING FOR 35 CHILDREN AGED 3 AND 4. FULL-TIME, STATEWIDE AVERAGE WAGES ....................................... 15
TABLE 2B: ANNUAL ESTIMATED LABOR COSTS FOR A HYPOTHETICAL PROVIDER CARING FOR 35 CHILDREN AGED 3 AND 4. FULL-TIME, SANTA FE AVERAGE WAGES......................................... 15
TABLE 2C: ANNUAL ESTIMATED LABOR COSTS FOR A HYPOTHETICAL PROVIDER CARING FOR 12 INFANTS AND TODDLERS, FULL-TIME, STATEWIDE AVERAGE WAGES ....................................... 15
TABLES 3A–3C: PER-CHILD LABOR COSTS: 3- AND 4-YEAR-OLDS AND INFANTS, STATEWIDE AND SANTA FE .......................................................................................................................... 17
TABLE 3A: ANNUAL PER-CHILD LABOR COSTS ........................................................................... 17
TABLE 3B: MONTHLY PER-CHILD LABOR COSTS ......................................................................... 17
TABLE 3C: MONTHLY INCREASE, PER-CHILD LABOR COSTS ....................................................... 17
TABLE 4A: EACH ADDITIONAL FULL-TIME EMPLOYEE, PER YEAR (2-STAR) ............................... 18
TABLE 4B: EACH ADDITIONAL FULL-TIME EMPLOYEE, PER YEAR (ASSUMING AVERAGE 3-STAR BENEFITS) .................................................................................................................................. 18

3 | P a g e
TABLE 4C: EACH ADDITIONAL FULL-TIME EMPLOYEE, PER YEAR (ASSUMING AVERAGE 4-STAR BENEFITS) .................................................................................................................................. 18
3.3. Enrollment and staffing ratios ............................................................................................ 19
TABLE 5: AVERAGE ENROLLMENT AND STAFFING DATA (STANDARD DEVIATION IN PARENTHESES) ........................................................................................................................... 19
TABLE 5A: CYFD REQUIRED STAFFING RATIOS ........................................................................ 20
FIGURE 1: DISTRIBUTION OF AGES OF CHILDREN BY PROVIDER-TYPE ....................................... 20
3.4. Cost comparisons ............................................................................................................... 21
TABLE 6: TOTAL ANNUAL COST SUMMARY, NEW MEXICO GENERALLY, HYPOTHETICAL PROVIDER, MIXED AGES ............................................................................................................. 22
TABLE 7: ONGOING MONTHLY COST DIFFERENCES, PER CHILD, CONSTRUCTED 44-CHILD PROVIDER ................................................................................................................................... 23
TABLE 3C: MONTHLY INCREASE, PER-CHILD LABOR COSTS ASSUMING 35 PRE-SCHOOL CHILDREN AND 12 INFANTS ......................................................................................................................... 23
3.4.1. Age-specific cost comparisons with CYFD reimbursement rates ............................. 24
3.4.1.1. Infant Care ............................................................................................................... 24
TABLE 8A: MONTHLY COST ESTIMATES AND CYFD REIMBURSEMENT RATES, PER INFANT (1 YEAR OLD OR YOUNGER) .......................................................................................................... 25
3.4.1.2. Toddler care ............................................................................................................. 25
3.4.1.3. Pre-school care ........................................................................................................ 26
3.4.2. The cost of additional workers. ....................................................................................... 26
TABLE 9A: PER-CHILD LABOR COSTS, ONE ADDITIONAL EMPLOYEE, INFANTS ........................... 27
TABLE 9B: PER-CHILD COSTS, ONE ADDITIONAL EMPLOYEE, TWO-YEAR-OLDS.......................... 27
TABLE 9C: PER-CHILD COSTS, ONE ADDITIONAL EMPLOYEE, 3 – 4 YEAR OLDS ........................... 27
TABLE 10: PER-CHILD MONTHLY DIFFERENCES IN LABOR COSTS AT REQUIRED RATIOS ............ 28
3.5. Are our results representative? .......................................................................................... 28
4. Abbreviated interviews, 1-Star and 5-Star facilities ................................................................ 28
4.1 One-Star facilities ............................................................................................................... 28
TABLE 11: 1-STAR PROVIDER RESPONSES ................................................................................. 29
4.2. Five-Star facilities .............................................................................................................. 29
5. Conclusion ................................................................................................................................ 29
6. The economics of the childcare industry and policy implications ............................................ 31
References ..................................................................................................................................... 33
Data Appendices ........................................................................................................................... 34
Appendix A: AIM HIGH Essential Elements of Quality at a Glance ...................................... 35
Appendix B: New Mexico Department of Workforce Solutions Wage Data ........................... 45

4 | P a g e
New Mexico Local Wages for Education Administrators, Preschool and Child Care Center/Program ......................................................................................................................... 46
Appendix C: TTAP Questions and Responses ......................................................................... 47
Summary of TTAP Responses, 2-Star ...................................................................................... 49
Summary of TTAP Responses, 3-Star ...................................................................................... 50
Effects of GED Requirement .................................................................................................... 50
Summary of TTAP Responses, 4-Star ...................................................................................... 51
Questions that apply to all Star Levels: .................................................................................... 51
Appendix D: Phone Interview Questions ................................................................................. 52
Appendix E: Actual Caregiver-to-Child Ratio Estimates ......................................................... 57
Table 6, Appendix:.................................................................................................................... 57
Costs estimated using actual ratios from interviewed providers, 35 children, mixed ages ...... 57
Appendix F: Detailed Interview Variable Tables ..................................................................... 58
Table 1A: Facility and Materials Costs, 2-Star* ....................................................................... 58
Table 2A: Detail of Labor Costs, 2-Star ................................................................................... 58
Table 3A: Interview Data Detail, 3-Star ................................................................................... 59
Table 4A: Interview Data Detail, 4-Star ................................................................................... 59

5 | P a g e
THE COST OF QUALITY STANDARDS IN THE CYFD QUALITY RATING SYSTEM Introduction Quality childcare is a policy priority. High quality childcare has been associated with developmental, social, and cognitive benefits; low quality childcare has been associated with detrimental effects in these domains (Blau and Mocan, 2002 citing developmental psychology work). This project considers the financial cost assumed by child care providers of increasing the quality of childcare provided in the State of New Mexico. Measuring, monitoring, and encouraging the provision of high quality childcare is not transparent, and the link between dollar expenditures and quality is tenuous. The most widely used measures of “process” quality – the intangibles like caregiver-child interaction – are ECERS (Early Childhood Environmental Rating Scale) and ITERS (Infant-Toddler Environmental Rating Scale).1 In a four-state study conducted in the mid-1990s2, researchers estimated that it would cost $243 - $324 per child per year to raise the quality of care provided from “mediocre” (an average score of 4 out of 7) to “good” (an average score of 5) as measured by these scales. In 2009 dollars, that amounts to $355 - $473 per year per child, or approximately thirty to forty dollars per month.3 Using the same 4-state data, researchers investigated the cost of “structural” quality, or those characteristics that are more readily quantified. These include class-size and number and characteristics of teachers. They found that spending more money did increase structural quality, but that the magnitude of the effect – that is, the dollar amounts estimated to raise quality – were small and that differences in expenditure explained only approximately half of the variation in quality. (Mocan, 1997; Blau and Mocan, 2002) Clearly there is more to providing quality care than spending more money on it. Under the Quality Rating System (QRS) used in the State of New Mexico, all licensed childcare providers are classified by a Star Level designation. A provider that meets the basic licensure requirements set by the Children Youth and Families Department (CYFD) is classified as a 1-Star provider. Providers advance to higher Star designations by meeting increasingly rigorous quality standards. Five-Star providers are those that have met the requirements of, and have paid the fees assessed by, national accrediting organizations. The standards included in the Aim High Essential Elements are included in Appendix A. Some providers are assisted in meeting these higher standards by participating in the voluntary Aim-High program administered by regional Training and Technical Assistance Programs (TTAPs). However, a provider can work toward and attain a higher Star designation without participating in the Aim-High program. Although a small portion of 5-Star providers were interviewed, these results are not included in the tables throughout this report because we are focusing on the cost involved in meeting the standards outlined in the Aim High Essential Elements of Quality.
1The Classroom Assessment Scoring System (CLASS) is an assessment system for pre-K through 3rd grade classrooms. http://classobservation.com/ 2 States included were California, Connecticut, Colorado and North Carolina. The data generated by this comprehensive study remains the most frequently used information about the economics of childcare. See Hellburn, 1995, for details about the study. 3 Calculated using the Bureau of Labor Statistics Inflation Calculator at http://data.bls.gov/cgi-bin/cpicalc.pl.

6 | P a g e
The State of New Mexico, through the CYFD, reimburses child care providers for children who are income-eligible for subsidized child care. CYFD reimbursement rates vary by type of care and the age of the child and along two additional dimensions. First, providers with higher Star level designations receive higher reimbursement reflecting, in part, the higher costs of maintaining the more rigorous standards. Second, at each Star level, urban providers receive a higher reimbursement rate reflecting higher private-pay, or market, rates. These institutional arrangements are designed to improve the quality of care provided to New Mexican children and to assure that low-income children have access to childcare. If the reimbursement rates are inadequate to offset the increased compliance costs, then providers will lack financial incentives to work toward higher Star level designation. Reimbursement rates exist in the context of the larger child care market. Parents who are not income-eligible for CYFD reimbursement pay according to that market. If CYFD reimbursement rates differ significantly from private-pay rates, providers will face incentives to either enroll more CYFD participant children (if reimbursement rates exceed the private pay market rate) or to turn away CYFD participant children (if reimbursement rates are less than the private pay rate). The provision of childcare in New Mexico takes place in a regulated and subsidized market, but unlike most regulated markets the industry is composed of many highly diverse providers. Some children are cared for in large centers; some in homes with just a few other children. All are regulated by CYFD, but those regulations vary depending on the type of provider and licensure level. It would be impossible to compute precise cost calculations for a “typical” provider, as there is no typical provider. The information and conclusions contained in this report must be interpreted in light of the unique features of this market. The objective of this analysis is to identify common costs faced by providers at different Star levels. We investigate differences in the initial costs incurred to move from one Star Level to the next and on-going costs at each Star level. Labor costs differ by region, and so we provide separate estimates for those costs. Because labor costs account for the largest fraction of caregiver costs (estimated to be 60% – 80% of total day care center costs in the 4-state study) we give those costs the most attention in this report. Several sources of information were used in this study. TTAP directors provided information about caregivers in their regions, more than one hundred childcare providers were interviewed, and wage data were obtained from the New Mexico Department of Workforce Solutions, a recently-formed state agency that includes the former Department of Labor (“Workforce Solutions”).4 Rates charged for childcare were taken from the most recent New Mexico CYFD Market Rate Survey, a bi-annual report of average rates charged by New Mexico childcare providers. Childcare providers who were interviewed for this study estimated dollar amounts for the out-of-pocket costs they incur, but in many cases, the “cost” was not financial, but time. Providers 4 Wage data used to calculate time costs are shown on Appendix A.
7 | P a g e
reported that they spend time on compliance activities such as documentation, record-keeping and training. In some cases (particularly at the 2-Star level) facility directors reported that they do not pay themselves a salary. Uncompensated provider time costs are imputed using wage data published by Workforce Solutions. Some providers incur the cost of providing care at a discounted rate to their employees. The cost of providing that employee benefit is calculated using rates reported in the Market Rate Survey. In the first section of this report we summarize the information provided to us by TTAP directors. In section 2 we provide a narrative summary of interviewed provider comments. The results of our analyses of the data are presented in section 3. Those results are presented in several tables that allow us to compare cost estimates for providers at different Star Levels. Section 4 describes the results of our interviews with 1-Star and 5-Star providers. Our conclusions are presented in Section 5. 1. TTAP Insight Phone interviews of a sample of more than one hundred childcare providers made up one key source of information for this report. Before interviewing these providers we asked TTAP directors to provide general impressions of the financial costs and other challenges faced by providers in their regions. These responses helped to frame the interview questions and highlighted the most common issues faced by childcare providers in seeking and maintaining Star level designations. We also contacted TTAP directors during the data analysis stage of this project to verify whether some interview responses reflected standard or typical procedures for caregivers. Initial questions were emailed to the TTAP directors, and six of eight responded5. The questions and responses are shown on Exhibit B and summarized below. Questions centered on four broad areas: perceived costs and challenges at each Star level, hurdles to achieving higher Star levels, the impact of labor costs and requirements, and training. In many cases the TTAP information was confirmed in the provider interviews.
1.1. Perceived financial costs TTAP directors reported different costs and challenges for different Star levels, not all of which were financial. Two-Star and 3-Star providers face high materials costs. In particular, TTAP directors thought that having enough toys and books to maintain satisfactory rotation presented a challenge to 3-Star providers. Almost every TTAP director who responded indicated that the outdoor play space requirement presented the biggest out-of-pocket initial cost for 4-Star providers.6
1.2. Perceived non-financial challenges, 2-STAR facilities Non-financial challenges also differed by Star level. One TTAP director commented that 2-Star providers were resistant to the idea that the QRS elements translated to higher quality of care,
5 Only the San Juan College TTAP in the far northwestern corner of the state and the NMSU TTAP in south-central New Mexico did not respond. 6 None of the 4-Star providers interviewed mentioned this cost. Only fifteen 4-Star providers were interviewed, and so we do not conclude that providing outdoor play space is not a significant cost for 4-Star providers generally.

8 | P a g e
an impression that was confirmed by some phone interviewees. Other TTAP directors mentioned that education, implementing best practices learned in the trainings, and appropriate interaction between caregivers and children presented challenges to 2-Star providers. Overcoming some of these challenges could improve the quality of care with virtually no out-of-pocket costs.
1.3. Perceived non-financial challenges, 3-STAR facilities Almost every TTAP director indicated that attaining 3-Star status is the most challenging of the Star Levels. Curriculum, lesson plans and assessment stood out as the biggest challenges among 3-Star providers. In addition, planning and documentation time was seen as a bigger burden for 3-Star providers than for 2-Star providers. Three-Star providers face a new requirement: hiring caregivers with a high school degree or GED. Most TTAP directors felt that this requirement would affect relatively few caregivers, but some believed that this requirement would adversely affect employee retention or deter caregivers from seeking the higher Star level designation, particularly those in rural areas of the state.
1.4. Perceived non-financial challenges, 4-STAR facilities Staffing issues were of primary concern among 4-Star providers. At this Star level, caregiver-to-child ratios fall. Staff turn-over and maintenance of the required ratios were the most frequently named challenges. Two TTAP directors indicated that the documentation burden was not significantly greater than at the 3-Star level. This was confirmed in interviews with providers. 2. Provider Interviews
2.1. Interview methodology Interview questions were developed in consultation with CYFD and TTAP personnel. The questions used in the phone interviews are attached as Appendix C. All interviews took place over the phone, primarily during December, 2008 although some calls were made in January, 2009. Interviewees were drawn from CYFD lists of licensed providers. We sought a broad geographic distribution of interviews rather than a random sample. We interviewed a smaller sample of 1-Star and 5-Star providers, although the focus of this analysis is on 2- through 4-Star providers. Virtually all providers contacted were willing to respond to the questions. However, the interviewers were able to complete more interviews with smaller providers. Thus, the sample of full interviews may include a greater proportion of lower-enrollment providers. While the goal of the interviews was to obtain dollar figures for the most common cost components, much of the insight gained from the interviews was narrative and non-quantifiable.
2.2. Two-Star facilities Fifty 2-Star providers completed phone interviews, including 36 centers and 14 homes. At least one 2-Star provider is located in 28 of the 33 counties in New Mexico, and the interview sample includes providers from 27 counties.7 Most 2-Star centers reported paying employees minimum
7 There are no 2-Star providers in Union, Harding, Mora, Catron, and Hidalgo Counties, and no providers in Quay County were interviewed.

9 | P a g e
wage, and most 2-Star home providers reported that they did not pay themselves. These providers said that they pay for bills and expenses and take whatever is left at the end of the month. TTAP directors had indicated that materials, training and teacher-child interaction were likely the biggest challenges for 2-Star providers, but the providers themselves cited documentation requirements as their biggest obstacle. Rural 2-Star providers voiced unique concerns, including the discrepancy in CYFD reimbursement rates between metro and rural providers, difficulty finding qualified employees and travel time and distance for trainings.
2.2.1. Narrative comments Eighteen of the 2-Star caregivers provided additional comments. The most common concern was cost, with eleven of eighteen expressing some concern about cost. Five of the 18 stated that either they would not move up to 3-Star because the initial cost for 2-Star designation had been too high or that they would have to shut down if 2-Star maintenance costs proved to be too high in the long run. Paperwork was a concern of five of the 18. Labor costs and staffing issues were mentioned by many directors. Of particular concern is the increase in minimum wage without a comparable increase in the reimbursement rate. One provider no longer accepts children under two because the infant-toddler ratio requirement is too costly.8 Finding qualified staff also presents a problem. Some expressed concern about the difficulty in finding staff in rural areas because of the GED/High School Diploma requirement and others expressed concern about the difficulty in finding substitutes who had the required training. One director felt that the 2-Star requirements place too much responsibility on $8 per hour employees. Some directors commented on the regulatory processes. Providers with particularly strong opinions would be expected to provide comments more often than those who are satisfied, so these comments must be taken as anecdotal rather than a sense of the industry generally. Four of 18 expressed concern that the Star rating system is about money, not the quality of care that children receive, confirming the concern expressed by a TTAP director that some of the 2-Star providers question the link between the regulatory requirements and quality child care.
2.2.2. Quantifiable data Quantifiable data are summarized in the tables that follow.9 Many directors of 2-Star facilities were unable to answer cost questions with precision. In some cases the care was provided in a church or school facility that the providers used at no out-of-pocket cost to themselves. Thirteen of fifty 2-Star providers bartered for some goods or services. Many of the dollar amounts given in response to interview questions were clearly rough estimates.
8 Staff-to-child ratios are the same for 1-Star, 2-Star and 3-Star providers so this does not represent an incremental cost associated with higher Star Level requirements at this level. 9 Detailed data tables are provided in the Appendix.

10 | P a g e
All interviewed 2-Star providers stated that their employees had at least a high school diploma or GED; many reported that at least some employees had earned some college credit or college degrees. All interviewed 2-Star providers indicated that they provide their employees with some training beyond the 24-hour required minimum. A small number of providers required different levels of training for their employees. Labor costs include the costs of training and obtaining substitute teachers when a regular staff member cannot come to work. These labor costs should not be greater when a provider steps up from 1-Star to 2-Star status because training requirements and caregiver-to-child ratios do not change. However time spent on compliance does represent an increase in costs when a provider moves up a level. Several 2-Star providers mentioned that documentation costs were a significant concern. Hours spent on documentation were reported and for the cost calculations below the time estimates were converted to dollar costs using average wage data published by Workforce Solutions. Most 2-Star interviewees reported wage data as hourly wages. Hourly wages are significantly higher for Santa Fe providers and somewhat higher for some Albuquerque providers. The average minimum hourly wage in our sample is $8.18 and the average maximum is $10.00. The one 2-Star Santa Fe provider in the sample reported a minimum hourly wage of $16 and a maximum hourly wage of $23. Three Albuquerque area providers reported a minimum hourly wage of $10, and one of those reported a maximum of $18. Wage averages published by Workforce Solutions are used for the labor cost calculations below rather than wages reported in interviews because the Workforce Solutions data are more representative than the wage data from our sample. Five providers reported monthly or annual salary data. Omitting those that were part-time employees, salaries in our interview sample range from $12,000 per year to $36,000 per year. Workforce Solutions reports a statewide average annual salary for experienced childcare workers of $18,106, with average salaries ranging from a low of $15,142 per year in eastern New Mexico to a high of $23,599 in Santa Fe. Workforce Solutions reports average salaries for experienced administrators and directors of pre-schools and childcare centers ranging from approximately $35,000 per year in Albuquerque to nearly $60,000 per year in the eastern part of the state. The statewide average for administrators and directors is $44,161.10 Documentation costs are not insignificant. We calculate those costs by multiplying the average number of hours spent on documentation reported by the interviewed providers times the Workforce Solutions average hourly wage for experienced childcare administrators. Using the statewide average hourly wage, we estimate that the value of initial documentation time is $1,083 for family and group homes and $1,422 for centers. Ongoing documentation time costs are estimated at $85 per year for homes and $764 for centers. Training costs impose an additional average annual cost of approximately $100 per employee each year, although this training includes the training required for basic licensure.
10 State and metro estimates for Education Administrators, Preschool and Child Care Center/Program obtained at http://www.dws.state.nm.us/careersolutions/occs/11903100.html, last accessed May 1, 2009. Estimates for childcare workers obtained from http://www.dws.state.nm.us/careersolutions/occs/39901100.html, last accessed May 1, 2009.

11 | P a g e
2.3. Three-Star facilities Twenty-five 3-Star child care centers in twelve counties throughout the state completed phone interviews. The counties represented in the sample were: San Juan (2), Colfax, Sandoval, Santa Fe, Bernalillo (4), Curry, Lincoln, Chaves (2), Lea, Grant (4), Dona Ana (6), and Hidalgo. All interviewed providers had participated in the Aim-High program and had received materials from the TTAPs. Those materials included toys, books, furniture, and shelves. The value of those materials ranged from 20%-50% of the total set up costs of the center.
2.3.1. Narrative comments The 3-Star directors interviewed had been in the child care industry for five years to twenty years. All of the directors had at least a high school degree or GED equivalent, several had associates degrees, some had bachelor’s degrees in Early Childhood Education, and one director had a master’s degree. The teachers and caregivers all had at least a high school diploma or GED equivalent and all had completed the 45-hour required training course. About half of the caregivers had received additional training beyond the required 45-hour training course provided by the local TTAP. Of the 25 centers interviewed, ten had a wait list. The caregivers spend several hours a week on planning, documentation, child assessment, and curriculum. However, this time is typically built into the daily schedule of teachers and is performed during naptime or at the end of each day. When asked, the majority of the interviewed directors stated that they chose to continue to operate at a 3-Star level because they do not want to reduce their classroom sizes to conform to the ratios required for 4-Star status.
2.3.2. Quantifiable data Data for 3-Star facilities reflect greater variance in size of facilities, but less variation in some costs. As a result, economies of scale are evident.11 For example, the interviewed provider with the highest enrollment had a total enrollment of 200 students and a fifty-person staff. That provider reported an annual facility maintenance cost of $5000, the largest amount reported, but that amounts to only $25 per child. Smaller providers with somewhat lower total maintenance costs had significantly higher per child costs, some in excess of $100 per year per child. The largest provider reported $500 in initial costs to step up from 2-Star licensure to 3-Star, or $2.50 per child; smaller providers report step-up costs of up to $45 per child. Only two 3-Star providers reported adding additional storage, one at a cost of $50 and one at a cost of $2500. All 3-Star providers purchased curriculum books, consistently reporting a cost of approximately $30 per book. Unlike the 2-Star providers, sixteen 3-Star providers hired outside business help, with the most common form of assistance being an accountant. Sixteen 3-Star providers, in most cases the same sixteen that hired accountants, also paid for assistance with a business plan. Becoming a 3-Star provider is perceived by the TTAP directors as the most difficult step. However it does not appear to be the most costly in terms of initial out-of-pocket expenditures. Many 3-Star providers indicated that they continue to use materials and equipment from when
11 Data from the 1995 four-state study also find economies of scale (Mocan, 1997).
12 | P a g e
they had been licensed at a lower level. The majority of the centers “rearranged” furniture and classrooms and did not spend any money for facility modifications. Hourly wages at interviewed 3-Star providers ranged from a low of $7.50 to a high of $10; the Santa Fe provider’s hourly wages were higher, ranging from $10 per hour to $13 per hour. Only four providers reported using substitutes. All employees of the surveyed providers had at least either a GED or high school diploma, although some rural providers mentioned that a GED/High School requirement would make it difficult to find qualified workers, consistent with the TTAP director information. One interviewed center director received a salary rather than hourly wages, and that salary was $50,000 per year, in the high range of the wage estimates published by Workforce Solutions for childcare administrators. The interviewed providers’ wage data reflects only the small sample that completed an interview. Therefore, for all labor cost estimates we use the more representative data published by Workforce Solutions. TTAP directors named curriculum and assessment as the biggest challenge for 3-Star providers, and the providers confirmed this. Relative to 2-Star requirements, 3-Star status requires significantly more documentation, planning and assessment. Time spent on these activities is a component of labor costs. In most cases much of this work is completed during naptime, during the teachers’ regularly compensated day. Directors report that assessment and curriculum development accounts for several hours per week, with most estimating the time at four to five hours per week. Estimating the time allocated at 4.5 hours per week and imputing the state-wide hourly wage for childcare administrators of $21.23 gives a weekly documentation cost of $95.54, or $4,968 per year. Because this time did not vary with size of facility, the cost per child is low for larger facilities and quite high for smaller ones. For example, the 200-child provider and a 98-child provider report spending five hours per week on assessment and curriculum, while a six-child provider reports spending four to five hours per week. In addition, each provider reimbursed her employees for the 45-hour training at an average cost of $75. One provider reimbursed staff members for additional books and estimated that training cost to be approximately $300 - $400 per staff member per year. These costs do not represent an increase over the training requirements at lower Star Levels. However, in calculating the total cost of hiring an additional caregiver these costs must be included. Three-Star facilities are required to provide three different employee benefits (including but not limited to: payment of individual professional membership or association fee, insurance supplement, paid leave, monetary bonuses, and health insurance), and almost all of the surveyed caregivers provided paid holidays, vacation time, sick leave and in some cases paid birthdays off. The cost of each of these is a regular days’ pay which, at $7.79 per hour for an 8 hour day is $62.32 per day. We calculate the cost of one week’s vacation, a common benefit among 3-Star providers, as 40 times the hourly rate for experienced child care workers, or $348 (using the New Mexico average wage for experienced workers of $8.70)12. One provider 12 We use the experienced hourly rate to value this benefit because interviewed providers stated that this benefit was provided to workers after one year of employment.
13 | P a g e
provided medical coverage at a cost of $1,800 per month (The provider had 17 employees, but did not state how many of those were covered by this insurance).
2.4. Four-Star facilities Fifteen calls were made to 4-Star childcare centers in fifteen counties throughout the state. The decision was made to stop calling at fifteen in order to call some 1- and 5-Star providers. Results from 1 and 5-Star provider interviews are included later in this report. The following counties were included: San Juan, Taos, McKinley, Sandoval, Santa Fe, Bernalillo, San Miguel, Cibola, Valencia, Socorro, Roosevelt, Sierra, Otero, Luna, and Eddy.
2.4.1. Narrative comments Many of the comments made by 4-Star providers reflected the same concerns as those of 3-Star providers. Few directors had plans to move from a 4-Star center to a 5-Star center. The most common reasons stated by directors for why they did not intend to become a 5-Star center included added pressure for caregivers, too much paperwork for director and caregivers, and the expense of the accreditation process.
2.4.2. Quantifiable data Only one of the interviewed 4-Star providers was a home provider; the rest were centers. Interviewed 4-Star providers were, on average, smaller than the 3-Star providers. Sixteen of the 25 surveyed 3-Star providers cared for infants and one-year-olds. Slightly more than half (8 of 15) of the 4-Star providers interviewed cared for infants or one-year-olds. Thus, even with more stringent student/teacher ratios at the 4-Star level, the child to caregiver ratios in the sample were approximately the same. Hourly wages for 4-Star facilities were the same as those for 3-Star facilities, but employee benefits were more costly. All 4-Star providers gave discounts on childcare and some provided some health insurance coverage. None provided a precise cost for that coverage and so values are imputed in the tables below.
3. Cost Estimates Given the high variance in some responses and the lack of precision in others, we estimate costs using imputed wages and simulated facility size. We address labor costs separately in the next section. For all but the labor costs (which were imputed using data from Workforce Solutions), the data reveal substantial variation in these figures. These amounts must be interpreted as averages from a small sample, not estimates for any particular center or home or as statewide averages. Providers of care in our sample varied widely in size. Among all 2-Star providers in the sample, the average enrollment was 29.6 children. Among the 3-Star providers the average was 44.6 children, and among the 4-Star providers it was 36.3 children. In Table 1 we estimate the cost for a hypothetical center with an enrollment of 35 children and a hypothetical family or group home with an enrollment of ten children. Labor costs vary both by the overall size of the facility and by the composition of ages served. Thus we report several estimations of labor costs in the tables that follow.

14 | P a g e
3.1 Differences in Costs by Star Level: Business costs Achieving 2-Star status imposes initial materials and facilities costs on a provider. However, once those costs are incurred, the cost to attain higher Star-level designation for these categories of costs is much smaller. Moving from 2-Star to 3-Star status while maintaining the same age distribution and enrollment imposes somewhat higher labor costs due to the cost of providing benefits. Moving from 3-Star to 4-Star status while maintaining the same age distribution and enrollment imposes much higher labor costs due to the more stringent ratio requirements and higher benefit costs. Once a provider has stepped up to a higher Star level, he or she must maintain the facility and materials in order to remain in compliance. Those on-going costs are summarized in Table 1. The costs described in Table 1 do not include building ownership or rental costs, the cost of utilities, property taxes or general building maintenance costs as those costs are incurred regardless of Star level. For similar reasons we do not include the cost of food. In our sample, one 3-Star provider incurred high costs for development of a business plan. That cost drove up the average consultant costs for that Star level. The 4-Star average business plan/accounting cost is more typical and reflects purchase of business software and annual meetings with a bookkeeper or accountant. Disregarding the 3-Star provider who secured professional business planning assistance, 3-Star and 4-Star facilities report lower on-going facility and materials costs but higher consulting costs than do 2-Star facilities.
TABLE 1: ANNUAL BUSINESS COSTS TO MAINTAIN STAR LEVEL (EXCLUDING LABOR COSTS) 2-Star
Centers 2-Star Homes
3-Star 4-Star
Facility Maintenance Costs, Annuala $3,000 $3,000 $1,250 $1,161 Materials Maintenance Costs per child, Annual $65 $67 $37 $15 Materials Maintenance Costs per child × 35 childrenb $2,275 $670 $1,295 $525 Annual Consultant Costs (accountant services, business plan)
0 0 $1,728 $272
Total for a 35-child provider $5,275 $3,737 $4,273 $1,958 Difference from lower Star Level -$1,002c -$2,315 Difference per child -$29 -$66 aVery few 2-Star providers were able to provide an estimate of this cost. Those that did reported costs in the range of $2,000 to $4,000 per year. bTimes ten children for the 2-Star homes. cRelative to a 2-Star Center.
3.2. Labor costs Labor costs are the largest component of a childcare provider’s costs, but most of those costs need not change when a provider steps up from a 1-Star to 2- or 3-Star designation because the required staff-to-child ratio does not change. The first column of Table 2 below (1-Star) is calculated at the minimum staffing requirements for a 1-, 2- or 3-Star provider. No additional documentation costs are included in the 1-Star column. Training, both required and additional optional training, impose costs on providers, as does time spent on documentation. Documentation requirements increase with higher Star designations. Three- and Four-Star providers must also provide benefits to their employees. Four-Star providers face more stringent caregiver-to-child ratios, further increasing the cost of maintaining 4-Star status.

15 | P a g e
Labor costs vary by the age of the children cared for. Tables 2a and 2b use the required caregiver-to-child ratios for three-year-old and four-year-old children. (Three- and four-year olds were the most commonly cared for age group among our interviewed providers.) For comparison purposes, Tables 2c and 2d repeat the information, but for a provider caring for twelve infants. Labor costs for infants are higher due to more stringent caregiver-to-child ratios. In our interview sample and in the Workforce Solutions data, Santa Fe labor costs are higher than in other parts of the state. Tables 2b and 2d report estimates of labor costs using Santa Fe wage data.
TABLE 2A: ANNUAL ESTIMATED LABOR COSTS FOR A HYPOTHETICAL PROVIDER CARING FOR 35 CHILDREN AGED 3 AND 4. FULL-TIME, STATEWIDE AVERAGE WAGES 1-Stara 2-Star 3-Star 4-Star Minimum Staffing, teachers $54,318 $54,318 $54,318 $72,424 Director (imputed at experienced N.M. average salary) $44,161 $44,161 $44,161 $44,161 Training times number of Staff members $300 $300 $300 $400 Benefits $0 $0 $1,044 $4,170 On-going Documentation Time (imputed)b $0 $764 $4,968 $4,968 TOTAL $98,779 $99,543 $104,791 $126,123 Per child $2,822 $2,844 $2,994 $3,604 Per child increase from lower Star Level $22 $150 $609
TABLE 2B: ANNUAL ESTIMATED LABOR COSTS FOR A HYPOTHETICAL PROVIDER CARING FOR 35 CHILDREN AGED 3 AND 4. FULL-TIME, SANTA FE AVERAGE WAGES 1-Star 2-Star 3-Star 4-Star Minimum Staffing, teachers $70,797 $70,797 $70,797 $94,396 Director (imputed at experienced salary) $49,008 $49,008 $49,008 $49,008 Training times number of Staff members $300 $300 $300 $400 Benefits $0 $0 $1,362 $4,720 On-going Documentation Time (imputed)c $0 $848 $5,513 $5,513 TOTAL $120,105 $120,953 $126,980 $154,037 Per child $3,432 $3,456 $3,628 $4,401 Per child increase from lower Star Level $24 $172 $773
TABLE 2C: ANNUAL ESTIMATED LABOR COSTS FOR A HYPOTHETICAL PROVIDER CARING FOR 12 INFANTS AND TODDLERS, FULL-TIME, STATEWIDE AVERAGE WAGES 1-Stara 2-Star 3-Star 4-Star Minimum Staffing, teachers $36,212 $36,212 $36,212 $54,318 Director (imputed at experienced N.M. average salary)
$44,161 $44,161 $44,161 $44,161
Training times number of Staff members $200 $200 $200 $300 Benefits 0 0 $696 $3,128 On-going Documentation Time (imputed)b 0 $510 $4,448 $4,448 TOTAL $80,573 $81,083 $85,717 $106,455 Per child $6,714 $6,757 $7,143 $8,863 Per child increase from lower Star Level -- $43 $386 $1,720

16 | P a g e
TABLE 2D: ANNUAL ESTIMATED LABOR COSTS FOR A HYPOTHETICAL PROVIDER CARING FOR 12 INFANTS AND TODDLERS, FULL-TIME, SANTA FE AVERAGE WAGES 1-Star 2-Star 3-Star 4-Star Minimum Staffing, teachers $47,198 $47,198 $47,198 $70,797 Director (imputed at experienced salary) $49,008 $49,008 $49,008 $49,008 Training times number of Staff members $200 $200 $200 $300 Benefits 0 0 $908 $3,540 On-going Documentation Time (imputed)c 0 $565 $5,513 $5,513 TOTAL $96,406 $96,971 $101,919 $129,158 Per child $8,034 $8,081 $8,493 $10,763 Per child increase from lower Star Level -- $47 $412 $2,270 a1-Star assumes that the labor cost increment to become a 2-Star facility is the documentation time cost. bDocumentation costs calculated by applying the Workforce Solutions average hourly wages to time estimates provided by interviewees. c Documentation costs calculated by applying the Workforce Solutions hourly wages for Santa Fe/Northern NM to time estimates provided by interviewees. Tables 2a – 2d assume the required child-caregiver ratio plus a salaried director. Three caregivers are required for 35 three-and four-year-olds at the 1-, 2- and 3-Star levels and four are required at the 4-Star level. Twelve children under the age of two require two caregivers for 2-Star and 3-Star providers and three for a 4-Star provider. We do not include the director in the ratios. Annual training costs are estimated at $100 per employee. This includes the average of $75 per employee for the 45-hour annual training program, books and related costs. Some providers also reimburse travel and materials, but because that is not the norm it is not included. The cost of employee benefits for 3-Star facilities is estimated at one week’s wages per year for each employee. The most common benefits are holidays off, paid vacation and sick leave after a year of employment. Four-star providers must provide an additional benefit (including but not limited to: payment of individual professional membership or association fee, insurance supplement, paid leave, monetary bonuses, and health insurance). Several interviewed providers offer partial or complete health insurance, but were unable to provide a cost estimate. We sought clarification from regional TTAPs on this cost and learned that offering health insurance varied significantly by geographic region. According to information from TTAP directors, 3-Star and 4-Star providers do not typically provide health care insurance in the Taos, Albuquerque, or Silver City areas. A few Santa Fe providers offer it, with little take-up due to high costs. Providers in the Las Cruces area are most likely to provide health care coverage: two-thirds of 3- and 4-Star providers in Las Cruces offer this benefit. Because this benefit is neither required nor commonly offered in many parts of the state, we do not include the cost of health insurance in our estimates. All interviewed 4-Star providers offer discounted childcare as an employee benefit, a very expensive benefit if it means that one fewer paying child can be accommodated. One provider estimated the cost of discounted childcare as $500 per month ($6000 annually). This is slightly

17 | P a g e
more than the average monthly rate for 4-Star center as reported in the Market Rate Survey, but is less than the maximum rate. We include in this simulation the value of a 50% discount taken up by one-fourth of the workers at the average market rate for toddlers in a rural 4-Star center ($463 per month) and, for the city-specific estimates, the market rate for toddlers in a metro 4-Star center ($484 per month). All labor cost tables assume that one-fourth of the employees to whom this benefit is offered accept it.13 Providers for whom either more or fewer employees avail themselves of this benefit will incur higher or lower implicit costs. Most providers may perceive this as a costless benefit, particularly if their facility is not operating at capacity. However, for providers operating at capacity or carrying a waitlist, this benefit represents lost revenue. In our interview sample, 27% of 4-Star providers had a wait list. On-going documentation time for 3- and 4-Star providers is imputed by calculating average reported hours spent per week (4.5) and multiplying that times the hourly wage. This assumes that the hours are for the director, not the full staff. Most directors surveyed reported that time spent on curriculum and assessment was incorporated into the standard work-day. Total wage costs vary with the number of children and the distribution of ages of children enrolled, as can be seen in Table 3 below. Staffing costs increase with increased enrollment if that enrollment increase puts the center into a higher caregiver-to-child ratio bracket. For example, one caregiver is required for five infants at a 4-Star provider, but a sixth infant would require an additional caregiver in order to maintain the required ratio. In addition, wages vary by region in New Mexico.
TABLES 3A–3C: PER-CHILD LABOR COSTS: 3- AND 4-YEAR-OLDS AND INFANTS, STATEWIDE AND SANTA FE TABLE 3A: ANNUAL PER-CHILD LABOR COSTS 1-Star 2-Star 3-Star 4-Star 3- and 4- year-olds, statewide $2,822 $2,844 $2,994 $3,604 Infants, statewide $6,714 $6,757 $7,143 $8,863 3-and 4-year-olds, Santa Fe $3,432 $3,456 $3,628 $4,401 Infants, Santa Fe $8,034 $8,081 $8,493 $10,763
TABLE 3B: MONTHLY PER-CHILD LABOR COSTS 1-Star 2-Star 3-Star 4-Star 3- and 4- year-olds, statewide $235 $237 $250 $300 Infants, statewide $560 $563 $595 $739 3-and 4-year-olds, Santa Fe $286 $288 $302 $367 Infants, Santa Fe $670 $673 $708 $889
TABLE 3C: MONTHLY INCREASE, PER-CHILD LABOR COSTS 1- to 2-Star 2- to 3-Star 3- to 4-Star 3- and 4- year-olds, statewide $2 $13 $50 Infants, statewide $3 $32 $144 3-and 4-year-olds, Santa Fe $2 $14 $65 Infants, Santa Fe $3 $35 $181
13 We base this estimate on informal information gathered from a TTAP director.

18 | P a g e
aData from Tables 2a – 2d above. Rather than provide a multitude of tables for possible combinations of children, the tables below provide estimates of the cost of one additional full-time employee in each urban area of the state and for New Mexico generally.
TABLE 4A: EACH ADDITIONAL FULL-TIME EMPLOYEE, PER YEAR (2-STAR) Santa Fe Albuquerque Las Cruces Farmington NM
Average Wage $23,599 $17,952 $18,182 $16,519 $18,106 Training $100 $100 $100 $100 $100 Total $23,699 $18,052 $18,282 $16,619 $18,206
TABLE 4B: EACH ADDITIONAL FULL-TIME EMPLOYEE, PER YEAR (ASSUMING AVERAGE 3-STAR BENEFITS) Santa Fe Albuquerque Las Cruces Farmington NM
Average Wage $23,599 $17,952 $18,182 $16,519 $18,106 Training $100 $100 $100 $100 $100 Benefits (1 paid week) $454 $345 $350 $318 $348 Total $24,153 $18,397 $18,632 $16,937 $18,554
TABLE 4C: EACH ADDITIONAL FULL-TIME EMPLOYEE, PER YEAR (ASSUMING AVERAGE 4-STAR BENEFITS) Santa Fe Albuquerque Las Cruces Farmington NM
Average Wage $23,599 $17,952 $18,182 $16,519 $18,106 Training $100 $100 $100 $100 $100 Benefitsa $1,180 $1,071 $1,076 $1,044 $1,043 Total $24,879 $19,123 $19,358 $17,663 $19,249 aOne week vacation and 50% childcare discount. Calculation assumes that, on average, 25% of the employees take the childcare discount benefits.

19 | P a g e
3.3. Enrollment and staffing ratios The size of the facilities varied significantly in our sample, with centers being generally larger than Family or Group homes.14 Because directors at smaller centers and homes were more likely to complete the interview, the size of facilities included in the sample may be smaller than the statewide average. Among the 36 licensed 2-Star centers, the largest had an enrollment of 101 children; the smallest center had eight children, all under two years old. Among the fourteen 2-Star Family and Group homes, the largest had a total enrollment of 29.15 Most family and group home providers enrolled ten or fewer children. The average enrollment among 2-Star centers was 39.72 children. Among interviewed 3-Star providers, the largest had an enrollment of 200 and three of the 25 interviewed providers enrolled more than one hundred children.
TABLE 5: AVERAGE ENROLLMENT AND STAFFING DATA (STANDARD DEVIATION IN PARENTHESES) (Average enrollments by age are for providers reporting any children in that age group; percent of providers caring for children in that age shown.)
2-Star Centers (n=36 total)
2-Star Family,Group Homes (n=14)
3-Star Providers (n=25)
4-Star Providers (n=15)
Average Total Enrollment
36.72 (21.05)
11.29 (6.71)
44.56 (47.30)
36.27 (29.06)
< 1 year
7.33 (7.07)
n=18 (50%)
1.80 (1.23)
n=10 (71.4%)
7.00 (4.07)
n=16 (64%)
6.25 (3.88)
n=8 (53%)
1-year-olds 6.50
(4.94) n=20 (55.6%)
1.70 (0.82)
n=12 (85.7%)
8.63 (7.00)
n=16 (64%)
5.50 (4.75)
n=8 (53%)
2-year-olds 7.78
(4.34) n=27 (75%)
2.25 (1.22)
n=12 (85.7%)
7.91 (6.90)
n=21 (84%)
5.93 (4.45)
n=15 (100%)
3-year-olds 8.41
(4.69) n=34 (94.4%)
1.80 (1.14)
n=10 (71.4%)
9.55 (6.98)
n=22 (88%)
6.53 (3.80)
n=15 (100%)
4-year-olds 8.53
(5.75) n=34 (94.4%)
2.40 (1.51)
n=10 (71.4%)
9.52 (7.08)
n=21 (84%)
7.08 (4.33)
n=13 (86.7%)
5-year-olds 4.10
(1.93) n=29 (80.6%)
1.70 (1.06)
n=10 (71.4%)
10.73 (10.51)
n=15 (60%)
9.40 (5.08)
n=10 (66.7%) School-aged 9.69
(7.98) n=16 (44.4%)
3.36 (3.04)
n=11 (78.6%)
13.56 (9.90)
n=9 (36%)
10.57 (4.72)
n=7 (46.7%) Total Staff
6.89
(5.10) 1.86
(0.95) 8.88
(9.84) 7.47
(6.09) Child/Staff Ratio 6.21 (2.76) 6.46 (2.60) 4.53 (1.81) 4.83 (0.80)
14 The interviewed sample of 3-Star facilities included only one Family Home provider. The rest were licensed centers. Every 4-Star facility included in the sample was a licensed center. 15 This high-enrollment group home enrolled 11 school-aged children and 18 younger children in total. Given the group homes size limit of twelve, we assume that these children were there part-time, not all at the same time.

20 | P a g e
TABLE 5A: CYFD REQUIRED STAFFING RATIOS By year of age groups:
2- and 3-Star Providers
4-Star Providers
By multi-year groups:
2- and 3-Star Providers
4-Star Providers
< 1 year old 1:6 1:5 < 24 months 1:6 1:5 1-year-olds 1:6 1:5 18 – 24
months grouped with 24 – 35 mos.
1:6 1:5 2-year-olds
1:10 1:8
3-year-olds 1:12 1:10 2 – 4 years 1:12 1:10 4-year-olds 1:12 1:10 5-year-olds 1:15 1:12 3 – 5 years 1:14 1:12 School-aged 1:15 1:12 School-aged 1:15 1:12 Many providers operated at capacity. Of 36 interviewed 2-Star centers, 21, or 58%, maintained a wait list. Five of the 14 (36%) 2-Star family and group homes, 10 of 25 (40%) interviewed 3-Star providers maintained a wait list as did four of 15 (27%) 4-Star providers. The distribution of children by age varied among the providers as illustrated in Figure 1. Almost every interviewed provider currently enrolled children aged 2, 3, and 4. Among the sample interviewed, 2-Star Homes were more likely to serve the youngest and the oldest children and were less likely to care for pre-school children. Fewer than half of the 2-Star centers and 3- and 4-Star providers enrolled school-aged children, but most of the 2-Star group and family homes did. More than 70% of the 2-Star family and group homes enrolled infants less than one year old, a much larger percentage than the other categories of providers.
FIGURE 1: DISTRIBUTION OF AGES OF CHILDREN BY PROVIDER-TYPE
Percent of Interviewed Providers Caring for Children of Different Ages, by Type of Provider
0%
20%
40%
60%
80%
100
120
<1 1 yr olds
2 yr olds
3 yr olds
4 yr olds
5 yr olds
School- aged
2-Star Centers 2-Star Homes 3-Star Providers 4-Star Providers

21 | P a g e
3.4. Cost comparisons In Table 6 we provide overall on-going costs in some, but not all, categories of costs that a provider is likely to incur. No start-up costs are included in this table. These costs reflect those costs providers were able to estimate in interviews and estimates of labor and time costs based on Workforce Solutions estimates for childcare workers. We compare these costs solely for exposition purposes to the CYFD reimbursement rate for rural toddler care. Estimates of labor costs vary by the age composition of the children cared for. Providers with an older mix of children require fewer caregivers. As shown in Figure 1 above, the composition of ages varies by Star Level. In our sample of interviewed providers, 3-Star providers cared for younger children and had slightly more caregivers-per-child than did 4-Star providers. A check with TTAPs around the state revealed that it is not generally the case that 4-Star providers are less likely to care for infants. Among our interviewed 3-Star providers, 25% provided care either before 7 a.m. or after 7 p.m., but none of the 4-Star providers offered extended hour care. Both of these effects – a younger mix of children and extended hours – will increase the number of caregivers per enrolled child. These help to explain the minimal difference between 3- and 4-Star providers in caregiver-to-child ratios shown in Table 5. Estimating costs using interviewed provider average ratios would fail to detect the large labor cost difference between offering care at the 4-Star level relative to the 3-Star level. To remove this source of bias in our estimations, we consider the cost of providing the required caregiver-to-child ratios to children at each Star Level at a hypothetical provider. We construct the hypothetical providers by assigning each provider exactly the same distribution of children. We are interested in the increased cost of moving from 3-Star status to 4-Star status because that is the step at which ratio requirements change. Therefore, each constructed provider is assigned the average distribution of children observed among our interviewed 3-Star providers. That distribution is: four babies less than a year old, six one-year-olds, seven two-year-olds, eight three-year-olds, eight four-year-olds, six five-year-olds, and five school-aged children, for a total of 44 children. To remove any bias arising from differences in length of day, we calculate the required staffing by applying the number of required adults to the average number of children in each age group. In our sample, at every Star level, the average caregiver-to-child ratio was greater than the regulatory minimum.16 Thus, these numbers understate the true labor costs for an actual provider.
16 Researchers using the four-state study data find the same phenomenon and attribute it to the fact that caregivers are open for longer than a standard eight-hour workday. Among our interviewed providers, several caregivers provided extended hour care (before 7 a.m. and after 7 p.m.) and some provided weekend care. This would necessitate total staffing in excess of the minimum requirements.
22 | P a g e
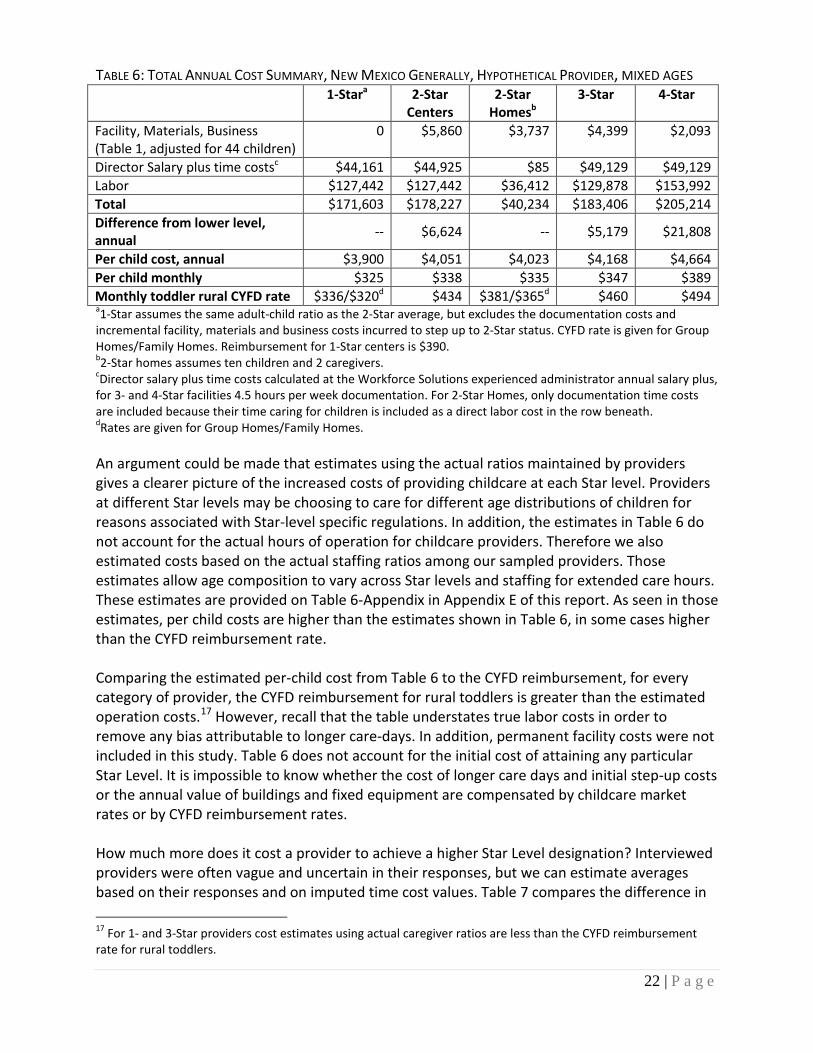
TABLE 6: TOTAL ANNUAL COST SUMMARY, NEW MEXICO GENERALLY, HYPOTHETICAL PROVIDER, MIXED AGES 1-Stara 2-Star
Centers 2-Star
Homesb 3-Star 4-Star
Facility, Materials, Business (Table 1, adjusted for 44 children)
0 $5,860 $3,737 $4,399 $2,093
Director Salary plus time costsc $44,161 $44,925 $85 $49,129 $49,129 Labor $127,442 $127,442 $36,412 $129,878 $153,992 Total $171,603 $178,227 $40,234 $183,406 $205,214 Difference from lower level, annual -- $6,624 -- $5,179 $21,808
Per child cost, annual $3,900 $4,051 $4,023 $4,168 $4,664 Per child monthly $325 $338 $335 $347 $389 Monthly toddler rural CYFD rate $336/$320d $434 $381/$365d $460 $494 a1-Star assumes the same adult-child ratio as the 2-Star average, but excludes the documentation costs and incremental facility, materials and business costs incurred to step up to 2-Star status. CYFD rate is given for Group Homes/Family Homes. Reimbursement for 1-Star centers is $390. b2-Star homes assumes ten children and 2 caregivers. cDirector salary plus time costs calculated at the Workforce Solutions experienced administrator annual salary plus, for 3- and 4-Star facilities 4.5 hours per week documentation. For 2-Star Homes, only documentation time costs are included because their time caring for children is included as a direct labor cost in the row beneath. dRates are given for Group Homes/Family Homes. An argument could be made that estimates using the actual ratios maintained by providers gives a clearer picture of the increased costs of providing childcare at each Star level. Providers at different Star levels may be choosing to care for different age distributions of children for reasons associated with Star-level specific regulations. In addition, the estimates in Table 6 do not account for the actual hours of operation for childcare providers. Therefore we also estimated costs based on the actual staffing ratios among our sampled providers. Those estimates allow age composition to vary across Star levels and staffing for extended care hours. These estimates are provided on Table 6-Appendix in Appendix E of this report. As seen in those estimates, per child costs are higher than the estimates shown in Table 6, in some cases higher than the CYFD reimbursement rate. Comparing the estimated per-child cost from Table 6 to the CYFD reimbursement, for every category of provider, the CYFD reimbursement for rural toddlers is greater than the estimated operation costs.17 However, recall that the table understates true labor costs in order to remove any bias attributable to longer care-days. In addition, permanent facility costs were not included in this study. Table 6 does not account for the initial cost of attaining any particular Star Level. It is impossible to know whether the cost of longer care days and initial step-up costs or the annual value of buildings and fixed equipment are compensated by childcare market rates or by CYFD reimbursement rates. How much more does it cost a provider to achieve a higher Star Level designation? Interviewed providers were often vague and uncertain in their responses, but we can estimate averages based on their responses and on imputed time cost values. Table 7 compares the difference in 17 For 1- and 3-Star providers cost estimates using actual caregiver ratios are less than the CYFD reimbursement rate for rural toddlers.

23 | P a g e
estimated on-going per child cost (drawn from Table 6) with the reimbursement premium incorporated in CYFD’s reimbursement rates. As mentioned above, CYFD provides reimbursement for childcare for income-eligible children. The monthly rate schedule provides for different rates by age of the child, type of care, location of the caregiver (urban or rural) and Star level. Relative to the base reimbursement rate, 2-Star providers receive a $45 differential per child, 3-Star providers receive a $70 differential per child, and 4-Star providers receive a $104.50 differential per child.18
TABLE 7: ONGOING MONTHLY COST DIFFERENCES, PER CHILD, CONSTRUCTED 44-CHILD PROVIDER 2-Star Centers 3-Star 4-Star Increase in per child cost over lower Star, required ratios holding distribution constant (Table 6) $13 $9 $42
CYFD rate differential increase (over lower Star level) $45 $25 $34.50 aRelative to a 2-Star Center. For ease of comparison, Table 3c is copied below with CYFD reimbursement rate information added. The estimated monthly per-child cost increase is higher in Table 3c because the children are younger, necessitating more adults per child. For infants, the CYFD reimbursement differential for moving from 2- to 3-Star is less than the labor-only cost difference. For both age groups, the CYFD reimbursement differential for moving from 3- to 4-Star is less than the labor-only cost difference.
TABLE 3C: MONTHLY INCREASE, PER-CHILD LABOR COSTS ASSUMING 35 PRE-SCHOOL CHILDREN AND 12 INFANTS 1- to 2-Star 2- to 3-Star 3- to 4-Star 3- and 4- year-olds, statewide $2 $13 $50 Infants, statewide $3 $32 $144 3-and 4-year-olds, Santa Fe $2 $14 $65 Infants, Santa Fe $3 $35 $181 CYFD rate differential increase $45 $25 $34.50 The increased costs of operating as a 2-Star facility are concentrated in the one-time initial cost, as opposed to ongoing costs. The 3- and 4-Star providers in our sample incurred relatively low start-up costs in stepping up from a lower Star level, as they already had made necessary facility improvements and obtained many of the required materials. Thus, while it appears that the CYFD premium for 2-Star status more than compensates relative to the on-going cost of providing care at a 2-Star center, anecdotal information indicates that significant costs are incurred by 2-Star providers at their initial step-up. Those costs are not included in Table 6 or in the comparisons shown in Tables 7 and 3c. Tables 7 and 3c use a conservative estimate of labor costs: the minimum staffing ratio is assumed. All of the providers in our sample – and in particular the 3-Star providers – maintained a caregiver-to-child ratio that was greater than the minimum requirement. Thus, these per-child cost estimates are lower than the actual costs incurred by caregivers. 18 New Mexico Administrative Code Section 8.15.2.17.K.

24 | P a g e
3.4.1. Age-specific cost comparisons with CYFD reimbursement rates Because we believe that these cost estimates understate true costs, we present two different monthly per-child cost estimates in Tables 8a – 8c below. In those tables we compare the CYFD reimbursement rates at each age group with age-specific cost estimates. National studies estimate that labor accounts for approximately 70% of total child care costs. Because we had statewide data on labor costs, but only a small sample of non-labor costs, in these tables we calculate total costs as labor costs (estimated using Workforce Solutions data) times 1.4. Santa Fe costs are higher than any other area of the state, so we include estimates for Santa Fe separately. Wages and other costs did not vary substantially among the other metropolitan areas of the state or between those areas and the statewide averages. We use two methods to calculate per-child monthly costs. In the first method, we calculate the per-child labor costs for a facility of a particular size. This method holds the size of the facility constant as Star Levels change. We estimate costs assuming infant care at a facility that enrolls twelve infants. Costs for older children are estimated for a 35-child facility. These estimates use the same data used to construct Tables 9a-9c. In the second method we estimate the cost per child of exactly meeting the minimum staffing requirements. Therefore, the number of children cared for varies with changes in the ratio requirements. Estimates using this second method must be taken as a lower bound on the cost of care. The estimates do not accommodate care beyond a normal working day, assume full capacity, and do not account for the director’s salary or documentation time.
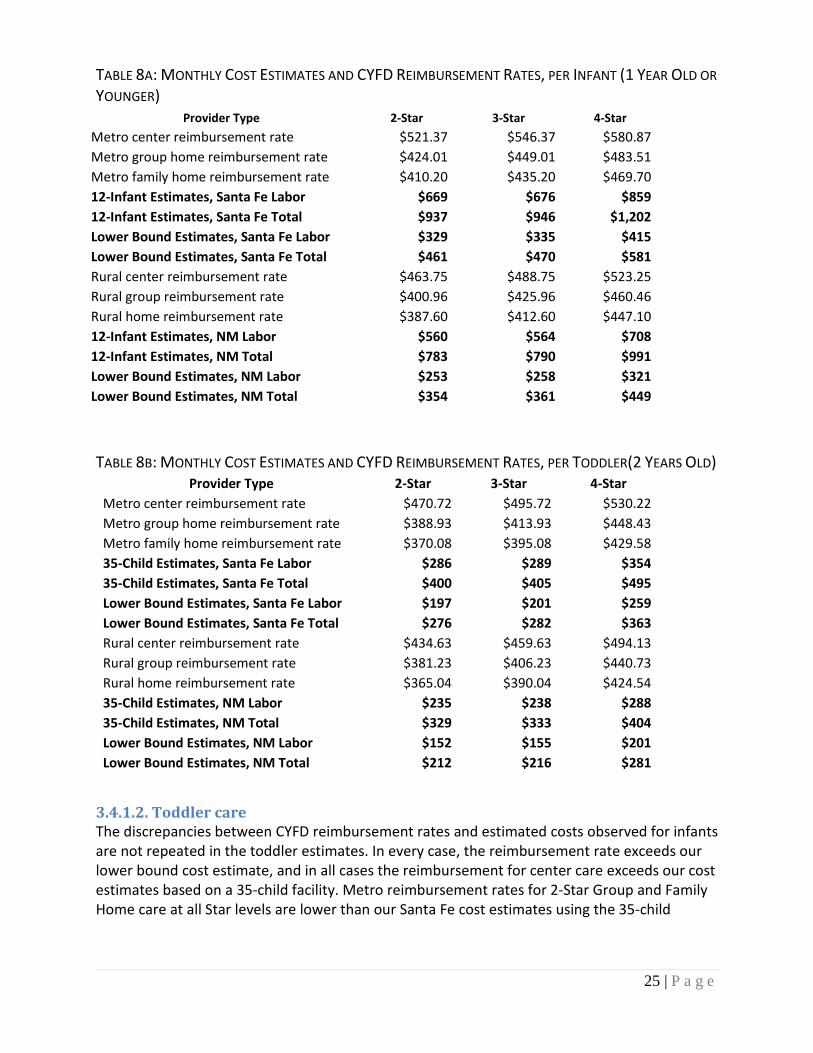
3.4.1.1. Infant Care Infant care is, by far, the most expensive care to provide. We estimate the cost of caring for twelve infants in Santa Fe and statewide. In the first estimation we include a director’s salary, training costs for each worker (but not for the director) and for 3- and 4-Star providers, the cost of providing benefits. The Lower Bound Estimates do not include a director’s salary and assume that each worker cares for the maximum allowable number of children. For both methods, we estimate total costs by multiplying the labor estimates by 1.4. Our Santa Fe estimates indicate that total costs at a 2-Star facility range from $461 to $937. Metro reimbursement rates range from $410 to $521. The 2-Star Center reimbursement rate is higher than the lower bound estimate of total costs, but less than labor costs or total costs estimated for a 12-infant facility. This pattern is repeated at higher Star levels: the center reimbursement rate is equal to (in the case of 4-Star rates) or greater than the lower bound cost. In all other comparisons, the CYFD reimbursement is less than our estimated total costs. The pattern observed for Santa Fe is not seen elsewhere in the state. Our lower bound cost estimates for 2- and 3-Star providers are both less than the CYFD reimbursement rates for all types of care. Only the 4-Star rural home reimbursement rate is less than our lower bound cost estimate, and that by only two dollars. However, we believe that the 12-infant estimates more realistically capture all of the costs of providing care. In every case, for every type of provider, our labor-only cost estimates are higher, and in most cases more than $100 higher, than the CYFD reimbursement rates. In every case our estimates of total costs are more than $300 higher than the reimbursement rate.
25 | P a g e
TABLE 8A: MONTHLY COST ESTIMATES AND CYFD REIMBURSEMENT RATES, PER INFANT (1 YEAR OLD OR YOUNGER)
Provider Type 2-Star 3-Star 4-Star Metro center reimbursement rate $521.37 $546.37 $580.87 Metro group home reimbursement rate $424.01 $449.01 $483.51 Metro family home reimbursement rate $410.20 $435.20 $469.70 12-Infant Estimates, Santa Fe Labor $669 $676 $859 12-Infant Estimates, Santa Fe Total $937 $946 $1,202 Lower Bound Estimates, Santa Fe Labor $329 $335 $415 Lower Bound Estimates, Santa Fe Total $461 $470 $581 Rural center reimbursement rate $463.75 $488.75 $523.25 Rural group reimbursement rate $400.96 $425.96 $460.46 Rural home reimbursement rate $387.60 $412.60 $447.10 12-Infant Estimates, NM Labor $560 $564 $708 12-Infant Estimates, NM Total $783 $790 $991 Lower Bound Estimates, NM Labor $253 $258 $321 Lower Bound Estimates, NM Total $354 $361 $449
TABLE 8B: MONTHLY COST ESTIMATES AND CYFD REIMBURSEMENT RATES, PER TODDLER(2 YEARS OLD) Provider Type 2-Star 3-Star 4-Star
Metro center reimbursement rate $470.72 $495.72 $530.22 Metro group home reimbursement rate $388.93 $413.93 $448.43 Metro family home reimbursement rate $370.08 $395.08 $429.58 35-Child Estimates, Santa Fe Labor $286 $289 $354 35-Child Estimates, Santa Fe Total $400 $405 $495 Lower Bound Estimates, Santa Fe Labor $197 $201 $259 Lower Bound Estimates, Santa Fe Total $276 $282 $363 Rural center reimbursement rate $434.63 $459.63 $494.13 Rural group reimbursement rate $381.23 $406.23 $440.73 Rural home reimbursement rate $365.04 $390.04 $424.54 35-Child Estimates, NM Labor $235 $238 $288 35-Child Estimates, NM Total $329 $333 $404 Lower Bound Estimates, NM Labor $152 $155 $201 Lower Bound Estimates, NM Total $212 $216 $281
3.4.1.2. Toddler care The discrepancies between CYFD reimbursement rates and estimated costs observed for infants are not repeated in the toddler estimates. In every case, the reimbursement rate exceeds our lower bound cost estimate, and in all cases the reimbursement for center care exceeds our cost estimates based on a 35-child facility. Metro reimbursement rates for 2-Star Group and Family Home care at all Star levels are lower than our Santa Fe cost estimates using the 35-child
26 | P a g e
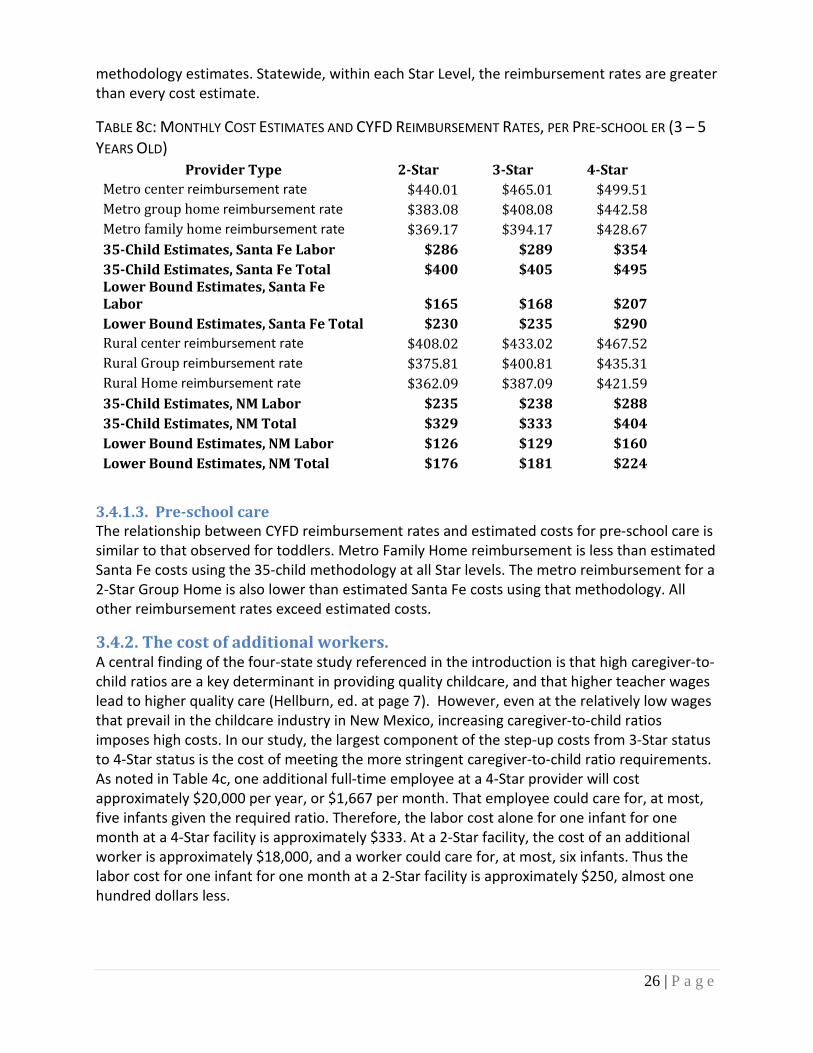
methodology estimates. Statewide, within each Star Level, the reimbursement rates are greater than every cost estimate.
TABLE 8C: MONTHLY COST ESTIMATES AND CYFD REIMBURSEMENT RATES, PER PRE-SCHOOL ER (3 – 5 YEARS OLD)
Provider Type 2-Star 3-Star 4-Star Metro center reimbursement rate $440.01 $465.01 $499.51 Metro group home reimbursement rate $383.08 $408.08 $442.58 Metro family home reimbursement rate $369.17 $394.17 $428.67 35-Child Estimates, Santa Fe Labor $286 $289 $354 35-Child Estimates, Santa Fe Total $400 $405 $495 Lower Bound Estimates, Santa Fe Labor $165 $168 $207 Lower Bound Estimates, Santa Fe Total $230 $235 $290 Rural center reimbursement rate $408.02 $433.02 $467.52 Rural Group reimbursement rate $375.81 $400.81 $435.31 Rural Home reimbursement rate $362.09 $387.09 $421.59 35-Child Estimates, NM Labor $235 $238 $288 35-Child Estimates, NM Total $329 $333 $404 Lower Bound Estimates, NM Labor $126 $129 $160 Lower Bound Estimates, NM Total $176 $181 $224
3.4.1.3. Pre-school care The relationship between CYFD reimbursement rates and estimated costs for pre-school care is similar to that observed for toddlers. Metro Family Home reimbursement is less than estimated Santa Fe costs using the 35-child methodology at all Star levels. The metro reimbursement for a 2-Star Group Home is also lower than estimated Santa Fe costs using that methodology. All other reimbursement rates exceed estimated costs.
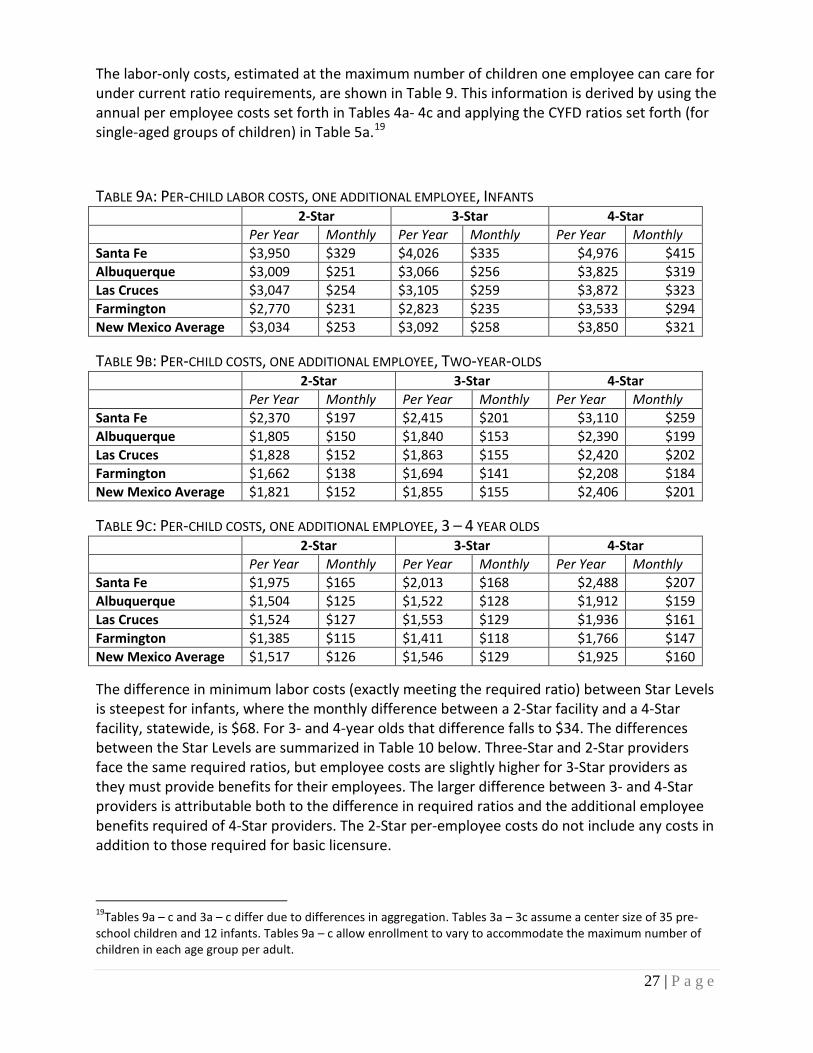
3.4.2. The cost of additional workers. A central finding of the four-state study referenced in the introduction is that high caregiver-to-child ratios are a key determinant in providing quality childcare, and that higher teacher wages lead to higher quality care (Hellburn, ed. at page 7). However, even at the relatively low wages that prevail in the childcare industry in New Mexico, increasing caregiver-to-child ratios imposes high costs. In our study, the largest component of the step-up costs from 3-Star status to 4-Star status is the cost of meeting the more stringent caregiver-to-child ratio requirements. As noted in Table 4c, one additional full-time employee at a 4-Star provider will cost approximately $20,000 per year, or $1,667 per month. That employee could care for, at most, five infants given the required ratio. Therefore, the labor cost alone for one infant for one month at a 4-Star facility is approximately $333. At a 2-Star facility, the cost of an additional worker is approximately $18,000, and a worker could care for, at most, six infants. Thus the labor cost for one infant for one month at a 2-Star facility is approximately $250, almost one hundred dollars less.
27 | P a g e
The labor-only costs, estimated at the maximum number of children one employee can care for under current ratio requirements, are shown in Table 9. This information is derived by using the annual per employee costs set forth in Tables 4a- 4c and applying the CYFD ratios set forth (for single-aged groups of children) in Table 5a.19
TABLE 9A: PER-CHILD LABOR COSTS, ONE ADDITIONAL EMPLOYEE, INFANTS 2-Star 3-Star 4-Star Per Year Monthly Per Year Monthly Per Year Monthly Santa Fe $3,950 $329 $4,026 $335 $4,976 $415 Albuquerque $3,009 $251 $3,066 $256 $3,825 $319 Las Cruces $3,047 $254 $3,105 $259 $3,872 $323 Farmington $2,770 $231 $2,823 $235 $3,533 $294 New Mexico Average $3,034 $253 $3,092 $258 $3,850 $321
TABLE 9B: PER-CHILD COSTS, ONE ADDITIONAL EMPLOYEE, TWO-YEAR-OLDS 2-Star 3-Star 4-Star Per Year Monthly Per Year Monthly Per Year Monthly Santa Fe $2,370 $197 $2,415 $201 $3,110 $259 Albuquerque $1,805 $150 $1,840 $153 $2,390 $199 Las Cruces $1,828 $152 $1,863 $155 $2,420 $202 Farmington $1,662 $138 $1,694 $141 $2,208 $184 New Mexico Average $1,821 $152 $1,855 $155 $2,406 $201
TABLE 9C: PER-CHILD COSTS, ONE ADDITIONAL EMPLOYEE, 3 – 4 YEAR OLDS 2-Star 3-Star 4-Star Per Year Monthly Per Year Monthly Per Year Monthly Santa Fe $1,975 $165 $2,013 $168 $2,488 $207 Albuquerque $1,504 $125 $1,522 $128 $1,912 $159 Las Cruces $1,524 $127 $1,553 $129 $1,936 $161 Farmington $1,385 $115 $1,411 $118 $1,766 $147 New Mexico Average $1,517 $126 $1,546 $129 $1,925 $160
The difference in minimum labor costs (exactly meeting the required ratio) between Star Levels is steepest for infants, where the monthly difference between a 2-Star facility and a 4-Star facility, statewide, is $68. For 3- and 4-year olds that difference falls to $34. The differences between the Star Levels are summarized in Table 10 below. Three-Star and 2-Star providers face the same required ratios, but employee costs are slightly higher for 3-Star providers as they must provide benefits for their employees. The larger difference between 3- and 4-Star providers is attributable both to the difference in required ratios and the additional employee benefits required of 4-Star providers. The 2-Star per-employee costs do not include any costs in addition to those required for basic licensure.
19Tables 9a – c and 3a – c differ due to differences in aggregation. Tables 3a – 3c assume a center size of 35 pre-school children and 12 infants. Tables 9a – c allow enrollment to vary to accommodate the maximum number of children in each age group per adult.

28 | P a g e
TABLE 10: PER-CHILD MONTHLY DIFFERENCES IN LABOR COSTS AT REQUIRED RATIOS Infants Two-year-olds 3 – 4 year olds 2 to 3-Star 3 to 4-Star 2 to 3-Star 3 to 4-Star 2 to 3-Star 3 to 4-Star Santa Fe $6 $79 $4 $58 $3 $40 Albuquerque $5 $63 $3 $46 $2 $32 Las Cruces $5 $64 $3 $46 $2 $32 Farmington $4 $59 $3 $43 $2 $30 New Mexico Average $5 $63 $3 $46 $2 $32
3.5. Are our results representative? Using data from a comprehensive four-state study of childcare costs, researchers estimated that it would cost $30 - $40 per month to raise a provider from “mediocre” to “good”. (Mocan, 1997) Some of our estimates suggest a smaller cost to advance from basic licensure to 2-Star status or from 2-Star to 3-Star status. In estimates that hold the age distribution constant as a caregiver advances from 3-Star to 4-Star status, we estimate a per child, per month cost increase of $42 (Table 8). For 3- and 4-year olds, the per child increase in labor costs when moving from 3-Star to 4-Star status ranges from $30 in Farmington to $40 in Santa Fe, with a statewide average of $32. (Table 9) While we draw no conclusion as to whether any of the QRS levels correspond to “mediocre” care or “good” care, and concur with prior research that the amount of money spent does not perfectly correlate with the quality of care provided, we find that many of our estimates are consistent with those of the four-state study. As a second check on the validity of our data, we used an online cost calculator for out-of-school programs found at http://www.wallacefoundation.org/cost-of-quality/cost-calculator/Pages/cost-calculator.aspx. Using an example of a 100-student facility in Albuquerque serving elementary-aged children, the monthly cost-per-slot estimate provided by this calculator is $561. Our estimates of operational costs for childcare are approximately $300 - $450 per month per child (Table 6). Our estimates do not include any facility costs or start-up costs, which would add to the total cost of a facility. Furthermore, we investigate infant through school-age care. However, despite these differences in the target group studied, our estimates are remarkably similar. 4. Abbreviated interviews, 1-Star and 5-Star facilities The primary objective of this study was to investigate differences in costs among 2-, 3-, and 4-Star childcare providers. However, we obtained a limited amount of information from 1-Star and 5-Star providers.
4.1 One-Star facilities Nine 1-Star providers completed phone interviews, including six centers and three homes from five different counties. The counties represented in the sample are: Bernalillo (3), Dona Ana (2), Otero (2) Grant, and Lea. The primary purpose of the 1-Star survey was to assess interest in advancing to 2-Star status. Results of the 1-Star survey are shown in Table 11.

29 | P a g e
TABLE 11: 1-STAR PROVIDER RESPONSES
Approximately two-thirds of interviewed center directors indicated either that they would like to move up or were in the process of moving up to 2-Star status. Of these respondents, the most commonly cited obstacle was cost for additional materials required in obtaining 2-Star status. The most commonly cited advantage was that the 2-Star status could be used as a marketing tool to grow business. Two center directors indicated they had no interest in moving up to 2-Star status. Of these respondents, one is a faith-based center that receives all of its funding from the church and the other is a small family owned center with all private pay clients. Both respondents stated there is no incentive for them to obtain 2-Star status. Of the 1-Star homes surveyed, two of the three responded that they would like to obtain 2-Star status. The third provider stated that she was indifferent to obtaining 2-Star status and was “just happy to take care of children.” Of those respondents that desired 2-Star status, both cited cost as the biggest obstacle in becoming a 2-Star facility.
4.2. Five-Star facilities Of all categories of providers contacted, 5-Star providers were the least likely to complete an interview. A total of eight 5-Star providers were contacted by phone or e-mail on several occasions. Only three 5-Star centers responded with completed surveys by e-mail, representing three counties: Dona Ana, Grant, and Otero. All three 5-Star centers that completed the survey are accredited by NAEYC. Of the centers, 2 reported annual accreditation fees of $300-$500, while one could not answer cost related questions because the director was new and had only been on the job for two weeks. All respondents were relatively large facilities with an average enrollment of 150 children. One respondent reported incurring costs of $5000 for remodeling and $12,000 for purchasing additional materials to step up to 5-Star accreditation. Another respondent reported incurring total costs of $5000 to step up to 5-Star accreditation. The last respondent could not answer cost related questions since she had only been on the job for two weeks. 5. Conclusion Money is just one input into quality childcare. Prior estimates based on a large multi-state study suggest that financial investments explain only half the variation in childcare quality. However, while more money may not be a sufficient condition to enhance quality of care, it is a necessary condition. In particular, higher wages and a richer caregiver-to-child ratio are associated with higher quality childcare. Those cost money. Our study of childcare providers in New Mexico reveals that it is expensive to provide childcare, and those costs increase with higher QRS levels.
Would you like to move up to 2-Stars?
1-Star Centers (n=6)
1-Star Homes (n=3)
Yes 66.7% (n = 4) 66.7% (n = 2) No 33.3% (n = 2) 0 Indifferent 0 33.3% (n = 1)

30 | P a g e
There is little difference in employee costs when a provider becomes a 2-Star provider, as adult-to-child ratios do not change. Documentation costs add somewhat to a 2-Star provider’s cost, but the single biggest cost is bringing the facility up to standards and providing enough materials for the children. Once 2-Star status is maintained, annual non-labor costs are approximately $5,000. These costs did not increase proportionately with the size of the facility. As a result, per-child costs are fairly low for larger providers, but high for providers with just a few children. Non-labor costs are similar across Star levels. However, the increases in labor costs at each step swamp the other costs. As a result of increased labor costs, in one estimate we find that the per-child monthly difference between a 2-Star and a 3-Star facility is approximately $100. In our sample, much of this can be attributed to 3-Star facilities hiring more workers than are required under the ratio requirements. Our data suggest that this is driven by the younger mix of children cared for by interviewed 3-Star providers and the extended hours of service provided by those caregivers. In our sample, 3-Star facilities and 4-Star facilities maintained similar staffing ratios despite the more stringent requirements faced by 4-Star providers. As a result, data from our sample do not indicate an increase in costs when moving from 3-Star status to 4-Star status. However, we believe that this underestimates the cost of that move. The age distribution in our sample gave us relatively few 4-Star facilities caring for infants, but TTAP directors advised us that this was not generally true statewide. Therefore, we separately estimated labor costs using Workforce Solutions wage data and CYFD ratio requirements to estimate the per-child cost differences between the different Star levels. Based on labor costs alone, we estimate that it costs $60 - $80 more per month to care for an infant in a 4-Star facility relative to an infant in a 3-Star facility when we assume that a worker cares for the maximum allowed number of children. In an estimate that does not impose this requirement, the increased labor cost to care for an infant is estimated to be as high as $180. We estimate a per-child monthly labor cost increase of $30 - $40 for 3- and 4-year old children, the same estimate found by researchers using a multi-state dataset. While the data may suggest trends in the child care market, we caution against making wide generalizations based on the data. If providers did not pay for materials or services out of pocket, we imputed dollar values for those items. Many providers who we interviewed did not have precise cost figures, and many 2-Star providers did not pay themselves a salary. Volunteered services and bartered goods and services obscure the true cost of offering childcare. For many of our estimates we used wage data from Workforce Solutions and interpreted statements made by providers in light of insight gained from TTAP directors. Thus these findings must be viewed as rough estimates, not precise cost figures. However, our findings are within the ranges of estimates provided by other sources. We urge caution in relying on these numbers alone, but believe they provide one piece of information and a starting point for thinking about the actual cost of providing quality childcare to New Mexican children.
31 | P a g e
6. The economics of the childcare industry and policy implications Childcare is a labor-intensive industry, and greater labor intensity is associated with higher quality care. Some savings are available through economies of scale: larger providers had lower per-child costs for some materials, documentation time and facility maintenance. However, the single largest cost component is labor, for which economies of scale are unavailable. In our estimates, we found that the labor cost alone, assuming the maximum number of children per worker, ranged from $115 per month for a pre-school child in Farmington to $415 per month for an infant in Santa Fe. Other researchers have estimated that total provider costs equal approximately 1.4 times total labor costs. Applying this multiplier yields per-child estimated total costs that range from $161 for the Farmington pre-schooler to $581 for the infant in Santa Fe. Childcare providers will inevitably hire more than the minimum necessary to maintain ratios. Provider hours are longer than one worker’s shift and enrollments may not align perfectly with required ratio brackets. For these reasons, our cost estimates understate the costs a provider actually incurs. On the other hand, providers may view their costs as lower than those we estimate. Particularly among 2-Star family and group home providers, directors often did not pay themselves a salary, and many said that they provided this service not for money, but because they wanted to care for the children. Many providers reported bartering for goods and services or encouraging parents to volunteer time or donate items. Regional TTAPs also provided materials. While each of these measures reduces a provider’s out-of-pocket costs, they are not free in the economic sense. Directors’ time has value whether they pay themselves or not. Goods and services that are obtained without paying cash are valuable goods and services. If these sources vanished, they would have to be acquired elsewhere. From an economic perspective, they represent costs of providing care. Cost issues represent the supply side of the childcare market. It is only sustainable for a provider to supply childcare services if the price charged compensates for those costs. The other side of the market is the demand side. The demand for childcare is driven by labor force participation, and particularly by labor force participation of women. The price of childcare is one cost of working. For working to make economic sense, the price of childcare must be sufficiently lower than the parent’s wage to make work worthwhile. If wages in general are low, parents will be unable to afford high childcare expenses. This may help to explain the relatively low market rates in rural areas of New Mexico. Low local wages necessitate low childcare rates. A unique feature of the demand for childcare that distinguishes it from other services is the availability of non-market substitutes. When faced with high childcare rates, a parent may choose to stay home or to leave a child with a family member or registered provider rather than place the child in a licensed facility. The more expensive licensed childcare is, the more likely it is that a parent will choose alternative arrangements. The childcare industry faces competing tensions. In this market, unique features of demand put downward pressure on prices. Providers must keep their rates low enough to compete with family members and to be affordable for parents working in low-wage occupations. To sustain
32 | P a g e
competitive rates, providers must seek ways to keep costs low. Because labor makes up the lion’s share of costs, it offers the greatest potential for cost savings. Wages in the childcare industry in New Mexico (and nationally) are low, leading to high staff turn-over. These adversely affect the quality of care offered. But providers may rightly believe that they cannot increase the rates they charge so are compelled to keep labor costs low. In this report, we compare childcare costs to the CYFD reimbursement rates, but those rates are not set to cover a provider’s costs. Rather, they must reflect rates prevailing in the market described above. If CYFD reimbursement rates were not tied to private pay rates providers would face perverse incentives. Reimbursement rates below market would encourage providers to refuse to care for subsidy children perhaps leading to substandard care for children from lower-income families. Reimbursement rates above market would create an incentive to care for more subsidy children and would bid up market rates as private-pay parents competed with subsidized parents for space. As prices rose, more parents would seek alternative childcare arrangements. Because of this necessary link between reimbursement rates and private-pay rates, if the market for childcare generates prices that are low relative to provider costs, the CYFD reimbursement rates will also be low relative to costs. This is most apparent in the rate differential between metro and rural providers. As can be seen from the average wage data, wages in urban areas of the state are not uniformly higher than the state average. Rural providers reported higher costs to travel to training and greater difficulty hiring and retaining qualified workers. We conclude that labor costs are not lower, and may even be higher, for rural providers. However, CYFD reimbursement is higher for providers in metro areas, reflecting higher private-pay rates. We also find that the CYFD reimbursement rates are much lower than the cost of providing infant care, but that, under some restrictive assumptions, those rates are not lower than the cost of providing care to older children. A provider who cares for children of mixed ages may be able to charge slightly higher-than-cost rates for older children to offset lower-than-cost rates charged for infant care. CYFD reimbursement rates (and market rates) for older children may serve to subsidize infant care. This feature of the market also introduces perverse incentives. If the prevailing market rate for pre-school care is profitable, but the prevailing rate for infant care does not cover costs, providers will be reluctant to care for infants. We observe some anecdotal evidence of this in our interview data. One 2-Star provider had stopped taking infants and 4-Star providers, on average, cared for fewer infants than did providers at other Star levels. Like education generally, provision of quality childcare generates positive externalities. That is, its benefits are not limited to the children cared for and their families. Given the link between quality childcare and positive developmental outcomes, assuring affordable quality care is in the public’s interest, justifying public investment. The State of New Mexico provides that investment by supporting provider efforts to advance to higher Star levels and by reimbursing providers who care for income-eligible children. However, if that support is not sufficient to overcome the hurdles to achieving higher Star status, providers will not be able to take advantage of it. Linking reimbursement rates to market rates means that the State is unable to

33 | P a g e
significantly increase its support to providers. This limits provider incentives to advance to higher Star status. Market forces keep prices low, and low prices deter providers from hiring more, and more qualified, workers. One economist presents evidence that the childcare industry suffers from the so-called “Lemons Problem” (Mocan, 2007). Because parents often are unable to distinguish between higher quality care and lower quality care (the “lemons”), they are not willing to pay more for childcare that purports to be of higher quality. But it is more expensive to provide high quality care if that means a richer caregiver-to-child ratio. If providers cannot pass on this higher cost in the form of higher rates they will not be able to sustain higher quality. The Lemons Model predicts that this inability to charge a higher price for higher quality drives high-quality providers out of the market. They cannot afford to continue to provide high quality care if parents are not willing to pay more for it. As a result, the childcare market is characterized by quality that is lower than optimal. As more women have entered the labor force, more children have been cared for by professional childcare providers. Quality care is an important issue: it is costly, but demand characteristics depress prices. Providers respond by keeping costs as low as possible, which can adversely affect quality. CYFD reimbursement rates are caught in that market trap, compelled to reimburse at market rates that may be inadequate to support high quality care, particularly for infants.
Note from CYFD: As a final note, we would like to reiterate that, due to the diversity of the child care market, the low sample size of providers, and the rough estimates of dollar amounts given by providers, the conclusions presented in this report should not be interpreted as precise cost figures. However, as stated by the contractor, the cost figures present a “starting point for thinking about the actual cost of providing quality childcare to New Mexican children.” References Blau, David M. and H. Naci Mocan. “The Supply of Quality in Child Care Centers.” The Review of Economics and Statistics, 84(3). 483 – 496. 2002. Dodson, Dorian. Children’s Cabinet Briefing on the Child Care Assistance Program New Mexico. Children, Youth and Families Department May 2008.
Grossman, Jean Baldwin, Christianne Lind, Cheryl Hayes, Jennifer McMaken and Andrew Gersick. “The Cost of Quality Out-of-School-Time Programs” http://www.wallacefoundation.org/KnowledgeCenter/KnowledgeTopics/AreasOfContinuingInterest/PhilanthropicIssues/Documents/The-Cost-of-Quality-OST-Programs.pdf
Hellburn, S. W. (Ed.). “Cost, Quality and Outcomes in Child Care Centers.” Technical Report, Department of Economics, University of Colorado, Denver. 1995. Hellburn, S.W., M. L. Culkin, J. R. Morris, and R. M. Clifford. “The Cost, Quality, and Outcomes Study Theoretical Structure” in Helburn, ed. 1995.

34 | P a g e
Mocan, H. Naci. “Quality Adjusted Cost Functions For Child Care Centers.” The American Economic Review 85(2): 409-413. 1995. Mocan, H. Naci. “Cost Functions, Efficiency, and Quality in Day Care Centers.” Journal of Human Resources 32(4): 861-891. 1997. Stebbins, Helene; Hanson Langford, Barbara. A Guide to Calculating the Cost of Quality Early Care and Education. The Finance Project Washington D.C. May 2006. www.financeproject.org The Cost and Quality of Full Day, Year-round Early Care and Education in Maine: Preschool Classrooms. Wellesley Centers for Women, Muskie Institute of the University of Southern Maine, 2004. The Cost of Providing Center-Based Child Care in Minnesota. Minnesota Department of Human Services and Policy Studies Incorporated. August 2006. Early Childhood Training and Technical Assistance Programs. CYFD New Mexico. September 2005. New Mexico Children Youth and Families Department Market Rate Survey. New Mexico State University, 2008. Practices and Policies: Market Rate Surveys in States, Territories, and Tribes. Oregon State University Family Policy Program, Oregon Child Care Research Partnership May 2007. Study of Market Prices: Validating Child Care Market Rate Surveys. Oregon State University Family Policy Program, Oregon Child Care Research Partnership August 2008.
Data Appendices A: Essential Elements of Quality at a Glance B: State Wage Data C: TTAP Questions and Responses D: Phone Interview Questions E: Information Using Actual Caregiver-to-child Ratios F: Interview Variable Detail Tables
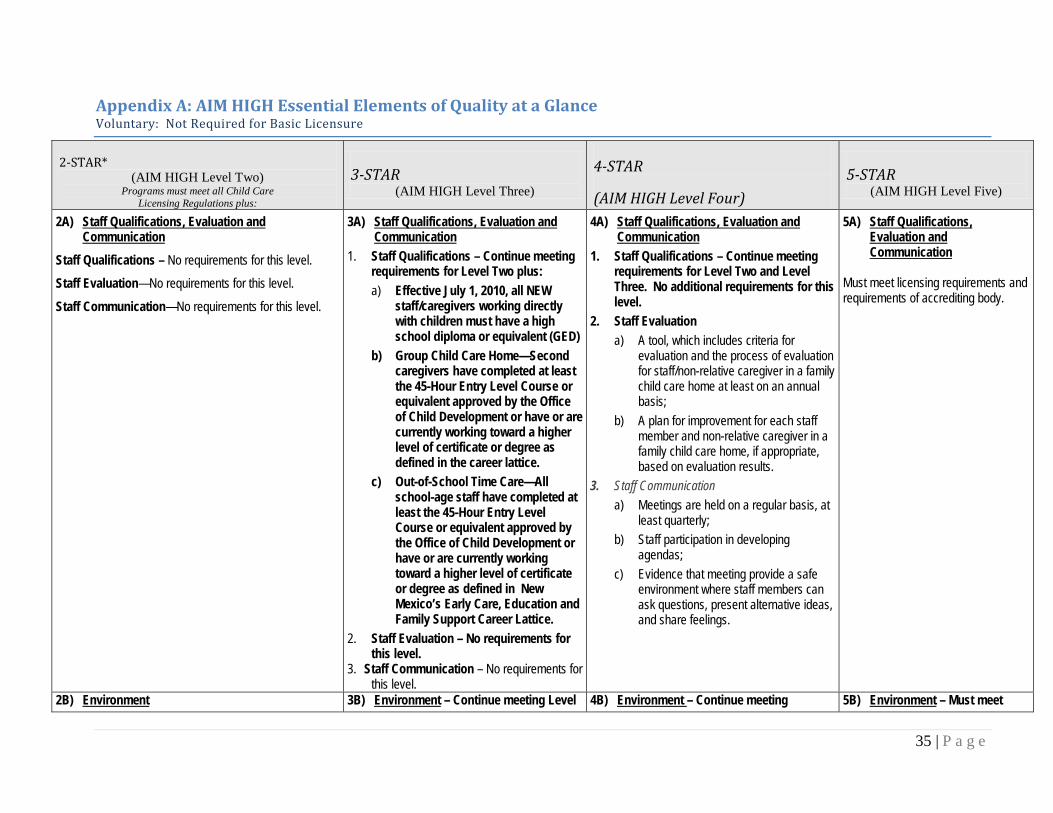
35 | P a g e
Appendix A: AIM HIGH Essential Elements of Quality at a Glance Voluntary: Not Required for Basic Licensure
2-STAR* (AIM HIGH Level Two)
Programs must meet all Child Care Licensing Regulations plus:
3-STAR (AIM HIGH Level Three)
4-STAR
(AIM HIGH Level Four) 5-STAR
(AIM HIGH Level Five)
2A) Staff Qualifications, Evaluation and Communication
Staff Qualifications – No requirements for this level.
Staff Evaluation—No requirements for this level.
Staff Communication—No requirements for this level.
3A) Staff Qualifications, Evaluation and Communication
1. Staff Qualifications – Continue meeting requirements for Level Two plus: a) Effective July 1, 2010, all NEW
staff/caregivers working directly with children must have a high school diploma or equivalent (GED)
b) Group Child Care Home—Second caregivers have completed at least the 45-Hour Entry Level Course or equivalent approved by the Office of Child Development or have or are currently working toward a higher level of certificate or degree as defined in the career lattice.
c) Out-of-School Time Care—All school-age staff have completed at least the 45-Hour Entry Level Course or equivalent approved by the Office of Child Development or have or are currently working toward a higher level of certificate or degree as defined in New Mexico’s Early Care, Education and Family Support Career Lattice.
2. Staff Evaluation – No requirements for this level.
3. Staff Communication – No requirements for this level.
4A) Staff Qualifications, Evaluation and Communication
1. Staff Qualifications – Continue meeting requirements for Level Two and Level Three. No additional requirements for this level.
2. Staff Evaluation a) A tool, which includes criteria for
evaluation and the process of evaluation for staff/non-relative caregiver in a family child care home at least on an annual basis;
b) A plan for improvement for each staff member and non-relative caregiver in a family child care home, if appropriate, based on evaluation results.
3. Staff Communication a) Meetings are held on a regular basis, at
least quarterly; b) Staff participation in developing
agendas; c) Evidence that meeting provide a safe
environment where staff members can ask questions, present alternative ideas, and share feelings.
5A) Staff Qualifications, Evaluation and Communication
Must meet licensing requirements and requirements of accrediting body.
2B) Environment 3B) Environment – Continue meeting Level 4B) Environment – Continue meeting 5B) Environment – Must meet

36 | P a g e
2-STAR* (AIM HIGH Level Two)
Programs must meet all Child Care Licensing Regulations plus:
3-STAR (AIM HIGH Level Three)
4-STAR
(AIM HIGH Level Four) 5-STAR
(AIM HIGH Level Five)
1. Physical Environment: a) Environment is organized into functional,
identifiable learning areas: – Dramatic Play – Creative Art – Books – Blocks and Accessories – Manipulatives – Music – Science – Math/Number – Sensory
b) For Homes: – A place for messy play – A place for loud, active play – A space for playing quietly – A place to pretend – A place to read – A place to eat – A place to rest or sleep
c) Noisy and quiet areas are arranged so that children’s activities can be sustained without interruption.
d) Materials are cleaned and well care for and organized by type and, where appropriate, are labeled with words and/or pictures. Adaptations to materials are made when needed to accommodate various abilities of all children. Unused materials are stored in inaccessible storage.
e) Interest areas are functional with adequate space and are logically placed. The environment is set up so children are not continually interrupting one another.
f) Examples of children’s individually expressed artwork are displayed in the environment or in
Two requirements plus: 1. Physical Environment:
a) Materials and equipment are rotated and adapted on a regular basis to conform to curriculum goals.
b) Staff of the program are very familiar with the environment rating instrument and feel confident that they will score an average score of four.
c) Evaluation of program’s environment requires the completion of a post rating scale*, scoring an average of 4.
*See list of environment rating scales in Element 3B.
2. Social- Emotional Responsive Environment – No additional requirements for this level.
requirements for Level Two and Level Three plus:
1. Physical Environment: a) Outdoor space has some protection
from the elements. b) Outdoor space has some play interest
centers (refer to page 41 of the Essential Elements for a detailed list).
c) Opportunities to develop motor skills.
2. Social- Emotional Responsive Environment – No additional requirements for this level.
licensing requirements and requirements of accrediting body.
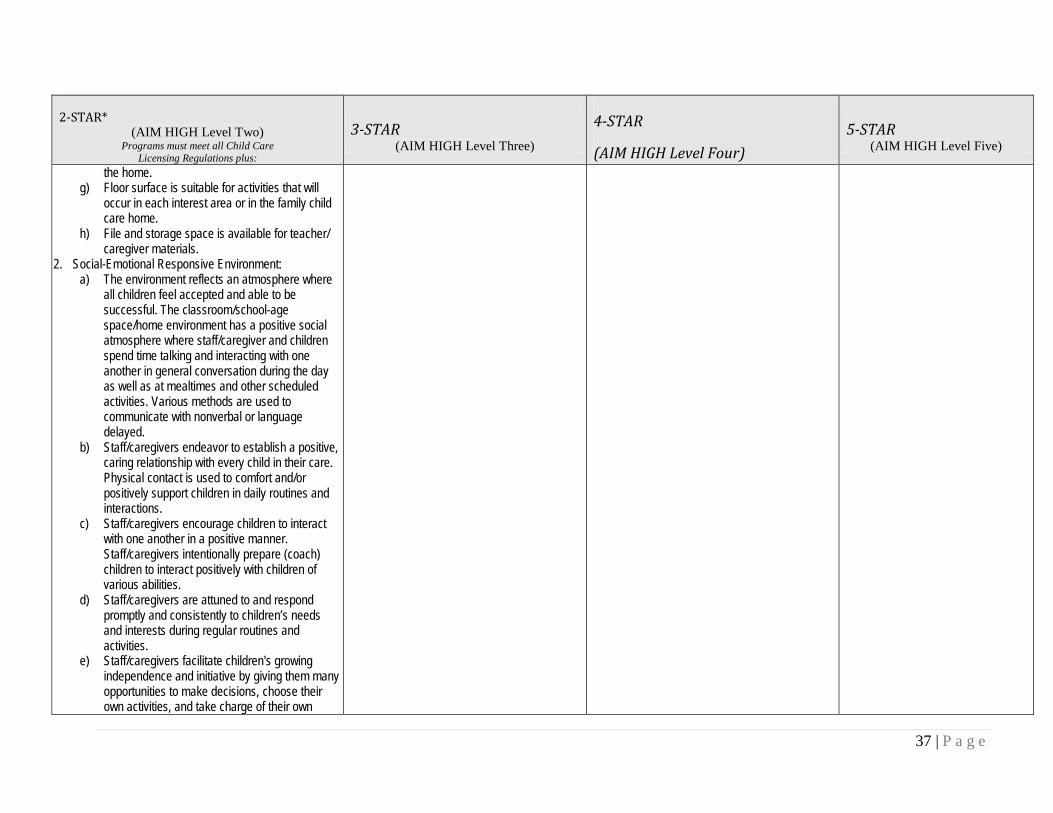
37 | P a g e
2-STAR* (AIM HIGH Level Two)
Programs must meet all Child Care Licensing Regulations plus:
3-STAR (AIM HIGH Level Three)
4-STAR
(AIM HIGH Level Four) 5-STAR
(AIM HIGH Level Five)
the home. g) Floor surface is suitable for activities that will
occur in each interest area or in the family child care home.
h) File and storage space is available for teacher/ caregiver materials.
2. Social-Emotional Responsive Environment: a) The environment reflects an atmosphere where
all children feel accepted and able to be successful. The classroom/school-age space/home environment has a positive social atmosphere where staff/caregiver and children spend time talking and interacting with one another in general conversation during the day as well as at mealtimes and other scheduled activities. Various methods are used to communicate with nonverbal or language delayed.
b) Staff/caregivers endeavor to establish a positive, caring relationship with every child in their care. Physical contact is used to comfort and/or positively support children in daily routines and interactions.
c) Staff/caregivers encourage children to interact with one another in a positive manner. Staff/caregivers intentionally prepare (coach) children to interact positively with children of various abilities.
d) Staff/caregivers are attuned to and respond promptly and consistently to children’s needs and interests during regular routines and activities.
e) Staff/caregivers facilitate children's growing independence and initiative by giving them many opportunities to make decisions, choose their own activities, and take charge of their own
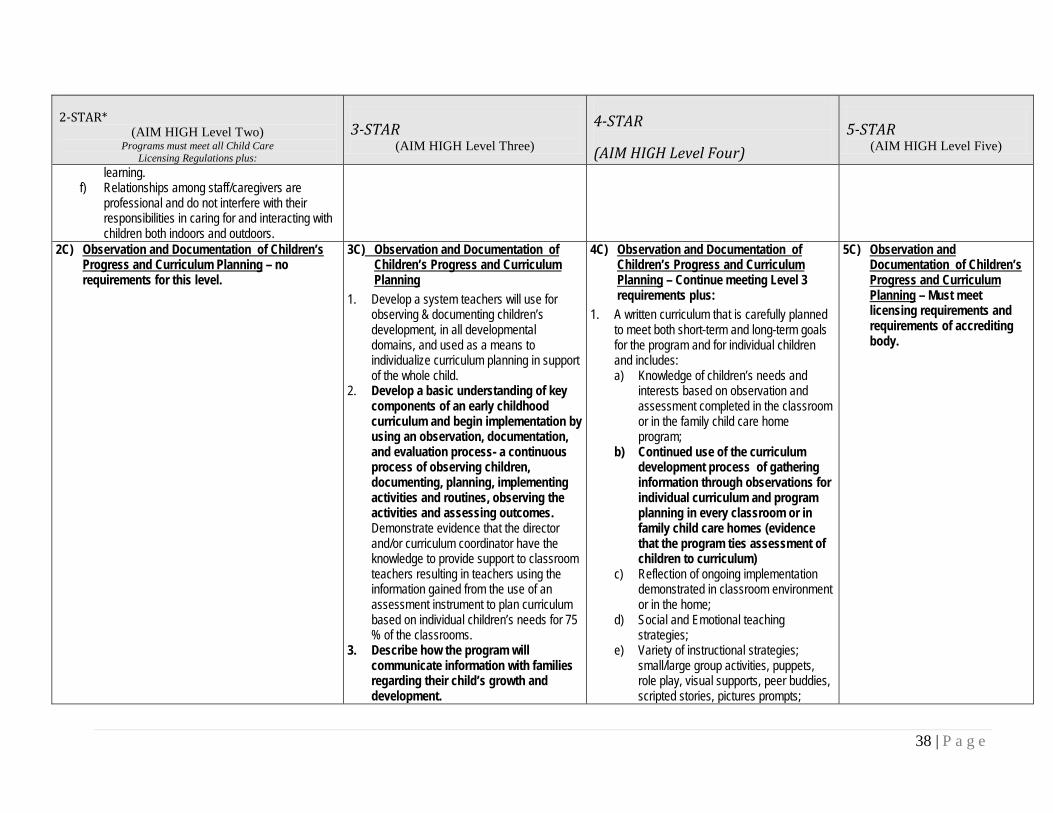
38 | P a g e
2-STAR* (AIM HIGH Level Two)
Programs must meet all Child Care Licensing Regulations plus:
3-STAR (AIM HIGH Level Three)
4-STAR
(AIM HIGH Level Four) 5-STAR
(AIM HIGH Level Five)
learning. f) Relationships among staff/caregivers are
professional and do not interfere with their responsibilities in caring for and interacting with children both indoors and outdoors.
2C) Observation and Documentation of Children’s Progress and Curriculum Planning – no requirements for this level.
3C) Observation and Documentation of Children’s Progress and Curriculum Planning
1. Develop a system teachers will use for observing & documenting children’s development, in all developmental domains, and used as a means to individualize curriculum planning in support of the whole child.
2. Develop a basic understanding of key components of an early childhood curriculum and begin implementation by using an observation, documentation, and evaluation process- a continuous process of observing children, documenting, planning, implementing activities and routines, observing the activities and assessing outcomes. Demonstrate evidence that the director and/or curriculum coordinator have the knowledge to provide support to classroom teachers resulting in teachers using the information gained from the use of an assessment instrument to plan curriculum based on individual children’s needs for 75 % of the classrooms.
3. Describe how the program will communicate information with families regarding their child’s growth and development.
4C) Observation and Documentation of Children’s Progress and Curriculum Planning – Continue meeting Level 3 requirements plus:
1. A written curriculum that is carefully planned to meet both short-term and long-term goals for the program and for individual children and includes: a) Knowledge of children’s needs and
interests based on observation and assessment completed in the classroom or in the family child care home program;
b) Continued use of the curriculum development process of gathering information through observations for individual curriculum and program planning in every classroom or in family child care homes (evidence that the program ties assessment of children to curriculum)
c) Reflection of ongoing implementation demonstrated in classroom environment or in the home;
d) Social and Emotional teaching strategies;
e) Variety of instructional strategies; small/large group activities, puppets, role play, visual supports, peer buddies, scripted stories, pictures prompts;
5C) Observation and Documentation of Children’s Progress and Curriculum Planning – Must meet licensing requirements and requirements of accrediting body.

39 | P a g e
2-STAR* (AIM HIGH Level Two)
Programs must meet all Child Care Licensing Regulations plus:
3-STAR (AIM HIGH Level Three)
4-STAR
(AIM HIGH Level Four) 5-STAR
(AIM HIGH Level Five)
4. Posted weekly lesson plans organized around an appropriate curriculum that incorporate a posted daily schedule (one for parents and one for children) and a written description of the role of the teacher(s)/caregiver(s) and teaching/learning strategies used. Together with the children, teachers/caregivers develop classroom/program rules. They are posted and reviewed regularly with children.
5. Develop a written curriculum that represents: Staff begins to implement the beginning stages of the items listed above. a) Review and update mission, and
philosophy statement. Curriculum planning and implementation should be consistent with the mission and philosophy statement, short-range and long-range goals;
b) Knowledge of child development. Staff/caregivers are familiar with ages and stages of development. Evidence is demonstrated through appropriate expectations for all children including children with special needs;
c) Activities are meaningful, developmentally appropriate, adapted/modified according to the needs and abilities of children;
d) Facilitation of all areas of development; social, emotional, physical, language and cognitive. Some programs might also include a spiritual domain;
e) Integrates foundations for the
f) Sequencing of activities from simple to complex;
g) Support for children’s thinking, reasoning, decision-making, and problem-solving. Teachers facilitate discussions to challenge (scaffold) children’s thinking;
h) Support for development of children’s self-regulation using methods such as logical and natural consequences. Teacher/caregivers facilitate discussions to problem-solve conflict;
i) Evidence that each child’s language and culture are integral components of the daily program;
j) Evidence of child participation in planning activities and developing program rules and routines;
k) Evidence that teachers/ caregivers challenge children just beyond their current level of development (scaffold their learning;
l) Documentation verifying at least a 3-month history of curriculum planning and preferably a year’s history of planning.

40 | P a g e
2-STAR* (AIM HIGH Level Two)
Programs must meet all Child Care Licensing Regulations plus:
3-STAR (AIM HIGH Level Three)
4-STAR
(AIM HIGH Level Four) 5-STAR
(AIM HIGH Level Five)
following content areas: Math, Science, Social Studies, Language Arts/Literacy, Health and Fine Arts;
f) Variety of learning experiences; g) Variety of materials that range from
simple to complex; h) Active engagement of children; i) Opportunities to make choices; j) Ensures smooth transitions from one
activity to another; k) Opportunities to experiment and
explore; l) Large blocks of time for discovery and
child-initiated learning activities; m) A balance of active/quiet,
individual/small group/large group activities and indoor/outdoor time;
n) Emphasis on the value of social interaction through peer learning;
o) A positive social/emotional foundation is valued as essential for the development of lifelong positive interpersonal relationships and the growth in all other developmental domains;
p) Social Skills are intentionally taught. Refer to pages 29 and 30 for curriculum for Infants and toddlers
2D) Staff/Caregiver Professional Development Plan 1. Development of a written plan for ongoing
professional development for each staff member, including the director or for each person working in the family child care home with the children. See sample forms in Element 2D.
3D) Staff/Caregiver Professional Development Plan – Continue meeting Level Two requirements plus:
1. Evidence of progression of the professional development plan from Essential Element 2D. The progress should show evidence that the program is beginning to meet the professional development criteria in AIM
4D) Staff/Caregiver Professional Development Plan- Continue meeting Level Two and Level Three requirements plus:
1. Evidence that individual professional development plans established at Level Two & Level Three are progressing for each staff member, including the director or for each
5D) Staff/Caregiver Professional Development Plan – Must meet licensing requirements and requirements of accrediting body.
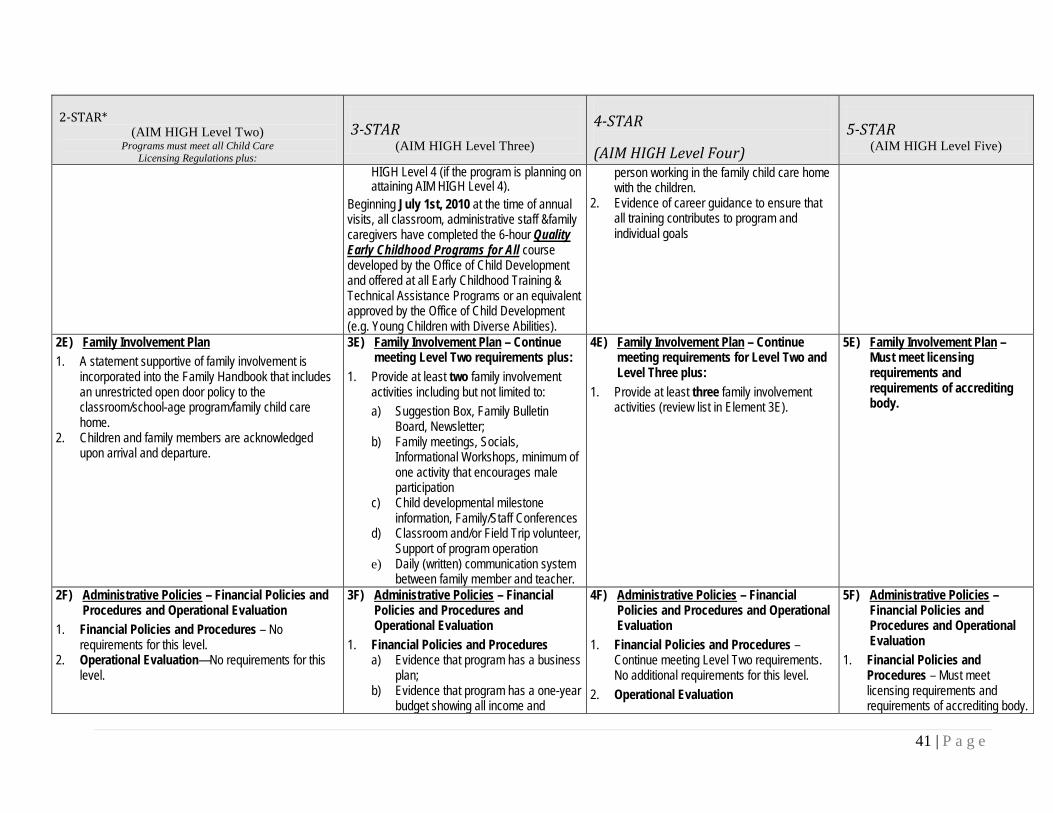
41 | P a g e
2-STAR* (AIM HIGH Level Two)
Programs must meet all Child Care Licensing Regulations plus:
3-STAR (AIM HIGH Level Three)
4-STAR
(AIM HIGH Level Four) 5-STAR
(AIM HIGH Level Five)
HIGH Level 4 (if the program is planning on attaining AIM HIGH Level 4).
Beginning July 1st, 2010 at the time of annual visits, all classroom, administrative staff &family caregivers have completed the 6-hour Quality Early Childhood Programs for All course developed by the Office of Child Development and offered at all Early Childhood Training & Technical Assistance Programs or an equivalent approved by the Office of Child Development (e.g. Young Children with Diverse Abilities).
person working in the family child care home with the children.
2. Evidence of career guidance to ensure that all training contributes to program and individual goals
2E) Family Involvement Plan 1. A statement supportive of family involvement is
incorporated into the Family Handbook that includes an unrestricted open door policy to the classroom/school-age program/family child care home.
2. Children and family members are acknowledged upon arrival and departure.
3E) Family Involvement Plan – Continue meeting Level Two requirements plus:
1. Provide at least two family involvement activities including but not limited to: a) Suggestion Box, Family Bulletin
Board, Newsletter; b) Family meetings, Socials,
Informational Workshops, minimum of one activity that encourages male participation
c) Child developmental milestone information, Family/Staff Conferences
d) Classroom and/or Field Trip volunteer, Support of program operation
e) Daily (written) communication system between family member and teacher.
4E) Family Involvement Plan – Continue meeting requirements for Level Two and Level Three plus:
1. Provide at least three family involvement activities (review list in Element 3E).
5E) Family Involvement Plan – Must meet licensing requirements and requirements of accrediting body.
2F) Administrative Policies – Financial Policies and Procedures and Operational Evaluation
1. Financial Policies and Procedures – No requirements for this level.
2. Operational Evaluation—No requirements for this level.
3F) Administrative Policies – Financial Policies and Procedures and Operational Evaluation
1. Financial Policies and Procedures a) Evidence that program has a business
plan; b) Evidence that program has a one-year
budget showing all income and
4F) Administrative Policies – Financial Policies and Procedures and Operational Evaluation
1. Financial Policies and Procedures – Continue meeting Level Two requirements. No additional requirements for this level.
2. Operational Evaluation
5F) Administrative Policies – Financial Policies and Procedures and Operational Evaluation
1. Financial Policies and Procedures – Must meet licensing requirements and requirements of accrediting body.
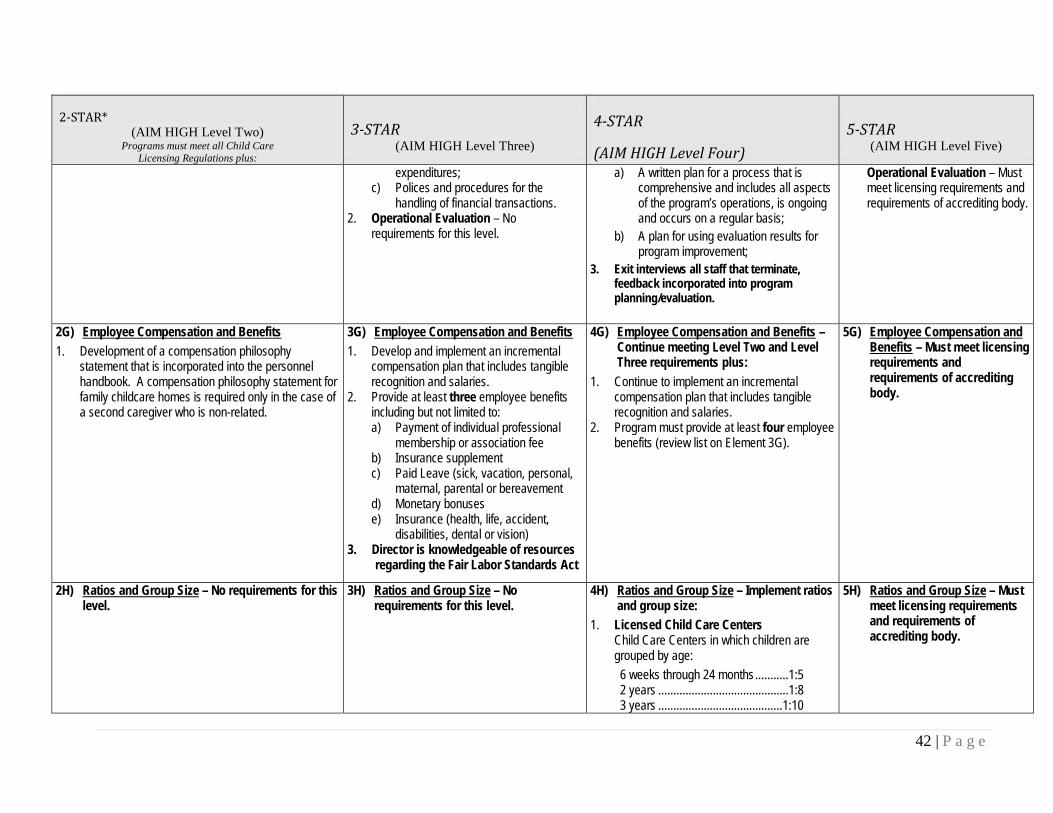
42 | P a g e
2-STAR* (AIM HIGH Level Two)
Programs must meet all Child Care Licensing Regulations plus:
3-STAR (AIM HIGH Level Three)
4-STAR
(AIM HIGH Level Four) 5-STAR
(AIM HIGH Level Five)
expenditures; c) Polices and procedures for the
handling of financial transactions. 2. Operational Evaluation – No
requirements for this level.
a) A written plan for a process that is comprehensive and includes all aspects of the program’s operations, is ongoing and occurs on a regular basis;
b) A plan for using evaluation results for program improvement;
3. Exit interviews all staff that terminate, feedback incorporated into program planning/evaluation.
Operational Evaluation – Must meet licensing requirements and requirements of accrediting body.
2G) Employee Compensation and Benefits 1. Development of a compensation philosophy
statement that is incorporated into the personnel handbook. A compensation philosophy statement for family childcare homes is required only in the case of a second caregiver who is non-related.
3G) Employee Compensation and Benefits 1. Develop and implement an incremental
compensation plan that includes tangible recognition and salaries.
2. Provide at least three employee benefits including but not limited to: a) Payment of individual professional
membership or association fee b) Insurance supplement c) Paid Leave (sick, vacation, personal,
maternal, parental or bereavement d) Monetary bonuses e) Insurance (health, life, accident,
disabilities, dental or vision) 3. Director is knowledgeable of resources
regarding the Fair Labor Standards Act
4G) Employee Compensation and Benefits – Continue meeting Level Two and Level Three requirements plus:
1. Continue to implement an incremental compensation plan that includes tangible recognition and salaries.
2. Program must provide at least four employee benefits (review list on Element 3G).
5G) Employee Compensation and Benefits – Must meet licensing requirements and requirements of accrediting body.
2H) Ratios and Group Size – No requirements for this level.
3H) Ratios and Group Size – No requirements for this level.
4H) Ratios and Group Size – Implement ratios and group size:
1. Licensed Child Care Centers Child Care Centers in which children are grouped by age: 6 weeks through 24 months ...........1:5 2 years ...........................................1:8 3 years .........................................1:10
5H) Ratios and Group Size – Must meet licensing requirements and requirements of accrediting body.
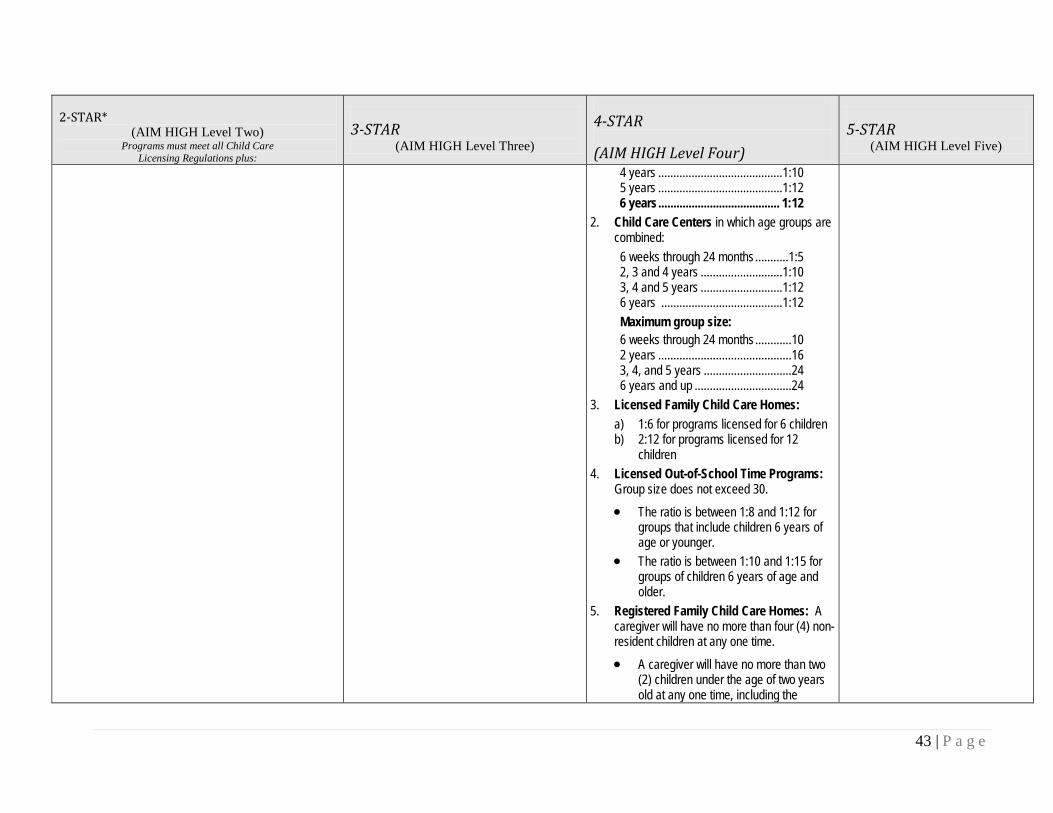
43 | P a g e
2-STAR* (AIM HIGH Level Two)
Programs must meet all Child Care Licensing Regulations plus:
3-STAR (AIM HIGH Level Three)
4-STAR
(AIM HIGH Level Four) 5-STAR
(AIM HIGH Level Five)
4 years .........................................1:10 5 years .........................................1:12 6 years ........................................ 1:12
2. Child Care Centers in which age groups are combined: 6 weeks through 24 months ...........1:5 2, 3 and 4 years ...........................1:10 3, 4 and 5 years ...........................1:12 6 years ........................................1:12 Maximum group size: 6 weeks through 24 months ............10 2 years ............................................16 3, 4, and 5 years .............................24 6 years and up ................................24
3. Licensed Family Child Care Homes: a) 1:6 for programs licensed for 6 children b) 2:12 for programs licensed for 12
children 4. Licensed Out-of-School Time Programs:
Group size does not exceed 30. • The ratio is between 1:8 and 1:12 for
groups that include children 6 years of age or younger.
• The ratio is between 1:10 and 1:15 for groups of children 6 years of age and older.
5. Registered Family Child Care Homes: A caregiver will have no more than four (4) non-resident children at any one time. • A caregiver will have no more than two
(2) children under the age of two years old at any one time, including the

44 | P a g e
2-STAR* (AIM HIGH Level Two)
Programs must meet all Child Care Licensing Regulations plus:
3-STAR (AIM HIGH Level Three)
4-STAR
(AIM HIGH Level Four) 5-STAR
(AIM HIGH Level Five)
providers own children. • A caregiver will have no more than six
(6) children under the age of six at any one time, including providers own children.
• Shifts are allowed provided there are never more than 4 non-resident children present at any one time.
I) Accreditation – No requirements for this level. *Programs serving children on Child Care Assistance will be required to achieve 2-STAR status at the time of their annual visit effective 7/1/2006.
3I) Accreditation – No requirements for this level.
4I) Accreditation – No requirements for this level.
5I) Accreditation through a nationally recognized accrediting body approved by the Office of Child Development Board through demonstration that their accreditation significantly matches standards set by the NAEYC Academy of Early Childhood Program Accreditation. Refer to the AH Essential Elements document for a complete list of accepted accrediting organizations.

45 | P a g e
Appendix B: New Mexico Department of Workforce Solutions Wage Data
New Mexico Local Wages for Child Care Workers Area Entry Wage Experienced Wage Average Wage
New Mexico Annual $12,372 $18,106 $16,195 New Mexico Hourly $5.95 $8.70 $7.79
+ Metro Areas Albuquerque Annual $12,390 $17,952 $16,098 Hourly $5.96 $8.63 $7.74 Farmington Annual $12,336 $16,519 $15,124 Hourly $5.93 $7.94 $7.27 Las Cruces Annual $12,522 $18,182 $16,295 Hourly $6.02 $8.74 $7.83 Santa Fe Annual $14,934 $23,599 $20,711 Hourly $7.18 $11.35 $9.96
+ Regions Central Annual $12,457 $18,088 $16,211 Hourly $5.99 $8.70 $7.79 Eastern Annual $12,345 $15,142 $14,210 Hourly $5.94 $7.28 $6.83 Northern Annual $14,143 $19,996 $18,045 Hourly $6.80 $9.61 $8.68 Southwestern Annual $12,520 $18,230 $16,327 Hourly $6.02 $8.76 $7.85
Areas refer to Metropolitan Statistical Areas. Regions refer to Workforce Investment Areas. Wages displayed are from the survey published 2008.
Source: http://www.dws.state.nm.us/careersolutions/occs/39901100.html Last Accessed February 27, 2009

46 | P a g e
New Mexico Local Wages for Education Administrators, Preschool and Child Care Center/Program
Area Entry Wage Experienced Wage Average Wage New Mexico Annual $22,539 $44,161 $36,954 New Mexico Hourly $10.84 $21.23 $17.77
+ Metro Areas Albuquerque Annual $20,987 $34,682 $30,117 Hourly $10.09 $16.67 $14.48 Farmington Annual $23,846 $44,243 $37,444 Hourly $11.46 $21.27 $18.00 Las Cruces Annual - - - Hourly - - - Santa Fe Annual - - - Hourly - - -
+ Regions Central Annual $21,065 $34,954 $30,324 Hourly $10.13 $16.80 $14.58 Eastern Annual $28,300 $58,784 $48,623 Hourly $13.61 $28.26 $23.38 Northern Annual $25,575 $49,008 $41,197 Hourly $12.30 $23.56 $19.81 Southwestern Annual - - - Hourly - - -
A dash '-' indicates that survey information is not available for this occupation. Areas refer to Metropolitan Statistical Areas. Regions refer to Workforce Investment Areas.
Source: http://www.dws.state.nm.us/careersolutions/occs/11903100.html Last accessed May 1, 2009.

47 | P a g e
Appendix C: TTAP Questions and Responses The following questions were emailed to TTAP Directors: TTAP Name and Location: ________________________________________ anecdotal information
1. Where do the bulk of the costs go within and among specific requirements of the Stars Quality
Rating System?
2 STAR:
3 STAR:
4 STAR:
2. On which requirements do providers spend the majority of their time?
2 STAR:
3 STAR:
4 STAR:
3. Which requirements do providers struggle with the most?
2 STAR:
3 STAR:
4 STAR:
4. What are the largest barriers to complying with the essential elements?
2 STAR:
3 STAR:
4 STAR:
5. Who is typically responsible for writing plans that are required in the essential elements (for
example, the family involvement plan and the professional development plan)?
6. What are the likely effects of the GED requirement in Star level 3 …
a) How many providers in your area might be affected by this requirement?
b) Do you think that directors will have to pay higher wages to their staff as a result of the
requirement?
c) Will it affect directors’ ability to hire and retain qualified staff?
d) How will family and group home child care providers be affected by the requirement?
7. How long does it typically take providers to meet the environmental rating scale requirements?

48 | P a g e
8. What is the biggest expense for providers in meeting the ERS requirements?
9. Do programs typically pay their staff for the time they’re doing trainings, whether staff
participate in trainings during or outside of normal work hours?
10. How much extra time typically goes toward planning and documentation?
2 STAR:
3 STAR:
4 STAR:
11. Do you know of providers that hire outside help to assist them in complying with the QRS
requirements? For example, a bookkeeper or a consultant? If so, how common do you think this
is?
specific information 1. This question is in regard to trainings you offer that would assist providers in reaching and
maintaining a higher star level. Are these training sessions typically well-attended? For example, do
you have a hard time getting enough providers to come or do you have a waiting list.
2. Is the 45-Hour Course typically well-attended?
3. Is there a waiting list to participate in the AIM HIGH program in your region?
4. Can you recommend some providers that would be beneficial to talk to about their participation in the
AIM HIGH program?
5. Are there any groups of directors or director associations in your TTAP region?
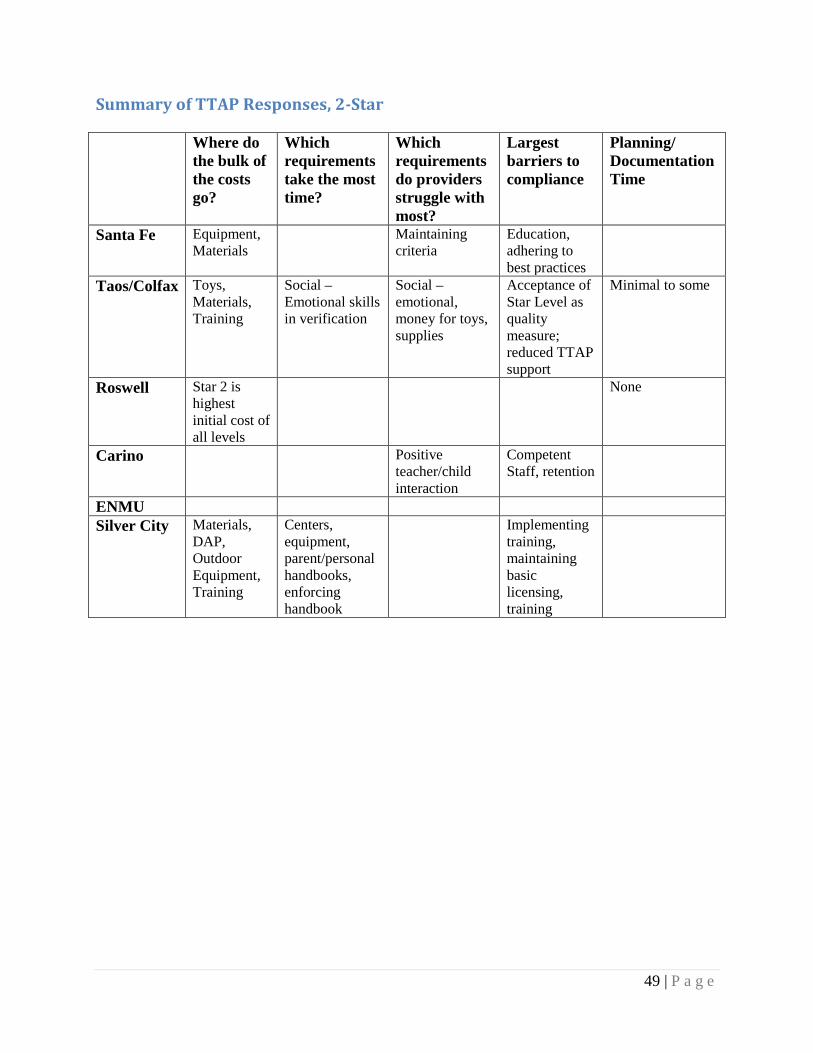
49 | P a g e
Summary of TTAP Responses, 2-Star Where do
the bulk of the costs go?
Which requirements take the most time?
Which requirements do providers struggle with most?
Largest barriers to compliance
Planning/ Documentation Time
Santa Fe Equipment, Materials
Maintaining criteria
Education, adhering to best practices
Taos/Colfax Toys, Materials, Training
Social – Emotional skills in verification
Social – emotional, money for toys, supplies
Acceptance of Star Level as quality measure; reduced TTAP support
Minimal to some
Roswell Star 2 is highest initial cost of all levels
None
Carino Positive teacher/child interaction
Competent Staff, retention
ENMU Silver City Materials,
DAP, Outdoor Equipment, Training
Centers, equipment, parent/personal handbooks, enforcing handbook
Implementing training, maintaining basic licensing, training

50 | P a g e
Summary of TTAP Responses, 3-Star Where do the
bulk of the costs go?
Which requirements take the most time?
Which requirements do providers struggle with most?
Largest barriers to compliance
Planning/ Document Prep Time
Santa Fe
Training, classes 3-Star is the most stringent level
Curriculum, assessment
Education, adhering to best practices
Taos/ Colfax
Toys, storage, office equipment, employee benefits, additional staff for assessment, activities
This is the hardest step.
Curriculum, Employee benefits
Acceptance of Star Level as quality measure;Best practices, observations, knowing DAP, Staff turnover
More than 2-Star
Roswell Materials, books, furniture, equipment
Curriculum; this is the most difficult
3-Star is the worst
3-Star is worst 2 hours per week minimum
Carino Materials for rotation
3-Star is the worst
Lesson plans, assessments, supplies
ENMU Silver City
Training, toys Understanding development, curriculum, development
Lack of understanding re: assessment, curriculum. Professional development, administrative policies
Lack of understanding of all of the components of the requirements
2 -3 hours per week
Effects of GED Requirement How many providers
will be affected? Will GED require higher wages?
Will GED affect retention?
Will GED affect family home providers?
Santa Fe Very few in this area No No Very little Taos/ Colfax
3 – 5 providers affected Probably not Probably not All currently have GED
Roswell Minimal No No Carino Approximately 20% Should, but
won’t. Yes – people will quit
May not pursue higher Star
ENMU Probably the family homes
Probably not Possibly in rural counties
Silver City
2 providers. No No Approximately ¾ not affected
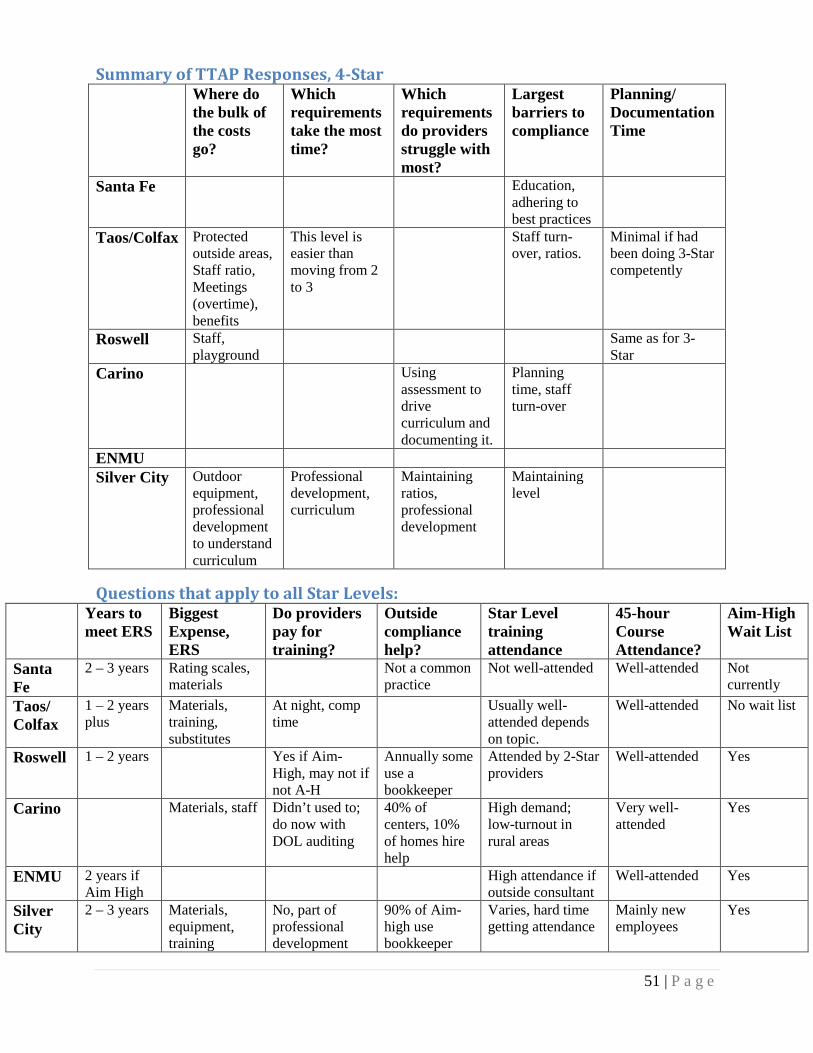
51 | P a g e
Summary of TTAP Responses, 4-Star Where do
the bulk of the costs go?
Which requirements take the most time?
Which requirements do providers struggle with most?
Largest barriers to compliance
Planning/ Documentation Time
Santa Fe Education, adhering to best practices
Taos/Colfax Protected outside areas, Staff ratio, Meetings (overtime), benefits
This level is easier than moving from 2 to 3
Staff turn-over, ratios.
Minimal if had been doing 3-Star competently
Roswell Staff, playground
Same as for 3-Star
Carino Using assessment to drive curriculum and documenting it.
Planning time, staff turn-over
ENMU Silver City Outdoor
equipment, professional development to understand curriculum
Professional development, curriculum
Maintaining ratios, professional development
Maintaining level
Questions that apply to all Star Levels: Years to
meet ERS Biggest Expense, ERS
Do providers pay for training?
Outside compliance help?
Star Level training attendance
45-hour Course Attendance?
Aim-High Wait List
Santa Fe
2 – 3 years Rating scales, materials
Not a common practice
Not well-attended Well-attended Not currently
Taos/ Colfax
1 – 2 years plus
Materials, training, substitutes
At night, comp time
Usually well-attended depends on topic.
Well-attended No wait list
Roswell 1 – 2 years Yes if Aim-High, may not if not A-H
Annually some use a bookkeeper
Attended by 2-Star providers
Well-attended Yes
Carino Materials, staff Didn’t used to; do now with DOL auditing
40% of centers, 10% of homes hire help
High demand; low-turnout in rural areas
Very well-attended
Yes
ENMU 2 years if Aim High
High attendance if outside consultant
Well-attended Yes
Silver City
2 – 3 years Materials, equipment, training
No, part of professional development
90% of Aim-high use bookkeeper
Varies, hard time getting attendance
Mainly new employees
Yes

52 | P a g e
Appendix D: Phone Interview Questions Introductory Information and Questions, Providers of all Star Levels: The information we collect is strictly anonymous, and we will not record your name, but we do want to confirm some basic information. This study is only to determine the cost of providing child care. We are not involved in compliance or verification. Our records show that your facility is A ______- Star facility and that it is a ___________ (licensed Home, Group or Center) In the zip code: ____________And that you serve ages ___________________ Thank you! Now I would like to ask you some questions about your program. I am going to ask you how many children you currently care for at various ages. How many do you care for that are Less than 1 year-old: 1 year olds 2 year olds 3 year olds 4 year olds 5 year olds School-aged Do you have a wait list? If yes – for what ages? Do you offer care before 7 am, after 7 pm or on the weekends? If yes – which hours? How many teachers or other care givers are on your staff? What is their educational background? Do you charge any extra fees, for example for transportation or for activities, besides tuition? Did you participate in the Aim High Program? Did your Aim High PDS provide you with any materials? If yes: What kinds of things did your PDS provide? If yes: About what percent of your costs do you think Aim High program material covers? 2-Star Questions FACILITY 1) Did you have to make any modifications to your space to obtain 2-Star status? a. What did you have to do? b. Do you remember how much that cost? c. In answering this question, think about people you might have hired to help with modifications as well as times you might have traded services.

53 | P a g e
2) Do you have to spend any additional money maintaining your facility in order to comply with 2-Star requirements? 3) What kinds of materials (for example, books and toys) were obtained to earn 2-Star status? a. Approximately how much did you initially spend on those things? b. Approximately how much do you spend each year on materials? 4) Did you have to add inside or outside storage space in order to obtain 2-Star status? a. Approximately how much did you spend on that? If they built anything themselves: How much time did you spend building or installing that? TRAINING 5) Do you and your staff obtain training to help you meet and/or maintain 2-Star status? a. Is this training over and above the 24 hours required for a license? If yes, how many more hours? b. Do these 2-Star related trainings cost money? i. Consider time, travel costs, overnight costs, costs of substitutes, etc. PLANNING AND DOCUMENTATION 6) Approximately how much time or money did/do you spend developing and updating your … a. Staff development plan? (Is that per year, per month or a one time event?) b. Family involvement statement? (per year, per month or one time event) c. Compensation philosophy statement? (per year, per month or one time event) 7) Who spends the majority of time developing these documents? Is that person compensated for her time spent on planning and preparing documents? ADDITIONAL COSTS 8) What other costs do you have meeting the standards for 2-Star? Did you have to hire any additional employees or any temporary help? 9) What other activities do you have to spend time on to meet the standards for 2-Star? 10) What is your educational background and years of experience in the field? Three-Star Questions FACILITY 1) Did you have to make any modifications to your space to obtain 3-Star status? a. What did you have to do? b. Do you remember how much that cost? c. In answering this question, think about people you might have hired to help with modifications as well as times you might have traded services. 2) Do you have to spend any additional money or time maintaining your facility in order to comply with 3-Star requirements? 3) What kinds of materials (for example, books and toys) did you obtain to earn 3-Star status? Include materials that you did not have to purchase yourself. a. Approximately how much did you initially spend on those things?

54 | P a g e
b. Approximately how much do you spend each year on materials? 4) Did you have to add inside or outside storage space in order to obtain 3-Star status? a. Approximately how much did you spend on that? Did you do any of the work yourself? If yes, how much time did you spend on that work? TRAINING 5) Do you and your staff obtain training to help you meet and/or maintain 3-Star status? a. Is this training over and above the 24 hours required for a license? If yes, how many more hours? b. Do these trainings cost money? i. Consider time, travel costs, overnight costs, costs of substitutes, etc. 6) IF OUT-OF-SCHOOL PROGRAM OR GROUP HOME: How does your second caregiver/after school program staff obtain the 45 hour course? How much does it cost (including materials)? a. Also consider time, travel costs, overnight costs, costs of substitutes, etc. PLANNING AND DOCUMENTATION 7) Approximately how much time or money did/do you spend a. Observing and assessing children’s progress and doing lesson plans? (Is this per week, per day?) Do you compensate your staff for planning time to prepare lesson plans? Did you purchase an assessment instrument for this? IF yes: How much did that cost? Have you purchased any curriculum? IF yes: How much did that cost? b. developing and updating your plan for your staff’s professional development? (per year, per month or one time event) c. developing and updating your business plan? i. Did you have help developing that plan? Did you have to pay for the assistance? d. developing and updating your budget? i. Did you have help developing your budget? Did you pay for the assistance? e. Developing your policies for handling financial transactions? For example, did you purchase software or hire a bookkeeper? i. Did you have help? Did you pay for the assistance? f. developing and updating your employee compensation and benefits plan? 8) Who spends the majority of time developing these documents? Is that time compensated? 9) How do you involve the families that you serve? a. How much time and money do you spend on family involvement activities? SALARIES AND BENEFITS 10) What kinds of benefits do you offer your employees? a. What does it cost you to provide those benefits? 11) Most studies find that salaries are the biggest cost for child care providers. Is that true for you? a. Approximately what is the range of salaries you pay your staff? b. How often do you hire substitutes? c. How much does that add to your regular salary costs? d. Will your salary costs increase when the rules change to require workers to have a GED or high school degree? If yes, by how much? ADDITIONAL COSTS

55 | P a g e
1) What other costs do you have meeting the Star Level standards? For example, did you have to hire any more workers? 2) What other activities do you have to spend time on to meet the Star level standards? 3) What is your educational background and years of experience in the field? Four-Star Level Questions FACILITY 1) Did you have to make any modifications to your space to obtain 4-Star status? a. What did you have to do? b. Do you remember how much that cost? c. In answering this question, think about people you might have hired to help with modifications as well as times you might have traded services. d. If they don't mention outdoor environment here, ask them about modifications to the outdoor environment. 2) Do you have to spend any additional money maintaining your facility in order to comply with 4-Star requirements? 3) What kinds of materials (for example, books and toys) did you obtain to earn 4-Star status, including things you did not have to pay for yourself? a. Approximately how much did you initially spend on those things? b. Approximately how much do you spend each year on materials? 4) Did you have to add inside or outside storage space in order to obtain 4-Star status? a. Approximately how much did you spend on that? Did you spend any time building or installing that? TRAINING 5) Do you and your staff obtain training to help you meet and/or maintain 4-Star status? a. Do these trainings cost money? i. Consider time, travel costs, overnight costs, costs of substitutes, etc. 6) Approximately how much time do you spend developing and updating your plan for your staff’s professional development? Is that per year, per month,? PLANNING AND DOCUMENTATION 7) Approximately how much of your own time do you spend assessing children’s progress and developing and implementing your curriculum? a. Approximately how much time do you spend verifying your curriculum? b. Do you compensate your staff for time spent on assessment, lesson plans and curriculum? (Is this per week, per day?) 8) Do you conduct exit interviews with staff members who leave? a. Approximately how much time do you spend on that activity? 9) Approximately how much time did/do you spend developing and updating your … a. Business plan? i. Did you have help developing that plan? Did you have to pay for the assistance? b. Budget? i. Did you have help developing your budget? Did you pay for the assistance?

56 | P a g e
c. Policies for handling financial transactions, for example did you purchase software, hire a bookkeeper? i. Did you have help? Did you pay for the assistance? d. Employee compensation and benefits plan? 10) Who spends the majority of time developing these documents? Is that person compensated for time spent on planning and documentation? 11) How do you involve the families that you serve? a. How much time and money do you spend on family involvement activities? SALARIES AND BENEFITS 12) What kinds of benefits do you offer your employees? (they should list 4! But don’t say so.) a. What does it cost you to provide those benefits? 13) Most studies find that salaries are the biggest cost for child care providers. Is that true for you? a. Approximately what is the range of salaries you pay your staff? Approximately how often do you hire substitutes? Approximately how much does that add to your regular salary costs? 19) What changes did you make in your staffing ratios to meet the 4-Star requirements? i. For example, did you have to take fewer children or hire more staff? How many fewer children? How many more teachers? 20) What other costs do you have meeting the Star Level 4 standards? 21) What other activities do you have to spend time on to meet the Star level standards? 22) What is your educational background and years of experience in the field? Additional questions asked of all providers: TRANSPORTATION 1) Do you transport children? IF NO, SKIP TO SPECIAL NEEDS SECTION: IF YES, CONTINUE 2) Who is responsible for transporting children? 3) How many employees transport children? 4) What type of vehicle is used to transport children (staff’s vehicles, designated vehicle, …) 5) How often are children transported? 6) Are vehicles built to school bus standards or of multifunction school activity buses? (yes/no/don’t know) 7) Is there a regular vehicle maintenance and inspection program? (yes/no) 8) Do drivers receive a medical examination to determine fitness to drive? (yes/no) 9) Is there preemployment, random, post accident, and "for cause" drug testing for all child care transportation providers? (yes/no) 10) Are vehicles labeled with the child care center's and oversight agency's names and phone numbers? (yes/no) CARING FOR CHILDREN WITH SPECIAL NEEDS 1) Do you care for any children with special needs? (IF YES, ask the following, otherwise just skip entire block of questions.) 2) Does the money you receive to care for these children cover any added expenses needed for their care? 3) If no: How much of any additional cost is not covered?
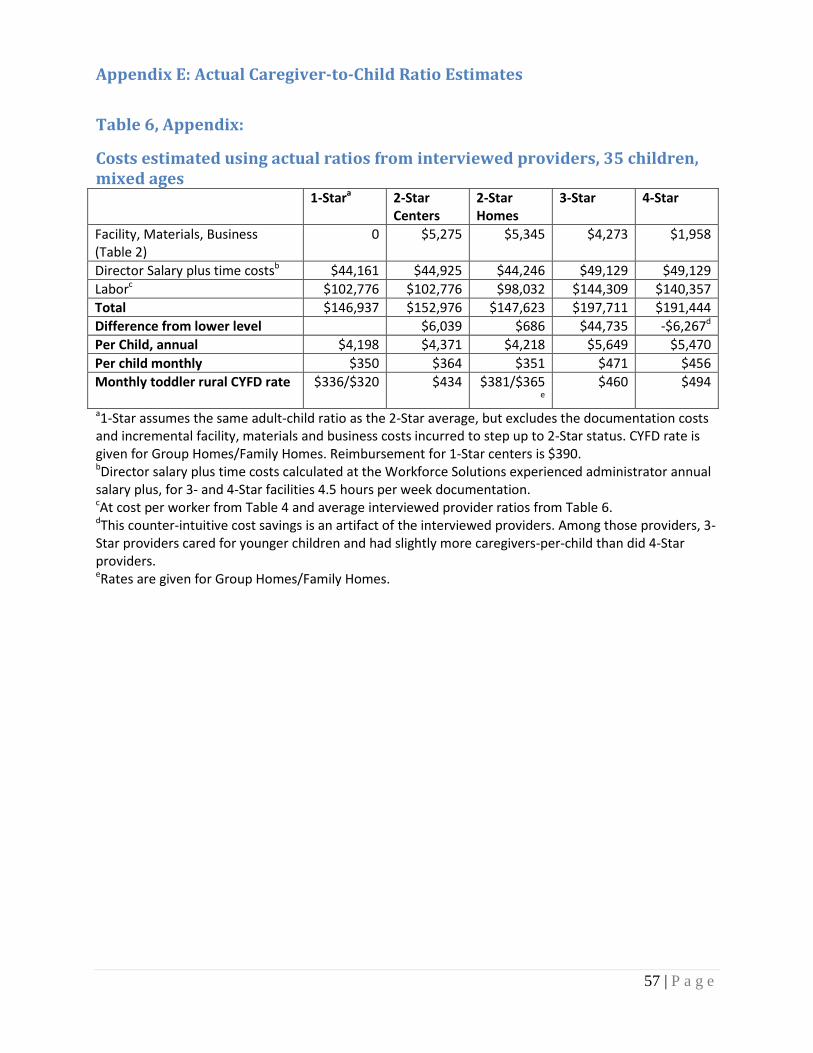
57 | P a g e
Appendix E: Actual Caregiver-to-Child Ratio Estimates
Table 6, Appendix:
Costs estimated using actual ratios from interviewed providers, 35 children, mixed ages 1-Stara 2-Star
Centers 2-Star Homes
3-Star 4-Star
Facility, Materials, Business (Table 2)
0 $5,275 $5,345 $4,273 $1,958
Director Salary plus time costsb $44,161 $44,925 $44,246 $49,129 $49,129 Laborc $102,776 $102,776 $98,032 $144,309 $140,357 Total $146,937 $152,976 $147,623 $197,711 $191,444 Difference from lower level $6,039 $686 $44,735 -$6,267d
Per Child, annual $4,198 $4,371 $4,218 $5,649 $5,470 Per child monthly $350 $364 $351 $471 $456 Monthly toddler rural CYFD rate $336/$320 $434 $381/$365
e $460 $494
a1-Star assumes the same adult-child ratio as the 2-Star average, but excludes the documentation costs and incremental facility, materials and business costs incurred to step up to 2-Star status. CYFD rate is given for Group Homes/Family Homes. Reimbursement for 1-Star centers is $390. bDirector salary plus time costs calculated at the Workforce Solutions experienced administrator annual salary plus, for 3- and 4-Star facilities 4.5 hours per week documentation. cAt cost per worker from Table 4 and average interviewed provider ratios from Table 6. dThis counter-intuitive cost savings is an artifact of the interviewed providers. Among those providers, 3-Star providers cared for younger children and had slightly more caregivers-per-child than did 4-Star providers. eRates are given for Group Homes/Family Homes.

58 | P a g e
Appendix F: Detailed Interview Variable Tables
Table 1A: Facility and Materials Costs, 2-Star* Number
Responding Count Mean Standard Deviation
Outlier Value
Total Enrollment 50 29.6 21.5 Aim High Participants 25 Receipt of Materials from PDS 21 Facility Modification Costs 14 $3,293 3540 $550,000 Facility Modification Costs per child $273 241 $14,865 Bartered for Goods or Services 13 Facilities Maintenance Costs 4 $2,750 645 -- Initial Cost, Materials 47 $1,385 2039 $75,000 Initial Cost of Materials per child 47 $93 177.6 $2,027 Yearly Cost, Materials 46 $1,428 1790 $10,000 Yearly Cost of Materials per child 46 $57 75 $270 Required Additional Storage 22 Additional Storage Cost 17 $2,319 2834 $15,000 Additional Storage Time (hours) 13 30.3 13.7 Total Mean Initial Facilities, Materials, Storage
$6,997 $625,000
Total Mean Initial Facilities and Materials per child
$366 $16,892
Total Mean Annual Facilities and Storage
$4,178
*One center’s costs were so much higher than the others’ that their cost information was not included in calculating descriptive statistics. Some providers did not provide specific dollar amounts; statistics are given only in those cases in which numerical figures were given. The column titled “Number Responding” provides the number of providers who provided that data. “Count” gives the number of providers responding Yes to Yes/No questions. Some variables are also reported as cost-per-child.
Table 2A: Detail of Labor Costs, 2-Star Number
Responding Mean Standard
Deviation Staff size 50 5.48 4.90 Annual Training Costs 50 $632.10 2115.4 Annual Training Costs per employee 50 $100.41 126.54 Staff Development Plan 10 $585 894 Initial Documentation Time, hours per year 42 59.2 hours 64.2 Imputed Value, Initial Document Time calculated at the mean, Workforce Solution wage of $21.23
$1,257
Maintenance Document Time, hours per year 48 32.5 hours 80.3 Value, Maintenance Time calculated at the mean $690 Minimum Hourly Wage 39 $8.18 1.59 Maximum Hourly wage 39 $10.00 3.39 Total Mean Training and Annual Documentation Costs $1,500 Hire Substitutes 26 report that they do, with highly
varying costs

59 | P a g e
Table 3A: Interview Data Detail, 3-Star Number
Responding Mean Standard
Deviation Total Enrollment 25 44.56 47.30 Child to Staff Ratio 25 4.53 1.81 Percent of Materials from PDS 25 36.8 14.35 Annual Facilities Maintenance Costs 25 $1,250 1065 Annual Facilities Maintenance Costs per child 25 $61.83 62.37 Initial Cost, Materials 25 $278 169.16 Initial Cost of Materials per child 25 $14.19 15.57 Yearly Cost, Materials 25 $712 470.8 Yearly Cost of Materials per child 25 $37.45 44.44 Consultant, Accountant (annual) 16 $251.56 43.72 Business Plan Assistance 16 $1,476 467
Table 4A: Interview Data Detail, 4-Star Number
Responding Mean Standard
Deviation Total Enrollment 15 36.27 29.06 Child to Staff Ratio 15 4.83 0.80 Percent of Materials from PDS 15 34.0 14.0 Annual Facilities Maintenance Costs 15 $1,161 1857 Annual Facilities Maintenance Costs per child 15 $27.17 18.68 Initial Cost, Materials 15 $361.67 226.95 Initial Cost of Materials per child 15 $14.98 12.03 Yearly Cost, Materials 15 $393.33 277.02 Yearly Cost of Materials per child 15 $14.79 11.37 Business Plan Assistance 15 $271.67 90.77