The Cost of IT at the University of Alberta 2008-2014 Rob Lake Information Technology Planning and...
60
The Cost of IT at the University of Alberta 2008-2014 Rob Lake Information Technology Planning and Forecasting Officer Office of the Vice-Provost (Information Technology) University of Alberta [email protected]
-
Upload
noemi-howman -
Category
Documents
-
view
214 -
download
1
Transcript of The Cost of IT at the University of Alberta 2008-2014 Rob Lake Information Technology Planning and...

The Cost of IT at the University of Alberta2008-2014
Rob Lake
Information Technology Planning and Forecasting OfficerOffice of the Vice-Provost (Information Technology)
University of Alberta

The Question:
What percentage of the University’s
operating budget is annually spent on IT?

The Answer:
?

Basic Principles:
• Obtain data from authoritative sources (must be defendable)
• Apply a consistent methodology for each year
• When in doubt, make your best educated guess

Start with the University’s Operating Budget:
• 2008-2009 Budget Submission
• 2009-2010 Budget Submission
• 2010-2011 Budget Submission
• 2011-2012 Comprehensive Institutional Plan
• 2012-2013 Comprehensive Institutional Plan
• 2013-2014 Comprehensive Institutional Plan

The Operating Budget:
• Funding sources are primarily student and taxpayer dollars
• The budget that is most accountable to the public


University of Alberta Approved Operating Budget

University of Alberta Approved Operating Budget
Year 2008-2009 2009-2010 2010-2011 2011-2012 2012-2013 2013-2014
Amount $764,462,000 $824,175,000 $898,867,039 $935,031,297 $987,277,000 $1,006,351,000
%Increase - 7.8% 9.1% 4.0% 5.6% 1.9%

Several units have mandates that are 100% Information or Digital Technology-related:
• Office of the Vice-Provost (Information Technology) – office of our Chief Information Officer
• Information Services and Technologies (IST) – provides IT services to the entire campus
• Information Services and Technologies – Enterprise Applications (IST-EA) – manages the contracts for our outsourced PeopleSoft ERP systems
• Centre for Teaching and Learning (E-Learning Component) – manages the content and appearance of the University’s Learning Management System
• Technology Training Centre (TTC) – provides IT training to all faculty and staff
• University Digital Strategies (UDS) – responsible for the web and mobile presence
• All budgets from these units are automatically included in the cost of IT calculation
What are the equivalent units within your institution?

The Three “P”ressure Points:
• People
• Purchases
• Power
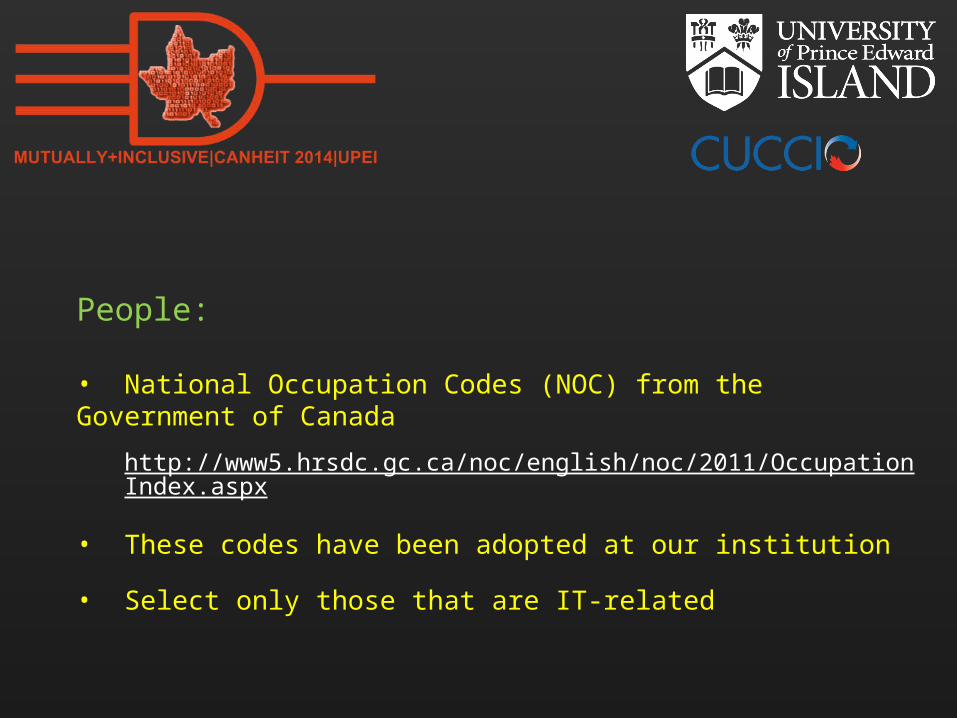
People:
• National Occupation Codes (NOC) from the Government of Canada
http://www5.hrsdc.gc.ca/noc/english/noc/2011/OccupationIndex.aspx
• These codes have been adopted at our institution
• Select only those that are IT-related

0 – Management Occupations
0213 – Computer and Information Systems Managers

217 – Computer and Information Systems Professionals
2171 – Information Systems Analysts and Consultants
2172 – Database Analysts and Data Administrators
2173 – Software Engineers and Designers
2174 – Computer Programmers and Interactive Media Developers
2175 – Web Designers and Developers

228 – Technical Occupations in Computer and Information Systems
2281 – Computer Network Technicians
2282 – User Support Technicians
2283 – Information Systems Testing Technicians

• The following NOC code was used for e-learning personnel:
4131 – College and Other Vocational Instructors

• The following obsolete NOC codes were used (if present):
1421 – Computer Operators (now in 2281)
2162 – Computer Systems Analysts (now in 2171)
2163 – Computer Programmers (now in 2174)

• The following NOC code was not used:
5225 – Audio and Video Recording Technicians
(The above NOC code is currently used for all electronic technicians)

• Human Resources helped generate staff lists
• Used PeopleSoft Financials 9.1 nVision reports
• Benefits: 20% (Academic Staff), 23% (Support Staff)
• Took a snapshot for each fiscal year end
• Does not include teaching faculty from units such as Computer Science
• Don’t double count staff from the IT-inclusive units
Need to be careful how this data is presented!

Academic and Support Staff Salaries and Benefits(Faculties and Departments)

Academic and Support Staff Salaries and Benefits(Administrative Units)

Academic and Support Staff Salaries and Benefits(Across All Units)

Academic Units versus Administrative UnitsStaff Salaries and Benefits

Academic Units versus Administrative UnitsStaff Salaries and Benefits
Total: $42,747,301.05
Total: $49,283,527.99
Total: $46,596,279.45
Total: $53,725,842.63 Total: $50,149,348.64
Total: $48,350,677.05

Academic and Support Staff Salaries and Benefitsas a Percentage of the Operating Budget
(Across All Units)
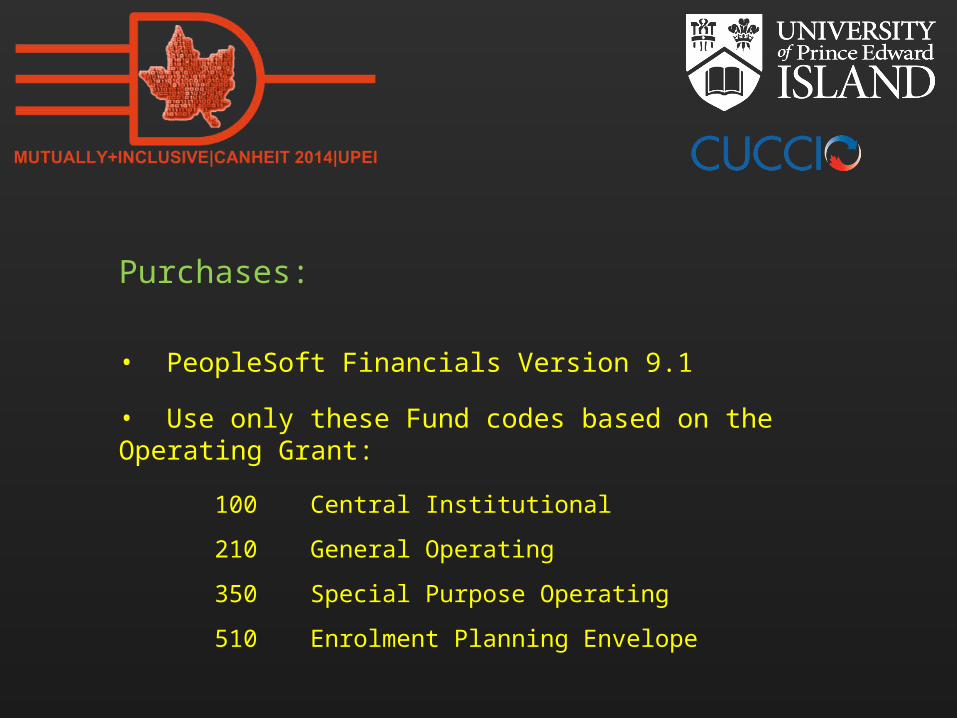
Purchases:
• PeopleSoft Financials Version 9.1
• Use only these Fund codes based on the Operating Grant:
100 Central Institutional
210 General Operating
350 Special Purpose Operating
510 Enrolment Planning Envelope

• Within each Fund code, examine only the following account codes from Accounts Payable:
502155 Electronic Supplies & Services
502197 Computing Site Licenses
502301 Computing Supplies
502306 Computing Support & Services
502311 Computing Mtce Agreements
502317 PDA Reimbursement

502321 Printing Supplies
502324 Printg,Reprints,Dup & Photocopy
502342 Computer Software <$5000
502343 Computer Hardware <$5000
502345 Network Connections
502346 Network Installations

504005 Rentals & Leases – Computer Equipment
504007 Rentals & Leases – Computer Software
504009 Rentals & Leases – Photocopy Equipment
504015 PBX Maintenance

507021 Equipment – Software
507023 Equipment – Software AIS/AICT
507025 Equipment – Computers
507531 LAN Wiring/Cabling (discontinued after 2008-2009)

• The following account codes were not used:
507017 Equipment – CFI Software
507022 In-Kind – Software
507026 In-Kind – Computers
507208 Books – ElectroncFormat (Learning Services Only)
507217 Serials – ElectroncFormat (Learning Services Only)

• IST-EA helped generate reports for all purchases with the above account codes from all academic and administrative units
• Used PeopleSoft nVision reports for the IT-inclusive units
• Don’t double count purchases from the IT-inclusive units

IT-Related Purchases by All Units

Total: $47,998,479.04
Total: $55,319,888.36
Total: $46,567,000.22
Total: $52,708,996.50 Total: $49,102,919.40
Total: $50,990,356.67
IT-Related Purchases by All Units

IT-Related Purchases as a Percentage of the Operating Budget
(Across All Units)

Power:
• The least well-defined pressure point
• A number of assumptions:
1-1 ratio of workstations to University staff
1-1 ratio of workstations to Graduate Students
Best guess of the server room power requirements other than our main server room
• Very conservative workstation usage:
52 weeks/year x 5 days/week x 8 hours per day
• Very conservative server usage:
24 hours/day x 360 days (allowed 5 days per year for maintenance)

• Other assumptions:
GSB server room power consumption is 35% of the total power consumption of GSB
Power usage of ESQ server room is 25% of GSB server room
Power usage of ECHA and CCIS server rooms is 15% of GSB
All other server closets (50+) are 50% of GSB
1,500 machines in research or other computer labs outside of IST and Computing Science
• Power consumption computations do not include printers, copiers, fax machines, and plugged in mobile devices

• Power costs:
Costs to operate workstations per year
Costs to operate the servers and server rooms per year
Costs to cool computers and LCDs per year
Costs to cool the servers and server rooms per year
Annual operations / maintenance costs for HVAC, etc.
• Majority of power costs involve operating and cooling servers and server rooms

Power Expenditure

Power Expenditure(As a Percentage of the Operating Budget)

Putting it all together...

The Cost of IT(In Dollars)

People Purchases Power Total2008-2009 $42,747,301.05 $47,998,479.04 $2,012,775.45 $92,758,555.55
2009-2010 $46,596,279.45 $46,567,000.22 $2,086,742.64 $95,250,022.31
2010-2011 $48,350,677.05 $50,990,356.67 $2,109,366.30 $101,450,400.03
2011-2012 $49,283,527.99 $55,319,888.36 $2,357,474.84 $106,960,891.19
2012-2013 $53,725,842.63 $52,708,996.50 $2,450,884.18 $108,885,723.31
2013-2014 $50,149,348.64 $49,102,919.40 $2,763,174.48 $102,015,442.52
The Cost of IT(In Dollars)

Total: $92,758,555.55
Total: $106,960,891.19
Total: $95,250,022.31
Total: $108,885,723.31 Total: $102,015,442.52
Total: $101,450,400.03
The Cost of IT

The Cost of IT(As a Percentage of the Operating Budget)

People Purchases Power Total2008-2009 5.59% 6.28% 0.26% 12.13%
2009-2010 5.65% 5.65% 0.25% 11.56%
2010-2011 5.38% 5.67% 0.23% 11.28%
2011-2012 5.27% 5.92% 0.25% 11.44%
2012-2013 5.44% 5.34% 0.25% 11.03%
2013-2014 4.98% 4.88% 0.27% 10.13%
The Cost of IT(As a Percentage of the Operating Budget)

2008-2009 2009-2010 2010-2011 2011-2012 2012-2013 2013-2014
Staff (FTE) 9105.3 9416.0 9416.6 9636.5 9793.8 9525.0
Staff (Head) 10793.0 11251.0 11138.0 11301.0 11567.0 11302.0
Students (FLE) 32238.3 32445.6 33114.6 34,222.1 35330.0 36099.4
Students (All) 36,843.0 36783.0 37422.0 37886 38569.0 38355.0
Operating Budget $764,462,000.00 $824,175,000.00 $898,867,039.00 $935,031,297.00 $987,277,000.00 $1,006,351,000.00
Cost of IT $92,758,555.55 $95,250,022.31 $101,450,400.03 $106,960,891.19 $108,885,723.31 $102,015,442.52
Overall Cost (FTE+FLE) $18,490.46 $19,688.09 $21,134.30 $21,319.22 $21,879.30 $22,057.30
Overall Cost (Head+All) $16,047.99 $17,158.16 $18,510.44 $19,009.72 $19,691.98 $20,266.05
IT Cost (FTE+FLE) $2,243.60 $2,275.36 $2,385.32 $2,438.77 $2,413.04 $2,235.98
IT Cost (Head+All) $1,947.24 $1,982.97 $2,089.18 $2,174.58 $2,171.81 $2,054.40
The Cost of IT(For Academic Staff, Support Staff and Students)

Questions(from me to me)

Despite consolidation of IT services for the past three years, IT costs are rising. Why?
• Creation of new academic and support staff IT-related positions
• Cost of living and merit increments
• Opening of CCIS and ECHA (two large buildings on campus)
• Addition of approximately 200 “smart classrooms”
• The “Acquire-Merge-Rationalize-Optimize” process currently underway with IST (i.e. IT consolidation)

Is the University spending too much on Administrative IT? Some factors to consider….
• Student, Human Resource, Financial and Donor Records
• Campus-wide Learning Management System
• Campus-wide wireless and external network connection
• Consolidated software licenses and firewalls (in progress)
• Centrally-supported “smart classrooms” and computer labs
• Addition of academic IT units to IST
• Library, digital, mobile and other campus-wide services
How many Academic IT costs are for duplicated services?

How do we compare to other large Canadian orAmerican publicly funded post-secondary institutions?
• It is difficult to say….
• Need to compare apples to apples
• Need to compare apples to the right brand of apples
• What is “in” and what is not?
• Progress is being made to answer this question….

CUCCIO Benchmarking Working Group
• Established in 2014
• Membership: Lori MacMullen (CUCCIO – Ex Officio) Rob Lake (University of Alberta) Jim Lesslie (Queen’s University) Jacqueline Oliver (University of Ottawa) Kent Percival (University of Guelph) Vivian Wong (Ryerson University)
• Main focus of the BMWG to date has been to review data definitions and to “clean up” previous data

Complexity Index
• Developed by CAUDIT to enable meaningful comparisons between Universities of differing sizes
• An institution’s Complexity Index (CI) is calculated using the following four weighted parameters:
Number of FLE students (35%) Number of FTE staff (35%) Research revenue (25%) Number and size of each institution’s campuses (5%)
• Enables Universities of similar CIs to undertake deeper benchmarking

Complexity Index
• Complexity Index for the University of Alberta:
2010 – 6.5 2011 – 6.5 2012 – 6.2
• Three major groupings have been proposed: Less than 2.1 “Small” 2.2 – 4.9 “Medium” 5.0 and above “ Large”

2012 Complexity Index for Canadian U15 Institutions

CUCCIO Benchmarking Data for the University of Alberta
2008-2009 2009-2010 2010-2011 2011-2012 2012-2013 2013-2014
Total IT Staff Costs $42,747,301.05 $46,596,279.45 $48,350,677.05 $49,283,527.99 $53,725,842.63 $50,149,348.64
Central IT Staff Costs $18,149,580.00 $19,204,348.00 $19,882,343.00 $21,072,238.00 $23,997,703.00 $24,871.888.00
Degree of Centralization 42.46% 41.21% 41.12% 42.76% 44.67% 49.60%
Total IT Purchases $47,998,479.04 $46,567,000.22 $50,990,356.67 $55,319,888.36 $52,708,996.50 $49,102,919.40
Central IT Purchases $31,366.551.00 $31,645,552.00 $35,850,407.00 $39,625,612.00 $36,754,023.00 $36,290,687.00
Degree of Centralization 65.35% 67.96% 70.31% 71.63% 69.73% 73.91%
Total IT Spend $90,745,780.09 $93,163,279.67 $99,341,033.72 $101,603,416.35 $106,434,839.13 $99,252,268.04
Central IT Spend $49,516,131.00 $50,849,900.00 $55,732,750.00 $60,697,850.00 $60,751,726.00 $61,162,575.00
Degree of Centralization 54.57% 54.58% 56.10% 58.03% 57.08% 61.62%

2008-2009 2009-2010 2010-2011 2011-2012 2012-2013 2013-2014
Total IT FTE 497 503 482 479 497 505
Central IT FTE 206 198 189 185 198 260
Degree of Centralization 41.45% 39.36% 39.21% 38.62% 39.84% 51.49%
IT Staff / Total FTE 5.5% 5.3% 5.1% 5.0% 5.1% 5.3%
IT Staff Salary + Benefit $86,010.67 $92,636.74 $100,312.61 $102,888.37 $108,100.29 $99,305.64
Student Workstations 8,583 9,145 9,792 10,009 9,986 10,097
Staff Workstations 9,105 9,416 9,417 9,637 9,794 9,525
CUCCIO Benchmarking Data for the University of Alberta

In summary:
• A “simple” methodology to compute the cost of IT for a major post-secondary institution based on institutional data
• “Easy” to update on a year-to-year basis
• IT costs continue to rise, but at a lower rate than the operating budget
• Does not include depreciation costs
• You will never be able to compute the exact cost; however, this provides a very good (lower) estimate

Thanks to:
• Ceinwen Arndt (IST-EA)
• Will Cheng (IST-EA)
• Kym Banks (Human Resource Services)
• Debbie McDonald (Human Resource Services)
• Donna Nordstrom (Human Resource Services)
• Mike Versteege (Energy Management)
• Laura Stewart (Strategic Analysis)
• Dale Olausen (Strategic Analysis)
• Ian Bernard (Resource Planning)
• Keith McKinnon (IST)
• Edith Finczak (Office of the Provost)
• Rod Johnson (Computing Science)

Questions(from you to me)