The correlation between extracellular resistance by electrical
13
RESEARCH Open Access The correlation between extracellular resistance by electrical biopsy and the ratio of optical low staining area in irradiated intestinal tissues of rats Yu-Jie Huang 1,2 , Eng-Yen Huang 2 and Kuo-Sheng Cheng 1,3* * Correspondence: [email protected] 1 Department of Biomedical Engineering, National Cheng Kung University, Tainan, Taiwan 3 Medical Device Innovation Center, National Cheng Kung University, Tainan, Taiwan Full list of author information is available at the end of the article Abstract Background: Electrical biopsy illustrates a tissue’s electrical properties by electrical impedance spectroscopy. However, electrical biopsy parameters are different from conventional morphological-based examinations. The correlation between electrical biopsy and the morphological observation has not been checked. Considering the tissue responses to injury, extracellular resistance should be most sensitive with the accumulation of fluid in tissue, and it is expected to increase the ratio of optical low staining area on histological images. In this study, we calculated the ratio of optical low staining area of sampled histological images and compared with the results of electrical biopsy to verify the hypothesis of that the extracellular resistance of electrical biopsy most highly correlates with the ratio of optical low staining area on histological images. Methods: The irradiated intestinal tissues of rats after different latent period were used for study. The sampled tissues were measured by electrical impedance spectroscopy for electrical biopsy and the microscopic images were acquired. The sampled histological images were transformed into the Hue-Saturation-Density (HSD) colour model to decouple the stain density. The ratio of optical low staining area on histological images was computed to quantify the morphological changes. The results were related to the parameters from electrical biopsy according to three element circuit model by Spearman’s rank correlation test. Results: The ratio of optical low staining area varied as well as the tissue’s electrical parameters. The extracellular resistance (R e ) and intracellular resistance (R i ) by electrical biopsy tended to increase with the ratio of low staining area decreasing. The membrane capacitance (C m ) by electrical biopsy tended to increase with the ratio of optical low staining area increasing. The extracellular resistance (R e ) of electrical biopsy was the parameter most highly correlated with the ratio of optical low staining area with a correlation coefficient of -0.757 (p < 0.001). Conclusions: The results of this report confirm the hypothesis and support the idea that electrical biopsy results reflect the changes in tissues seen in conventional histological findings in a sense of conventional histological knowledge, and this approach may have a great potential for augmenting the pathological diagnosis of tissues. Keywords: Electrical impedance spectroscopy, Electrical biopsy, Radiation enteropathy, Hue-saturation-density (HSD) transformation, Ratio of low staining area, Extracellular resistance © 2013 Huang et al.; licensee BioMed Central Ltd. This is an Open Access article distributed under the terms of the Creative Commons Attribution License (http://creativecommons.org/licenses/by/2.0), which permits unrestricted use, distribution, and reproduction in any medium, provided the original work is properly cited. Huang et al. BioMedical Engineering OnLine 2013, 12:23 http://www.biomedical-engineering-online.com/content/12/1/23
Transcript of The correlation between extracellular resistance by electrical

Huang et al. BioMedical Engineering OnLine 2013, 12:23http://www.biomedical-engineering-online.com/content/12/1/23
RESEARCH Open Access
The correlation between extracellular resistanceby electrical biopsy and the ratio of optical lowstaining area in irradiated intestinal tissues of ratsYu-Jie Huang1,2, Eng-Yen Huang2 and Kuo-Sheng Cheng1,3*
* Correspondence:[email protected] of BiomedicalEngineering, National Cheng KungUniversity, Tainan, Taiwan3Medical Device Innovation Center,National Cheng Kung University,Tainan, TaiwanFull list of author information isavailable at the end of the article
Abstract
Background: Electrical biopsy illustrates a tissue’s electrical properties by electricalimpedance spectroscopy. However, electrical biopsy parameters are different fromconventional morphological-based examinations. The correlation between electricalbiopsy and the morphological observation has not been checked. Considering thetissue responses to injury, extracellular resistance should be most sensitive with theaccumulation of fluid in tissue, and it is expected to increase the ratio of optical lowstaining area on histological images. In this study, we calculated the ratio of opticallow staining area of sampled histological images and compared with the results ofelectrical biopsy to verify the hypothesis of that the extracellular resistance ofelectrical biopsy most highly correlates with the ratio of optical low staining area onhistological images.
Methods: The irradiated intestinal tissues of rats after different latent period wereused for study. The sampled tissues were measured by electrical impedancespectroscopy for electrical biopsy and the microscopic images were acquired. Thesampled histological images were transformed into the Hue-Saturation-Density (HSD)colour model to decouple the stain density. The ratio of optical low staining area onhistological images was computed to quantify the morphological changes. Theresults were related to the parameters from electrical biopsy according to threeelement circuit model by Spearman’s rank correlation test.
Results: The ratio of optical low staining area varied as well as the tissue’s electricalparameters. The extracellular resistance (Re) and intracellular resistance (Ri) byelectrical biopsy tended to increase with the ratio of low staining area decreasing.The membrane capacitance (Cm) by electrical biopsy tended to increase with theratio of optical low staining area increasing. The extracellular resistance (Re) ofelectrical biopsy was the parameter most highly correlated with the ratio of opticallow staining area with a correlation coefficient of −0.757 (p < 0.001).
Conclusions: The results of this report confirm the hypothesis and support the ideathat electrical biopsy results reflect the changes in tissues seen in conventionalhistological findings in a sense of conventional histological knowledge, and thisapproach may have a great potential for augmenting the pathological diagnosis oftissues.
Keywords: Electrical impedance spectroscopy, Electrical biopsy, Radiationenteropathy, Hue-saturation-density (HSD) transformation, Ratio of low staining area,Extracellular resistance
© 2013 Huang et al.; licensee BioMed Central Ltd. This is an Open Access article distributed under the terms of the CreativeCommons Attribution License (http://creativecommons.org/licenses/by/2.0), which permits unrestricted use, distribution, andreproduction in any medium, provided the original work is properly cited.

Huang et al. BioMedical Engineering OnLine 2013, 12:23 Page 2 of 13http://www.biomedical-engineering-online.com/content/12/1/23
BackgroundElectrical impedance is one of the most often used parameters for characterizing mater-
ial properties. The electrical impedance of a tissue is highly correlated with biological
structure, including cell size, density, spacing, and the constituents of the extracellular
and intracellular matrix [1]. Electrical impedance spectroscopy, revealing the variations
in electrical impedance with changes infrequency, is good for obtaining both the resist-
ive and capacitive characteristics of tissues. Schwan described the electrical properties
of tissues and cell suspensions and concluded that electrical impedance analysis is a
powerful research tool for biological applications [2]. Electrical impedance is a good
marker for characterizing a tissue’s pathological changes, such as ischemia and neo-
plasms, both in human and animal subjects [3-12]. Electrical impedance spectroscopy
of tissues has great potential for use in pathological analysis as an alternative or adjunct
to the conventional morphological and histological examinations. This analysis is re-
ferred to as an “electrical biopsy”.
The most well-known model for representing a tissue’s electrical characteristics is the
three-element model depicted in Figure 1. It is a simple and easy model to understand
from a biological aspect. This model was reported to be a good representation of the
electrical properties of biological materials due to relaxation phenomena throughout
the frequency range [2]. The simplified equivalent three-element model was applied for
the interpretation of the electrical properties of biological tissues, with Re (extracellular
resistance), Ri (intracellular resistance), and Cm (membrane capacitance). Re is contrib-
uted by the extracellular matrix (which is made up of mostly water), Ri by intracellular
complex substances of the cytoplasm, and Cm by changes in cell membranes.
Considering the tissue’s responses to injury, edema is the most general histological re-
action to injury. It is characterized fluid accumulation in tissues and presented as clear-
ing and separation of the extracellular matrix [13]. It is supposed to be observed as
increased areas of low staining and separation in the microscopic images of tissue.
Based on this rationale, the ratio of optical low staining area of tissues on histological
images could be used to quantify the tissue fluid status morphologically. Comparing
the parameters of electrical biopsy to the ratio of optical low staining area in tissues,
Figure 1 The simplified equivalent three-element electrical circuit model for tissues. The simplifiedequivalent three-element model to interpret the electrical properties of biological tissues, with Re (extracellularresistance), Ri (intracellular resistance), and Cm (membrane capacitance).

Huang et al. BioMedical Engineering OnLine 2013, 12:23 Page 3 of 13http://www.biomedical-engineering-online.com/content/12/1/23
extracellular and intracellular resistance should be most sensitive with the accumula-
tion of fluid in tissue, and the fluid in tissue is expected to increase the ratio of optical
low staining area on histological images. However, intracellular cytoplasm is denser
than extracellular space. The optical low staining area should mostly be contributed by
extracellular space and its water content. Therefore, the Re of electrical biopsy should
most highly correlate with the ratio of optical low staining area on histological images
by this rationale.
In this study, we established the algorithm to calculate the ratio of optical low stain-
ing area of sampled histological images from irradiated intestinal tissue in rats and
compared with the results of electrical biopsy. The purpose is to verify the hypothesis
of that the extracellular resistance of electrical biopsy most highly correlates with the
ratio of optical low staining area on histological images.
MethodsAnimal care and irradiated intestinal tissues
The radiation enteropathy of the rats was designed for this study. The specific
pathogen-free Sprague–Dawley rats (males, weighing 300–350 g) were used in the ex-
periments. There were four rats in each group. The control group was treated the same
as the experimental group, except for the whole abdomen irradiation. An 18-Gy dose
to the whole abdomen was applied, and the experimental groups were sacrificed at 3, 9,
14, 21, 28, 35, and 49 days after irradiation (annotated as D3, D9, D14, D21, D28, D35,
and D49, respectively) for electrical biopsy and histological examinations of the intes-
tinal tissues. All procedures and measurements were performed in strict accordance
with protocols approved by the Chang Gung Memorial Hospital Animal Care and Use
Committee.
The electrical biopsy
The electrical impedance spectroscopy system for electrical biopsy is designed around the
electrical impedance converter chip (AD5933) acquired from Analog Devices (Norwood,
MA, USA) and controlled by personal computer [14]. The system is showed on
Figure 2. The system provided a frequency sweep mode for scanning electrical imped-
ance values over a frequency band from 10 kHz to 100 kHz with 1 kHz steps. After the
Figure 2 The electrical impedance spectroscopy system for electrical biopsy. The system is designedaround an electrical impedance converter chip. The electrical impedance is measured with the tissues onelectrodes. The data is transfer to personal computer to save and solve the electrical properties of tissues.

Huang et al. BioMedical Engineering OnLine 2013, 12:23 Page 4 of 13http://www.biomedical-engineering-online.com/content/12/1/23
rat was sacrificed, a 5-cm length of distal jejunum, traced from the cecum was sam-
pled. The tissue was dissected to expand a 5 × 5 mm sample. The specimen was placed
on the electrodes with the mucosal surface down. The electrode were designed based
on the two-electrode measurement method and were fabricated on a printed circuit
board with two parallel plates of copper. The size of the electrode was the same as a
glass slide for convenient tissue specimen study. The gap between the two electrode
plates was 0.2 mm, with a saw line. The length of saw line is longer than a straight line.
Therefore, the area of the saw line gap between electrodes is more effective for meas-
urement. A cover glass was used to cover the specimen with a weight load of 20 g. The
electrical impedance spectroscopy by the system was measured for electrical biopsy.
The electrical parameters of Re, Ri, and Cm were solved by ZSimpWin Version 3.1
(Princeton Applied Research, Oak Ridge, TN, USA) according to the impedance spec-
troscopy data. The impedance data from three-element RC model simulation with dif-
ferent scanning frequency range had been inputted to ZSimpWin to validate its ability
and the adequacy of scanning frequency range. The results certify an excellent capabil-
ity of ZSimpWin to solve the circuit model as Figure 1 with scanning frequency from
10 kHz to 100 kHz. The measured sample was then prepared for histological
examination.
Histological examination and image sampling
After electrical biopsy, the specimens underwent histological examination using
Masson’s trichrome stain. The histological images were acquired in digital form for
later analysis using a transmitted light microscope at 100x magnification. For each spe-
cimen, four areas of interest (AOI) were selected for computing the optical low staining
area. The AOI was defined as a maximum rectangle in mucosa and submucosa area,
including lamina propria, and excluding air space of the villi within the histological im-
ages as illustrated in Figure 3.
Computing the ratio of low staining area on histological images
The Hue-Saturation-Density (HSD) colour model was applied for staining area
extraction of the images [15]. The monochromatic light travelling through an
Figure 3 The selected area of interest (AOI) and HSD transformation. Diagram of the selected area ofinterest (AOI) and HSD transformation for computing the optical stain density (OSD).

Huang et al. BioMedical Engineering OnLine 2013, 12:23 Page 5 of 13http://www.biomedical-engineering-online.com/content/12/1/23
absorbing medium is in accordance with Lambert-Beers’ law of absorption [16].
Thus, the relationship between the intensity of monochromatic light transmitted
through a specimen and the amount of stain present in the specimen may be repre-
sented as:
I λð Þ ¼ I0 λð Þ e�Ac λð Þ ð1Þ
Where I0(λ) is the intensity of light of wavelength λ passing through the specimen,
and I(λ) is the intensity of the light transmitted through the specimen. A is the quantity
of stain per unit area of the specimen, and c(λ) is the function for the fraction of the in-
cident light of wavelength λ transmitting through the stain.
The colour images acquired from the optical microscope are represented in pixels
with colours in red, green, and blue (RGB). The sensitivity curve of the camera used
for image acquisition is defined as the relationship between the incident light and the
electric output signal. The output intensity of the camera for channel ch is repre-
sented by
Ich ¼Z 1
0Sch λð Þ I0 λð Þ e�Ac λð Þdλ ð2Þ
where Sch(λ) is the sensitivity of channel ch at wavelength λ. The filters used in the
microscope camera were assumed to be narrow band-pass filters in which the sensi-
tivity was restricted to the central frequency (=λch, where ch is R, G, or B); therefore,
we have
Sch λð Þ ¼ 1 if λ ¼ λch0 if λ≠λch
� �ð3Þ
Equation 2 can be simplified using equation 3 as
Ich ¼ I0;ch e�Acch ð4Þ
where I0,ch is the intensity of channel ch when no stain is present and cch is the absorp-
tion coefficient for λ = λch.
Therefore, the optical density (OD) of a channel Dch depending linearly on the
amount of stain could be defined as the absorption value of the staining at channel ch.
It can be computed as
Dch ¼ � lnIchI0;ch
� �¼ Acch ð5Þ
An overall measure for the OD can be further obtained from the following equation
as
D ¼ DR þ DG þ DB
3¼ A cR þ cG þ cBð Þ
3ð6Þ
The overall OD is proportional to the staining per unit area of the specimen (A).
Therefore, the optical stain density (OSD) of the sampled image (as shown in Figure 3)
can be decoupled.

Huang et al. BioMedical Engineering OnLine 2013, 12:23 Page 6 of 13http://www.biomedical-engineering-online.com/content/12/1/23
Then we define the low staining area is the area of lower 10% OSD on images. The
ratio of low staining area is illustrated as
Ratio of optical low staining area ¼ Area of lower 10% OSD on sampled imageTotal sampler image area
ð7Þ
The value of the ratio of low staining area on sampled image for the tissue specimens
could then be computed. The ratios of low staging area of four sampled AOI on each
histological image were averaged for the result.
Statistics
The Spearman’s rank correlation coefficient was applied to test the correlations be-
tween the results of electrical biopsy and the ratio of low staining area on sampled im-
ages. A p-value <0.05 was taken as statistically significant.
ResultsThe results of electrical biopsy
The results of electrical biopsy based on the parameters of the three-element RC elec-
trical circuit model for each experimental group, as illustrated in Figures 4, 5, 6. The
range of Re was between 398 Ohms and 1375 Ohms with minimum in D9 group and
maximum in D49 group. The range of Ri was between 529 Ohms and 1086 Ohms with
minimum in D14 group and maximum in D49 group. The range of Cm was between
2.93*10-9 Farads and 7.26*10-9 Farads with minimum in D49 group and maximum in
D14 group.
The results for the ratio of low staining area
The range was from 0.00264 to 0.49621 for the ratio of optical low staining area. The
maximum was in D49 group and the minimum was in D9 group. Figure 7 shows the
line plot with standard deviation bars for the experimental groups.
Figure 4 The results of extracellular resistance in electrical biopsy according to experiment groups.The mean value with bar of the standard deviation (SD) for extracellular resistance (Re) according toexperiment groups.

Figure 5 The results of intracellular resistance in electrical biopsy according to experiment groups.The mean value with bar of the SD for intracellular resistance (Ri) according to experiment groups.
Huang et al. BioMedical Engineering OnLine 2013, 12:23 Page 7 of 13http://www.biomedical-engineering-online.com/content/12/1/23
The correlation between the ratio of optical low staining area and the parameters of
electrical biopsy
Scatter plots with linear regression for the electrical parameter values of the elec-
trical biopsy versus the ratio of optical low staining areas are illustrated in
Figures 8, 9, 10. The extracellular resistance (Re) and intracellular resistance (Ri)
tended to increase with the ratio of low staining area decreasing. The membrane
capacitance (Cm) tended to increase with the ratio of optical low staining area
increasing.
Table 1 shows the Spearman’s rank correlation coefficient between the electrical pa-
rameters obtained from the three-element model by electrical biopsy and the ratio of
optical low staining area in the tissues. The most highly correlated parameter of elec-
trical biopsy to the ratio of optical low staining area was extracellular resistance (Re),
with a correlation coefficient of −0.757 (p < 0.001).
Figure 6 The results of membrane capacitance in electrical biopsy according to experiment groups.The mean value with bar of the SD for membrane capacitance (Cm) according to experiment groups.

Figure 7 The results for the ratio of optical low staining area according to experiment groups. Themean value for the ratio of optical low staining area according to experimental groups, and the error barindicating the standard deviation (SD).
Huang et al. BioMedical Engineering OnLine 2013, 12:23 Page 8 of 13http://www.biomedical-engineering-online.com/content/12/1/23
DiscussionThe histological changes in the gastrointestinal epithelium after ionizing radiation are di-
vided into two stages, an early stage and late stage [17]. Early radiation enteropathy is the
damage of the intestinal mucosa and the first morphologic change after irradiation in this
stage is serosa thickening. This is because of the extracellular fluid accumulation by tissue
injury. Subsequently, late radiation enteropathy occurs after a variable latency. The mani-
festations of late radiation enteropathy are considered to be vascular and connective tissue
damage. These phenomena in late phase frequently occur in the intestinal wall, instead of
the mucosa, with vascular sclerosis and intestinal wall fibrosis [18]. The occurrence of vas-
cular sclerosis and intestinal fibrosis is likely to decrease extracellular fluid.
According to the tissue’s electrical parameters with the three-element RC equivalent
electrical model in Figure 1, Re is extracellular resistance that should imply the status
of the extracellular fluid. For the fluid in biological tissue is conductive, the Re should
decrease with the extracellular fluid increasing. As our results, Re was decreased after
irradiation up to day 9 in early phase for tissue fluid accumulation, and increased in
day 49 for fibrosis in late phase rationally (Figure 4). The other two electrical parame-
ters of electrical biopsy, Ri and Cm, demonstrated the similar response to tissue injury
for their representation of changes in tissues (Figures 5 and 6). Therefore, electrical bi-
opsy may be a quantified method to evaluate the tissue’s status.
Conventional histological examinations involve morphological examination under a
light microscope. These rely on the human eye and depend on the experience of the
observer. Although some criteria or descriptions are used to evaluate the histological
morphology, they are subjective and not quantitative. The judgment of the tissue status
by morphological examination varies individually. It is the same in evaluation of the
fluid status in tissues. Edema denotes an excess of fluid in the interstitial or serous cav-
ities and is characterized as clearing and separation of the extracellular matrix in text-
books [13]. The assessment of the fluid status of tissue, i.e. edema, is descriptive in
conventional way.
For quantifying the fluid status of tissue on histology images, the descriptions for
evaluate the tissue’s fluid status should be defined quantitatively. This clearing of
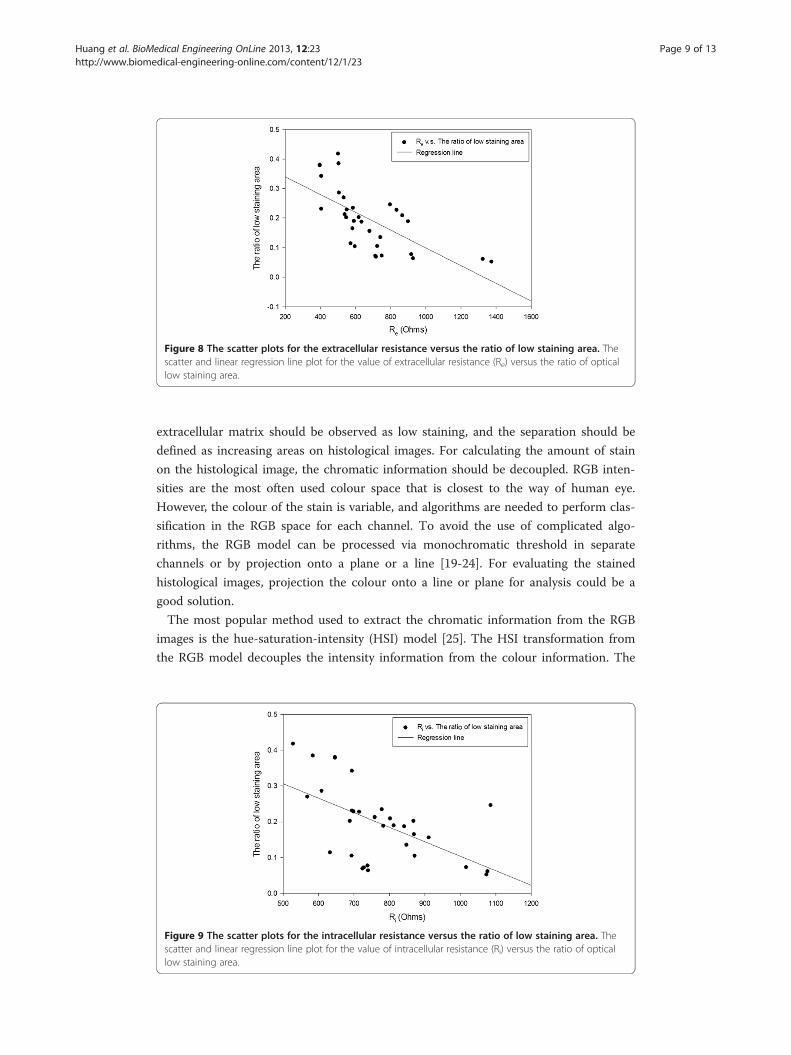
Figure 8 The scatter plots for the extracellular resistance versus the ratio of low staining area. Thescatter and linear regression line plot for the value of extracellular resistance (Re) versus the ratio of opticallow staining area.
Huang et al. BioMedical Engineering OnLine 2013, 12:23 Page 9 of 13http://www.biomedical-engineering-online.com/content/12/1/23
extracellular matrix should be observed as low staining, and the separation should be
defined as increasing areas on histological images. For calculating the amount of stain
on the histological image, the chromatic information should be decoupled. RGB inten-
sities are the most often used colour space that is closest to the way of human eye.
However, the colour of the stain is variable, and algorithms are needed to perform clas-
sification in the RGB space for each channel. To avoid the use of complicated algo-
rithms, the RGB model can be processed via monochromatic threshold in separate
channels or by projection onto a plane or a line [19-24]. For evaluating the stained
histological images, projection the colour onto a line or plane for analysis could be a
good solution.
The most popular method used to extract the chromatic information from the RGB
images is the hue-saturation-intensity (HSI) model [25]. The HSI transformation from
the RGB model decouples the intensity information from the colour information. The
Figure 9 The scatter plots for the intracellular resistance versus the ratio of low staining area. Thescatter and linear regression line plot for the value of intracellular resistance (Ri) versus the ratio of opticallow staining area.

Figure 10 The scatter plots for the membrane capacitance versus the ratio of low staining area.The scatter and linear regression line plot for the value of membrane capacitance (Cm) versus the ratio ofoptical low staining area.
Huang et al. BioMedical Engineering OnLine 2013, 12:23 Page 10 of 13http://www.biomedical-engineering-online.com/content/12/1/23
intensities are independent with a linear relation to channel intensity. However,
according to equation 1, the optical intensities show a logarithmic relationship (as op-
posed to linear) with the amount of staining. Therefore, the HSD model is adapted
from the HSI model with optical densities converted from intensities. The optical dens-
ities are linear relative to the amount of staining (as in equation 5), which is linear to
the amount of stain. The optical density of the HSD model is independent of the chro-
matic component and, therefore, offers a good representation of the amount of stain.
Following the accumulation of fluid in tissues, the substances that can be stained are
separated and diluted. Thus, the low staining area in the histological images increases.
We supposed that the low staining is the optical density less than 10%. The proportion
of optical low staining area in the sampled histological image should be a good index
for the fluid status of tissue. The ratio of optical low staining area is hence defined as
in equation 7. In this study, the ratio of optical low staining area was elevated after day
3 and decreased relative to the control after day 21 (Figure 7). This was in accordance
with the morphological description of radiation enteropathy [17].
Comparing the values of the electrical parameters of electrical biopsy and the ratio of
optical low staining area on histological images, both extracellular and intracellular
electrical resistance of the tissues tended to decrease with the ratio of optical low stain-
ing area increasing (Figures 8 and 9). This is reasonable for the increased conductivity
by the fluid accumulation both extracellularly and intracelluarly. The membrane cap-
acitance (Cm) tended to increase with increasing ratio of optical low staining area
(Figure 10). This may be due to the decrease in membrane permeability (resulting in
increasing capacitance) that occurs to prevent cell swelling following extracellular fluid
accumulation.
Most stained substances are located in the cytoplasm; therefore, the ratio of optical
low staining area is primarily a reflection of extracellular status. According to this ra-
tionale for tissue fluid status evaluation in electrical biopsy and optical low staining area
rating, the Re and ratio of optical low staining area should be the most highly correlat-
ing parameters for extracellular fluid status. This hypothesis is tested on Table 1 with a
confirmed result. Because the electrical parameters of the tissue are not only impacted

Table 1 The correlation between electrical parameters and the ratio of optical lowstaining area
Correlations(95% ConfidenceInterval) p-value
The ratio of optical lowstaining area
Re Ri Cm
The ratio of opticallow staining area
1 - - -
Re −0.757 1 - -
(−0.909 to −0.511)
p < 0.001*
Ri −0.572 0.667 1 -
(−0.825 to −0.218) (0.407 to 0.815)
p < 0.001* p < 0.001*
Cm 0.608 −0.680 −0.905 1
(0.325 to 0.821) (−0.799 to −0.494) (−0.936 to −0.764)
p < 0.001* p < 0.001* p < 0.001*
Spearman’s rank correlation coefficient between the electrical parameters from the three-element model by electricalbiopsy and the ratio of optical low staining area in the tissues.*p < 0.05.
Huang et al. BioMedical Engineering OnLine 2013, 12:23 Page 11 of 13http://www.biomedical-engineering-online.com/content/12/1/23
by water content but also by any other tissue characteristics, the correlations were not
particularly high. However, Re was indeed the most correlative parameter relative to the
ratio of optical low staining area based on Spearman’s rank test with a correlation coef-
ficient of −0.757, and a p-value <0.001.
Electrical biopsy is a novel method for augmenting pathological diagnosis and screen-
ing of tissue status. However, the results of the electrical biopsy provide electrical pa-
rameters that are different from those conventional morphological-based histological
examinations. Most of the identification of the histological change is under microscopy
by morphology due to this is the most conventional and experienced way for tissue
examination. The electrical biopsy may be applied to extend the histological examin-
ation for quantifying the tissue’s characteristics in addition to the observed morpho-
logical variations. In this study, we evaluated the ratio of optical low staining area on
histological images to correlate the parameters of the electrical biopsy. It was shown
that the extracellular resistance was the most highly correlated parameter. This implied
that the electrical biopsy indeed reflected changes of the tissue corresponding to con-
ventional morphological findings in a sense of conventional histological knowledge.
Therefore, the electrical biopsy may have a great potential for augmenting the patho-
logical diagnosis of tissues. However, these results is still primitively, further experi-
ments should be designed to check the correlation between the electrical parameters
and other morphological changes observed via conventional histological examination,
in order to facilitate the application of the electrical biopsy.
ConclusionsThe extracellular resistance (Re) estimated using the concept of electrical biopsy was
shown to be most highly correlated the ratio of low staining area on the sampled histo-
logical images because of extracellular fluid accumulation in tissue injury response.
These results illustrate that electrical biopsy corresponds to the morphological changes
in a sense of conventional histological knowledge. Therefore, The electrical biopsy

Huang et al. BioMedical Engineering OnLine 2013, 12:23 Page 12 of 13http://www.biomedical-engineering-online.com/content/12/1/23
reflects the histological changes and has demonstrated great potential for augmenting
the pathological diagnosis of tissues.
Competing interestsThere is no competing interest associated with this study.
Authors’ contributionsThe contributions of the authors are as follows: YJH have made substantial contributions to conception and design,carried out the electrical biopsy, image analysis and interpretation of data, and drafting the manuscript. EYHparticipated in animal experiment and histological image acquisition. KSC was the advisor and coordinator of thisstudy. He also helped to draft and revise the manuscript. All authors read and approved the final manuscript.
AcknowledgementsWe thank the grant from the Chang Gung Memorial Hospital research program (CMRPG870011) and the NationalScience Council, Taiwan (NSC98-2320-B-182A-002-MY2) for the support of this study.
Author details1Department of Biomedical Engineering, National Cheng Kung University, Tainan, Taiwan. 2Department of RadiationOncology, Kaohsiung Chang Gung Memorial Hospital and Chang Gung University College of Medicine, Kaohsiung,Taiwan. 3Medical Device Innovation Center, National Cheng Kung University, Tainan, Taiwan.
Received: 5 December 2012 Accepted: 11 March 2013Published: 19 March 2013
References
1. Riu PJ: Electrical bioimpedance methods: applications to medicine and biotechnology. New York: New York Academyof Sciences; 1999.2. Schwan HP: Electrical properties of tissue and cell suspensions. Adv Biol Med Phys 1957, 5:147–209.3. Wilkinson BA, Smallwood RH, Keshtar A, Lee JA, Hamdy FC: Electrical impedance spectroscopy and the
diagnosis of bladder pathology: a pilot study. J Urol 2002, 168:1563–1567.4. Beetner DG, Kapoor S, Manjunath S, Zhou X, Stoecker WV: Differentiation among basal cell carcinoma, benign
lesions, and normal skin using electric impedance. IEEE Trans Biomed Eng 2003, 50:1020–1025.5. Gonzalez CA, Villanueva C, Othman S, Narvaez R, Sacristan E: Impedance spectroscopy for monitoring ischemic
injury in the intestinal mucosa. Physiol Meas 2003, 24:277–289.6. Gupta D, Lammersfeld CA, Burrows JL, Dahlk SL, Vashi PG, Grutsch JF, Hoffman S, Lis CG: Bioelectrical impedance
phase angle in clinical practice: implications for prognosis in advanced colorectal cancer. Am J Clin Nutr 2004,80:1634–1638.
7. Skourou C, Hoopes PJ, Strawbridge RR, Paulsen KD: Feasibility studies of electrical impedance spectroscopy forearly tumor detection in rats. Physiol Meas 2004, 25:335–346.
8. Abdul S, Brown BH, Milnes P, Tidy JA: A clinical study of the use of impedance spectroscopy in the detectionof cervical intraepithelial neoplasia (CIN). Gynecol Oncol 2005, 99:S64–66.
9. Ahn H, Shin H, Yun S, Kim J, Choi J: Measurement of bioimpedance and cell viability during ischemia-reperfusion in the rat liver. Conf Proc IEEE Eng Med Biol Soc 2005, 2:1945–1947.
10. Stojadinovic A, Nissan A, Gallimidi Z, Lenington S, Logan W, Zuley M, Yeshaya A, Shimonov M, Melloul M, Fields S,et al: Electrical impedance scanning for the early detection of breast cancer in young women: preliminaryresults of a multicenter prospective clinical trial. J Clin Oncol 2005, 23:2703–2715.
11. Abdul S, Brown BH, Milnes P, Tidy JA: The use of electrical impedance spectroscopy in the detection ofcervical intraepithelial neoplasia. Int J Gynecol Cancer 2006, 16:1823–1832.
12. Keshtkar A, Smallwood RH: Electrical impedance spectroscopy and the diagnosis of bladder pathology. PhysiolMeas 2006, 27:585–596.
13. Robbins SL, Kumar V, Abbas AK, Cotran RS, Fausto N: Robbins and Cotran Pathologic Basis of Disease. Philadelphia:Saunders/Elsevier; 2010.
14. Huang YJ, Huang EY, Lu YY, Chen CY, Cheng KS: Electrical biopsy of irradiated intestinal tissue with a simpleelectrical impedance spectroscopy system for radiation enteropathy in rats–a pilot study. Physiol Meas 2011,32:1491–1504.
15. Van Der Laak JA, Pahlplatz MM, Hanselaar AG, de Wilde PC: Hue-saturation-density (HSD) model for stainrecognition in digital images from transmitted light microscopy. Cytometry 2000, 39:275–284.
16. Longhurst RS: Geometrical and physical optics. 3rd edition. London: Longman; 1973.17. Hauer-Jensen M: Late radiation injury of the small intestine. Clinical, pathophysiologic and radiobiologic
aspects. A review. Acta Oncol 1990, 29:401–415.18. Langberg CW, Sauer T, Reitan JB, Hauer-Jensen M: Tolerance of rat small intestine to localized single dose and
fractionated irradiation. Acta Oncol 1992, 31:781–787.19. Rostagno P, Birtwisle I, Ettore F, Courdi A, Gioanni J, Namer M, Caldani C: Immunohistochemical determination
of nuclear antigens by colour image analysis: application for labelling index, estrogen and progesteronereceptor status in breast cancer. Anal Cell Pathol 1994, 7:275–287.
20. Bulten J, van der Laak JA, Gemmink JH, Pahlplatz MM, de Wilde PC, Hanselaar AG: MIB1, a promising marker forthe classification of cervical intraepithelial neoplasia. J Pathol 1996, 178:268–273.
21. Van Der Laak JA, Westphal JR, Schalkwijk LJ, Pahlplatz MM, Ruiter DJ, de Waal RM, de Wilde PC: An improvedprocedure to quantify tumour vascularity using true colour image analysis. Comparison with the manual hot-spot procedure in a human melanoma xenograft model. J Pathol 1998, 184:136–143.

Huang et al. BioMedical Engineering OnLine 2013, 12:23 Page 13 of 13http://www.biomedical-engineering-online.com/content/12/1/23
22. MacAulay C, Tezcan H, Palcic B: Adaptive color basis transformation. An aid in image segmentation. AnalQuant Cytol Histol 1989, 11:53–58.
23. Ruifrok AC: Quantification of immunohistochemical staining by color translation and automated thresholding.Anal Quant Cytol Histol 1997, 19:107–113.
24. Harms H, Aus HM, Haucke M, Gunzer U: Segmentation of stained blood cell images measured at highscanning density with high magnification and high numerical aperture optics. Cytometry 1986, 7:522–531.
25. González RC, Woods RE: Digital Image Processing. Upper Saddle River: Pearson/Prentice Hall; 2008.
doi:10.1186/1475-925X-12-23Cite this article as: Huang et al.: The correlation between extracellular resistance by electrical biopsy and theratio of optical low staining area in irradiated intestinal tissues of rats. BioMedical Engineering OnLine 2013 12:23.
Submit your next manuscript to BioMed Centraland take full advantage of:
• Convenient online submission
• Thorough peer review
• No space constraints or color figure charges
• Immediate publication on acceptance
• Inclusion in PubMed, CAS, Scopus and Google Scholar
• Research which is freely available for redistribution
Submit your manuscript at www.biomedcentral.com/submit