The Contribution of Diesel Engines to Emissions of … 11, 2005 · The Contribution of Diesel...
120
Report No. SR2005-02-01 The Contribution of Diesel Engines to Emissions of ROG, NOx, and PM 2.5 in California: Past, Present and Future prepared for: Diesel Technology Forum February 11, 2005 prepared by: Sierra Research, Inc. 1801 J Street Sacramento, California 95814 (916) 444-6666
Transcript of The Contribution of Diesel Engines to Emissions of … 11, 2005 · The Contribution of Diesel...

Report No. SR2005-02-01
The Contribution of Diesel Engines to Emissions of ROG, NOx, and PM2.5 in California: Past, Present and Future
prepared for:
Diesel Technology Forum
February 11, 2005
prepared by: Sierra Research, Inc. 1801 J Street Sacramento, California 95814 (916) 444-6666

Report No. SR2005-02-01
The Contribution of Diesel Engines to Emissions of ROG, NOx, and PM2.5 in California:
Past, Present and Future
prepared for:
Diesel Technology Forum
February 11, 2005
Principal authors:
James M. Lyons Philip L. Heirigs Lori L. Williams
Sierra Research, Inc. 1801 J Street
Sacramento, CA 95814 (916) 444-6666

-i-
The Contribution of Diesel Engines to Emissions of ROG, NOx, and PM2.5 in California:
Past, Present and Future
Table of Contents
Page
1. Executive Summary ............................................................................................................. 1
2. Introduction .......................................................................................................................... 4
3. Development of Emissions Inventory Data.......................................................................... 5
3.1 Development of Stationary and Area Source Emissions Data...................................... 5 3.2 Development of On-Road Emissions Data ................................................................... 6 3.3 Development of Off-Road Emissions Data .................................................................. 6
4. Contributions of Diesel Engines to Statewide Emissions .................................................... 8
4.1 Diesel Contribution to Statewide ROG Emissions ....................................................... 8 4.2 Diesel Contribution to Statewide NOx Emissions...................................................... 14 4.3 Diesel Contribution to Direct PM2.5 Emissions.......................................................... 18
5. Contribution of Diesels to Emissions in the South Coast Air Basin .................................. 24
5.1 Diesel Contribution to South Coast Air Basin ROG Emissions................................. 24 5.2 Diesel Contribution to South Coast Air Basin NOx Emissions.................................. 29 5.3 Diesel Contribution to Direct PM2.5 Emissions in the South Coast Air Basin ........... 33
6. Contribution of Diesel Engines to Emissions in the San Joaquin Valley Air Basin .......... 38
6.1 Diesel Contribution to San Joaquin Valley Air Basin ROG Emissions ..................... 38 6.2 Diesel Contribution to San Joaquin Valley Air Basin NOx Emissions ...................... 44 6.3 Diesel Contribution to Direct PM2.5 Emissions.......................................................... 48
7. Contribution of Diesel Engines to Emissions in the San Francisco Bay Area Air Basin .. 53
7.1 Diesel Contribution to San Francisco Bay Area Air Basin ROG Emissions.............. 53 7.2 Diesel Contribution to San Francisco Bay Area Air Basin NOx Emissions .............. 59 7.3 Diesel Contribution to Direct PM2.5 Emissions.......................................................... 63
APPENDIX A Stationary and Area Source Emissions Data APPENDIX B On-Road Mobile Source Emissions Data APPENDIX C Non-Road Mobile Source Emissions Data

-ii-
List of Figures Figure Page ES-1 California Statewide ROG Emissions Inventory.......................................................... 2 ES-2 California Statewide NOx Emissions Inventory .......................................................... 2 ES-3 California Statewide PM2.5 Emissions Inventory......................................................... 3 4-1 Statewide Comparison of Major ROG Stationary/Area Source Categories vs. Diesel ........................................................................................ 9 4-2 Statewide Stationary/Area ROG Emissions from Diesel IC Engines ........................ 10 4-3 California Statewide On-Road Motor Vehicle ROG Emissions Inventory ............... 11 4-4 California Statewide On-Road Diesel Vehicle ROG Emissions Inventory ............... 12 4-5 California Non-Road ROG Emissions Inventory....................................................... 13 4-6 California Statewide ROG Emissions Inventory........................................................ 14 4-7 Statewide Comparison of Major NOx Stationary/Area Source Categories vs. Diesel ...................................................................................... 15 4-8 California Statewide On-Road Motor Vehicle NOx Emissions Inventory ................ 16 4-9 California Non-Road NOx Emissions Inventory ....................................................... 17 4-10 California Statewide NOx Emissions Inventory ........................................................ 18 4-11 Statewide Comparison of Major PM2.5 Stationary/Area Source Categories vs. Diesel ...................................................................................... 19 4-12 Statewide Stationary/Area Source PM2.5 Emissions from Diesel IC Engines ........... 20 4-13 California Statewide On-Road Motor Vehicle Exhaust PM2.5 Brake/Tire Wear PM2.5 and Lead Emissions Inventory ................................... 21 4-14 California Non-Road PM2.5 Emissions Inventory ...................................................... 22 4-15 California Statewide PM2.5 Emissions Inventory....................................................... 23 5-1 South Coast Air Basin Major ROG Stationary/Area Source Categories vs. Diesel ...................................................................................... 25 5-2 South Coast Air Basin Stationary/Area Source
ROG Emissions from Diesel IC Engines ................................................................... 25 5-3 South Coast Air Basin On-Road Motor Vehicle ROG Emissions Inventory............. 26 5-4 South Coast Air Basin On-Road Diesel Vehicle ROG Emissions Inventory ............ 27 5-5 South Coast Air Basin Non-Road ROG Emission Inventory..................................... 28 5-6 South Coast Air Basin ROG Emissions Inventory..................................................... 29 5-7 South Coast Air Basin Major NOx Stationary/Area Source Categories vs. Diesel ...................................................................................... 30 5-8 South Coast Air Basin On-Road Motor Vehicle NOx Emissions Inventory ............. 30 5-9 South Coast Air Basin Non-Road NOx Emission Inventory ..................................... 31 5-10 South Coast Air Basin NOx Emissions Inventory ..................................................... 32 5-11 South Coast Air Basin Major PM2.5 Stationary/Area Source Categories vs. Diesel ...................................................................................... 33 5-12 South Coast Air Basin Stationary/Area Source PM2.5 Emissions from Diesel IC Engines................................................................... 34 5-13 South Coast Air Basin On-Road Motor Vehicle Exhaust PM2.5 Brake/Tire Wear PM2.5 and Lead Emissions Inventory ................................... 35

-iii-
List of Figures (continued) Figure Page 5-14 South Coast Air Basin Non-Road PM2.5 Emission Inventory.................................... 36 5-15 South Coast Air Basin PM2.5 Emissions Inventory .................................................... 37 6-1 San Joaquin Valley Air Basin Major ROG Stationary/Area Source Categories vs. Diesel ...................................................................................... 39 6-2 San Joaquin Valley Air Basin Stationary/Area Source
ROG Emissions from Diesel IC Engines ................................................................... 39 6-3 San Joaquin Valley Air Basin On-Road Motor Vehicle ROG Emissions Inventory ............................................................................ 40 6-4 San Joaquin Valley Air Basin On-Road Diesel Vehicle ROG Emissions Inventory ............................................................................ 41 6-5 San Joaquin Valley Air Basin Non-Road ROG Emission Inventory......................... 42 6-6 San Joaquin Valley Air Basin ROG Emissions Inventory ......................................... 43 6-7 San Joaquin Valley Air Basin Major NOx Stationary/Area Source Categories vs. Diesel ...................................................................................... 44 6-8 San Joaquin Valley Air Basin On-Road Motor Vehicle NOx Emissions Inventory.. 45 6-9 San Joaquin Valley Air Basin Non-Road NOx Emission Inventory.......................... 46 6-10 San Joaquin Valley Air Basin NOx Emissions Inventory.......................................... 47 6-11 San Joaquin Valley Air Basin Major PM2.5 Stationary/Area Source Categories vs. Diesel ...................................................................................... 48 6-12 San Joaquin Valley Air Basin Stationary/Area Source PM2.5 Emissions from Diesel IC Engines................................................................... 49 6-13 San Joaquin Valley Air Basin On-Road Motor Vehicle Exhaust PM2.5 Brake/Tire Wear PM2.5 and Lead Emissions Inventory ................................... 50 6-14 San Joaquin Valley Air Basin Non-Road PM2.5 Emission Inventory ........................ 51 6-15 San Joaquin Valley Air Basin PM2.5 Emissions Inventory ........................................ 52 7-1 San Francisco Bay Area Air Basin Major ROG Stationary/Area Source Categories vs. Diesel ...................................................................................... 54 7-2 San Francisco Bay Area Air Basin Stationary/Area Source
ROG Emissions from Diesel IC Engines ................................................................... 54 7-3 San Francisco Bay Area Air Basin On-Road Motor Vehicle ROG Emissions Inventory ............................................................................ 55 7-4 San Francisco Bay Area Air Basin On-Road Diesel Vehicle ROG Emissions Inventory ............................................................................ 56 7-5 San Francisco Bay Area Air Basin Non-Road ROG Emission Inventory ................. 57 7-6 San Francisco Bay Area Air Basin ROG Emissions Inventory ................................. 58 7-7 San Francisco Bay Area Air Basin Major NOx Stationary/Area Source Categories vs. Diesel ...................................................................................... 59 7-8 San Francisco Bay Area Air Basin On-Road Motor Vehicle NOx Emissions Inventory............................................................................. 60 7-9 San Francisco Bay Area Air Basin Non-Road NOx Emission Inventor .................... 61 7-10 San Francisco Bay Area Air Basin NOx Emissions Inventory .................................. 62 7-11 San Francisco Bay Area Air Basin Major PM2.5 Stationary/Area Source Categories vs. Diesel ...................................................................................... 63

-iv-
List of Figures (continued) Figure Page 7-12 San Francisco Bay Area Air Basin Stationary/Area Source PM2.5 Emissions from Diesel IC Engines................................................................... 64 7-13 San Francisco Bay Area Air Basin On-Road Motor Vehicle Exhaust PM2.5 Brake/Tire Wear PM2.5 and Lead Emissions Inventory ................................... 65 7-14 San Francisco Bay Area Air Basin Non-Road PM2.5 Emission Inventory................. 66 7-15 San Francisco Bay Area Air Basin PM2.5 Emissions Inventory................................. 67

-1-
1. EXECUTIVE SUMMARY
California has well known and long-standing air quality problems. Foremost among these problems historically has been high ambient concentrations of ozone (the primary constituent of “smog”). Ozone is formed in the atmosphere as the result of photochemical reactions involving reactive organic gases (ROG) and oxides of nitrogen (NOx). Hence, reductions in emissions of these types of pollutants have been of primary concern to air quality regulators since the late 1960s when air pollution control efforts began in earnest in California. Despite several decades of emission regulations, many areas in California still do not comply with either the one-hour average or the more recently promulgated eight-hour average National Ambient Air Quality Standard (NAAQS) for ozone. In addition to ozone, high ambient concentrations of fine particulate matter (PM2.5) represent a significant air quality problem in California. Again, despite long-standing efforts to reduce direct emissions of PM2.5 and precursors to secondary particulate formulation, a number of areas in California do not comply with applicable NAAQS. Although there are a multitude of sources of emissions of ozone precursors and PM2.5 in California, Diesel engines are often singled out as a major if not principal source of these pollutants. In order to put the air quality impacts of Diesel engines into perspective, this report assesses the past, present, and future contribution of Diesel engines to emissions of ROG, NOx, and direct emissions of PM2.5 in California and selected sub-regions of the state over the period from 1975 to 2020. This assessment is based primarily on emissions inventory data developed by the California Air Resources Board. The results of this assessment are shown in Figures ES-1, ES-2, and ES-3, for ROG, NOx, and direct PM2.5 emissions, respectively. As shown in Figure ES-1, Diesel engines used in applications from stationary power generation to the propulsion of heavy-duty trucks and marine vessels have not and will not contribute significantly to statewide ROG emissions. Diesels do contribute substantially to statewide emissions of NOx. However, as shown in Figure ES-2, the contributions from stationary Diesels are small and the contribution made by on-road Diesel vehicles will diminish considerably between now and 2020 as engines certified to stringent new emission standards are phased into the fleet beginning in 2007. While off-road Diesel engines make the greatest contribution to statewide NOx emissions, it should be noted that that source category includes commercial marine vessels, which are largely unregulated. In addition, most off-road Diesel engines will also be required to comply with the NOx emissions standards similar in stringency to those that apply to on-road Diesels, which will be phased in starting at the end of this decade. While those standards will lead to some reduction in non-road NOx emissions

-2-
Figure ES-1
California Statewide ROG Emissions Inventory
0
1,000
2,000
3,000
4,000
5,000
6,000
7,000
8,000
1975 1980 1985 1990 1995 2000 2005 2010 2015 2020
Calendar Year
Emis
sion
s (to
ns/y
ear)
Stationary/Area Diesel
On-Road Diesel
Non-Road Diesel
Other Non-Road
Other Stationary/Area
Other On-Road
Figure ES-2
California Statewide NOx Emissions Inventory
0
1,000
2,000
3,000
4,000
5,000
6,000
1975 1980 1985 1990 1995 2000 2005 2010 2015 2020
Calendar Year
Emis
sion
s (to
ns/y
ear)
Stationary/Area Diesel
On-Road Diesel
Non-Road Diesel
Other Non-Road
Other Stationary/Area
Other On-Road

-3-
Figure ES-3
California Statewide PM2.5 Emissions Inventory
0
100
200
300
400
500
600
700
800
900
1,000
1975 1980 1985 1990 1995 2000 2005 2010 2015 2020
Calendar Year
Emis
sion
s (to
ns/y
ear)
On-Road Diesel
Stationary/Area Diesel
Non-Road Diesel
Other Non-Road
Other On-Road
Other Stationary/Area
by 2020, the full magnitude of the reductions associated with those standards will not be realized until sometime later due to the long life of Diesel engines and the time required for the replacement of all existing engines. As shown in Figure ES-3, Diesel engines currently account for only about 10% of statewide emissions of PM2.5. The bulk of PM2.5 emissions are due to other stationary and area sources, which include residential fuel combustion, paved and unpaved road dust, and waste burning and disposal. Because of a series of increasingly stringent regulations on stationary and on-road Diesel engines, which ultimately require the use of particulate traps, emissions from Diesel engines account for a small and diminishing fraction of statewide PM2.5 emissions. As is the case with NOx emissions, non-road Diesel engines account for the bulk of the PM2.5 emissions from Diesels. Again, as with on-road engines, most off-road Diesel engines have been and will be required to comply with a series of increasingly stringent emission standards that will also lead to the use of particulate traps. These standards will reduce PM2.5 emissions in 2020 but their effect will not be fully realized until after 2020. Assessments of the contribution of Diesels to ROG, NOx, and direct PM2.5 emissions in the South Coast, San Joaquin Valley, and San Francisco Bay Area air basins lead to observations similar to those found for the state as a whole.
###

-4-
2. INTRODUCTION
California has well known and long-standing air quality problems. Foremost among these problems historically has been high ambient concentrations of ozone (the primary constituent of “smog”). Ozone is formed in the atmosphere as the result of photochemical reactions involving reactive organic gases (ROG) and oxides of nitrogen (NOx). Hence, reductions in emissions of these types of pollutants have been of primary concern to air quality regulators since the late 1960s, when air pollution control efforts began in earnest in California. Despite several decades of emission regulations, many areas in California still do not comply with either the one-hour average or the more recently promulgated eight-hour average National Ambient Air Quality Standard (NAAQS) for ozone. In addition to ozone, high ambient concentrations of fine particulate matter* represent a significant air quality problem in California. There are a number of sources of PM2.5 that include particles directly emitted from combustion processes, some portion of particles associated with vehicular brake and tire wear debris as entrainment of road dust, as well as some portion of dust generated by industrial processes or wind-induced entrainment of soil dust. Fine particulate matter can also be formed in the atmosphere† via gas-to-particle conversion processes from gaseous emissions of NOx, oxides of sulfur (SOx), and ROG. Again, despite long-standing efforts to reduce direct emissions of PM2.5 and precursors to secondary particulate formulation, a number of areas in California do not comply with applicable NAAQS. Although there are a multitude of sources of emissions of ozone and PM2.5 precursors in California, Diesel engines are often singled out as a major if not principal source of these pollutants. To put the air quality impacts of Diesel engines into perspective, this report assesses the past, present, and future contribution of Diesel engines to emissions of ROG, NOx, and direct emissions of PM2.5 in California and selected sub-regions of the state over the period from 1975 to 2020. The emissions data that form the foundation for this assessment were developed by the California Air Resources Board and were adjusted insofar as necessary and possible so that they would accurately account for newly adopted state and federal regulations that affect Diesel emissions in California. This report and its appendices describe and present the results of this assessment.
###
* For purposes of this report, fine particulate matter is defined to mean particulate matter with particle diameters of 2.5 microns or less, which is denoted as PM2.5. † Fine particulate matter formed in the atmosphere is commonly denoted as secondary particulate matter.

-5-
3. DEVELOPMENT OF EMISSIONS INVENTORY DATA
As noted above, the goal of this effort was to develop data allowing the relative contribution of Diesel engines to two of California’s most serious air quality problems to be estimated. As described below, emissions inventory data for stationary and area sources as well as on- and off-road mobile sources developed by the California Air Resources Board formed the foundation for this assessment. The emissions data span the period from 1975 to 2020 in five-year increments. The pollutants considered were ROG and NOx, precursors to both the formation of ozone and fine particulate matter, as well as direct PM2.5 emissions. Assessments have been performed for the state as a whole as well as for the South Coast, San Joaquin Valley, and San Francisco Bay Area air basins.* Data were segregated into three major source classifications—stationary and area, on-road mobile, and off-road mobile—and further segregated within those major classifications. Adjustments were made to the data as necessary and insofar as possible to account for the impacts of recently adopted state and federal regulations not already reflected. 3.1 Development of Stationary and Area Source Emissions Data
Emissions data for stationary and area sources were obtained from CARB’s emission inventory website.† For purposes of this assessment, Diesel engines used in applications included in the stationary and area sources inventories, such as primary and emergency power generation, and engines included in CARB’s portable equipment registration program were grouped into a single category. Non-Diesel stationary and area sources were grouped into one of the 21 following classifications:
1. Adhesives & Sealants 2. Agricultural/Farming Processing & Operations 3. Architectural Coatings and Related Process Solvents 4. Asphalt Paving/Roofing 5. Cleaning & Surface Coatings 6. Consumer Products 7. Dust (Construction, road, windblown) 8. Fires 9. Industrial Process - Chemical 10. Industrial Process - Electronics
* Details regarding air basin boundaries can be found at http://www.arb.ca.gov/aqd/almanac/almanac04/pdf/chap404.pdf. † See http://www.arb.ca.gov/ei/emissiondata.htm.

-6-
11. Industrial Process - Glass and Related Products 12. Industrial Process - Metal 13. Industrial Process - Mineral 14. Industrial Process - Wood & Paper 15. Other Fuel Combustion 16. Other Miscellaneous & Industrial Processes 17. Petroleum Production, Refining, & Marketing 18. Printing 19. Residential Heating/Cooking 20. Utilities/Cogeneration 21. Waste Disposal
These categories were intended to allow for the comparison of Diesel engine emissions with emissions due to specific industrial processes in California as well as the other major stationary/area emissions sources. Appendix A provides additional discussion of how the inventory was developed, as well as detailed emission data in tabular form for the different classifications over the study period. 3.2 Development of On-Road Emissions Data
Data for on-road mobile sources were generated directly using the latest version of CARB’s EMFAC emissions inventory model.* All gasoline vehicles were aggregated into a single classification† while Diesel-fueled vehicles were divided into the following classifications based on vehicle type and gross vehicle weight rating:
1. Light-duty Diesel cars and trucks; 2. Light-heavy and medium heavy-duty Diesel vehicles; 3. Diesel school and urban buses; and 4. Heavy heavy-duty Diesel vehicles.
Details regarding the development of the on-road inventory and tabular summaries of detailed inventory data are presented in Appendix B. 3.3 Development of Off-Road Emissions Data
Data for off-road mobile sources were developed using the current CARB Mobile Source Inventory, which is available on the CARB website.‡ All non-Diesel powered vehicles
* EMFAC2002 see http://www.arb.ca.gov/msei/on-road/latest_version.htm. † Note that while there are a limited number of alternatively fueled vehicles in use in California, they are not explicitly accounted for in CARB’s EMFAC2002 model as they are certified to the same emission standards as gasoline vehicles and subject to the same requirements. ‡ See http://www.arb.ca.gov/ei/emissiondata.htm.

-7-
and equipment were grouped into a single classification while the following classifications were used for Diesels:
1. Agricultural equipment; 2. Construction, industrial and other equipment; 3. Locomotives; and 4. Marine vessels.
Other sources included in the non-road inventory are lawn and garden equipment, recreational off-road vehicles and motorcycles, and pleasure and personal watercraft. Details regarding the off-road mobile source emissions are addressed in Appendix C, which also includes detailed tabular summaries of the inventory data.
###

-8-
4. CONTRIBUTIONS OF DIESEL ENGINES TO STATEWIDE EMISSIONS
This section presents the results of our assessment of the contribution of Diesel engines to statewide ROG, NOx, and direct PM2.5 emissions. The contributions of Diesels to emissions in the South Coast, San Joaquin Valley, and San Francisco Bay Area air basins are addressed in Sections 5, 6, and 7, respectively, of this report. In each of these sections, emissions data are presented in the order of pollutant for ROG, NOx, and direct PM2.5 emissions, respectively, and then for each pollutant in order of source categories for stationary and area, on-road, non-road mobile, and all sources, respectively. Data are presented here in graphical form and, as noted in the previous section, in tabular form in Appendices A through C. 4.1 Diesel Contribution to Statewide ROG Emissions
Relative to gasoline-fueled engines, Diesel engines generally exhibit relatively low emissions of ROG. This occurs for two reasons. First, Diesel engines operate at high air to fuel ratios where the excess oxygen and high temperatures present during and immediately following the combustion process lead to fairly complete combustion of ROG compounds. Secondly, Diesel fuel is relatively non-volatile, which causes evaporative emissions from Diesel fuel use to be of little consequence relative to gasoline and solvent use. It should also be noted that catalyzed Diesel particulate traps—which are coming into widespread use as the result of CARB Diesel retrofit regulations, air pollution control district requirements, voluntary retrofit programs and more stringent federal emission standards for new on- and non-road Diesel engines—will also reduce ROG emissions. This will occur because the catalyzed traps are approximately 90% effective in oxidizing even the relatively low levels of ROG emissions found in Diesel exhaust.*
* See http://www.dieselforum.org/factsheet/traps.html.

-9-
Stationary and Area Sources – The contribution of Diesel engines to statewide emissions of ROG in the stationary and area source classification is presented below in Figure 4-1. Emissions are highlighted for the four most significant of the 21 categories listed in Section 3 of report, Diesel engines, and all other stationary and area sources. As shown, Diesels constitute such a minimal portion of the overall area and stationary source ROG emission totals (0.5% or less) that they are not visible on Figure 4.1.
Figure 4-1
Statewide Comparison of Major ROG Stationary/Area Source Categories vs. Diesel
0
500
1,000
1,500
2,000
2,500
3,000
1975 1980 1985 1990 1995 2000 2005 2010 2015 2020
Calendar Year
Emis
sion
s (to
ns/d
ay)
Total Area/Stationary Diesel IC Engines
Cleaning & Surface Coatings
Petroleum Production, Refining, & Marketing
Agricultural/Farming Processing & Operations
Consumer Products
Other Area/Stationary Sources

-10-
Trends in Diesel engine ROG emissions in the stationary and area source classification are shown in Figure 4-2 where only those emissions have been plotted. Comparison of the ordinate scale of this figure with that of Figure 4-1 shows that Diesel ROG emissions have accounted for and will continue to account for a negligible portion of the stationary and area source ROG emission inventory in California. The figure also shows that ROG emissions from Diesel engines in California continuously decline from 1990 to 2020. The reason for the spikes in the inventory during 1990 is unknown.
Figure 4-2
Statewide Stationary/Area ROG Emissionsfrom Diesel IC Engines
0
1
2
3
4
5
6
7
8
1975 1980 1985 1990 1995 2000 2005 2010 2015 2020
Calendar Year
Emis
sion
s (to
ns/d
ay)

-11-
On-Road Mobile Sources – The contribution of Diesels to statewide ROG emissions from on-road mobile sources is presented in Figure 4-3. As shown in the figure, gasoline-fueled vehicles dominate the ROG emission inventory from on-road mobile sources to such a degree that the contribution of Diesel vehicles is barely discernable at any point over the study period.
Figure 4-3
California StatewideOn-Road Motor Vehicle ROG Emissions Inventory
0
500
1000
1500
2000
2500
3000
3500
4000
4500
1975 1980 1985 1990 1995 2000 2005 2010 2015 2020
Calendar Year
Emis
sion
s (to
ns/d
ay)
Gasoline VehiclesLight-Duty Diesel Cars and TrucksLt-Hvy and Med-Hvy-Duty Diesel VehiclesDiesel School and Urban BusesHeavy Heavy-Duty Diesel Vehicles

-12-
To see the trends in Diesel ROG emissions over time, ROG emissions from only on-road Diesel engines are presented in Figure 4-4. As shown, ROG emissions from on-road Diesel engines grew from 1975 to about 1990 as the result of increases in the population of vehicles and number of miles traveled. Emissions then leveled off as the result of the imposition of more stringent emission standards, and then began a continuous downward trend that is projected to continue through 2020. This decline occurs despite, as indicated in Appendix B, the number of Diesel vehicles and the mileage they accumulate in California increasing by about a factor of three over the period from 1975 to 2020.
Figure 4-4
California StatewideOn-Road Diesel Vehicle ROG Emissions Inventory
0
10
20
30
40
50
60
1975 1980 1985 1990 1995 2000 2005 2010 2015 2020
Calendar Year
Emis
sion
s (to
ns/d
ay)
Light-Duty Diesel Cars and TrucksLt-Hvy and Med-Hvy-Duty Diesel VehiclesDiesel School and Urban BusesHeavy Heavy-Duty Diesel Vehicles

-13-
Off-Road Mobile Sources – The contribution of Diesels to statewide ROG emissions from non-road sources is shown in Figure 4-5. In contrast to the situation with the other two classifications, off-road Diesels have accounted for and will continue to account for about 20% of ROG emissions in this classification. However, ROG emissions from non-road mobile sources, including Diesels, peaked during the 1990s and continuously decline through 2020.
Figure 4-5
California Non-Road ROG Emissions Inventory
0
100
200
300
400
500
600
700
1975 1980 1985 1990 1995 2000 2005 2010 2015 2020
Calendar Year
Emis
sion
s (to
ns/d
ay)
LocomotivesDiesel MarineDiesel Agricultural EquipmentDiesel - "Other" EquipmentOther Non-Road

-14-
All Sources – The very small total contribution of all Diesel engines to statewide emissions of ROG can be seen in Figure 4-6. As shown, the total ROG emissions inventory has declined dramatically and continuously since 1975 and will continue to decline through 2020 despite some projected growth in ROG emissions from non-Diesel stationary and area sources. As one would expect based on the previous figures, Diesels in California do not contribute significantly to statewide ROG emissions.
Figure 4-6
California Statewide ROG Emissions Inventory
0
1,000
2,000
3,000
4,000
5,000
6,000
7,000
8,000
1975 1980 1985 1990 1995 2000 2005 2010 2015 2020
Calendar Year
Emis
sion
s (to
ns/y
ear)
Stationary/Area Diesel
On-Road Diesel
Non-Road Diesel
Other Non-Road
Other Stationary/Area
Other On-Road
4.2 Diesel Contribution to Statewide NOx Emissions
In contrast to the situation with ROG emissions, Diesel engines emit significant amounts of NOx unless they are fitted with suitable aftertreatment devices. Such devices are required at present on some stationary Diesel engines and will be entering widespread use for on- and non-road engines beginning at the end of this decade as they will be required to achieve compliance with applicable federal emission regulations. NOx emissions also occur as the result of virtually all combustion processes that occur in California.

-15-
Stationary and Area Sources – The contribution of Diesel engines to statewide emissions of NOx in the stationary and area source classification is presented in Figure 4-7. Emissions are highlighted for the four most significant of the 21 categories listed in Section 3 of report, Diesel engines, and all other stationary and area sources. Although difficult to see from the figure, NOx emissions from Diesel engines in this classification peaked around 1990 at about 70 tons per day and decline continuously from 1980 through 2020, at which time they will amount to only about 30 tons per day. From 2000 through 2020, Diesels account for only 10% or less of NOx emissions in this source classification and Diesel NOx emissions are smaller than those associated with any of the identified source categories. Finally, although the Diesel contribution to NOx emissions is small and decreases over time, there is a slight upward trend in the total NOx emission inventory for this classification due to increases in NOx emissions from other non-Diesel sources.
Figure 4-7
Statewide Comparison of Major NOx Stationary/Area Source Categories vs. Diesel
0
200
400
600
800
1,000
1,200
1,400
1,600
1975 1980 1985 1990 1995 2000 2005 2010 2015 2020
Calendar Year
Emis
sion
s (to
ns/d
ay)
Total Area/Stationary Diesel IC Engines
Other Area/Stationary Sources
Residential Heating/Cooking
Utilities/Cogeneration
Petroleum Production, Refining, & Marketing
Other Fuel Combustion

-16-
On-Road Mobile Sources – The contribution of Diesels to statewide NOx emissions from on-road mobile sources is presented in Figure 4-8. As shown in the figure, although gasoline-fueled vehicles have generally dominated the NOx emission inventory from on-road mobile sources over time, Diesel emissions, particularly those from heavy heavy-duty Diesel vehicles used in line-haul trucking and other applications, are significant. On-road Diesel emissions peaked in 1990 at about 1,000 tons per day, which represented about 30% of the total on-road NOx inventory. By 2005, Diesel NOx emissions have declined to 700 tons per day, but amount to about 50% of on-road NOx due to the more rapid decrease in NOx emissions from gasoline vehicles. However, because of more stringent emission standards on new engines, Diesel NOx emissions are forecast to drop by 2020 to only 250 tons per day and will continue to account for about 50% of total on-road NOx. To summarize, despite substantial growth in the number of Diesel vehicles and total miles of Diesel travel, NOx emissions from on-road Diesel vehicles in California by 2020 will be reduced to about 25% of what they were in 1990 and about 30% of what they are today.
Figure 4-8
California StatewideOn-Road Motor Vehicle NOx Emissions Inventory
0
500
1000
1500
2000
2500
3000
1975 1980 1985 1990 1995 2000 2005 2010 2015 2020
Calendar Year
Emis
sion
s (to
ns/d
ay)
Gasoline VehiclesLight-Duty Diesel Cars and TrucksLt-Hvy and Med-Hvy-Duty Diesel VehiclesDiesel School and Urban BusesHeavy Heavy-Duty Diesel Vehicles
-17-
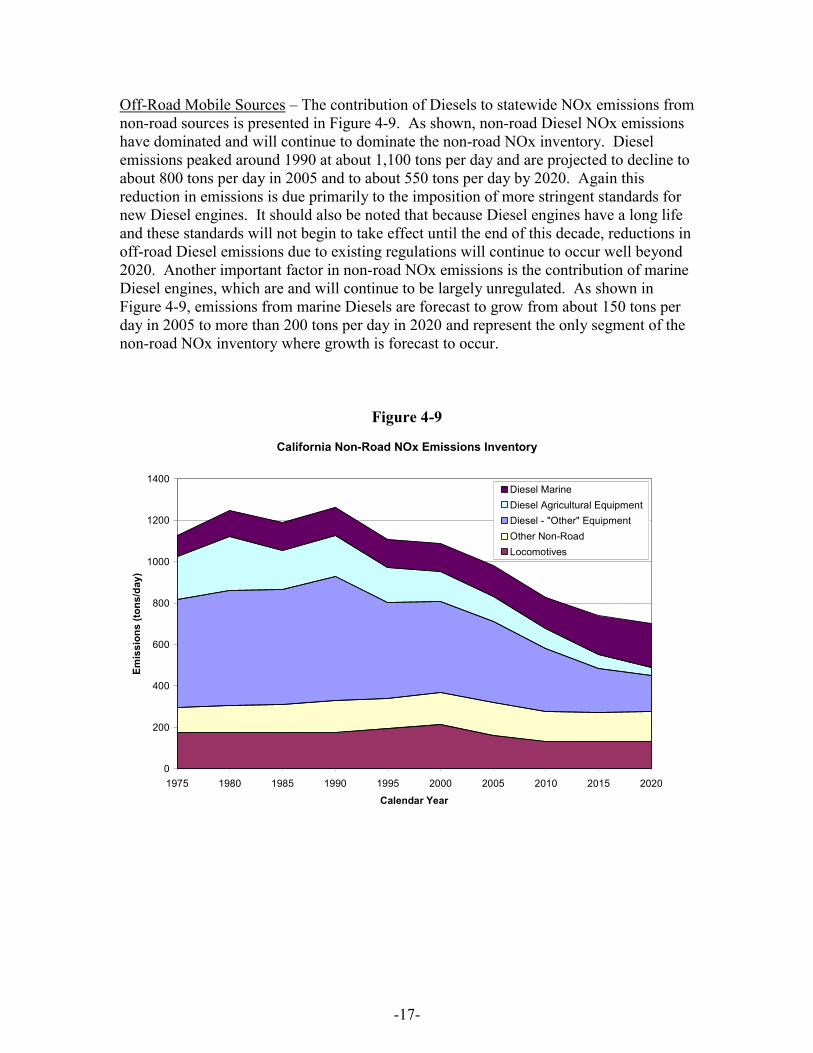
Off-Road Mobile Sources – The contribution of Diesels to statewide NOx emissions from non-road sources is presented in Figure 4-9. As shown, non-road Diesel NOx emissions have dominated and will continue to dominate the non-road NOx inventory. Diesel emissions peaked around 1990 at about 1,100 tons per day and are projected to decline to about 800 tons per day in 2005 and to about 550 tons per day by 2020. Again this reduction in emissions is due primarily to the imposition of more stringent standards for new Diesel engines. It should also be noted that because Diesel engines have a long life and these standards will not begin to take effect until the end of this decade, reductions in off-road Diesel emissions due to existing regulations will continue to occur well beyond 2020. Another important factor in non-road NOx emissions is the contribution of marine Diesel engines, which are and will continue to be largely unregulated. As shown in Figure 4-9, emissions from marine Diesels are forecast to grow from about 150 tons per day in 2005 to more than 200 tons per day in 2020 and represent the only segment of the non-road NOx inventory where growth is forecast to occur.
Figure 4-9
California Non-Road NOx Emissions Inventory
0
200
400
600
800
1000
1200
1400
1975 1980 1985 1990 1995 2000 2005 2010 2015 2020
Calendar Year
Emis
sion
s (to
ns/d
ay)
Diesel MarineDiesel Agricultural EquipmentDiesel - "Other" EquipmentOther Non-RoadLocomotives

-18-
All Sources – The contribution of all Diesel engines to total statewide emissions of NOx from 1975 through 2020 can be seen in Figure 4-10. As shown, the total NOx emissions inventory peaked during the 1980 to 1990 timeframe at about 5,000 tons per day and declines continuously from 1990 through 2020, at which time it is estimated that NOx emissions will be about 2,000 tons per day. Diesels of all types will account for roughly 50% of NOx emissions in 2020. The decline in NOx emissions from the peak around 1990 through 2020 is due primarily to reductions in NOx emissions from on-road gasoline and Diesel mobile sources and to a lesser extent to reductions in off-road Diesel NOx emissions.
Figure 4-10
California Statewide NOx Emissions Inventory
0
1,000
2,000
3,000
4,000
5,000
6,000
1975 1980 1985 1990 1995 2000 2005 2010 2015 2020
Calendar Year
Emis
sion
s (to
ns/y
ear)
Stationary/Area Diesel
On-Road Diesel
Non-Road Diesel
Other Non-Road
Other Stationary/Area
Other On-Road
4.3 Diesel Contribution to Direct PM2.5 Emissions
As is the case with NOx emissions, Diesel engines have significant direct emissions of PM2.5 unless they are fitted with suitable aftertreatment devices. However, Diesel particulate traps and oxidation catalysts used in the control of fine particulate emissions are more highly evolved than are aftertreatment devices for reducing Diesel NOx emissions* and are being applied to on- and off-road Diesel engines both as retrofit
* “Final Regulatory Analysis: Control of Emissions from Nonroad Diesel Engines”, Chapter 4, U.S. EPA, EPA420-R-04-007, May, 2004.

-19-
devices and as a means to allow new engines to comply with applicable emission standards. Stationary and Area Sources – The contribution of Diesel engines to statewide direct PM2.5 emissions in the stationary and area source classification is presented in Figure 4-11. Again, emissions are highlighted for the four most significant of the 21 categories listed in Section 3 of this report, for Diesel engines, and for all other stationary and area sources. As shown, Diesels contribute only very minimally to the total stationary and area source PM2.5 emission total.
Figure 4-11
Statewide Comparison of Major PM2.5 Stationary/Area Source Categories vs. Diesel
0
100
200
300
400
500
600
700
800
1 2 3 4 5 6 7 8 9 10
Calendar Year
Emis
sion
s (to
ns/d
ay)
Total Area/Stationary Diesel IC EnginesOther Area/Stationary SourcesAgricultural/Farming Processing & OperationsWaste DisposalResidential Heating/CookingDust (Construction, road, windblown)

-20-
Trends in Diesel engine PM2.5 emissions in the stationary and area source classification are shown in Figure 4-12, where only those emissions have been plotted. As shown, Diesel PM2.5 emissions are predicted to continue the downward trend that began during the 1990s. Again, a comparison of the ordinate of Figure 4-12 with that of Figure 4-11 puts the negligible contribution of Diesel emissions to total PM2.5 emissions in this category into perspective.
Figure 4-12
Statewide Stationary/Area Source PM2.5 Emissionsfrom Diesel IC Engines
0
1
2
3
4
5
6
7
1975 1980 1985 1990 1995 2000 2005 2010 2015 2020
Calendar Year
Emis
sion
s (to
ns/d
ay)

-21-
On-Road Mobile Sources – The contribution of Diesels to statewide direct PM2.5 emissions from on-road mobile sources is presented in Figure 4-13. As indicated in the figure’s legend, emissions of fine lead particulate matter from gasoline vehicles occurring before the elimination of leaded gasoline from the California market in 1992, as well as fine particulate matter due to brake and tire wear, have been included. As shown, Diesel emissions became the dominant source of fine particulate matter from on-road mobile sources as lead emissions decreased and remained the dominant source through about 2005, after which time exhaust emissions from gasoline vehicles become dominant. Diesel PM2.5 emissions peaked at about 35 tons per day in 1990 and then continuously decline through 2020, at which time they amount to less than 10 tons per day. The main reason for the reduction in fine particulate matter emissions from on-road Diesels since 1990 is the implementation of a series of more stringent emission standards for new engines.
Figure 4-13
California StatewideOn-Road Motor Vehicle Exhaust PM2.5, Brake/Tire Wear PM2.5,
and Lead Emissions Inventory
0
10
20
30
40
50
60
70
80
90
1975 1980 1985 1990 1995 2000 2005 2010 2015 2020
Calendar Year
Emis
sion
s (to
ns/d
ay)
Brake and Tire WearGasoline Vehicle Lead EmissionsGasoline Vehicle Exhaust PMLight-Duty Diesel Exhaust PMLt-Hvy and Med-Hvy-Duty Diesel Exhaust PMDiesel School and Urban Bus Exhaust PMHeavy Heavy-Duty Diesel Exhaust PM

-22-
Off-Road Mobile Sources – The contribution of Diesels to statewide direct PM2.5 emissions from non-road sources is shown in Figure 4-14. As shown, non-road Diesel PM2.5 emissions have dominated and will continue to dominate the non-road PM2.5 inventory. Diesel emissions peaked around 1990 at about 70 tons per day but are projected to decline to about 50 tons per day in 2005 and to about 30 tons per day by 2020. Again, this reduction in emissions is due primarily to the imposition of more stringent standards for new Diesel engines. As with NOx emissions, it should also be noted that because of the long life of Diesel engines and the fact that these standards will not begin to take effect until the end of this decade, reductions in off-road Diesel emissions due to existing regulations will continue to occur well beyond 2020. It should also be noted that as was the case with NOx emissions, PM2.5 emissions from commercial marine engines are the only segment of the off-road sector where growth in emissions is forecast.
Figure 4-14
California Non-Road PM2.5 Emissions Inventory
0
10
20
30
40
50
60
70
80
90
100
1975 1980 1985 1990 1995 2000 2005 2010 2015 2020
Calendar Year
Emis
sion
s (to
ns/d
ay)
LocomotivesDiesel Agricultural EquipmentDiesel MarineDiesel - "Other" EquipmentOther Non-Road

-23-
All Sources – Direct PM2.5 emissions from all sources in California are shown in Figure 4-15. As shown, emissions from non-Diesel stationary and area sources, which include the fine particulate from entrained dust and industrial emissions, dominate the statewide inventory. Disesel emissions from all sources account for around 10% or less of the total inventory after their peak in 1990.
Figure 4-15
California Statewide PM2.5 Emissions Inventory
0
100
200
300
400
500
600
700
800
900
1,000
1975 1980 1985 1990 1995 2000 2005 2010 2015 2020
Calendar Year
Emis
sion
s (to
ns/y
ear)
On-Road Diesel
Stationary/Area Diesel
Non-Road Diesel
Other Non-Road
Other On-Road
Other Stationary/Area
###

-24-
5. CONTRIBUTION OF DIESELS TO EMISSIONS IN THE SOUTH COAST AIR BASIN
In this section we present the results of our assessment of the contribution of Diesel engines to ROG, NOx, and direct PM2.5 emissions in the South Coast Air Basin, assessments for the San Joaquin Valley and San Francisco Bay Area air basins are presented in Sections 6 and 7, respectively. As with the other sections of this report, emissions data are presented in the order of pollutant for ROG, NOx, and direct PM2.5 emissions, respectively, and then for each pollutant in order of source categories for stationary and area, on-road, non-road mobile, and finally all sources, respectively. Data are presented here in graphical form and as noted in the previous section in tabular form in Appendices A through C. Given the similarity of the area-specific assessments to the statewide assessment presented in Section 4, the discussion presented in that section also applies here as well as in Sections 6 and 7. 5.1 Diesel Contribution to South Coast Air Basin ROG Emissions
Stationary and Area Sources – The contribution of Diesel engines to South Coast Air Basin ROG emissions in the stationary and area source classification is presented in Figure 5-1. Emissions are highlighted for the four most significant of the 21 categories listed in Section 3 of report, Diesel engines, and all other stationary and area sources. As shown, the Diesel contribution to ROG emissions in the South Coast air basin is negligible as it is also on a statewide basis. Trends in Diesel engine ROG emissions in the stationary and area source classification are shown in Figure 5-2, where only those emissions have been plotted. As shown, ROG emissions from stationary Diesel engines in the South Coast Air Basin are small and have declined from a peak in 1990.

-25-
Figure 5-1
South Coast Air BasinMajor ROG Stationary/Area Source Categories vs. Diesel
0
100
200
300
400
500
600
700
800
900
1975 1980 1985 1990 1995 2000 2005 2010 2015 2020
Calendar Year
Emis
sion
s (to
ns/d
ay)
Total Area/Stationary Diesel IC Engines
Other Area/Stationary Sources
Architectural Coatings and Related Process Solvents
Petroleum Production, Refining, & Marketing
Cleaning & Surface Coatings
Consumer Products
Figure 5-2
South Coast Air BasinStationary/Area Source ROG Emissions from Diesel IC Engines
0.0
0.5
1.0
1.5
2.0
2.5
3.0
1975 1980 1985 1990 1995 2000 2005 2010 2015 2020
Calendar Year
Emis
sion
s (to
ns/d
ay)

-26-
On-Road Mobile Sources – The contribution of Diesels to South Coast Air Basin ROG emissions from on-road mobile sources is presented in Figure 5-3. As shown in the figure, gasoline-fueled vehicles dominate the ROG emission inventory from on-road mobile sources.
Figure 5-3
South Coast Air BasinOn-Road Motor Vehicle ROG Emissions Inventory
0
200
400
600
800
1000
1200
1400
1600
1800
1975 1980 1985 1990 1995 2000 2005 2010 2015 2020
Calendar Year
Emis
sion
s (to
ns/d
ay)
Gasoline VehiclesLight-Duty Diesel Cars and TrucksLt-Hvy and Med-Hvy-Duty Diesel VehiclesDiesel School and Urban BusesHeavy Heavy-Duty Diesel Vehicles

-27-
In order to see the trends in Diesel ROG emissions overtime, ROG emissions from only on-road Diesel engines are presented in Figure 5-4 and are similar to those observed on a statewide basis.
Figure 5-4
South Coast Air BasinOn-Road Diesel Vehicle ROG Emissions Inventory
0
2
4
6
8
10
12
14
16
18
20
1975 1980 1985 1990 1995 2000 2005 2010 2015 2020
Calendar Year
Emis
sion
s (to
ns/d
ay)
Light-Duty Diesel Cars and TrucksLt-Hvy and Med-Hvy-Duty Diesel VehiclesDiesel School and Urban BusesHeavy Heavy-Duty Diesel Vehicles

-28-
Off-Road Mobile Sources – The contribution of Diesels to South Coast Air Basin ROG emissions from non-road sources is shown in Figure 5-5. Off-road ROG emissions in the South Coast Air Basin follow the same trend noted for statewide off-road ROG emissions.
Figure 5-5
South Coast Air BasinNon-Road ROG Emission Inventory
0
50
100
150
200
250
1975 1980 1985 1990 1995 2000 2005 2010 2015 2020
Calendar Year
Emis
sion
s (to
ns/d
ay)
Diesel Agricultural EquipmentLocomotivesDiesel MarineDiesel - "Other" EquipmentOther Non-Road

-29-
All Sources – The contribution of all Diesel engines to total South Coast Air Basin emissions of ROG can be seen in Figure 5-6. As shown, Diesels do not contribute significantly to the total ROG emissions inventory.
Figure 5-6
South Coast Air Basin ROG Emissions Inventory
0
500
1,000
1,500
2,000
2,500
3,000
1975 1980 1985 1990 1995 2000 2005 2010 2015 2020
Calendar Year
Emis
sion
s (to
ns/y
ear)
Stationary/Area Diesel
On-Road Diesel
Non-Road Diesel
Other Non-Road
Other Stationary/Area
Other On-Road
5.2 Diesel Contribution to South Coast Air Basin NOx Emissions
Stationary and Area Sources – The contribution of Diesel engines to South Coast Air Basin emissions of NOx in the stationary and area source classification is presented in Figure 5-7. Emissions are again highlighted for the four most significant of the 21 categories listed in Section 3 of report, Diesel engines, and all other stationary and area sources. As shown in Figure 5-7, as was the case for the state as a whole, NOx emissions from Diesel engines in this classification peaked in the South Coast around 1980, and decline continuously from 1980 through 2020; from 2000 through 2020, Diesels account for only 10% or less of NOx emissions in this source classification. On-Road Mobile Sources – The contribution of Diesels to South Coast Air Basin NOx emissions from on-road mobile sources is presented in Figure 5-8 and is very similar to that observed for statewide emissions.

-30-
Figure 5-7
South Coast Air BasinMajor NOx Stationary/Area Source Categories vs. Diesel
0
50
100
150
200
250
300
350
400
1975 1980 1985 1990 1995 2000 2005 2010 2015 2020
Calendar Year
Emis
sion
s (to
ns/d
ay)
Total Area/Stationary Diesel IC Engines
Other Area/Stationary Sources
Utilities/Cogeneration
Petroleum Production, Refining, & Marketing
Residential Heating/Cooking
Other Fuel Combustion
Figure 5-8
South Coast Air BasinOn-Road Motor Vehicle NOx Emissions Inventory
0
200
400
600
800
1000
1200
1975 1980 1985 1990 1995 2000 2005 2010 2015 2020
Calendar Year
Emis
sion
s (to
ns/d
ay)
Gasoline VehiclesLight-Duty Diesel Cars and TrucksLt-Hvy and Med-Hvy-Duty Diesel VehiclesDiesel School and Urban BusesHeavy Heavy-Duty Diesel Vehicles
-31-
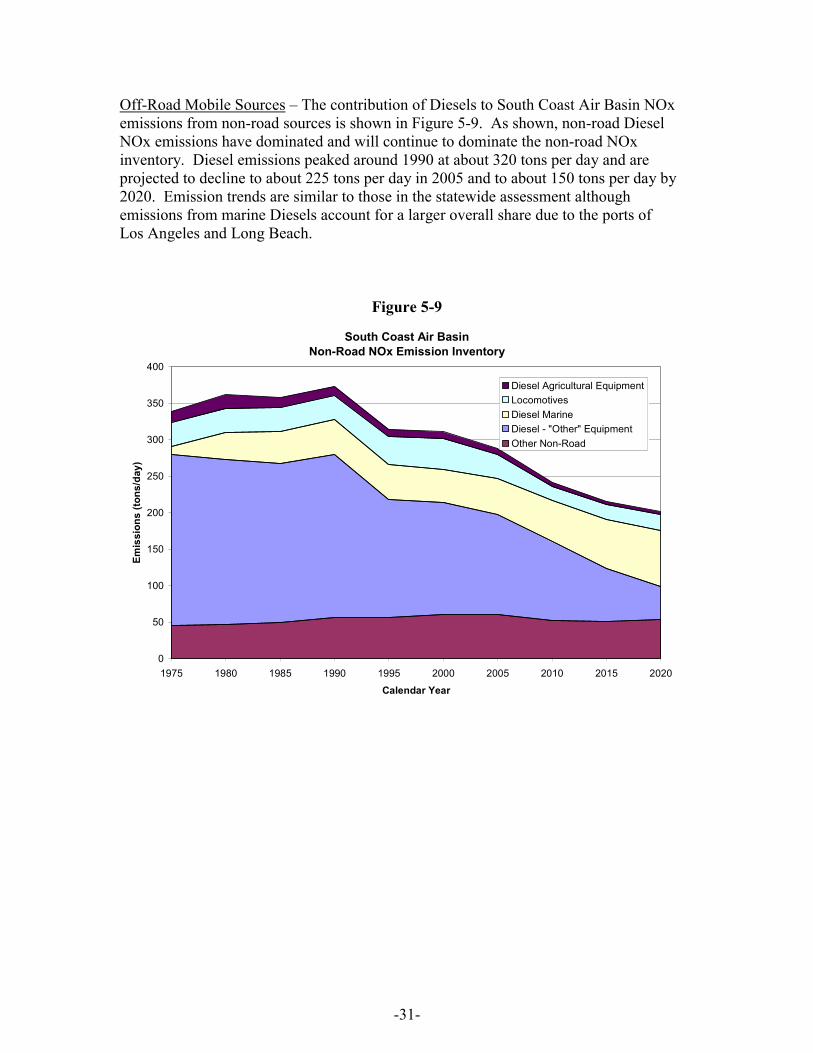
Off-Road Mobile Sources – The contribution of Diesels to South Coast Air Basin NOx emissions from non-road sources is shown in Figure 5-9. As shown, non-road Diesel NOx emissions have dominated and will continue to dominate the non-road NOx inventory. Diesel emissions peaked around 1990 at about 320 tons per day and are projected to decline to about 225 tons per day in 2005 and to about 150 tons per day by 2020. Emission trends are similar to those in the statewide assessment although emissions from marine Diesels account for a larger overall share due to the ports of Los Angeles and Long Beach.
Figure 5-9
South Coast Air BasinNon-Road NOx Emission Inventory
0
50
100
150
200
250
300
350
400
1975 1980 1985 1990 1995 2000 2005 2010 2015 2020
Calendar Year
Emis
sion
s (to
ns/d
ay)
Diesel Agricultural EquipmentLocomotivesDiesel MarineDiesel - "Other" EquipmentOther Non-Road

-32-
All Sources – The contribution of all Diesel engines to total South Coast Air Basin emissions of NOx from 1975 through 2020 can be seen in Figure 5-10. As shown, the total NOx emissions inventory peaked in 1990 and declined continuously since that time and will continue to decline through 2020. This decline is due primarily to reductions in NOx emissions from on-road gasoline and Diesel mobile sources and to a lesser extent to reductions in off-road Diesel NOx emissions. By 2020, South Coast NOx emissions will have dropped to less than one-third of those at the peak around 1990.
Figure 5-10
South Coast Air Basin NOx Emissions Inventory
0
200
400
600
800
1,000
1,200
1,400
1,600
1,800
2,000
1975 1980 1985 1990 1995 2000 2005 2010 2015 2020
Calendar Year
Emis
sion
s (to
ns/y
ear)
Stationary/Area Diesel
On-Road Diesel
Non-Road Diesel
Other Non-Road
Other Stationary/Area
Other On-Road

-33-
5.3 Diesel Contribution to Direct PM2.5 Emissions in the South Coast Air Basin
Stationary and Area Sources – The contribution of Diesel engines to South Coast Air Basin direct PM2.5 emissions in the stationary and area source classification is presented in Figure 5-11. Again, emissions are highlighted for the four most significant of the 21 categories listed in Section 3 of report, Diesel engines, and all other stationary and area sources. As shown, Diesels contribute minimally to the total stationary and area source inventory prior to 1995, and their contribution is negligible after 1995.
Figure 5-11
South Coast Air BasinMajor PM2.5 Stationary/Area Source Categories vs. Diesel
0
10
20
30
40
50
60
70
80
90
1975 1980 1985 1990 1995 2000 2005 2010 2015 2020
Calendar Year
Emis
sion
s (to
ns/d
ay)
Total Area/Stationary Diesel IC EnginesOther Area/Stationary SourcesPetroleum Production, Refining, & MarketingWaste DisposalResidential Heating/CookingDust (Construction, road, windblown)

-34-
Trends in Diesel engine PM2.5 emissions in the stationary and area source classification are shown in Table 5-12, where only those emissions have been plotted. As shown, Diesel PM2.5 emissions gradually decrease between 1995 and 2010, and are essentially constant from 2010 to 2020.
Figure 5-12
South Coast Air BasinStationary/Area Source PM2.5 Emissions from Diesel IC Engines
0.0
0.5
1.0
1.5
2.0
2.5
3.0
3.5
1975 1980 1985 1990 1995 2000 2005 2010 2015 2020
Calendar Year
Emis
sion
s (to
ns/d
ay)

-35-
On-Road Mobile Sources – The contribution of Diesels to South Coast Air Basin direct PM2.5 emissions from on-road mobile sources is presented in Figure 5-13. The Diesel contribution to total emissions and trends are comparable to what was observed for the statewide assessment.
Figure 5-13
South Coast Air BasinOn-Road Motor Vehicle Exhaust PM2.5, Brake/Tire Wear PM2.5,
and Lead Emissions Inventory
0
5
10
15
20
25
30
35
40
1975 1980 1985 1990 1995 2000 2005 2010 2015 2020
Calendar Year
Emis
sion
s (to
ns/d
ay)
Brake and Tire WearGasoline Vehicle Lead EmissionsGasoline Vehicle Exhaust PMLight-Duty Diesel Exhaust PMLt-Hvy and Med-Hvy-Duty Diesel Exhaust PMDiesel School and Urban Bus Exhaust PMHeavy Heavy-Duty Diesel Exhaust PM

-36-
Off-Road Mobile Sources – The contribution of Diesels to South Coast Air Basin direct PM2.5 emissions from non-road sources is shown in Figure 5-14. Again, trends and contributions are similar to those observed for the statewide case, with the one exception being a somewhat larger contribution from marine Diesels.
Figure 5-14
South Coast Air BasinNon-Road PM2.5 Emission Inventory
0
5
10
15
20
25
1975 1980 1985 1990 1995 2000 2005 2010 2015 2020
Calendar Year
Emis
sion
s (to
ns/d
ay)
Diesel Agricultural EquipmentLocomotivesDiesel MarineDiesel - "Other" EquipmentOther Non-Road
-37-
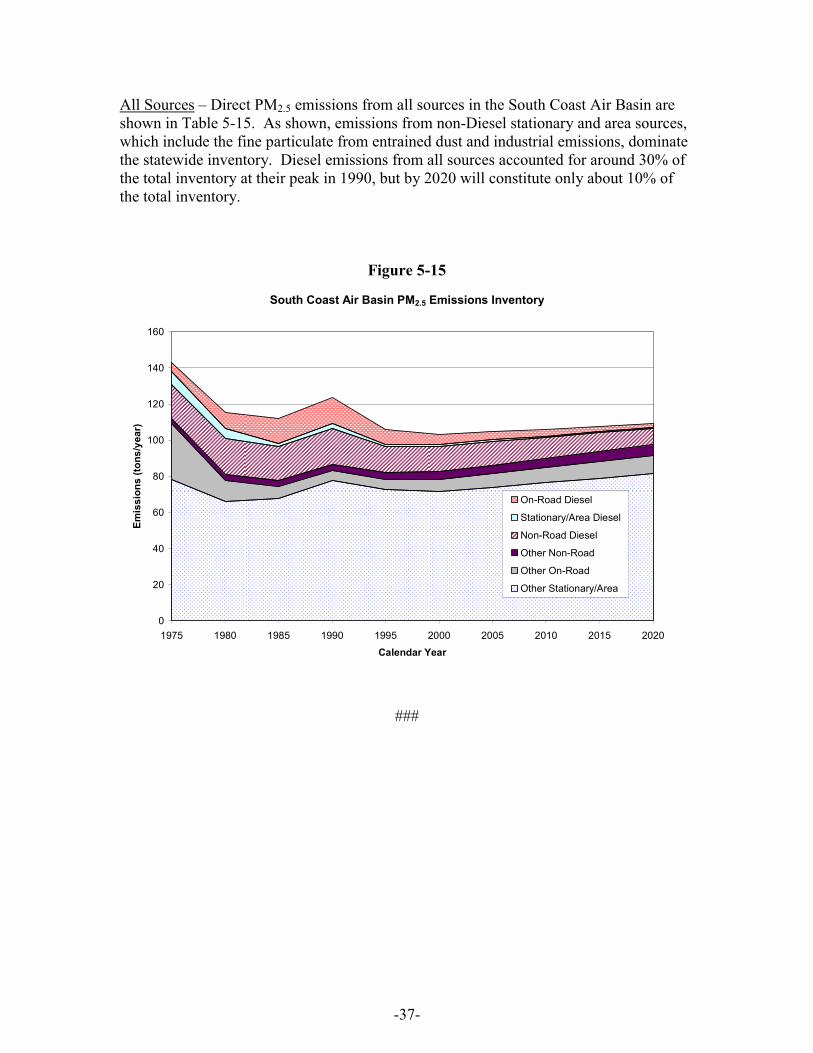
All Sources – Direct PM2.5 emissions from all sources in the South Coast Air Basin are shown in Table 5-15. As shown, emissions from non-Diesel stationary and area sources, which include the fine particulate from entrained dust and industrial emissions, dominate the statewide inventory. Diesel emissions from all sources accounted for around 30% of the total inventory at their peak in 1990, but by 2020 will constitute only about 10% of the total inventory.
Figure 5-15
South Coast Air Basin PM2.5 Emissions Inventory
0
20
40
60
80
100
120
140
160
1975 1980 1985 1990 1995 2000 2005 2010 2015 2020
Calendar Year
Emis
sion
s (to
ns/y
ear)
On-Road Diesel
Stationary/Area Diesel
Non-Road Diesel
Other Non-Road
Other On-Road
Other Stationary/Area
###

-38-
6. CONTRIBUTION OF DIESEL ENGINES TO EMISSIONS IN THE SAN JOAQUIN VALLEY AIR BASIN
In this section, the results of our assessment of the contribution of Diesel engines to San Joaquin Valley Air Basin ROG, NOx, and direct PM2.5 emissions are presented. As with the other sections of this report, emissions data are presented in the order of pollutant for ROG, NOx, and direct PM2.5 emissions, respectively, and then for each pollutant in order of source categories for stationary and area, on-road, non-road mobile, and finally all sources, respectively. Data are presented here in graphical form and, as noted in the previous section, in tabular form in Appendices A through C. 6.1 Diesel Contribution to San Joaquin Valley Air Basin ROG Emissions
Stationary and Area Sources – The contribution of Diesel engines to San Joaquin Valley Air Basin emissions of ROG in the stationary and area source classification is presented in Figure 6-1. As was the case with the other assessments presented above, Diesel engines make a negligible contribution to the ROG emissions inventory for this classification. Trends in Diesel engine ROG emissions in the stationary and area source classification are shown in Figure 6-2, where only those emissions have been plotted. As the figure shows, ROG emissions from Diesel engines in San Joaquin Valley Air Basin have been gradually decreasing since the 1990s.

-39-
Figure 6-1
San Joaquin Valley Air BasinMajor ROG Stationary/Area Source Categories vs. Diesel
0
100
200
300
400
500
600
700
800
900
1,000
1975 1980 1985 1990 1995 2000 2005 2010 2015 2020
Calendar Year
Emis
sion
s (to
ns/d
ay)
Total Area/Stationary Diesel IC Engines
Other Area/Stationary Sources
Consumer Products
Waste Disposal
Petroleum Production, Refining, & Marketing
Agricultural/Farming Processing & Operations
Figure 6-2
San Joaquin Valley Air BasinStationary/Area Source ROG Emissions from Diesel IC Engines
1.65
1.70
1.75
1.80
1.85
1.90
1.95
2.00
2.05
2.10
1975 1980 1985 1990 1995 2000 2005 2010 2015 2020
Calendar Year
Emis
sion
s (to
ns/d
ay)

-40-
On-Road Mobile Sources – The contribution of Diesels to San Joaquin Valley Air Basin ROG emissions from on-road mobile sources is presented in Figure 6-3. As shown in the figure, gasoline-fueled vehicles also dominate the ROG emission inventory from on-road mobile sources in the San Joaquin Valley to such a degree that the contribution of Diesel vehicles is barely discernable at any point over the study period.
Figure 6-3
San Joaquin Valley Air BasinOn-Road Motor Vehicle ROG Emissions Inventory
0
50
100
150
200
250
300
350
1975 1980 1985 1990 1995 2000 2005 2010 2015 2020
Calendar Year
Emis
sion
s (to
ns/d
ay)
Gasoline VehiclesLight-Duty Diesel Cars and TrucksLt-Hvy and Med-Hvy-Duty Diesel VehiclesDiesel School and Urban BusesHeavy Heavy-Duty Diesel Vehicles

-41-
In order to see the trends in Diesel ROG emissions over time, ROG emissions from only on-road Diesel engines are presented in Figure 6-4. As shown, ROG emissions from on-road Diesel engines in the San Joaquin Valley exhibit the same trends as observed for the statewide inventory and inventories in other areas.
Figure 6-4
San Joaquin Valley Air BasinOn-Road Diesel Vehicle ROG Emissions Inventory
0
1
2
3
4
5
6
7
8
9
10
1975 1980 1985 1990 1995 2000 2005 2010 2015 2020
Calendar Year
Emis
sion
s (to
ns/d
ay)
Light-Duty Diesel Cars and TrucksLt-Hvy and Med-Hvy-Duty Diesel VehiclesDiesel School and Urban BusesHeavy Heavy-Duty Diesel Vehicles

-42-
Off-Road Mobile Sources – The contribution of Diesels to San Joaquin Valley Air Basin ROG emissions from non-road sources is shown in Figure 6-5. Figure 6-5 is similar to those presented for the other assessments, with off-road Diesels accounting for as much as 30% of the ROG emissions in this classification during the 1990s and then dropping to about 15% by 2020.
Figure 6-5
San Joaquin Valley Air BasinNon-Road ROG Emission Inventory
0
10
20
30
40
50
60
70
1975 1980 1985 1990 1995 2000 2005 2010 2015 2020
Calendar Year
Emis
sion
s (to
ns/d
ay)
Diesel MarineLocomotivesDiesel - "Other" EquipmentDiesel Agricultural EquipmentOther Non-Road

-43-
All Sources – The contribution of all Diesel engines to total San Joaquin Valley Air Basin emissions of ROG can be seen in Figure 6-6. As one would expect based on the above, Diesels in California do not contribute significantly to San Joaquin Valley Air Basin ROG emissions.
Figure 6-6
San Joaquin Valley Air Basin ROG Emissions Inventory
0
200
400
600
800
1,000
1,200
1,400
1975 1980 1985 1990 1995 2000 2005 2010 2015 2020
Calendar Year
Emis
sion
s (to
ns/d
ay)
Stationary/Area Diesel
On-Road Diesel
Non-Road Diesel
Other Non-Road
Other Stationary/Area
Other On-Road

-44-
6.2 Diesel Contribution to San Joaquin Valley Air Basin NOx Emissions
Stationary and Area Sources – The contribution of Diesel engines to San Joaquin Valley Air Basin emissions of NOx in the stationary and area source classification is presented in Figure 6-7. Emissions are highlighted for the four most significant of the 21 categories listed in Section 3 of report, for Diesel engines, and for all other stationary and area sources. As shown below in Figure 6-7, NOx emissions from Diesels engines in this classification peaked around 1980 and decline continuously from 1980 through 2020. From 2000 through 2020, Diesels account for only 15% or less of NOx emissions in this source classification, but are the third largest category shown below in Figure 6-7, likely because of the widespread use of Diesel pumps in the San Joaquin Valley’s extensive agricultural industry.
Figure 6-7
San Joaquin Valley Air BasinMajor NOx Stationary/Area Source Categories vs. Diesel
0
50
100
150
200
250
300
350
400
1975 1980 1985 1990 1995 2000 2005 2010 2015 2020
Calendar Year
Emis
sion
s (to
ns/d
ay)
Total Area/Stationary Diesel IC Engines
Other Area/Stationary Sources
Agricultural/Farming Processing & Operations
Petroleum Production, Refining, & Marketing
Utilities/Cogeneration
Other Fuel Combustion

-45-
On-Road Mobile Sources – The contribution of Diesels to San Joaquin Valley Air Basin NOx emissions from on-road mobile sources is presented in Figure 6-8. Trends are generally the same as observed for other areas although the long-term relative contribution from Diesels is somewhat greater. By 2020, on-road Diesel NOx emissions will amount to 40 tons per day and will continue to account for about 60% of total on-road NOx.
Figure 6-8
San Joaquin Valley Air BasinOn-Road Motor Vehicle NOx Emissions Inventory
0
50
100
150
200
250
300
350
1975 1980 1985 1990 1995 2000 2005 2010 2015 2020
Calendar Year
Emis
sion
s (to
ns/d
ay)
Gasoline VehiclesLight-Duty Diesel Cars and TrucksLt-Hvy and Med-Hvy-Duty Diesel VehiclesDiesel School and Urban BusesHeavy Heavy-Duty Diesel Vehicles

-46-
Off-Road Mobile Sources – The contribution of Diesels to San Joaquin Valley Air Basin NOx emissions from non-road sources is presented in Figure 6-9. The situation in the San Joaquin Valley is different from other areas as the contribution of marine Diesels to non-road NOx is minimal and Diesel engines used in agricultural and other types of equipment dominate the inventory. However, emissions from these sources drop substantially over time from their peak in 1990. Again this reduction in emissions is due primarily to the imposition of more stringent standards for new Diesel engines. It should also be noted once again that because of the long life of Diesel engines and the fact that these standards will not begin to take effect until the end of this decade, reductions in off-road Diesel emissions due to existing regulations will continue to occur well beyond 2020.
Figure 6-9
San Joaquin Valley Air BasinNon-Road NOx Emission Inventory
0
50
100
150
200
250
1975 1980 1985 1990 1995 2000 2005 2010 2015 2020
Calendar Year
Emis
sion
s (to
ns/d
ay)
Diesel MarineDiesel Agricultural EquipmentDiesel - "Other" EquipmentOther Non-RoadLocomotives

-47-
All Sources – The contribution of all Diesel engines to total San Joaquin Valley Air Basin emissions of NOx from 1975 through 2020 can be seen in Figure 6-10. As shown, the total NOx emissions inventory peaked between 1980 and 1990, has declined continuously since that time, and will continue to decline through 2020. This decline is due primarily to reductions in NOx emissions from on-road gasoline and Diesel mobile sources and to a lesser extent to reductions in off-road Diesel NOx emissions. By 2020, San Joaquin Valley Air Basin NOx emissions will have dropped to less than one-half of those at the peak around 1990.
Figure 6-10
San Joaquin Valley Air Basin NOx Emissions Inventory
0
100
200
300
400
500
600
700
800
900
1975 1980 1985 1990 1995 2000 2005 2010 2015 2020
Calendar Year
Emis
sion
s (to
ns/d
ay)
Stationary/Area Diesel
On-Road Diesel
Non-Road Diesel
Other Non-Road
Other Stationary/Area
Other On-Road

-48-
6.3 Diesel Contribution to Direct PM2.5 Emissions
Stationary and Area Sources – The contribution of Diesel engines to San Joaquin Valley Air Basin direct PM2.5 emissions in the stationary and area source classification is presented in Figure 6-12. Again, emissions are highlighted for the four most significant of the 21 categories listed in Section 3 of report, Diesel engines, and all other stationary and area sources. As shown, Diesels contribute minimally to the total stationary and area source inventory prior to 2000 and are a negligible contribution after that, as was also observed for other areas.
Figure 6-11
San Joaquin Valley Air BasinMajor PM2.5 Stationary/Area Source Categories vs. Diesel
0.00
20.00
40.00
60.00
80.00
100.00
120.00
140.00
160.00
1975 1980 1985 1990 1995 2000 2005 2010 2015 2020
Calendar Year
Emis
sion
s (to
ns/d
ay)
Total Area/Stationary Diesel IC EnginesOther Area/Stationary SourcesResidential Heating/CookingAgricultural/Farming Processing & OperationsWaste DisposalDust (Construction, road, windblown)

-49-
Trends in Diesel engine PM2.5 emissions in the stationary and area source classification are shown in Table 6-12, where only those emissions have been plotted. As shown, Diesel PM2.5 emissions gradually decrease through 2020.
Figure 6-12
San Joaquin Valley Air BasinStationary/Area Source PM2.5 Emissions from Diesel IC Engines
0.0
0.2
0.4
0.6
0.8
1.0
1.2
1.4
1.6
1.8
1975 1980 1985 1990 1995 2000 2005 2010 2015 2020
Calendar Year
Emis
sion
s (to
ns/d
ay)

-50-
On-Road Mobile Sources – The contribution of Diesels to San Joaquin Valley Air Basin direct PM2.5 emissions from on-road mobile sources is presented in Figure 6-13. Trends are similar to those observed statewide and in other areas.
Figure 6-13
San Joaquin Valley Air BasinOn-Road Motor Vehicle Exhaust PM2.5, Brake/Tire Wear PM2.5,
and Lead Emissions Inventory
0
1
2
3
4
5
6
7
8
1975 1980 1985 1990 1995 2000 2005 2010 2015 2020
Calendar Year
Emis
sion
s (to
ns/d
ay)
Brake and Tire WearGasoline Vehicle Lead EmissionsGasoline Vehicle Exhaust PMLight-Duty Diesel Exhaust PMLt-Hvy and Med-Hvy-Duty Diesel Exhaust PMDiesel School and Urban Bus Exhaust PMHeavy Heavy-Duty Diesel Exhaust PM

-51-
Off-Road Mobile Sources – The contribution of Diesels to San Joaquin Valley Air Basin direct PM2.5 emissions from non-road sources is shown in Figure 6-14. As shown, non-road Diesel PM2.5 emissions have dominated and will continue to dominate the non-road PM2.5 inventory. Differences in the San Joaquin Valley inventory relative to other areas are similar to those discussed above with respect to NOx emissions. Diesel marine engines make only a negligible contribution and the inventory is dominated over most of the time period by engines used in agricultural and other types of equipment, although locomotive emissions account for a greater share of the inventory towards the end of the time period.
Figure 6-14
San Joaquin Valley Air BasinNon-Road PM2.5 Emission Inventory
0
2
4
6
8
10
12
14
16
1975 1980 1985 1990 1995 2000 2005 2010 2015 2020
Calendar Year
Emis
sion
s (to
ns/d
ay)
Diesel MarineLocomotivesDiesel - "Other" EquipmentDiesel Agricultural EquipmentOther Non-Road
-52-
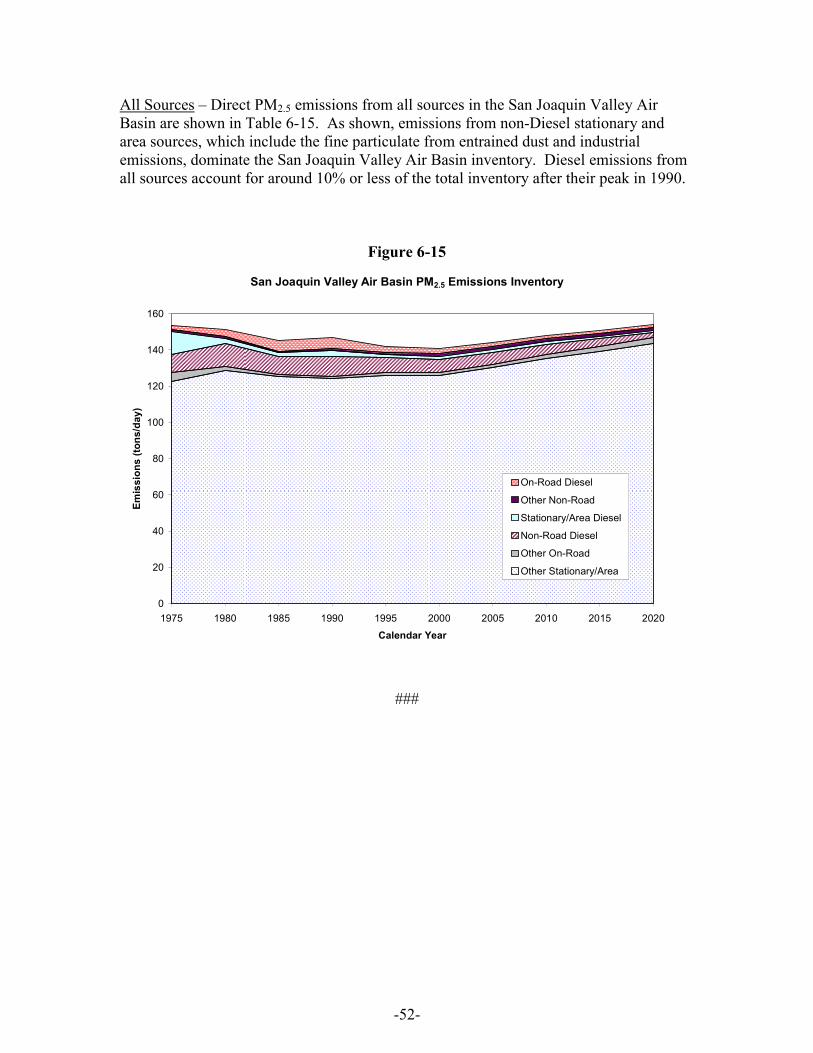
All Sources – Direct PM2.5 emissions from all sources in the San Joaquin Valley Air Basin are shown in Table 6-15. As shown, emissions from non-Diesel stationary and area sources, which include the fine particulate from entrained dust and industrial emissions, dominate the San Joaquin Valley Air Basin inventory. Diesel emissions from all sources account for around 10% or less of the total inventory after their peak in 1990.
Figure 6-15
San Joaquin Valley Air Basin PM2.5 Emissions Inventory
0
20
40
60
80
100
120
140
160
1975 1980 1985 1990 1995 2000 2005 2010 2015 2020
Calendar Year
Emis
sion
s (to
ns/d
ay)
On-Road Diesel
Other Non-Road
Stationary/Area Diesel
Non-Road Diesel
Other On-Road
Other Stationary/Area
###

-53-
7. CONTRIBUTION OF DIESEL ENGINES TO EMISSIONS IN THE SAN FRANCISCO BAY AREA AIR BASIN
In this section, the results of our assessment of the contribution of Diesel engines to San Francisco Bay Area Air Basin ROG, NOx, and direct PM2.5 emissions is presented. As with the other sections of this report, emissions data are presented in the order of pollutant for ROG, NOx, and direct PM2.5 emissions, respectively, and then for each pollutant in order of source categories for stationary and area, on-road, non-road mobile, and finally all sources, respectively. Data are presented here in graphical form and, as noted previously, in tabular form in Appendices A through C. 7.1 Diesel Contribution to San Francisco Bay Area Air Basin ROG Emissions
Stationary and Area Sources – The contribution of Diesel engines to San Francisco Bay Area Air Basin emissions of ROG in the stationary and area source classification is presented in Figure 7-1. As shown, results are similar to those for the other areas and the state with Diesels making a negligible contribution. Trends in Diesel engine ROG emissions in the stationary and area source classification are shown in Table 7-2 where only those emissions have been plotted. The peak here occurs in 2000 with emissions declining after that.

-54-
Figure 7-1
San Francisco Bay Area Air BasinMajor ROG Stationary/Area Source Categories vs. Diesel
0
100
200
300
400
500
600
1975 1980 1985 1990 1995 2000 2005 2010 2015 2020
Calendar Year
Emis
sion
s (to
ns/d
ay)
Total Area/Stationary Diesel IC Engines
Other Area/Stationary Sources
Cleaning & Surface Coatings
Architectural Coatings and Related Process Solvents
Petroleum Production, Refining, & Marketing
Consumer Products
Figure 7-2
San Francisco Bay Area Air BasinStationary/Area Source ROG Emissions from Diesel IC Engines
0.00
0.05
0.10
0.15
0.20
0.25
0.30
0.35
0.40
0.45
0.50
1975 1980 1985 1990 1995 2000 2005 2010 2015 2020
Calendar Year
Emis
sion
s (to
ns/d
ay)
-55-
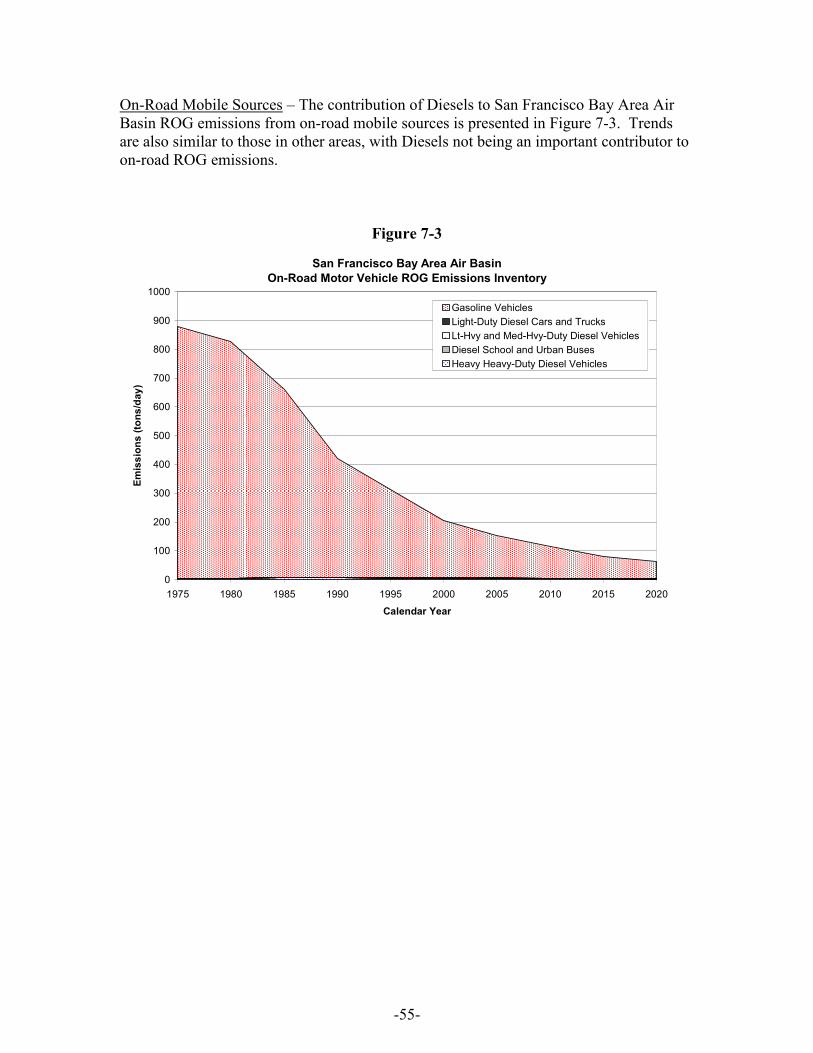
On-Road Mobile Sources – The contribution of Diesels to San Francisco Bay Area Air Basin ROG emissions from on-road mobile sources is presented in Figure 7-3. Trends are also similar to those in other areas, with Diesels not being an important contributor to on-road ROG emissions.
Figure 7-3
San Francisco Bay Area Air BasinOn-Road Motor Vehicle ROG Emissions Inventory
0
100
200
300
400
500
600
700
800
900
1000
1975 1980 1985 1990 1995 2000 2005 2010 2015 2020
Calendar Year
Emis
sion
s (to
ns/d
ay)
Gasoline VehiclesLight-Duty Diesel Cars and TrucksLt-Hvy and Med-Hvy-Duty Diesel VehiclesDiesel School and Urban BusesHeavy Heavy-Duty Diesel Vehicles

-56-
In order to see the trends in Diesel ROG emissions overtime, ROG emissions from only on-road Diesel engines are presented in Figure 7-4. Trends are again consistent with those seen in other areas.
Figure 7-4
San Francisco Bay Area Air BasinOn-Road Diesel Vehicle ROG Emissions Inventory
0
1
2
3
4
5
6
7
8
9
10
1975 1980 1985 1990 1995 2000 2005 2010 2015 2020
Calendar Year
Emis
sion
s (to
ns/d
ay)
Light-Duty Diesel Cars and TrucksLt-Hvy and Med-Hvy-Duty Diesel VehiclesDiesel School and Urban BusesHeavy Heavy-Duty Diesel Vehicles

-57-
Off-Road Mobile Sources – The contribution of Diesels to San Francisco Bay Area Air Basin ROG emissions from non-road sources is shown in Figure 7-5. As in other areas, off-road Diesels make a relatively significant contribution to total ROG in this classification and account for about 10% to 15% of the inventory over the study period. However, Diesel emissions, like those from other non-road sources, decline from their peak around 1990 continuously through 2020.
Figure 7-5
San Francisco Bay Area Air BasinNon-Road ROG Emissions Inventory
0
20
40
60
80
100
120
1975 1980 1985 1990 1995 2000 2005 2010 2015 2020Calendar Year
Emis
sion
s (to
ns/d
ay)
LocomotivesDiesel MarineDiesel Agricultural EquipmentDiesel - "Other" EquipmentOther Non-Road

-58-
All Sources – The contribution of all Diesel engines to total San Francisco Bay Area Air Basin emissions of ROG can be seen in Figure 7-6. As shown, the total ROG emissions inventory has declined dramatically and continuously since 1975 and will continue to decline through 2020 despite some projected growth in ROG emissions from non-Diesel stationary and area sources. As one would expect based on the previous figures, Diesels in California do not contribute significantly to San Francisco Bay Area Air Basin ROG emissions.
Figure 7-6
San Francisco Bay Area Air Basin ROG Emissions Inventory
0
200
400
600
800
1,000
1,200
1,400
1,600
1975 1980 1985 1990 1995 2000 2005 2010 2015 2020
Calendar Year
Emis
sion
s (to
ns/d
ay)
Stationary/Area Diesel
On-Road Diesel
Non-Road Diesel
Other Non-Road
Other Stationary/Area
Other On-Road

-59-
7.2 Diesel Contribution to San Francisco Bay Area Air Basin NOx Emissions
Stationary and Area Sources – The contribution of Diesel engines to San Francisco Bay Area Air Basin emissions of NOx in the stationary and area source classification is presented in Figure 7-7. Emissions are highlighted for the four most significant of the 21 categories listed in Section 3 of report, for Diesel engines, and for all other stationary and area sources. As shown, NOx emissions from Diesel engines in this classification have declined continuously from 1975, with the exception of an anomalous increase in several of the categories for calendar year 2000. From 1990 through 2020, Diesels account for only 5% or less of NOx emissions in this source classification and are smaller than those associated with any of the four identified source categories.
Figure 7-7
San Francisco Bay Area Air BasinMajor NOx Stationary/Area Source Categories vs. Diesel
0
50
100
150
200
250
300
1975 1980 1985 1990 1995 2000 2005 2010 2015 2020
Calendar Year
Emis
sion
s (to
ns/d
ay)
Total Area/Stationary Diesel IC Engines
Other Area/Stationary Sources
Other Fuel Combustion
Residential Heating/Cooking
Utilities/Cogeneration
Petroleum Production, Refining, & Marketing

-60-
On-Road Mobile Sources – The contribution of Diesels to San Francisco Bay Area Air Basin NOx emissions from on-road mobile sources is presented in Figure 7-8. Trends are similar to those shown for other areas. By 2005, Diesel NOx emissions decline to 135 tons per day and drop further to about 50 tons per day in 2020 but still account for about 50% of total on-road NOx.
Figure 7-8
San Francisco Bay Area Air BasinOn-Road Motor Vehicle NOx Emissions Inventory
0
100
200
300
400
500
600
700
1975 1980 1985 1990 1995 2000 2005 2010 2015 2020
Calendar Year
Emis
sion
s (to
ns/d
ay)
Gasoline VehiclesLight-Duty Diesel Cars and TrucksLt-Hvy and Med-Hvy-Duty Diesel VehiclesDiesel School and Urban BusesHeavy Heavy-Duty Diesel Vehicles

-61-
Off-Road Mobile Sources – The contribution of Diesels to San Francisco Bay Area Air Basin NOx emissions from non-road sources is presented in Figure7-9. As shown, non-road Diesel NOx emissions have dominated and will continue to dominate the non-road NOx inventory. Diesel emissions peaked around 1990 at about170 tons per day and are projected to decline to just over 120 tons per day in 2005 and to about 65 tons per day by 2020. Again, this reduction in emissions is due primarily to the imposition of more stringent standards for new Diesel engines and will continue beyond that point as new engines meeting those standards continue to enter the fleet.
Figure 7-9
San Francisco Bay Area Air BasinNon-Road NOx Emissions Inventory
0
50
100
150
200
250
1975 1980 1985 1990 1995 2000 2005 2010 2015 2020Calendar Year
Emis
sion
s (to
ns/d
ay)
Diesel Marine
Diesel Agricultural Equipment
Diesel - "Other" Equipment
Other Non-Road
Locomotives

-62-
All Sources – The contribution of all Diesel engines to total San Francisco Bay Area Air Basin emissions of NOx from 1975 through 2020 can be seen in Figure 7-10. As with other areas, by 2020, San Francisco Bay Area Air Basin NOx emissions will have dropped to less than one-half of those at the peak around 1990 and Diesels will account for about 50% of the inventory.
Figure 7-10
San Francisco Bay Area Air Basin NOx Emissions Inventory
0
200
400
600
800
1,000
1,200
1975 1980 1985 1990 1995 2000 2005 2010 2015 2020
Calendar Year
Emis
sion
s (to
ns/d
ay)
Stationary/Area Diesel
On-Road Diesel
Non-Road Diesel
Other Non-Road
Other Stationary/Area
Other On-Road

-63-
7.3 Diesel Contribution to Direct PM2.5 Emissions
Stationary and Area Sources – The contribution of Diesel engines to San Francisco Bay Area Air Basin direct PM2.5 emissions in the stationary and area source classification is presented in Figure 7-11. Again, emissions are highlighted for the four most significant of the 21 categories listed in Section 3 of report, for Diesel engines, and for all other stationary and area sources. As shown, Diesels contribute minimally to the total stationary and area source inventory over the entire period.
Figure 7-11
San Francisco Bay Area Air BasinMajor PM2.5 Stationary/Area Source Categories vs. Diesel
0
10
20
30
40
50
60
70
80
90
1975 1980 1985 1990 1995 2000 2005 2010 2015 2020
Calendar Year
Emis
sion
s (to
ns/d
ay)
Total Area/Stationary Diesel IC EnginesOther Area/Stationary SourcesIndustrial Process - MineralAgricultural/Farming Processing & OperationsDust (Construction, road, windblown)Residential Heating/Cooking
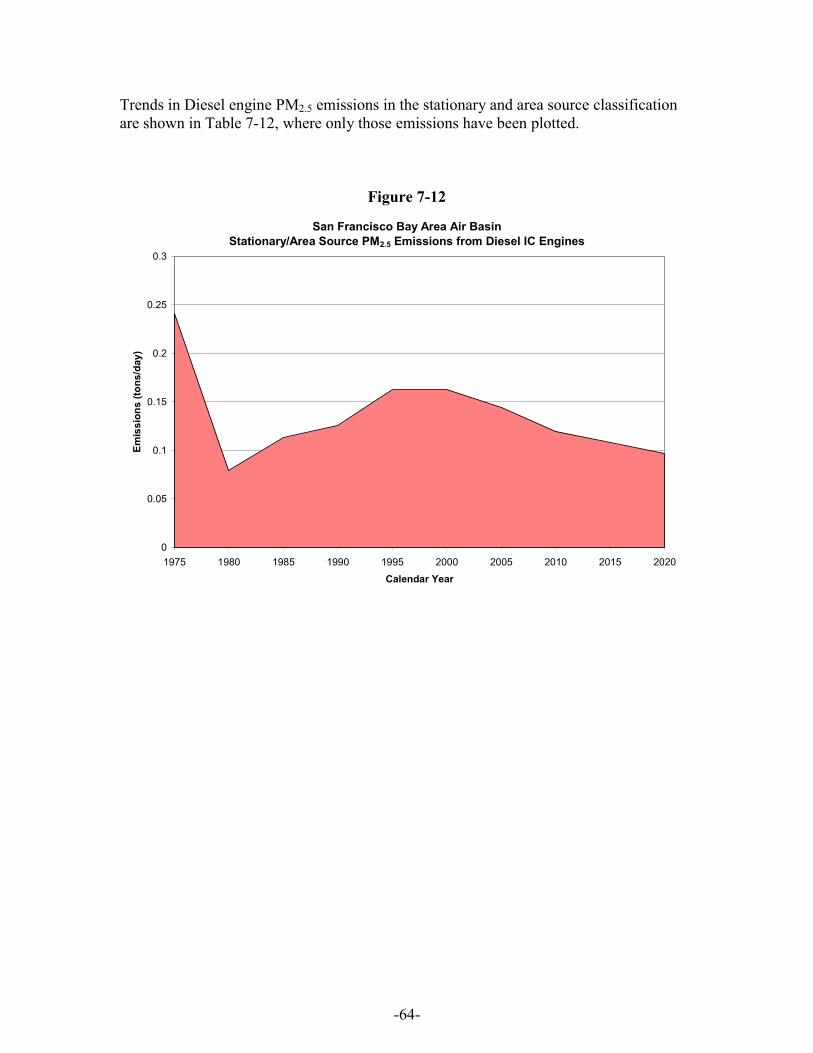
-64-
Trends in Diesel engine PM2.5 emissions in the stationary and area source classification are shown in Table 7-12, where only those emissions have been plotted.
Figure 7-12
San Francisco Bay Area Air BasinStationary/Area Source PM2.5 Emissions from Diesel IC Engines
0
0.05
0.1
0.15
0.2
0.25
0.3
1975 1980 1985 1990 1995 2000 2005 2010 2015 2020
Calendar Year
Emis
sion
s (to
ns/d
ay)

-65-
On-Road Mobile Sources – The contribution of Diesels to San Francisco Bay Area Air Basin direct PM2.5 emissions from on-road mobile sources is presented in Figure 7-13. As shown, the trends are similar to those observed for the state and other areas. Diesel PM2.5 emissions peaked at 7.3 tons per day in 1990 and then continuously decline through 2020, at which time they amount to 1.4 tons per day.
Figure 7-13
San Francisco Bay Area Air BasinOn-Road Motor Vehicle Exhaust PM2.5, Brake/Tire Wear PM2.5,
and Lead Emissions Inventory
0
2
4
6
8
10
12
14
16
18
20
1975 1980 1985 1990 1995 2000 2005 2010 2015 2020
Calendar Year
Emis
sion
s (to
ns/d
ay)
Brake and Tire Wear Gasoline Vehicle Lead EmissionsGasoline Vehicle Exhaust PMLight-Duty Diesel Exhaust PMLt-Hvy and Med-Hvy-Duty Diesel Exhaust PMDiesel School and Urban Bus Exhaust PMHeavy Heavy-Duty Diesel Exhaust PM

-66-
Off-Road Mobile Sources – The contribution of Diesels to San Francisco Bay Area Air Basin direct PM2.5 emissions from non-road sources is shown in Figure 7-14. As shown and as is consistent with what is observed in other areas, non-road Diesel PM2.5 emissions have dominated and will continue to dominate the non-road PM2.5 inventory. Diesel emissions peaked around 1990 at about 11 tons per day but are projected to decline to about 50 tons per day in 2005 and to about 4.5 tons per day by 2020.
Figure 7-14
San Francisco Bay Area Air BasinNon-Road PM2.5 Emissions Inventory
0
2
4
6
8
10
12
14
1975 1980 1985 1990 1995 2000 2005 2010 2015 2020Calendar Year
Emis
sion
s (to
ns/d
ay)
Diesel Trains
Diesel Agricultural Equipment
Diesel Marine
Diesel - "Other" Equipment
Other Non-Road
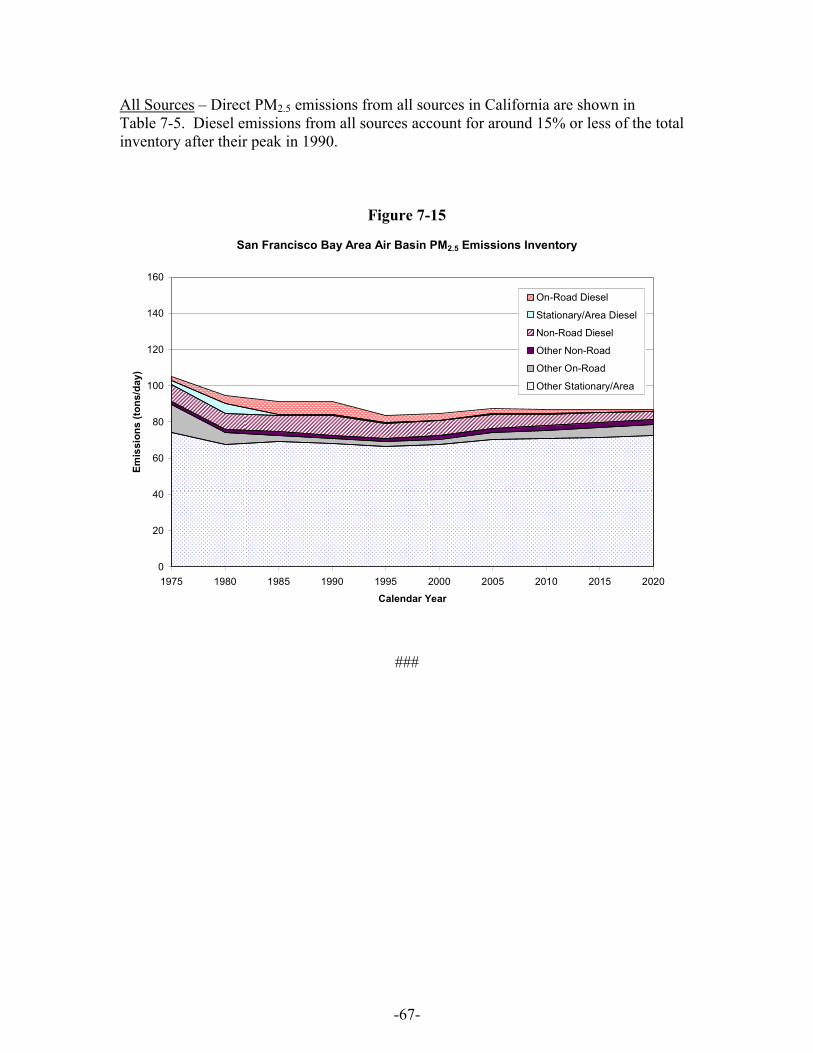
-67-
All Sources – Direct PM2.5 emissions from all sources in California are shown in Table 7-5. Diesel emissions from all sources account for around 15% or less of the total inventory after their peak in 1990.
Figure 7-15
San Francisco Bay Area Air Basin PM2.5 Emissions Inventory
0
20
40
60
80
100
120
140
160
1975 1980 1985 1990 1995 2000 2005 2010 2015 2020
Calendar Year
Emis
sion
s (to
ns/d
ay)
On-Road Diesel
Stationary/Area Diesel
Non-Road Diesel
Other Non-Road
Other On-Road
Other Stationary/Area
###

APPENDIX A
Stationary and Areas Source Emissions Data

A-1
Methodology Stationary and area source emissions inventory estimates for this study were based on the current Stationary and Area Source Inventories posted on the CARB website.* CARB defines stationary sources as large, fixed sources of air pollution (e.g., power plants, refineries, and factories), and area sources as those where the emissions are spread over a wide area (e.g., consumer products, fireplaces, road dust, and farming operations). These on-line inventories are available for calendar years 1975 through 2020, in five year increments, in varying degrees of detail. According to the CARB website, these data are based on Almanac Emission Projection Data published in 2004, and reflect the most current data provided to CARB. The most detailed available inventories, which were used in this analysis, include emissions estimates for hundreds of different emission source categories. The inventory includes ton per day estimates of total organic gases (TOG), reactive organic gases (ROG), carbon monoxide (CO), oxides of nitrogen (NOx), oxides of sulfur (SOx), total particulate matter (PM), particulate matter less than or equal to 10 microns in diameter (PM10), and particulate matter less than or equal to 2.5 microns in diameter (PM2.5), for each source category. Although this study focused on ROG, NOx, and PM2.5 emissions, totals for all emissions are also presented. Inventory estimates were prepared for California, the South Coast Air Basin, the San Joaquin Valley Air Basin, and the San Francisco Bay Area Air Basin from calendar year 1975 to 2020 in five-year increments. For purposes of this analysis, Sierra has developed a list of 22 area/stationary source categories, one of which is stationary Diesel engines. This list of categories is more illustrative than the aggregated CARB inventory (which includes only seven categories), and more manageable than the disaggregated inventory (which contains over 40 categories). Calendar year 1975 through 2020 emission summaries for these 22 categories have been prepared for California and for the three air basins of interest, and are presented below. Adjustments to the Area and Stationary Source Emissions Inventory As part of this effort, Sierra reviewed the stationary and area source emissions inventory in an attempt to determine if the impacts of all adopted control measures have been incorporated into the inventory estimates. We identified one rule that does not appear to have been accounted for in the latest inventories available on-line. This discrepancy was identified by reviewing emissions trends and identifying sources in which the trend lines were flatter that expected. The adjustments made to the stationary source inventory to account for this adopted regulation that has not yet been incorporated are summarized below. Stationary Compression-Ignition (CI) Engine ATCM – According to the staff report for this rulemaking,† implementation of this Air Toxic Control Measure (ATCM) will result in 2010 and 2020 NOx reductions of approximately 30% and 50%, and 2010 and 2020
* The inventories can be downloaded at http://www.arb.ca.gov/ei/emissiondata.htm. † http://www.arb.ca.gov/regact/statde/isor.pdf

A-2
PM reductions in the range of 50% and 70%, respectively, relative to a 2002 baseline. The precise reductions claimed in the staff report are shown below in Table A-1.
Table A-1 CARB’s Stationary CI Engine ATCM Reductions
PM (tpd) NOx (tpd)Stationary Diesel Engine Categories 2002 2010 2020 2002 2010 2020Prime Engines 0.8 0.4 0.2 13.8 8.5 4.9Emergency Standby Engines 0.3 0.2 0.1 6.4 5.6 4.6TOTAL 1.1 0.6 0.3 20.2 14.1 9.5Percent Reductions 45% 73% 30% 53% Note that the engine categories shown above in Table A-1 do not correspond precisely with emissions for the single “Stationary I.C. Engines - Diesel” category listed in the statewide emissions inventory. The emissions for calendar year 2002* in the inventory for NOx and PM2.5 are approximately 13.5 and 0.35 tons per day, respectively. These totals do not correspond either with the totals or with the two separate categories shown in Table A-1, but rather with some sort of mix of the two. Therefore, given that the inventory totals listed in the Stationary CI Engine staff report are obviously not based directly on emissions from any easily identifiable CARB Inventory categories, we adjusted the 2010 through 2020 “Stationary I.C. Engines - Diesel” category by the percent reductions shown in Table A-1, to reflect the fully implemented ATCM.† The air basin inventories were adjusted by applying the relative percentage reduction between CARB’s statewide 2010-2020 values, and the re-calculated values, which reflect the fully implemented ATCM. One complication regarding the air basin files was the lack of a specific “Stationary I.C. Engines - Diesel” category. In the absence of more precise data, the stationary CI engine inventory for the three air basins was assumed to be included in the “Diesel I.C. Reciprocating Engine” category, fractionally equivalent to the “Stationary I.C. Engines - Diesel” vs. “Diesel I.C. Reciprocating Engine” fraction from the statewide file. This statewide fraction was calculated for each calendar year and applied to the “Diesel I.C. Reciprocating Engine” total for each air basin for the corresponding year. Inventory Results The results of the inventory analysis described above are presented in the tables that follow for California, the South Coast Air Basin, the San Joaquin Valley Air Basin, and the San Francisco Bay Area Air Basin. Note that the Diesel emission total includes emissions from sources utilizing Diesel as well as distillate oil and residual oil.
* Because calendar year 2002 inventory figures are not available on the CARB website, it was interpolated from 2000 and 2005 data. † Note that the 2015 replacement data was calculated by interpolating between 2010 and 2020.

A-3
ROG (tons per day)1975 1980 1985 1990 1995 2000 2005 2010 2015 2020
Ag. Irrigation I.C. Engines 3.29 3.29 3.27 3.22 3.21 3.18 3.16 3.14 3.12 3.10I.C. Reciprocating Engines 0.88 0.11 0.51 1.59 1.11 0.71 0.77 0.81 0.85 0.88Stationary I.C. Engines 0.96 1.24 0.82 1.99 1.22 1.41 1.29 1.02 0.82 0.69
Total Diesel I.C. Engines 5.13 4.63 4.60 6.79 5.53 5.30 5.21 4.96 4.79 4.67Other Diesel Sources 2.82 8.49 2.70 2.47 1.61 0.78 0.76 0.75 0.78 0.81Other Area & Stationary Sources 2663.06 2557.25 2277.96 1712.93 1327.85 1289.03 1196.42 1230.61 1295.07 1362.75Total Area & Stationary Sources 2671.01 2570.38 2285.26 1722.19 1335.00 1295.10 1202.39 1236.32 1300.64 1368.23
NOx (tons per day)1975 1980 1985 1990 1995 2000 2005 2010 2015 2020
Ag. Irrigation I.C. Engines 31.87 32.00 31.86 32.45 32.40 31.78 30.12 26.97 22.87 17.91I.C. Reciprocating Engines 20.96 1.74 7.86 20.74 11.99 10.05 7.82 6.94 7.19 7.49Stationary I.C. Engines 13.49 27.14 10.02 15.85 12.81 14.50 12.86 9.43 6.98 5.22
Total Diesel I.C. Engines 66.33 60.88 49.74 69.04 57.20 56.33 50.80 43.34 37.04 30.61Other Diesel Sources 62.15 243.84 50.42 38.86 13.68 9.59 10.12 10.63 12.06 11.77Other Area & Stationary Sources 1180.06 1032.37 998.75 862.58 720.31 652.72 544.40 566.07 588.85 614.60Total Area & Stationary Sources 1308.54 1337.09 1098.91 970.48 791.19 718.65 605.32 620.04 637.95 656.98
PM2.5 (tons per day)1975 1980 1985 1990 1995 2000 2005 2010 2015 2020
Ag. Irrigation I.C. Engines 2.25 2.26 2.25 2.22 2.22 2.20 2.12 1.83 1.55 1.27I.C. Reciprocating Engines 2.81 0.10 0.54 1.61 1.07 0.68 0.68 0.71 0.74 0.77Stationary I.C. Engines 1.06 0.33 0.23 0.84 0.31 0.36 0.32 0.18 0.15 0.11
Total Diesel I.C. Engines 6.13 2.69 3.03 4.67 3.60 3.24 3.13 2.73 2.44 2.15Other Diesel Sources 23.32 26.34 6.70 4.91 1.94 1.31 0.99 1.02 1.04 1.07Other Area & Stationary Sources 675.40 642.07 645.48 670.24 648.59 650.96 670.50 692.60 710.28 730.46Total Area & Stationary Sources 704.85 671.10 655.20 679.83 654.13 655.51 674.62 696.35 713.76 733.69
California Statewide Stationary & Area Source ROG, NOx, and PM2.5 Emission Inventory

A-4
ROG Emissions (tons per day)Area/Stationary Source Category 1975 1980 1985 1990 1995 2000 2005 2010 2015 2020Adhesives & Sealants 48.10 55.72 61.17 63.41 26.16 24.40 19.90 20.32 20.69 21.39Agricultural/Farming Processing & Operations 195.52 198.79 203.86 193.82 208.03 205.54 200.24 200.89 209.09 217.35Architectural Coatings and Related Process Solvents 185.85 186.84 176.28 126.30 108.84 120.79 103.50 88.83 92.63 96.84Asphalt Paving/Roofing 35.94 46.45 30.05 36.18 29.27 31.29 32.77 33.60 34.27 34.81Cleaning & Surface Coatings 338.25 338.75 342.40 308.28 207.80 185.09 171.94 193.52 217.65 241.38Consumer Products 225.60 252.41 282.37 321.19 274.78 266.43 243.62 258.38 272.50 287.64Dust (Construction, road, windblown) 0.00 0.00 0.00 0.00 0.00 0.00 0.00 0.00 0.00 0.00Fires 0.48 0.54 0.57 0.66 0.66 0.66 0.70 0.73 0.76 0.80Industrial Process - Chemical 55.35 38.00 35.47 31.51 21.16 22.42 20.95 23.87 26.81 29.94Industrial Process - Electronics 0.06 0.12 0.07 0.07 0.74 0.77 0.81 0.84 0.87Industrial Process - Glass and Related Products 0.29 0.03 0.06 0.07 0.10 0.39 0.40 0.44 0.48 0.52Industrial Process - Metal 5.50 4.55 2.46 1.56 1.55 1.69 1.66 1.95 2.29 2.69Industrial Process - Mineral 3.96 3.20 3.07 5.38 5.90 5.67 6.27 6.91 7.59 8.29Industrial Process - Wood & Paper 2.26 3.68 5.05 4.69 2.73 3.05 3.18 3.46 3.81 4.14Other Fuel Combustion 27.92 60.22 30.01 27.47 22.33 22.42 23.38 24.80 25.75 26.76Other Miscellaneous & Industrial Processes 11.07 20.30 27.84 10.26 7.55 7.16 7.45 7.75 8.03 8.40Petroleum Production, Refining, & Marketing 1345.48 1172.77 893.97 388.10 221.01 200.65 166.52 167.18 171.51 177.03Printing 30.50 28.51 21.98 28.12 22.25 18.61 16.67 18.05 19.49 20.93Residential Heating/Cooking 46.82 52.59 56.81 62.87 60.05 60.93 61.99 62.52 63.86 65.76Utilities/Cogeneration 13.12 8.45 10.53 13.18 16.72 12.98 13.45 13.90 14.10 14.40Waste Disposal 93.82 93.95 96.61 92.28 92.51 98.88 101.81 103.44 103.68 103.59Other 0.01 0.01 0.01 0.01 0.01Total Area/Stationary Diesel IC Engines 5.13 4.63 4.60 6.79 5.53 5.30 5.21 4.96 4.79 4.67TOTAL 2,671 2,570 2,285 1,722 1,335 1,295 1,202 1,236 1,301 1,368
California Statewide Stationary & Area Source ROG Emission Inventory – 21 Categories

A-5
NOx Emissions (tons per day)Area/Stationary Source Category 1975 1980 1985 1990 1995 2000 2005 2010 2015 2020Adhesives & Sealants 0.00 0.00 0.00 0.00 0.00 0.00 0.00 0.00 0.00 0.00Agricultural/Farming Processing & Operations 27.28 23.71 19.74 22.01 23.10 14.42 14.20 14.14 14.16 14.16Architectural Coatings and Related Process Solvents 0.00 0.00 0.00 0.00 0.00 0.00 0.00 0.00 0.00 0.00Asphalt Paving/Roofing 0.00 0.00 0.00 0.00 0.00 0.00 0.00 0.00 0.00 0.00Cleaning & Surface Coatings 0.30 0.05 0.06 0.51 0.10 0.19 0.22 0.27 0.33 0.40Consumer Products 0.00 0.00 0.00 0.00 0.00 0.00 0.00 0.00 0.00 0.00Dust (Construction, road, windblown) 0.00 0.00 0.00 0.00 0.00 0.00 0.00 0.00 0.00 0.00Fires 0.16 0.18 0.19 0.23 0.23 0.23 0.24 0.25 0.26 0.27Industrial Process - Chemical 7.79 3.06 5.30 4.13 3.38 1.57 1.72 1.89 2.08 2.25Industrial Process - Electronics 0.00 0.00 0.00 0.02 0.02 0.02 0.02 0.02 0.03Industrial Process - Glass and Related Products 6.89 2.56 12.88 12.89 16.20 12.62 12.15 11.35 12.56 13.56Industrial Process - Metal 5.20 3.60 0.23 0.66 0.25 1.37 1.18 1.26 1.36 1.47Industrial Process - Mineral 58.10 20.55 26.70 71.79 56.91 58.67 63.93 68.92 74.50 79.68Industrial Process - Wood & Paper 1.50 2.98 2.46 3.68 2.84 1.98 2.08 2.30 2.53 2.77Other Fuel Combustion 383.35 640.84 382.97 308.98 242.60 207.54 210.81 223.10 237.46 247.68Other Miscellaneous & Industrial Processes 0.98 6.42 10.65 1.70 4.13 7.04 6.26 6.75 7.25 7.72Petroleum Production, Refining, & Marketing 302.71 322.69 344.85 255.89 184.04 142.06 75.05 76.66 78.19 80.29Printing 0.02 0.00 0.00 0.04 0.02 0.05 0.06 0.06 0.07 0.07Residential Heating/Cooking 70.36 75.99 77.28 74.55 73.29 73.25 74.33 69.42 68.52 69.90Utilities/Cogeneration 363.14 161.21 152.19 129.92 112.46 122.37 71.77 78.67 80.47 84.14Waste Disposal 14.43 12.38 13.67 14.48 14.43 18.71 20.29 21.39 21.55 21.71Other 0.22 0.23 0.25 0.27 0.29Total Area/Stationary Diesel IC Engines 66.33 60.88 49.74 69.04 57.20 56.33 50.80 43.34 37.04 30.61TOTAL 1,309 1,337 1,099 970 791 719 605 620 639 657
California Statewide Stationary & Area Source NOx Emission Inventory – 21 Categories

A-6
PM2.5 Emissions (tons per day)Area/Stationary Source Category 1975 1980 1985 1990 1995 2000 2005 2010 2015 2020Adhesives & Sealants 0.00 0.00 0.00 0.00 0.00 0.01 0.01 0.01 0.01 0.01Agricultural/Farming Processing & Operations 57.17 55.61 54.02 54.16 54.11 51.36 51.10 50.89 50.75 50.59Architectural Coatings and Related Process Solvents 0.00 0.00 0.00 0.00 0.00 0.00 0.00 0.00 0.00 0.00Asphalt Paving/Roofing 0.02 0.02 0.02 0.03 0.03 0.03 0.03 0.04 0.04 0.04Cleaning & Surface Coatings 0.50 0.68 0.83 0.81 0.27 0.22 0.26 0.31 0.37 0.43Consumer Products 0.00 0.00 0.00 0.00 0.00 0.00 0.00 0.00 0.00 0.00Dust (Construction, road, windblown) 221.72 243.17 263.17 284.18 277.52 283.34 293.67 305.47 316.08 327.65Fires 0.77 0.84 0.88 1.00 1.02 1.03 1.09 1.14 1.19 1.25Industrial Process - Chemical 17.05 5.20 5.30 4.55 4.38 3.16 3.71 4.20 4.63 5.02Industrial Process - Electronics 0.00 0.00 0.01 0.00 0.03 0.03 0.03 0.03 0.03Industrial Process - Glass and Related Products 2.68 0.59 1.17 1.12 1.85 1.48 1.60 1.75 1.95 2.12Industrial Process - Metal 6.27 6.57 1.66 2.41 1.48 0.78 0.90 1.04 1.21 1.40Industrial Process - Mineral 47.67 24.22 26.81 31.25 19.00 19.53 21.29 22.98 24.62 26.25Industrial Process - Wood & Paper 8.81 11.24 9.15 10.52 6.64 6.11 6.35 6.88 7.55 8.22Other Fuel Combustion 58.23 67.64 32.74 21.47 13.35 16.98 16.67 19.13 20.25 21.82Other Miscellaneous & Industrial Processes 8.56 4.04 6.23 2.55 11.78 5.94 6.24 6.52 6.80 7.42Petroleum Production, Refining, & Marketing 16.43 15.59 10.70 12.22 7.39 6.76 6.59 6.77 6.97 7.21Printing 0.06 0.03 0.03 0.11 0.06 0.05 0.05 0.05 0.06 0.06Residential Heating/Cooking 97.92 109.93 118.25 128.63 124.45 126.00 127.98 128.98 131.69 135.53Utilities/Cogeneration 37.88 5.46 4.26 8.43 11.68 9.83 10.30 11.39 11.90 12.39Waste Disposal 117.00 117.57 116.96 111.72 115.52 119.64 123.61 126.02 125.20 124.06Other 0.02 0.02 0.03 0.03 0.03Total Area/Stationary Diesel IC Engines 6.13 2.69 3.03 4.67 3.60 3.24 3.13 2.73 2.44 2.15 TOTAL 705 671 655 680 654 656 675 696 714 734
California Statewide Stationary & Area Source PM2.5 Emission Inventory – 21 Categories

A-7
ROG (tons per day)1975 1980 1985 1990 1995 2000 2005 2010 2015 2020
Ag. Irrigation I.C. Engines 0.11 0.10 0.12 0.10 0.11 0.11 0.10 0.10 0.10 0.10I.C. Reciprocating Engines 0.61 0.03 0.24 1.22 0.50 0.31 0.36 0.39 0.43 0.46Stationary I.C. Engines 0.66 0.33 0.38 1.53 0.55 0.61 0.60 0.50 0.42 0.36
Total Diesel I.C. Engines 1.38 0.46 0.73 2.84 1.17 1.02 1.06 0.99 0.94 0.92Other Diesel Sources 0.72 4.83 0.87 0.86 0.20 0.11 0.11 0.07 0.07 0.07Other Area & Stationary Sources 762.44 641.10 656.15 547.55 366.15 385.15 306.20 305.24 325.73 348.74Total Area & Stationary Sources 764.54 646.39 657.75 551.25 367.52 386.28 307.37 306.30 326.74 349.73
NOx (tons per day)1975 1980 1985 1990 1995 2000 2005 2010 2015 2020
Ag. Irrigation I.C. Engines 1.62 1.47 1.71 1.33 1.58 1.54 1.44 1.23 1.02 0.79I.C. Reciprocating Engines 15.50 0.26 3.50 14.55 4.29 3.77 2.76 2.12 2.16 2.21Stationary I.C. Engines 9.98 4.04 4.47 11.12 4.58 5.44 4.55 2.89 2.30 1.88
Total Diesel I.C. Engines 27.10 5.76 9.68 27.01 10.44 10.76 8.75 6.24 5.48 4.88Other Diesel Sources 12.04 57.62 7.36 5.46 0.76 0.80 0.77 0.83 0.90 0.98Other Area & Stationary Sources 319.77 262.68 272.75 159.05 146.88 109.94 90.71 85.18 85.09 87.71Total Area & Stationary Sources 358.91 326.06 289.79 191.51 158.08 121.49 100.23 92.25 91.47 93.57
PM2.5 (tons per day)1975 1980 1985 1990 1995 2000 2005 2010 2015 2020
Ag. Irrigation I.C. Engines 0.09 0.09 0.10 0.09 0.11 0.10 0.09 0.071 0.06 0.05I.C. Reciprocating Engines 2.18 0.02 0.25 1.33 0.49 0.31 0.32 0.348 0.37 0.40Stationary I.C. Engines 0.82 0.07 0.11 0.69 0.15 0.17 0.15 0.090 0.07 0.05
Total Diesel I.C. Engines 3.09 0.18 0.46 2.10 0.75 0.58 0.56 0.509 0.50 0.49Other Diesel Sources 4.17 5.48 0.75 0.62 0.07 0.07 0.06 0.06 0.06 0.06Other Area & Stationary Sources 78.20 66.08 67.71 77.84 72.55 71.72 73.96 76.59 78.95 81.68Total Area & Stationary Sources 85.46 71.74 68.92 80.57 73.36 72.37 74.58 77.159 79.51 82.24
South Coast Air Basin Stationary & Area Source ROG, NOx, and PM2.5 Emissions Inventory

A-8
ROG Emissions (tons per day)Area/Stationary Source Category 1975 1980 1985 1990 1995 2000 2005 2010 2015 2020Adhesives & Sealants 23.68 34.06 39.12 34.10 5.58 7.32 3.10 3.79 4.58 5.54Agricultural/Farming Processing & Operations 36.78 36.89 39.81 24.10 24.92 27.71 19.51 19.08 19.40 19.75Architectural Coatings and Related Process Solvents 61.98 69.08 72.92 37.03 36.73 50.59 38.97 24.46 25.88 27.31Asphalt Paving/Roofing 0.35 0.53 0.52 0.59 0.49 0.69 0.78 0.86 0.92 0.96Cleaning & Surface Coatings 171.55 173.70 200.31 139.79 77.88 64.54 48.04 53.34 61.75 71.92Consumer Products 102.84 111.17 123.26 140.38 119.49 114.63 102.67 107.69 112.58 117.48Dust (Construction, road, windblown) 0.00 0.00 0.00 0.00 0.00 0.00 0.00 0.00 0.00 0.00Fires 0.21 0.22 0.23 0.23 0.23 0.23 0.24 0.25 0.26 0.27Industrial Process - Chemical 9.14 12.03 19.11 18.01 7.24 12.42 9.63 11.25 13.05 15.11Industrial Process - Electronics 0.00 0.09 0.03 0.00 0.00 0.00 0.00 0.00 0.00Industrial Process - Glass and Related Products 0.16 0.03 0.02 0.03 0.04 0.06 0.04 0.05 0.05 0.06Industrial Process - Metal 4.29 2.07 1.25 1.26 0.78 1.24 1.20 1.45 1.76 2.13Industrial Process - Mineral 0.66 0.55 0.48 0.59 2.13 2.33 2.61 2.93 3.28 3.68Industrial Process - Wood & Paper 0.01 0.00 0.00 0.03 0.01 0.01 0.01 0.01 0.01 0.01Other Fuel Combustion 14.49 20.54 16.59 13.70 11.71 12.05 12.51 12.94 13.37 13.86Other Miscellaneous & Industrial Processes 2.73 5.85 22.09 4.17 0.58 0.60 0.64 0.68 0.73 0.78Petroleum Production, Refining, & Marketing 295.43 146.21 93.05 103.46 48.32 61.87 37.63 36.93 37.62 38.44Printing 21.99 17.66 8.86 14.89 8.58 6.49 4.75 5.21 5.66 6.14Residential Heating/Cooking 3.85 4.51 4.70 4.86 4.61 4.82 5.10 5.37 5.69 6.00Utilities/Cogeneration 7.01 5.52 6.56 5.12 9.70 6.70 6.91 6.94 6.97 6.97Waste Disposal 6.01 5.32 8.06 6.05 7.34 10.95 11.96 12.08 12.25 12.42Total Area/Stationary Diesel IC Engines 1.38 0.46 0.73 2.84 1.17 1.02 1.06 0.99 0.94 0.92TOTAL 765 646 658 551 368 386 307 306 327 350
South Coast Air Basin Stationary & Area Source ROG Emissions Inventory – 21 Categories

A-9
NOx Emissions (tons per day)Area/Stationary Source Category 1975 1980 1985 1990 1995 2000 2005 2010 2015 2020Adhesives & Sealants 0.00 0.00 0.00 0.00 0.00 0.00 0.00 0.00 0.00 0.00Agricultural/Farming Processing & Operations 2.25 2.15 1.13 1.50 1.21 0.75 0.65 0.67 0.69 0.71Architectural Coatings and Related Process Solvents 0.00 0.00 0.00 0.00 0.00 0.00 0.00 0.00 0.00 0.00Asphalt Paving/Roofing 0.00 0.00 0.00 0.00 0.00 0.00 0.00 0.00 0.00 0.00Cleaning & Surface Coatings 0.28 0.05 0.06 0.47 0.09 0.18 0.20 0.25 0.31 0.37Consumer Products 0.00 0.00 0.00 0.00 0.00 0.00 0.00 0.00 0.00 0.00Dust (Construction, road, windblown) 0.00 0.00 0.00 0.00 0.00 0.00 0.00 0.00 0.00 0.00Fires 0.06 0.07 0.07 0.07 0.07 0.07 0.08 0.08 0.09 0.09Industrial Process - Chemical 0.11 1.41 1.60 0.48 0.54 0.02 0.01 0.01 0.01 0.01Industrial Process - Electronics 0.00 0.00 0.00 0.02 0.02 0.02 0.02 0.02 0.02Industrial Process - Glass and Related Products 3.42 2.56 7.48 4.47 2.98 1.56 1.32 1.33 1.33 1.33Industrial Process - Metal 5.18 3.41 0.15 0.54 0.12 0.56 0.38 0.40 0.42 0.45Industrial Process - Mineral 4.52 5.47 4.43 4.50 10.92 7.75 7.49 7.88 8.33 8.83Industrial Process - Wood & Paper 0.01 0.00 0.00 0.01 0.00 0.00 0.00 0.00 0.00 0.00Other Fuel Combustion 101.94 162.09 92.44 48.89 38.95 28.18 21.18 20.72 21.42 22.70Other Miscellaneous & Industrial Processes 0.69 0.48 9.49 1.20 0.99 0.01 0.01 0.02 0.02 0.04Petroleum Production, Refining, & Marketing 74.09 59.84 84.02 47.17 42.13 22.28 16.19 16.24 16.24 16.24Printing 0.01 0.00 0.00 0.03 0.00 0.00 0.00 0.00 0.00 0.00Residential Heating/Cooking 30.06 33.57 33.00 26.72 25.35 25.88 27.27 22.05 20.67 21.37Utilities/Cogeneration 106.56 48.52 43.74 26.13 21.33 17.22 9.95 9.51 9.53 9.53Waste Disposal 2.63 0.69 2.50 2.31 2.92 6.27 6.73 6.83 6.91 7.00Total Area/Stationary Diesel IC Engines 27.10 5.76 9.68 27.01 10.44 10.76 8.75 6.24 5.48 4.88TOTAL 359 326 290 192 158 121 100 92 91 94
South Coast Air Basin Stationary & Area Source NOx Emissions Inventory – 21 Categories

A-10
PM2.5 Emissions (tons per day)Area/Stationary Source Category 1975 1980 1985 1990 1995 2000 2005 2010 2015 2020Adhesives & Sealants 0.00 0.00 0.00 0.00 0.00 0.00 0.00 0.00 0.00 0.00Agricultural/Farming Processing & Operations 1.37 1.10 1.18 2.03 2.04 1.11 1.09 1.06 1.05 1.05Architectural Coatings and Related Process Solvents 0.00 0.00 0.00 0.00 0.00 0.00 0.00 0.00 0.00 0.00Asphalt Paving/Roofing 0.01 0.01 0.01 0.02 0.01 0.02 0.02 0.02 0.02 0.02Cleaning & Surface Coatings 0.44 0.54 0.75 0.69 0.11 0.14 0.17 0.21 0.25 0.31Consumer Products 0.00 0.00 0.00 0.00 0.00 0.00 0.00 0.00 0.00 0.00Dust (Construction, road, windblown) 22.12 26.15 31.16 43.01 41.61 36.54 36.58 37.86 38.72 39.87Fires 0.37 0.39 0.39 0.40 0.40 0.41 0.42 0.43 0.44 0.45Industrial Process - Chemical 0.82 1.68 0.92 0.82 0.21 0.23 0.25 0.28 0.32 0.35Industrial Process - Electronics 0.00 0.00 0.01 0.00 0.00 0.00 0.00 0.00 0.00Industrial Process - Glass and Related Products 0.36 0.58 0.65 0.39 0.24 0.26 0.28 0.30 0.33 0.36Industrial Process - Metal 3.95 4.85 0.75 1.42 0.39 0.49 0.59 0.72 0.86 1.04Industrial Process - Mineral 6.20 3.45 1.61 3.13 1.67 1.93 2.12 2.34 2.57 2.82Industrial Process - Wood & Paper 0.46 0.73 0.79 0.58 0.54 0.65 0.65 0.68 0.72 0.75Other Fuel Combustion 10.20 11.75 2.95 3.16 2.51 2.77 3.00 3.27 3.54 3.85Other Miscellaneous & Industrial Processes 0.55 1.13 3.87 0.51 0.10 0.09 0.10 0.10 0.10 0.11Petroleum Production, Refining, & Marketing 7.06 5.83 5.96 6.24 2.51 3.10 2.63 2.64 2.64 2.65Printing 0.01 0.00 0.00 0.02 0.00 0.00 0.00 0.00 0.00 0.00Residential Heating/Cooking 9.32 11.06 11.37 12.16 11.29 11.86 12.47 13.07 13.74 14.40Utilities/Cogeneration 16.60 1.06 1.25 1.57 4.78 2.09 2.28 2.30 2.33 2.33Waste Disposal 2.50 1.27 4.85 2.29 4.20 10.10 11.38 11.37 11.37 11.38Total Area/Stationary Diesel IC Engines 3.09 0.18 0.46 2.10 0.75 0.58 0.56 0.51 0.50 0.49 TOTAL 85 72 69 81 73 72 75 77 80 82
South Coast Air Basin Stationary & Area Source PM2.5 Emissions Inventory – 21 Categories

A-11
ROG (tons per day)1975 1980 1985 1990 1995 2000 2005 2010 2015 2020
Ag. Irrigation I.C. Engines 1.99 1.96 1.93 1.91 1.88 1.85 1.82 1.79 1.77 1.74I.C. Reciprocating Engines 0.03 0.01 0.04 0.05 0.07 0.05 0.05 0.05 0.04 0.04Stationary I.C. Engines 0.03 0.10 0.07 0.06 0.08 0.10 0.08 0.06 0.04 0.03
Total Diesel I.C. Engines 2.04 2.08 2.04 2.01 2.03 2.00 1.96 1.90 1.86 1.81Other Diesel Sources 0.31 0.15 0.14 0.39 0.11 0.20 0.21 0.22 0.23 0.23Other Area & Stationary Sources 808.98 868.35 720.31 347.59 260.68 248.10 246.32 256.90 269.94 283.56Total Area & Stationary Sources 811.34 870.58 722.49 349.99 262.82 250.30 248.48 259.02 272.02 285.61
NOx (tons per day)1975 1980 1985 1990 1995 2000 2005 2010 2015 2020
Ag. Irrigation I.C. Engines 18.58 18.31 18.05 17.78 17.51 17.24 16.67 16.67 12.41 9.61I.C. Reciprocating Engines 1.30 0.10 0.64 0.82 0.94 0.99 0.65 0.65 0.56 0.54Stationary I.C. Engines 0.83 1.57 0.82 0.63 1.01 1.43 1.06 1.06 0.60 0.46
Total Diesel I.C. Engines 20.71 19.99 19.50 19.22 19.47 19.67 18.38 18.38 13.57 10.61Other Diesel Sources 18.78 8.75 5.94 12.36 3.38 3.04 3.48 3.48 4.01 4.13Other Area & Stationary Sources 228.48 323.87 317.64 264.77 205.23 153.37 128.55 128.55 136.00 140.02Total Area & Stationary Sources 267.97 352.61 343.08 296.35 228.08 176.08 150.41 150.41 153.59 154.76
PM2.5 (tons per day)1975 1980 1985 1990 1995 2000 2005 2010 2015 2020
Ag. Irrigation I.C. Engines 1.28 1.26 1.24 1.22 1.20 1.19 1.14 0.97 0.81 0.66I.C. Reciprocating Engines 0.24 0.02 0.03 0.03 0.06 0.05 0.04 0.04 0.04 0.04Stationary I.C. Engines 0.09 0.05 0.01 0.01 0.02 0.03 0.02 0.01 0.01 0.00
Total Diesel I.C. Engines 1.61 1.33 1.29 1.26 1.28 1.26 1.20 1.03 0.86 0.70Other Diesel Sources 11.17 1.49 0.89 2.04 0.40 0.37 0.43 0.45 0.49 0.50Other Area & Stationary Sources 122.44 128.67 125.11 124.35 126.16 125.87 130.15 135.40 139.32 143.61Total Area & Stationary Sources 135.22 131.49 127.29 127.65 127.83 127.50 131.78 136.87 140.67 144.81
San Joaquin Valley Air Basin Stationary & Area Source ROG, NOx, and PM2.5 Emissions Inventory

A-12
ROG Emissions (tons per day)Area/Stationary Source Category 1975 1980 1985 1990 1995 2000 2005 2010 2015 2020Adhesives & Sealants 0.71 1.21 1.42 1.56 1.16 0.72 0.68 0.63 0.58 0.54Agricultural/Farming Processing & Operations 74.20 77.64 79.78 86.75 97.08 94.71 100.48 104.88 112.43 119.96Architectural Coatings and Related Process Solvents 12.49 13.37 14.12 11.64 11.76 11.97 10.66 11.14 11.63 12.29Asphalt Paving/Roofing 1.02 1.57 1.79 2.31 2.08 2.24 2.35 2.39 2.42 2.45Cleaning & Surface Coatings 22.61 20.49 17.72 41.29 27.07 24.19 16.68 19.22 21.78 23.94Consumer Products 18.99 21.88 25.16 29.24 25.89 25.18 24.16 26.72 29.18 32.03Dust (Construction, road, windblown) 0.00 0.00 0.00 0.00 0.00 0.00 0.00 0.00 0.00 0.00Fires 0.05 0.06 0.06 0.07 0.08 0.09 0.09 0.10 0.10 0.11Industrial Process - Chemical 1.54 3.38 3.59 4.64 1.71 2.61 3.12 3.55 3.95 4.30Industrial Process - Electronics 0.02Industrial Process - Glass and Related Products 0.00 0.00 0.00 0.03 0.06 0.34 0.36 0.39 0.43 0.47Industrial Process - Metal 0.14 0.15 0.14 0.18 0.19 0.34 0.35 0.36 0.40 0.42Industrial Process - Mineral 0.52 0.68 0.33 0.41 0.34 0.33 0.37 0.41 0.45 0.48Industrial Process - Wood & Paper 0.00 0.00 0.00 0.00 0.01 0.00 0.00 0.00 0.00 0.00Other Fuel Combustion 1.93 2.71 3.05 3.21 3.01 3.25 3.57 3.71 3.83 3.86Other Miscellaneous & Industrial Processes 0.01 0.06 0.01 0.02 0.02 0.37 0.38 0.39 0.40 0.46Petroleum Production, Refining, & Marketing 634.07 684.44 530.99 126.04 51.54 42.84 43.93 43.46 42.50 42.10Printing 2.59 2.38 3.41 2.39 1.77 1.55 1.65 1.80 1.98 2.15Residential Heating/Cooking 4.66 5.28 5.98 6.59 6.56 6.74 6.93 7.10 7.31 7.64Utilities/Cogeneration 0.08 0.06 0.17 0.33 0.30 0.97 0.98 1.12 1.13 1.19Waste Disposal 33.67 33.15 32.72 31.27 30.14 29.87 29.78 29.76 29.67 29.39Total Area/Stationary Diesel IC Engines 2.04 2.08 2.04 2.01 2.03 2.00 1.96 1.90 1.86 1.81TOTAL 811 871 722 350 263 250 248 259 272 286
San Joaquin Valley Air Basin Stationary & Area Source ROG Emissions Inventory – 21 Categories

A-13
NOx Emissions (tons per day)Area/Stationary Source Category 1975 1980 1985 1990 1995 2000 2005 2010 2015 2020Adhesives & Sealants 0.00 0.00 0.00 0.00 0.00 0.00 0.00 0.00 0.00 0.00Agricultural/Farming Processing & Operations 15.02 14.89 12.53 15.13 15.42 10.95 10.81 10.70 10.65 10.59Architectural Coatings and Related Process Solvents 0.00 0.00 0.00 0.00 0.00 0.00 0.00 0.00 0.00 0.00Asphalt Paving/Roofing 0.00 0.00 0.00 0.00 0.00 0.00 0.00 0.00 0.00 0.00Cleaning & Surface Coatings 0.00 0.00 0.00 0.00 0.00 0.00 0.00 0.00 0.00 0.00Consumer Products 0.00 0.00 0.00 0.00 0.00 0.00 0.00 0.00 0.00 0.00Dust (Construction, road, windblown) 0.00 0.00 0.00 0.00 0.00 0.00 0.00 0.00 0.00 0.00Fires 0.02 0.02 0.02 0.02 0.03 0.03 0.03 0.03 0.03 0.03Industrial Process - Chemical 0.70 0.24 0.09 0.11 0.14 0.26 0.30 0.34 0.37 0.40Industrial Process - Electronics 0.00Industrial Process - Glass and Related Products 0.00 0.00 0.00 6.26 12.02 9.63 9.21 8.23 9.16 9.95Industrial Process - Metal 0.00 0.00 0.00 0.00 0.07 0.06 0.06 0.07 0.08 0.08Industrial Process - Mineral 1.85 2.28 5.47 5.58 2.29 2.22 2.39 2.61 2.88 3.12Industrial Process - Wood & Paper 0.00 0.00 0.00 0.00 0.00 0.00 0.00 0.00 0.00 0.00Other Fuel Combustion 90.05 141.94 111.07 91.76 64.40 62.57 64.61 67.77 71.98 74.23Other Miscellaneous & Industrial Processes 0.01 0.86 0.00 0.01 0.00 0.16 0.17 0.17 0.17 0.18Petroleum Production, Refining, & Marketing 122.87 157.26 175.47 138.28 80.19 29.18 16.43 15.84 15.49 15.51Printing 0.00 0.00 0.00 0.00 0.00 0.00 0.00 0.00 0.00 0.00Residential Heating/Cooking 7.90 8.13 8.27 7.03 6.92 6.67 6.40 6.25 6.23 6.21Utilities/Cogeneration 3.94 2.17 5.89 8.22 22.47 30.05 17.05 18.17 18.50 19.44Waste Disposal 4.90 4.85 4.77 4.72 4.66 4.63 4.57 4.52 4.46 4.41Total Area/Stationary Diesel IC Engines 20.71 19.99 19.50 19.22 19.47 19.67 18.38 18.38 13.57 10.61TOTAL 268 353 343 296 228 176 150 153 154 155
San Joaquin Valley Air Basin Stationary & Area Source NOx Emissions Inventory – 21 Categories

A-14
PM2.5 Emissions (tons per day)Area/Stationary Source Category 1975 1980 1985 1990 1995 2000 2005 2010 2015 2020Adhesives & Sealants 0.00 0.00 0.00 0.00 0.00 0.00 0.00 0.00 0.00 0.00Agricultural/Farming Processing & Operations 24.65 23.10 22.67 22.90 23.19 21.87 21.64 21.45 21.27 21.09Architectural Coatings and Related Process Solvents 0.00 0.00 0.00 0.00 0.00 0.00 0.00 0.00 0.00 0.00Asphalt Paving/Roofing 0.00 0.00 0.00 0.00 0.00 0.00 0.00 0.00 0.00 0.00Cleaning & Surface Coatings 0.00 0.00 0.00 0.00 0.02 0.00 0.01 0.01 0.01 0.01Consumer Products 0.00 0.00 0.00 0.00 0.00 0.00 0.00 0.00 0.00 0.00Dust (Construction, road, windblown) 28.21 31.79 35.45 39.66 41.83 44.69 48.23 52.90 56.35 59.87Fires 0.08 0.09 0.11 0.12 0.14 0.15 0.16 0.18 0.19 0.20Industrial Process - Chemical 1.17 0.78 0.93 1.37 2.17 1.70 2.12 2.47 2.77 3.02Industrial Process - Electronics 0.00Industrial Process - Glass and Related Products 0.34 0.02 0.18 0.35 1.35 0.95 1.01 1.10 1.23 1.33Industrial Process - Metal 0.01 0.04 0.01 0.11 0.17 0.09 0.09 0.11 0.12 0.13Industrial Process - Mineral 3.86 3.10 2.15 2.56 1.81 1.70 1.86 2.01 2.16 2.30Industrial Process - Wood & Paper 0.69 0.82 0.60 0.48 0.27 0.25 0.25 0.28 0.31 0.38Other Fuel Combustion 15.34 15.88 10.03 3.66 1.99 1.93 2.13 2.23 2.35 2.41Other Miscellaneous & Industrial Processes 1.93 0.49 0.32 0.15 0.06 0.29 0.29 0.33 0.35 0.71Petroleum Production, Refining, & Marketing 3.65 1.65 0.88 2.14 1.42 0.91 1.05 1.04 1.05 1.10Printing 0.04 0.03 0.03 0.07 0.05 0.04 0.05 0.05 0.06 0.06Residential Heating/Cooking 8.77 10.01 11.32 12.40 12.10 12.58 13.04 13.43 13.90 14.59Utilities/Cogeneration 1.59 0.12 0.43 1.02 1.67 1.54 1.79 1.94 2.01 2.17Waste Disposal 43.29 42.24 40.88 39.40 38.31 37.55 36.86 36.32 35.68 34.75Total Area/Stationary Diesel IC Engines 1.61 1.33 1.29 1.26 1.28 1.26 1.20 1.03 0.86 0.70 TOTAL 135.2 131.5 127.3 127.7 127.8 127.5 131.8 136.9 140.7 144.8
San Joaquin Valley Air Basin Stationary & Area Source PM2.5 Emissions Inventory – 21 Categories

A-15
ROG (tons per day)1975 1980 1985 1990 1995 2000 2005 2010 2015 2020
Ag. Irrigation I.C. Engines 0.05 0.05 0.05 0.05 0.05 0.05 0.05 0.05 0.05 0.05I.C. Reciprocating Engines 0.07 0.01 0.09 0.13 0.17 0.14 0.12 0.11 0.11 0.10Stationary I.C. Engines 0.08 0.17 0.15 0.16 0.19 0.27 0.20 0.14 0.11 0.08
Total Diesel I.C. Engines 0.21 0.24 0.30 0.35 0.42 0.46 0.38 0.31 0.27 0.24Other Diesel Sources 1.11 0.83 0.77 0.45 0.79 0.15 0.16 0.17 0.18 0.19Other Area & Stationary Sources 476.82 458.49 355.63 259.32 221.55 195.88 180.42 180.38 184.52 188.74Total Area & Stationary Sources 478.14 459.55 356.70 260.12 222.76 196.49 180.95 180.86 184.97 189.17
NOx (tons per day)1975 1980 1985 1990 1995 2000 2005 2010 2015 2020
Ag. Irrigation I.C. Engines 0.44 0.44 0.44 0.44 0.44 0.44 0.43 0.39 0.33 0.26I.C. Reciprocating Engines 1.69 0.17 1.38 2.02 2.08 1.99 1.39 1.27 1.26 1.26Stationary I.C. Engines 1.09 2.62 1.76 1.54 2.22 2.87 2.29 1.73 1.34 1.07
Total Diesel I.C. Engines 3.22 3.23 3.58 4.00 4.73 5.29 4.11 3.38 2.93 2.58Other Diesel Sources 9.81 54.32 8.06 4.07 1.46 0.54 0.26 0.28 0.28 0.28Other Area & Stationary Sources 231.63 165.18 140.66 143.16 116.59 158.64 88.12 93.39 97.62 102.09Total Area & Stationary Sources 244.66 222.73 152.30 151.23 122.78 164.48 92.49 97.05 100.83 104.96
PM2.5 (tons per day)1975 1980 1985 1990 1995 2000 2005 2010 2015 2020
Ag. Irrigation I.C. Engines 0.03 0.03 0.03 0.03 0.03 0.03 0.03 0.02 0.02 0.02I.C. Reciprocating Engines 0.15 0.01 0.06 0.06 0.10 0.09 0.08 0.08 0.07 0.07Stationary I.C. Engines 0.06 0.04 0.03 0.03 0.03 0.05 0.04 0.02 0.01 0.01
Total Diesel I.C. Engines 0.24 0.08 0.11 0.13 0.16 0.16 0.14 0.12 0.11 0.10Other Diesel Sources 2.18 5.48 0.53 0.40 0.11 0.04 0.07 0.07 0.07 0.07Other Area & Stationary Sources 74.25 67.34 69.04 68.44 66.28 67.33 70.37 70.69 71.65 72.79Total Area & Stationary Sources 76.67 72.89 69.69 68.96 66.55 67.54 70.58 70.88 71.83 72.96
San Francisco Bay Area Air Basin Stationary & Area Source ROG, NOx, and PM2.5 Emissions Inventory

A-16
ROG Emissions (tons per day)Area/Stationary Source Category 1975 1980 1985 1990 1995 2000 2005 2010 2015 2020Adhesives & Sealants 16.53 10.70 7.40 12.91 10.26 8.28 8.83 9.17 9.22 9.32Agricultural/Farming Processing & Operations 12.80 11.92 11.71 11.98 11.78 11.21 11.43 11.46 11.60 11.77Architectural Coatings and Related Process Solvents 77.99 66.81 53.93 45.85 28.06 23.43 21.97 20.31 20.73 21.17Asphalt Paving/Roofing 10.62 10.19 7.50 2.59 1.72 1.67 1.73 1.81 1.87 1.93Cleaning & Surface Coatings 66.24 51.93 37.54 35.02 26.76 21.02 21.13 22.08 22.76 23.46Consumer Products 50.51 54.82 59.12 63.42 53.42 52.18 46.88 48.20 49.32 50.35Dust (Construction, road, windblown) 0.00 0.00 0.00 0.00 0.00 0.00 0.00 0.00 0.00 0.00Fires 0.12 0.14 0.14 0.21 0.20 0.18 0.19 0.19 0.20 0.20Industrial Process - Chemical 5.57 2.43 6.10 4.57 3.46 3.71 3.83 4.07 4.27 4.50Industrial Process - Electronics 0.06 0.02 0.04 0.03 0.69 0.72 0.75 0.78 0.80Industrial Process - Glass and Related Products 0.00 0.00 0.00 0.00 0.00 0.00 0.00 0.00 0.00 0.00Industrial Process - Metal 1.04 1.17 1.04 0.06 0.56 0.11 0.11 0.12 0.13 0.14Industrial Process - Mineral 0.14 0.07 0.22 0.71 0.53 0.53 0.57 0.60 0.62 0.65Industrial Process - Wood & Paper 0.10 0.18 0.03 0.06 0.01 0.00 0.00 0.00 0.00 0.00Other Fuel Combustion 2.48 19.08 2.44 2.26 2.34 1.53 1.61 1.69 1.78 1.87Other Miscellaneous & Industrial Processes 5.38 1.87 4.48 3.07 4.20 4.86 4.95 5.04 5.12 5.21Petroleum Production, Refining, & Marketing 210.19 210.49 146.56 58.03 60.94 43.77 34.07 33.10 34.72 36.43Printing 3.11 3.16 3.62 4.46 6.22 4.29 3.69 3.87 4.01 4.17Residential Heating/Cooking 10.76 10.95 11.14 12.83 10.40 10.64 10.62 10.23 10.22 10.22Utilities/Cogeneration 0.94 0.28 0.56 0.57 0.36 0.50 0.70 0.74 0.75 0.75Waste Disposal 3.32 3.13 2.85 1.17 1.09 7.44 7.54 7.12 6.60 5.98Other 0.00 0.00 0.00 0.00 0.00Total Area/Stationary Diesel IC Engines 0.21 0.24 0.30 0.35 0.42 0.46 0.38 0.31 0.27 0.24
TOTAL 478 460 357 260 223 196 181 181 185 189
San Francisco Bay Area Air Basin Stationary & Area Source ROG Emissions Inventory – 21 Categories

A-17
NOx Emissions (tons per day)Area/Stationary Source Category 1975 1980 1985 1990 1995 2000 2005 2010 2015 2020Adhesives & Sealants 0.00 0.00 0.00 0.00 0.00 0.00 0.00 0.00 0.00 0.00Agricultural/Farming Processing & Operations 3.10 1.43 1.98 1.57 1.49 0.32 0.34 0.36 0.39 0.42Architectural Coatings and Related Process Solvents 0.00 0.00 0.00 0.00 0.00 0.00 0.00 0.00 0.00 0.00Asphalt Paving/Roofing 0.00 0.00 0.00 0.00 0.00 0.00 0.00 0.00 0.00 0.00Cleaning & Surface Coatings 0.01 0.00 0.00 0.01 0.00 0.01 0.01 0.01 0.01 0.01Consumer Products 0.00 0.00 0.00 0.00 0.00 0.00 0.00 0.00 0.00 0.00Dust (Construction, road, windblown) 0.00 0.00 0.00 0.00 0.00 0.00 0.00 0.00 0.00 0.00Fires 0.05 0.06 0.06 0.08 0.08 0.07 0.08 0.08 0.08 0.08Industrial Process - Chemical 5.71 0.93 1.24 2.46 1.49 0.09 0.10 0.10 0.11 0.12Industrial Process - Electronics 0.00 0.00 0.00 0.00 0.00 0.00 0.00 0.00 0.00Industrial Process - Glass and Related Products 0.00 0.00 0.00 0.00 0.03 0.00 0.00 0.00 0.00 0.00Industrial Process - Metal 0.01 0.00 0.06 0.02 0.01 0.21 0.23 0.25 0.27 0.29Industrial Process - Mineral 1.17 2.21 1.96 0.08 0.87 2.74 2.95 3.17 3.38 3.61Industrial Process - Wood & Paper 0.00 0.45 0.00 0.00 0.00 0.00 0.00 0.00 0.00 0.00Other Fuel Combustion 54.71 99.57 35.18 40.12 29.99 19.18 19.33 20.51 21.76 23.10Other Miscellaneous & Industrial Processes 0.12 0.13 0.43 0.32 0.23 2.32 0.93 0.99 1.05 1.11Petroleum Production, Refining, & Marketing 64.07 55.91 49.20 44.62 43.54 78.02 30.80 32.74 34.82 37.03Printing 0.01 0.00 0.00 0.01 0.01 0.01 0.01 0.01 0.01 0.01Residential Heating/Cooking 13.66 14.47 15.33 18.69 19.33 19.02 18.90 19.34 19.72 20.08Utilities/Cogeneration 97.51 44.10 42.81 37.67 20.38 36.46 13.83 15.17 15.34 15.51Waste Disposal 1.32 0.25 0.48 1.58 0.59 0.55 0.69 0.72 0.74 0.76Other 0.18 0.19 0.21 0.22 0.24Total Area/Stationary Diesel IC Engines 3.22 3.23 3.58 4.00 4.73 5.29 4.11 3.38 2.93 2.58TOTAL 245 223 152 151 123 164 92 97 101 105
San Francisco Bay Area Air Basin Stationary & Area Source NOx Emissions Inventory – 21 Categories

A-18
PM2.5 Emissions (tons per day)Area/Stationary Source Category 1975 1980 1985 1990 1995 2000 2005 2010 2015 2020Adhesives & Sealants 0.00 0.00 0.00 0.00 0.00 0.00 0.00 0.00 0.00 0.00Agricultural/Farming Processing & Operations 9.30 9.47 9.35 9.23 9.31 9.22 9.23 9.24 9.24 9.25Architectural Coatings and Related Process Solvents 0.00 0.00 0.00 0.00 0.00 0.00 0.00 0.00 0.00 0.00Asphalt Paving/Roofing 0.00 0.00 0.00 0.00 0.00 0.00 0.00 0.00 0.00 0.00Cleaning & Surface Coatings 0.00 0.10 0.00 0.00 0.00 0.00 0.00 0.00 0.00 0.00Consumer Products 0.00 0.00 0.00 0.00 0.00 0.00 0.00 0.00 0.00 0.00Dust (Construction, road, windblown) 16.77 18.59 20.85 20.18 19.31 21.96 23.43 24.00 24.55 25.20Fires 0.14 0.16 0.16 0.22 0.22 0.19 0.21 0.21 0.22 0.22Industrial Process - Chemical 2.12 1.00 1.92 1.72 1.55 0.73 0.78 0.83 0.86 0.90Industrial Process - Electronics 0.00 0.00 0.00 0.00 0.02 0.03 0.03 0.03 0.03Industrial Process - Glass and Related Products 0.29 0.00 0.15 0.28 0.26 0.03 0.03 0.04 0.04 0.04Industrial Process - Metal 2.05 1.45 0.58 0.69 0.82 0.10 0.11 0.12 0.12 0.13Industrial Process - Mineral 5.12 3.44 4.58 3.22 3.34 3.41 3.62 3.78 3.91 4.06Industrial Process - Wood & Paper 0.14 0.72 0.17 0.07 0.02 0.03 0.03 0.03 0.03 0.03Other Fuel Combustion 4.38 7.73 1.82 1.80 1.27 1.47 1.61 1.72 1.84 1.90Other Miscellaneous & Industrial Processes 3.06 1.37 1.56 1.42 2.61 2.35 2.46 2.39 2.29 2.17Petroleum Production, Refining, & Marketing 3.52 3.26 3.31 2.76 2.93 2.27 2.43 2.60 2.77 2.96Printing 0.00 0.00 0.00 0.00 0.00 0.00 0.00 0.00 0.00 0.00Residential Heating/Cooking 22.74 23.20 23.67 25.54 23.15 23.30 23.19 22.34 22.36 22.41Utilities/Cogeneration 6.21 1.72 0.81 1.00 0.78 1.39 1.97 2.11 2.12 2.16Waste Disposal 0.58 0.59 0.63 0.69 0.79 0.89 1.32 1.33 1.34 1.34Other 0.00 0.00 0.00 0.00 0.00Total Area/Stationary Diesel IC Engines 0.24 0.08 0.11 0.13 0.16 0.16 0.14 0.12 0.11 0.10 TOTAL 77 73 70 69 67 68 71 71 72 73
San Francisco Bay Area Air Basin Stationary & Area Source PM2.5 Emissions Inventory – 21 Categories

APPENDIX B On-Road Mobile Source Emissions Data

B-1
Methodology Emissions inventory estimates for on-road motor vehicles prepared for this study were based on the latest version of CARB’s EMFAC2002 emissions model (version 2.2, April 23, 2003).* That model calculates daily emissions of reactive organic gases (ROG), carbon monoxide (CO), oxides of nitrogen (NOx), particulate matter less than or equal to 10 microns in diameter (PM10), particulate matter less than or equal to 2.5 microns in diameter (PM2.5), lead, oxides of sulfur (SOx), and carbon dioxide (CO2). This study focused on ROG, NOx, and PM2.5 emissions, although gasoline vehicle lead emissions are also presented. EMFAC2002 calculates emissions for 12 different vehicle classes and generates separate estimates for gasoline and Diesel vehicles. For this effort, ton per day (tpd) emissions estimates were compiled for the following vehicle classes: • Diesel passenger cars and light-duty trucks (PC/LDT) up to 8,500 lbs. GVWR; • Diesel light-heavy-duty vehicles (Light HDV) from 8,501 to 14,000 lbs. GVWR; • Diesel medium-heavy-duty vehicles (Medium HDV) from 14,001 to 33,000 lbs.
GVWR; • Diesel heavy-heavy-duty vehicles (Heavy HDVs) over 33,000 lbs. GVWR; • Diesel buses (school and transit); • Gasoline passenger cars (PC); • Gasoline light-duty trucks (LDT) up to 8,500 lbs. GVWR; • Gasoline heavy-duty vehicles over 8,500 lbs. GVWR; and • Motorcycles (MC). Inventory estimates were prepared for California, the South Coast Air Basin, the San Joaquin Valley Air Basin, and the San Francisco Bay Area Air Basin from calendar year 1975 to 2020 in five-year increments. All estimates were prepared based on an average annual day. For gasoline vehicles, Diesel PC/LDTs, and Diesel Light HDVs, the EMFAC2002 estimates were used without adjustment. For Diesel Medium HDVs, Heavy HDVs, and Buses, adjustments were made to account for airborne toxic control measures (ATCMs) that have been adopted by CARB but have not been incorporated into the latest public version of EMFAC2002. The specific ATCMs that were accounted for in this study included (1) fleet rules for solid waste collection vehicles;† (2) school bus idle
* The EMFAC2002 emissions model can be downloaded at http://www.arb.ca.gov/msei/on-road/latest_version.htm. † “Proposed Diesel Particulate Matter Control Measure for On-Road Heavy-Duty Residential and Commercial Solid Waste Collection Vehicles,” Supplemental Staff Report, California Air Resources Board, August 8, 2003.

B-2
restrictions;* and (3) commercial Diesel vehicle idle restrictions.† The methodologies used to estimate the emissions impacts of these measures are discussed below. • Fleet Rules for Solid Waste Collection Vehicles - In the staff report prepared for
this regulation, CARB staff presented statewide estimates of the emission reductions for this measure. These reductions were applied directly to the statewide heavy-heavy duty Diesel vehicle inventory. Air basin specific estimates were prepared by assuming the percentage reduction observed in the statewide estimates would apply to each air basin.
• School Bus Idle Restrictions - Emission reduction estimates for this measure were
not generated by CARB staff. As a result, Sierra assumed that Diesel school bus idle emissions (which are calculated separately by EMFAC2002) would be reduced by 50%.
• Commercial Diesel Vehicle Idle Restrictions - This measure contains two primary
components: (1) restrictions on “general” idling, and (2) restrictions on “hoteling.” The restriction on general idling was estimated by CARB staff to reduce emissions from medium HDVs by 3.5 tpd NOx and 0.11 tpd PM in 2005, which reflects a 2.7% and 3.2% reduction in NOx and PM, respectively, for this vehicle class. Emissions from Diesel heavy HDVs were estimated to be reduced by 10.6 tpd NOx and 0.33 tpd PM in 2005, which reflects a 2.2% and 3.6% reduction in NOx and PM, respectively, for this vehicle class. These percentage reductions were applied to the air basin inventories to account for this component of this ATCM in 2005. For the 2010, 2015, and 2020 inventories, the same percentage reductions were applied. The emissions reductions from hoteling restrictions were estimated by first adding hoteling emissions to the baseline inventory and then reducing those emissions to be consistent with the emission reduction estimates prepared by CARB staff. (Note that emissions from hoteling are not in the baseline EMFAC2002 inventory.) Statewide uncontrolled hoteling emissions were presented in the CARB staff report for calendar years 2000, 2005, and 2009. For pre-2000 estimates, it was assumed that hoteling emissions would reflect the same percentage of the NOx and PM heavy HDV inventory as observed for 2000 (6.4% for NOx and 6.3% for PM). For the 2010 and later estimates, it was assumed that uncontrolled hoteling emissions would reflect the same percentage of the NOx and PM heavy HDV inventory as observed for 2009 (12.2% for NOx and 11.3% for PM). The impact of the rule was estimated by assuming a 77% reduction in NOx and 53% reduction in PM from hoteling operations for the 2010 and later calendar year estimates. These percentage reductions are consistent with the estimates prepared by CARB staff for 2009.
* “Airborne Toxic Control Measure to Limit School Bus Idling and Idling at Schools,” Staff Report, California Air Resources Board, October 2002. † “Airborne Toxic Control Measure to Limit Diesel-Fueled Commercial Motor Vehicle Idling,” Staff Report, July 2004.

B-3
Inventory Results The results of the inventory analysis described above are presented in the tables that follow for California, the South Coast Air Basin, the San Joaquin Valley Air Basin, and the San Francisco Bay Area Air Basin. In addition to ROG, NOx, PM2.5 and lead emissions estimates, trends in vehicle population and vehicle miles traveled are also presented in the summary tables.

B-4
Fuel VehicleType Class 1975 1980 1985 1990 1995 2000 2005 2010 2015 2020Diesel PC/LDT 34,693 124,290 342,547 330,078 289,906 266,302 257,133 188,367 129,463 80,597
Light HDV 3,038 6,945 24,179 48,703 47,938 60,151 76,728 85,275 92,225 99,629Medium HDV 6,676 17,095 49,799 104,827 128,647 160,716 194,561 225,451 253,407 281,598Heavy HDV 41,664 75,925 129,974 166,161 157,423 158,204 180,178 201,072 219,671 237,683Bus 9,353 11,338 14,995 22,871 27,975 34,027 37,694 42,697 47,391 52,452
Gasoline PC 6,927,630 7,538,040 9,553,760 10,600,460 11,411,061 12,419,999 13,841,362 15,216,920 16,444,920 17,684,048LDT 3,546,026 3,214,225 3,787,756 5,928,968 6,953,944 8,098,187 9,036,181 10,151,308 11,196,796 12,257,910HDV 265,163 391,559 610,629 665,704 659,564 637,238 676,240 740,970 818,793 921,745MC 602,717 664,846 759,487 682,279 562,860 388,518 397,680 414,575 435,974 468,519
Total 11,436,960 12,044,263 15,273,126 18,550,051 20,239,318 22,223,342 24,697,757 27,266,635 29,638,640 32,084,181
Vehicle PopulationCalendar Year
Fuel VehicleType Class 1975 1980 1985 1990 1995 2000 2005 2010 2015 2020Diesel PC/LDT 1,226 5,064 13,649 11,722 9,462 8,401 7,808 5,146 3,248 1,868
Light HDV 129 347 1,441 3,027 2,632 3,469 4,668 4,681 4,599 4,721Medium HDV 354 1,082 3,127 6,697 7,666 9,157 10,548 11,461 12,203 13,038Heavy HDV 6,959 11,834 19,590 26,210 24,384 23,145 26,032 30,479 34,456 37,244Bus 885 1,031 1,318 1,805 2,144 2,554 2,743 3,082 3,385 3,718
Gasoline PC 226,168 242,848 324,250 385,144 409,851 434,976 479,954 527,416 566,633 605,148LDT 121,826 107,928 128,885 214,192 251,492 289,351 314,147 347,273 379,773 413,462HDV 10,203 14,386 20,183 24,078 20,239 22,427 23,969 24,568 25,196 26,674MC 4,329 4,589 5,239 4,296 3,340 2,591 3,013 3,256 3,422 3,644
Total 372,079 389,109 517,682 677,171 731,210 796,071 872,882 957,362 1,032,915 1,109,517
Vehicle Miles Traveled (VMT/1000)Calendar Year
Statewide Vehicle Population and Vehicle Miles Traveled Estimates

B-5
Fuel VehicleType Class 1975 1980 1985 1990 1995 2000 2005 2010 2015 2020Diesel PC/LDT 0.85 2.99 5.20 4.13 2.77 1.81 1.27 0.74 0.42 0.22
Light HDV 0.05 0.13 0.46 1.00 1.15 1.20 1.77 1.64 1.31 1.01Medium HDV 0.16 0.50 1.47 2.91 3.30 3.36 3.65 3.39 2.87 2.45Heavy HDV 14.49 25.66 39.42 37.89 27.08 21.87 20.14 15.04 12.05 10.30Bus 1.05 1.22 1.53 1.94 2.26 2.66 2.65 2.72 2.66 2.54
Gasoline PC 2,457.03 2,263.66 1,937.35 1,120.34 811.33 530.03 325.10 206.85 136.25 98.67LDT 1,120.54 848.16 750.25 653.04 524.75 374.56 268.11 212.57 166.26 132.05HDV 236.16 292.96 357.56 324.85 211.15 113.74 78.82 59.30 47.26 39.27MC 79.41 77.77 78.92 60.46 44.55 23.65 19.87 16.97 15.39 15.48
Total 3,909.74 3,513.05 3,172.16 2,206.56 1,628.34 1,072.88 721.38 519.22 384.47 301.99
Reactive Organic Gases (Tons Per Day)Calendar Year
Fuel VehicleType Class 1975 1980 1985 1990 1995 2000 2005 2010 2015 2020Diesel PC/LDT 2.48 9.93 22.82 18.47 13.45 12.30 11.48 7.57 4.78 2.75
Light HDV 0.67 1.78 7.35 15.61 16.07 26.90 32.70 24.85 15.87 10.65Medium HDV 8.38 25.65 73.46 146.28 133.56 142.41 129.93 100.76 65.12 41.82Heavy HDVa 260.76 439.33 678.19 760.93 590.84 570.57 507.39 357.42 223.58 146.86Bus 28.87 33.35 42.22 53.67 54.05 61.48 58.13 57.46 53.17 48.17
Gasoline PC 1,340.69 1,249.86 1,170.89 845.03 671.20 468.22 279.21 176.61 111.07 74.34LDT 715.52 590.29 571.16 696.75 656.37 498.43 317.04 227.44 158.39 113.11HDV 80.79 119.68 174.23 233.12 191.38 125.64 98.32 78.81 61.96 50.02MC 4.19 5.96 8.76 7.66 6.01 4.14 4.69 4.77 4.71 4.89
Total 2,442.35 2,475.83 2,749.08 2,777.52 2,332.93 1,910.09 1,438.89 1,035.69 698.65 492.61a Includes hoteling emissions estimates, which are not included in the baseline inventory.
Oxides of Nitrogen (Tons Per Day)Calendar Year
Statewide ROG and NOx Emissions Estimates

B-6
Fuel VehicleType Class 1975 1980 1985 1990 1995 2000 2005 2010 2015 2020Diesel PC/LDT 0.58 2.07 3.67 2.81 1.43 0.92 0.63 0.36 0.19 0.11
Light HDV 0.04 0.09 0.38 0.81 0.41 0.27 0.33 0.26 0.19 0.16Medium HDV 0.31 0.97 2.72 4.95 3.73 3.29 3.17 2.68 2.14 1.78Heavy HDVa 11.67 19.67 29.30 29.42 16.26 11.33 8.70 5.91 4.32 3.45Bus 0.57 0.69 0.88 1.15 1.05 1.24 1.24 1.22 1.18 1.11
Gasoline PC 6.35 5.06 4.48 3.94 4.41 5.07 5.81 6.63 7.44 8.04LDT 3.39 2.28 2.28 3.22 3.98 5.02 6.19 7.74 9.06 10.05HDV 0.29 0.31 0.38 0.42 0.39 0.26 0.27 0.31 0.34 0.36MC 0.21 0.22 0.25 0.21 0.16 0.11 0.12 0.10 0.08 0.07
Total 23.41 31.36 44.34 46.93 31.82 27.51 26.46 25.20 24.95 25.14a Includes hoteling emissions estimates, which are not included in the baseline inventory.
Exhaust PM2.5 (Tons Per Day)Calendar Year
Fuel VehicleType Class 1975 1980 1985 1990 1995 2000 2005 2010 2015 2020Diesel PC/LDT 0.00 0.03 0.11 0.08 0.08 0.07 0.08 0.04 0.04 0.01
Light HDV 0.00 0.00 0.01 0.04 0.02 0.04 0.04 0.05 0.05 0.05Medium HDV 0.00 0.01 0.03 0.06 0.07 0.08 0.10 0.12 0.11 0.12Heavy HDV 0.11 0.19 0.31 0.42 0.39 0.37 0.41 0.48 0.55 0.59Bus 0.01 0.01 0.01 0.01 0.02 0.02 0.03 0.03 0.02 0.03
Gasoline PC 1.84 1.97 2.63 3.13 3.34 3.54 3.90 4.29 4.61 4.92LDT 0.98 0.85 1.04 1.76 2.05 2.36 2.57 2.83 3.10 3.36HDV 0.08 0.12 0.18 0.23 0.18 0.21 0.22 0.23 0.22 0.25MC 0.03 0.03 0.04 0.03 0.02 0.02 0.02 0.03 0.02 0.03
Total 3.05 3.21 4.36 5.76 6.17 6.71 7.37 8.10 8.72 9.36
Brake/Tire Wear PM2.5 (Tons Per Day)Calendar Year
Statewide PM2.5 Emissions Estimates

B-7
Fuel VehicleType Class 1975 1980 1985 1990 1995 2000 2005 2010 2015 2020Diesel PC/LDT 0.00 0.00 0.00 0.00 0.00 0.00 0.00 0.00 0.00 0.00
Light HDV 0.00 0.00 0.00 0.00 0.00 0.00 0.00 0.00 0.00 0.00Medium HDV 0.00 0.00 0.00 0.00 0.00 0.00 0.00 0.00 0.00 0.00Heavy HDV 0.00 0.00 0.00 0.00 0.00 0.00 0.00 0.00 0.00 0.00Bus 0.00 0.00 0.00 0.00 0.00 0.00 0.00 0.00 0.00 0.00
Gasoline PC 34.74 11.57 2.97 0.28 0.00 0.00 0.00 0.00 0.00 0.00LDT 18.34 4.92 1.39 0.23 0.00 0.00 0.00 0.00 0.00 0.00HDV 3.26 1.51 0.59 0.09 0.00 0.00 0.00 0.00 0.00 0.00MC 0.25 0.12 0.05 0.01 0.00 0.00 0.00 0.00 0.00 0.00
Total 56.59 18.12 5.00 0.61 0.00 0.00 0.00 0.00 0.00 0.00
Lead Emissions (Tons Per Day)Calendar Year
Statewide Lead Emissions Estimates

B-8
Fuel VehicleType Class 1975 1980 1985 1990 1995 2000 2005 2010 2015 2020Diesel PC/LDT 12,823 49,516 137,070 114,498 90,571 77,106 77,016 56,346 39,465 24,927
Light HDV 775 1,875 7,564 17,276 15,866 18,220 24,977 28,795 32,118 35,658Medium HDV 1,829 5,903 18,578 42,490 50,779 63,523 75,000 85,252 94,528 103,418Heavy HDV 14,720 28,891 51,539 65,098 60,546 61,052 68,913 77,540 85,593 93,251Bus 4,007 4,903 6,014 9,035 10,703 13,057 13,891 14,915 16,033 17,081
Gasoline PC 3,264,809 3,238,593 4,344,580 4,634,672 4,893,959 5,293,247 5,716,301 6,156,372 6,598,009 7,068,370LDT 1,446,584 1,159,227 1,449,130 2,273,349 2,625,784 3,093,192 3,329,489 3,603,497 3,873,413 4,164,325HDV 95,721 142,186 222,775 244,168 234,415 228,863 233,254 242,356 253,044 266,904MC 216,685 242,584 277,834 240,917 181,523 123,338 133,788 144,535 155,038 166,356
Total 5,057,953 4,873,678 6,515,084 7,641,503 8,164,146 8,971,598 9,672,629 10,409,608 11,147,241 11,940,290
Vehicle PopulationCalendar Year
Fuel VehicleType Class 1975 1980 1985 1990 1995 2000 2005 2010 2015 2020Diesel PC/LDT 466 1,962 5,226 3,948 2,877 2,396 2,398 1,628 1,076 643
Light HDV 34 88 423 1,022 819 940 1,400 1,449 1,472 1,573Medium HDV 99 360 1,119 2,603 2,909 3,501 3,907 4,137 4,379 4,685Heavy HDV 2,549 4,603 7,930 10,352 9,188 8,441 9,410 11,286 12,988 13,943Bus 387 444 521 687 782 930 962 1,023 1,093 1,155
Gasoline PC 107,055 105,688 148,009 165,927 172,502 183,284 194,992 208,980 222,627 237,403LDT 49,561 39,103 49,365 80,720 93,380 109,772 115,149 121,559 128,873 138,006HDV 3,492 4,968 7,192 9,219 7,409 7,834 7,902 7,796 7,736 7,977MC 1,399 1,515 1,766 1,424 1,022 772 966 1,080 1,155 1,236
Total 165,042 158,731 221,551 275,902 290,888 317,870 337,086 358,938 381,399 406,621
Vehicle Miles Traveled (VMT/1000)Calendar Year
South Coast Air Basin Vehicle Population and Vehicle Miles Traveled Estimates

B-9
Fuel VehicleType Class 1975 1980 1985 1990 1995 2000 2005 2010 2015 2020Diesel PC/LDT 0.35 1.21 2.13 1.50 0.95 0.58 0.39 0.23 0.14 0.07
Light HDV 0.01 0.03 0.13 0.32 0.35 0.25 0.37 0.36 0.30 0.24Medium HDV 0.04 0.16 0.51 1.07 1.19 1.07 1.14 1.06 0.91 0.77Heavy HDV 5.12 9.61 14.92 13.62 9.36 7.22 6.55 4.88 3.99 3.49Bus 0.47 0.54 0.62 0.75 0.84 0.98 0.93 0.91 0.88 0.81
Gasoline PC 1,141.87 960.07 869.44 474.38 338.57 220.45 133.41 84.08 55.75 39.98LDT 441.47 297.92 282.40 241.20 188.83 134.29 93.04 73.75 59.18 47.23HDV 82.41 101.59 125.16 109.21 66.79 34.89 25.36 19.74 16.33 13.97MC 26.29 26.68 27.70 20.10 13.19 7.04 6.18 5.44 5.03 5.10
Total 1,698.03 1,397.81 1,323.01 862.15 620.07 406.77 267.37 190.45 142.51 111.66
Reactive Organic Gases (Tons Per Day)Calendar Year
Fuel VehicleType Class 1975 1980 1985 1990 1995 2000 2005 2010 2015 2020Diesel PC/LDT 0.90 3.64 8.44 6.08 4.00 3.50 3.49 2.37 1.55 0.93
Light HDV 0.18 0.45 2.15 5.25 4.93 7.84 10.61 8.42 5.49 3.70Medium HDV 2.33 8.48 26.11 56.13 49.68 54.83 48.62 37.38 23.54 14.86Heavy HDVa 94.58 168.95 268.59 291.81 217.24 222.94 194.30 135.74 82.36 53.99Bus 12.86 14.57 16.93 20.59 20.22 22.70 20.56 19.39 17.97 15.80
Gasoline PC 611.16 519.11 511.62 352.79 278.34 194.65 114.63 71.77 45.06 29.67LDT 279.23 203.99 210.48 254.94 238.36 183.04 113.74 82.30 58.58 42.12HDV 28.62 42.05 62.13 90.89 71.01 47.73 35.51 27.15 20.74 16.55MC 1.29 1.88 2.86 2.46 1.78 1.21 1.47 1.55 1.55 1.62
Total 1,031.15 963.12 1,109.31 1,080.94 885.56 738.44 542.93 386.07 256.84 179.23a Includes hoteling emissions estimates, which are not included in the baseline inventory.
Oxides of Nitrogen (Tons Per Day)Calendar Year
South Coast Air Basin ROG and NOx Emissions Estimates

B-10
Fuel VehicleType Class 1975 1980 1985 1990 1995 2000 2005 2010 2015 2020Diesel PC/LDT 0.23 0.85 1.45 0.98 0.52 0.31 0.21 0.11 0.07 0.04
Light HDV 0.01 0.02 0.11 0.24 0.13 0.06 0.07 0.06 0.04 0.04Medium HDV 0.08 0.31 0.94 1.73 1.36 1.06 1.03 0.86 0.69 0.57Heavy HDVa 4.27 7.62 11.37 10.61 5.92 3.91 2.97 2.00 1.50 1.21Bus 0.24 0.28 0.33 0.41 0.38 0.44 0.42 0.40 0.38 0.35
Gasoline PC 3.05 2.21 2.04 1.70 1.90 2.13 2.41 2.61 2.96 3.17LDT 1.40 0.82 0.89 1.24 1.51 1.87 2.30 2.78 3.31 3.60HDV 0.11 0.08 0.13 0.13 0.11 0.07 0.06 0.07 0.08 0.08MC 0.06 0.07 0.08 0.07 0.05 0.03 0.04 0.03 0.03 0.02
Total 9.45 12.26 17.34 17.11 11.88 9.88 9.51 8.93 9.06 9.08a Includes hoteling emissions estimates, which are not included in the baseline inventory.
Exhaust PM2.5 (Tons Per Day)Calendar Year
Fuel VehicleType Class 1975 1980 1985 1990 1995 2000 2005 2010 2015 2020Diesel PC/LDT 0.01 0.01 0.03 0.03 0.01 0.02 0.02 0.03 0.01 0.00
Light HDV 0.00 0.00 0.01 0.02 0.01 0.01 0.01 0.02 0.02 0.02Medium HDV 0.00 0.01 0.01 0.02 0.03 0.04 0.03 0.04 0.05 0.04Heavy HDV 0.04 0.07 0.12 0.16 0.15 0.13 0.15 0.18 0.21 0.22Bus 0.00 0.00 0.01 0.01 0.01 0.01 0.01 0.00 0.01 0.00
Gasoline PC 0.87 0.86 1.20 1.35 1.41 1.49 1.58 1.70 1.81 1.93LDT 0.40 0.34 0.39 0.66 0.76 0.91 0.91 1.00 1.07 1.13HDV 0.02 0.06 0.06 0.11 0.09 0.07 0.08 0.07 0.08 0.08MC 0.01 0.01 0.01 0.01 0.00 0.01 0.00 0.01 0.00 0.01
Total 1.35 1.36 1.84 2.37 2.47 2.69 2.79 3.05 3.26 3.43
Brake/Tire Wear PM2.5 (Tons Per Day)Calendar Year
South Coast Air Basin PM2.5 Emissions Estimates

B-11
Fuel VehicleType Class 1975 1980 1985 1990 1995 2000 2005 2010 2015 2020Diesel PC/LDT 0.00 0.00 0.00 0.00 0.00 0.00 0.00 0.00 0.00 0.00
Light HDV 0.00 0.00 0.00 0.00 0.00 0.00 0.00 0.00 0.00 0.00Medium HDV 0.00 0.00 0.00 0.00 0.00 0.00 0.00 0.00 0.00 0.00Heavy HDV 0.00 0.00 0.00 0.00 0.00 0.00 0.00 0.00 0.00 0.00Bus 0.00 0.00 0.00 0.00 0.00 0.00 0.00 0.00 0.00 0.00
Gasoline PC 16.42 4.99 1.33 0.12 0.00 0.00 0.00 0.00 0.00 0.00LDT 7.47 1.78 0.53 0.09 0.00 0.00 0.00 0.00 0.00 0.00HDV 1.13 0.52 0.19 0.02 0.00 0.00 0.00 0.00 0.00 0.00MC 0.08 0.04 0.02 0.00 0.00 0.00 0.00 0.00 0.00 0.00
Total 25.10 7.33 2.07 0.23 0.00 0.00 0.00 0.00 0.00 0.00
Lead Emissions (Tons Per Day)Calendar Year
South Coast Air Basin Lead Emissions Estimates

B-12
Fuel VehicleType Class 1975 1980 1985 1990 1995 2000 2005 2010 2015 2020Diesel PC/LDT 2,147 7,005 20,126 26,229 28,804 30,158 28,426 20,502 13,854 8,504
Light HDV 445 1,566 3,673 6,253 6,523 8,338 10,626 11,966 13,391 14,888Medium HDV 1,216 2,488 6,619 12,286 15,926 18,920 24,389 29,167 34,207 39,054Heavy HDV 6,540 11,523 19,543 25,086 25,102 24,415 28,770 32,391 36,366 40,443Bus 739 925 1,279 2,060 2,679 3,445 4,157 4,858 5,601 6,361
Gasoline PC 385,874 453,775 553,430 707,203 849,650 982,319 1,151,813 1,305,904 1,472,980 1,637,035LDT 291,972 296,811 339,912 537,645 684,053 818,524 959,426 1,109,343 1,277,210 1,442,892HDV 29,717 44,223 68,862 74,191 74,704 71,681 79,174 88,256 100,166 113,764MC 58,787 62,744 69,501 60,886 49,626 34,163 38,131 41,132 44,655 48,233
Total 777,437 881,060 1,082,945 1,451,839 1,737,067 1,991,963 2,324,912 2,643,519 2,998,430 3,351,174
Vehicle PopulationCalendar Year
Fuel VehicleType Class 1975 1980 1985 1990 1995 2000 2005 2010 2015 2020Diesel PC/LDT 83 328 943 1,076 1,098 1,100 968 620 377 211
Light HDV 22 103 248 431 399 562 740 751 772 822Medium HDV 64 173 468 876 1,062 1,182 1,479 1,725 1,975 2,201Heavy HDV 1,312 2,098 3,199 4,152 4,292 3,970 4,561 5,325 6,344 7,208Bus 58 69 96 150 195 252 297 343 393 445
Gasoline PC 13,978 16,492 21,112 28,845 34,461 38,673 45,381 51,890 58,399 64,321LDT 11,220 11,225 12,857 21,582 27,507 32,193 37,123 43,167 49,801 55,840HDV 1,338 1,889 2,600 2,811 2,434 2,868 3,328 3,544 3,801 4,129MC 495 509 552 431 323 253 330 376 408 438
Total 28,570 32,886 42,075 60,354 71,771 81,053 94,207 107,741 122,270 135,615
Vehicle Miles Traveled (VMT/1000)Calendar Year
San Joaquin Valley Air Basin Vehicle Population and Vehicle Miles Traveled Estimates

B-13
Fuel VehicleType Class 1975 1980 1985 1990 1995 2000 2005 2010 2015 2020Diesel PC/LDT 0.05 0.18 0.32 0.33 0.26 0.20 0.14 0.07 0.05 0.01
Light HDV 0.01 0.04 0.08 0.15 0.19 0.24 0.35 0.33 0.27 0.21Medium HDV 0.03 0.08 0.23 0.42 0.51 0.57 0.62 0.58 0.50 0.45Heavy HDV 2.81 4.74 7.09 6.84 5.01 4.14 3.95 2.99 2.37 2.05Bus 0.05 0.07 0.10 0.14 0.18 0.24 0.28 0.30 0.30 0.29
Gasoline PC 148.59 147.23 124.50 86.37 69.86 47.54 29.17 18.13 11.77 8.55LDT 103.94 89.07 78.12 72.48 63.83 47.07 33.76 25.02 18.66 14.50HDV 30.39 38.36 47.81 44.81 31.00 16.47 11.08 8.19 6.47 5.26MC 8.96 8.31 8.06 6.08 4.48 2.41 2.21 1.93 1.80 1.82
Total 294.83 288.08 266.31 217.62 175.32 118.88 81.56 57.54 42.18 33.14
Reactive Organic Gases (Tons Per Day)Calendar Year
Fuel VehicleType Class 1975 1980 1985 1990 1995 2000 2005 2010 2015 2020Diesel PC/LDT 0.17 0.67 1.63 1.73 1.58 1.66 1.46 0.94 0.57 0.31
Light HDV 0.12 0.53 1.27 2.23 2.46 4.15 4.95 3.78 2.48 1.68Medium HDV 1.54 4.15 11.14 19.63 19.17 18.85 18.20 14.37 9.63 6.41Heavy HDVa 49.39 78.38 113.90 125.09 105.22 93.29 85.78 61.01 38.54 25.26Bus 1.71 2.03 2.82 4.16 4.57 5.65 5.91 5.97 5.62 5.18
Gasoline PC 87.77 89.59 82.40 68.89 60.01 44.61 26.47 16.37 10.18 6.83LDT 69.55 64.80 61.40 76.23 76.94 61.49 39.75 27.26 18.53 13.21HDV 10.96 15.96 23.06 27.21 22.81 14.24 12.08 10.37 8.66 7.21MC 0.50 0.69 0.96 0.79 0.60 0.42 0.53 0.56 0.57 0.60
Total 221.71 256.80 298.58 325.96 293.36 244.36 195.13 140.63 94.77 66.70a Includes hoteling emissions estimates, which are not included in the baseline inventory.
Oxides of Nitrogen (Tons Per Day)Calendar Year
San Joaquin Valley Air Basin ROG and NOx Emissions Estimates

B-14
Fuel VehicleType Class 1975 1980 1985 1990 1995 2000 2005 2010 2015 2020Diesel PC/LDT 0.03 0.12 0.23 0.24 0.14 0.11 0.07 0.05 0.01 0.01
Light HDV 0.01 0.03 0.06 0.13 0.06 0.05 0.06 0.05 0.04 0.04Medium HDV 0.06 0.15 0.42 0.72 0.55 0.51 0.50 0.44 0.36 0.32Heavy HDVa 2.19 3.47 4.99 5.01 2.84 1.98 1.55 1.09 0.80 0.65Bus 0.04 0.05 0.08 0.11 0.11 0.13 0.15 0.15 0.15 0.13
Gasoline PC 0.36 0.32 0.29 0.31 0.39 0.48 0.55 0.61 0.70 0.80LDT 0.29 0.22 0.23 0.36 0.45 0.60 0.74 0.87 1.01 1.18HDV 0.02 0.02 0.04 0.04 0.04 0.02 0.03 0.05 0.06 0.08MC 0.02 0.03 0.03 0.02 0.02 0.01 0.01 0.01 0.01 0.01
Total 3.02 4.41 6.37 6.94 4.60 3.89 3.67 3.32 3.14 3.22a Includes hoteling emissions estimates, which are not included in the baseline inventory.
Exhaust PM2.5 (Tons Per Day)Calendar Year
Fuel VehicleType Class 1975 1980 1985 1990 1995 2000 2005 2010 2015 2020Diesel PC/LDT 0.01 0.01 0.01 0.01 0.01 0.00 0.01 0.00 0.00 0.00
Light HDV 0.00 0.00 0.01 0.00 0.00 0.00 0.00 0.01 0.00 0.00Medium HDV 0.00 0.00 0.01 0.00 0.01 0.01 0.01 0.01 0.02 0.02Heavy HDV 0.02 0.04 0.05 0.07 0.07 0.06 0.08 0.08 0.10 0.11Bus 0.01 0.00 0.00 0.01 0.00 0.00 0.00 0.00 0.00 0.01
Gasoline PC 0.11 0.13 0.18 0.23 0.27 0.31 0.38 0.43 0.47 0.52LDT 0.09 0.10 0.11 0.16 0.24 0.28 0.31 0.36 0.40 0.45HDV 0.01 0.03 0.03 0.04 0.03 0.04 0.04 0.04 0.04 0.02MC 0.01 0.00 0.00 0.00 0.00 0.00 0.01 0.00 0.00 0.00
Total 0.26 0.31 0.40 0.52 0.63 0.70 0.84 0.93 1.03 1.13
Brake/Tire Wear PM2.5 (Tons Per Day)Calendar Year
San Joaquin Valley Air Basin PM2.5 Emissions Estimates

B-15
Fuel VehicleType Class 1975 1980 1985 1990 1995 2000 2005 2010 2015 2020Diesel PC/LDT 0.00 0.00 0.00 0.00 0.00 0.00 0.00 0.00 0.00 0.00
Light HDV 0.00 0.00 0.00 0.00 0.00 0.00 0.00 0.00 0.00 0.00Medium HDV 0.00 0.00 0.00 0.00 0.00 0.00 0.00 0.00 0.00 0.00Heavy HDV 0.00 0.00 0.00 0.00 0.00 0.00 0.00 0.00 0.00 0.00Bus 0.00 0.00 0.00 0.00 0.00 0.00 0.00 0.00 0.00 0.00
Gasoline PC 2.08 0.75 0.19 0.02 0.00 0.00 0.00 0.00 0.00 0.00LDT 1.64 0.51 0.14 0.02 0.00 0.00 0.00 0.00 0.00 0.00HDV 0.43 0.20 0.08 0.01 0.00 0.00 0.00 0.00 0.00 0.00MC 0.03 0.01 0.01 0.00 0.00 0.00 0.00 0.00 0.00 0.00
Total 4.18 1.47 0.42 0.05 0.00 0.00 0.00 0.00 0.00 0.00
Lead Emissions (Tons Per Day)Calendar Year
San Joaquin Valley Air Basin Lead Emissions Estimates

B-16
Fuel VehicleType Class 1975 1980 1985 1990 1995 2000 2005 2010 2015 2020Diesel PC/LDT 9,624 33,580 80,604 69,851 57,923 51,169 49,138 36,374 25,141 15,783
Light HDV 531 1,063 4,634 8,805 8,615 10,673 13,624 14,910 15,208 15,521Medium HDV 1,010 3,084 9,809 20,918 25,199 32,322 38,441 44,635 48,401 52,676Heavy HDV 6,867 12,301 20,696 25,700 24,150 25,319 28,936 32,084 33,243 34,213Bus 2,674 3,070 4,220 6,221 7,449 8,851 9,443 11,245 12,489 14,063
Gasoline PC 1,679,251 1,947,165 2,225,146 2,307,634 2,489,908 2,735,984 3,040,074 3,382,112 3,548,053 3,730,532LDT 733,858 680,802 723,378 1,084,339 1,288,609 1,530,479 1,697,267 2,003,595 2,216,338 2,450,405HDV 50,513 72,629 105,926 108,558 104,236 100,991 106,640 127,378 148,758 178,980MC 114,060 130,635 157,211 147,204 129,956 91,758 75,945 67,033 56,597 47,985
Total 2,598,388 2,884,329 3,331,624 3,779,230 4,136,045 4,587,546 5,059,508 5,719,366 6,104,228 6,540,158
Vehicle PopulationCalendar Year
Fuel VehicleType Class 1975 1980 1985 1990 1995 2000 2005 2010 2015 2020Diesel PC/LDT 312 1,346 3,160 2,370 1,749 1,498 1,419 939 593 341
Light HDV 19 48 294 579 497 610 818 814 747 712Medium HDV 64 210 661 1,431 1,606 1,981 2,215 2,353 2,326 2,345Heavy HDV 1,229 2,096 3,486 4,487 4,068 4,045 4,462 5,133 5,297 5,367Bus 285 324 423 563 658 774 798 937 1,019 1,131
Gasoline PC 52,601 60,158 73,044 81,434 86,773 92,572 101,323 112,385 115,828 120,335LDT 24,299 22,115 23,899 38,148 45,359 53,323 56,853 65,830 71,429 78,400HDV 2,073 2,840 3,722 4,035 3,350 3,832 4,125 4,398 4,551 4,910MC 854 932 1,104 947 795 638 570 509 422 356
Total 81,736 90,069 109,793 133,994 144,855 159,273 172,583 193,298 202,212 213,897
Vehicle Miles Traveled (VMT/1000)Calendar Year
San Francisco Bay Area Air Basin Vehicle Population and Vehicle Miles Traveled Estimates

B-17
Fuel VehicleType Class 1975 1980 1985 1990 1995 2000 2005 2010 2015 2020Diesel PC/LDT 0.21 0.75 1.13 0.79 0.52 0.33 0.23 0.14 0.09 0.04
Light HDV 0.01 0.01 0.09 0.19 0.22 0.26 0.37 0.34 0.26 0.19Medium HDV 0.03 0.10 0.30 0.61 0.69 0.78 0.84 0.78 0.62 0.50Heavy HDV 2.55 4.49 6.76 6.13 4.26 3.77 3.52 2.59 1.95 1.57Bus 0.35 0.39 0.51 0.63 0.73 0.86 0.83 0.89 0.83 0.79
Gasoline PC 581.69 570.88 431.04 231.18 169.09 111.21 76.49 50.72 32.22 22.37LDT 226.71 173.54 133.98 109.24 90.30 64.95 52.42 45.12 35.22 27.85HDV 50.65 60.87 69.02 57.20 35.28 19.20 13.09 9.90 7.80 6.42MC 16.01 16.03 16.89 13.58 10.70 5.59 3.82 2.78 2.02 1.58
Total 878.21 827.06 659.72 419.55 311.79 206.95 151.61 113.26 81.01 61.31
Reactive Organic Gases (Tons Per Day)Calendar Year
Fuel VehicleType Class 1975 1980 1985 1990 1995 2000 2005 2010 2015 2020Diesel PC/LDT 0.67 2.82 5.63 3.99 2.63 2.19 2.09 1.39 0.88 0.52
Light HDV 0.10 0.25 1.50 3.00 3.07 4.43 5.41 4.09 2.52 1.67Medium HDV 1.52 5.01 15.60 31.26 27.90 29.65 26.84 20.68 13.15 8.18Heavy HDVa 46.26 78.00 119.66 128.36 97.56 93.63 82.39 56.44 33.89 20.95Bus 9.52 10.84 13.99 17.34 17.03 19.57 18.17 18.78 16.92 15.39
Gasoline PC 328.77 325.18 272.22 180.56 141.44 96.95 68.89 45.89 28.28 17.98LDT 150.10 127.06 109.19 125.78 119.44 89.29 67.82 53.70 38.07 26.89HDV 16.81 24.27 33.02 39.34 31.33 20.66 16.67 13.86 10.95 8.79MC 0.87 1.25 1.90 1.74 1.47 1.03 0.90 0.75 0.59 0.49
Total 554.62 574.68 572.71 531.37 441.87 357.40 289.17 215.57 145.24 100.86a Includes hoteling emissions estimates, which are not included in the baseline inventory.
Oxides of Nitrogen (Tons Per Day)Calendar Year
San Francisco Bay Area Air Basin ROG and NOx Emissions Estimates
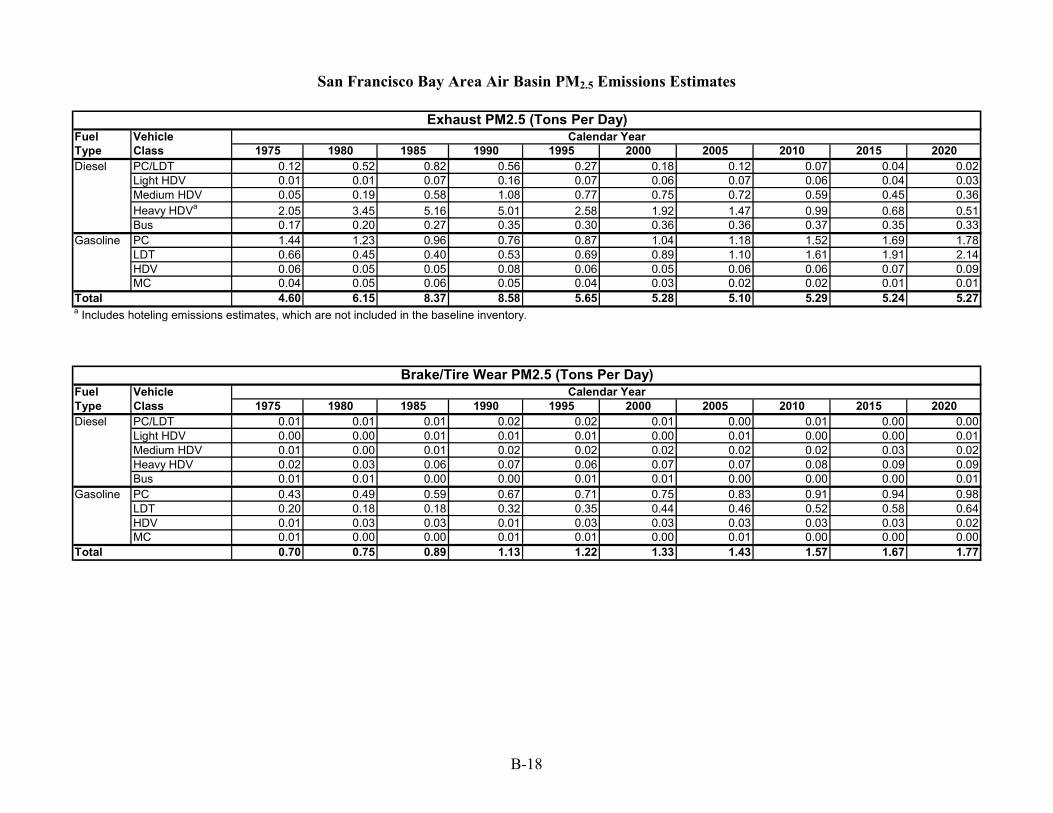
B-18
Fuel VehicleType Class 1975 1980 1985 1990 1995 2000 2005 2010 2015 2020Diesel PC/LDT 0.12 0.52 0.82 0.56 0.27 0.18 0.12 0.07 0.04 0.02
Light HDV 0.01 0.01 0.07 0.16 0.07 0.06 0.07 0.06 0.04 0.03Medium HDV 0.05 0.19 0.58 1.08 0.77 0.75 0.72 0.59 0.45 0.36Heavy HDVa 2.05 3.45 5.16 5.01 2.58 1.92 1.47 0.99 0.68 0.51Bus 0.17 0.20 0.27 0.35 0.30 0.36 0.36 0.37 0.35 0.33
Gasoline PC 1.44 1.23 0.96 0.76 0.87 1.04 1.18 1.52 1.69 1.78LDT 0.66 0.45 0.40 0.53 0.69 0.89 1.10 1.61 1.91 2.14HDV 0.06 0.05 0.05 0.08 0.06 0.05 0.06 0.06 0.07 0.09MC 0.04 0.05 0.06 0.05 0.04 0.03 0.02 0.02 0.01 0.01
Total 4.60 6.15 8.37 8.58 5.65 5.28 5.10 5.29 5.24 5.27a Includes hoteling emissions estimates, which are not included in the baseline inventory.
Exhaust PM2.5 (Tons Per Day)Calendar Year
Fuel VehicleType Class 1975 1980 1985 1990 1995 2000 2005 2010 2015 2020Diesel PC/LDT 0.01 0.01 0.01 0.02 0.02 0.01 0.00 0.01 0.00 0.00
Light HDV 0.00 0.00 0.01 0.01 0.01 0.00 0.01 0.00 0.00 0.01Medium HDV 0.01 0.00 0.01 0.02 0.02 0.02 0.02 0.02 0.03 0.02Heavy HDV 0.02 0.03 0.06 0.07 0.06 0.07 0.07 0.08 0.09 0.09Bus 0.01 0.01 0.00 0.00 0.01 0.01 0.00 0.00 0.00 0.01
Gasoline PC 0.43 0.49 0.59 0.67 0.71 0.75 0.83 0.91 0.94 0.98LDT 0.20 0.18 0.18 0.32 0.35 0.44 0.46 0.52 0.58 0.64HDV 0.01 0.03 0.03 0.01 0.03 0.03 0.03 0.03 0.03 0.02MC 0.01 0.00 0.00 0.01 0.01 0.00 0.01 0.00 0.00 0.00
Total 0.70 0.75 0.89 1.13 1.22 1.33 1.43 1.57 1.67 1.77
Brake/Tire Wear PM2.5 (Tons Per Day)Calendar Year
San Francisco Bay Area Air Basin PM2.5 Emissions Estimates

B-19
Fuel VehicleType Class 1975 1980 1985 1990 1995 2000 2005 2010 2015 2020Diesel PC/LDT 0.00 0.00 0.00 0.00 0.00 0.00 0.00 0.00 0.00 0.00
Light HDV 0.00 0.00 0.00 0.00 0.00 0.00 0.00 0.00 0.00 0.00Medium HDV 0.00 0.00 0.00 0.00 0.00 0.00 0.00 0.00 0.00 0.00Heavy HDV 0.00 0.00 0.00 0.00 0.00 0.00 0.00 0.00 0.00 0.00Bus 0.00 0.00 0.00 0.00 0.00 0.00 0.00 0.00 0.00 0.00
Gasoline PC 8.04 2.85 0.65 0.05 0.00 0.00 0.00 0.00 0.00 0.00LDT 3.65 0.99 0.25 0.03 0.00 0.00 0.00 0.00 0.00 0.00HDV 0.67 0.30 0.11 0.02 0.00 0.00 0.00 0.00 0.00 0.00MC 0.06 0.03 0.01 0.00 0.00 0.00 0.00 0.00 0.00 0.00
Total 12.42 4.17 1.02 0.10 0.00 0.00 0.00 0.00 0.00 0.00
Lead Emissions (Tons Per Day)Calendar Year
San Francisco Bay Area Air Basin Lead Emissions Estimates

APPENDIX C Non-Road Mobile Source Emissions Data

C-1
Methodology Non-road emissions inventory estimates for this study were based on the current Mobile Source Inventory posted on the CARB website.* These inventories are available for calendar years 1975 through 2020, in five year increments, in varying degrees of detail. According to the CARB website, these data are based on Almanac Emission Projection Data published in 2004, and reflect the most current data provided to CARB. The most detailed available inventories, which were used in this analysis, include emissions estimates for over 80 different non-road fuel/equipment categories, including small off-road engines and equipment, off-road recreational vehicles, farm and construction equipment, forklifts, locomotives, commercial marine vessels, and marine pleasure craft. The inventory includes ton per day estimates of total organic gases (TOG), reactive organic gases (ROG), carbon monoxide (CO), oxides of nitrogen (NOx), oxides of sulfur (SOX), total particulate matter (PM), particulate matter less than or equal to 10 microns in diameter (PM10), and particulate matter less than or equal to 2.5 microns in diameter (PM2.5), for each equipment/fuel category. Although this study focused on ROG, NOx, and PM2.5 emissions, totals for all emissions are also presented. Inventory estimates were prepared for California, the South Coast Air Basin, the San Joaquin Valley Air Basin, and the San Francisco Bay Area Air Basin from calendar year 1975 to 2020 in five-year increments. Adjustments to the Off-Road Equipment Emissions Inventory As part of this effort, Sierra reviewed the off-road equipment emissions inventory in an attempt to determine if the impacts of all adopted control measures have been incorporated into the inventory estimates. Although the documentation for CARB’s off-road equipment emissions inventory is generally poor, we identified several rules that do not appear to have been accounted for in the latest inventories available on-line. This was accomplished by reviewing emissions trends and identifying sources in which the trend lines were flatter that expected. The adjustments made to the off-road inventory to account for adopted regulations not yet incorporated are summarized below. Large Land-Based Diesel Engines - The emissions inventory from this equipment category, which includes Diesel engines used in farm and construction equipment, appears to account for emissions standards up to CARB’s Tier 3 standards. However, the EPA Tier 4 standards that were finalized earlier this year† do not appear to be accounted for in the inventory. Those standards, which take full effect in the 2012 to 2014 timeframe, impact the 2015 and 2020 inventories. Based on a very rough estimate that off-road Diesel equipment NOx and PM emissions will be reduced by 90% beginning in 2013, the following adjustment factors relative to California’s Tier 3 standards were calculated by Sierra:
* The inventories can be downloaded at http://www.arb.ca.gov/ei/emissiondata.htm. † “Control of Emissions of Air Pollution from Nonroad Diesel Engines and Fuel; Final Rule,” U.S. Environmental Protection Agency, Federal Register, vol. 69, no. 124, June 29, 2004.

C-2
Year NOx PM 2015 0.92 0.95 2020 0.69 0.76
Large Spark Ignition (LSI) Engines - The 2001 regulations have clearly been accounted for in the CARB inventory estimates. However, it appears that the 2007 EPA regulations* have not been incorporated. Based on rough estimates regarding the impacts of the 2007 EPA regulations, the following emissions reductions were applied to the baseline inventory for this source:
Year ROG NOx 2010 1.00 0.88 2015 0.98 0.70 2020 0.98 0.66
Off-Road Recreational Equipment - Most of the off-road recreational equipment category appears to account for the most recently adopted standards. However, snowmobile emissions do not appear to have been adjusted for federal regulations. Based on the Regulatory Support Document prepared for regulations published in November 2002,† the following adjustment factors were applied to the snowmobile inventory:
Year ROG NOx PM 2010 0.85 1.17 0.96 2015 0.64 1.59 0.77 2020 0.43 2.00 0.58
Transport Refrigeration Units (TRU) ATCM – The staff report for this ATCM lists statewide calendar year 2010 through 2020 PM and NOx reductions of between 0.5 and 1.0 ton per day, as shown in Table C-1. Because TRUs are included in the statewide air basin inventory as a single entry, we simply subtracted these reductions from the current 2010 through 2020 CARB inventory numbers. To calculate the appropriate TRU reduction for the three air basins, we scaled these reductions by the fraction of the air basin vs. statewide TRU emissions for each calendar year.
* “Control of Emissions From Nonroad Large Spark-Ignition Engines, and Recreational Engines (Marine and Land-Based); Final Rule,” U.S. Environmental Protection Agency, Federal Register, vol. 67, no. 217, November 8, 2002. † “Final Regulatory Support Document: Control of Emissions from Unregulated Nonroad Engines,” U.S. Environmental Protection Agency, EPA420-R-02-022, September 2002.

C-3
Table C-1 CARB’s Projected TRU Reductions
(Relative to a CY 2000 baseline)
Calendar Year NOx (tpd) PM (tpd)
2010 0.9 0.62015 0.95 0.552020 1.0 0.5
Table C-2 shows a comparison of staff’s projected TRU inventory with full implementation of the ATCM, vs. our adjusted inventory totals. We attribute the difference in these totals to the fact that the ATCM applied to both TRUs and TRU generator set engines, the latter of which we assume to be included in separate Diesel IC engine inventory totals. For purposes of this analysis, adjustments were made only to the Diesel “Transport Refrigeration Unit” category within CARB’s Nonroad inventory because, as noted above, TRU generator set engine emissions are not listed as a separate inventory category.
Table C-2 CARB Projected TRU Inventory vs. Adjusted TRU Inventory
Calendar Adjusted TRU Inventory CARB Projected TRU InventoryYear NOx (tpd) PM (tpd) NOx (tpd) PM (tpd)2010 18.9 1.6 24.5 1.62020 11.2 0.8 28.2 0.3
Portable Diesel Engine ATCM – Because this engine category is not listed separately in either the statewide or air basin inventory databases, we must assume that it is included in the “Diesel I.C. Reciprocating Engine” category, which has already been adjusted for the stationary IC engine ATCM, as discussed in Appendix C. Therefore, no further adjustments to account for the fully implemented ATCM were deemed necessary. Inventory Results The results of the inventory analysis described above are presented in the tables that follow for California, the South Coast Air Basin, the San Joaquin Valley Air Basin, and the San Francisco Bay Area Air Basin. Note that both Diesel and Residual Oil (used in commercial shipping) are included in the Diesel emission totals.

C-4
California Statewide Non-Road ROG, NOx, and PM2.5 Emission Inventory
ROG (tons per day)1975 1980 1985 1990 1995 2000 2005 2010 2015 2020
Diesel Trains 7.56 7.55 7.54 6.89 7.71 8.56 8.81 8.14 8.11 8.05Diesel Marine 5.56 7.55 8.38 8.76 8.73 8.65 9.43 9.65 11.50 12.84"Other" Diesel Non-Road Equipment 54.48 57.01 57.26 61.87 52.13 48.62 42.35 30.98 22.63 17.26Diesel Agricultural Equipment 22.93 28.63 20.56 21.91 20.24 17.73 14.67 11.23 7.64 5.22
Total Non-Road Diesel Emissions 90.53 100.75 93.75 99.43 88.82 83.56 75.27 59.99 49.89 43.36Total Non-Road Emissions 481.70 538.93 579.01 647.99 636.94 590.90 432.73 349.52 307.75 280.77Commercial Marine 5.35 7.27 7.98 8.29 8.21 8.08 8.82 8.97 10.77 12.03
NOx (tons per day)1975 1980 1985 1990 1995 2000 2005 2010 2015 2020
Diesel Trains 173.81 173.58 173.33 173.46 195.00 215.22 161.67 129.95 132.41 132.73Diesel Marine 100.50 126.42 133.38 137.41 136.10 134.61 149.53 152.79 188.53 213.28"Other" Diesel Non-Road Equipment 523.38 555.78 558.37 598.83 463.43 439.20 391.58 304.09 210.89 172.30Diesel Agricultural Equipment 208.21 262.21 189.09 199.73 170.20 146.85 120.27 96.17 66.11 38.55
Total Non-Road Diesel 1005.90 1118.00 1054.17 1109.43 964.73 935.89 823.14 682.99 597.94 556.86Total Non-Road 1128.23 1248.60 1190.20 1264.31 1108.76 1089.05 982.77 829.20 739.20 702.68Commercial Marine 99.47 125.04 131.40 135.06 133.68 131.97 146.64 149.64 185.10 209.53
PM2.5 (tons per day)1975 1980 1985 1990 1995 2000 2005 2010 2015 2020
Diesel Trains 4.00 3.98 3.97 3.61 4.07 4.52 4.65 4.29 4.23 4.19Diesel Marine 8.15 9.78 10.20 10.51 10.34 10.30 10.98 11.42 13.92 15.63"Other" Diesel Non-Road Equipment 36.24 37.43 36.24 39.91 28.40 27.17 24.94 19.75 14.66 8.25Diesel Agricultural Equipment 13.94 17.25 11.86 13.23 9.91 8.82 7.44 6.10 4.40 2.70
Total Non-Road Diesel 62.33 68.45 62.27 67.25 52.73 50.81 48.32 41.56 37.21 30.77Total Non-Road 75.91 83.31 77.65 86.54 68.29 67.90 67.58 61.44 58.90 53.28Commercial Marine 8.12 9.74 10.15 10.44 10.29 10.23 10.91 11.34 13.83 15.54

C-5
South Coast Air Basin Non-Road ROG, NOx, and PM2.5 Emissions Inventory
ROG (tons per day)1975 1980 1985 1990 1995 2000 2005 2010 2015 2020
Diesel Trains 1.36 1.36 1.36 1.41 1.64 1.80 1.84 1.70 1.69 1.68Diesel Marine 0.94 2.85 3.45 3.87 3.88 3.66 4.08 4.50 5.28 6.05"Other" Diesel Non-Road Equipment 24.83 23.75 22.99 23.59 18.78 17.60 15.37 11.45 8.16 6.03Diesel Agricultural Equipment 1.62 2.13 1.45 1.35 1.21 1.13 0.95 0.72 0.49 0.33
Total Non-Road Diesel Emissions 28.76 30.09 29.25 30.22 25.36 24.01 22.08 18.24 15.49 14.09Total Non-Road Emissions 187.65 197.87 212.01 227.58 215.09 195.49 131.01 103.69 92.99 88.23Commercial Marine 0.86 2.74 3.30 3.69 3.69 3.45 3.85 4.26 5.01 5.76
NOx (tons per day)1975 1980 1985 1990 1995 2000 2005 2010 2015 2020
Diesel Trains 32.88 32.88 32.88 32.88 38.66 42.33 32.62 19.29 20.46 21.74Diesel Marine 11.58 36.19 43.70 48.24 47.77 44.35 50.28 56.20 66.51 76.83"Other" Diesel Non-Road Equipment 233.48 226.05 218.45 222.96 161.67 153.89 136.50 107.02 73.22 45.34Diesel Agricultural Equipment 14.75 19.54 13.33 12.29 10.17 9.38 7.78 6.18 4.56 3.48
Total Non-Road Diesel Emissions 292.69 314.66 308.36 316.37 254.57 245.74 223.27 185.04 161.41 147.39Total Non-Road Emissions 338.79 361.89 357.77 373.31 310.87 306.43 283.69 238.04 212.06 201.32Commercial Marine 11.18 35.66 42.96 47.37 46.89 43.39 49.23 55.05 65.26 75.47
PM2.5 (tons per day)1975 1980 1985 1990 1995 2000 2005 2010 2015 2020
Diesel Trains 0.66 0.66 0.66 0.68 0.83 0.92 0.94 0.86 0.86 0.85Diesel Marine 0.72 2.29 2.76 3.12 3.10 2.92 3.22 3.53 4.16 4.80"Other" Diesel Non-Road Equipment 16.43 15.53 14.49 15.17 10.23 9.88 8.89 7.17 5.42 3.26Diesel Agricultural Equipment 0.99 1.29 0.84 0.81 0.59 0.56 0.48 0.39 0.29 0.22
Total Non-Road Diesel Emissions 18.80 19.76 18.74 19.78 14.56 14.06 13.36 11.81 10.62 9.13Total Non-Road Emissions 21.61 22.85 22.10 23.25 18.33 18.48 18.18 16.74 16.01 14.78Commercial Marine 0.71 2.28 2.74 3.10 3.07 2.89 3.20 3.50 4.13 4.77

C-6
San Joaquin Valley Air Basin Non-Road ROG, NOx, and PM2.5 Emissions Inventory
ROG (tons per day)1975 1980 1985 1990 1995 2000 2005 2010 2015 2020
Diesel Trains 1.04 1.04 1.04 0.96 1.07 1.19 1.23 1.14 1.13 1.13Diesel Marine 0.06 0.06 0.09 0.11 0.09 0.09 0.10 0.10 0.11 0.11"Other" Diesel Non-Road Equipment 5.06 6.21 6.02 6.36 5.45 5.00 4.25 3.08 2.23 1.68Diesel Agricultural Equipment 10.08 13.23 9.31 9.87 9.12 7.87 6.66 5.09 3.46 2.36
Total Non-Road Diesel 16.24 20.54 16.47 17.30 15.73 14.16 12.23 9.41 6.93 5.28Total Non-Road 50.27 61.25 57.69 63.57 63.61 60.00 46.33 38.33 33.00 29.52Commercial Marine 0.04 0.04 0.06 0.07 0.04 0.04 0.04 0.04 0.04 0.04
NOx (tons per day)1975 1980 1985 1990 1995 2000 2005 2010 2015 2020
Diesel Trains 26.23 26.23 26.23 26.23 29.31 32.59 24.28 20.83 21.12 20.96Diesel Marine 0.32 0.37 0.54 0.67 0.49 0.51 0.53 0.55 0.57 0.59"Other" Diesel Non-Road Equipment 50.37 62.56 61.18 63.73 50.37 47.07 41.31 31.63 21.33 12.92Diesel Agricultural Equipment 91.47 121.10 85.59 89.97 76.67 65.22 54.59 43.56 32.48 25.21
Total Non-Road Diesel 168.39 210.26 173.54 180.60 156.85 145.39 120.71 96.57 75.49 59.68Total Non-Road 176.71 219.62 182.09 190.06 165.97 155.30 131.15 106.15 84.37 68.48Commercial Marine 0.22 0.23 0.36 0.47 0.27 0.27 0.27 0.27 0.26 0.25
PM2.5 (tons per day)1975 1980 1985 1990 1995 2000 2005 2010 2015 2020
Diesel Trains 0.57 0.57 0.57 0.52 0.58 0.66 0.68 0.63 0.62 0.61Diesel Marine 0.03 0.03 0.04 0.06 0.05 0.05 0.05 0.05 0.05 0.05"Other" Diesel Non-Road Equipment 3.41 4.12 3.85 4.12 2.97 2.77 2.49 1.91 1.38 0.86Diesel Agricultural Equipment 6.13 7.97 5.37 5.96 4.47 3.92 3.38 2.76 2.10 1.60
Total Non-Road Diesel 10.13 12.69 9.83 10.66 8.08 7.40 6.59 5.35 4.14 3.12Total Non-Road 11.00 13.61 10.74 11.74 9.13 8.61 7.99 6.84 5.74 4.77Commercial Marine 0.02 0.03 0.04 0.06 0.05 0.05 0.04 0.04 0.04 0.04

C-7
San Francisco Bay Area Air Basin Non-Road ROG, NOx, and PM2.5 Emissions Inventory
1975 1980 1985 1990 1995 2000 2005 2010 2015 2020Diesel Trains 0.39 0.39 0.39 0.41 0.47 0.53 0.55 0.50 0.50 0.50Diesel Marine 0.94 0.94 0.94 0.94 0.93 0.99 1.06 1.13 1.21 1.28"Other" Diesel Non-Road Equipment 10.59 10.14 11.19 12.09 11.77 11.12 9.75 6.94 5.20 4.20Diesel Agricultural Equipment 0.89 0.89 0.87 1.30 1.17 1.10 0.92 0.70 0.47 0.32
Total Non-Road Diesel Emissions 12.81 12.36 13.39 14.74 14.33 13.73 12.28 9.28 7.38 6.30Total Non-Road Emissions 94.42 96.38 104.21 112.22 105.26 92.10 63.58 50.23 45.13 42.50Commercial Marine 0.92 0.91 0.90 0.90 0.89 0.95 1.01 1.08 1.15 1.22
NOx (tons per day)1975 1980 1985 1990 1995 2000 2005 2010 2015 2020
Diesel Trains 12.56 12.56 12.56 12.56 13.68 14.91 11.24 9.61 9.63 9.50Diesel Marine 15.12 14.88 14.63 14.35 13.76 14.67 15.86 17.05 18.29 19.66"Other" Diesel Non-Road Equipment 100.87 97.96 108.14 116.15 105.48 99.83 89.29 68.80 49.44 32.58Diesel Agricultural Equipment 8.11 8.14 8.01 11.89 9.82 9.07 7.53 5.97 4.40 3.38
Total Non-Road Diesel Emissions 136.65 133.53 143.35 154.94 142.74 138.48 123.92 101.43 81.76 65.11Total Non-Road Emissions 177.67 174.54 186.37 200.47 181.61 177.11 163.20 137.52 116.41 100.07Commercial Marine 15.02 14.75 14.46 14.15 13.56 14.46 15.63 16.80 18.02 19.35
PM2.5 (tons per day)1975 1980 1985 1990 1995 2000 2005 2010 2015 2020
Diesel Trains 0.23 0.23 0.23 0.23 0.25 0.27 0.28 0.26 0.25 0.25Diesel Marine 1.27 1.23 1.20 1.17 1.07 1.14 1.24 1.34 1.45 1.58"Other" Diesel Non-Road Equipment 7.02 6.65 7.07 7.80 6.39 6.23 5.86 4.56 3.50 2.35Diesel Agricultural Equipment 0.54 0.53 0.50 0.79 0.57 0.54 0.47 0.38 0.28 0.21
Total Non-Road Diesel Emissions 9.07 8.65 9.01 9.98 8.27 8.18 7.84 6.53 5.49 4.39Total Non-Road Emissions 10.92 10.68 11.29 12.50 10.34 10.25 10.17 9.01 8.17 7.19Commercial Marine 1.27 1.23 1.20 1.16 1.06 1.13 1.23 1.33 1.45 1.57


![Welcome [dieselforum.org]...2020/06/30 · Emissions Control System + Advanced Engine Combustion 13 Factors that Contribute to Emissions from Diesel Engines Condition of engines and](https://static.fdocuments.in/doc/165x107/5f26763917285954851d987a/welcome-20200630-emissions-control-system-advanced-engine-combustion.jpg)