The Consistent Development in the Whole River System · The Consistent Development in the Whole...
23
The Consistent Development in the Whole River System The KANSAI Electric Power Co., INC Takashi AKIYAMA IEA :Implementing Agreement for Hydropower Technologies & Programs Workshop; Best Practices for Renewal and Upgrading of Hydropower Facilities to Maintain and Provide Value to the Power System, July 18, 2011 July 18, 2011
Transcript of The Consistent Development in the Whole River System · The Consistent Development in the Whole...

The Consistent Development
in the Whole River System
The KANSAI Electric Power Co., INC
Takashi AKIYAMA
IEA :Implementing Agreement for Hydropower Technologies & Programs
Workshop; Best Practices for Renewal and Upgrading of Hydropower Facilities
to Maintain and Provide Value to the Power System, July 18, 2011
July 18, 2011

・History of hydropower development
・Improvement of the river flow
・Redevelopment of existing power plants
■ Integrated management of sedimentation in the Kurobe River system
Contents
■Integrated management of water resources in the Kiso River system
・Sediment
・Flushing Operation
■Consistent development of the whole river system
1

Consistent river-system development involves
setting up a reservoir at the most upper-reach of
the river system for improved river flow,
and making maximum use of the river's elevation
head and water flow to achieve a large peak output
across the whole river system.
Consistent development of the whole river system
The concept in Japan
2

The Sea of Japan
Sho River
Jinzu River
Kurobe River
Kiso River
Osaka Tokyo
0 50km
Lake Biwa
Pacific Ocean
The position of each river system
Osaka
3
・150 hydropower stations

・History of hydropower development
・Improvement of the river flow
・Redevelopment of existing power plants
■ Integrated management of sedimentation in the Kurobe River system
Contents
■Integrated management of water resources in the Kiso River system
・Sediment
・Flushing Operation
■Consistent development of the whole river system
4

Year 1900 ’10 ’20 ’30 ’40 ’50 ’60 ’70 ’80
’90
Waterway-type
Hydropower
development
1910~1920
Dam-type
Hydropower
development
1920~1945
Large dam development
1945~1960
Redevelopment of existing
plants
1960~1980
Consistent development
in the whole river system
Nuclear Hydro
Thermal
Dam-type
Waterway-typeMiura
Dam
The history of hydropower development in the Kiso River5
Electricity
demand
In Japan
Elevation
Maximum
Discharge
1,000MWh

MiuraTakikoshi
Ontake
Tokiwa
Mio
Nezame
Agematsu
Momoyama
Inagawa
Inagawa No.2Suhara
Kiso
OkuwaHashiba Ainosawa
Tako
YogawaYomikaki
Araragigawa
Tsumago
Shizumo
Yamaguchi
Shin’ochiai
Ochiai
Shin’ohi
Ohi
Kasagi
Yaotsu(closed)
Maruyama
Shin’maruyama
Kaneyama
Minokawai
Imawatari
Downstream
Kiso River
Otaki River
Miura Dam
Hydropower Development in Kiso River System
0 5 10 15 20 25(km)
6
Hydropower
32 stations
Total:1,040MW
River channel length: 227km
Catchment area: 9,100km2

Miura power plant
Following the startup of Miura Dam, the annual river flow of
Kiso river was improved as illustrated below
Miura Dam (Miura Power Plant)
Maximum output:7,700kW
Maximum discharge:17.5m3/s
Effective head:54.7m
Flow duration curve for Kiso River
50 100 150 200 250 300 350(days)
(m3/s)
30
15
Maximum discharge of Miura power plant
Before startup of Miura Dam
After startup of Miura Dam
7
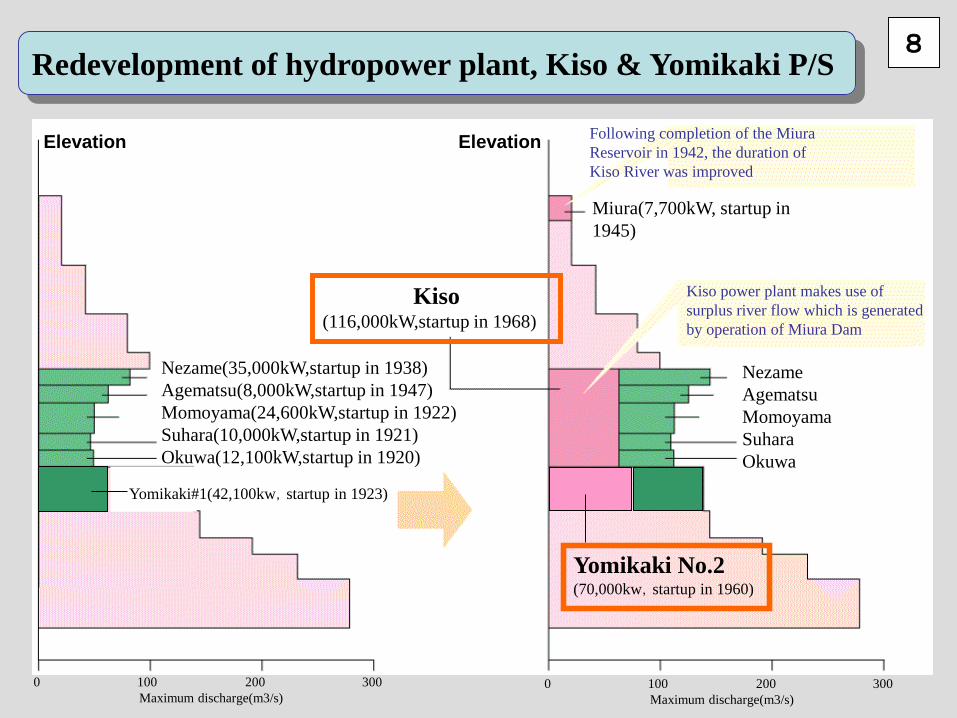
Redevelopment of hydropower plant, Kiso & Yomikaki P/S
Following completion of the Miura
Reservoir in 1942, the duration of
Kiso River was improved
Kiso power plant makes use of
surplus river flow which is generated
by operation of Miura Dam
Miura(7,700kW, startup in
1945)
Kiso(116,000kW,startup in 1968)
Nezame
Agematsu
Momoyama
Suhara
Okuwa
Nezame(35,000kW,startup in 1938)
Agematsu(8,000kW,startup in 1947)
Momoyama(24,600kW,startup in 1922)
Suhara(10,000kW,startup in 1921)
Okuwa(12,100kW,startup in 1920)
0 100 200 300
Maximum discharge(m3/s)0 100 200 300
Maximum discharge(m3/s)
Yomikaki No.2(70,000kw,startup in 1960)
Yomikaki#1(42,100kw,startup in 1923)
8
Elevation Elevation

38.40 m3/s
Ookuwa P/S
38.40 m3/s
Ookuwa P/S36.17 m3/s
Suhara P/S
37.57 m3/s
Momoyama P/S
36.17 m3/s
Suhara P/S
37.57 m3/s
Momoyama P/S
48.65 m3/s
Agematsu P/S
48.65 m3/s
Agematsu P/S
65.80 m3/s
Nezame P/S
65.80 m3/s
Nezame P/S
Kiso Dam
Kiso water intake Dam
Kiso P/S
The position of Kiso power plant9
Miura Dam
Kiso water intake weir
New power system with higher efficiency
⇒Prioritized operation
Nezame P/S
bottom
top

Dam
Yomikaki No.2
power plant
: Old system : New system
Weir
Yomikaki No.1
power plant
Development image of Yomikaki No.2 power plant10

No.1 plant headrace tunnel
Newly constructed
Yomikaki Dam
Redeveloped No.1
plant intake
Newly constructed
No.2 plant intake
Cross-section of No.1 plant intake
Decommissioned part of
No.1 plant headrace tunnel
Optimal use of existing facilities11

・History of hydropower development
・Improvement of the river flow
・Redevelopment of existing power plants
■ Integrated management of sedimentation in the Kurobe River system
Contents
■Integrated management of water resources in the Kiso River system
・Sediment
・Flushing Operation
■Consistent development of the whole river system
12

Kurobe Dam
Kurobe No.4
Kurobe No.3
Shin’kurobe No.3
Shin’kurobe No.2
Kurobe No.2
0 5 10 15(km)
Kuronagi No.2
Yanagawara
Aimoto
Otozawa
Kurobe River O River Sasa River
The sea of Japan
Hydropower development in the Kurobe River System
Unazuki
13

Kurobe Dam 14
Kurobe Dam
Height:186m (the highest in
Japan)
Kurobe River No.4 Power
Plant
Maximum output:335,000kW
Maximum discharge:
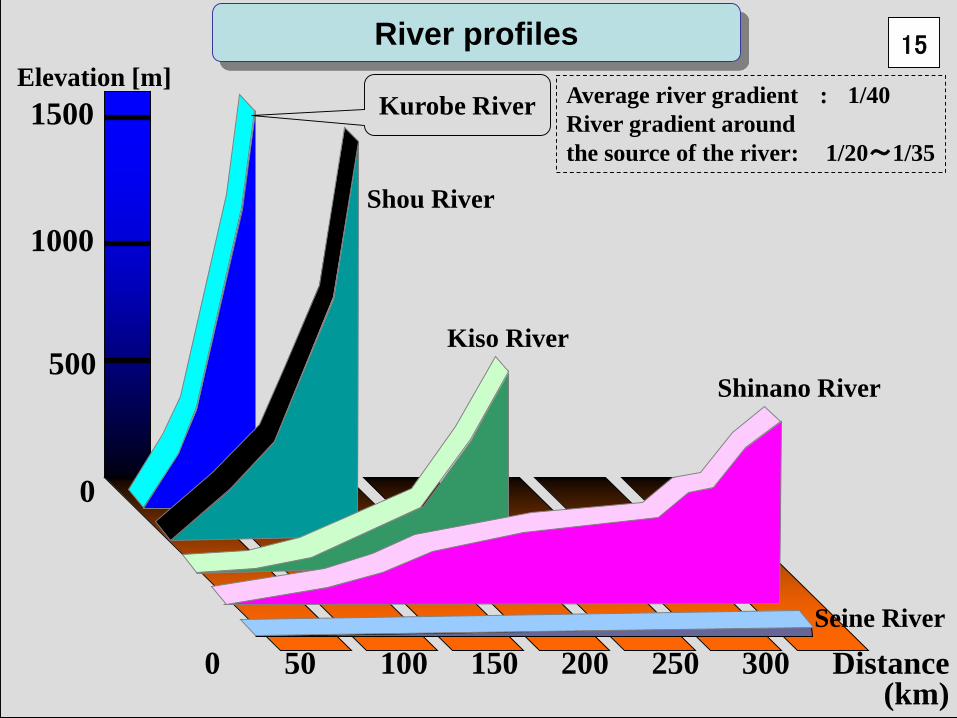
Seine River
Shinano River
Kiso River
Shou River
0 50 100 150 200 250 300 Distance(km)
Elevation [m]
1500
1000
500
0
Kurobe River Average river gradient : 1/40
River gradient around
the source of the river: 1/20~1/35
River profiles 15

• The amount of inflowing sediment into dams is huge
compared with reservoir capacities.
• It is difficult to transport excavated or dredged materials to
the downstream under the conditions of steep gorge.
A more comprehensive soil management approach is needed.
Background of flushing operation 16
Blocking the flow of sand and soil causes
■raising the riverbed at the upstream
■lowering the riverbed or coastline set back at the downstream
Situation

Slide Gate
Roller gate
Radial gate
Flushing channel
Flushing channel
Upstream Longitudial section
Spillway
gate
Head tank
Power
Station
Catchment area
Name Otozawa
Maximum Output 124MW
Type Concrete gravity
Height 76.7m
Length 136.0m
Total Capacity 9.01 x 10⁶ m
3
Effective Capacity 1.66 x 10⁶ m
3
Operation area 18m
Number 2
Area 5.0 x 5.0m
Upstream Slide gate
Center Roller gate
Downstream Radial gate
Flushing gate
461.18 km2
Power Plant
Dam
Reservoir
Flushing channel
Outline of Dashidaira dam 17

Slide gate
Roller gate
Radial gate
Flushing channel
For maintenance
For flushing control
For prevention of seepage
Moving protection
flame
Flow
Outline of flushing facilities 18

Drawdown
Flushing
through a low-level outlet
Refill
Unazuki Dam
Unazuki Dam
Unazuki Dam
Dashidaira Dam
Dashidaira Dam
Dashidaira Dam
Flushing operation 19

20

0
100
200
300
400
500
600
700
800
900
Dat
a19
8519
8619
8719
8819
8919
9019
9119
9219
9319
94
1995
/6
1995
/7
1995
/11
1996
1997
1998
1999
2000
2001
2002
2003
/7
2004
/7
2005
/7
2006
/7
2007
/6
2008
/6
2009
/7
2010
/6
Acc
um
ula
ted s
edim
ent
Initial flushing
460,000m3
[x104m
3]
Test flushing
80,000m3
Trial flushing
20,000m3
1995
Huge flood
Emergency flushing
1,720,000m3
Emergency flushing
800,000m3
Emergency flushing
460,000m3
340,000m3
700,000m3
590,000m3
60,000m3
280,000m3
510,000m3
240,000m3
90,000m3
120,000m3
350,000m3
370,000m3
160,000m3
Flushing
Cooperative flushing
Sedimentation volume of Dashidaira reservoir 21

The end