The Consequences of Residential Infill Development on ... · The sample of case studies ... Where...
41
The�Consequences�of Residential�Infill�Development�on Existing�Neighborhoods in�the�Treasure�Valley a�Study�and�Conclusions IDAHO ULI�Idaho and
Transcript of The Consequences of Residential Infill Development on ... · The sample of case studies ... Where...
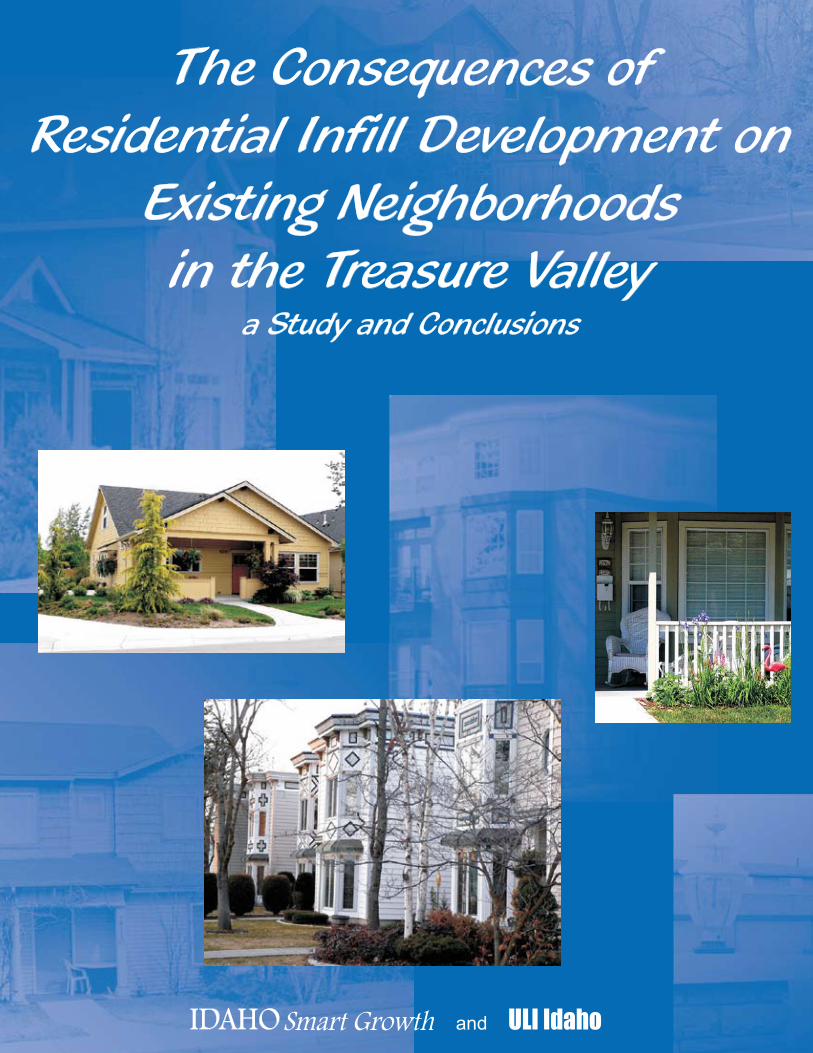
The�Consequences�ofResidential�Infill�Development�on
Existing�Neighborhoodsin�the�Treasure�Valley
a�Study�and�Conclusions
IDAHO ULI�Idahoand
Idaho�Smart�GrowthPO�Box�374
Boise,�ID�83701www.idahosmartgrowth.org
ULI�IdahoPO�Box�8463
Boise,�ID�83707www.idaho.uli.org
ULI�IdahoUrban�LandInstituteULI
�
The Consequences of Res�dent�al Inf�ll Development on
Ex�st�ng Ne�ghborhoods �n the Treasure Valley
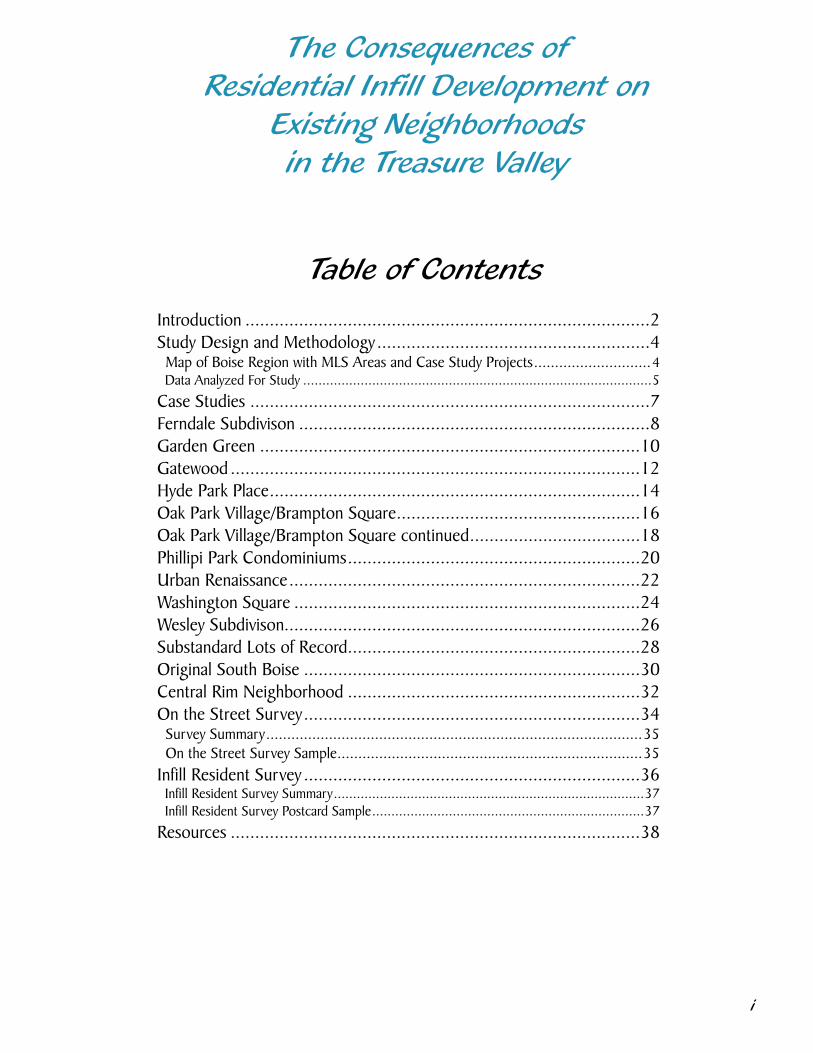
Table of ContentsIntroduction....................................................................................2Study.Design.and.Methodology.........................................................4..Map.of.Boise.Region.with.MLS.Areas.and.Case.Study.Projects.............................4..Data.Analyzed.For.Study............................................................................................5
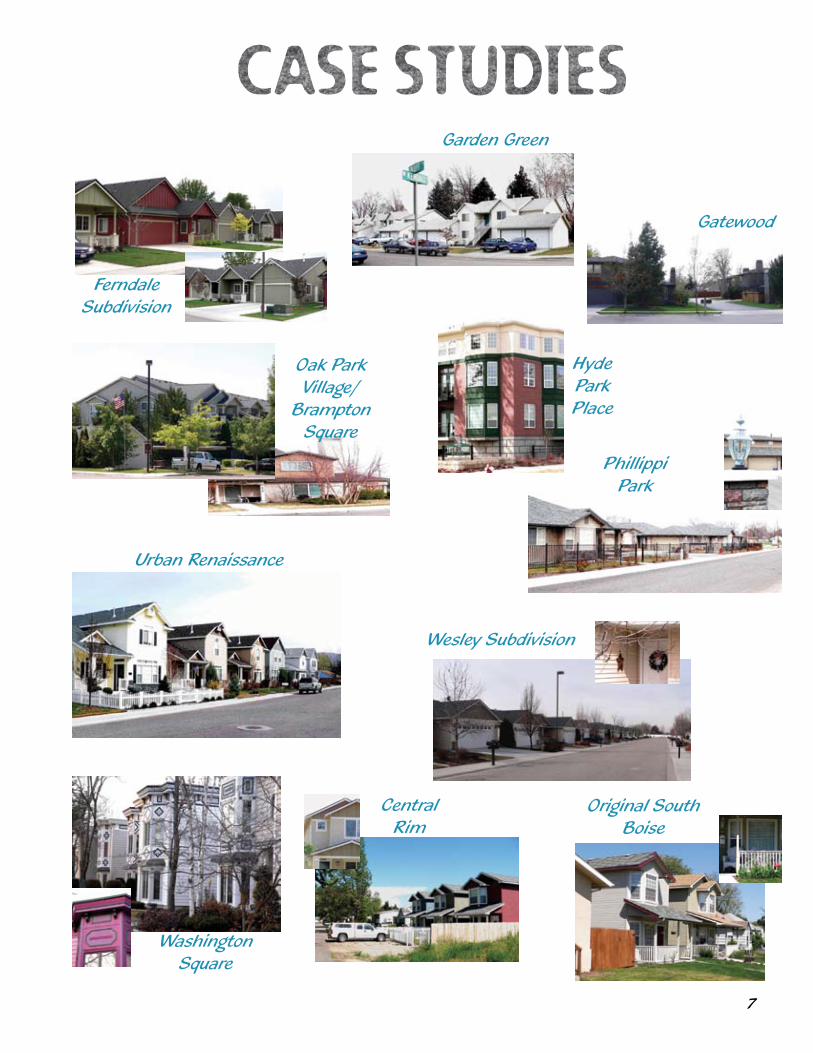
Case.Studies...................................................................................7Ferndale.Subdivison.........................................................................8Garden.Green...............................................................................10Gatewood.....................................................................................12Hyde.Park.Place.............................................................................14Oak.Park.Village/Brampton.Square...................................................16Oak.Park.Village/Brampton.Square.continued....................................18Phillipi.Park.Condominiums.............................................................20Urban.Renaissance.........................................................................22Washington.Square........................................................................24Wesley.Subdivison.........................................................................26Substandard.Lots.of.Record.............................................................28Original.South.Boise......................................................................30Central.Rim.Neighborhood.............................................................32On.the.Street.Survey......................................................................34..Survey.Summary...........................................................................................35..On.the.Street.Survey.Sample..........................................................................35Infill.Resident.Survey......................................................................36..Infill.Resident.Survey.Summary..................................................................................37..Infill.Resident.Survey.Postcard.Sample........................................................................37
Resources.....................................................................................38

��
This.study.was.facilitated.by.Idaho.Smart.Growth.and.supported.by.ULI.Idaho..Idaho.Smart.Growth.and.ULI.Idaho.would.like.to.thank.the.Urban.Land.Institute.and.the.ULI.Community.Action.Grant.program.for.supporting.this.study..Without.their.gen-erous.support.this.research.would.not.have.happened..
Thank.you.to.Boise.State.University.who.offered.in.kind.support.from.a.faculty.mem-ber,.a.graduate.assistant,.and.an.undergraduate.intern.who.assisted.in.writing.the.survey.instruments,.conducting.phone.interviews.and.compiling.the.survey.data..
In.addition.the.Ada.County.Assessor’s.Office,.Ada.County.Highway.District,.Boise.City.Planning.and.Development.Services,.and.City.of.Meridian.Development.Servic-es.offered.invaluable.help.in.gathering.existing.data.on.property.values,.traffic.counts.and.development.application.records,.help.that.was.greatly.appreciated..Thanks.go.them.as.well..
We.offer.a.heartfelt.thank.you.to.all.of.the.volunteers.from.neighborhood.associa-tions,.developers,.and.real.estate.agents.for.the.time.they.spent.conducting.on-the.street.interviews.and.phone.surveys.with.neighbors.of.the.infill.projects.studied.
Finally,.we.thank.the.following.individuals.who.generously.gave.their.time.to.serve.on.the.study.team.throughout.the.project:
♦.Chris.Blanchard:.Graduate.Assistant,.Boise.State.University♦.Brad.Hawkins.Clark:.Community.Planner,.City.of.Meridian♦.Lance.Evans:.Neighbrohood.Planner,.Boise.City♦.Bryant.Forrester:.Real.Estate.Agent,.Homeland.Realty♦.John.Franden:.Commissioner,.Ada.County.Highway.District♦.Fred.Fritchman:.President,.Southeast.Boise.Neighborhood.Assn.♦.Marilee.Fuller:.Deputy.Assessor,.Ada.County.Assessors.Office♦.Quentin.Knipe:.Attorney,.Stoel.Rives,.ULI.Idaho♦.Diane.Kushlan.AICP:.Planner,.Planning.&.Management.Services♦.Leslie.Martin:.Assistant.Professor,.Sociology,.Boise.State.University♦.Deanna.Smith:.President,.East.End.Neighborhood.Assn.,.Board.Member.ISG♦.David.Southers:.Developer,.Real.Estate,.Owner.Southers.Properties
Idaho.Smart.Growth.enjoyed.working.closely.with.these.organizations.and.individuals.to.explore.the.consequences.of.infill.in.the.Boise.area..It.is.our.hope.that.the.trends.and.conclusions.identified.will.assist.local.governments.in.their.efforts.to.encourage.sustainable.development.
Elaine.Clegg.Special.Projects.Manager,.Idaho.Smart.Growth
Acknowledgements

�
The Consequences of Residential Infill Development
on Existing Neighborhoods in the Treasure Valley
a Study and Conclusions

�
IntroductionExecutive Summary
In 2004, the Urban Land Institute awarded a community action grant to the newly formed Idaho District Council in partnership with Idaho Smart Growth. The purpose of the grant was to examine in-fill projects to determine if the feared conse-quences voiced by neighborhoods during the approval process could be substantiated.
The study was conducted over a three year period with assistance from Boise State University, the Ada County Assessor’s Of-fice, the Ada County Highway District, the Cities of Meridian and Boise, builders and developers, and neighborhood association leaders. After considering eighteen projects for possible inclusion in the study, twelve completed infill projects were analyzed. Case studies review the following:• Hearing records and available public
comments were examined for each project. No hearing records exist for substandard lot developments, or ‘skinny houses’, comments were documented from neighborhood plans. • Changes in property valuation based on
actual sales prices were evaluated for the neighborhoods surrounding the projects and compared to the Multiple Listings Service (MLS) valuations for that area. • Traffic conditions before/after were as-
sessed using before/after traffic counts.
• Current parking conditions were com-pared to the testimony on parking. • A door-to-door survey was conducted
in each neighborhood of neighbors found at home who were willing to take the time to answer questions about their opinions of the neighborhood and the project. • A mail survey was sent to residents of
the chosen projects. • Finally, neighbors who had testified at the
hearings and the developers of the projects were interviewed by the team.
The general findings of the study are that many of the factors that create ap-prehension about infill projects are difficult to measure or their effects are difficult to assess. These factors include density, neigh-borhood incompatibility, design, and lack of public amenities. The sample of case studies is relatively small, but the quantifiable data was remarkably consistent between the proj-ects. For the factors that can be quantified, including traffic, parking and property values the community fears are generally unfounded for the cases studied. Researchers recognize due to the small sample size that conclu-sions should not be assumed for infill in general and would welcome additional case studies and a comparison of findings.
Conclusions1.Thereisnoevidencethattheinfilldevelopmentsstudiedforthisreportcreateharmfultrafficimpactsontheexistingsurroundingneighborhoods.
In all but three infill cases studied the traffic counts were flat or decreased on sur-rounding roads after the infill projects were completed. Reasons varied; for instance traffic decreases near Oak Park/Brampton are likely due to changes in regional traffic, and near Hyde Park Place the prior use (School Administration Building) may have generated more traffic than the new development. Reasons for decreases near other developments were less evident. Where traffic increased near Urban Renaissance and Wesley Subdivision the likely sources are new large commercial developments nearby and not the infill projects.
Where the studied projects contributed to congestion or safety other factors were also in evidence. For instance Wesley does contribute to congestion on adjacent arterials, but lack of roadway connectivity and the large commercial developments nearby are key to traffic congestion in the area surrounding this project. The traffic generated by Garden Green has created safety concerns that are exacerbated by existing conditions of limited connectivity, substandard roads and a lack of sidewalks. The study also demonstrates that these kinds of issues can be mitigated as in the case of Oak Park/Brampton.
Researchers concluded:
�. There is no evidence of harmful effects of traffic
from infill on existing neighborhoods. In 75% of cases traffic was flat or
down, where traffic was up lack of roadway connectivity
increased the traffic impacts.
�. There is no clear evidence that infill developments depress property values.
3. Infill developments are perceived by the neighbors
to provide few public amenities.
4. The loss of both public and private neighborhood open space is deeply felt.
5. Design quality can positively affect acceptance
of infill developments.
6. There is a lack of understanding by the public
of project goals and their consistency with adopted
plans and regulations.
7. Density did not correlate to perceived acceptance of
case study projects.
3
Conclusions continued2. Researchersfoundnoevidencethatinfilllowerssurroundingpropertyvalue.
The question of property values is much more complicated than infill supporters/opponents may think. Property value trends were up across the study though not always in sync with the regional trend. The one exception was the sales price trend around Washington Square in the early 1980’s when prices in the region were stagnate. Researchers could not directly attribute property value changes to the infill projects studied. Factors such as house size and location may affect the trends as much as infill, and the region shows growing evidence of property values (and taxes) rising very quickly near the projects studied.
Many of the neighborhoods studied are located close to the city center and close to services, both factors which can drive property values up. Additionally many of the houses in the areas studied were smaller in size than newer houses in the region, generally resulting in lower sales prices but higher prices per square foot - particularly in the more desirable locations. Finally, factors such as the upkeep of surrounding properties and other new development nearby also affect values. 3. Providing‘public’amenities[ornot]affectsperceptionsofprojectslongafterthey’recomplete.
Clearly the perception of the public today is that the infill, at least for the projects we studied, does not provide ameni-ties to the larger neighborhood - eight of the eleven neighborhoods surveyed gave this question the lowest score. Projects that provided amenities that are, or are perceived to be, available to the public and not just to residents of the project show evidence of earning acceptance from neighbors. These include features such as neighborhood pathways, crosswalks, or the preservation of mature trees. We know of one instance, Oak Park/Brampton, where the addition of neighborhood amenities helped the project gain neighborhood support during the application process. 4. Lossofneighborhoodopenspaceisstronglyperceivedasanegativeimpact.
There is a real (and sometimes emotional) attachment to the loss of open space within the neighborhoods studied. This can be felt long after a development is complete and was true for spaces that the neighborhood had used for recreation, enjoyed for its aesthetic appeal and even for spaces that had been unkempt. 5. Thequalityofdesigncanaffectacceptanceofaproject.
Design quality can affect acceptance of projects both early in the process and after the project is complete. For instance, in the case of Urban Renaissance the willingness to respond to neighbors suggestions seemed to help the project proceed despite continued concerns about density and traffic. At Philippi Park the higher than average acceptance of the project after the fact is anecdotally tied to high quality design and the design of Hyde Park Place has helped it to gain high acceptance today despite continued regret over the loss of an historic school structure. Garden Green on the other hand may never find acceptance and both the developer and neighbors mention poor design quality as a factor. 6. Controversyisintensifiedbymisunderstandingandincompleteimplementationofinfillgoals.Whenthepermitprocessrequiresvariancesorexceptionstheseareopposed,evenwhensupportedbyplansandgoals.
There seems to be an incomplete understanding of and agreement with comprehensive plan goals in many cases studied. Reactions indicate this affected the extent and strength of opposition, particularly in neighborhoods that originally developed on the rural fringe and are now redeveloping in a more urban pattern. In addition goals sometimes call for infill yet require a rezone or land use map amendment to support it. For instance this was evident at Ferndale where 45 neighbors signed a petition of con-cern about neighborhood integrity over a project that was 1/3 less dense than allowed, but needed to obtain variances to allow a different product type and more creative design. Ferndale is also in an area described as an urban village in comprehensive plan goals but still designated as low density residential on the land use map. At Philippi Park the density was not much different than other nearby development, but the permit process spurred a great deal of opposition, in part because the auto court site design required a conditional use permit. 7. Densitydidnotcorrelatetoperceivedacceptanceofcasestudyprojects.
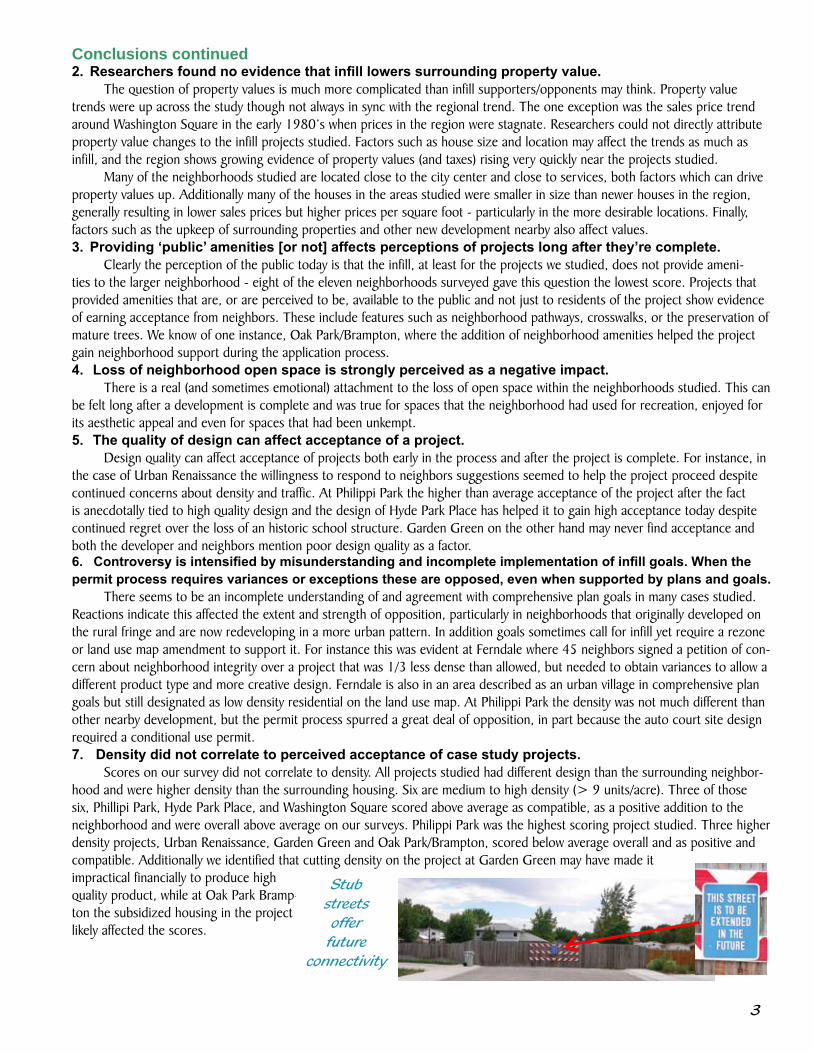
Scores on our survey did not correlate to density. All projects studied had different design than the surrounding neighbor-hood and were higher density than the surrounding housing. Six are medium to high density (> 9 units/acre). Three of those six, Phillipi Park, Hyde Park Place, and Washington Square scored above average as compatible, as a positive addition to the neighborhood and were overall above average on our surveys. Philippi Park was the highest scoring project studied. Three higher density projects, Urban Renaissance, Garden Green and Oak Park/Brampton, scored below average overall and as positive and compatible. Additionally we identified that cutting density on the project at Garden Green may have made it impractical financially to produce high quality product, while at Oak Park Bramp-ton the subsidized housing in the project likely affected the scores.
Stub streets offer
future connectivity
4
BackgroundThe study was facilitated by Idaho
Smart Growth and led by a committee of twelve interested individuals represent-ing Idaho Smart Growth, ULI Idaho, Boise State University, Realtors, Infill Developers, Neighborhood Associations, City Planners, The Ada County Assessor’s Office, and the Ada County Highway District (ACHD).
The Committee examined documenta-tion about infill and agreed on a definition of infill and on criteria to identify potential case study projects for this study (page 4). Com-mittee members began investigating projects in the region for possible inclusion in the study. Eighteen potential projects met the criteria and were nominated for study, after further examination 12 were chosen for case studies (map below).
Study Design and Methodology
Information was gathered about the projects based on the outline on page 4 and findings for each project are reported in the case study sections that follow. Residents of the infill case study projects were surveyed and the results of that survey can be found on pages 36 and 37.
The city planning departments of Boise and Meridian, Ada County Assessors Office, the Ada County Highway District and two Boise State interns were invaluable in help-ing researchers collect existing data for the case studies and we thank them. The project team also thanks the volunteers who helped the team collect original data by conducting phone interviews and neighborhood surveys.
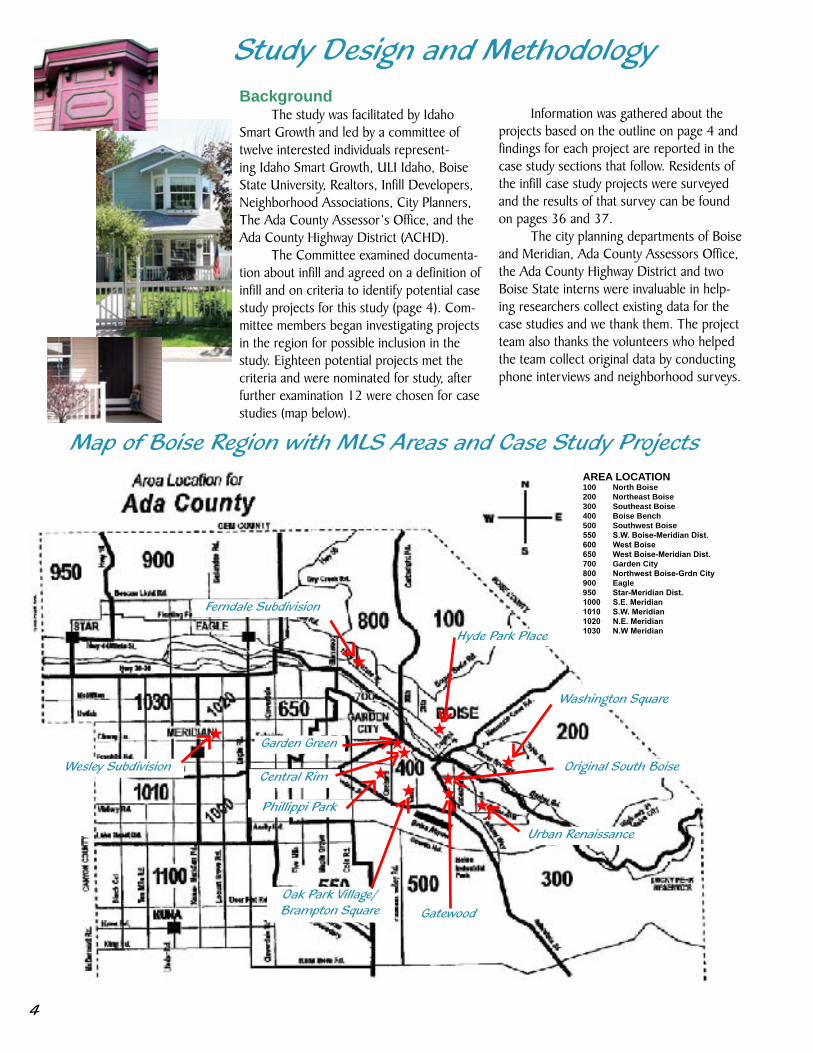
Map of Boise Region with MLS Areas and Case Study Projects
Wesley Subdivision
Ferndale Subdivision
Urban Renaissance
Washington Square
Oak Park Village/ Brampton Square Gatewood
Phillippi Park
Central Rim
Garden Green
Original South Boise
Hyde Park Place
H
H
H
HH
H HH
H
H
H
AREA LOCATION100 North Boise200 Northeast Boise300 Southeast Boise400 Boise Bench500 Southwest Boise550 S.W.Boise-MeridianDist.600 WestBoise650 WestBoise-MeridianDist.700 Garden City800 NorthwestBoise-GrdnCity900 Eagle950 Star-MeridianDist.1000 S.E.Meridian1010 S.W.Meridian1020 N.E.Meridian1030 N.WMeridian
5
ExistingDataAssembled1. Develop project profile [project
name, year built, dwelling type, density (# of Units/# of acres = # of dwelling units/acre), prior use of land, adjacent uses], and description of surrounding residential properties based on the same measures.
2. Collect information about neighbor-hood conditions and history.
3. Examine hearing and application records; document testimony for and against the project and document issues raised in testimony and during the application pro-cess. Create database of people who testified or participated in neighborhood meetings and of applicants/developers for subsequent interviews.
4. Traffic counts before and after - Gather average daily trips (ADT) on sur-rounding affected roadways before and after completion of case study project and docu-ment any change in ADT after completion from ACHD database. Look for confounding factors - e.g. background traffic increase in the region.
5. Compare sales prices and price per square foot of properties within a defined neighborhood area (see below) around each site with the same information for the entire Multiple Listing Services (MLS) Area that the case study site is located in. Collect and analyze data within each neighborhood area for five years prior to the construction of the project and five years after completion (or for as long as the project has been complete if less than five years) to establish a trend rate of valuation change during those peri-ods. The trend before construction will be compared with the trend after construction and analyzed for any differences from the trend in the MLS Area for those same years.
CriteriatoDefineNeighborhoodAreasforRealEstateCompari-sons
Assumptions used to define bound-aries of neighborhoods surrounding Case Study sites for purposes of comparing real estate values:
• The case study project size will shape the size of the neighborhood area, larger projects will generally generate larger neighborhood regions than smaller projects.
• The roadway network will affect the size of the neighborhood area chosen, a more connected network that allows more dispersed trips will usually gener-ate a smaller neighborhood area.
• Neighborhood area boundaries will generally take in account the type of residential properties that were pre-dominant in the neighborhood prior to the case study project construction.
• Neighborhood areas will generally not cross arterial roadways.
• Neighborhood boundaries need to be large enough that sufficient sales data exists for a statistically valid sample.
Original Data Collected1. Develop survey and conduct inter-
views of neighborhood leaders and members of the public who participated in meetings or testified for or against the case study proj-ects.
2. Develop survey and conduct inter-views of project case study applicants/devel-opers.
3. Develop and conduct survey of residents of case study projects.
4. Develop and conduct survey of residents who live nearby the case study project.
Data Analyzed For Study DefinitionofInfillAdoptedByProjectTeam:Infill: A development project within city limits on a site that is currently vacant or can be approved for redevelopment for a project where urban services are already available to service the case study project and where at least 80% of property within 300 feet is developed.
Criteria For Choosing Case Studies1. Projects that were both
controversial and non-controversial when proposed - compare and contrast the differences.
2. Projects should include density categories ranging from 6 units per acre to 50 units per acre - note differences in impacts.
3. Projects must be completed to allow a full assessment.
4. Projects must meet the definition of infill adopted by the study team.
5. Cases should collectively represent the opportunity to analyze both good and bad examples of:
a.Design b.Included Amenities c.Open space d.Neighborhood impacts e.Compatibility f.Traffic impacts g.Affect on property values6. Sites that were vacant prior
to the case study project being constructed or were redeveloped with the case study project.
7. Projects that are residential of all types [single family detached, townhouse, condominiums and apartments] *Note: studied the housing portion of Oak Park/Brampton Square that does have an adjacent mixed use component.
�
Ferndale Subdivision
Oak Park Village/
Brampton Square
Washington Square
Wesley Subdivision
Central Rim
Original South Boise
Urban Renaissance
Phillippi Park
Hyde Park Place
Garden Green
Gatewood

�
On-the-Street Survey
Infill Resident Survey
Ferndale SubdivisonYear built 2004Dwelling Type Patio Homes# of Units 13Size in Acres 2.55Units per Acre 5.09Prior use 1 SF Res.Adjacent Uses Large lot/Church
BackgroundThe Ferndale Subdivision consists of
13 dwelling units on 2.55 acres for a density of 5.09 d.u./acre. It was completed in 2004 in northwest Boise with 8 duplex units and 5 single family detached homes. The approval process required a conditional use permit and subdivision plat. The developer asked for waivers on lot size minimums and set-backs on the duplex lots. Surrounding uses include single family detached to the east, large lot residential (2 to 5 acres lots) to the south, small lot single family to the west and a church to the north. The site is just less than ½ mile north of a future transit stop on State Street. The land was previously vacant.
The developer held a neighborhood meeting attended by four people. The attendees were concerned about a street connection and cut-through traffic on their
street. That street was not extended and none of them subsequently testified at the hearings. Another street within the project was stubbed for a future street connection. Four people did testify or write letters, three in opposition. The opposition was centered mainly on density, traffic and incompatibility with existing large lot estates nearby. One letter declared that the nearby neighbor-hood school was over capacity, yet the Boise School District proposed to close that school because of declining enrollments in
2004. A petition requesting a moratorium on further development in the neighborhood until the zoning could be examined relative to the neighborhoods’ integrity was signed by 45 neighbors and submitted.
This is an area in transition. It devel-oped at the edge of the city with small farms and large lot housing on the edge of the historic streetcar line. Pockets of rural devel-opment remain and some residents still keep large animals. Newer developments with medium sized single family detached housing are interspersed randomly. The small houses and duplexes in Ferndale are different. The city comprehensive plan calls for new urban-ism and an urban village in the area - how-ever the land use map continues to indicate low density residential. Researchers note that the future vision reflected in the city com-prehensive plan goals doesn’t seem to be
understood or accepted by the neighborhood residents and there is little cognizance of plans for nearby high capacity transit service.
The existing R1-C zon-ing on the parcel allowed for up to twenty dwelling units, yet testimony centered on the thirteen units proposed as “excessive” density. Confusion may have risen over waivers requested in the conditional use process. While the aver-age lot size is larger than the minimum required in Boise code the project was granted a
waiver allowing some lots to be smaller than minimum with no setback required between units to create separate lots for each of the duplex units. This allowed for separate hom-eownership for these duplex townhouses.
A waiver was also granted on the cor-ner lot. Corner lots are required to be bigger so that buffer space from the roadways can be incorporated into them. The wavier al-lowed a smaller corner lot but required it to be a separate buffer lot, not a buildable
Demographic dataYears in home 11.69Rent/Own home 23/77Roundtrip Car Trips/day 2.96
Questions 1-151-disagree 3-neutral 5-agreeCompatible layout 2.46Good built amenities 2.92Good natural amenities 2.0Compatible design 2.75Preserved historic bldgs 2.36N’hood still affordable 3.46Project increased values 3.42Project positive addition 2.62N’hood pedestrian friendly 2.55N’hood safe for bikes 2.82Didn’t create more traffic 2.17Same quality parking 3.38Protected views/light 3.08Didn’t affect Air Quality 3.33As safe from crime 3.08
Demographic dataRent/Own home 0/100 Roundtrip Car Trips/day 2.67Questions Feel welcome in n’hood 100% Project positive addition 100% Favorite thing about n’hood Proximity/Low Maintenance/Friendly Neighbors 33% each Least favorite about n’hood None 100%
Aerial Map LegendInfill project
Neighborhood Area

�
Real Estate Data
Traffic Counts
lot. This provided more buffer space than would be incorporated into a buildable corner lot. Those oppos-ing the development did not seem to understand the reason for the waiver requests.Evaluation
This project scored moderately on the survey. Those surveyed do not believe the project includes amenities - giving the second lowest score on this question in all the projects studied. Though the project was required to add curb, gutter and sidewalks on both the collector and local streets, these amenities serve the residents of the project and the surrounding neighborhood still has no sidewalks. At neighbors’ request the developer was also required to build a surrounding fence, but neighbors asked for a pole fence and the fence constructed is solid wood and takes away the open feel of the neighborhood.
Respondents were also concerned about traffic and the compat-ibility of the project layout with the existing neighborhood, scoring both of these questions quite low. Recorded traffic counts show that traffic has decreased on the adjacent collector since 2001 by as much as 300 trips per day. A diversion completed at an intersection upstream may have lowered these counts. Traffic counts did increase by 50 trips per day after the project was completed. A count of traffic exiting the devel-opment shows 102 car trips per day.
Neighbors surveyed believe that the neighborhood maintained its affordability after the project was completed, and at the same time that property values in the area increased. The neighborhood area has an eclectic range of housing from very large lot single family to townhouses. Sales prices in the Ferndale area were increasing at a slower rate than MLS Area 800 before the project was complete and continued that trend in the year after, though at a higher pace. Price per square foot was rising faster than the MLS Area before the project and declined relative to the MLS Area in the year afterward, though again at a faster rate. Given the changing and eclectic nature of the Ferndale neighborhood it is difficult to pinpoint the factors most affecting values.Conclusion
Researchers found no firm evidence that the Ferndale Subdivision had a negative affect on the neighborhood and scores given the project are gener-ally moderate. The project introduced a different housing type into a traditionally rural neighborhood and the surrounding neighbors were uncertain of the difference and unsupportive of the density. Traffic increases have been minimal and the trends in real estate values are inconclusive. Agreement on how development in this neighborhood might meet the comprehensive plan goals for the area and a better understanding of waiver requests would help pro-vide certainty for both the neighborhood and future projects.
Ferndale Single Family
Ferndale Townhouses
Date Count am Nb am Sb pm Nb pm Sb Date Count am Nb am Sb pm Nb pm Sb
4/10/97 23491 706 735 1055 1020 9/4/97 1183 59 11 48 90
10/30/02 22107 734 750 1018 893 10/18/00 1156 60 17 46 77
11/19/02 21540 705 745 952 855 9/28/05 897 37 9 39 30
11/18/03 20235 605 657 873 903
4/10/97 23172 738 787 1028 1015 Date Count am Nb am Sb pm Nb pm Sb
11/19/02 20501 654 722 908 802
11/18/03 19487 607 665 863 867 8/7/95 1005
2/7/06 19822 655 619 848 841 12/10/96 1161 20 58 49 55
8/26/98 1561
3/21/95 2060 96 45 79 111 1/25/00 1243 40 61 71 53
1/7/97 2314 114 30 73 123 1/24/01 1141 25 59 60 53
3/19/97 2212 109 33 73 119 6/26/01 1510
12/10/03 2038 67 23 68 130 7/15/03 1769 35 45 74 64
3/2/06 2822 99 37 126 130 12/2/04 1305 35 60 60 48
1/5/05 1355 34 54 83 71
12/27/95 843 20 20 42 38
1/5/06 ADT 102
Date Count am Nb am Sb pm Nb pm Sb
Date Count am Nb am Sb pm Nb pm Sb
8/19/94 2159
10/13/94 2327 9/22/94 6872
10/6/99 1388 21 48 52 73 2/28/95 658811/8/00 1569 34 42 54 72 2/24/98 7508 258 279 386 331
2/4/04 1523 32 53 65 62 3/18/98 8378 382 318 435 375
3/3/05 1567 24 58 68 64 11/30/99 8085
10/26/00 7674
5/16/05 ADT 349 13 13 21 11 12/15/05 9191 402 320 437 428
12/21/95 12380 601 289 523 677
Date Count am Nb am Sb pm Nb pm Sb
5/29/96 11774 171 90 398 443
3/31/98 7533 2/3/99 10887 462 300 489 619
11/28/00 10020
11/16/94 6661 11/4/03 11200 522 347 462 618
11/17/04 5653 385 188 222 399
7/5/95 1471 20 75 107 523/31/98 9280 1/3/01 1408 21 60 122 60
1/9/01 7967 528 182 219 516 6/3/04 1587 32 69 87 67
9/29/04 7945 436 183 265 534
Date Count am Nb am Sb pm Nb pm Sb
Date Count am Nb am Sb pm Nb pm Sb
8/19/94 2159
10/24/95 2993 10/13/94 2327
10/1/96 2615 124 79 102 153 10/6/99 1388 21 48 52 73
11/19/96 2216 126 54 79 123 11/8/00 1569 34 42 54 72
4/15/97 2719 2/4/04 1523 32 53 65 62
3/9/99 2649 165 62 93 135 3/3/05 1567 24 58 68 64
11/2/99 2728
5/15/03 2722 138 41 90 171 7/12/93 1303
6/22/05 2481 108 23 90 121 9/15/93 13778/19/94 1672
5/16/05 ADT 32 1 1 2 4 10/13/94 1254
5/23/05 ADT 30 2 4 3 4 3/2/95 518
10/6/99 818 10 36 40 37
4/27/04 815
Date Count am Nb am Sb pm Nb pm Sb 3/3/05 901 13 26 48 33
4/5/00 12007 174 536 714 430
2/14/02 10890 132 566 656 398 Date Count am Nb am Sb pm Nb pm Sb
3/2/04 13283 201 742 733 491
4/20/06 18710 344 922 752 806 10/26/95 10764 483 238 651 615
5/1/96 13683
5/23/06 ADT 396 20 20 19 21 10/19/99 11095 492 177 469 556
11/5/02 10652 326 203 419 604
1/12/05 10011 315 231 369 494
Traffic Counts
Locust Grove north of Fairview
Beacon Street west of Broadway
Built:2002
Built:2002Wesley Subdivison
Original South Boise Village
Targee west of Orchard
Built:2003Phillipi Park
Cherry Lane West of Vista
Shoshone north of Cherry lane
Built:1998
Bluff daily trip counter
Battlement daily trip counter east of Pierce Park
Built:2002Ferndale Subdivison
Oak Park/Brampton Square
Manitou south of Boise Avenue
Built:1997Gatewood Subdivison
Pierce Park south of Hill Road
Vista North of Targee
Vista South of Targee
Garden Street north of Emerald
Roosevelt north of Emerald
Built:1999Urban Renaissance
Apple Street north of Bergeson
Built:2002Central Rim Neighborhood
Wright Street east of Apple Street
Apple Street south of Boise Avenue
Phillipi daily trip counter at project
Willowbrook daily trip counter
Garden Green
Built:1996
Hyde Park Place Built:2004
Garden Street north of Emerald
Fort St west of 9th
Fort St east of 13th
Fort St west of 13th
Ferndale Neighborhood before
$120,000
$140,000
$160,000
$180,000
$200,000
$220,000
$240,000
1999
2000
2001
2002
2003
2004
Av
g. S
ale
s P
ric
e
Ferndale
N'hood after
20042005
20042005
Year
$60.00
$70.00
$80.00
$90.00
$100.00
$110.00
$120.00
$130.00
$140.00
1999
2000
2001
2002
2003
2004
Year
Av
g. P
ric
e p
er
Sq
ua
re F
oo
t
MLS Area 800 Ferndale Neighborhood
Fern-
dale
built
Fern-
dale
built

10
On-the-Street Survey
Infill Resident Survey
Aerial Map LegendInfill project
Neighborhood Area
Year built 1998Dwelling Type 4-Plex# of Units 32Size in Acres 1.899Units per Acre 16.85Prior use VacantAdjacent Uses SF Residential
BackgroundGarden Green is a 32 unit develop-
ment in eight four-plex buildings on 1.89 (16.85 acres units/acre) in a single family residential neighborhood on the Central Bench Rim in Boise. The site was the last vestige of a farm and was largely vacant until Garden Green was built in 1998. Immedi-ately to the North below the grade of the rim is the I-84 connector, to the east and south are single family residences and to the west and disconnected from the neighbor-hood are commercial uses lining an arterial, Orchard Street.
The site is constrained by the inter-state and the commercial, leaving only one route in and out, with a secondary route on a shouderless road fronted by single family houses. Both routes traverse through the existing neighborhood for access and there are no sidewalks in most places.
There were a number of proposals for the property prior to the one that was eventually built; all of them were for multi-family projects at much higher density, up to 60 units. The approval process included a conditional use permit and a rezone and a reapplication of a modified conditional use permit after negotiation with the neighbor-hood. There were numerous public hearings, appeals, a denial and reapplication. Thirty-two people testified, all in opposition to the
project. The issues that were cited most often in opposition to the project included traffic congestion, high density, school overcrowding, hazards to children from traf-fic, incompatibility with surrounding neigh-borhood, parking issues, and architectural design issues.Evaluation
The approval process for Garden Green was acrimonious. In fact, years after the development was completed, both neighbors and the developer marvel at the hostility that characterized the process. During this period, residents formed a neighborhood association. Modifications to the developers’ plan came about through the course of gaining approval, reducing density (from 40 units to 33 units) and making small architectural and aesthetic changes in the buildings. Neither side was satisfied by
the compromises, and both agree that the changes in design made the apartments more suited for multi-person rentals, rather than family oc-cupancy.
All parties remain dissatisfied with the develop-ment of Garden Green today. Neighborhood activists con-tinue to be displeased with the project and the developer has abandoned working on infill in Boise because of his frustra-tion with the process. He felt that the project he wanted to build would have served the
interests of the City in increasing density close to the core, providing connectivity to the Greenbelt, and providing new investment in a struggling neighborhood. However, the compromises led to the development of a very different project, without enough units to support high quality construction.
Today residents express many concerns about both Garden Green and other changes in the immediate neighborhood. Surveyed residents found the project to not be a posi-
Demographic dataYears in home 8.22Rent/Own home 44/56Roundtrip Car Trips/day 4.33
Questions 1-151-disagree 3-neutral 5-agreeCompatible layout 2.83Good built amenities 3.0Good natural amenities 2.67Compatible design 3.17Preserved historic bldgs 2.71N’hood still affordable 3.0Project increased values 2..57Project positive addition 2.43N’hood pedestrian friendly 3.0N’hood safe for bikes 2.57Didn’t create more traffic 2.0Same quality parking 2.67Protected views/light 3.0Didn’t affect Air Quality 2.86As safe from crime 3.29
Demographic dataRent/Own home 100% Roundtrip Car Trips/day 2.25Questions Feel welcome in n’hood 75% Project positive addition 100% Favorite thing about n’hood Proximity to services 80% Least favorite about n’hood Surroundings unkempt 50%Noisy 25%Rowdy neighbors 25%
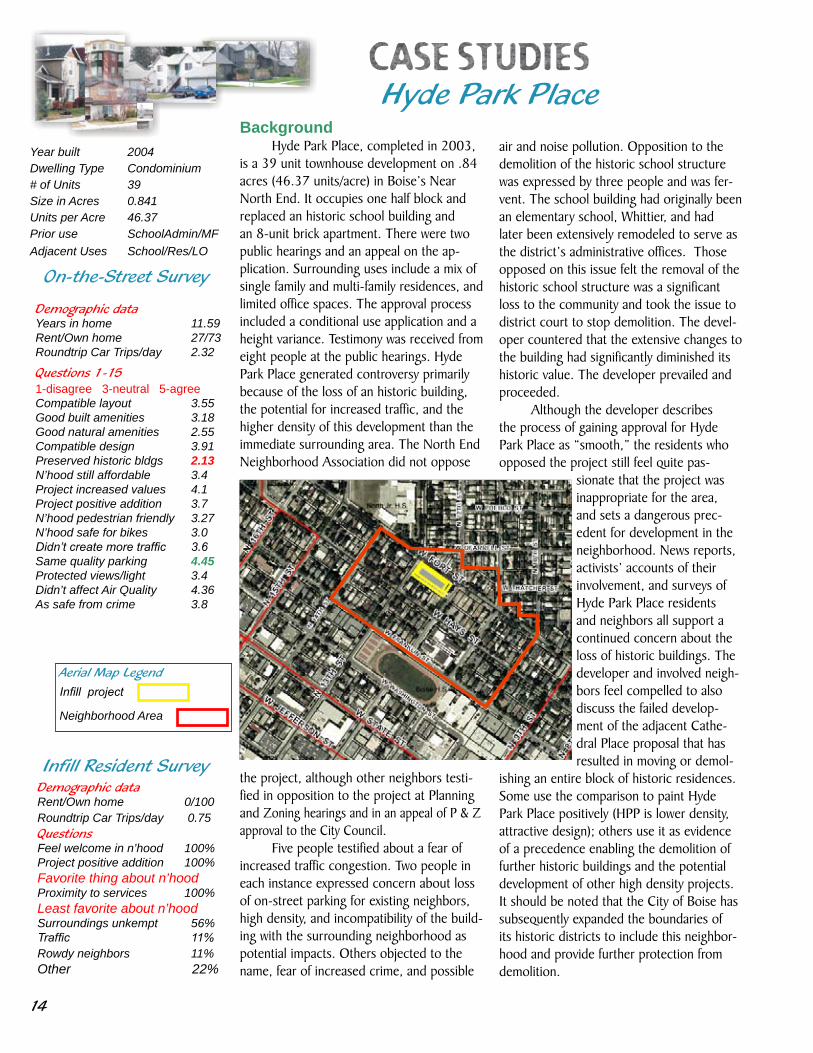
Garden Green
11
tive addition to the neighborhood. Neighbor perception is that Garden Green continues to attract short-term tenants*, and that high occupancy units increase traffic and parking problems. With the lowest mean score [of 2] in any of our neighborhood surveys, resi-dents believe Garden Green has increased traffic in the neighborhood. Finally, there is some concern that the acceptance of the higher density Garden Green project which is unlike other neighborhood dwellings in ap-pearance opened the door for the emergence of ‘skinny houses’ in the area. *This is the only project where infill residents failed to return any of the mail surveys.
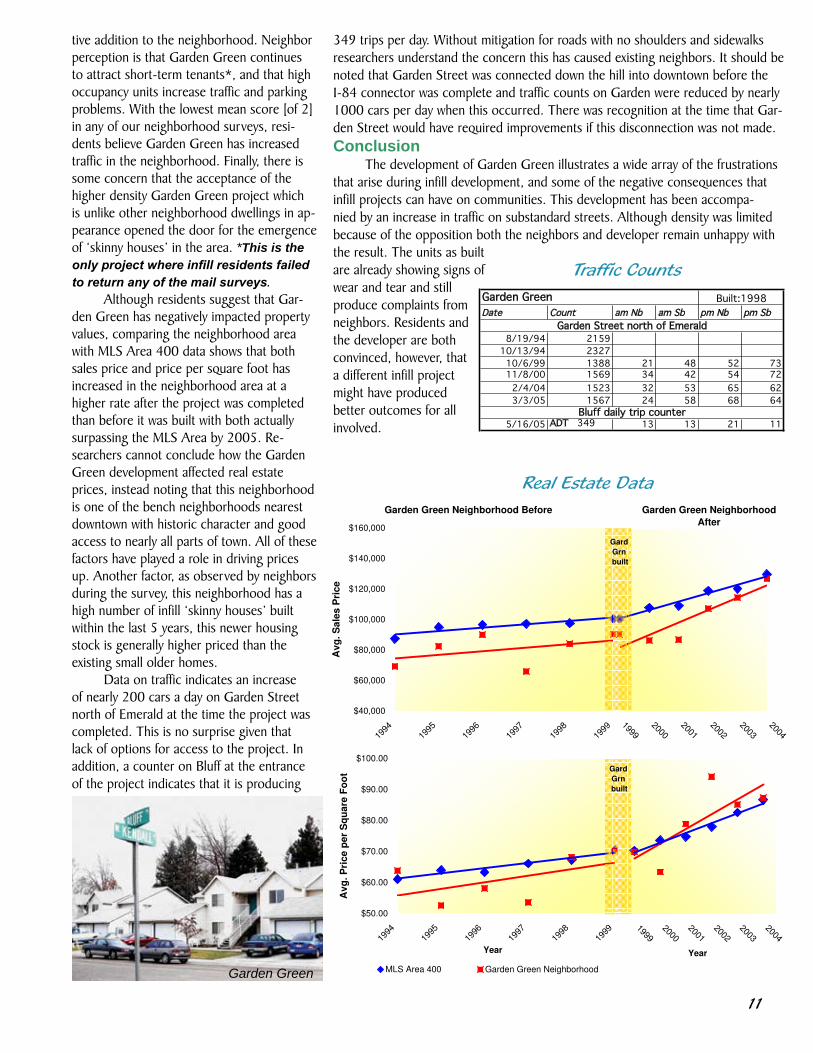
Although residents suggest that Gar-den Green has negatively impacted property values, comparing the neighborhood area with MLS Area 400 data shows that both sales price and price per square foot has increased in the neighborhood area at a higher rate after the project was completed than before it was built with both actually surpassing the MLS Area by 2005. Re-searchers cannot conclude how the Garden Green development affected real estate prices, instead noting that this neighborhood is one of the bench neighborhoods nearest downtown with historic character and good access to nearly all parts of town. All of these factors have played a role in driving prices up. Another factor, as observed by neighbors during the survey, this neighborhood has a high number of infill ‘skinny houses’ built within the last 5 years, this newer housing stock is generally higher priced than the existing small older homes.
Data on traffic indicates an increase of nearly 200 cars a day on Garden Street north of Emerald at the time the project was completed. This is no surprise given that lack of options for access to the project. In addition, a counter on Bluff at the entrance of the project indicates that it is producing
349 trips per day. Without mitigation for roads with no shoulders and sidewalks researchers understand the concern this has caused existing neighbors. It should be noted that Garden Street was connected down the hill into downtown before the I-84 connector was complete and traffic counts on Garden were reduced by nearly 1000 cars per day when this occurred. There was recognition at the time that Gar-den Street would have required improvements if this disconnection was not made.Conclusion
The development of Garden Green illustrates a wide array of the frustrations that arise during infill development, and some of the negative consequences that infill projects can have on communities. This development has been accompa-nied by an increase in traffic on substandard streets. Although density was limited because of the opposition both the neighbors and developer remain unhappy with the result. The units as built are already showing signs of wear and tear and still produce complaints from neighbors. Residents and the developer are both convinced, however, that a different infill project might have produced better outcomes for all involved.
Traffic Counts
Garden Green
Date Count am Nb am Sb pm Nb pm Sb Date Count am Nb am Sb pm Nb pm Sb
4/10/97 23491 706 735 1055 1020 9/4/97 1183 59 11 48 90
10/30/02 22107 734 750 1018 893 10/18/00 1156 60 17 46 77
11/19/02 21540 705 745 952 855 9/28/05 897 37 9 39 30
11/18/03 20235 605 657 873 903
4/10/97 23172 738 787 1028 1015 Date Count am Nb am Sb pm Nb pm Sb
11/19/02 20501 654 722 908 802
11/18/03 19487 607 665 863 867 8/7/95 1005
2/7/06 19822 655 619 848 841 12/10/96 1161 20 58 49 55
8/26/98 1561
3/21/95 2060 96 45 79 111 1/25/00 1243 40 61 71 53
1/7/97 2314 114 30 73 123 1/24/01 1141 25 59 60 53
3/19/97 2212 109 33 73 119 6/26/01 1510
12/10/03 2038 67 23 68 130 7/15/03 1769 35 45 74 64
3/2/06 2822 99 37 126 130 12/2/04 1305 35 60 60 48
1/5/05 1355 34 54 83 71
12/27/95 843 20 20 42 38
1/5/06 ADT 102
Date Count am Nb am Sb pm Nb pm Sb
Date Count am Nb am Sb pm Nb pm Sb
8/19/94 2159
10/13/94 2327 9/22/94 6872
10/6/99 1388 21 48 52 73 2/28/95 658811/8/00 1569 34 42 54 72 2/24/98 7508 258 279 386 331
2/4/04 1523 32 53 65 62 3/18/98 8378 382 318 435 375
3/3/05 1567 24 58 68 64 11/30/99 8085
10/26/00 7674
5/16/05 ADT 349 13 13 21 11 12/15/05 9191 402 320 437 428
12/21/95 12380 601 289 523 677
Date Count am Nb am Sb pm Nb pm Sb
5/29/96 11774 171 90 398 443
3/31/98 7533 2/3/99 10887 462 300 489 619
11/28/00 10020
11/16/94 6661 11/4/03 11200 522 347 462 618
11/17/04 5653 385 188 222 399
7/5/95 1471 20 75 107 523/31/98 9280 1/3/01 1408 21 60 122 60
1/9/01 7967 528 182 219 516 6/3/04 1587 32 69 87 67
9/29/04 7945 436 183 265 534
Date Count am Nb am Sb pm Nb pm Sb
Date Count am Nb am Sb pm Nb pm Sb
8/19/94 2159
10/24/95 2993 10/13/94 2327
10/1/96 2615 124 79 102 153 10/6/99 1388 21 48 52 73
11/19/96 2216 126 54 79 123 11/8/00 1569 34 42 54 72
4/15/97 2719 2/4/04 1523 32 53 65 62
3/9/99 2649 165 62 93 135 3/3/05 1567 24 58 68 64
11/2/99 2728
5/15/03 2722 138 41 90 171 7/12/93 1303
6/22/05 2481 108 23 90 121 9/15/93 13778/19/94 1672
5/16/05 ADT 32 1 1 2 4 10/13/94 1254
5/23/05 ADT 30 2 4 3 4 3/2/95 518
10/6/99 818 10 36 40 37
4/27/04 815
Date Count am Nb am Sb pm Nb pm Sb 3/3/05 901 13 26 48 33
4/5/00 12007 174 536 714 430
2/14/02 10890 132 566 656 398 Date Count am Nb am Sb pm Nb pm Sb
3/2/04 13283 201 742 733 491
4/20/06 18710 344 922 752 806 10/26/95 10764 483 238 651 615
5/1/96 13683
5/23/06 ADT 396 20 20 19 21 10/19/99 11095 492 177 469 556
11/5/02 10652 326 203 419 604
1/12/05 10011 315 231 369 494
Traffic Counts
Locust Grove north of Fairview
Beacon Street west of Broadway
Built:2002
Built:2002Wesley Subdivison
Original South Boise Village
Targee west of Orchard
Built:2003Phillipi Park
Cherry Lane West of Vista
Shoshone north of Cherry lane
Built:1998
Bluff daily trip counter
Battlement daily trip counter east of Pierce Park
Built:2002Ferndale Subdivison
Oak Park/Brampton Square
Manitou south of Boise Avenue
Built:1997Gatewood Subdivison
Pierce Park south of Hill Road
Vista North of Targee
Vista South of Targee
Garden Street north of Emerald
Roosevelt north of Emerald
Built:1999Urban Renaissance
Apple Street north of Bergeson
Built:2002Central Rim Neighborhood
Wright Street east of Apple Street
Apple Street south of Boise Avenue
Phillipi daily trip counter at project
Willowbrook daily trip counter
Garden Green
Built:1996
Hyde Park Place Built:2004
Garden Street north of Emerald
Fort St west of 9th
Fort St east of 13th
Fort St west of 13thGarden Green Neighborhood Before
$40,000
$60,000
$80,000
$100,000
$120,000
$140,000
$160,000
1994
1995
1996
1997
1998
1999
Avg
. S
ale
s P
rice
Garden Green Neighborhood
After
19992000
20012002
20032004
$50.00
$60.00
$70.00
$80.00
$90.00
$100.00
1994
1995
1996
1997
1998
1999
Year
Av
g.
Pri
ce
pe
r S
qu
are
Fo
ot
MLS Area 400 Garden Green Neighborhood
19992000
20012002
20032004
Year
Gard
Grn
built
Gard
Grn
built
Real Estate Data

12
On-the-Street Survey
Infill Resident Survey
GatewoodYear built 1997Dwelling Type SF/Townhouse# of Units 9Size in Acres 1.11Units per Acre 8.11Prior use Large lot Res.Adjacent Uses SF Residential
BackgroundGatewood is a nine unit single family
residential subdivision on 1.11 acres (8.108 units/acre) in South East Boise. The site was formerly one single family home with a pasture. The original home was saved and renovated as one of the units in the develop-ment. Two other units are street facing on the corner and the remaining six units are in a courtyard pattern with a shared driveway. The approval process included a conditional use permit and subdivision and an appeal.
Surrounding use is mostly single family residential, with a 10-acre city park, Manitou Park, less than one block away. Seventeen people testified at the public hearings. The biggest concern by far was the density of the project with fifteen people opposing
the density as too high. The surrounding neighborhood averages 4.656 units/acre. The lot that was redeveloped had tradition-ally been pastureland and was perceived by the neighborhood as open space.
There were other issues of concern as well. Three people were afraid of traffic congestion and two believed that the devel-opment was incompatible with the neighbor-hood. Also mentioned were; lack of parking, hazards to kids, negative impacts on quality of life, increased crime, landscaping issues, and loss of wildlife.
EvaluationAlthough the approval process was
fairly contentious, many neighbors and community activists are more ambivalent now about the impact of the project on the neighborhood. Several residents agree that the project as built is nice, and is a positive addition to the neighborhood; while others emphasize the loss of neighborhood conti-nuity and increased traffic. This ambivalence is reflected in survey results. Responses to questions about the compatibility of Gate-wood with the neighborhood, the impact of the development on traffic and parking in the neighborhood, and overall project impact produce lukewarm responses, with means between 2.9 and 3.3.
The central concern now in the neigh-borhood is the sense that this infill project opened the door for other, less desirable, types of infill and neigh-bors of Gatewood sug-gest that the prolifera-tion of ‘skinny house’ infill is in some way related to this project.
Neither Gate-wood (or for that mat-ter the ‘skinny houses’) appear to have had any negative impacts on property values in the neighborhood. The sales prices, though
lower than the MLS Area 400 due to smaller home size, have increased at a higher rate since the project was completed than before it was built, gaining on the MLS Area after-ward. Price per square foot nearly caught the MLS Area shortly after the project was built. The factors affecting these prices are more likely the desirable location and relative health of this older neighborhood than any effects from such a small infill development.
Another major concern was traffic which continues to be perceived by some as a problem. The data does not bear out this
Demographic dataYears in home 20.29Rent/Own home 14/86Roundtrip Car Trips/day 3.52
Questions 1-151-disagree 3-neutral 5-agreeCompatible layout 2.89Good built amenities 2.75Good natural amenities 2.56Compatible design 3.46Preserved historic bldgs 2.85N’hood still affordable 3.32Project increased values 3.0Project positive addition 2.89N’hood pedestrian friendly 3.15N’hood safe for bikes 3.26Didn’t create more traffic 3.07Same quality parking 3.25Protected views/light 3.0Didn’t affect Air Quality 3.62As safe from crime 3.36
Demographic dataRent/Own home 0/100 Roundtrip Car Trips/day 1.75Questions Feel welcome in n’hood 100% Project positive addition 100% Favorite thing about n’hood Proximity to services 75% Least favorite about n’hood Surroundings unkempt 50%New Skinny Houses 50%
Aerial Map LegendInfill project
Neighborhood Area

13
Real Estate Data
concern with traffic counts on Manitou fall-ing by nearly 300 trips a day since the project was built. In addition, the highway district had concerns about drainage from the development and included a requirement to detain all drain-age on site. This was eventually implemented using some roadway right-of-way (opposed by some in the neighborhood on the grounds that allowing the use of the right-of-way was favor-ing the developer). By chance this drainage swale created a traffic calming bulb out that has likely discouraged traffic on Martin and slowed it as well.
Traffic CountsDespite the small size of the project
and the proximity of public park open space the development of Gatewood was prob-lematic for neighbors who didn’t want to lose this open space in their neighborhood. Testimony at the time the project was built and anecdotes recited to surveyors show that the loss of this pasture and its habitat as open space continues to be felt as a negative impact today. Conclusions
Gatewood was opposed by many neighbors and even today some of those continue to feel the loss of open space despite a nearby public park. Loss of open space within neighborhoods is a recurrent theme among neighbors who have lived in the case study neighborhoods since before the projects were built. The concerns about negative effects from density and the traffic it might produce have not proven true. Prop-erty values in this neighborhood are increas-ing at rates faster than the MLS averages and the feelings about the project itself today are ambivalent with many people in the neigh-borhood finding it to be a pleasant addition to the community. The key infill concern of neighbors surveyed today is the proliferation of ‘skinny houses’ in the neighborhood.
Townhouses at Gatewood
Single Family portion of Gatewood
Date Count am Nb am Sb pm Nb pm Sb Date Count am Nb am Sb pm Nb pm Sb
4/10/97 23491 706 735 1055 1020 9/4/97 1183 59 11 48 90
10/30/02 22107 734 750 1018 893 10/18/00 1156 60 17 46 77
11/19/02 21540 705 745 952 855 9/28/05 897 37 9 39 30
11/18/03 20235 605 657 873 903
4/10/97 23172 738 787 1028 1015 Date Count am Nb am Sb pm Nb pm Sb
11/19/02 20501 654 722 908 802
11/18/03 19487 607 665 863 867 8/7/95 1005
2/7/06 19822 655 619 848 841 12/10/96 1161 20 58 49 55
8/26/98 1561
3/21/95 2060 96 45 79 111 1/25/00 1243 40 61 71 53
1/7/97 2314 114 30 73 123 1/24/01 1141 25 59 60 53
3/19/97 2212 109 33 73 119 6/26/01 1510
12/10/03 2038 67 23 68 130 7/15/03 1769 35 45 74 64
3/2/06 2822 99 37 126 130 12/2/04 1305 35 60 60 48
1/5/05 1355 34 54 83 71
12/27/95 843 20 20 42 38
1/5/06 ADT 102
Date Count am Nb am Sb pm Nb pm Sb
Date Count am Nb am Sb pm Nb pm Sb
8/19/94 2159
10/13/94 2327 9/22/94 6872
10/6/99 1388 21 48 52 73 2/28/95 658811/8/00 1569 34 42 54 72 2/24/98 7508 258 279 386 331
2/4/04 1523 32 53 65 62 3/18/98 8378 382 318 435 375
3/3/05 1567 24 58 68 64 11/30/99 8085
10/26/00 7674
5/16/05 ADT 349 13 13 21 11 12/15/05 9191 402 320 437 428
12/21/95 12380 601 289 523 677
Date Count am Nb am Sb pm Nb pm Sb
5/29/96 11774 171 90 398 443
3/31/98 7533 2/3/99 10887 462 300 489 619
11/28/00 10020
11/16/94 6661 11/4/03 11200 522 347 462 618
11/17/04 5653 385 188 222 399
7/5/95 1471 20 75 107 523/31/98 9280 1/3/01 1408 21 60 122 60
1/9/01 7967 528 182 219 516 6/3/04 1587 32 69 87 67
9/29/04 7945 436 183 265 534
Date Count am Nb am Sb pm Nb pm Sb
Date Count am Nb am Sb pm Nb pm Sb
8/19/94 2159
10/24/95 2993 10/13/94 2327
10/1/96 2615 124 79 102 153 10/6/99 1388 21 48 52 73
11/19/96 2216 126 54 79 123 11/8/00 1569 34 42 54 72
4/15/97 2719 2/4/04 1523 32 53 65 62
3/9/99 2649 165 62 93 135 3/3/05 1567 24 58 68 64
11/2/99 2728
5/15/03 2722 138 41 90 171 7/12/93 1303
6/22/05 2481 108 23 90 121 9/15/93 13778/19/94 1672
5/16/05 ADT 32 1 1 2 4 10/13/94 1254
5/23/05 ADT 30 2 4 3 4 3/2/95 518
10/6/99 818 10 36 40 37
4/27/04 815
Date Count am Nb am Sb pm Nb pm Sb 3/3/05 901 13 26 48 33
4/5/00 12007 174 536 714 430
2/14/02 10890 132 566 656 398 Date Count am Nb am Sb pm Nb pm Sb
3/2/04 13283 201 742 733 491
4/20/06 18710 344 922 752 806 10/26/95 10764 483 238 651 615
5/1/96 13683
5/23/06 ADT 396 20 20 19 21 10/19/99 11095 492 177 469 556
11/5/02 10652 326 203 419 604
1/12/05 10011 315 231 369 494
Traffic Counts
Locust Grove north of Fairview
Beacon Street west of Broadway
Built:2002
Built:2002Wesley Subdivison
Original South Boise Village
Targee west of Orchard
Built:2003Phillipi Park
Cherry Lane West of Vista
Shoshone north of Cherry lane
Built:1998
Bluff daily trip counter
Battlement daily trip counter east of Pierce Park
Built:2002Ferndale Subdivison
Oak Park/Brampton Square
Manitou south of Boise Avenue
Built:1997Gatewood Subdivison
Pierce Park south of Hill Road
Vista North of Targee
Vista South of Targee
Garden Street north of Emerald
Roosevelt north of Emerald
Built:1999Urban Renaissance
Apple Street north of Bergeson
Built:2002Central Rim Neighborhood
Wright Street east of Apple Street
Apple Street south of Boise Avenue
Phillipi daily trip counter at project
Willowbrook daily trip counter
Garden Green
Built:1996
Hyde Park Place Built:2004
Garden Street north of Emerald
Fort St west of 9th
Fort St east of 13th
Fort St west of 13th
Gatewood Neighborhood Before
$0
$50,000
$100,000
$150,000
$200,000
$250,000
1990
1991
1992
1993
1994
1995
1996
Avg
. S
ale
s P
ric
e
Gatewood Neighborhood After
1996
1997
1998
1999
2000
2001
2002
$-
$20.00
$40.00
$60.00
$80.00
$100.00
$120.00
$140.00
1990
1991
1992
1993
1994
1995
1996
Year
Avg
. P
ric
e p
er S
qu
are F
oo
t
MLS 300 Gatewood area
1996
1997
1998
1999
2000
2001
2002
Year
GW
built
GW
built
14
On-the-Street Survey
Infill Resident Survey
Hyde Park Place
Year built 2004Dwelling Type Condominium# of Units 39Size in Acres 0.841Units per Acre 46.37Prior use SchoolAdmin/MFAdjacent Uses School/Res/LO
Demographic dataRent/Own home 0/100 Roundtrip Car Trips/day 0.75Questions Feel welcome in n’hood 100% Project positive addition 100% Favorite thing about n’hood Proximity to services 100% Least favorite about n’hood Surroundings unkempt 56%Traffic 11%Rowdy neighbors 11%Other 22%
Demographic dataYears in home 11.59Rent/Own home 27/73Roundtrip Car Trips/day 2.32
Questions 1-151-disagree 3-neutral 5-agreeCompatible layout 3.55Good built amenities 3.18Good natural amenities 2.55Compatible design 3.91Preserved historic bldgs 2.13N’hood still affordable 3.4Project increased values 4.1Project positive addition 3.7N’hood pedestrian friendly 3.27N’hood safe for bikes 3.0Didn’t create more traffic 3.6Same quality parking 4.45Protected views/light 3.4Didn’t affect Air Quality 4.36As safe from crime 3.8
BackgroundHyde Park Place, completed in 2003,
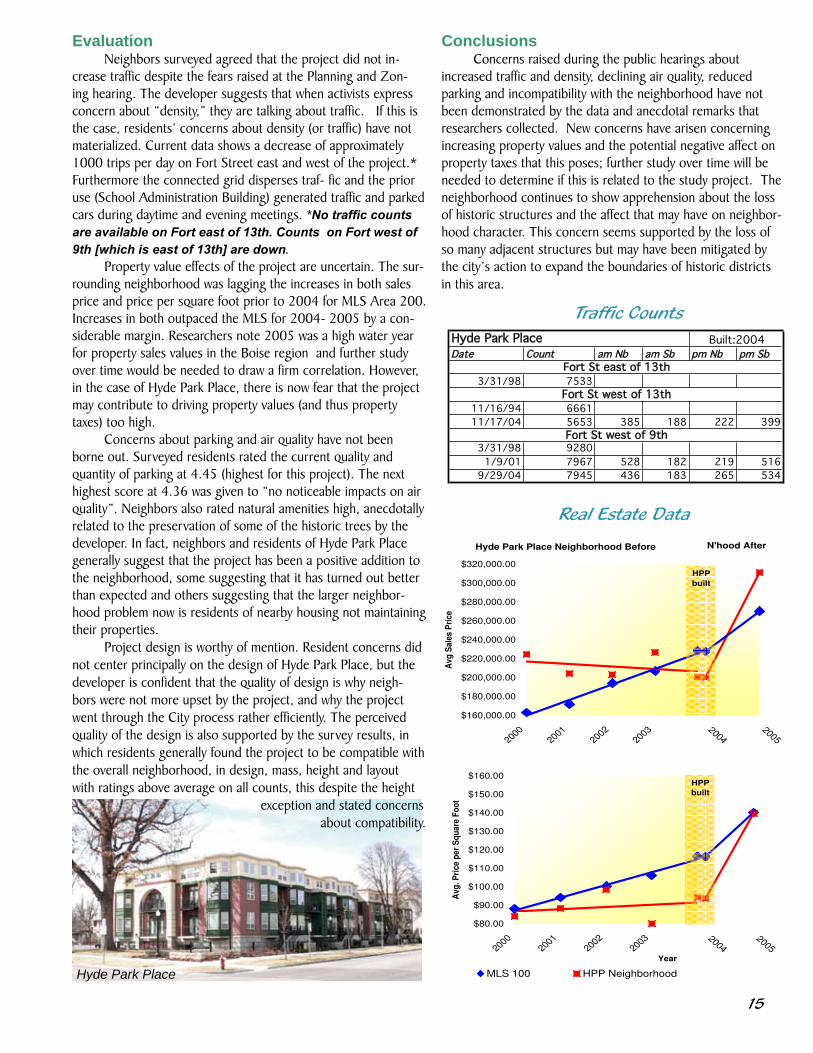
is a 39 unit townhouse development on .84 acres (46.37 units/acre) in Boise’s Near North End. It occupies one half block and replaced an historic school building and an 8-unit brick apartment. There were two public hearings and an appeal on the ap-plication. Surrounding uses include a mix of single family and multi-family residences, and limited office spaces. The approval process included a conditional use application and a height variance. Testimony was received from eight people at the public hearings. Hyde Park Place generated controversy primarily because of the loss of an historic building, the potential for increased traffic, and the higher density of this development than the immediate surrounding area. The North End Neighborhood Association did not oppose
the project, although other neighbors testi-fied in opposition to the project at Planning and Zoning hearings and in an appeal of P & Z approval to the City Council.
Five people testified about a fear of increased traffic congestion. Two people in each instance expressed concern about loss of on-street parking for existing neighbors, high density, and incompatibility of the build-ing with the surrounding neighborhood as potential impacts. Others objected to the name, fear of increased crime, and possible
air and noise pollution. Opposition to the demolition of the historic school structure was expressed by three people and was fer-vent. The school building had originally been an elementary school, Whittier, and had later been extensively remodeled to serve as the district’s administrative offices. Those opposed on this issue felt the removal of the historic school structure was a significant loss to the community and took the issue to district court to stop demolition. The devel-oper countered that the extensive changes to the building had significantly diminished its historic value. The developer prevailed and proceeded.
Although the developer describes the process of gaining approval for Hyde Park Place as “smooth,” the residents who opposed the project still feel quite pas-
sionate that the project was inappropriate for the area, and sets a dangerous prec-edent for development in the neighborhood. News reports, activists’ accounts of their involvement, and surveys of Hyde Park Place residents and neighbors all support a continued concern about the loss of historic buildings. The developer and involved neigh-bors feel compelled to also discuss the failed develop-ment of the adjacent Cathe-dral Place proposal that has resulted in moving or demol-
ishing an entire block of historic residences. Some use the comparison to paint Hyde Park Place positively (HPP is lower density, attractive design); others use it as evidence of a precedence enabling the demolition of further historic buildings and the potential development of other high density projects. It should be noted that the City of Boise has subsequently expanded the boundaries of its historic districts to include this neighbor-hood and provide further protection from demolition.
Aerial Map LegendInfill project
Neighborhood Area
15
Real Estate Data
EvaluationNeighbors surveyed agreed that the project did not in-
crease traffic despite the fears raised at the Planning and Zon-ing hearing. The developer suggests that when activists express concern about “density,” they are talking about traffic. If this is the case, residents’ concerns about density (or traffic) have not materialized. Current data shows a decrease of approximately 1000 trips per day on Fort Street east and west of the project.* Furthermore the connected grid disperses traf- fic and the prior use (School Administration Building) generated traffic and parked cars during daytime and evening meetings. *No traffic counts are available on Fort east of 13th. Counts on Fort west of 9th [which is east of 13th] are down.
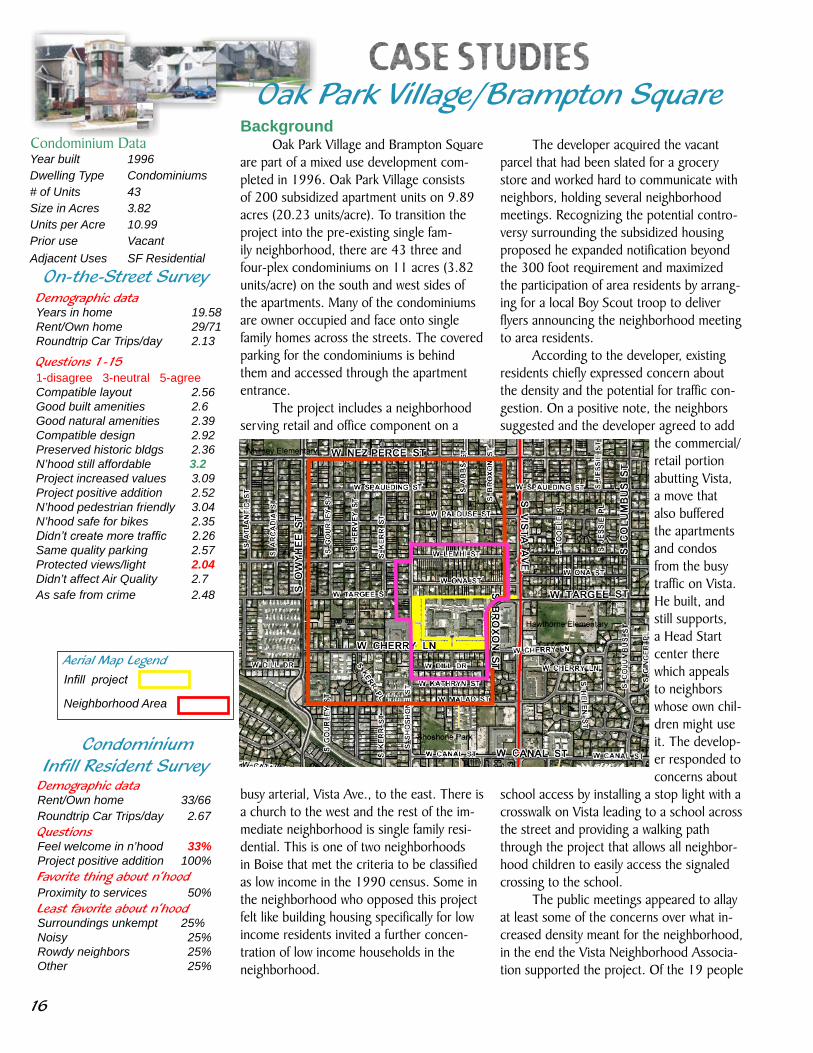
Property value effects of the project are uncertain. The sur-rounding neighborhood was lagging the increases in both sales price and price per square foot prior to 2004 for MLS Area 200. Increases in both outpaced the MLS for 2004- 2005 by a con-siderable margin. Researchers note 2005 was a high water year for property sales values in the Boise region and further study over time would be needed to draw a firm correlation. However, in the case of Hyde Park Place, there is now fear that the project may contribute to driving property values (and thus property taxes) too high.
Concerns about parking and air quality have not been borne out. Surveyed residents rated the current quality and quantity of parking at 4.45 (highest for this project). The next highest score at 4.36 was given to “no noticeable impacts on air quality”. Neighbors also rated natural amenities high, anecdotally related to the preservation of some of the historic trees by the developer. In fact, neighbors and residents of Hyde Park Place generally suggest that the project has been a positive addition to the neighborhood, some suggesting that it has turned out better than expected and others suggesting that the larger neighbor-hood problem now is residents of nearby housing not maintaining their properties.
Project design is worthy of mention. Resident concerns did not center principally on the design of Hyde Park Place, but the developer is confident that the quality of design is why neigh-bors were not more upset by the project, and why the project went through the City process rather efficiently. The perceived quality of the design is also supported by the survey results, in which residents generally found the project to be compatible with the overall neighborhood, in design, mass, height and layout with ratings above average on all counts, this despite the height
exception and stated concerns about compatibility.
ConclusionsConcerns raised during the public hearings about
increased traffic and density, declining air quality, reduced parking and incompatibility with the neighborhood have not been demonstrated by the data and anecdotal remarks that researchers collected. New concerns have arisen concerning increasing property values and the potential negative affect on property taxes that this poses; further study over time will be needed to determine if this is related to the study project. The neighborhood continues to show apprehension about the loss of historic structures and the affect that may have on neighbor-hood character. This concern seems supported by the loss of so many adjacent structures but may have been mitigated by the city’s action to expand the boundaries of historic districts in this area.
Traffic Counts
Hyde Park Place
Date Count am Nb am Sb pm Nb pm Sb Date Count am Nb am Sb pm Nb pm Sb
4/10/97 23491 706 735 1055 1020 9/4/97 1183 59 11 48 90
10/30/02 22107 734 750 1018 893 10/18/00 1156 60 17 46 77
11/19/02 21540 705 745 952 855 9/28/05 897 37 9 39 30
11/18/03 20235 605 657 873 903
4/10/97 23172 738 787 1028 1015 Date Count am Nb am Sb pm Nb pm Sb
11/19/02 20501 654 722 908 802
11/18/03 19487 607 665 863 867 8/7/95 1005
2/7/06 19822 655 619 848 841 12/10/96 1161 20 58 49 55
8/26/98 1561
3/21/95 2060 96 45 79 111 1/25/00 1243 40 61 71 53
1/7/97 2314 114 30 73 123 1/24/01 1141 25 59 60 53
3/19/97 2212 109 33 73 119 6/26/01 1510
12/10/03 2038 67 23 68 130 7/15/03 1769 35 45 74 64
3/2/06 2822 99 37 126 130 12/2/04 1305 35 60 60 48
1/5/05 1355 34 54 83 71
12/27/95 843 20 20 42 38
1/5/06 ADT 102
Date Count am Nb am Sb pm Nb pm Sb
Date Count am Nb am Sb pm Nb pm Sb
8/19/94 2159
10/13/94 2327 9/22/94 6872
10/6/99 1388 21 48 52 73 2/28/95 658811/8/00 1569 34 42 54 72 2/24/98 7508 258 279 386 331
2/4/04 1523 32 53 65 62 3/18/98 8378 382 318 435 375
3/3/05 1567 24 58 68 64 11/30/99 8085
10/26/00 7674
5/16/05 ADT 349 13 13 21 11 12/15/05 9191 402 320 437 428
12/21/95 12380 601 289 523 677
Date Count am Nb am Sb pm Nb pm Sb
5/29/96 11774 171 90 398 443
3/31/98 7533 2/3/99 10887 462 300 489 619
11/28/00 10020
11/16/94 6661 11/4/03 11200 522 347 462 618
11/17/04 5653 385 188 222 399
7/5/95 1471 20 75 107 523/31/98 9280 1/3/01 1408 21 60 122 60
1/9/01 7967 528 182 219 516 6/3/04 1587 32 69 87 67
9/29/04 7945 436 183 265 534
Date Count am Nb am Sb pm Nb pm Sb
Date Count am Nb am Sb pm Nb pm Sb
8/19/94 2159
10/24/95 2993 10/13/94 2327
10/1/96 2615 124 79 102 153 10/6/99 1388 21 48 52 73
11/19/96 2216 126 54 79 123 11/8/00 1569 34 42 54 72
4/15/97 2719 2/4/04 1523 32 53 65 62
3/9/99 2649 165 62 93 135 3/3/05 1567 24 58 68 64
11/2/99 2728
5/15/03 2722 138 41 90 171 7/12/93 1303
6/22/05 2481 108 23 90 121 9/15/93 13778/19/94 1672
5/16/05 ADT 32 1 1 2 4 10/13/94 1254
5/23/05 ADT 30 2 4 3 4 3/2/95 518
10/6/99 818 10 36 40 37
4/27/04 815
Date Count am Nb am Sb pm Nb pm Sb 3/3/05 901 13 26 48 33
4/5/00 12007 174 536 714 430
2/14/02 10890 132 566 656 398 Date Count am Nb am Sb pm Nb pm Sb
3/2/04 13283 201 742 733 491
4/20/06 18710 344 922 752 806 10/26/95 10764 483 238 651 615
5/1/96 13683
5/23/06 ADT 396 20 20 19 21 10/19/99 11095 492 177 469 556
11/5/02 10652 326 203 419 604
1/12/05 10011 315 231 369 494
Traffic Counts
Locust Grove north of Fairview
Beacon Street west of Broadway
Built:2002
Built:2002Wesley Subdivison
Original South Boise Village
Targee west of Orchard
Built:2003Phillipi Park
Cherry Lane West of Vista
Shoshone north of Cherry lane
Built:1998
Bluff daily trip counter
Battlement daily trip counter east of Pierce Park
Built:2002Ferndale Subdivison
Oak Park/Brampton Square
Manitou south of Boise Avenue
Built:1997Gatewood Subdivison
Pierce Park south of Hill Road
Vista North of Targee
Vista South of Targee
Garden Street north of Emerald
Roosevelt north of Emerald
Built:1999Urban Renaissance
Apple Street north of Bergeson
Built:2002Central Rim Neighborhood
Wright Street east of Apple Street
Apple Street south of Boise Avenue
Phillipi daily trip counter at project
Willowbrook daily trip counter
Garden Green
Built:1996
Hyde Park Place Built:2004
Garden Street north of Emerald
Fort St west of 9th
Fort St east of 13th
Fort St west of 13th
Hyde Park Place Neighborhood Before
$160,000.00
$180,000.00
$200,000.00
$220,000.00
$240,000.00
$260,000.00
$280,000.00
$300,000.00
$320,000.00
20002001
20022003
Avg
Sale
s P
rice
$80.00
$90.00
$100.00
$110.00
$120.00
$130.00
$140.00
$150.00
$160.00
20002001
20022003
Year
Avg
. P
rice p
er
Sq
uare
Fo
ot
MLS 100 HPP Neighborhood
20042005
HPP
built
N'hood After
20042005
HPP
built
16
On-the-Street Survey
Infill Resident Survey
Aerial Map LegendInfill project
Neighborhood Area
Oak Park Village/Brampton Square
Year built 1996Dwelling Type Condominiums# of Units 43Size in Acres 3.82Units per Acre 10.99Prior use VacantAdjacent Uses SF Residential
Background Oak Park Village and Brampton Square
are part of a mixed use development com-pleted in 1996. Oak Park Village consists of 200 subsidized apartment units on 9.89 acres (20.23 units/acre). To transition the project into the pre-existing single fam-ily neighborhood, there are 43 three and four-plex condominiums on 11 acres (3.82 units/acre) on the south and west sides of the apartments. Many of the condominiums are owner occupied and face onto single family homes across the streets. The covered parking for the condominiums is behind them and accessed through the apartment entrance.
The project includes a neighborhood serving retail and office component on a
busy arterial, Vista Ave., to the east. There is a church to the west and the rest of the im-mediate neighborhood is single family resi-dential. This is one of two neighborhoods in Boise that met the criteria to be classified as low income in the 1990 census. Some in the neighborhood who opposed this project felt like building housing specifically for low income residents invited a further concen-tration of low income households in the neighborhood.
The developer acquired the vacant parcel that had been slated for a grocery store and worked hard to communicate with neighbors, holding several neighborhood meetings. Recognizing the potential contro-versy surrounding the subsidized housing proposed he expanded notification beyond the 300 foot requirement and maximized the participation of area residents by arrang-ing for a local Boy Scout troop to deliver flyers announcing the neighborhood meeting to area residents.
According to the developer, existing residents chiefly expressed concern about the density and the potential for traffic con-gestion. On a positive note, the neighbors suggested and the developer agreed to add
the commercial/retail portion abutting Vista, a move that also buffered the apartments and condos from the busy traffic on Vista. He built, and still supports, a Head Start center there which appeals to neighbors whose own chil-dren might use it. The develop-er responded to concerns about
school access by installing a stop light with a crosswalk on Vista leading to a school across the street and providing a walking path through the project that allows all neighbor-hood children to easily access the signaled crossing to the school.
The public meetings appeared to allay at least some of the concerns over what in-creased density meant for the neighborhood, in the end the Vista Neighborhood Associa-tion supported the project. Of the 19 people
Demographic dataYears in home 19.58Rent/Own home 29/71Roundtrip Car Trips/day 2.13
Questions 1-151-disagree 3-neutral 5-agreeCompatible layout 2.56Good built amenities 2.6Good natural amenities 2.39Compatible design 2.92Preserved historic bldgs 2.36N’hood still affordable 3.2Project increased values 3.09Project positive addition 2.52N’hood pedestrian friendly 3.04N’hood safe for bikes 2.35Didn’t create more traffic 2.26Same quality parking 2.57Protected views/light 2.04Didn’t affect Air Quality 2.7As safe from crime 2.48
Demographic dataRent/Own home 33/66 Roundtrip Car Trips/day 2.67Questions Feel welcome in n’hood 33% Project positive addition 100% Favorite thing about n’hood Proximity to services 50% Least favorite about n’hood Surroundings unkempt 25%Noisy 25%Rowdy neighbors 25%Other 25%
Condominium Data
Condominium

1�
who testified about the project at the public hearings, 4 expressed concern over traffic congestion, 3 on potential parking problems, and 4 on school overcrowding. How were the residents who feared school crowding to know that the Boise Schools, especially in the Bench area, would face the opposite problem just a few years later? Rapid growth in surrounding suburban communities came at the expense of Boise’s first tier neighbor-hoods and the Boise district now has declin-ing enrollments.Evaluation
Neighbors complained of increased traffic at the inception of the project, and today rate the increased traffic as their chief complaint. The developer, on the other hand, contends that through traffic should decrease with infill development. After hearing of concerns at the neighborhood meeting the developer worked to alleviate them by directing traffic from the project onto the nearby arterial through traffic calm-ing measures. That effort appears to have been successful with traffic levels on Cherry Ave. holding steady from 1995 to 2003. However, traffic data for Shoshone Street near the project is not available so research-ers were unable to determine if Shoshone has been impacted. We do know that traffic counts on Vista Ave. have declined substan-tially both north and south of the project since the project was built - from a high of over 23,000 ADT to a current level around 20,000 ADT. This may be explained by a shift of the center of the Boise metro region to the west, leaving this eastern portion of the region with fewer regional trips.
Though residents feared initially that parking in the area would suffer, a full 40% of residents surveyed, reported they agreed that the project did not reduce the qual-ity and quantity of on-street parking. 4 (on the scale of 1 to 5) was the most common answer on that parking question. It appears that the theoretical concern over parking was not borne out in practice. In contrast, our survey of 25 neighborhood residents gave the lowest score to the question “the devel-opment protects views and natural light”. As the property was a vacant lot prior to build-ing, this loss is quite real. The developer was careful to step back the height of the project, the condominiums fronting the exist-
ing single story single family residences are designed with single story facades that step back to two-stories with the three story apartments behind that. However the foothills are still obscured from view for adjacent residences to the south and west.
Half of all residents thought their neighborhood was less safe since the proj-ect’s construction, and another 20% were neutral on the question. The fear of crime predates the project and is confirmed by concerns about crime stated in a neigh-borhood plan written before the project was built where the Vista Neighborhood Association pitched a proposal that the City of Boise construct a police substation on the property where the development now stands. Crime within this neighborhood increased in raw numbers initially after this project was built but at a rate that was less than the projected rate of population increase, and crime within the city overall has fallen since 2005. Ironically, the residents of the apartment complex are mostly pleased with their homes, but many expressed concern with the number of sex offenders housed in the rest of the neighborhood.
(continued next page)
Apartments at Oak
Park Village
School crosswalk, looking from end of pathway
Pathway through Oak Park for school access
School site

1�
On-the-Street Survey
Infill Resident Survey
Oak Park Village/Brampton Squarecontinued
homes in the Lemhi/Dill sub neighborhood visibly need renovation, while some are well kept, and the houses are smaller than in the other surrounding neighborhood. It would require more study to determine the cause of this relative decline. Meanwhile, the Nez Perce/Canal portion of the neighborhood seems unaffected in price per square foot and is rising in sales price at a slightly higher pace than the MLS Area.
Researchers also observed that the value of Brampton Square condominiums were initially above the MLS in sales price, but remained flat for the study period - quite an anomaly in the Boise market during this period - only rising with the market in the last year studied. The question we were unable to answer is whether the subsidized housing in the Oak Park Village complex is affecting the value of the homes in the
Lemhi/Dill neighborhood (and coincidentally the value of the Brampton Square condo-miniums themselves) or whether a combina-tion of factors such as the size and condition of some homes and crime rate in this sub neighborhood or a combination of those fac-tors is affecting the value. Despite the mixed conclusions of researchers the surveyed residents gave their highest marks to the statements, “the neighborhood is a place that I want to and can afford to live in” and “the project did not negatively impact my
Year built 1996Dwelling Type Apartments# of Units 200Size in Acres 9.89Units per Acre 20.23Prior use VacantAdjacent Uses SF/Commercial
Demographic dataRent/Own home 100/0 Roundtrip Car Trips/day 2.00Questions Feel welcome in n’hood 88% Project positive addition 100% Favorite thing about n’hood Proximity to services 63% Least favorite about n’hood Close by sex offenders 43%Parking issues 14%Rowdy neighbors 14%Surroundings unkempt 14%
Apartment Data
ApartmentInfill Resident Survey
Background What remains a conundrum on this proj-ect is discerning its impact on surrounding property values. At the project’s inception, at least one resident complained that he did not want low income housing in the neigh-borhood because it would hurt property values. The real estate data studied in-cludes only the condominium portion of the project, Brampton Square. The apartment complex, Oak Park Village, has remained un-der ownership of the developer and housing authority, no sales data exists on it.
As with the rest of the Treasure Valley, this area has seen strong growth. Noting the difference in house sizes of the two areas, researchers divided the surrounding neigh-borhood into two pieces and aggregated the data for each sub neighborhood separately. Houses in the Lemhi/Dill sub neighborhood are smaller by nearly 300 square feet on average than houses in the Nez Perce/Canal sub neighborhood. Before the project was completed both parts of the neighborhood were nearly on pace with the MLS Area 400 in property value increase. Sales prices in the whole neighborhood were lower than the MLS Area because of the smaller size homes. However, their price per square foot remained even with or above the MLS price. This seems consistent with the rule that smaller sized homes in good locations bring a higher price per square foot due to economies of scale.
After the project was completed the Lemhi/Dill portion of the neighborhood began to lose ground on its advantage in price per square foot over both the MLS Area and the Nez Perce/Canal portion of the neighborhood. It also lost ground in the rate of increase in sales price. A few of the small
Condominiums at Brampton

1�
Traffic Countsproperty values.” The factors potentially af-fecting property values in this neighborhood are too varied to assign cause to any of them without further study.Conclusions
Of the initial concerns from the neighbors; the traffic on the collector streets has not gotten worse and traffic has actu-ally decreased on the arterial, parking seems unaffected, conversely views have been obscured. The project has not dampened property values for the Nez Perce/Canal sub neighborhood and the affects on the Lemhi/Dill property values are uncertain. The project overall scored second lowest of any studied in the survey of surrounding neighbors. What is unclear is whether the scores were lower because of the neighbor-hood in general, or if the Oak Park project was the primary contributing factor.
All in all, the residents surveyed were upbeat about the project as it stands today. Certainly the fact that the developer listened to residents’ concerns and implemented traf-fic calming, added walkable retail, put in a pathway and stoplight and included a Head-start classroom, helped this project succeed. The addition of these amenities was a pri-mary reason the project gained support from the neighborhood association. In a difficult location a project including a subsidized housing component gained neighborhood association support initially and is seen by half our respondents as a positive addition to the neighborhood today.
Bicyclist leaving Oak Park Apartments
Real Estate Data
Date Count am Nb am Sb pm Nb pm Sb Date Count am Nb am Sb pm Nb pm Sb
4/10/97 23491 706 735 1055 1020 9/4/97 1183 59 11 48 90
10/30/02 22107 734 750 1018 893 10/18/00 1156 60 17 46 77
11/19/02 21540 705 745 952 855 9/28/05 897 37 9 39 30
11/18/03 20235 605 657 873 903
4/10/97 23172 738 787 1028 1015 Date Count am Nb am Sb pm Nb pm Sb
11/19/02 20501 654 722 908 802
11/18/03 19487 607 665 863 867 8/7/95 1005
2/7/06 19822 655 619 848 841 12/10/96 1161 20 58 49 55
8/26/98 1561
3/21/95 2060 96 45 79 111 1/25/00 1243 40 61 71 53
1/7/97 2314 114 30 73 123 1/24/01 1141 25 59 60 53
3/19/97 2212 109 33 73 119 6/26/01 1510
12/10/03 2038 67 23 68 130 7/15/03 1769 35 45 74 64
3/2/06 2822 99 37 126 130 12/2/04 1305 35 60 60 48
1/5/05 1355 34 54 83 71
12/27/95 843 20 20 42 38
1/5/06 ADT 102
Date Count am Nb am Sb pm Nb pm Sb
Date Count am Nb am Sb pm Nb pm Sb
8/19/94 2159
10/13/94 2327 9/22/94 6872
10/6/99 1388 21 48 52 73 2/28/95 658811/8/00 1569 34 42 54 72 2/24/98 7508 258 279 386 331
2/4/04 1523 32 53 65 62 3/18/98 8378 382 318 435 375
3/3/05 1567 24 58 68 64 11/30/99 8085
10/26/00 7674
5/16/05 ADT 349 13 13 21 11 12/15/05 9191 402 320 437 428
12/21/95 12380 601 289 523 677
Date Count am Nb am Sb pm Nb pm Sb
5/29/96 11774 171 90 398 443
3/31/98 7533 2/3/99 10887 462 300 489 619
11/28/00 10020
11/16/94 6661 11/4/03 11200 522 347 462 618
11/17/04 5653 385 188 222 399
7/5/95 1471 20 75 107 523/31/98 9280 1/3/01 1408 21 60 122 60
1/9/01 7967 528 182 219 516 6/3/04 1587 32 69 87 67
9/29/04 7945 436 183 265 534
Date Count am Nb am Sb pm Nb pm Sb
Date Count am Nb am Sb pm Nb pm Sb
8/19/94 2159
10/24/95 2993 10/13/94 2327
10/1/96 2615 124 79 102 153 10/6/99 1388 21 48 52 73
11/19/96 2216 126 54 79 123 11/8/00 1569 34 42 54 72
4/15/97 2719 2/4/04 1523 32 53 65 62
3/9/99 2649 165 62 93 135 3/3/05 1567 24 58 68 64
11/2/99 2728
5/15/03 2722 138 41 90 171 7/12/93 1303
6/22/05 2481 108 23 90 121 9/15/93 13778/19/94 1672
5/16/05 ADT 32 1 1 2 4 10/13/94 1254
5/23/05 ADT 30 2 4 3 4 3/2/95 518
10/6/99 818 10 36 40 37
4/27/04 815
Date Count am Nb am Sb pm Nb pm Sb 3/3/05 901 13 26 48 33
4/5/00 12007 174 536 714 430
2/14/02 10890 132 566 656 398 Date Count am Nb am Sb pm Nb pm Sb
3/2/04 13283 201 742 733 491
4/20/06 18710 344 922 752 806 10/26/95 10764 483 238 651 615
5/1/96 13683
5/23/06 ADT 396 20 20 19 21 10/19/99 11095 492 177 469 556
11/5/02 10652 326 203 419 604
1/12/05 10011 315 231 369 494
Traffic Counts
Locust Grove north of Fairview
Beacon Street west of Broadway
Built:2002
Built:2002Wesley Subdivison
Original South Boise Village
Targee west of Orchard
Built:2003Phillipi Park
Cherry Lane West of Vista
Shoshone north of Cherry lane
Built:1998
Bluff daily trip counter
Battlement daily trip counter east of Pierce Park
Built:2002Ferndale Subdivison
Oak Park/Brampton Square
Manitou south of Boise Avenue
Built:1997Gatewood Subdivison
Pierce Park south of Hill Road
Vista North of Targee
Vista South of Targee
Garden Street north of Emerald
Roosevelt north of Emerald
Built:1999Urban Renaissance
Apple Street north of Bergeson
Built:2002Central Rim Neighborhood
Wright Street east of Apple Street
Apple Street south of Boise Avenue
Phillipi daily trip counter at project
Willowbrook daily trip counter
Garden Green
Built:1996
Hyde Park Place Built:2004
Garden Street north of Emerald
Fort St west of 9th
Fort St east of 13th
Fort St west of 13th
Oak Park/Brampton Neighborhood before
$40,000
$50,000
$60,000
$70,000
$80,000
$90,000
$100,000
$110,000
$120,000
1990
1991
1992
1993
1994
1995
1996
Av
g.
Sa
les
Pri
ce
Oak Park/Brampton N'hood after
1996
1997
1998
1999
2000
2001
2002
$30.00
$40.00
$50.00
$60.00
$70.00
$80.00
$90.00
1990
1991
1992
1993
1994
1995
1996
Year
Av
g.
Pri
ce
pe
r S
qu
are
Fo
ot
MLS Area 400 Nez Perce/Canal Lemhi/Dill
1996
1997
1998
1999
2000
2001
2002
Year
Oak
Park
built
Oak
Park
built

20
On-the-Street Survey
Infill Resident Survey
Year built 2001Dwelling Type Condominium# of Units 13Size in Acres 1.347Units per Acre 9.65Prior use VacantAdjacent Uses SF Residential
BackgroundPhillippi Park Condominiums is a 13
unit condominium project on 1.35 acres at a density of 9.65 d.u. per acre. The site was formerly occupied by two large lot single family homes. It is located on Phillippi south of Targee in a region that developed as rural residential outside the city. It was annexed into the city beginning in the 1960’s and has been redeveloping into a more urban resi-dential area since. The surrounding neigh-borhood is characterized by a mix of single family homes, single family manufactured homes, a townhouse development, a smat-tering of duplexes, one four-plex and one grandfathered small business. The develop-ment is directly adjacent to a neighborhood park.
The developer held a neighborhood
meeting and six residents attended. The approval process included a rezone from single family residential to multi-family with a design review overlay. It also included a condominium plat. Four residents testified in opposition to the project at the public hearing at the Planning & Zoning Com-mission. We were unable to interview the developer of this project; however a member of the Planning and Zoning Commission at the time remembers fervent objections from neighbors. Records show those objections
included traffic congestion, density, lower property values, noise pollution, hazards to kids, safety hazards and degrading the quality of life. The project site is near the interstate limiting connectivity and destina-tions to the south, three of the residents who testified with concerns about increased traffic live on Phillippi to the south of the project.
Phillippi Park is different than other housing types in the neighborhood in both layout and construction, but similar in den-sity to other nearby development. It is nearly twice as dense as the single family detached lot housing that is 4.78 d.u./acre and adja-cent and to the south. However, the project is a similar density to the manufactured homes adjacent across Phillipi Street to the
east which are 8.76 d/u/acre and is less dense than nearby townhouses which are 11.25/d.u./acre. The layout is a less familiar drive-way courtyard arrangement rather than a culdesac layout such as the townhouses and the manufactured homes. Construction quality is re-flected in the higher average sales values of $157,500 when the project was built, compared to $143,500 for the nearby townhouses that are approximately the same size. Evaluation
Given the eclectic mix of housing types and densities in the surrounding neighborhood the passionate opposition to this project based on quality of life, density and property values was somewhat surpris-ing. Anecdotes to researchers indicate it may have been attributed to the need for a rezone request for higher density. With no planning discussions about appropriate infill in the neighborhood prior to the develop-ment application expectations were based on existing zoning. Other factors contributing
Demographic dataYears in home 15.59Rent/Own home 12/88Roundtrip Car Trips/day 2.41
Questions 1-151-disagree 3-neutral 5-agreeCompatible layout 4.35Good built amenities 4.47Good natural amenities 4.0Compatible design 4.71Preserved historic bldgs 4.53N’hood still affordable 4.53Project increased values 4.35Project positive addition 4.75N’hood pedestrian friendly 4.35N’hood safe for bikes 4.06Didn’t create more traffic 4.12Same quality parking 4.06Protected views/light 4.76Didn’t affect Air Quality 4.41As safe from crime 4.47
Demographic dataRent/Own home 0/100 Roundtrip Car Trips/day 1.25Questions Feel welcome in n’hood 100% Project positive addition 100% Favorite thing about n’hood Proximity to services 100% Least favorite about n’hood No Sidewalks 40%Traffic 20%Parking Issues 20%Noisy 20%
Phillipi Park Condominiums
Aerial Map LegendInfill project
Neighborhood Area

21
Real Estate Data
to the opposition appear to be the fact that the development proposed was quite different from anything existing in the neighborhood, and to the fact that this neighborhood origi-nally developed as a rural residential area and expectations based on that lifestyle are still intact.
Survey respondents today rate this project far higher than any other project reviewed with an average score of 4.39. Quality of life issues of protecting views/light access, being a positive addition to the neighborhood and including natural amenities scored the highest at 4.76, 4.75 and 4.71 respectively. No other project scored higher than 3.65 on any of those questions. Traffic and safety for bikes, among the lowest mean scores at 4.12 and 4.06, are still well above average. Data from the highway district shows that traffic on Targee Street has decreased by about 250 trips per day since the project was completed, researchers could not determine the factors that may have affected these counts. The project is only producing 30-32 trips per day, about half the number projected by the trip generation manual.
Fear of lower property values was voiced at the public hearing. Evidence that this project has had a negative af-fect on values is uncertain. The neighborhood trend in sales price* was losing ground very slightly to the MLS Area before the project was built and continued to do so at nearly the same rate afterward, though both the neighborhood and the MLS Area saw dramatic increases in sales price from 2003 to 2005. However price per square foot went from gaining ground to the MLS Area to losing ground and from 2003 to 2005. The project itself, the eclectic mix of housing around the project and/or new housing being built in other parts of the MLS Area may have all affected this trend. This is another area of the city where the location proximate to the interstate and ser-vices may be driving up the value of real estate. *Researchers examined property sales in the neighborhood including the townhouses but excluding the manufactured homes which are considered a different sales market.Conclusion
The Phillippi Park project is well received today despite vigorous opposition during the approval process. Predictions about increased traffic and a loss of quality of life have not proven to be accurate. Traffic has decreased on the nearby collector and the number of trips per day generated by the development is lower than projected. Quality of life issues received the highest scores of any project
Traffic Counts
surveyed by a full point on a five point scale. Real estate values have increased in the surrounding neighborhood though price per square foot has declined in relation to the MLS Area since the project was completed. Despite initial opposition and being quite different from the rest of its neighbors in layout and design this project is extremely well accepted by its neighbors today as a positive addition to the neighborhood. The project’s design qual-ity has earned support and it now scores higher with surrounding neighbors than any other project studied.
Condo- miniums at Phillipi Park
Date Count am Nb am Sb pm Nb pm Sb Date Count am Nb am Sb pm Nb pm Sb
4/10/97 23491 706 735 1055 1020 9/4/97 1183 59 11 48 90
10/30/02 22107 734 750 1018 893 10/18/00 1156 60 17 46 77
11/19/02 21540 705 745 952 855 9/28/05 897 37 9 39 30
11/18/03 20235 605 657 873 903
4/10/97 23172 738 787 1028 1015 Date Count am Nb am Sb pm Nb pm Sb
11/19/02 20501 654 722 908 802
11/18/03 19487 607 665 863 867 8/7/95 1005
2/7/06 19822 655 619 848 841 12/10/96 1161 20 58 49 55
8/26/98 1561
3/21/95 2060 96 45 79 111 1/25/00 1243 40 61 71 53
1/7/97 2314 114 30 73 123 1/24/01 1141 25 59 60 53
3/19/97 2212 109 33 73 119 6/26/01 1510
12/10/03 2038 67 23 68 130 7/15/03 1769 35 45 74 64
3/2/06 2822 99 37 126 130 12/2/04 1305 35 60 60 48
1/5/05 1355 34 54 83 71
12/27/95 843 20 20 42 38
1/5/06 ADT 102
Date Count am Nb am Sb pm Nb pm Sb
Date Count am Nb am Sb pm Nb pm Sb
8/19/94 2159
10/13/94 2327 9/22/94 6872
10/6/99 1388 21 48 52 73 2/28/95 658811/8/00 1569 34 42 54 72 2/24/98 7508 258 279 386 331
2/4/04 1523 32 53 65 62 3/18/98 8378 382 318 435 375
3/3/05 1567 24 58 68 64 11/30/99 8085
10/26/00 7674
5/16/05 ADT 349 13 13 21 11 12/15/05 9191 402 320 437 428
12/21/95 12380 601 289 523 677
Date Count am Nb am Sb pm Nb pm Sb
5/29/96 11774 171 90 398 443
3/31/98 7533 2/3/99 10887 462 300 489 619
11/28/00 10020
11/16/94 6661 11/4/03 11200 522 347 462 618
11/17/04 5653 385 188 222 399
7/5/95 1471 20 75 107 523/31/98 9280 1/3/01 1408 21 60 122 60
1/9/01 7967 528 182 219 516 6/3/04 1587 32 69 87 67
9/29/04 7945 436 183 265 534
Date Count am Nb am Sb pm Nb pm Sb
Date Count am Nb am Sb pm Nb pm Sb
8/19/94 2159
10/24/95 2993 10/13/94 2327
10/1/96 2615 124 79 102 153 10/6/99 1388 21 48 52 73
11/19/96 2216 126 54 79 123 11/8/00 1569 34 42 54 72
4/15/97 2719 2/4/04 1523 32 53 65 62
3/9/99 2649 165 62 93 135 3/3/05 1567 24 58 68 64
11/2/99 2728
5/15/03 2722 138 41 90 171 7/12/93 1303
6/22/05 2481 108 23 90 121 9/15/93 13778/19/94 1672
5/16/05 ADT 32 1 1 2 4 10/13/94 1254
5/23/05 ADT 30 2 4 3 4 3/2/95 518
10/6/99 818 10 36 40 37
4/27/04 815
Date Count am Nb am Sb pm Nb pm Sb 3/3/05 901 13 26 48 33
4/5/00 12007 174 536 714 430
2/14/02 10890 132 566 656 398 Date Count am Nb am Sb pm Nb pm Sb
3/2/04 13283 201 742 733 491
4/20/06 18710 344 922 752 806 10/26/95 10764 483 238 651 615
5/1/96 13683
5/23/06 ADT 396 20 20 19 21 10/19/99 11095 492 177 469 556
11/5/02 10652 326 203 419 604
1/12/05 10011 315 231 369 494
Traffic Counts
Locust Grove north of Fairview
Beacon Street west of Broadway
Built:2002
Built:2002Wesley Subdivison
Original South Boise Village
Targee west of Orchard
Built:2003Phillipi Park
Cherry Lane West of Vista
Shoshone north of Cherry lane
Built:1998
Bluff daily trip counter
Battlement daily trip counter east of Pierce Park
Built:2002Ferndale Subdivison
Oak Park/Brampton Square
Manitou south of Boise Avenue
Built:1997Gatewood Subdivison
Pierce Park south of Hill Road
Vista North of Targee
Vista South of Targee
Garden Street north of Emerald
Roosevelt north of Emerald
Built:1999Urban Renaissance
Apple Street north of Bergeson
Built:2002Central Rim Neighborhood
Wright Street east of Apple Street
Apple Street south of Boise Avenue
Phillipi daily trip counter at project
Willowbrook daily trip counter
Garden Green
Built:1996
Hyde Park Place Built:2004
Garden Street north of Emerald
Fort St west of 9th
Fort St east of 13th
Fort St west of 13th
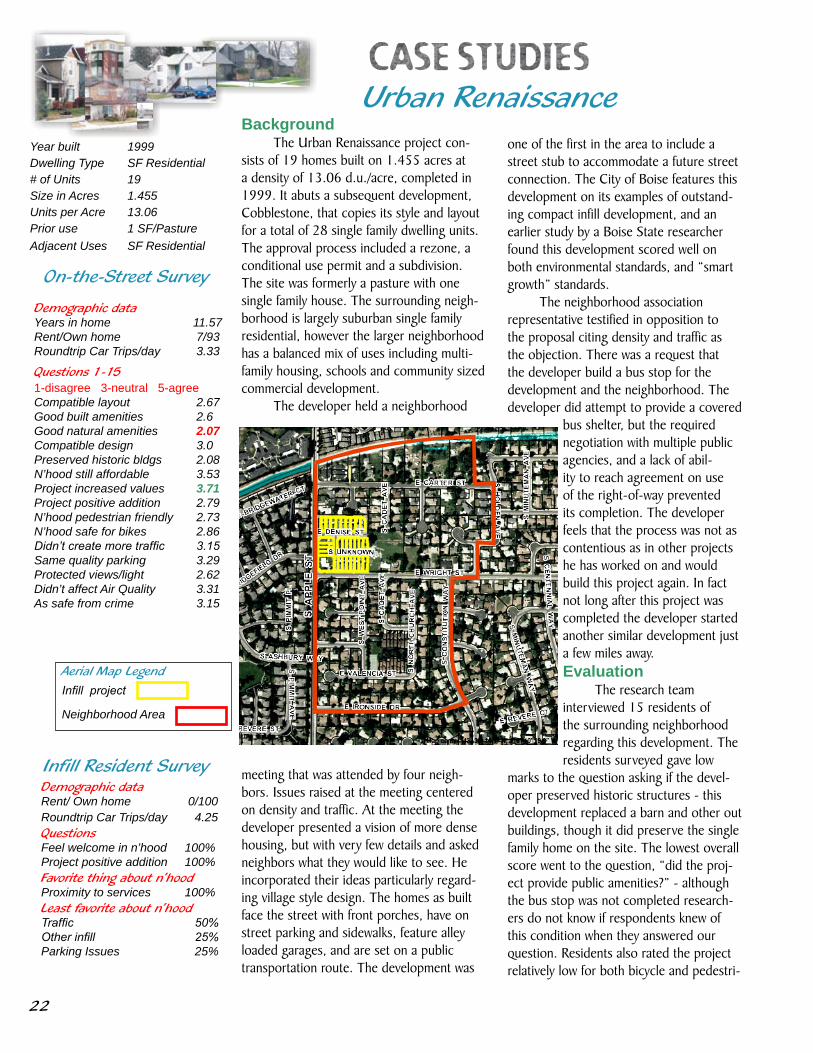
22
On-the-Street Survey
Infill Resident Survey
Urban RenaissanceYear built 1999Dwelling Type SF Residential# of Units 19Size in Acres 1.455Units per Acre 13.06Prior use 1 SF/PastureAdjacent Uses SF Residential
BackgroundThe Urban Renaissance project con-
sists of 19 homes built on 1.455 acres at a density of 13.06 d.u./acre, completed in 1999. It abuts a subsequent development, Cobblestone, that copies its style and layout for a total of 28 single family dwelling units. The approval process included a rezone, a conditional use permit and a subdivision. The site was formerly a pasture with one single family house. The surrounding neigh-borhood is largely suburban single family residential, however the larger neighborhood has a balanced mix of uses including multi-family housing, schools and community sized commercial development.
The developer held a neighborhood
meeting that was attended by four neigh-bors. Issues raised at the meeting centered on density and traffic. At the meeting the developer presented a vision of more dense housing, but with very few details and asked neighbors what they would like to see. He incorporated their ideas particularly regard-ing village style design. The homes as built face the street with front porches, have on street parking and sidewalks, feature alley loaded garages, and are set on a public transportation route. The development was
one of the first in the area to include a street stub to accommodate a future street connection. The City of Boise features this development on its examples of outstand-ing compact infill development, and an earlier study by a Boise State researcher found this development scored well on both environmental standards, and “smart growth” standards.
The neighborhood association representative testified in opposition to the proposal citing density and traffic as the objection. There was a request that the developer build a bus stop for the development and the neighborhood. The developer did attempt to provide a covered
bus shelter, but the required negotiation with multiple public agencies, and a lack of abil-ity to reach agreement on use of the right-of-way prevented its completion. The developer feels that the process was not as contentious as in other projects he has worked on and would build this project again. In fact not long after this project was completed the developer started another similar development just a few miles away. Evaluation
The research team interviewed 15 residents of the surrounding neighborhood regarding this development. The residents surveyed gave low
marks to the question asking if the devel-oper preserved historic structures - this development replaced a barn and other out buildings, though it did preserve the single family home on the site. The lowest overall score went to the question, “did the proj-ect provide public amenities?” - although the bus stop was not completed research-ers do not know if respondents knew of this condition when they answered our question. Residents also rated the project relatively low for both bicycle and pedestri-
Demographic dataYears in home 11.57Rent/Own home 7/93Roundtrip Car Trips/day 3.33
Questions 1-151-disagree 3-neutral 5-agreeCompatible layout 2.67Good built amenities 2.6Good natural amenities 2.07Compatible design 3.0Preserved historic bldgs 2.08N’hood still affordable 3.53Project increased values 3.71Project positive addition 2.79N’hood pedestrian friendly 2.73N’hood safe for bikes 2.86Didn’t create more traffic 3.15Same quality parking 3.29Protected views/light 2.62Didn’t affect Air Quality 3.31As safe from crime 3.15
Demographic dataRent/ Own home 0/100 Roundtrip Car Trips/day 4.25Questions Feel welcome in n’hood 100% Project positive addition 100% Favorite thing about n’hood Proximity to services 100% Least favorite about n’hood Traffic 50%Other infill 25%Parking Issues 25%
Aerial Map LegendInfill project
Neighborhood Area
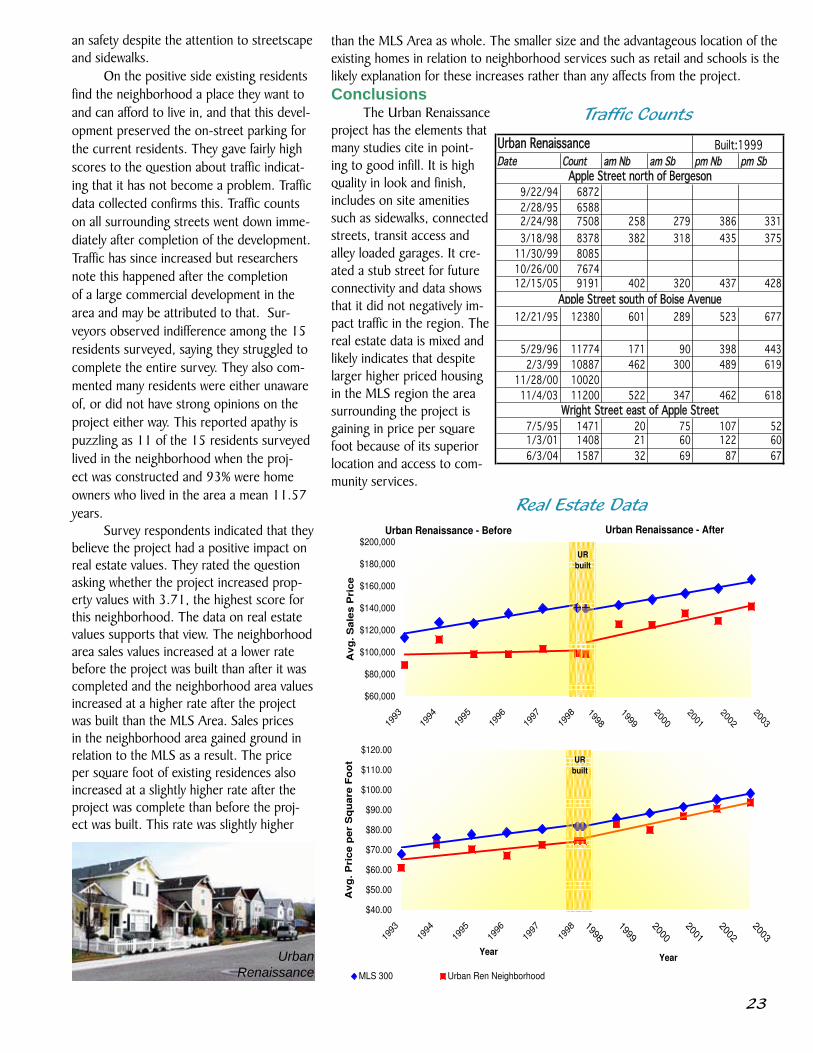
23
Real Estate Data
than the MLS Area as whole. The smaller size and the advantageous location of the existing homes in relation to neighborhood services such as retail and schools is the likely explanation for these increases rather than any affects from the project. Conclusions
The Urban Renaissance project has the elements that many studies cite in point-ing to good infill. It is high quality in look and finish, includes on site amenities such as sidewalks, connected streets, transit access and alley loaded garages. It cre-ated a stub street for future connectivity and data shows that it did not negatively im-pact traffic in the region. The real estate data is mixed and likely indicates that despite larger higher priced housing in the MLS region the area surrounding the project is gaining in price per square foot because of its superior location and access to com-munity services.
Traffic Counts
an safety despite the attention to streetscape and sidewalks.
On the positive side existing residents find the neighborhood a place they want to and can afford to live in, and that this devel-opment preserved the on-street parking for the current residents. They gave fairly high scores to the question about traffic indicat-ing that it has not become a problem. Traffic data collected confirms this. Traffic counts on all surrounding streets went down imme-diately after completion of the development. Traffic has since increased but researchers note this happened after the completion of a large commercial development in the area and may be attributed to that. Sur-veyors observed indifference among the 15 residents surveyed, saying they struggled to complete the entire survey. They also com-mented many residents were either unaware of, or did not have strong opinions on the project either way. This reported apathy is puzzling as 11 of the 15 residents surveyed lived in the neighborhood when the proj-ect was constructed and 93% were home owners who lived in the area a mean 11.57 years.
Survey respondents indicated that they believe the project had a positive impact on real estate values. They rated the question asking whether the project increased prop-erty values with 3.71, the highest score for this neighborhood. The data on real estate values supports that view. The neighborhood area sales values increased at a lower rate before the project was built than after it was completed and the neighborhood area values increased at a higher rate after the project was built than the MLS Area. Sales prices in the neighborhood area gained ground in relation to the MLS as a result. The price per square foot of existing residences also increased at a slightly higher rate after the project was complete than before the proj-ect was built. This rate was slightly higher
Urban Renaissance
Date Count am Nb am Sb pm Nb pm Sb Date Count am Nb am Sb pm Nb pm Sb
4/10/97 23491 706 735 1055 1020 9/4/97 1183 59 11 48 90
10/30/02 22107 734 750 1018 893 10/18/00 1156 60 17 46 77
11/19/02 21540 705 745 952 855 9/28/05 897 37 9 39 30
11/18/03 20235 605 657 873 903
4/10/97 23172 738 787 1028 1015 Date Count am Nb am Sb pm Nb pm Sb
11/19/02 20501 654 722 908 802
11/18/03 19487 607 665 863 867 8/7/95 1005
2/7/06 19822 655 619 848 841 12/10/96 1161 20 58 49 55
8/26/98 1561
3/21/95 2060 96 45 79 111 1/25/00 1243 40 61 71 53
1/7/97 2314 114 30 73 123 1/24/01 1141 25 59 60 53
3/19/97 2212 109 33 73 119 6/26/01 1510
12/10/03 2038 67 23 68 130 7/15/03 1769 35 45 74 64
3/2/06 2822 99 37 126 130 12/2/04 1305 35 60 60 48
1/5/05 1355 34 54 83 71
12/27/95 843 20 20 42 38
1/5/06 ADT 102
Date Count am Nb am Sb pm Nb pm Sb
Date Count am Nb am Sb pm Nb pm Sb
8/19/94 2159
10/13/94 2327 9/22/94 6872
10/6/99 1388 21 48 52 73 2/28/95 658811/8/00 1569 34 42 54 72 2/24/98 7508 258 279 386 331
2/4/04 1523 32 53 65 62 3/18/98 8378 382 318 435 375
3/3/05 1567 24 58 68 64 11/30/99 8085
10/26/00 7674
5/16/05 ADT 349 13 13 21 11 12/15/05 9191 402 320 437 428
12/21/95 12380 601 289 523 677
Date Count am Nb am Sb pm Nb pm Sb
5/29/96 11774 171 90 398 443
3/31/98 7533 2/3/99 10887 462 300 489 619
11/28/00 10020
11/16/94 6661 11/4/03 11200 522 347 462 618
11/17/04 5653 385 188 222 399
7/5/95 1471 20 75 107 523/31/98 9280 1/3/01 1408 21 60 122 60
1/9/01 7967 528 182 219 516 6/3/04 1587 32 69 87 67
9/29/04 7945 436 183 265 534
Date Count am Nb am Sb pm Nb pm Sb
Date Count am Nb am Sb pm Nb pm Sb
8/19/94 2159
10/24/95 2993 10/13/94 2327
10/1/96 2615 124 79 102 153 10/6/99 1388 21 48 52 73
11/19/96 2216 126 54 79 123 11/8/00 1569 34 42 54 72
4/15/97 2719 2/4/04 1523 32 53 65 62
3/9/99 2649 165 62 93 135 3/3/05 1567 24 58 68 64
11/2/99 2728
5/15/03 2722 138 41 90 171 7/12/93 1303
6/22/05 2481 108 23 90 121 9/15/93 13778/19/94 1672
5/16/05 ADT 32 1 1 2 4 10/13/94 1254
5/23/05 ADT 30 2 4 3 4 3/2/95 518
10/6/99 818 10 36 40 37
4/27/04 815
Date Count am Nb am Sb pm Nb pm Sb 3/3/05 901 13 26 48 33
4/5/00 12007 174 536 714 430
2/14/02 10890 132 566 656 398 Date Count am Nb am Sb pm Nb pm Sb
3/2/04 13283 201 742 733 491
4/20/06 18710 344 922 752 806 10/26/95 10764 483 238 651 615
5/1/96 13683
5/23/06 ADT 396 20 20 19 21 10/19/99 11095 492 177 469 556
11/5/02 10652 326 203 419 604
1/12/05 10011 315 231 369 494
Traffic Counts
Locust Grove north of Fairview
Beacon Street west of Broadway
Built:2002
Built:2002Wesley Subdivison
Original South Boise Village
Targee west of Orchard
Built:2003Phillipi Park
Cherry Lane West of Vista
Shoshone north of Cherry lane
Built:1998
Bluff daily trip counter
Battlement daily trip counter east of Pierce Park
Built:2002Ferndale Subdivison
Oak Park/Brampton Square
Manitou south of Boise Avenue
Built:1997Gatewood Subdivison
Pierce Park south of Hill Road
Vista North of Targee
Vista South of Targee
Garden Street north of Emerald
Roosevelt north of Emerald
Built:1999Urban Renaissance
Apple Street north of Bergeson
Built:2002Central Rim Neighborhood
Wright Street east of Apple Street
Apple Street south of Boise Avenue
Phillipi daily trip counter at project
Willowbrook daily trip counter
Garden Green
Built:1996
Hyde Park Place Built:2004
Garden Street north of Emerald
Fort St west of 9th
Fort St east of 13th
Fort St west of 13th
Urban Renaissance - Before
$60,000
$80,000
$100,000
$120,000
$140,000
$160,000
$180,000
$200,000
1993
1994
1995
1996
1997
1998
Avg
. S
ale
s P
rice
Urban Renaissance - After
1998
1999
2000
2001
2002
2003
$40.00
$50.00
$60.00
$70.00
$80.00
$90.00
$100.00
$110.00
$120.00
1993
1994
1995
1996
1997
1998
Year
Av
g.
Pri
ce
pe
r S
qu
are
Fo
ot
MLS 300 Urban Ren Neighborhood
1998
1999
2000
2001
2002
2003
Year
UR
built
UR
built

24
On-the-Street Survey
Infill Resident Survey
Washington Square
Year built 1981Dwelling Type Townhouse# of Units 20Size in Acres 1.757Units per Acre 11.38Prior use VacantAdjacent Uses SF Residential
Background In 1981 20 Victorian style town-
houses were built on 1.76 acres at a density of 11.38 units/acre in Boise’s East End. Neighbors had frequently used the block, which had always been vacant, for recreation and some hoped the City would purchase and develop it as a park. Boise City Council members heard testimony from 43 neighbors who variously testified that the project was incompatible with the rest of the neighbor-hood; that schools would face overcrowding; that traffic congestion would increase; and that the development would be hazardous to kids.
The developer held neighborhood meetings and listened to input from resi-dents; residents seemed to place the blame
for the application of this particular type of development on the City zoning that allowed for this “higher density” project. This project generated support for the establishment of the East End Neighborhood Association, just as Garden Green did for the Central Rim Neighborhood Association in the late 1990s.
Though several area residents re-call the primary issue was the loss of open space, the public hearing record only shows 2 complaints on that issue, and only 1 on the loss of view and sunlight. Our survey
Demographic dataYears in home 15.56Rent/Own home 12/88Roundtrip Car Trips/day 2.79
Questions 1-151-disagree 3-neutral 5-agreeCompatible layout 3.47Good built amenities 3.0Good natural amenities 2.5Compatible design 3.65Preserved historic bldgs 3.08N’hood still affordable 3.59Project increased values 3.96Project positive addition 3.5N’hood pedestrian friendly 3.88N’hood safe for bikes 3.71Didn’t create more traffic 3.81Same quality parking 3.94Protected views/light 3.35Didn’t affect Air Quality 3.94As safe from crime 4.06
Demographic dataRent/ Own home 0/100 Roundtrip Car Trips/day 2.50Questions Feel welcome in n’hood 100% Project positive addition 100% Favorite thing about n’hood Proximity to services 100% Least favorite about n’hood Surroundings unkempt 50%Other 50%
confirmed the sentiment that the loss of open space still weighs heavy on the minds of area residents, with Question #5 (Pre-served natural amenities, historic structures) receiving the second lowest score for this project - a mean of 3.08, of any question on the survey. As with the other developments surveyed, this development earned its lowest score on including public amenities, achiev-ing a score of only 2.50. Anecdotes from those surveyed reveal that the lack of a park is an absence still affecting the neighbor-hood.Evaluation
Consistent with original testimony, neighbors continue to have no concern about the projects impact their property
values. Real estate sales price data is not easily available for the MLS Area in the time period when this projects was completed. The As-sessors office did have access to data for the whole East End Neighborhood and so researchers compared the smaller Washington Square Area with the larger East End Neigh-borhood as a whole instead of comparing to the MLS Area as in other case studies. The
project was built in the early 1980’s and took nearly four years to build out due to a period of relative stagnation in real estate prices for the Boise Metro region.
Comparing the Washington Square area to the whole East End in a slow market required researchers to increase the size of the neighborhood area around the project in order to have enough sales to compare reliably. The sales prices in the Washington Square Area were losing ground slightly to the East End before the project was built and showed actual declines as well as declines
Aerial Map Legend
Infill project
Neighborhood Area

25
Real Estate Data
relative to the whole East End after the project was complete. On the other hand the price per square foot in the Washington Square Area was rising at a slower rate than the East End before the project was built and took a jump and stayed on pace with the East End afterward. Researchers are unable to assign any one cause to the property value changes in light of real declines in value in some areas of the city during this period, the relatively long period of build out for the project, and the larger neighborhood area diluting the impact of the project.
Our surveys indicate that the neigh-borhood still harbors concerns related to compatibility of the project with the neigh-borhood. Among the issues Washington Square area residents cited were: building height and mass; paint colors - some charac-terize them as garish; density; “too different from rest of neighborhood; and a preference for single family homes. The prevalence of ‘skinny houses’ (which these are not) was mentioned and others feel the neighborhood is being inundated by rentals (only 11% of those we surveyed were renters).
Traffic counts were not available imme-diately adjacent to Washington Square and the project received a relatively high mean score (3.81) on the question indicating that neighbors feel it did not create traffic. The development as built should generate about the same number of trips per day as other blocks in the neighborhood and the connect-ed grid system allows for a wide dispersal of trips. Additionally, nearly the entire neigh-borhood has detached tree lined sidewalks. Traffic has become an issue with the wider neighborhood and they are working proac-tively to implement a neighborhood wide
traffic calming plan. Much of the ‘excess’ traffic in the neighborhood is attributed to cut through trips from nearby foothills development. Conclusions
On the whole researchers found no negative affect on property values or traf-fic from this project, though the “density” is still perceived negatively. It continues to invite concerns about compatibility - it is different than its neighbors, especially the attached design and “painted lady” character. Traffic is a problem in the neigh-borhood but is attributed to foothills development and not this project. The biggest ongoing issue however is the lost opportunity for a neighborhood park.
There are no Traffic Counts for WA Square
Washington Square
Wesley Subdivision (see next page)
Washington Square After
1981
1982
1983
1984
1985
1986
Washington Square Neighborhood Before
$20,000
$30,000
$40,000
$50,000
$60,000
$70,000
$80,000
$90,000
1976
1977
1978
1979
1980
1981
Av
g. S
ale
s P
ric
e
$15.00
$20.00
$25.00
$30.00
$35.00
$40.00
1976
1977
1978
1979
1980
1981
Year
Av
g. P
ric
e p
er
Sq
ua
re F
oo
t
East End Wa. Square Area
1981
1982
1983
1984
1985
1986
Year
WA
Sqr
built
WA
Sqr
built
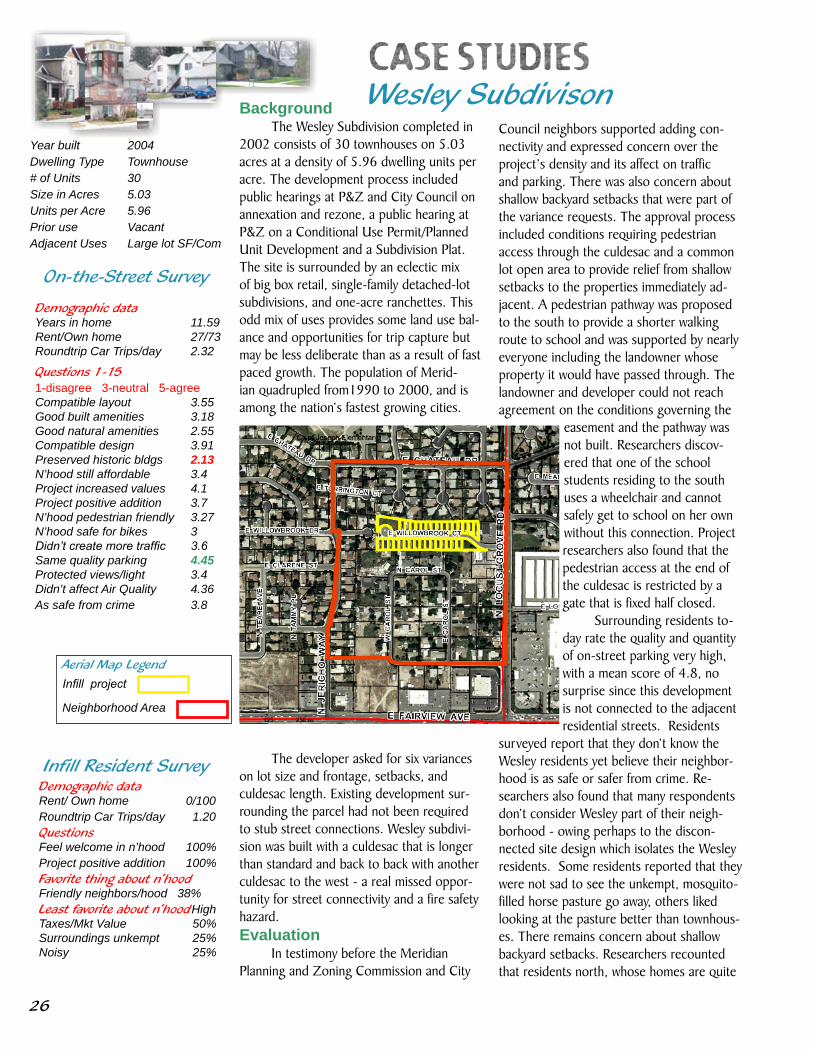
26
On-the-Street Survey
Infill Resident Survey
Wesley SubdivisonYear built 2004Dwelling Type Townhouse# of Units 30Size in Acres 5.03Units per Acre 5.96Prior use VacantAdjacent Uses Large lot SF/Com
BackgroundThe Wesley Subdivision completed in
2002 consists of 30 townhouses on 5.03 acres at a density of 5.96 dwelling units per acre. The development process included public hearings at P&Z and City Council on annexation and rezone, a public hearing at P&Z on a Conditional Use Permit/Planned Unit Development and a Subdivision Plat. The site is surrounded by an eclectic mix of big box retail, single-family detached-lot subdivisions, and one-acre ranchettes. This odd mix of uses provides some land use bal-ance and opportunities for trip capture but may be less deliberate than as a result of fast paced growth. The population of Merid-ian quadrupled from1990 to 2000, and is among the nation’s fastest growing cities.
The developer asked for six variances on lot size and frontage, setbacks, and culdesac length. Existing development sur-rounding the parcel had not been required to stub street connections. Wesley subdivi-sion was built with a culdesac that is longer than standard and back to back with another culdesac to the west - a real missed oppor-tunity for street connectivity and a fire safety hazard. Evaluation
In testimony before the Meridian Planning and Zoning Commission and City
Council neighbors supported adding con-nectivity and expressed concern over the project’s density and its affect on traffic and parking. There was also concern about shallow backyard setbacks that were part of the variance requests. The approval process included conditions requiring pedestrian access through the culdesac and a common lot open area to provide relief from shallow setbacks to the properties immediately ad-jacent. A pedestrian pathway was proposed to the south to provide a shorter walking route to school and was supported by nearly everyone including the landowner whose property it would have passed through. The landowner and developer could not reach agreement on the conditions governing the
easement and the pathway was not built. Researchers discov-ered that one of the school students residing to the south uses a wheelchair and cannot safely get to school on her own without this connection. Project researchers also found that the pedestrian access at the end of the culdesac is restricted by a gate that is fixed half closed.
Surrounding residents to-day rate the quality and quantity of on-street parking very high, with a mean score of 4.8, no surprise since this development is not connected to the adjacent residential streets. Residents
surveyed report that they don’t know the Wesley residents yet believe their neighbor-hood is as safe or safer from crime. Re-searchers also found that many respondents don’t consider Wesley part of their neigh-borhood - owing perhaps to the discon-nected site design which isolates the Wesley residents. Some residents reported that they were not sad to see the unkempt, mosquito-filled horse pasture go away, others liked looking at the pasture better than townhous-es. There remains concern about shallow backyard setbacks. Researchers recounted that residents north, whose homes are quite
Demographic dataYears in home 11.59Rent/Own home 27/73Roundtrip Car Trips/day 2.32
Questions 1-151-disagree 3-neutral 5-agreeCompatible layout 3.55Good built amenities 3.18Good natural amenities 2.55Compatible design 3.91Preserved historic bldgs 2.13N’hood still affordable 3.4Project increased values 4.1Project positive addition 3.7N’hood pedestrian friendly 3.27N’hood safe for bikes 3Didn’t create more traffic 3.6Same quality parking 4.45Protected views/light 3.4Didn’t affect Air Quality 4.36As safe from crime 3.8
Demographic dataRent/ Own home 0/100 Roundtrip Car Trips/day 1.20Questions Feel welcome in n’hood 100% Project positive addition 100% Favorite thing about n’hood Friendly neighbors/hood 38% Least favorite about n’hood High Taxes/Mkt Value 50%Surroundings unkempt 25%Noisy 25%
Aerial Map LegendInfill project
Neighborhood Area
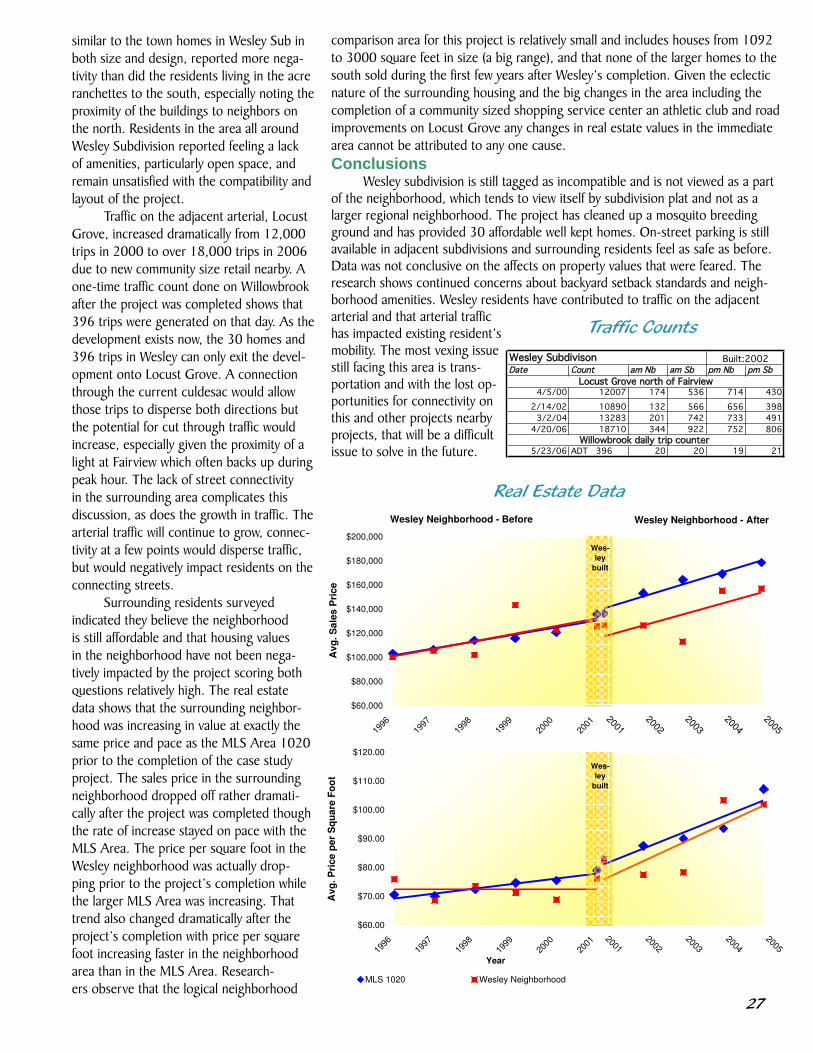
2�
similar to the town homes in Wesley Sub in both size and design, reported more nega-tivity than did the residents living in the acre ranchettes to the south, especially noting the proximity of the buildings to neighbors on the north. Residents in the area all around Wesley Subdivision reported feeling a lack of amenities, particularly open space, and remain unsatisfied with the compatibility and layout of the project.
Traffic on the adjacent arterial, Locust Grove, increased dramatically from 12,000 trips in 2000 to over 18,000 trips in 2006 due to new community size retail nearby. A one-time traffic count done on Willowbrook after the project was completed shows that 396 trips were generated on that day. As the development exists now, the 30 homes and 396 trips in Wesley can only exit the devel-opment onto Locust Grove. A connection through the current culdesac would allow those trips to disperse both directions but the potential for cut through traffic would increase, especially given the proximity of a light at Fairview which often backs up during peak hour. The lack of street connectivity in the surrounding area complicates this discussion, as does the growth in traffic. The arterial traffic will continue to grow, connec-tivity at a few points would disperse traffic, but would negatively impact residents on the connecting streets.
Surrounding residents surveyed indicated they believe the neighborhood is still affordable and that housing values in the neighborhood have not been nega-tively impacted by the project scoring both questions relatively high. The real estate data shows that the surrounding neighbor-hood was increasing in value at exactly the same price and pace as the MLS Area 1020 prior to the completion of the case study project. The sales price in the surrounding neighborhood dropped off rather dramati-cally after the project was completed though the rate of increase stayed on pace with the MLS Area. The price per square foot in the Wesley neighborhood was actually drop-ping prior to the project’s completion while the larger MLS Area was increasing. That trend also changed dramatically after the project’s completion with price per square foot increasing faster in the neighborhood area than in the MLS Area. Research-ers observe that the logical neighborhood
comparison area for this project is relatively small and includes houses from 1092 to 3000 square feet in size (a big range), and that none of the larger homes to the south sold during the first few years after Wesley’s completion. Given the eclectic nature of the surrounding housing and the big changes in the area including the completion of a community sized shopping service center an athletic club and road improvements on Locust Grove any changes in real estate values in the immediate area cannot be attributed to any one cause.Conclusions
Wesley subdivision is still tagged as incompatible and is not viewed as a part of the neighborhood, which tends to view itself by subdivision plat and not as a larger regional neighborhood. The project has cleaned up a mosquito breeding ground and has provided 30 affordable well kept homes. On-street parking is still available in adjacent subdivisions and surrounding residents feel as safe as before. Data was not conclusive on the affects on property values that were feared. The research shows continued concerns about backyard setback standards and neigh-borhood amenities. Wesley residents have contributed to traffic on the adjacent arterial and that arterial traffic has impacted existing resident’s mobility. The most vexing issue still facing this area is trans-portation and with the lost op-portunities for connectivity on this and other projects nearby projects, that will be a difficult issue to solve in the future.
Real Estate Data
Traffic Counts
Date Count am Nb am Sb pm Nb pm Sb Date Count am Nb am Sb pm Nb pm Sb
4/10/97 23491 706 735 1055 1020 9/4/97 1183 59 11 48 90
10/30/02 22107 734 750 1018 893 10/18/00 1156 60 17 46 77
11/19/02 21540 705 745 952 855 9/28/05 897 37 9 39 30
11/18/03 20235 605 657 873 903
4/10/97 23172 738 787 1028 1015 Date Count am Nb am Sb pm Nb pm Sb
11/19/02 20501 654 722 908 802
11/18/03 19487 607 665 863 867 8/7/95 1005
2/7/06 19822 655 619 848 841 12/10/96 1161 20 58 49 55
8/26/98 1561
3/21/95 2060 96 45 79 111 1/25/00 1243 40 61 71 53
1/7/97 2314 114 30 73 123 1/24/01 1141 25 59 60 53
3/19/97 2212 109 33 73 119 6/26/01 1510
12/10/03 2038 67 23 68 130 7/15/03 1769 35 45 74 64
3/2/06 2822 99 37 126 130 12/2/04 1305 35 60 60 48
1/5/05 1355 34 54 83 71
12/27/95 843 20 20 42 38
1/5/06 ADT 102
Date Count am Nb am Sb pm Nb pm Sb
Date Count am Nb am Sb pm Nb pm Sb
8/19/94 2159
10/13/94 2327 9/22/94 6872
10/6/99 1388 21 48 52 73 2/28/95 658811/8/00 1569 34 42 54 72 2/24/98 7508 258 279 386 331
2/4/04 1523 32 53 65 62 3/18/98 8378 382 318 435 375
3/3/05 1567 24 58 68 64 11/30/99 8085
10/26/00 7674
5/16/05 ADT 349 13 13 21 11 12/15/05 9191 402 320 437 428
12/21/95 12380 601 289 523 677
Date Count am Nb am Sb pm Nb pm Sb
5/29/96 11774 171 90 398 443
3/31/98 7533 2/3/99 10887 462 300 489 619
11/28/00 10020
11/16/94 6661 11/4/03 11200 522 347 462 618
11/17/04 5653 385 188 222 399
7/5/95 1471 20 75 107 523/31/98 9280 1/3/01 1408 21 60 122 60
1/9/01 7967 528 182 219 516 6/3/04 1587 32 69 87 67
9/29/04 7945 436 183 265 534
Date Count am Nb am Sb pm Nb pm Sb
Date Count am Nb am Sb pm Nb pm Sb
8/19/94 2159
10/24/95 2993 10/13/94 2327
10/1/96 2615 124 79 102 153 10/6/99 1388 21 48 52 73
11/19/96 2216 126 54 79 123 11/8/00 1569 34 42 54 72
4/15/97 2719 2/4/04 1523 32 53 65 62
3/9/99 2649 165 62 93 135 3/3/05 1567 24 58 68 64
11/2/99 2728
5/15/03 2722 138 41 90 171 7/12/93 1303
6/22/05 2481 108 23 90 121 9/15/93 13778/19/94 1672
5/16/05 ADT 32 1 1 2 4 10/13/94 1254
5/23/05 ADT 30 2 4 3 4 3/2/95 518
10/6/99 818 10 36 40 37
4/27/04 815
Date Count am Nb am Sb pm Nb pm Sb 3/3/05 901 13 26 48 33
4/5/00 12007 174 536 714 430
2/14/02 10890 132 566 656 398 Date Count am Nb am Sb pm Nb pm Sb
3/2/04 13283 201 742 733 491
4/20/06 18710 344 922 752 806 10/26/95 10764 483 238 651 615
5/1/96 13683
5/23/06 ADT 396 20 20 19 21 10/19/99 11095 492 177 469 556
11/5/02 10652 326 203 419 604
1/12/05 10011 315 231 369 494
Traffic Counts
Locust Grove north of Fairview
Beacon Street west of Broadway
Built:2002
Built:2002Wesley Subdivison
Original South Boise Village
Targee west of Orchard
Built:2003Phillipi Park
Cherry Lane West of Vista
Shoshone north of Cherry lane
Built:1998
Bluff daily trip counter
Battlement daily trip counter east of Pierce Park
Built:2002Ferndale Subdivison
Oak Park/Brampton Square
Manitou south of Boise Avenue
Built:1997Gatewood Subdivison
Pierce Park south of Hill Road
Vista North of Targee
Vista South of Targee
Garden Street north of Emerald
Roosevelt north of Emerald
Built:1999Urban Renaissance
Apple Street north of Bergeson
Built:2002Central Rim Neighborhood
Wright Street east of Apple Street
Apple Street south of Boise Avenue
Phillipi daily trip counter at project
Willowbrook daily trip counter
Garden Green
Built:1996
Hyde Park Place Built:2004
Garden Street north of Emerald
Fort St west of 9th
Fort St east of 13th
Fort St west of 13th
Wesley Neighborhood - After
20012002
20032004
2005
20012002
20032004
2005
Wesley Neighborhood - Before
$60,000
$80,000
$100,000
$120,000
$140,000
$160,000
$180,000
$200,000
1996
1997
1998
1999
2000
2001
Av
g. S
ale
s P
ric
e
$60.00
$70.00
$80.00
$90.00
$100.00
$110.00
$120.00
1996
1997
1998
1999
2000
2001
Year
Av
g. P
ric
e p
er
Sq
ua
re F
oo
t
MLS 1020 Wesley Neighborhood
Wes-
ley
built
Wes-
ley
built
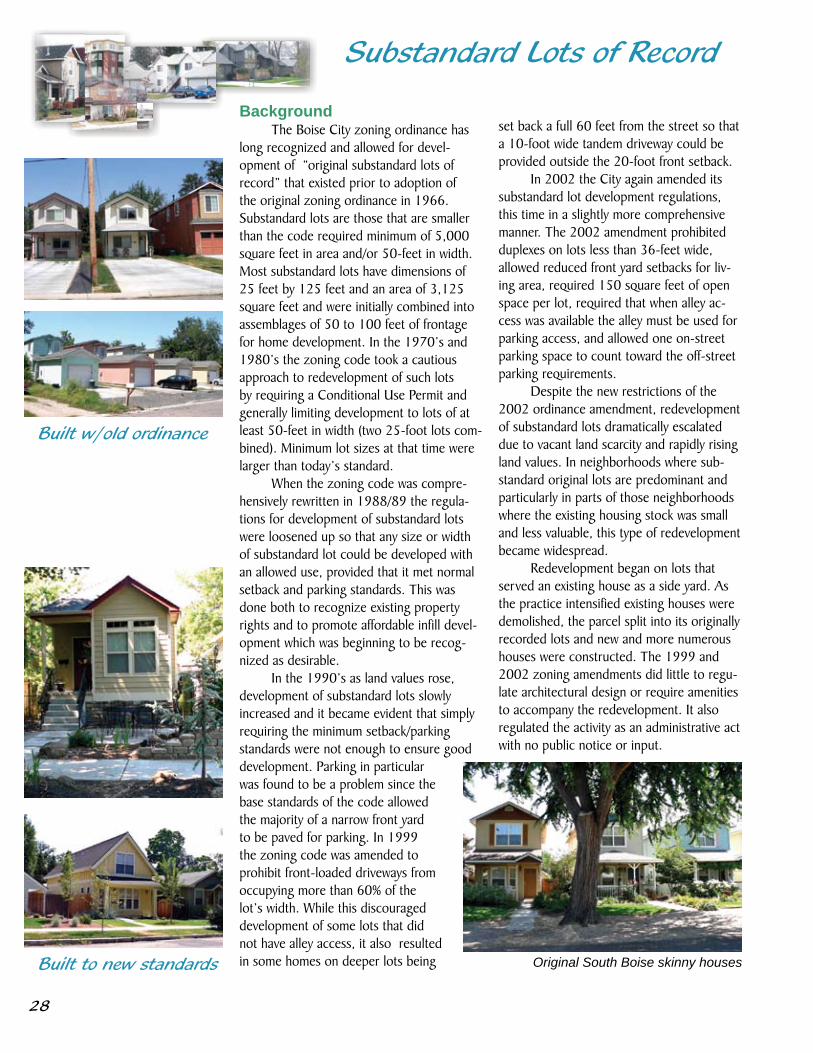
2�
On-the-Street Survey
Infill Resident Survey
Substandard Lots of Record
BackgroundThe Boise City zoning ordinance has
long recognized and allowed for devel-opment of “original substandard lots of record” that existed prior to adoption of the original zoning ordinance in 1966. Substandard lots are those that are smaller than the code required minimum of 5,000 square feet in area and/or 50-feet in width. Most substandard lots have dimensions of 25 feet by 125 feet and an area of 3,125 square feet and were initially combined into assemblages of 50 to 100 feet of frontage for home development. In the 1970’s and 1980’s the zoning code took a cautious approach to redevelopment of such lots by requiring a Conditional Use Permit and generally limiting development to lots of at least 50-feet in width (two 25-foot lots com-bined). Minimum lot sizes at that time were larger than today’s standard.
When the zoning code was compre-hensively rewritten in 1988/89 the regula-tions for development of substandard lots were loosened up so that any size or width of substandard lot could be developed with an allowed use, provided that it met normal setback and parking standards. This was done both to recognize existing property rights and to promote affordable infill devel-opment which was beginning to be recog-nized as desirable.
In the 1990’s as land values rose, development of substandard lots slowly increased and it became evident that simply requiring the minimum setback/parking standards were not enough to ensure good development. Parking in particular was found to be a problem since the base standards of the code allowed the majority of a narrow front yard to be paved for parking. In 1999 the zoning code was amended to prohibit front-loaded driveways from occupying more than 60% of the lot’s width. While this discouraged development of some lots that did not have alley access, it also resulted in some homes on deeper lots being
set back a full 60 feet from the street so that a 10-foot wide tandem driveway could be provided outside the 20-foot front setback.
In 2002 the City again amended its substandard lot development regulations, this time in a slightly more comprehensive manner. The 2002 amendment prohibited duplexes on lots less than 36-feet wide, allowed reduced front yard setbacks for liv-ing area, required 150 square feet of open space per lot, required that when alley ac-cess was available the alley must be used for parking access, and allowed one on-street parking space to count toward the off-street parking requirements.
Despite the new restrictions of the 2002 ordinance amendment, redevelopment of substandard lots dramatically escalated due to vacant land scarcity and rapidly rising land values. In neighborhoods where sub-standard original lots are predominant and particularly in parts of those neighborhoods where the existing housing stock was small and less valuable, this type of redevelopment became widespread.
Redevelopment began on lots that served an existing house as a side yard. As the practice intensified existing houses were demolished, the parcel split into its originally recorded lots and new and more numerous houses were constructed. The 1999 and 2002 zoning amendments did little to regu-late architectural design or require amenities to accompany the redevelopment. It also regulated the activity as an administrative act with no public notice or input.
Built to new standards Original South Boise skinny houses
Built w/old ordinance
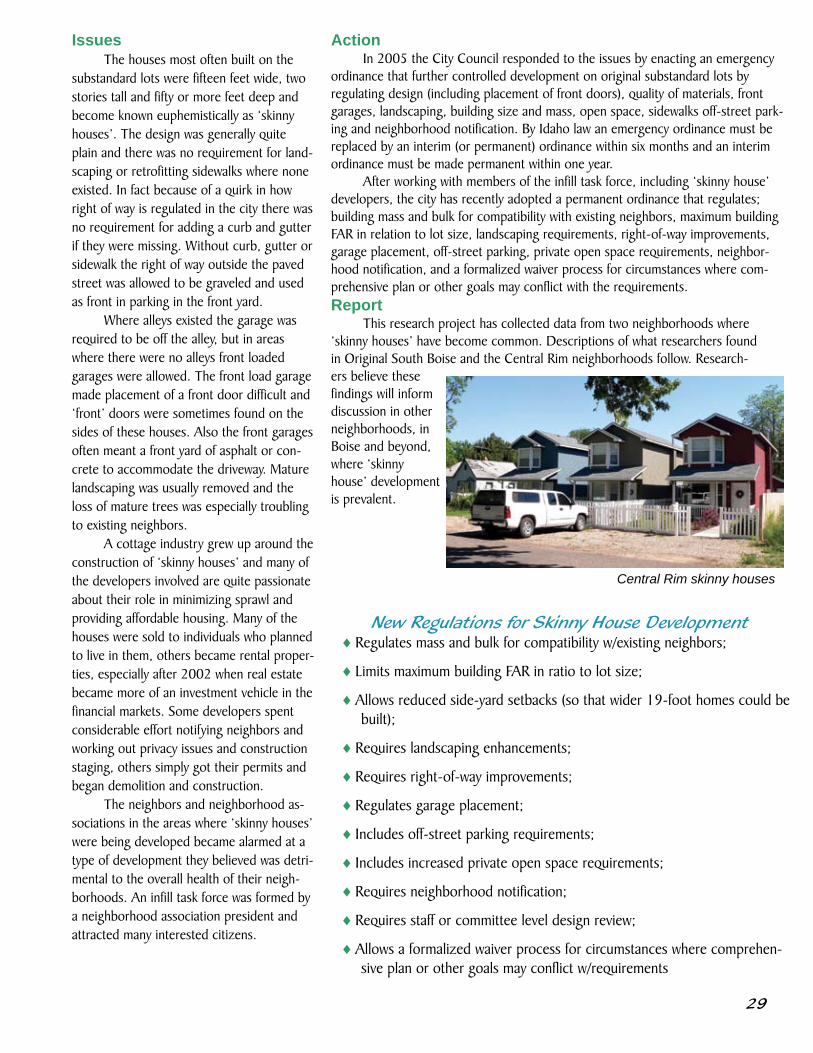
2�
IssuesThe houses most often built on the
substandard lots were fifteen feet wide, two stories tall and fifty or more feet deep and become known euphemistically as ‘skinny houses’. The design was generally quite plain and there was no requirement for land-scaping or retrofitting sidewalks where none existed. In fact because of a quirk in how right of way is regulated in the city there was no requirement for adding a curb and gutter if they were missing. Without curb, gutter or sidewalk the right of way outside the paved street was allowed to be graveled and used as front in parking in the front yard.
Where alleys existed the garage was required to be off the alley, but in areas where there were no alleys front loaded garages were allowed. The front load garage made placement of a front door difficult and ‘front’ doors were sometimes found on the sides of these houses. Also the front garages often meant a front yard of asphalt or con-crete to accommodate the driveway. Mature landscaping was usually removed and the loss of mature trees was especially troubling to existing neighbors.
A cottage industry grew up around the construction of ‘skinny houses’ and many of the developers involved are quite passionate about their role in minimizing sprawl and providing affordable housing. Many of the houses were sold to individuals who planned to live in them, others became rental proper-ties, especially after 2002 when real estate became more of an investment vehicle in the financial markets. Some developers spent considerable effort notifying neighbors and working out privacy issues and construction staging, others simply got their permits and began demolition and construction.
The neighbors and neighborhood as-sociations in the areas where ‘skinny houses’ were being developed became alarmed at a type of development they believed was detri-mental to the overall health of their neigh-borhoods. An infill task force was formed by a neighborhood association president and attracted many interested citizens.
ActionIn 2005 the City Council responded to the issues by enacting an emergency
ordinance that further controlled development on original substandard lots by regulating design (including placement of front doors), quality of materials, front garages, landscaping, building size and mass, open space, sidewalks off-street park-ing and neighborhood notification. By Idaho law an emergency ordinance must be replaced by an interim (or permanent) ordinance within six months and an interim ordinance must be made permanent within one year.
After working with members of the infill task force, including ‘skinny house’ developers, the city has recently adopted a permanent ordinance that regulates; building mass and bulk for compatibility with existing neighbors, maximum building FAR in relation to lot size, landscaping requirements, right-of-way improvements, garage placement, off-street parking, private open space requirements, neighbor-hood notification, and a formalized waiver process for circumstances where com-prehensive plan or other goals may conflict with the requirements.Report
This research project has collected data from two neighborhoods where ‘skinny houses’ have become common. Descriptions of what researchers found in Original South Boise and the Central Rim neighborhoods follow. Research-ers believe these findings will inform discussion in other neighborhoods, in Boise and beyond, where ‘skinny house’ development is prevalent.
New Regulations for Skinny House Development♦Regulates mass and bulk for compatibility w/existing neighbors;
♦Limits maximum building FAR in ratio to lot size;
♦Allows reduced side-yard setbacks (so that wider 19-foot homes could be built);
♦Requires landscaping enhancements;
♦Requires right-of-way improvements;
♦Regulates garage placement;
♦Includes off-street parking requirements;
♦Includes increased private open space requirements;
♦Requires neighborhood notification;
♦Requires staff or committee level design review;
♦Allows a formalized waiver process for circumstances where comprehen-sive plan or other goals may conflict w/requirements
Central Rim skinny houses
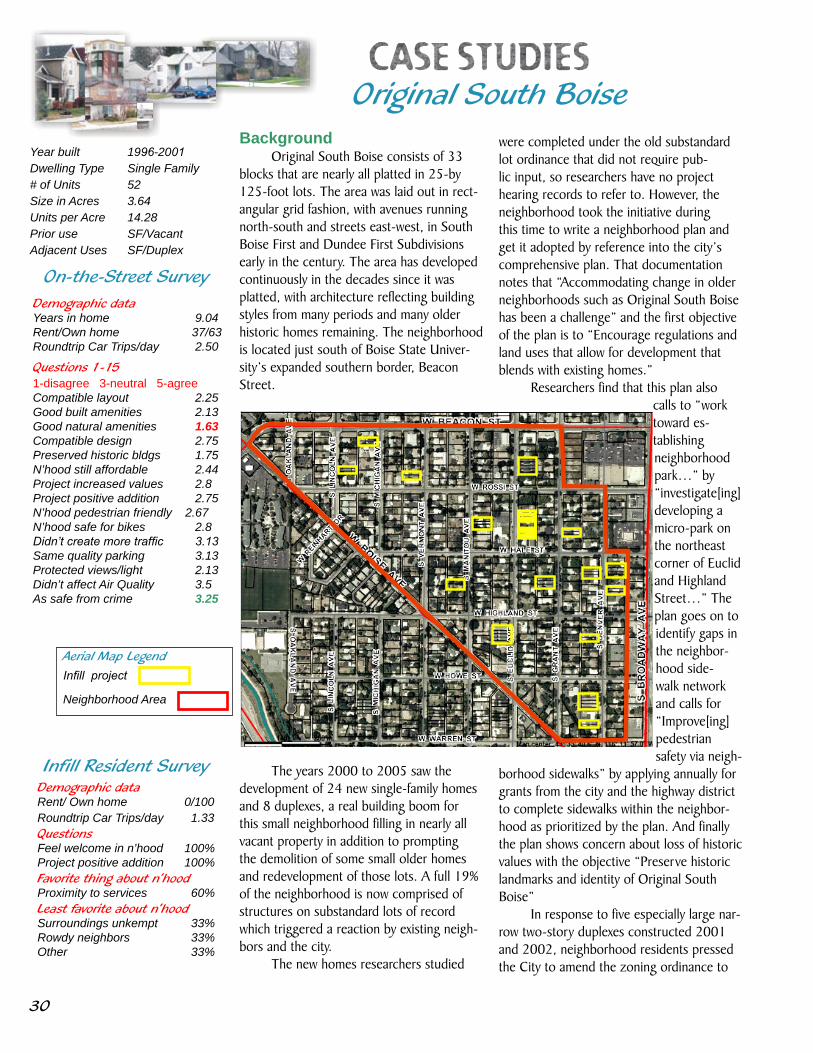
30
On-the-Street Survey
Infill Resident Survey
Original South Boise
Year built 1996-2001Dwelling Type Single Family# of Units 52Size in Acres 3.64Units per Acre 14.28Prior use SF/VacantAdjacent Uses SF/Duplex
BackgroundOriginal South Boise consists of 33
blocks that are nearly all platted in 25-by 125-foot lots. The area was laid out in rect-angular grid fashion, with avenues running north-south and streets east-west, in South Boise First and Dundee First Subdivisions early in the century. The area has developed continuously in the decades since it was platted, with architecture reflecting building styles from many periods and many older historic homes remaining. The neighborhood is located just south of Boise State Univer-sity’s expanded southern border, Beacon Street.
The years 2000 to 2005 saw the development of 24 new single-family homes and 8 duplexes, a real building boom for this small neighborhood filling in nearly all vacant property in addition to prompting the demolition of some small older homes and redevelopment of those lots. A full 19% of the neighborhood is now comprised of structures on substandard lots of record which triggered a reaction by existing neigh-bors and the city.
The new homes researchers studied
were completed under the old substandard lot ordinance that did not require pub-lic input, so researchers have no project hearing records to refer to. However, the neighborhood took the initiative during this time to write a neighborhood plan and get it adopted by reference into the city’s comprehensive plan. That documentation notes that “Accommodating change in older neighborhoods such as Original South Boise has been a challenge” and the first objective of the plan is to “Encourage regulations and land uses that allow for development that blends with existing homes.”
Researchers find that this plan also calls to “work toward es-tablishing neighborhood park…” by “investigate[ing] developing a micro-park on the northeast corner of Euclid and Highland Street…” The plan goes on to identify gaps in the neighbor-hood side-walk network and calls for “Improve[ing] pedestrian safety via neigh-
borhood sidewalks” by applying annually for grants from the city and the highway district to complete sidewalks within the neighbor-hood as prioritized by the plan. And finally the plan shows concern about loss of historic values with the objective “Preserve historic landmarks and identity of Original South Boise”
In response to five especially large nar-row two-story duplexes constructed 2001 and 2002, neighborhood residents pressed the City to amend the zoning ordinance to
Demographic dataYears in home 9.04Rent/Own home 37/63Roundtrip Car Trips/day 2.50
Questions 1-151-disagree 3-neutral 5-agreeCompatible layout 2.25Good built amenities 2.13Good natural amenities 1.63Compatible design 2.75Preserved historic bldgs 1.75N’hood still affordable 2.44Project increased values 2.8Project positive addition 2.75N’hood pedestrian friendly 2.67N’hood safe for bikes 2.8Didn’t create more traffic 3.13Same quality parking 3.13Protected views/light 2.13Didn’t affect Air Quality 3.5As safe from crime 3.25
Demographic dataRent/ Own home 0/100 Roundtrip Car Trips/day 1.33Questions Feel welcome in n’hood 100% Project positive addition 100% Favorite thing about n’hood Proximity to services 60% Least favorite about n’hood Surroundings unkempt 33%Rowdy neighbors 33%Other 33%
Aerial Map LegendInfill project
Neighborhood Area

31
Real Estate Data
deal with duplexes citing ‘ninety feet deep and 15 or 20 feet wide units that loomed over neighboring homes and had virtually no private open space’. The city responded by prohibiting duplexes on lots less than 36 feet wide and adding a design review require-ment to all duplexes. Later, three of the same type of long tall duplex buildings that had caused the original alarm were moved into the neighborhood and set on three adjacent substandard lots with plans to convert them into single family houses. These came from north of Beacon Street to make way for the expansion of BSU literally in the middle of the night with no warning and no permits. In response the city called a special meeting and initiated the emergency ordinance on substandard lots. Evaluation
The issues addressed by the neigh-borhood plan are consistent with concerns raised by respondents to our survey who gave the lowest score recorded in any neigh-borhood on any question (1.63) when asked whether the infill properties “include ameni-ties” and the second lowest score (1.75) to “preserves historic structures.” In addition, this neighborhood’s mean score for the whole survey at 2.61 was second lowest, only to Central Rim, as the lowest overall scores of neighborhoods surveyed. Despite the mini building boom survey respondents agreed that the ‘skinny houses’ “did not create traffic” with a rating of 3.13. Highway district data shows this to be true with traffic on Beacon Street remaining relatively stable from 1995 to 2005.
Survey respondents rated questions on maintaining housing affordability and increased property values just below aver-age. Researchers looked at real estate trends before and after 2002 when construction of these infill houses had begun in earnest. Data indicates that the neighborhood lost ground relatively in sales price to MLS Area 300 from 2002 to 2005 and continued to gain ground slightly toward the MLS aver-age in sales price per square foot in the same period. This is consistent with other neighborhoods that have lower average sales prices due to smaller homes, and the smaller ‘skinny houses’ may have contributed to this trend. Conversely the convenient location is likely driving the price per square foot at a higher rate than the region.
Traffic Counts
ConclusionOriginal South Boise has experienced a high rate of sub standard lot redevel-
opment in the last decade creating considerable change for such a small neighbor-hood. These changes have not negatively affected traffic volumes, and affects on real estate value are mixed. Residents did recognize other threats to their quality of life and responded with a neighborhood plan and request for design review of duplexes. The threat was magnified in 2005 with the move of three duplexes into the neighborhood. The city and neighborhood responded with ordinance changes further regulating ‘skinny houses’ and duplexes and these changes addressed immediate threats. Remaining issues include retrofitting a complete pedestrian network, protecting mature landscaping, protecting historic assets and introducing new public open space to replace the lost private open space as the neighborhood fills in.
Date Count am Nb am Sb pm Nb pm Sb Date Count am Nb am Sb pm Nb pm Sb
4/10/97 23491 706 735 1055 1020 9/4/97 1183 59 11 48 90
10/30/02 22107 734 750 1018 893 10/18/00 1156 60 17 46 77
11/19/02 21540 705 745 952 855 9/28/05 897 37 9 39 30
11/18/03 20235 605 657 873 903
4/10/97 23172 738 787 1028 1015 Date Count am Nb am Sb pm Nb pm Sb
11/19/02 20501 654 722 908 802
11/18/03 19487 607 665 863 867 8/7/95 1005
2/7/06 19822 655 619 848 841 12/10/96 1161 20 58 49 55
8/26/98 1561
3/21/95 2060 96 45 79 111 1/25/00 1243 40 61 71 53
1/7/97 2314 114 30 73 123 1/24/01 1141 25 59 60 53
3/19/97 2212 109 33 73 119 6/26/01 1510
12/10/03 2038 67 23 68 130 7/15/03 1769 35 45 74 64
3/2/06 2822 99 37 126 130 12/2/04 1305 35 60 60 48
1/5/05 1355 34 54 83 71
12/27/95 843 20 20 42 38
1/5/06 ADT 102
Date Count am Nb am Sb pm Nb pm Sb
Date Count am Nb am Sb pm Nb pm Sb
8/19/94 2159
10/13/94 2327 9/22/94 6872
10/6/99 1388 21 48 52 73 2/28/95 658811/8/00 1569 34 42 54 72 2/24/98 7508 258 279 386 331
2/4/04 1523 32 53 65 62 3/18/98 8378 382 318 435 375
3/3/05 1567 24 58 68 64 11/30/99 8085
10/26/00 7674
5/16/05 ADT 349 13 13 21 11 12/15/05 9191 402 320 437 428
12/21/95 12380 601 289 523 677
Date Count am Nb am Sb pm Nb pm Sb
5/29/96 11774 171 90 398 443
3/31/98 7533 2/3/99 10887 462 300 489 619
11/28/00 10020
11/16/94 6661 11/4/03 11200 522 347 462 618
11/17/04 5653 385 188 222 399
7/5/95 1471 20 75 107 523/31/98 9280 1/3/01 1408 21 60 122 60
1/9/01 7967 528 182 219 516 6/3/04 1587 32 69 87 67
9/29/04 7945 436 183 265 534
Date Count am Nb am Sb pm Nb pm Sb
Date Count am Nb am Sb pm Nb pm Sb
8/19/94 2159
10/24/95 2993 10/13/94 2327
10/1/96 2615 124 79 102 153 10/6/99 1388 21 48 52 73
11/19/96 2216 126 54 79 123 11/8/00 1569 34 42 54 72
4/15/97 2719 2/4/04 1523 32 53 65 62
3/9/99 2649 165 62 93 135 3/3/05 1567 24 58 68 64
11/2/99 2728
5/15/03 2722 138 41 90 171 7/12/93 1303
6/22/05 2481 108 23 90 121 9/15/93 13778/19/94 1672
5/16/05 ADT 32 1 1 2 4 10/13/94 1254
5/23/05 ADT 30 2 4 3 4 3/2/95 518
10/6/99 818 10 36 40 37
4/27/04 815
Date Count am Nb am Sb pm Nb pm Sb 3/3/05 901 13 26 48 33
4/5/00 12007 174 536 714 430
2/14/02 10890 132 566 656 398 Date Count am Nb am Sb pm Nb pm Sb
3/2/04 13283 201 742 733 491
4/20/06 18710 344 922 752 806 10/26/95 10764 483 238 651 615
5/1/96 13683
5/23/06 ADT 396 20 20 19 21 10/19/99 11095 492 177 469 556
11/5/02 10652 326 203 419 604
1/12/05 10011 315 231 369 494
Traffic Counts
Locust Grove north of Fairview
Beacon Street west of Broadway
Built:2002
Built:2002Wesley Subdivison
Original South Boise Village
Targee west of Orchard
Built:2003Phillipi Park
Cherry Lane West of Vista
Shoshone north of Cherry lane
Built:1998
Bluff daily trip counter
Battlement daily trip counter east of Pierce Park
Built:2002Ferndale Subdivison
Oak Park/Brampton Square
Manitou south of Boise Avenue
Built:1997Gatewood Subdivison
Pierce Park south of Hill Road
Vista North of Targee
Vista South of Targee
Garden Street north of Emerald
Roosevelt north of Emerald
Built:1999Urban Renaissance
Apple Street north of Bergeson
Built:2002Central Rim Neighborhood
Wright Street east of Apple Street
Apple Street south of Boise Avenue
Phillipi daily trip counter at project
Willowbrook daily trip counter
Garden Green
Built:1996
Hyde Park Place Built:2004
Garden Street north of Emerald
Fort St west of 9th
Fort St east of 13th
Fort St west of 13th
Original South Boise Village, Before
$50,000
$70,000
$90,000
$110,000
$130,000
$150,000
$170,000
$190,000
$210,000
1994
1995
1996
1997
1998
1999
2000
2001
Avg
. S
ale
s P
rice
$40.00
$50.00
$60.00
$70.00
$80.00
$90.00
$100.00
$110.00
$120.00
1994
1995
1996
1997
1998
1999
2000
2001
Year
Av
g.P
ric
e p
er
Sq
ua
re F
oo
t
MLS 300 Original South Boise Village
20012002
20032004
2005
Original SB Village After
20012002
20032004
2005
Infill
built
Infill
built
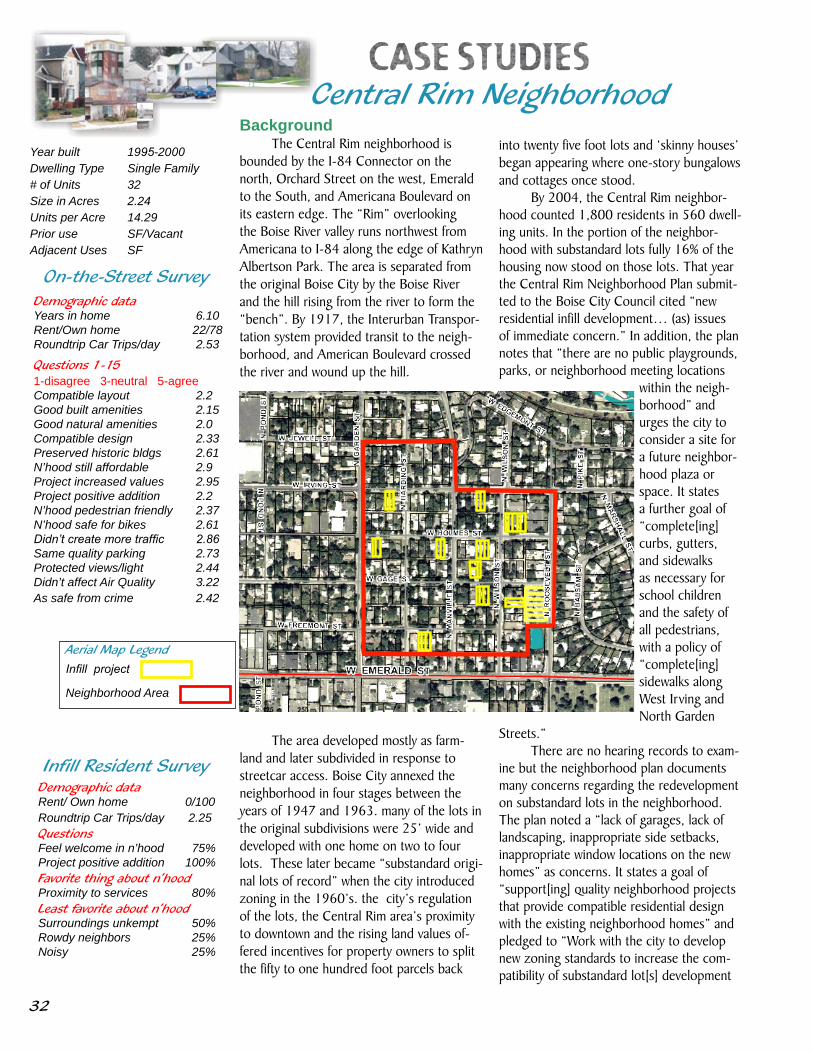
32
On-the-Street Survey
Infill Resident Survey
Central Rim Neighborhood
Year built 1995-2000Dwelling Type Single Family# of Units 32Size in Acres 2.24Units per Acre 14.29Prior use SF/VacantAdjacent Uses SF
BackgroundThe Central Rim neighborhood is
bounded by the I-84 Connector on the north, Orchard Street on the west, Emerald to the South, and Americana Boulevard on its eastern edge. The “Rim” overlooking the Boise River valley runs northwest from Americana to I-84 along the edge of Kathryn Albertson Park. The area is separated from the original Boise City by the Boise River and the hill rising from the river to form the “bench”. By 1917, the Interurban Transpor-tation system provided transit to the neigh-borhood, and American Boulevard crossed the river and wound up the hill.
The area developed mostly as farm-land and later subdivided in response to streetcar access. Boise City annexed the neighborhood in four stages between the years of 1947 and 1963. many of the lots in the original subdivisions were 25’ wide and developed with one home on two to four lots. These later became “substandard origi-nal lots of record” when the city introduced zoning in the 1960’s. the city’s regulation of the lots, the Central Rim area’s proximity to downtown and the rising land values of-fered incentives for property owners to split the fifty to one hundred foot parcels back
into twenty five foot lots and ‘skinny houses’ began appearing where one-story bungalows and cottages once stood.
By 2004, the Central Rim neighbor-hood counted 1,800 residents in 560 dwell-ing units. In the portion of the neighbor-hood with substandard lots fully 16% of the housing now stood on those lots. That year the Central Rim Neighborhood Plan submit-ted to the Boise City Council cited “new residential infill development… (as) issues of immediate concern.” In addition, the plan notes that “there are no public playgrounds, parks, or neighborhood meeting locations
within the neigh-borhood” and urges the city to consider a site for a future neighbor-hood plaza or space. It states a further goal of “complete[ing] curbs, gutters, and sidewalks as necessary for school children and the safety of all pedestrians, with a policy of “complete[ing] sidewalks along West Irving and North Garden
Streets.”There are no hearing records to exam-
ine but the neighborhood plan documents many concerns regarding the redevelopment on substandard lots in the neighborhood. The plan noted a “lack of garages, lack of landscaping, inappropriate side setbacks, inappropriate window locations on the new homes” as concerns. It states a goal of “support[ing] quality neighborhood projects that provide compatible residential design with the existing neighborhood homes” and pledged to “Work with the city to develop new zoning standards to increase the com-patibility of substandard lot[s] development
Demographic dataYears in home 6.10Rent/Own home 22/78Roundtrip Car Trips/day 2.53
Questions 1-151-disagree 3-neutral 5-agreeCompatible layout 2.2Good built amenities 2.15Good natural amenities 2.0Compatible design 2.33Preserved historic bldgs 2.61N’hood still affordable 2.9Project increased values 2.95Project positive addition 2.2N’hood pedestrian friendly 2.37N’hood safe for bikes 2.61Didn’t create more traffic 2.86Same quality parking 2.73Protected views/light 2.44Didn’t affect Air Quality 3.22As safe from crime 2.42
Demographic dataRent/ Own home 0/100 Roundtrip Car Trips/day 2.25Questions Feel welcome in n’hood 75% Project positive addition 100% Favorite thing about n’hood Proximity to services 80% Least favorite about n’hood Surroundings unkempt 50%Rowdy neighbors 25%Noisy 25%
Aerial Map LegendInfill project
Neighborhood Area

33
Real Estate Data
Traffic Counts
with the existing neighborhood by develop-ing new zoning standards to increase the compatibility of substandard lots that may include increased landscaping requirements, window orientation, restrictions on the amount of paving per lot, and architectural enhancements that break up the scale and mass of the structure.” A committee includ-ing neighborhood leaders (though none from this neighborhood) helped write the new permanent substandard lot ordinance that addresses many of the concerns cited in the Central Rim Plan.Evaluation
Still, it is no surprise that the 23 neighbors in the Central Rim neighborhood gave the lowest scores to public amenities, a mean score of 2.0, and to compatibility of design, height and mass - a mean score of 2.15. Anecdotally researchers note that the response citing a lack of public ameni-ties is related to the lack of curb, gutter, and sidewalk and particularly the ubiquitous use of the right-of-way for front in graveled park-ing for the new homes that were built under the old ordinance. Respondents did not feel that these ‘skinny houses’ were a positive addition to the neighborhood or compat-ible in layout scoring both questions below average at 2.2. Indeed, this neighborhoods response to our survey garnered the lowest scores of any neighborhood we studied with a mean score of 2.53. One of the higher scores (2.86) indicated that neighbors believe relatively that the new development has not caused an increase in traffic. Data from the highway district confirms that traffic has remained stable from 2000 to 2005 on Garden and Roosevelt streets internally to the neighborhood.
Researchers also asked the neighbors if they believed these new ‘skinny houses’ impacted their property values. Though from an aesthetic standpoint, neighbors over-whelmingly disliked these new homes, the statement that garnered the largest amount of agreement (2.95) was that they did not negatively impact the value of the existing homes. Further, neighbors agreed that the neighborhood was still a place they wanted to live in and could afford to live in. Indeed, as the real estate data for the neighborhood shows, the Central Rim neighborhood area of the Boise Bench shows strong growth
trend in both the average sale price and the price per square foot, with each out-pacing MLS Area 400 as a whole in the period during which the bulk of the ‘skinny houses’ were completed. Conclusion
Redevelopment on substandard lots of record has raised many concerns with residents of the Central Rim neighborhood. These concerns were well documented in the neighborhood plan of 2004. Apprehension about design standards, privacy, garage placement, and landscaping were addressed in the new permanent substan-dard lot ordinance with neigh-borhood input. The ‘skinny houses’ have not dampened real estate values; in fact affordability is beginning to become an issue of con-cern. Retrofitting sidewalks, particularly on the collec-tors within the neighbor-hood, and introducing new public open space have not been addressed.
Date Count am Nb am Sb pm Nb pm Sb Date Count am Nb am Sb pm Nb pm Sb
4/10/97 23491 706 735 1055 1020 9/4/97 1183 59 11 48 90
10/30/02 22107 734 750 1018 893 10/18/00 1156 60 17 46 77
11/19/02 21540 705 745 952 855 9/28/05 897 37 9 39 30
11/18/03 20235 605 657 873 903
4/10/97 23172 738 787 1028 1015 Date Count am Nb am Sb pm Nb pm Sb
11/19/02 20501 654 722 908 802
11/18/03 19487 607 665 863 867 8/7/95 1005
2/7/06 19822 655 619 848 841 12/10/96 1161 20 58 49 55
8/26/98 1561
3/21/95 2060 96 45 79 111 1/25/00 1243 40 61 71 53
1/7/97 2314 114 30 73 123 1/24/01 1141 25 59 60 53
3/19/97 2212 109 33 73 119 6/26/01 1510
12/10/03 2038 67 23 68 130 7/15/03 1769 35 45 74 64
3/2/06 2822 99 37 126 130 12/2/04 1305 35 60 60 48
1/5/05 1355 34 54 83 71
12/27/95 843 20 20 42 38
1/5/06 ADT 102
Date Count am Nb am Sb pm Nb pm Sb
Date Count am Nb am Sb pm Nb pm Sb
8/19/94 2159
10/13/94 2327 9/22/94 6872
10/6/99 1388 21 48 52 73 2/28/95 658811/8/00 1569 34 42 54 72 2/24/98 7508 258 279 386 331
2/4/04 1523 32 53 65 62 3/18/98 8378 382 318 435 375
3/3/05 1567 24 58 68 64 11/30/99 8085
10/26/00 7674
5/16/05 ADT 349 13 13 21 11 12/15/05 9191 402 320 437 428
12/21/95 12380 601 289 523 677
Date Count am Nb am Sb pm Nb pm Sb
5/29/96 11774 171 90 398 443
3/31/98 7533 2/3/99 10887 462 300 489 619
11/28/00 10020
11/16/94 6661 11/4/03 11200 522 347 462 618
11/17/04 5653 385 188 222 399
7/5/95 1471 20 75 107 523/31/98 9280 1/3/01 1408 21 60 122 60
1/9/01 7967 528 182 219 516 6/3/04 1587 32 69 87 67
9/29/04 7945 436 183 265 534
Date Count am Nb am Sb pm Nb pm Sb
Date Count am Nb am Sb pm Nb pm Sb
8/19/94 2159
10/24/95 2993 10/13/94 2327
10/1/96 2615 124 79 102 153 10/6/99 1388 21 48 52 73
11/19/96 2216 126 54 79 123 11/8/00 1569 34 42 54 72
4/15/97 2719 2/4/04 1523 32 53 65 62
3/9/99 2649 165 62 93 135 3/3/05 1567 24 58 68 64
11/2/99 2728
5/15/03 2722 138 41 90 171 7/12/93 1303
6/22/05 2481 108 23 90 121 9/15/93 13778/19/94 1672
5/16/05 ADT 32 1 1 2 4 10/13/94 1254
5/23/05 ADT 30 2 4 3 4 3/2/95 518
10/6/99 818 10 36 40 37
4/27/04 815
Date Count am Nb am Sb pm Nb pm Sb 3/3/05 901 13 26 48 33
4/5/00 12007 174 536 714 430
2/14/02 10890 132 566 656 398 Date Count am Nb am Sb pm Nb pm Sb
3/2/04 13283 201 742 733 491
4/20/06 18710 344 922 752 806 10/26/95 10764 483 238 651 615
5/1/96 13683
5/23/06 ADT 396 20 20 19 21 10/19/99 11095 492 177 469 556
11/5/02 10652 326 203 419 604
1/12/05 10011 315 231 369 494
Traffic Counts
Locust Grove north of Fairview
Beacon Street west of Broadway
Built:2002
Built:2002Wesley Subdivison
Original South Boise Village
Targee west of Orchard
Built:2003Phillipi Park
Cherry Lane West of Vista
Shoshone north of Cherry lane
Built:1998
Bluff daily trip counter
Battlement daily trip counter east of Pierce Park
Built:2002Ferndale Subdivison
Oak Park/Brampton Square
Manitou south of Boise Avenue
Built:1997Gatewood Subdivison
Pierce Park south of Hill Road
Vista North of Targee
Vista South of Targee
Garden Street north of Emerald
Roosevelt north of Emerald
Built:1999Urban Renaissance
Apple Street north of Bergeson
Built:2002Central Rim Neighborhood
Wright Street east of Apple Street
Apple Street south of Boise Avenue
Phillipi daily trip counter at project
Willowbrook daily trip counter
Garden Green
Built:1996
Hyde Park Place Built:2004
Garden Street north of Emerald
Fort St west of 9th
Fort St east of 13th
Fort St west of 13th
Central Rim Neighborhood Before
$60,000
$80,000
$100,000
$120,000
$140,000
$160,000
$180,000
1995
1996
1997
1998
1999
2000
Av
g.
Sa
les
Pri
ce
Central Rim Neighborhood After
20002001
20022003
20042005
$50.00
$60.00
$70.00
$80.00
$90.00
$100.00
$110.00
$120.00
$130.00
$140.00
1995
1996
1997
1998
1999
2000
Year
Av
g. P
ric
e p
er
Sq
ua
re F
oo
t
MLS Area 400 Central Rim Neighborhood
2000
2001
2002
2003
2004
2005
Year
Infill
built
Infill
built

34
Testimony and On the Street Survey
TestimonyThe Study team examined public hear-
ing records for the projects at the City of Boise and in Meridian. 158 people com-mented on the projects through testimony, written comments, or petition signatures. Of those who commented:• 20% were concerned about increased traf-
fic and traffic congestion.• 19% opposed density.• 13% thought the project was incompatible
with the existing neighborhood• 10% feared parking issues.• 9% predicted school overcrowding.
“ 8% worried about safety issues
On the Street SurveysThe team conducted on-the-street
surveys door to door in the neighborhoods surrounding the projects. Teams of two volunteers and one study team member can-vassed each neighborhood. The respondents were read a series of statements and asked to score them from one to five, with one meaning strongly disagree and five meaning strongly agree (see sample next page). Sur-veys were completed with 184 respondents: • 80% of respondents were homeowners • 53% had lived in their home ten years or
more• The lowest mean score overall was 2.45
on the statement; the project includes public amenities such as traffic calming, pathways and public open space that enhance the neighborhood.
The survey specifically asked about public amenities. Many of the projects that scored low on this question have amenities such as curb gutter and sidewalk that are lacking in the surrounding neighborhood but adding these to the project did not serve the neighborhood as a whole.
• The second lowest score of 2.71 was recorded on the statement; the project preserved desirable elements for the neighborhood such as historic structures or mature trees.
• Respondents agreed that projects did not negatively affect air quality with the high-est mean score of 3.60
• The second highest score of 3.48 was recorded on the statement; existing residents can find the same quality and quantity of on-street parking since the project was completed.
Neighbors near Garden Green and in the Central Rim Neighborhood were exceptions on the question of parking, scoring it lower than average.

35
On the Street Survey
On the Street Survey SampleComments from neighbors exhibited a range of feelings
about infill development
One neighbor reported “the neighborhood had no plan, but this development
was incongrous.”
A second said “I testified [against] on
setbacks and landscaping, in truth I wasn’t fully
informed...the houses are nice and they kept a lot of
trees.”
From a third “The skinny house
developers really don’t care and the rules let them not
care.”
Finally one neighbor states
“the people are nice but not the density.”
On the Street Survey Summary
C ompa tible layout
C ompatible
des ign
Includesam
enities
Includes na tura l amenities
Pe rse rves his torics tructure s
Maintained
affordability
Incre asedsurrounding
value s
Pos itive addition
Pede strianfriendly
S a fefor bikes
Did not cre a tetra ffic
S amequa lity of parking
P rote ct views/light
Air qua lity
S afefrom
crime
Ave rage
Y ea rs %R ent/Own C a rT r ips 1 2 3 4 5 6 7 8 9 10 11 12 13 14 15C entral R im 6. 1 22/78 2.53 2. 2 2.15 2 2.33 2.61 2.9 2 .95 2 .2 2. 37 2. 61 2.86 2.73 2.44 3.22 2.42 2.53F erndale 11. 69 23/77 2.96 2.46 2.92 2 2.75 2.36 3 .46 3 .42 2 .62 2. 55 2. 82 2.17 3.38 3.08 3.33 3.08 2.83G arden G reen 8.22 44/56 4.33 2.83 3 2.67 3.17 2.71 3 2 .57 2 .43 3 2. 57 2 2.67 3 2.86 3.29 2.78G atewood 20. 29 14/86 3.52 2.89 2.75 2.56 3.46 2.85 3 .32 3 2 .89 3. 15 3. 26 3.07 3.25 3 3.62 3.36 3.10Hyde P ark P la ce 11. 59 27/73 2.32 3.55 3.18 2.55 3.91 2.13 3.4 4.1 3 .7 3. 27 3 3. 6 4.45 3.4 4.36 3.8 3.49Oak P ark/B ra mpton 19. 58 29/71 2.13 2.56 2.6 2.39 2.92 2.36 3.2 3 .09 2 .52 3. 04 2. 35 2.26 2.57 2.04 2.7 2.48 2.61Phillipi Pa rk 15. 59 12/88 2.41 4.35 4.47 4 4.71 4.53 4 .53 4 .35 4 .75 4. 35 4. 06 4.12 4.06 4.76 4.41 4.47 4.39S outh Bois e V illa ge 9.04 37/63 2.5 2.25 2.13 1.63 2.75 1.75 2 .44 2.8 2 .75 2. 67 2 .8 3.13 3.13 2.13 3.5 3.25 2.61Urba n R enais sa nce 11. 57 07/93 3.33 2.67 2.6 2.07 3 2.08 3 .53 3 .71 2 .79 2. 73 2. 86 3.15 3.29 2.62 3.31 3.15 2.90W a shington S quare 15. 56 12/88 2.79 3.47 3 2.5 3.65 3.08 3 .59 3 .96 3 .5 3. 88 3. 71 3.81 3.94 3.35 3.94 4.06 3.56W esley 14. 91 0/100 4.59 3.09 3.55 2.67 3.56 3.38 3 .82 3 .88 3 .6 3 .3 3 .5 3.56 4. 8 3.64 4.4 4.2 3.66T otals 13.1 20/80 3.04 2. 94 2.94 2.46 3.29 2.71 3.38 3 .44 3 .07 3 .12 3 .05 3. 07 3.48 3.04 3.60 3.41 3.13
* 8 of 11 projects s urveyed ga ve the lowes t s core to ques tion 3 - "includes a menitie s. "3 ques tions ha d multiple instances rece iving the highes t s core: 7) Increa sed s urrounding values ; 12) s ame qualityof parking; 15) s afe from
crime. P arking, negative imapct on property value s or crime, are common complaints in the public hea ring proce ss .

36
Infill Resident Survey
BackgroundThe Study team made a decision to
complete a mail survey of the residents of the chosen case study projects. Although this was not part of the original scope of the study the team felt that the results would be informative in humanizing those residents. By asking demographic and other questions it would allow a comparison with neighbor-hood residents and a basis to discern their own perceptions of their homes and the neighborhoods they had chosen to live in.
The survey was mailed to 447 residents of the twelve case study projects chosen. 206 of the surveys were mailed to residents of the Oak Park Village Apart-ments, a project that is 100% rentals. Nine surveys were returned from Oak Park for a return rate of 4%. Of the remaining 241 surveys 40 were returned at a rate of 17%. Researchers recognize that this is not a scientifically random sample of residents and the data is more qualitative than quantitative. However the perceptions and estimates self reported by this group are no different than the qualitative self reported perceptions and estimates made by the neighbors of these projects in our door to door survey.
Infill residents were asked whether they owned or rented and to estimate the number of cars trips they took per day. They were asked if they felt welcome in their neighbor-hood and whether they believed their home to be a positive addition. Finally they were allowed to comment on their favorite and least favorite thing about their new home and also to make a general comment. Some of the residents surveyed named more than one issue in their general comments so some of the categories have more than 49 total comments. Results
Perhaps the most revealing comments received from these surveys was the over-whelming response to our question “What is the favorite thing you have discovered about your neighborhood?” A full 57% of the resi-dents, unprompted in an open ended ques-tion, responded that the proximity or short
walking distances to jobs services and every day needs was their favorite thing, 18% cited friendly neighbors or neighborhood and 11% named nearby parks and other ameni-ties. No other issue garnered more than two responses.
Although not as overwhelming the response to the inverse question “What is the least favorite thing you have discovered about your neighborhood?” is nearly as revealing. 29% of residents identified sur-rounding property that was not well cared for as their least favorite thing. Another 8% of our respondents mentioned rowdy neighbors, a different 8% thought noise was an issue, and a variety of other issues were rated about equally.
Every one of the infill residents who responded (100%) felt that their home was a positive addition to the neighborhood and overwhelming they feel welcome in their neighborhoods with 45 of the 49 respon-dents (92%) answering yes to that question.
To the question “How many roundtrip car trips does your household make per day?” infill residents self-report 1.9 trips per day, a third less than what surrounding neighbors self-reported at 3 trips per day. In each group 80% were homeowners and 20% were renters. Residents of one infill project estimated taking less than one trip per day on average at 0.75 trips per day and in only three projects did infill residents estimate taking more than 2.5 trips per day which was the lowest estimate by surrounding neighbors.
Researchers agree that while the num-ber itself may not be accurate it is probable that any difference between the estimate made by infill residents and surrounding neighbors is accurate. Coupled with the quantitative data collected on average daily trips on the affected roads there is strong evidence in the cases we studied that infill projects do not generate excessive traffic. Researchers encourage further study of this factor by traffic engineers and others who are charged with estimating trip generation for planning purposes.
Infill residents’ comments on whether their homes were a
positive addition to the neigh-borhood were heartfelt and
confirm anecdotally the hopes for infill that policy makers have
stated.
One resident wrote
“I am glad that this afford-able, low environmental impact housing exists in
inner Boise.”
Another said
“[as a] single woman work-ing for a non-profit that
does good for the commu-nity – but doesn’t pay well, owning a tall skinny house has made it possible for me to live well. I love my house, its small enough for me to manage the home mainte-nance & new enough I don’t
have to fix it up.”
A third reported
“I like having a new home near downtown.”
Finally one resident states
“I love my house! It’s the cutest on the block.”
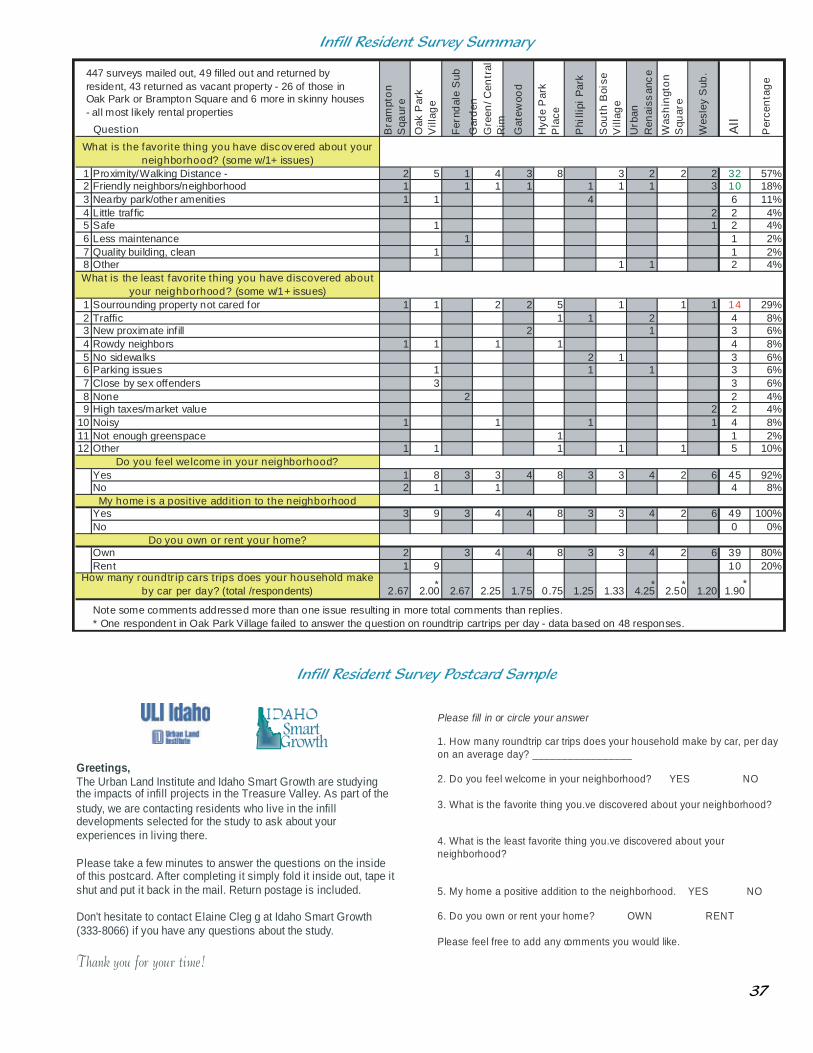
37
Infill Resident Survey Postcard Sample
Infill Resident Survey Summary
Greetings,The Urban Land Institute and Idaho Smart Growth are studyingthe impacts of infill projects in the Treasure Valley. As part of thestudy, we are contacting residents who live in the infilldevelopments selected for the study to ask about yourexperiences in living there.
Please take a few minutes to answer the questions on the insideof this postcard. After completing it simply fold it inside out, tape itshut and put it back in the mail. Return postage is included.
Don't hesitate to contact Elaine Cleg g at Idaho Smart Growth(333-8066) if you have any questions about the study.
Thank you for your time!
Smart Growth
Please fill in or circle your answer
1. How many roundtrip car trips does your household make by car, per dayon an average day? _________________
2. Do you feel welcome in your neighborhood? YES NO
3. What is the favorite thing you.ve discovered about your neighborhood?
4. What is the least favorite thing you.ve discovered about yourneighborhood?
5. My home a positive addition to the neighborhood. YES NO
6. Do you own or rent your home? OWN RENT
Please feel free to add any comments you would like.
큳?Question B
ram
pto
nS
qaur
e
Oak
Par
kV
illag
e
Fer
ndal
eS
ub
Gar
den
Gre
en/C
entr
alR
im
Gat
ewoo
d
Hyd
eP
ark
Pla
ce
Phi
llipi
Par
k
Sou
thB
oise
Vill
age
Urb
anR
enai
ssan
ce
Was
hin
gto
nS
quar
e
Wes
ley
Sub
.
All
Per
cen
tag
e
1 Proximity/Walking Distance - 2 5 1 4 3 8 3 2 2 2 32 57%2 Friendly neighbors/neighborhood 1 1 1 1 1 1 1 3 10 18%3 Nearby park/other amenities 1 1 4 6 11%4 Little traffic 2 2 4%5 Safe 1 1 2 4%6 Less maintenance 1 1 2%7 Quality building, clean 1 1 2%8 Other 1 1 2 4%
561 Sourrounding property not cared for 1 1 2 2 5 1 1 1 14 29%2 Traffic 1 1 2 4 8%3 New proximate infill 2 1 3 6%4 Rowdy neighbors 1 1 1 1 4 8%5 No sidewalks 2 1 3 6%6 Parking issues 1 1 1 3 6%7 Close by sex offenders 3 3 6%8 None 2 2 4%9 High taxes/market value 2 2 4%
10 Noisy 1 1 1 1 4 8%11 Not enough greenspace 1 1 2%12 Other 1 1 1 1 1 5 10%
Yes 1 8 3 3 4 8 3 3 4 2 6 45 92%No 2 1 1 4 8%
Yes 3 9 3 4 4 8 3 3 4 2 6 49 100%No 0 0%
Own 2 3 4 4 8 3 3 4 2 6 39 80%Rent 1 9 10 20%
2.67 2.00 2.67 2.25 1.75 0.75 1.25 1.33 4.25 2.50 1.20 1.90
Note some comments addressed more than one issue resulting in more total comments than replies.* One respondent in Oak Park Village failed to answer the question on roundtrip cartrips per day - data based on 48 responses.
My home i s a posit ive addit ion to the neighborhood
Do you own or rent your home?
How many roundtr ip cars trips does your household makeby car per day? (total /respondents)
What is the favorite thing you have discovered about yourneighborhood? (some w/1+ issues)
What is the least favorite thing you have discovered aboutyour neighborhood? (some w/1+ issues)
Do you feel welcome in your neighborhood?
447 surveys mailed out, 49 filled out and returned byresident, 43 returned as vacant property - 26 of those inOak Park or Brampton Square and 6 more in skinny houses- all most likely rental properties
*** *
38
Resources
City of Boise, City Code, Title 11, Zoning, http://www.cityofboise.org/Departments/City_Clerk/CityCode/page14176.aspx
City of Boise, Comprehensive Plan, http://www.cityofboise.org/Departments/PDS/CompPlanning/Documents/page15741.aspx
Original South Boise Neighborhood Plan, City of Boise Neighborhood Planning, http://www.cityofboise.org/Departments/PDS/Neighborhoods/NeighborhoodPlans/page11096.aspx
Central Rim Neighborhood Plan, City of Boise Neighborhood Planning, http://www.cityofboise.org/Departments/PDS/Neighborhoods/NeighborhoodPlans/page11096.aspx
City of Meridian, City Code, Title 11, Unified Development Code, http://66.113.195.234/ID/Meridian/index.htm
City of Meridian, Comprehensive Plan, http://www.meridiancity.org/planning_zoning/comprehensive_plans/index.asp
ULI IdahoPO Box 8463
Boise, ID 83707www.idaho.uli.org
Idaho Smart GrowthPO Box 374
Boise, ID 83701www.idahosmartgrowth.org
For more information contact:

The�Consequences�ofResidential�Infill�Development�on
Existing�Neighborhoodsin�the�Treasure�Valley
a�Study�and�Conclusions
IDAHO ULI�Idahoand
Idaho�Smart�GrowthPO�Box�374
Boise,�ID�83701www.idahosmartgrowth.org
ULI�IdahoPO�Box�8463
Boise,�ID�83707www.idaho.uli.org
ULI�IdahoUrban�LandInstituteULI