The Conners Parent Rating Scale: Psychometric, clinical ... - Conners.pdf · 3 Introduction The...
15
1 Running head: Psychometric properties of the Conners Parent Rating Scale The Conners Parent Rating Scale: Psychometric, clinical and cross-cultural considerations in typically developing 4- to 12-year-old French- speaking children Key words: Conners Scale, validation, confirmatory analyses, children, ADHD
-
Upload
nguyenkhanh -
Category
Documents
-
view
239 -
download
1
Transcript of The Conners Parent Rating Scale: Psychometric, clinical ... - Conners.pdf · 3 Introduction The...

1
Running head: Psychometric properties of the Conners Parent Rating Scale
The Conners Parent Rating Scale: Psychometric,
clinical and cross-cultural considerations in
typically developing 4- to 12-year-old French-
speaking children
Key words: Conners Scale, validation, confirmatory analyses, children, ADHD

2
Abstract
The principal aim of this study was to validate the five-factor structure of the French version of
the Conners Parent Rating Scale-CPRS in French-speaking children. A sample of children with
Attention Deficit and Hyperactivity Disorder (ADHD) was assessed and their ADHD CPRS profile
was examined. Confirmatory factor analysis shows that the CPRS presents good psychometric
properties and has a factor structure similar to the original version. Furthermore, the CPRS
shows high rates of sensitivity and specificity when the ADHD and control group scores are
compared. Clinical and cross-cultural implications are discussed.
3
Introduction
The Conners Parent Rating Scales (CPRS) are principally intended to be used as clinical and
research tools with children suffering from neurodevelopmental disorders, and particularly
ADHD.
The first version of the CPRS (CPRS-93; Conners, 1973) included 93 items which assessed
problematic behavior in children within 25 different areas (e.g., peer relationships, temper, etc.)
in order to identify “hyperkinetic” children and to analyze the effectiveness of drug treatments.
Later, Goyette, Conners, and Ulrich (1978) tested the psychometric properties of a 48-item
version (CPRS-48) and obtained a five-factor structure. This shorter rating form provides a
qualitative and quantitative picture of children’s emotions and behavior, based on five subscales
assessing (1) Conduct Problems, (2) Learning Problems, (3) Psychosomatic, (4) Impulsive-
Hyperactive, and (5) Anxiety. In addition, the CPRS-48 includes the Hyperactivity Index (HI) with
10 items that are considered to be the most sensitive to treatment effects.
Currently, the CPRS-48 remains the most widely used scale in both clinical and research settings
in French-speaking European countries (see Wodon, 2008), which is probably explained by its
ease and rapidity of completion. However, to our knowledge, its factor structure has never been
verified through adequate statistical analyses such as Confirmatory Factor Analyses-CFA
(Deplus, 2007). Furthermore, normative data for French-speaking European countries do not
exist for this adaptation. Consequently, several authors (e.g., Wodon, 2008) suggest using the
normative data from the study by Goyette et al. (1978), which could be problematic for two
main reasons. First, we can question the relevance of using the 34-year-old normative data from

4
Goyette et al. (1978) in assessing children without considering the period’s influence on
children’s behavior (including changes in politics and the economy, family environment, and
multimedia since 1978). Secondly, these normative data come from the US and should be used
with caution in a French-speaking European culture. This latter point is particularly challenging
considering that some cultural differences have been found in other psychopathology screening
measures between French-speaking countries (e.g., France) and the US (e.g., see Shojaei,
Wazana, Pitrou, & Kovess, 2009), and between the Flemish community of Belgium and the US
(Braet et al., 2011).
From this perspective, this study principally aims to verify the five-factor structure of the CPRS-
48 in a sample of typically developing children. In addition, the raw scores obtained will be
compared to the normative data from the US collected by Goyette et al. (1978). Finally, we will
compare the CPRS scores of a sample of ADHD children and a matched-control group.
Part 1
Participants
The CPRS-48 was distributed in several schools in the French-speaking part of Belgium. A total of
377 typically developing children (178 boys) from 4 to 12 years old were included in this study.
Material
In the CPRS-48, parents have to rate their child’s behavior on a 4-point Likert scale from 0 (not
at all) to 3 (severely). The five-factor structure described by Goyette et al. (1978) was examined.

5
Results
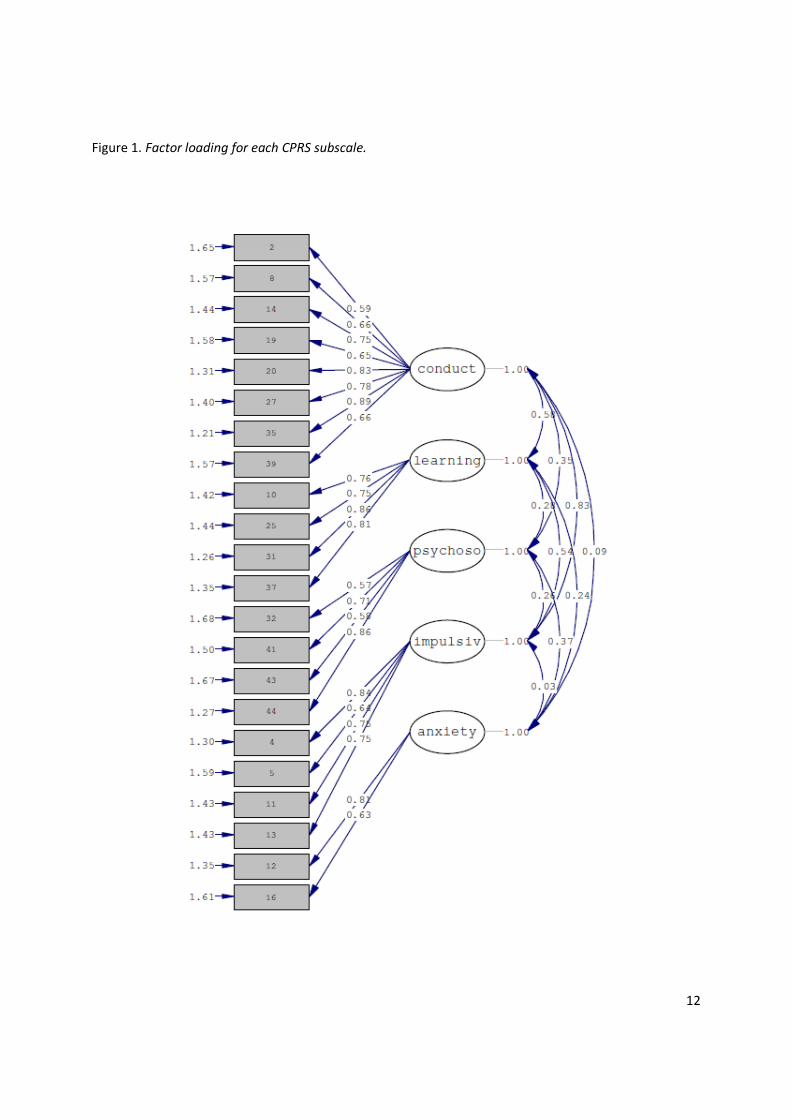
Confirmatory factor analysis
CFA were computed using LISREL 8.80 (Jöreskog & Sörbom, 2006) to examine the factor
structure of the French adaptation of the CPRS-48 using the Robust Maximum Likelihood
method (Satorra & Bentler, 1988). A model can be considered to fit the data well when the χ2/df
ratio is inferior to 2, when the root mean square error of approximation (RMSEA) value is
comprised between 0 and .05 ; when the comparative fit index (CFI) value is >.90 and finally,
when the standardized root mean square residual (SRMR) values remain below 0.10.
The combination indicated an acceptable fit for the five-factor structure assessed (see Figure 1)
with χ2(199) = 212.05, p = .25, and χ2/df ratio = 1.06; RMSEA=.05; CFI= .94 and SRMR=.04.
Internal reliability
The reliability coefficients for Conduct Problems and Learning Problems are .80 and .78, and .83
for the HI. The reliability coefficient for the Impulsive-Hyperactive scale is .76. However, the
coefficient is weaker for the Psychosomatic (α = .58) and Anxiety (α = .55).
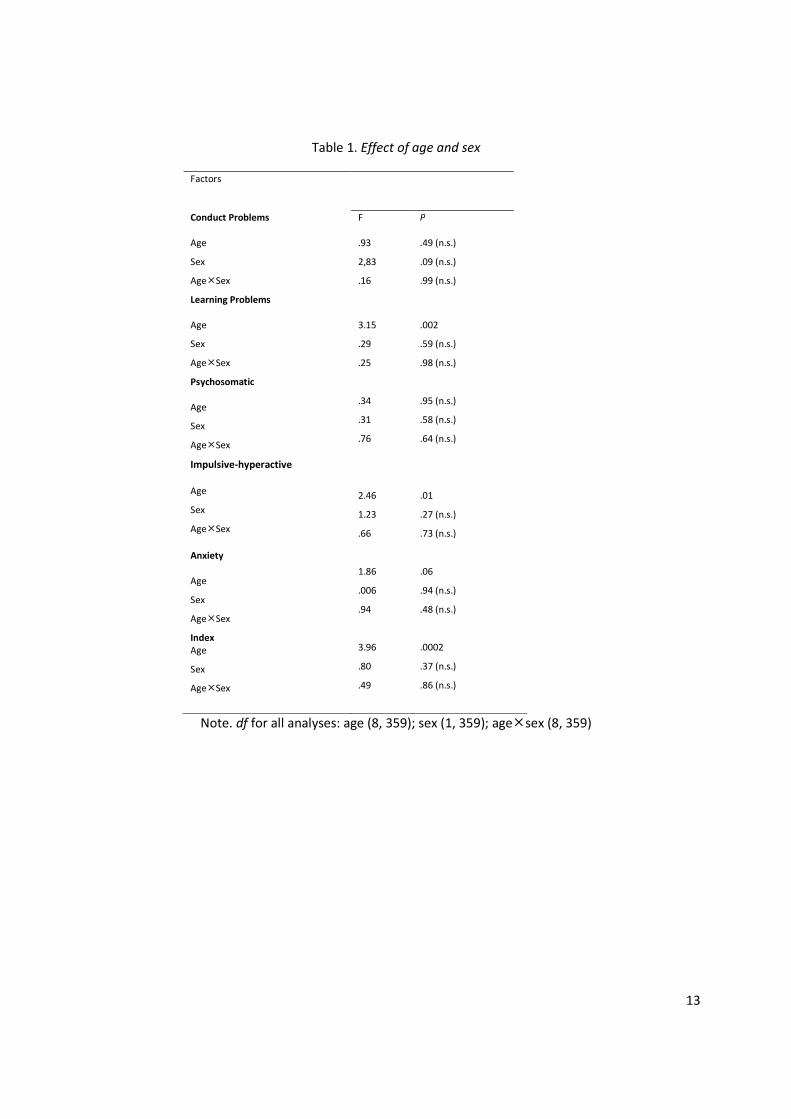
Age and sex effect
Analyses of variance were conducted on the five subscales and HI, with age and sex as
independent variables. The results (see Table 1) showed no significant sex effect for any of the
variables considered. However, an age effect was found for the Learning Problems, Impulsive-
Hyperactive and HI subscales.

6
Comparison with US data
t analyses between the US and Belgian raw scores were first computed for the group whose age
range (6–8 years old) was identical to the group used in Goyette et al. (1978, p. 231). These
analyses showed significant differences between French and US normative data for the Conduct
Problems, Learning Problems, and Impulsive-Hyperactive subscales, but also for the HI. The
Belgian sample had lower scores (p<.01).
Similar analyses were conducted for the other age groups. These analyses showed significant
differences only in the US and the Belgian scores for Conduct Problems, with lower scores
(p<.01) for the Belgian preschoolers (3–5 versus 4–5). However, in the older age groups (9–11
and 9–12), the analyses showed significant differences between French and US normative data
for the Conduct Problems and Impulsive-Hyperactive subscales, but also for the HI. Again, the
Belgian sample had lower scores (p<.01).
Part 2
Participants
ADHD and control groups. Children who consulted for attention disorders from January to July
2012 in our clinical neuropsychological unit were screened for ADHD according to the DSM-IV
criteria by a trained examiner. Fifteen children (13 boys, mean age in months: 95; SD: 14.89)
with a diagnosis of ADHD confirmed by a French adaptation of the ADHD Rating Scale-IV
(DuPaul, Power, Anastopoulos, & Reid, 1998) were included in this study. The control group
7
consisted of 30 children recruited from the Part 1 (26 boys; mean age in months: 96.1; SD:
14.87) who were matched for age and sex (p>.05).
Results
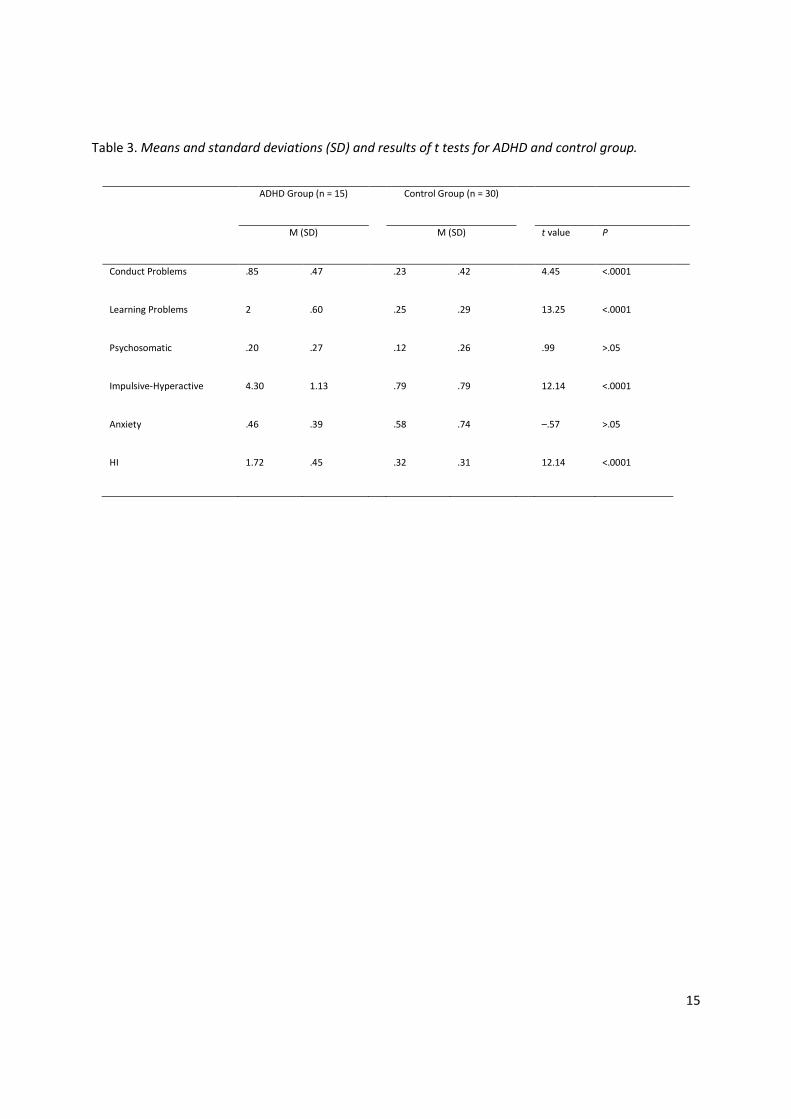
t tests revealed significant differences for several scales between ADHD and control group (see
Table 3). Logistic regression analyses showed that the CPRS subscales contributed significantly
to distinguishing the ADHD children from the control group, with a specificity ranging from
93.33% (Conduct Problems) to 96.66% (HI and Impulsive-Hyperactive), and a sensitivity ranging
from 0% (Anxiety) to 93.33% (HI and Impulsive-Hyperactive).
Discussion
The results confirm the five-factor structure of the CPRS in 4-to 12-year-old French-speaking
children. Interestingly, these results indicate that, despite the fact that the data were collected
in different cultural environments and at different economic and social periods, the factor
structure of the French version of the CPRS is similar to that of the original version (Goyette et
al., 1978), suggesting that the psychometric properties of the scale possess strong and lasting
cross-cultural robustness. Furthermore, with exception of the Psychosomatic and Anxiety
subscales, the reliability coefficients are satisfactory.
Although our data are not strictly comparable to the results of Goyette et al. (1978) given that
Goyette et al. included a larger age range (3–17 years) in their study than we did (4–12 years),
we can, however, make some comparisons between the two studies. Three important points
must be highlighted. First, the principal connection between the two studies is that age can be

8
considered as a significant determinant of the scores on the Impulsive-Hyperactive scale and the
HI, an observation also confirmed by other studies (e.g., Conners, Sitarenios, Parker, & Epstein,
1998). Secondly, we did not find any significant effect of sex on any of the subscale scores (with
only a marginal effect for the Conduct Problems subscale). This lack of influence of sex on the
CPRS is quite surprising, but had already been observed with the CPRS in other cultures (e.g., El-
Hassan Al-Awad & Sonuga-Barke, 2002). Third, our results showed evidence that the normative
scores collected from the Belgian French-speaking children are lower than the US children’s
scores, particularly for the middle and older age groups (with significant differences principally
for the Conduct Problems and Impulsive-Hyperactive subscales and the HI index). One
explanation of this discrepancy could be that the cultural background influences the “way of
thinking about a child,” and consequently has an impact on parental ratings on behavior scales
(Braet et al., 2011). These performance divergences, which could be interpreted as an effect of
cultural biases demonstrate the need to provide culturally adapted norms so children with and
without psychopathological disorders can be better detected. From a clinical point of view,
these results show that the use of normative data from the US could lead to inaccuracy and a
risk of underestimating behavioral problems when used with French-speaking children.
Finally, our results confirm that the CPRS, and particularly the Impulsive-Hyperactive and HI
subscales, is very successful at discriminating between ADHD children and control children, with
high levels of specificity and sensitivity.
In conclusion, this study confirms the original five-factor structure of the CPRS when used with
French-speaking children. Furthermore, comparisons between the US normative data and the
Belgian data showed evidence of cultural biases and emphasized the necessity of using specific

9
culturally adapted normative data when administering behavioral scales to children. Finally, this
study showed the clinical utility of the French version of the CPRS in distinguishing ADHD
children who are being treated for attention disorders from control children.

10
References
Braet, C., Callens, J., Schittekatte, M., Soyez, V., Druart, C., & Roeyers, H. (2011). Assessing
emotional and behavioural problems with the Child Behaviour Checklist: Exploring the
relevance of adjusting the norms for the Flemish community. Psychologica Belgica, 51,
213–235.
Conners, C. K. (1973). Rating scales for use in drug studies with children. Psychopharmacology
Bulletin, 9, 24– 84.
Conners, C. K., Sitarenios, G., Parker, J. D. A., & Epstein, J. N. (1998). Revision and
restandardization of the Conners Teacher Rating Scale: Factor structure, reliability, and
criterion validity. Journal of Abnormal Child Psychology, 26, 279–291.
Deplus, S. (2007). L’évaluation des difficultés émotionnelles et comportementales chez l’enfant.
In M.-P. Noël (Ed.), Bilan neuropsychologique chez l’enfant, évaluation, mesure,
diagnostic (pp. 255–278). Wavre, Belgium: Mardaga.
DuPaul, G. J., Power, T. J., Anastopoulos, A. D., & Reid, R. (1998). ADHD rating scale IV.
Checklists, norms, and clinical interpretation. New York: Guilford Press.
El Hassan Al Awad, M. A., & Sonuga-Barke, E. J. S. (1992). Childhood problems in a Sudanese
city: A comparison of extended and nuclear families. Child Development, 63, 906–914.
Goyette, C. H., Conners, C. K., & Ulrich, R. F. (1978). Normative data on revised Conners Parent
and Teacher Rating Scales. Journal of Abnormal Child Psychology, 6, 221–236.

11
Jöreskog, K. G., & Sörbom, D. (2006). LISREL 8.80 for Windows [computer software].
Lincolnwood, IL: Scientific Software International, Inc.
Satorra, A., & Bentler, P. M. (1988). Scaling corrections for chi-square statistics in covariance
structure analysis. ASA 1988 Proceedings of the Business and Economic Statistics, Section (308-
313). Alexandria, VA: American Statistical Association.
Shojaei, T., Wazana, A., Pitrou, I., & Kovess, V. (2009). The Strengths and Difficulties
Questionnaire: Validation study in French school-aged children and cross-cultural
comparisons. Social Psychiatry and Psychiatric Epidemiology, 44(9), 740-747
Wodon, I. (2008). Trouble deficit de l’attention avec hyperactivité. In M. Bouvard (Ed.), Echelles
et questionnaires d’évaluation chez l’enfant et l’adolescent, volume 2 (pp. 19–26). Paris:
Elsevier Masson.
12
Figure 1. Factor loading for each CPRS subscale.
13
Table 1. Effect of age and sex
Factors
Conduct Problems
Age
Sex
Age�Sex
Learning Problems
F
.93
2,83
.16
P
.49 (n.s.)
.09 (n.s.)
.99 (n.s.)
Age
Sex
Age�Sex
Psychosomatic
Age
Sex
Age�Sex
Impulsive-hyperactive
Age
Sex
Age�Sex
Anxiety
Age
Sex
Age�Sex
Index
Age
Sex
Age�Sex
3.15
.29
.25
.34
.31
.76
2.46
1.23
.66
1.86
.006
.94
3.96
.80
.49
.002
.59 (n.s.)
.98 (n.s.)
.95 (n.s.)
.58 (n.s.)
.64 (n.s.)
.01
.27 (n.s.)
.73 (n.s.)
.06
.94 (n.s.)
.48 (n.s.)
.0002
.37 (n.s.)
.86 (n.s.)
Note. df for all analyses: age (8, 359); sex (1, 359); age�sex (8, 359)

14
Table 2. Mean age and standard deviations (SD) for the subscales of the CPRS
Age Group (both sexes) Conduct Learning Psychosomatic Hyperactive Anxiety HI
Mean SD Mean SD Mean SD Mean SD Mean SD Mean SD
4–5 years old (n = 78) .34 .39 .64 .57 .15 .31 .90 .67 .71 .64 .69 .48
6–8 years old(n = 132) .25 .36 .34 .42 .14 .27 .65 .63 .54 .56 .45 .43
9–12 years old (n = 167) .28 .28 .45 .51 .16 .27 .65 .59 .55 .50 .47 .40
15
Table 3. Means and standard deviations (SD) and results of t tests for ADHD and control group.
ADHD Group (n = 15) Control Group (n = 30)
M (SD) M (SD) t value P
Conduct Problems
Learning Problems
Psychosomatic
Impulsive-Hyperactive
Anxiety
HI
.85
2
.20
4.30
.46
1.72
.47
.60
.27
1.13
.39
.45
.23
.25
.12
.79
.58
.32
.42
.29
.26
.79
.74
.31
4.45
13.25
.99
12.14
–.57
12.14
<.0001
<.0001
>.05
<.0001
>.05
<.0001