The Connecticut Light and Power Company - … · The Connecticut Light and Power Company SRCP Page...
22
The Connecticut Light and Power Company SRCP Page I-1 I. ELECTRIC AND MAGNETIC FIELDS This section provides EMF information for the Project, presenting projections for future EMF levels associated with the proposed transmission line in each segment of the Preferred Route. The base case underground 115-kV line that was modeled for these projections is a single- circuit line using three cross-linked polyethylene cables in a triangular arrangement. Because of the proximity of the cable route to nearby existing overhead transmission lines, both the proposed underground and existing overhead transmission lines were modeled in the calculations. Section I.1 provides general background information about EMF – what it is and typical levels encountered in the environment. Section I.2 describes the Council’s requirements for addressing EMF. Section I.3 outlines the methods for measuring and calculating fields and summarizes the measured and calculated magnetic fields to comply with the requirements of the Council. Section I.4 summarizes new developments in EMF health research since the adoption of the Council’s EMF BMP in December of 2007. Section I.5 reviews CL&P’s actions demonstrating consistency with the Council’s guidelines. Section I.6 provides the references used for this section. In addition, there are four appendices for this section. Appendix D.1 is the Council’s EMF BMP. Appendix D.2 is CL&P’s Field Management Design Plan (“FMDP”) for the proposed project. Appendix D.3 contains tabulated results of the calculated electric and magnetic fields for the Project and information on generator dispatch. Appendix D.4 provides a review of relevant scientific literature since June of 2011 that was prepared by CL&P’s consultant, Exponent, Inc. I.1 ELECTRIC AND MAGNETIC FIELDS FROM POWER LINES AND OTHER SOURCES Electricity used in homes and workplaces is transmitted over considerable distances from generation sources to distribution systems. Electricity is transmitted as alternating current (“AC”) to all homes and over electric lines delivering power to neighborhoods, factories, and commercial establishments. The power provided by electric utilities in North America oscillates 60 times per second (i.e., at a frequency of 60 hertz (“Hz”)).
Transcript of The Connecticut Light and Power Company - … · The Connecticut Light and Power Company SRCP Page...
The Connecticut Light and Power Company
SRCP Page I-1
I. ELECTRIC AND MAGNETIC FIELDS
This section provides EMF information for the Project, presenting projections for future EMF
levels associated with the proposed transmission line in each segment of the Preferred Route.
The base case underground 115-kV line that was modeled for these projections is a single-
circuit line using three cross-linked polyethylene cables in a triangular arrangement. Because of
the proximity of the cable route to nearby existing overhead transmission lines, both the
proposed underground and existing overhead transmission lines were modeled in the
calculations.
Section I.1 provides general background information about EMF – what it is and typical levels
encountered in the environment. Section I.2 describes the Council’s requirements for
addressing EMF. Section I.3 outlines the methods for measuring and calculating fields and
summarizes the measured and calculated magnetic fields to comply with the requirements of
the Council. Section I.4 summarizes new developments in EMF health research since the
adoption of the Council’s EMF BMP in December of 2007. Section I.5 reviews CL&P’s actions
demonstrating consistency with the Council’s guidelines. Section I.6 provides the references
used for this section.
In addition, there are four appendices for this section. Appendix D.1 is the Council’s EMF BMP.
Appendix D.2 is CL&P’s Field Management Design Plan (“FMDP”) for the proposed project.
Appendix D.3 contains tabulated results of the calculated electric and magnetic fields for the
Project and information on generator dispatch. Appendix D.4 provides a review of relevant
scientific literature since June of 2011 that was prepared by CL&P’s consultant, Exponent, Inc.
I.1 ELECTRIC AND MAGNETIC FIELDS FROM POWER LINES AND OTHER SOURCES
Electricity used in homes and workplaces is transmitted over considerable distances from
generation sources to distribution systems. Electricity is transmitted as alternating current
(“AC”) to all homes and over electric lines delivering power to neighborhoods, factories, and
commercial establishments. The power provided by electric utilities in North America oscillates
60 times per second (i.e., at a frequency of 60 hertz (“Hz”)).
The Connecticut Light and Power Company
Page I-2 SRCP
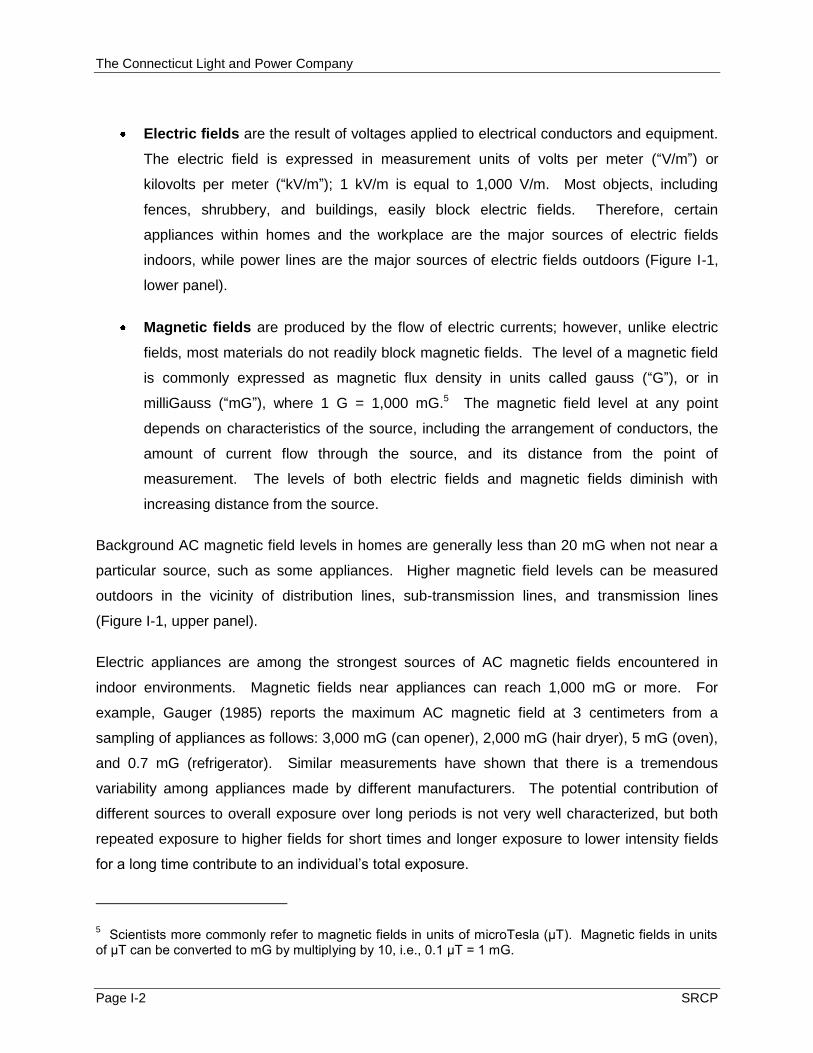
Electric fields are the result of voltages applied to electrical conductors and equipment.
The electric field is expressed in measurement units of volts per meter (“V/m”) or
kilovolts per meter (“kV/m”); 1 kV/m is equal to 1,000 V/m. Most objects, including
fences, shrubbery, and buildings, easily block electric fields. Therefore, certain
appliances within homes and the workplace are the major sources of electric fields
indoors, while power lines are the major sources of electric fields outdoors (Figure I-1,
lower panel).
Magnetic fields are produced by the flow of electric currents; however, unlike electric
fields, most materials do not readily block magnetic fields. The level of a magnetic field
is commonly expressed as magnetic flux density in units called gauss (“G”), or in
milliGauss (“mG”), where 1 G = 1,000 mG.5 The magnetic field level at any point
depends on characteristics of the source, including the arrangement of conductors, the
amount of current flow through the source, and its distance from the point of
measurement. The levels of both electric fields and magnetic fields diminish with
increasing distance from the source.
Background AC magnetic field levels in homes are generally less than 20 mG when not near a
particular source, such as some appliances. Higher magnetic field levels can be measured
outdoors in the vicinity of distribution lines, sub-transmission lines, and transmission lines
(Figure I-1, upper panel).
Electric appliances are among the strongest sources of AC magnetic fields encountered in
indoor environments. Magnetic fields near appliances can reach 1,000 mG or more. For
example, Gauger (1985) reports the maximum AC magnetic field at 3 centimeters from a
sampling of appliances as follows: 3,000 mG (can opener), 2,000 mG (hair dryer), 5 mG (oven),
and 0.7 mG (refrigerator). Similar measurements have shown that there is a tremendous
variability among appliances made by different manufacturers. The potential contribution of
different sources to overall exposure over long periods is not very well characterized, but both
repeated exposure to higher fields for short times and longer exposure to lower intensity fields
for a long time contribute to an individual’s total exposure.
5 Scientists more commonly refer to magnetic fields in units of microTesla (μT). Magnetic fields in units
of μT can be converted to mG by multiplying by 10, i.e., 0.1 μT = 1 mG.

The Connecticut Light and Power Company
SRCP Page I-3
Considering EMF from a perspective of specific sources or environments, as illustrated in Figure
I-1, does not fully reflect the variations in an individual’s personal exposure as encountered in
everyday life. To illustrate this, magnetic field measurements were recorded, over a two-hour
period, by a meter worn at the waist of an individual who conducted a range of typical daily
activities in a Connecticut town.
Figure I-1. Electric and Magnetic Fields in the Environment

The Connecticut Light and Power Company
Page I-4 SRCP
As illustrated in Figure I-2, these activities included a visit to the post office and the library,
walking along the street, getting ice cream, browsing in a bicycle shop, stopping in a chocolate
shop, going to the bank/ATM, driving along streets, shopping in a supermarket, stopping for
gas, and purchasing food at a fast food restaurant.
Figure I-2. Typical Magnetic Field Exposures in a Connecticut Town (Bethel)
During the course of the two hours, a maximum magnetic field of 97.55 mG was measured in
the supermarket (Table I-1). As Figure I-2 shows, from moment-to-moment in everyday life,
magnetic fields are encountered that vary in intensity over a wide range. Other patterns of
exposure to magnetic fields could well be very different. For example, a rider on commuter or
long-distance electric trains in Connecticut would encounter higher average power-frequency
magnetic fields of perhaps 14 to 50 mG during a trip, with peak values in the range of 100 to
400 mG (DOT/FRA, 2006).
The Connecticut Light and Power Company
SRCP Page I-5
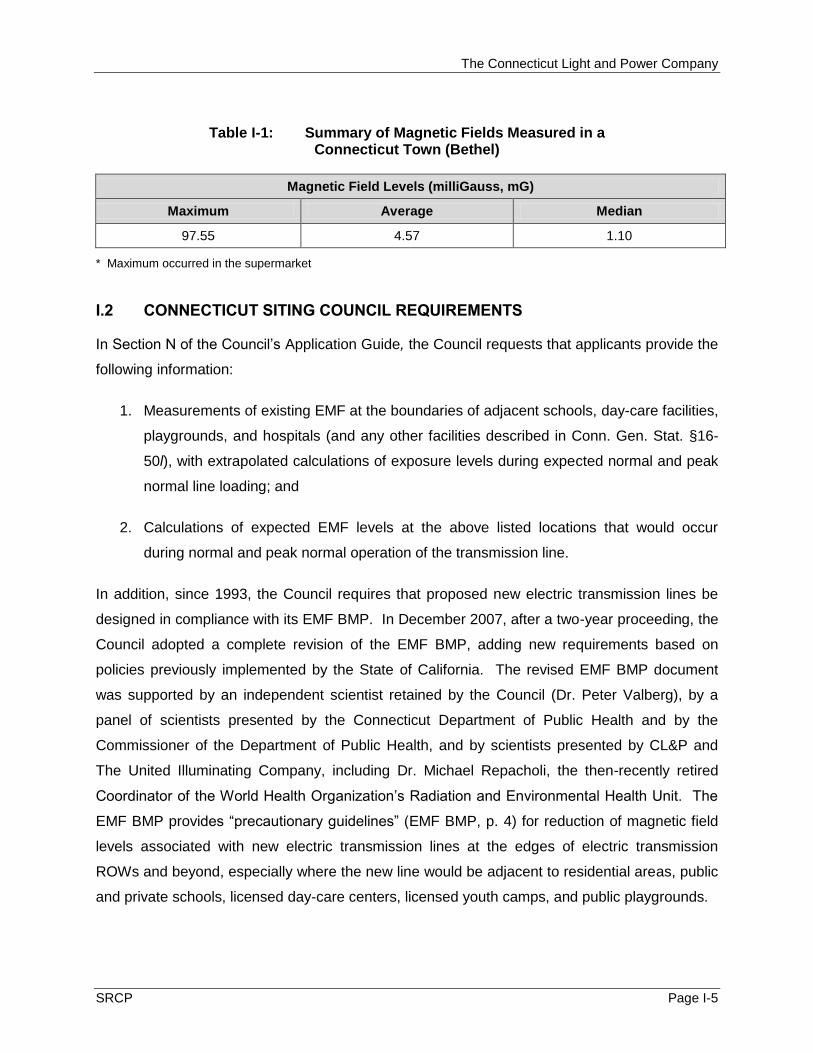
Table I-1: Summary of Magnetic Fields Measured in a Connecticut Town (Bethel)
Magnetic Field Levels (milliGauss, mG)
Maximum Average Median
97.55 4.57 1.10
* Maximum occurred in the supermarket
I.2 CONNECTICUT SITING COUNCIL REQUIREMENTS
In Section N of the Council’s Application Guide, the Council requests that applicants provide the
following information:
1. Measurements of existing EMF at the boundaries of adjacent schools, day-care facilities,
playgrounds, and hospitals (and any other facilities described in Conn. Gen. Stat. §16-
50l), with extrapolated calculations of exposure levels during expected normal and peak
normal line loading; and
2. Calculations of expected EMF levels at the above listed locations that would occur
during normal and peak normal operation of the transmission line.
In addition, since 1993, the Council requires that proposed new electric transmission lines be
designed in compliance with its EMF BMP. In December 2007, after a two-year proceeding, the
Council adopted a complete revision of the EMF BMP, adding new requirements based on
policies previously implemented by the State of California. The revised EMF BMP document
was supported by an independent scientist retained by the Council (Dr. Peter Valberg), by a
panel of scientists presented by the Connecticut Department of Public Health and by the
Commissioner of the Department of Public Health, and by scientists presented by CL&P and
The United Illuminating Company, including Dr. Michael Repacholi, the then-recently retired
Coordinator of the World Health Organization’s Radiation and Environmental Health Unit. The
EMF BMP provides “precautionary guidelines” (EMF BMP, p. 4) for reduction of magnetic field
levels associated with new electric transmission lines at the edges of electric transmission
ROWs and beyond, especially where the new line would be adjacent to residential areas, public
and private schools, licensed day-care centers, licensed youth camps, and public playgrounds.

The Connecticut Light and Power Company
Page I-6 SRCP
In adopting the EMF BMP, the Council recognized “the weight of scientific evidence indicates
that exposure to electric fields, beyond levels traditionally established for safety, does not cause
adverse health effects” and that scientific literature “reflects the lack of credible scientific
evidence for a causal relationship between “MF” (magnetic field) exposure and adverse health
effects” (EMF BMP, pp. 2-3). Still, as part of its statutory duties, including its duty under Conn.
Gen. Stat. §16-50j et seq. to address public health and safety, the Council follows procedures to
ensure a proposed transmission line would not pose an undue safety or health hazard to
persons or property. These procedures and the EMF BMP require that an applicant for
approval of an electric transmission line provide:
1. Measurements and Calculations. An assessment of the effects of any
electromagnetic fields produced by the proposed transmission lines (Conn. Gen. Stat.
§16-50l(a)(1)(A)) including a proposed line adjacent to “residential areas, private or
public schools, licensed child day-care facilities, licensed youth camps, and public
playgrounds,” (EMF BMP, p. 4) and “electromagnetic field effects on public health and
safety” (Conn. Gen. Stat. §16-50 p(a)(3)(B)). This is to be met by taking
measurements of existing electric and magnetic fields at the boundaries adjacent to
the above facilities, with extrapolated calculations of exposure levels during expected
normal and peak normal line loading. In particular, “an applicant shall provide design
alternatives and calculations of MF for pre-project and post-project conditions under 1)
peak load conditions at the time of the application filing, and 2) projected seasonal
maximum 24-hour average current load on the line anticipated within 5 years after the
line is placed into operation” (EMF BMP, p. 7).
2. Field Management Design Plan. The Council expects applicants will propose no-
cost/low-cost measures to reduce the magnetic fields by one or more engineering
controls via a FMDP. The Plan should depict “the proposed transmission line project
designed according to standard good utility practice and incorporate no-cost MF
mitigation design features. The Applicant shall then modify the base design by adding
low-cost MF mitigation design features specifically where portions of the project are
adjacent to residential areas, public or private schools, licensed child day-care
facilities, licensed youth camps or public playgrounds” (EMF BMP, p. 4).

The Connecticut Light and Power Company
SRCP Page I-7
3. Updates on Research. The Council will “consider and review evidence of any new
developments in scientific research addressing MF and public health effects or
changes in scientific consensus group positions regarding MF” (EMF BMP, p. 5).
4. Statement of Compliance. A statement describing the consistency of the proposed
mitigation design with the EMF BMP (p. 6, 8), and buffer zone requirements (Conn.
Gen. Stat. §16-50p(a)(3)(D)).
I.2.1 Statement of Compliance with the BMP and Buffer Zone Requirements
Section I.3 provides measurements and calculations, developed pursuant to the Council’s
Application Guide and the EMF BMP, for the proposed transmission line. These measurements
and calculations also account for existing overhead transmission lines that are nearby to the
route of the proposed line.
The FMDP for the proposed transmission line improvements, based in part on these
calculations is included in Appendix D.2. In compliance with the EMF BMP, the FMDP begins
with the “base” design of the proposed new transmission line incorporating standard utility
practice with only “no-cost” magnetic field management features. The FMDP then examines
modified line designs incorporating “low-cost” magnetic field management features for a “focus
area” of the project (along Lincoln Avenue and Culloden Road in the vicinity of the Glenbrook
Substation) where the proposed transmission line could be considered by the Council to be
adjacent to a residential area. After examining potential “BMP” designs to reduce magnetic field
levels at nearby facilities, compared to those associated with the base line design, the FMDP
recommends one BMP design for the focus area as best fitting the Council’s guidelines.
I.3 EMF MEASUREMENTS AND CALCULATIONS
The major sources of EMF associated with the Project are the proposed underground line and
existing overhead transmission lines on an existing ROW nearby. Transformers and other
equipment within the South End and Glenbrook Substations are also potential EMF sources, but
would cause little or no exposure to the general public. The strength of fields from equipment
inside a typical substation decreases rapidly with distance, reaching very low levels at relatively
short distances beyond substation perimeter fences. EMF levels from substations “attenuate
sharply with distance and will often be reduced to a general ambient level at the substation

The Connecticut Light and Power Company
Page I-8 SRCP
property lines. The exception is where transmission and distribution lines enter the substation”
(IEEE Std. 1127-1998). Because the fields outside the perimeter fence of a substation are
highest directly above or below where transmission and distribution lines enter and leave the
substation, measuring and calculating the EMF levels associated with transmission lines
effectively addresses potential EMF exposures close to substations.
I.3.1 Field Measurements of EMF from Existing Sources
CL&P took spot measurements of existing electric and magnetic fields at selected locations
along the Preferred Route. Continuous magnetic field measurements were also taken walking
along the path of the proposed transmission line. See Figures I-3 through I-7 for depictions of
these measurements. The measurements were taken at a height of 1 meter (3.28 feet) above
ground, in accordance with the industry standard protocol for taking measurements of EMF near
power lines (IEEE Std. 644-1994, R2008). The meters were calibrated on October 26, 2012.
The electric field was measured in units of kV/m with a single-axis field sensor and meter
(Electric Field Measurements, Inc.) The magnetic field was measured in units of mG using a
meter with sensing coils for three axes (EMDEX II). These instruments meet the IEEE
instrumentation standard for obtaining valid and accurate field measurements at power-line
frequencies (IEEE Std. 1308-1994, R2001, R2010). The meters were calibrated on October 26,
2011 by the manufacturers by methods like those described in IEEE Std. 644-1994, R2008.
Measurements of the magnetic field present a “snapshot” of the conditions at a point in time.
Within a day, and over the course of days, months, and even seasons, magnetic field levels
change at any given location, depending on the amount and the patterns of power supply and
demand within the state and surrounding region. In contrast, the electric field is quite stable
over time.
I.3.1.1 Electric and Magnetic Field Measurements across Lincoln Avenue
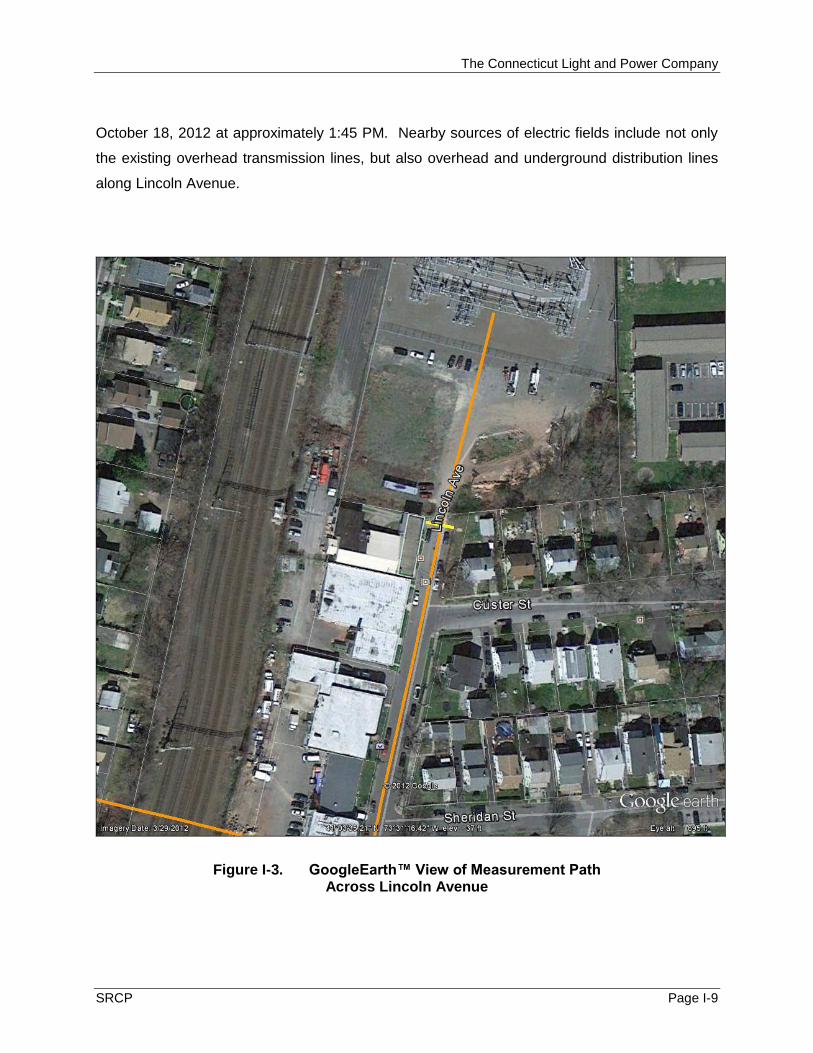
Measurements of electric and magnetic fields were taken on a horizontal transect of the
Preferred Route on Lincoln Avenue in the vicinity of Glenbrook Substation. A depiction of the
measurement area is shown in Figure I-3 below. The orange line represents the Preferred
Route. The yellow line represents the measurement path. Tabulated results of the
measurements are provided in Table I-2 and Figure I-4. These measurements were taken on
The Connecticut Light and Power Company
SRCP Page I-9
October 18, 2012 at approximately 1:45 PM. Nearby sources of electric fields include not only
the existing overhead transmission lines, but also overhead and underground distribution lines
along Lincoln Avenue.
Figure I-3. GoogleEarth™ View of Measurement Path Across Lincoln Avenue
The Connecticut Light and Power Company
Page I-10 SRCP
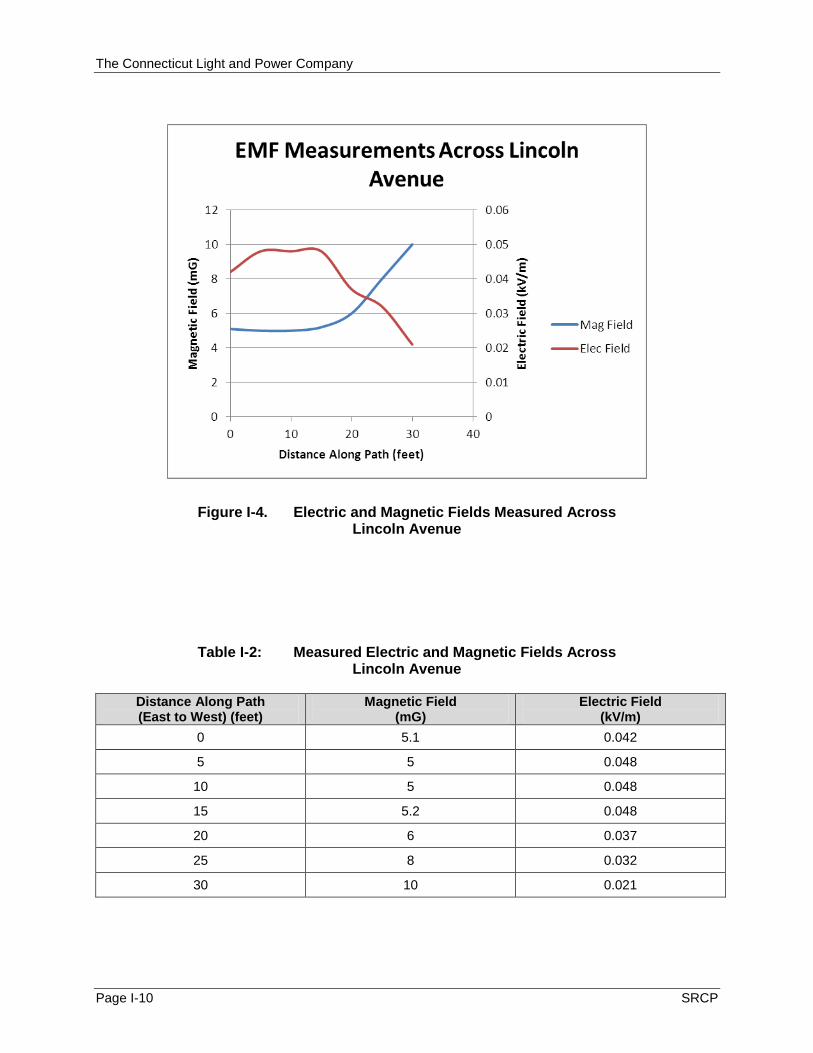
Figure I-4. Electric and Magnetic Fields Measured Across Lincoln Avenue
Table I-2: Measured Electric and Magnetic Fields Across Lincoln Avenue
Distance Along Path (East to West) (feet)
Magnetic Field (mG)
Electric Field (kV/m)
0 5.1 0.042
5 5 0.048
10 5 0.048
15 5.2 0.048
20 6 0.037
25 8 0.032
30 10 0.021
The Connecticut Light and Power Company
SRCP Page I-11
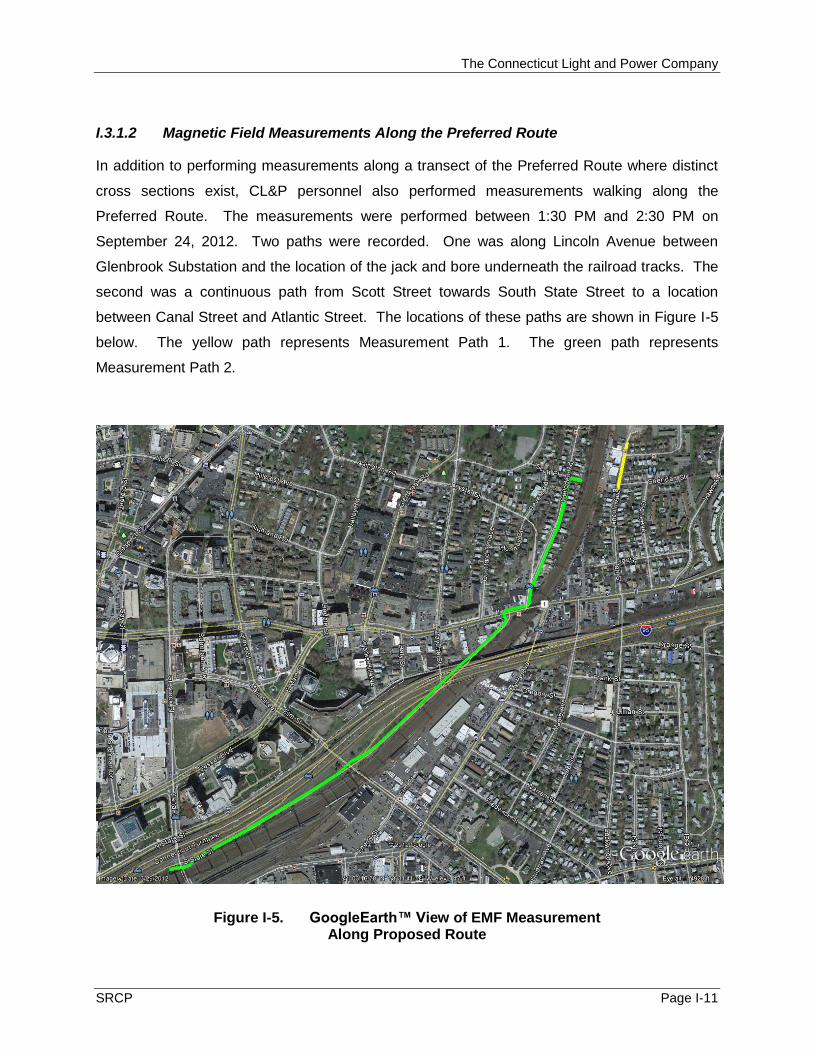
I.3.1.2 Magnetic Field Measurements Along the Preferred Route
In addition to performing measurements along a transect of the Preferred Route where distinct
cross sections exist, CL&P personnel also performed measurements walking along the
Preferred Route. The measurements were performed between 1:30 PM and 2:30 PM on
September 24, 2012. Two paths were recorded. One was along Lincoln Avenue between
Glenbrook Substation and the location of the jack and bore underneath the railroad tracks. The
second was a continuous path from Scott Street towards South State Street to a location
between Canal Street and Atlantic Street. The locations of these paths are shown in Figure I-5
below. The yellow path represents Measurement Path 1. The green path represents
Measurement Path 2.
Figure I-5. GoogleEarth™ View of EMF Measurement Along Proposed Route

The Connecticut Light and Power Company
Page I-12 SRCP
Figure I-6. MF Measurement Results Along Path 1
Table I-3: Path 1 MF Measurement Summary
MF Levels – Path 1 (milliGauss, mG)
Maximum Average Median
7.03 5.95 5.97

The Connecticut Light and Power Company
SRCP Page I-13
Figure I-7. MF Measurement Results Along Path 2
Table I-4: Path 2 MF Measurement Summary
MF Levels – Path 2 (milliGauss, mG)
Maximum Average Median
15.9 5.2 4.97

The Connecticut Light and Power Company
Page I-14 SRCP
I.3.2 Calculations of EMF from Transmission Lines
CL&P calculated pre- and post-construction electric and magnetic field levels using methods
described in the Electric Power Research Institute’s AC Transmission Line Reference Book –
200-kV and Above, Third Edition and Underground Transmission Systems Reference Book.
With accurate input data, the equations in these references will accurately predict electric and
magnetic fields measured near power lines. The inputs to the calculation are data regarding
voltage, current flow, circuit phasing, sheath and wire bonding, conductor and cable sizes and
locations. The fields associated with power lines were estimated along profiles drawn
perpendicular to the lines assuming flat terrain, at a point of lowest conductor sag for overhead
transmission lines (30 feet for lowest conductor of an overhead 115-kV line and at a point of
shallowest depth for the underground transmission line (45 inches for the uppermost power
cable). All calculations were made for a height of 1 meter (3.28 feet) above ground, in
accordance with standard practice (IEEE Std., 644-1994, R2008).
Because most of the Preferred Route is parallel to overhead transmission lines along the
railroad, it was necessary to calculate the fields to account for the interactions between the
proposed underground transmission line and the existing overhead transmission lines. Three
distinct calculation sections were developed to account for the location of the existing overhead
transmission lines relative to the proposed underground transmission line.
A calculation of magnetic fields first requires determining the currents that will flow on the
affected lines under each set of conditions to be studied. For the Southwest Connecticut
transmission system, these currents are determined by modeling the transmission system with a
specific system load level, generation dispatch, and direction/magnitude of power transfers in or
out of Connecticut. Each condition to be studied is selected in a conservative way so as to lead
to calculation results that would likely be higher than actual magnetic field values under the
assumed loading condition. CL&P calculated magnetic fields for existing lines under pre-Project
conditions in 2014 and for the proposed and existing lines under post-Project conditions in 2019
for three system loading conditions, Annual Peak Load (“APL”), Peak-Day Average Load
(“PDAL”), and Annual Average Load (“AAL”). The calculations for Average Annual Load are the
most useful for comparing before and after field levels for any ‘typical’ day, so these results are
presented below in profiles and tables. Additionally, magnetic field levels at the edges of the

The Connecticut Light and Power Company
SRCP Page I-15
ROWs and at 25-foot intervals are also presented for the base design and alternative designs at
AAL, APL and PDAL, together with associated electric field levels, in Appendix D.3.
I.3.2.1 System Load and Generator Dispatch
Per the EMF BMP, CL&P analyzed the system under varying load conditions with reasonably
appropriate generator dispatches. All transmission lines were assumed in service. Only
transmission projects with PPA approval in accordance with Section I.3.9 of the Tariff, as of the
April 2012 RSP Project Listing, were included in the study base case. There are no system
topology changes that are relevant to this study area when considering the 2019 system model.
Loads assumed on the transmission system for New England are summarized in Table I-5
below. Generator dispatch is summarized in Table I-6 below. To yield conservatively high
results for projected magnetic fields, these generator dispatches included turning off all
generators at Cos Cob and Waterside Power.
Table I-5: New England System Loads
Load Case Description 2014 Load
(MW) 2019 Load
(MW)
Annual Peak Load (APL) 90/10 Summer Peak ISO-NE L+L 31250 33335
Peak Day Average Load (PDAL) 85% of 90/10 Peak 26563 28335
Average Annual Load (AAL) Annual Hourly Average 15000 15000

The Connecticut Light and Power Company
Page I-16 SRCP
Table I-6: Connecticut Generator Output
Generator 2014 Generator Output (MW) 2019 Generator Output (MW)
AAL PDAL APL AAL PDAL APL
Norwalk Harbor 1 164 164 164 164 164 164
Norwalk Harbor 2 172 172 172 172 172 172
Norwalk Harbor 10 Off Off Off Off Off Off
Bridgeport Energy 10 180 180 180 180 180 180
Bridgeport Energy 11 90 90 90 90 90 90
Bridgeport Energy 12 170 170 170 170 170 170
Bridgeport Harbor 2 Off Off Off Off Off Off
Bridgeport Harbor 3 375 375 375 375 375 375
Bridgeport Resco 57 57 57 57 57 57
Cos Cob 10 Off Off Off Off Off Off
Cos Cob 11 Off Off Off Off Off Off
Cos Cob 12 Off Off Off Off Off Off
Cos Cob 13 Off Off Off Off Off Off
Cos Cob 14 Off Off Off Off Off Off
Waterside Power 1 Off Off Off Off Off Off
Waterside Power 2 Off Off Off Off Off Off
Waterside Power 3 Off Off Off Off Off Off
The Connecticut Light and Power Company
SRCP Page I-17
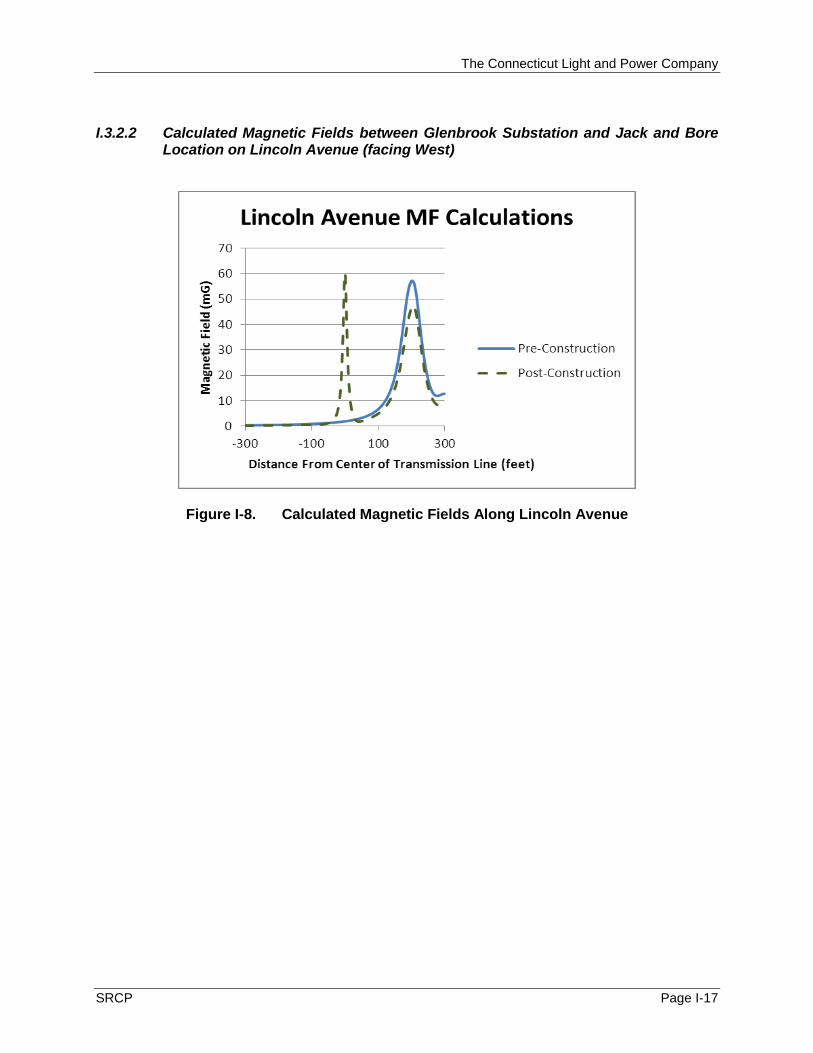
I.3.2.2 Calculated Magnetic Fields between Glenbrook Substation and Jack and Bore Location on Lincoln Avenue (facing West)
Figure I-8. Calculated Magnetic Fields Along Lincoln Avenue
The Connecticut Light and Power Company
Page I-18 SRCP
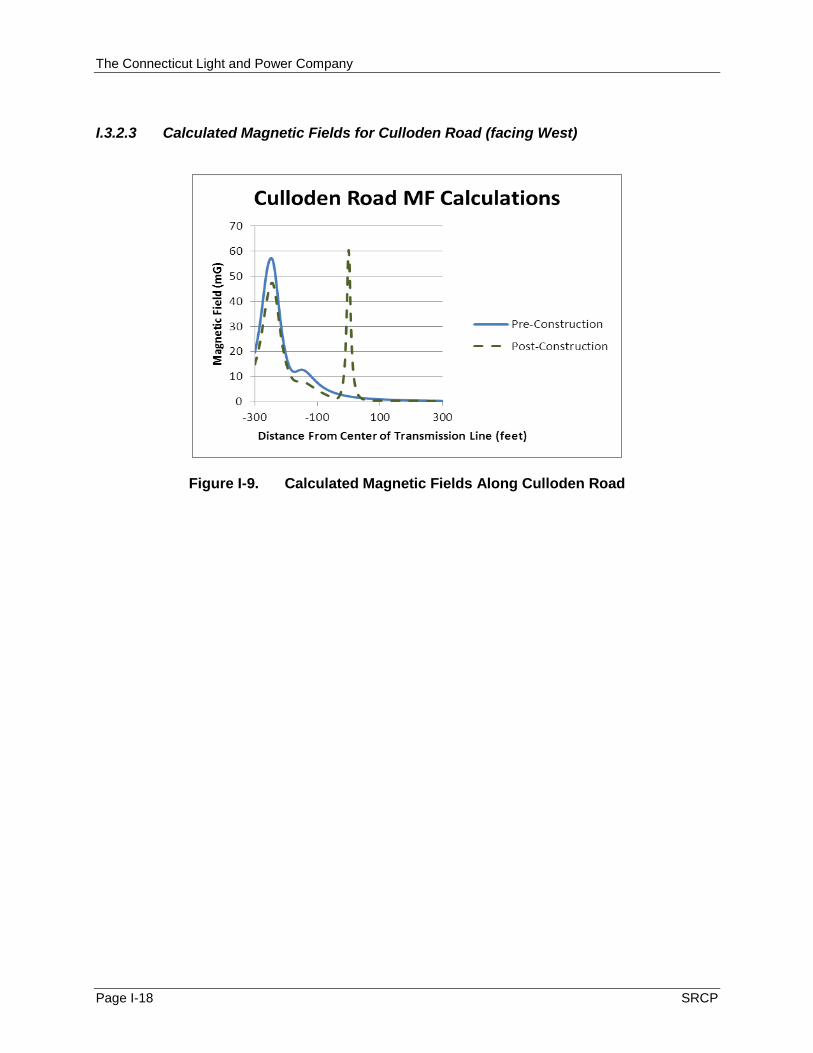
I.3.2.3 Calculated Magnetic Fields for Culloden Road (facing West)
Figure I-9. Calculated Magnetic Fields Along Culloden Road
The Connecticut Light and Power Company
SRCP Page I-19
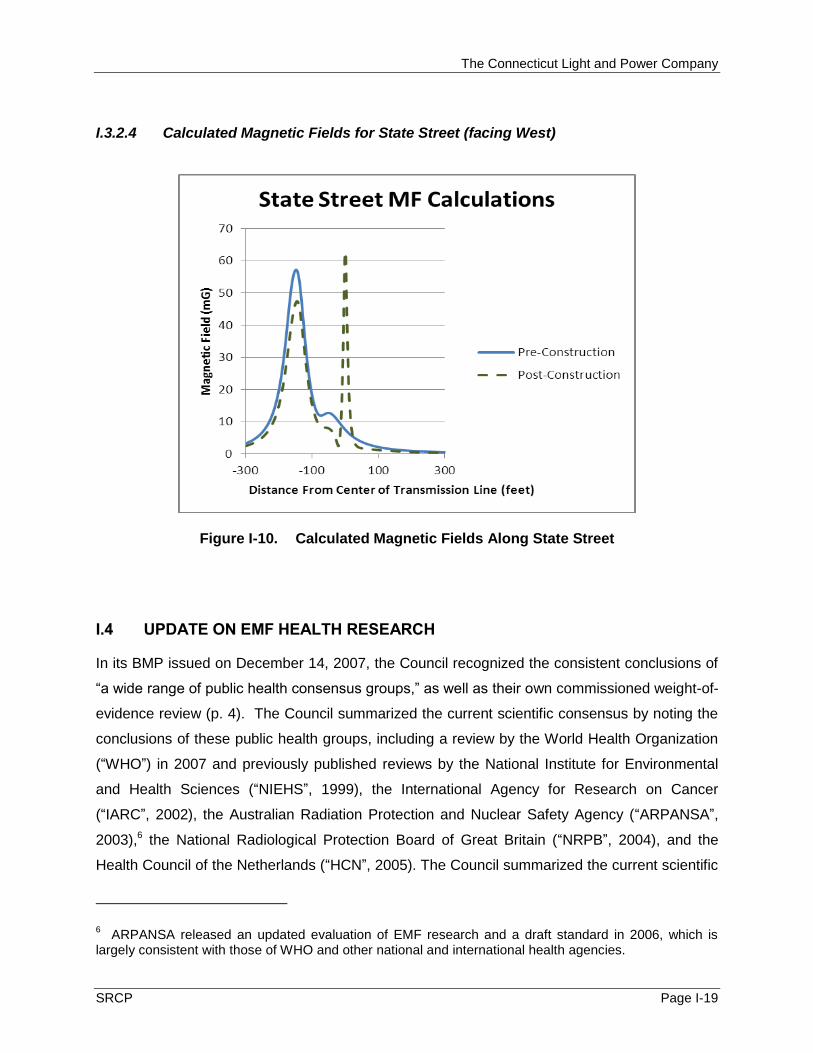
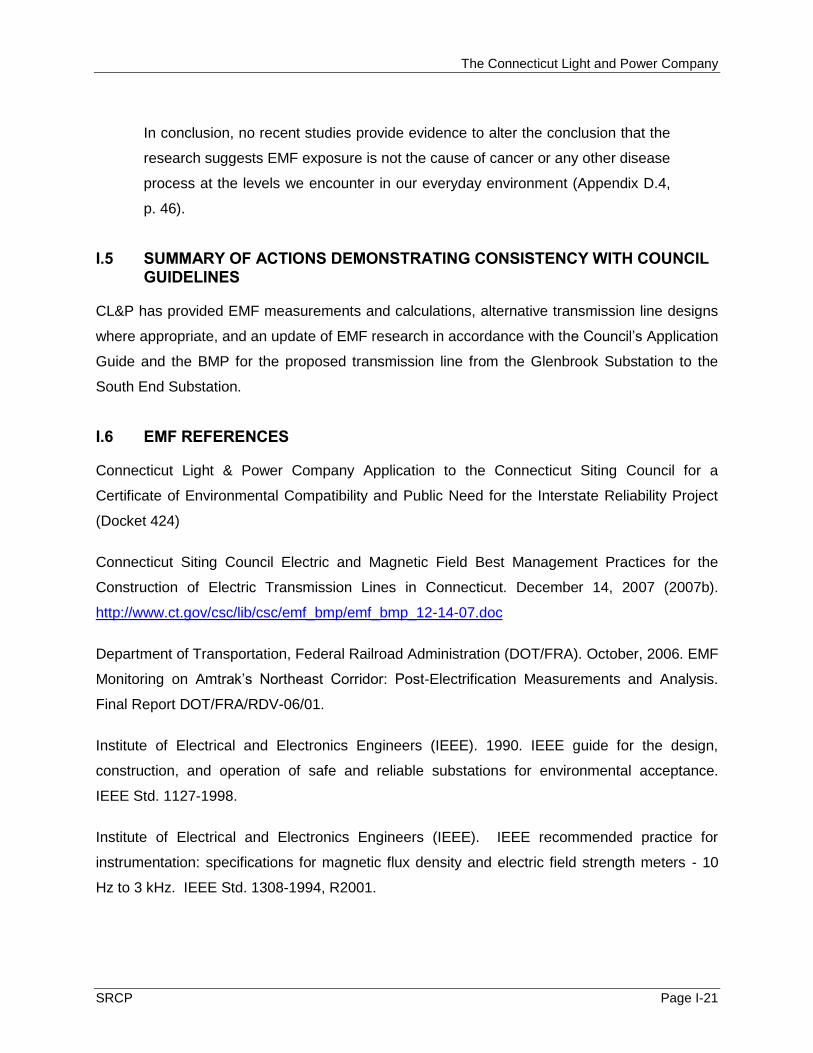
I.3.2.4 Calculated Magnetic Fields for State Street (facing West)
Figure I-10. Calculated Magnetic Fields Along State Street
I.4 UPDATE ON EMF HEALTH RESEARCH
In its BMP issued on December 14, 2007, the Council recognized the consistent conclusions of
“a wide range of public health consensus groups,” as well as their own commissioned weight-of-
evidence review (p. 4). The Council summarized the current scientific consensus by noting the
conclusions of these public health groups, including a review by the World Health Organization
(“WHO”) in 2007 and previously published reviews by the National Institute for Environmental
and Health Sciences (“NIEHS”, 1999), the International Agency for Research on Cancer
(“IARC”, 2002), the Australian Radiation Protection and Nuclear Safety Agency (“ARPANSA”,
2003),6 the National Radiological Protection Board of Great Britain (“NRPB”, 2004), and the
Health Council of the Netherlands (“HCN”, 2005). The Council summarized the current scientific
6 ARPANSA released an updated evaluation of EMF research and a draft standard in 2006, which is
largely consistent with those of WHO and other national and international health agencies.

The Connecticut Light and Power Company
Page I-20 SRCP
consensus as follows: there is limited evidence from epidemiology studies of a statistical
association between estimated, average exposures greater than 3-4 mG and childhood
leukemia; the cumulative research, however, does not indicate that magnetic fields are a cause
of childhood leukemia, as animal and other experimental studies do not suggest that magnetic
fields are carcinogenic. The Council also noted the WHO’s conclusion with respect to other
diseases: “the scientific evidence supporting an association between ELF magnetic field
exposure and all of these health effects is much weaker than for childhood leukemia” (EMF
BMP, pp. 2-3).
Based on this scientific consensus, the Council concluded that precautionary measures for the
siting of new transmission lines include “the use of effective no-cost and low-cost technologies
and management techniques on a project-specific basis to reduce MF exposure to the public
while allowing for the development of efficient and cost-effective electrical transmission projects”
(p. 4). The EMF BMP also stated that the Council will “consider and review evidence of any
new developments in scientific research addressing MF and public health effects or changes in
scientific consensus group positions regarding MF” (p. 5).
Accordingly, in its March 16, 2010 decision approving the Greater Springfield Reliability Project,
the Siting Council evaluated extensive evidence concerning recent developments in EMF health
effects research, including commentary from the CT DEEP’s Radiation Division, and concluded
that: “There is no new evidence that might alter the scientific consensus articulated in the
Council’s 2007 EMF BMP document.” (Docket 370, Opinion at 12; and see Findings of Fact
par. 284-286)
To assist the Council in evaluating the most up-to-date research, CL&P commissioned William
H. Bailey, Ph.D. and colleagues at Exponent to provide a report that systematically evaluates
recent peer-reviewed research and reviews by scientific panels, specifically including any
published since those considered in the Council’s Docket 424 proceeding. Exponent’s report,
which is provided in Appendix D.4 includes a review of research and reviews published from
May 1, 2011 through July 31, 2012. These reports demonstrate that the conclusion reached by
the Council in the BMP Proceeding in 2007 and in Docket 370 in 2010 remains sound.
Significantly, Exponent’s report concludes:
The Connecticut Light and Power Company
SRCP Page I-21
In conclusion, no recent studies provide evidence to alter the conclusion that the
research suggests EMF exposure is not the cause of cancer or any other disease
process at the levels we encounter in our everyday environment (Appendix D.4,
p. 46).
I.5 SUMMARY OF ACTIONS DEMONSTRATING CONSISTENCY WITH COUNCIL GUIDELINES
CL&P has provided EMF measurements and calculations, alternative transmission line designs
where appropriate, and an update of EMF research in accordance with the Council’s Application
Guide and the BMP for the proposed transmission line from the Glenbrook Substation to the
South End Substation.
I.6 EMF REFERENCES
Connecticut Light & Power Company Application to the Connecticut Siting Council for a
Certificate of Environmental Compatibility and Public Need for the Interstate Reliability Project
(Docket 424)
Connecticut Siting Council Electric and Magnetic Field Best Management Practices for the
Construction of Electric Transmission Lines in Connecticut. December 14, 2007 (2007b).
http://www.ct.gov/csc/lib/csc/emf_bmp/emf_bmp_12-14-07.doc
Department of Transportation, Federal Railroad Administration (DOT/FRA). October, 2006. EMF
Monitoring on Amtrak’s Northeast Corridor: Post-Electrification Measurements and Analysis.
Final Report DOT/FRA/RDV-06/01.
Institute of Electrical and Electronics Engineers (IEEE). 1990. IEEE guide for the design,
construction, and operation of safe and reliable substations for environmental acceptance.
IEEE Std. 1127-1998.
Institute of Electrical and Electronics Engineers (IEEE). IEEE recommended practice for
instrumentation: specifications for magnetic flux density and electric field strength meters - 10
Hz to 3 kHz. IEEE Std. 1308-1994, R2001.

The Connecticut Light and Power Company
Page I-22 SRCP
Institute of Electrical and Electronics Engineers (IEEE). IEEE standard procedures for
measurement of power frequency electric and magnetic fields from AC power lines (Revision of
IEEE Std. 644- 1987) IEEE Standard 644-1994, R2008.
Regulations of Connecticut State Agencies, §16-50j-59(18)
Savitz DA, Pearce NE, Poole C. Methodological issues in the epidemiology of electromagnetic
fields and cancer. Epidemiology Rev, 11:59-78, 1989.