The Conceptual Design of an Electric Sail Technology ...
49
The Conceptual Design of an Electric Sail Technology Demonstration Mission Spacecraft Presentation at: 40 th Annual AAS Guidance and Control Conference Breckenridge, CO, USA February 3-8, 2017 Bruce M. Wiegmann NASA-MSFC-ED04 [email protected]
Transcript of The Conceptual Design of an Electric Sail Technology ...

The Conceptual Design of an
Electric Sail Technology
Demonstration Mission Spacecraft
Presentation at:
40th Annual AAS Guidance and Control
ConferenceBreckenridge, CO, USA
February 3-8, 2017
Bruce M. Wiegmann
NASA-MSFC-ED04

National Aeronautics and Space Administration 2
Presentation Agenda
• HERTS/Electric Sail background information
• Findings from the Phase I NIAC• This propulsion technology enables trip times to the Heliopause
in 10 – 12 years
• Fastest transportation method to reach Heliopause of near term propulsion technologies
Image shown is copyright by: Alexandre Szames, Antigravite, Paris, and is used with permission
• Current Phase II NIAC tasks• Plasma chamber testing
• Particle-in-cell (PIC) space plasma to spacecraft modeling
• Tether material investigation
• Conceptual design of a TDM spacecraft
• Mission capture
National Aeronautics and Space Administration 3
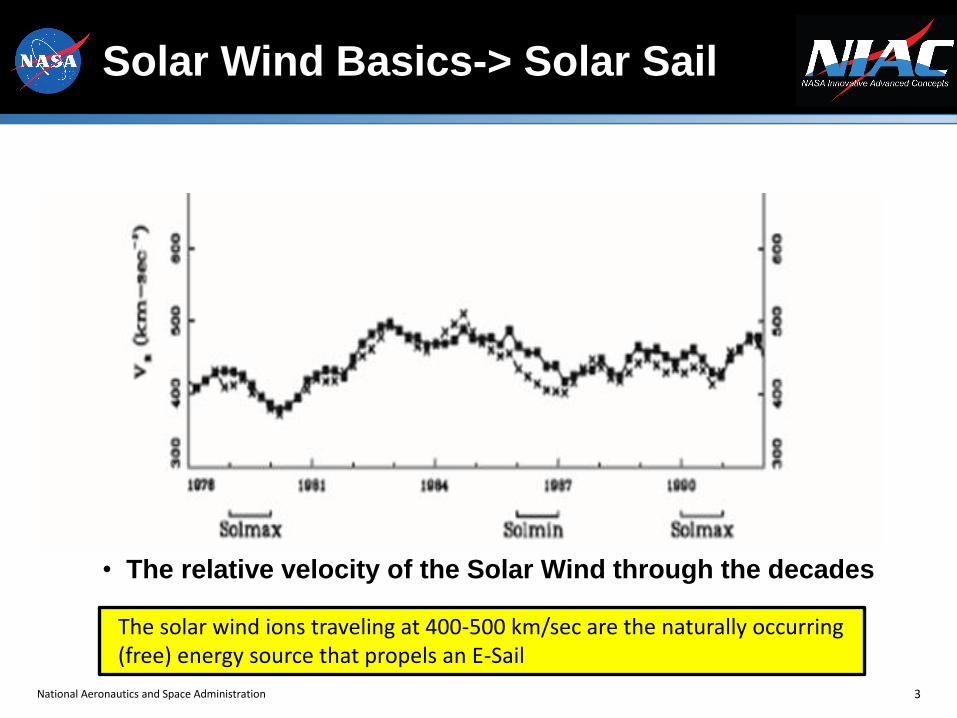
Solar Wind Basics-> Solar Sail
• The relative velocity of the Solar Wind through the decades
The solar wind ions traveling at 400-500 km/sec are the naturally occurring (free) energy source that propels an E-Sail

Electric Sail Origins
The electric solar wind sail, or electric sail for short, is a propulsion invention made in 2006 at the Kumpula Space Centre by Dr. Pekka Janhunen.
Image courtesy of:
Dr. Pekka Janhunen

National Aeronautics and Space Administration 5
Phase I Findings
• Electric-Sail propulsion systems are the fastest method to get spacecraft to deep space destinations as compared to:
• Solar sails,
• All chemical propulsions,
• Electric (ion) propulsion systems
• Technology appears to be viable .
• Technology Assessment – Most subsystems at high state of readiness except:
• Wire-plasma interaction modeling,
• Wire deployment, and
• Dynamic control of E–Sail spacecraft…
• These are the three areas of focus for the current Phase II NIAC

Electric Sail – Concept of Operations
• The E-sail consists of 10 to 20 conducting, positively charged, bare wires, each 1–20 km in length.
• Wires are deployed from the main spacecraft bus and the spacecraft rotates to keep wires taut.
• An electron gun is used to keep the spacecraft and wires in a high positive potential (~6 t0 20 kV).
• Positive ions in the solar wind are repulsed by the field and thrust is generated.

Electric Sail – By The NumbersAn Example
• 10 – 20 wires
• 5 - 20 km long
• 25 microns thick
• Wires kept at ~6 kV potential
• The electric field surrounding each wire extends ~ 10 meters into the surrounding plasma and gradually expands as the distance from the sun increases.
• Produces ~1 mm/s2
acceleration at 1 AU

National Aeronautics and Space Administration 8
Why An Electric Sail?
• Has the potential to fly payloads out of the ecliptic and into non-Keplerian orbits, place payloads in a retrograde solar orbit, missions to terrestrial planets and asteroids, and position instruments for off-Lagrange point space weather observation.
• Low mass/ low cost propulsion system
• Electric sail acceleration extends deep into the solar system (6 times further than a solar sail)
• Propulsion system is scalable to small spacecraft
• Readily meets the requirements for relatively near-term interstellar precursor missions out to 500 AU

National Aeronautics and Space Administration 9
• Thrust drops as 1/r2 for the solar sail and 1/r7/6 for the electric sail
Velocity vs. Radial Distance Comparison for Equal Mass Spacecraft
• The solar sail system velocity is limited to 1.5 AU/year since the system stops accelerating at distance of 5 AU: whereas,
• The E-Sail accelerates to 15.8 AU, thereby creating a velocity of 8.3 AU/year

National Aeronautics and Space Administration 10
Normalized Thrust Decay Comparison
The AU distance where the thrust generated by each system = 0.04 * Thrust (1AU)
is 5AU for the solar sail system and 15.8 AU for the E-Sail system
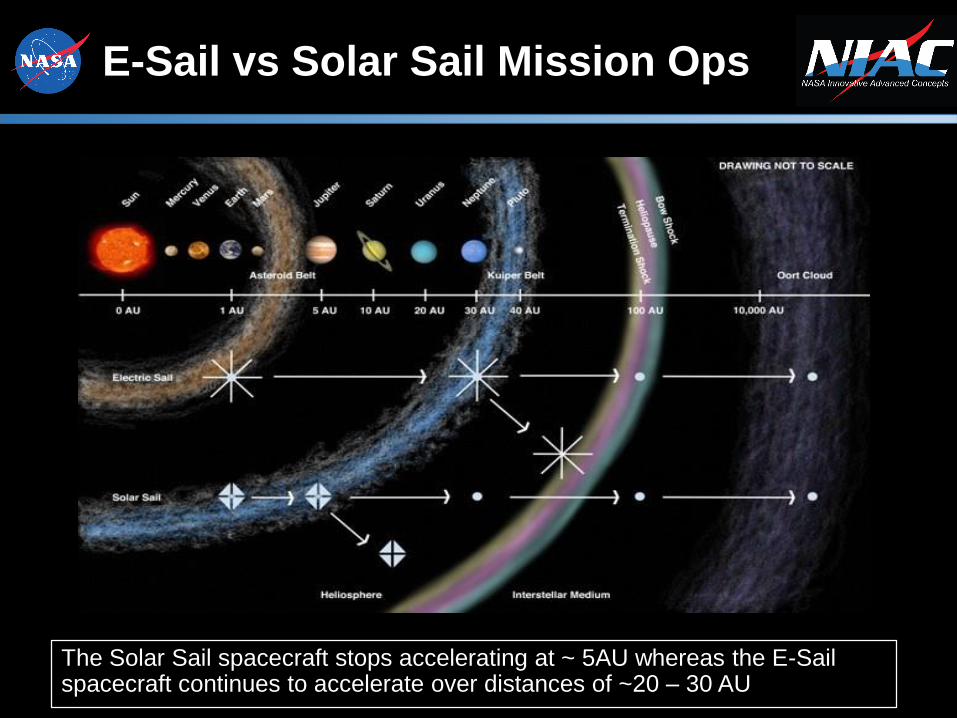
E-Sail vs Solar Sail Mission Ops
The Solar Sail spacecraft stops accelerating at ~ 5AU whereas the E-Sail spacecraft continues to accelerate over distances of ~20 – 30 AU

National Aeronautics and Space Administration 12
Velocity Comparison Between E-Sail and Solar Sail Propulsion Systems
• E-sail velocities are 25% greater than solar sail option because of the rate of acceleration decline (1/r7/6) vs solar sail acceleration decline (1/r2)
• E-Sail and Solar Sail propulsion options exceed the 2012 Heliophysics Decadal Survey speed goal of 3.8 AU/yr

In-Space Propulsion Options Compared for a Heliopause Mission
• High-thrust propulsion option (All chem)• 1 to 2 solid rocket motors (SRM) in SLS
stack
• Low-thrust propulsion options:• MaSMi Hall thruster
• 50,000 hr. life
• Solar sail• @ 10 g/m2; Characteristic Acceleration =
0.43 mm/sec2 (Near-Term technology)• @ 3 g/m2; Characteristic Acceleration = 0.66
mm/sec2 (Enhanced technology)
• Electric sail• Characteristic Acceleration = 2mm/sec2• Characteristic Acceleration = 1mm/sec2
SLS Block 1B with
EUS and 8.4m PLF
MaSMi Hall
thruster Solar sailElectric sail
Support Structure
Low-thrust Propulsion
Subsystems
High-thrust
Propulsion

National Aeronautics and Space Administration 14
Trip Time Comparison Between E-Sail and Solar Sail Propulsion Systems
Direct escape using SLS,
Jupiter Gravity Assist (JGA)
and onboard in-space
propulsion system.
Earth
V∞
Jupiter
The HERTS/E-Sail option dramatically reduces trip times by ~50% to 100 AU
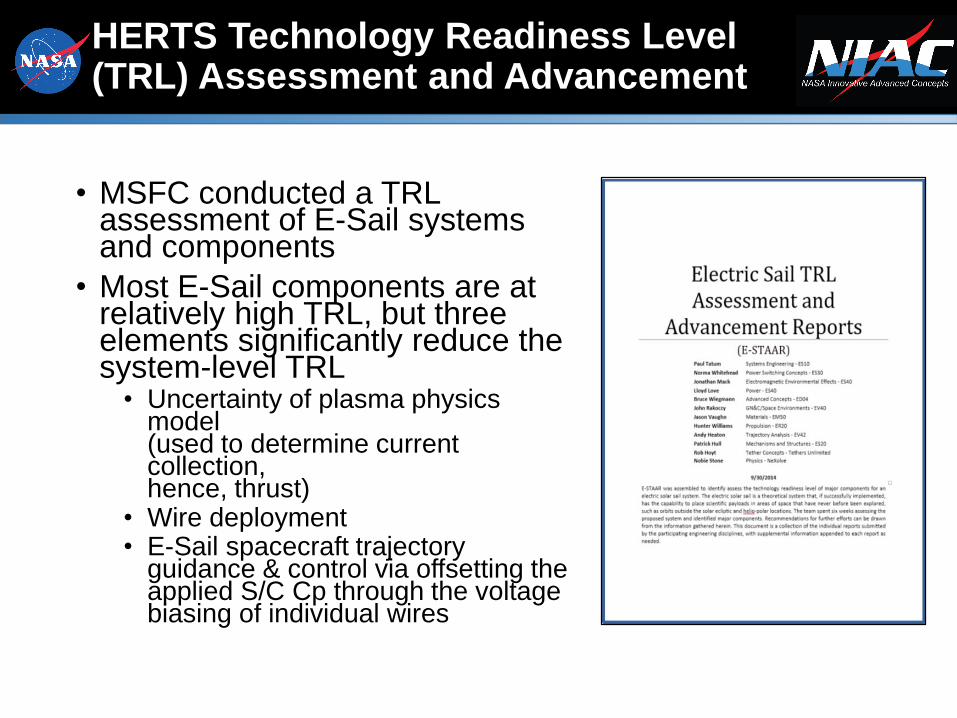
HERTS Technology Readiness Level (TRL) Assessment and Advancement
• MSFC conducted a TRL assessment of E-Sail systems and components
• Most E-Sail components are at relatively high TRL, but three elements significantly reduce the system-level TRL
• Uncertainty of plasma physics model (used to determine current collection, hence, thrust)
• Wire deployment• E-Sail spacecraft trajectory
guidance & control via offsetting the applied S/C Cp through the voltage biasing of individual wires

National Aeronautics and Space Administration 16
The Phase II HERTS Team
Tethers Unlimited Inc.
Bothell, WA
Dr. Rob Hoyt
Tether and Deployer Expertise
Jet Propulsion Laboratory
Pasadena, CA
Robert Shotwell
Trajectory Tool Development
NASA MSFC
Huntsville, AL
Bruce Wiegmann (PI)
Jason Vaughn
Dr. Ken Wright
Plasma Chamber Testing
ManTech NeXolve Corporation
Huntsville, AL
Dr. Nobie Stone
Space Plasma Physics Expertise
University of Alabama Huntsville
Huntsville, AL
Dr. Gary Zank
Plasma Physics Model Development
Bangham Engineering
Huntsville, AL
Michal Bangham
Spacecraft Integrated Design
University of Colorado - Boulder
Boulder, CO
Joanna Fulton
Tether Deployment Dynamics
University of Missouri
Columbia, MO
Dr. Craig Kluever
E-Sail Trajectory Analysis
Tennessee Tech University
Cookeville, TN
Dr. Stephen Canfield
Tether Deployment Dynamics
Finnish Meteorological Institute
Helsinki, Finland
Dr. Pekka Janhunen
E-Sail Expertise
Funded Team Members
Unfunded Collaborators
Future Partners
Naval Postgraduate School
Monterrey, CA
Dr. Rudy Panholzer/James Newman
Tether CubeSat Expertise
Naval Research Lab
Washington, DC
Dr. Shannon Coffey
Tether Deployment Dynamics

Animation of E-Sail vs Other Options

National Aeronautics and Space Administration 18
Major Thrusts of Phase II NIAC
• Develop a particle-in-cell (PIC) model of the space plasma dynamics and interaction with a spacecraft propelled by an electric sail
• The development of the model requires experimental data from ground tests (MSFC plasma chamber)
• Investigate tether material and deployment
• Perform a conceptual spacecraft study on a HERTS TDM spacecraft
• Investigate HERTS spacecraft navigation & control
• Enhance low thrust trajectory models (JPL)

Simulation of solar wind particles near a charged wire using the LANL VPIC code
Particle-in-Cell Modeling
x [km] x [km]
y[k
m]
Electron Density Ion Density
Tether
Solar Wind
Results to date comparable with published values from Dr. Pekka Janhunen.
Solar Wind

Plasma Chamber Testing
(Side View)
Charged ions (protons and electrons) flow from the ion source towards the end of the chamber. Electrons are collected onto the positively charged wire & the current is measured.Protons are deflected by the charged Debye sheath
Plasma chamber height (L)
1/3 L 1/3 L 1/3 L
Charged section
The middle third of the SS tube is positively charged and a sheath is created that deflects protons. Then measurements are made to determine degree of deflection of these protons
1.5
7 m
2.7
m
1.2 m
National Aeronautics and Space Administration 21
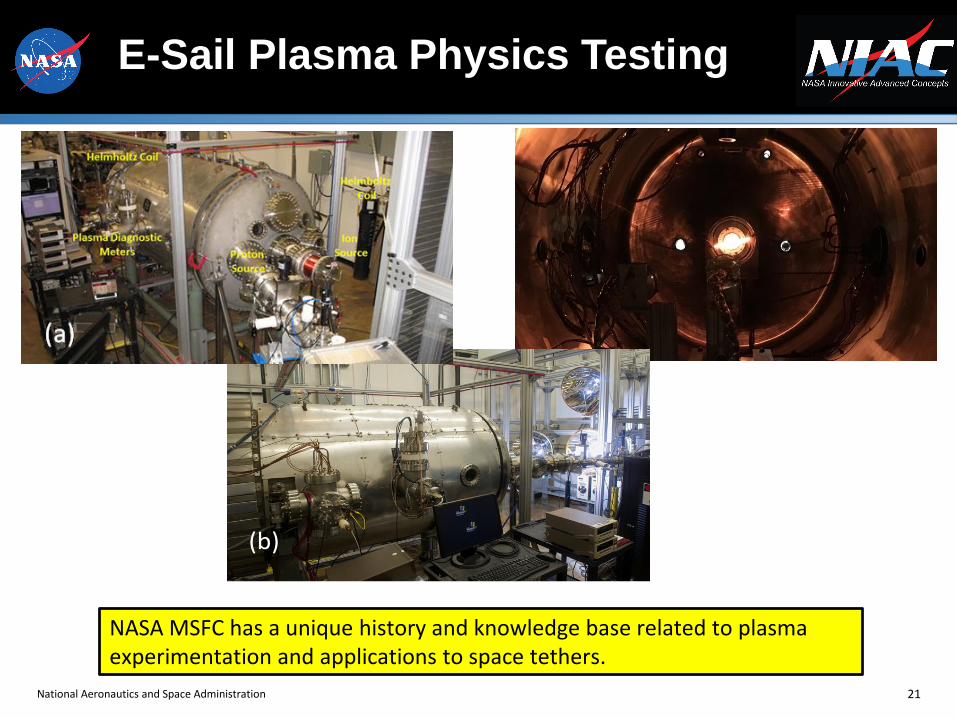
E-Sail Plasma Physics Testing
(a)
(b)
NASA MSFC has a unique history and knowledge base related to plasma experimentation and applications to space tethers.
National Aeronautics and Space Administration 22
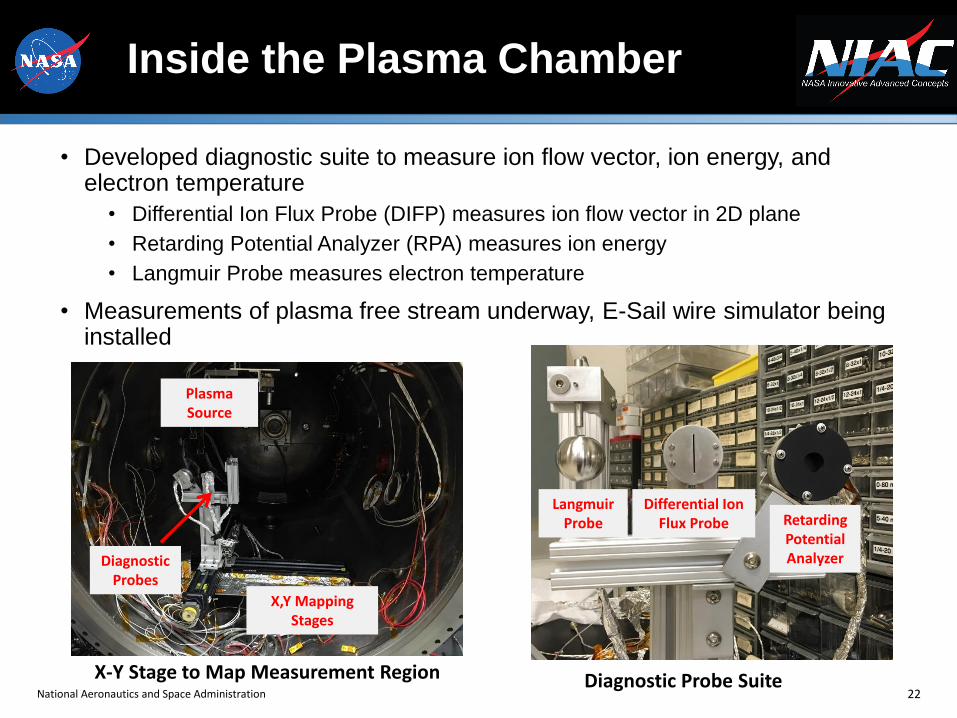
Inside the Plasma Chamber
• Developed diagnostic suite to measure ion flow vector, ion energy, and electron temperature
• Differential Ion Flux Probe (DIFP) measures ion flow vector in 2D plane
• Retarding Potential Analyzer (RPA) measures ion energy
• Langmuir Probe measures electron temperature
• Measurements of plasma free stream underway, E-Sail wire simulator being installed
Plasma Source
X,Y Mapping Stages
Diagnostic Probes
X-Y Stage to Map Measurement Region
Langmuir Probe
Differential Ion Flux Probe Retarding
Potential Analyzer
Diagnostic Probe Suite

National Aeronautics and Space Administration 23
A Sample of Plasma Chamber Data
• Chamber calibration underway
with new ion source
• E-Sail wire being installed
Characteristic RPA data
Derivative of
data
Ion Beam Energy
Differential Ion Flux Probe Data
Retarding Potential Analyzer DataLangmuir Probe Data
Three discrete types of experimental data are being collected which will be
used by the PIC model team to anchor model being developed

National Aeronautics and Space Administration 24
JPL MALTO Tool Enhancement
• MALTO ( Mission Analysis Low Thrust Optimization) is the go-to NASA preliminary mission design tool for electric propulsion ion engines and solar sails. MALTO was critical to the mission design of DAWN (ion engines) and is currently being used to design the NEA Scout mission (solar sail) and the Psyche Step 2 Discovery proposal (Hall thrusters).
• JPL is adding an Electric Sail model to MALTO that includes two key parameters that can be varied.
• The first parameter is variation with distance from Sun (roughly 1/r but some models use 1/r7/6)
• The second parameter is variation with respect to Sun incidence angle (a function of cosine)
• The addition of an E-Sail model to MALTO will allow rapid mission design studies with a validated low thrust optimization design tool that is a standard for NASA
• Thrust model (in terms of acceleration):
𝒂 =acceleration𝒂𝟎 = characteristic acceleration defined as thrust/mass at normal incidence (𝜶=0) at 1 AU𝑹𝑬 = constant of 1 AU 𝒓 = distance from sunc1 = constant of radial variation (typically either 7/6 or 1)c2 = constant of angular variation (typically between 1 and 2)𝜶 = incidence angle to solar wind of body vector to reference plane of E-sail 𝒏 = thrust/acceleration reference frame of E-sail
𝒂 = 𝒂𝟎𝑹𝑬𝒓
𝒄𝟏𝐜𝐨𝐬𝒄𝟐(𝜶)𝒏

National Aeronautics and Space Administration 25
Why a Technology Demo Mission?
• Before NASA could consider an un-proven propulsion technology to propel future Heliopause missions in the 2025 to 2035 timeframe,
• Our team believes that a Technology Demonstration Mission (TDM) must first be developed & flown in deep-space to prove the actual propulsion capabilities of an E-Sail propelled spacecraft
Therefore, members of our team performed a conceptual design for an E-Sail propelled spacecraft for consideration as a future TDM

National Aeronautics and Space Administration 26
Overall Focus & Goals of the E-Sail Tech Demo Mssn Conceptual Design
• Focus of study• To determine if all components necessary for an E-Sail
TDM can be packaged within a singular 12U spacecraft or 2-6U spacecraft (12U)
• Primary goals of mission:• To develop a CubeSat that can do the following (DAS):
• Deploy a 16,000 m conductive tether
• Accelerate the spacecraft, &
• Steer
• Secondary goals of mission:• Collect meaningful science data

National Aeronautics and Space Administration 27
Comparison of E-Sail Proposed Characteristic Acceleration Rates to Other Spacecraft
0.05 0.06 0.07
0.19
0.60
1.00
0.00
0.20
0.40
0.60
0.80
1.00
1.20
Hayabusa NEA Scout Dawn DS1 HERTS TDMInitial Goal
E-Sail Goal
Ch
ara
cte
risti
c A
ccele
rati
on
[m
m/s
2]
Low Thrust Mission
Dr. P. Janhunen’s
minimum E-Sail
Design Reference
The conceptual design of an E-Sail propulsion system for a proposed TDM was designed
with a characteristic acceleration that is 10 times greater then the NEA Scout Solar Sail

National Aeronautics and Space Administration 28
Out of Plane Capabilities within a Three Year Operational Life
• Results provided by Dr. Craig Kluever of the University of Missouri, College of Engineering
A characteristic acceleration that is 10 times that of a Solar Sail will enable the E-
Sail TDM spacecraft to get 50 degrees out of the ecliptic plane within 3 years
0.1 0.2 0.3 0.4 0.5 0.65
10
15
20
25
30
35
40
45
50
55
Initial thrust acceleration, mm/s2
Fina
l incli
natio
n, d
eg

National Aeronautics and Space Administration 29
TDM Configurations Investigated
“Hub and Spoke” “Hybrid” “Barbell”
Tether
Length
4 Tethers, each 4 km
length
Two tethers, each 8 km
lengthSingle 16 km tether
Feasible on
Full ScaleNo Yes No
Spin Up ΔV
Many km/s
(impossible at long
lengths)
3 m/s deployment, 21
m/s spin up
3 m/s deployment, 5
m/s spin up
Propellant
MassInfeasible 0.24 kg 0.5 kg
Steering
Capability
Different tether
voltagesDifferent tether voltages
Insulator/switch at
center
12 U
4 km16 km
6 U 6 U
8 km
1 U 1 U10 U
vv
v
vv
v
v
v

National Aeronautics and Space Administration 30
Down-Selected Tether Material Options for Further Study
• 32 gauge wire; 16,500 m; AmberStrand for baseline design
Miralon (CNT) Copper Aluminum AmberStrand
Mass [kg] 0.60 6.69 2.02 0.99
Tensile Load at Yield [N] 40.72 3.17 12.49 40.48
Voltage Drop [V] 2,431.5 51.1 80.6 902.4
Unquantified figures of merit:
• UV degradation
• Thermal properties
• Workability/reliability of material
• Deployment friction
AmberStrand is currently the leading contender for use in a TDM spacecraft
But recent technical discussions with UK’s Manchester University have occurred
that are investigating the use of Manchester U’s developed Graphene materials
National Aeronautics and Space Administration 31
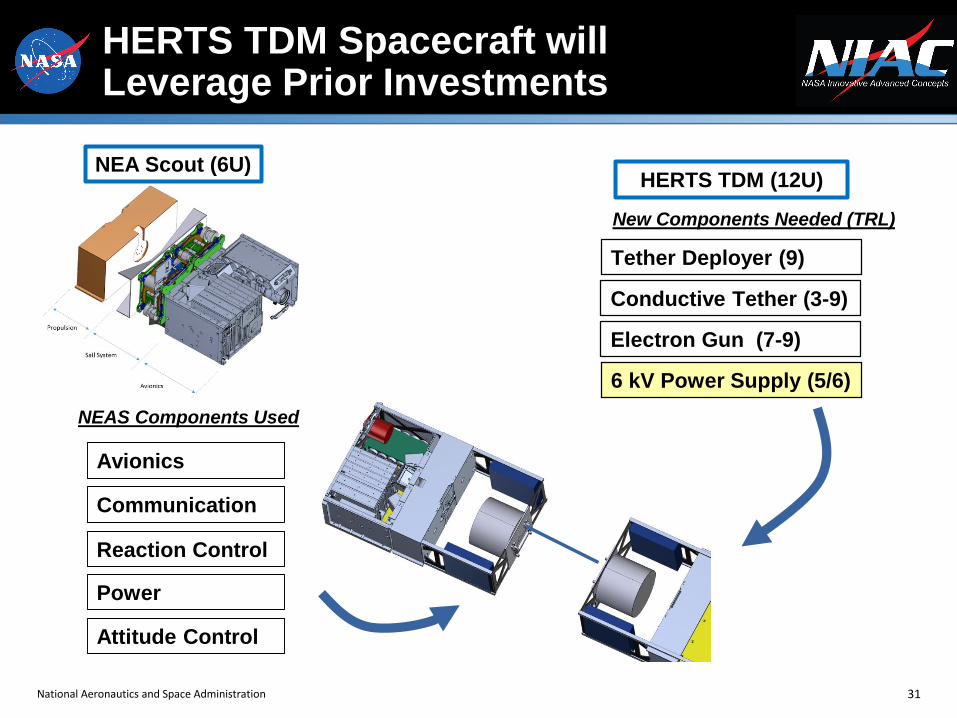
HERTS TDM Spacecraft will Leverage Prior Investments
NEA Scout (6U)
Avionics
Communication
Reaction Control
Power
Attitude Control
HERTS TDM (12U)
Conductive Tether (3-9)
Tether Deployer (9)
Electron Gun (7-9)
6 kV Power Supply (5/6)
New Components Needed (TRL)
NEAS Components Used

Animation of Proposed E-Sail TDM (2023)

Schedule to HERTS TDM Demo
Oct
2015
Oct
2016
Oct
2017
Oct
2018
Oct
2019
Oct
2020
Oct
2021
Oct
2022
Oct
2023
EM-1 Launches in Oct 2018
EM-2 Launch Opportunity 2021-2023
HERTS Phase II NIAC
2017 TIP Tether
Deployment at
MSFC Flat Floor
Before a Tech Demo Mission can be
done, NASA must first prove the
successful deployment of multiple
tethers in an experiment on Earth, or in
the upper atmosphere, or in LEO
TDM H/W Development
STMD Sub Orbital Rideshare
– Tether Deployment
ARM Ride-Share Opportunity
JWST Launches Oct 2018

National Aeronautics and Space Administrationwww.nasa.gov

Backup Slides Follow

National Aeronautics and Space Administration 36
Plasma Chamber Testing
National Aeronautics and Space Administration 37
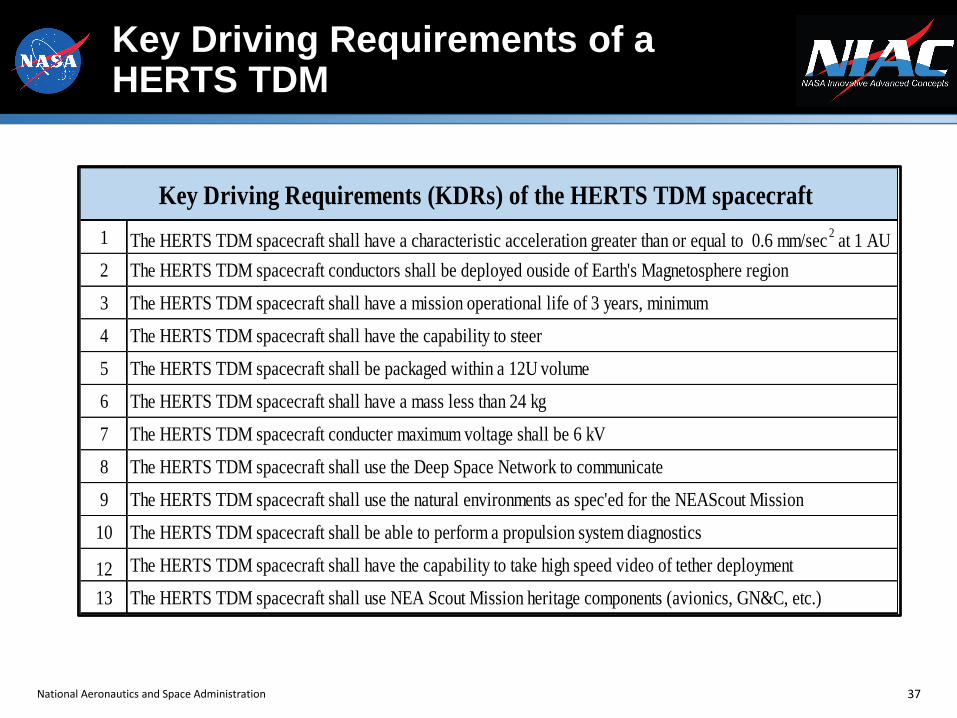
Key Driving Requirements of a HERTS TDM
1 The HERTS TDM spacecraft shall have a characteristic acceleration greater than or equal to 0.6 mm/sec2 at 1 AU
2 The HERTS TDM spacecraft conductors shall be deployed ouside of Earth's Magnetosphere region
3 The HERTS TDM spacecraft shall have a mission operational life of 3 years, minimum
4 The HERTS TDM spacecraft shall have the capability to steer
5 The HERTS TDM spacecraft shall be packaged within a 12U volume
6 The HERTS TDM spacecraft shall have a mass less than 24 kg
7 The HERTS TDM spacecraft conducter maximum voltage shall be 6 kV
8 The HERTS TDM spacecraft shall use the Deep Space Network to communicate
9 The HERTS TDM spacecraft shall use the natural environments as spec'ed for the NEAScout Mission
10 The HERTS TDM spacecraft shall be able to perform a propulsion system diagnostics
12 The HERTS TDM spacecraft shall have the capability to take high speed video of tether deployment
13 The HERTS TDM spacecraft shall use NEA Scout Mission heritage components (avionics, GN&C, etc.)
Key Driving Requirements (KDRs) of the HERTS TDM spacecraft

National Aeronautics and Space Administration 38
HERTS Tether Material Trade Space
The tether design required is key to mission success. Therefore the team
developed an overall tether trade tree to justify our down-selections of materials


National Aeronautics and Space Administrationwww.nasa.gov