The concentration of stress and strain in finite thickness elastic plate containing a circular hole
19
The concentration of stress and strain in finite thickness elastic plate containing a circular hole Zheng Yang * , Chang-Boo Kim, Chongdu Cho, Hyeon Gyu Beom Department of Mechanical Engineering, Inha University, Incheon 402-751, Republic of Korea Received 10 April 2007; received in revised form 20 July 2007 Available online 14 September 2007 Abstract The elastic stress and strain fields of finite thickness large plate containing a hole are systematically investigated using 3D finite element method. It is found that the stress and strain concentration factors of the finite thickness plate are dif- ferent even if the plate is in elasticity state except at notch root of plate surface. The maximum stress and strain do not always occur on the mid plane of plate. They occur on the mid plane only in thin plate. The maximum stress and strain concentration factors are not on mid plane and the locations of maximum stress and strain concentration factors are dif- ferent in thick plate. The maximum stress and strain concentration factors of notch root increase from their plane stress value to their peak values, then decrease gradually with increasing thickness and tend to each constant related to Poisson’s ratio of plate, respectively. The stress and strain concentration factors at notch root of plate surface are the same and are the monotonic descent functions of thickness. Their values decrease rapidly and tend to each constant related to Poisson’s ratio with plate thickness increasing. The difference between maximum and surface value of stress concentration factor is a monotonic ascent function of thickness. The thicker the plate is or the larger the Poisson’s ratio is, the larger the difference is. The corresponding difference of strain concentration factor is similar to the one of stress concentration factor. But the difference magnitude of stress concentration factor is larger than that of strain concentration factor in same plate. Ó 2007 Elsevier Ltd. All rights reserved. Keywords: Circular hole; Stress concentration factor; Strain concentration factor; Finite thickness 1. Introduction Cracks in structures often initiate and propagate from the locations of stress or strain concentration. The stress and strain concentration locations are the critical structural details to determine the crack initiation and growth life of engineering structures. Despite careful detail-design, practically many structures contain stress and strain concentrations due to holes. Holes in structural components will create stress or strain concentra- tions and hence will reduce the mechanical properties. The majority of service cracks nucleate in the area of stress or strain concentration at the edge of a hole. Knowledge of stress and strain concentration in the vicinity 0020-7683/$ - see front matter Ó 2007 Elsevier Ltd. All rights reserved. doi:10.1016/j.ijsolstr.2007.08.030 * Corresponding author. Tel.: +82 32 8607383; fax: +82 32 8681716. E-mail address: [email protected] (Z. Yang). Available online at www.sciencedirect.com International Journal of Solids and Structures 45 (2008) 713–731 www.elsevier.com/locate/ijsolstr
-
Upload
zheng-yang -
Category
Documents
-
view
214 -
download
0
Transcript of The concentration of stress and strain in finite thickness elastic plate containing a circular hole

Available online at www.sciencedirect.com
International Journal of Solids and Structures 45 (2008) 713–731
www.elsevier.com/locate/ijsolstr
The concentration of stress and strain in finite thicknesselastic plate containing a circular hole
Zheng Yang *, Chang-Boo Kim, Chongdu Cho, Hyeon Gyu Beom
Department of Mechanical Engineering, Inha University, Incheon 402-751, Republic of Korea
Received 10 April 2007; received in revised form 20 July 2007Available online 14 September 2007
Abstract
The elastic stress and strain fields of finite thickness large plate containing a hole are systematically investigated using3D finite element method. It is found that the stress and strain concentration factors of the finite thickness plate are dif-ferent even if the plate is in elasticity state except at notch root of plate surface. The maximum stress and strain do notalways occur on the mid plane of plate. They occur on the mid plane only in thin plate. The maximum stress and strainconcentration factors are not on mid plane and the locations of maximum stress and strain concentration factors are dif-ferent in thick plate. The maximum stress and strain concentration factors of notch root increase from their plane stressvalue to their peak values, then decrease gradually with increasing thickness and tend to each constant related to Poisson’sratio of plate, respectively. The stress and strain concentration factors at notch root of plate surface are the same and arethe monotonic descent functions of thickness. Their values decrease rapidly and tend to each constant related to Poisson’sratio with plate thickness increasing. The difference between maximum and surface value of stress concentration factor is amonotonic ascent function of thickness. The thicker the plate is or the larger the Poisson’s ratio is, the larger the differenceis. The corresponding difference of strain concentration factor is similar to the one of stress concentration factor. But thedifference magnitude of stress concentration factor is larger than that of strain concentration factor in same plate.� 2007 Elsevier Ltd. All rights reserved.
Keywords: Circular hole; Stress concentration factor; Strain concentration factor; Finite thickness
1. Introduction
Cracks in structures often initiate and propagate from the locations of stress or strain concentration. Thestress and strain concentration locations are the critical structural details to determine the crack initiation andgrowth life of engineering structures. Despite careful detail-design, practically many structures contain stressand strain concentrations due to holes. Holes in structural components will create stress or strain concentra-tions and hence will reduce the mechanical properties. The majority of service cracks nucleate in the area ofstress or strain concentration at the edge of a hole. Knowledge of stress and strain concentration in the vicinity
0020-7683/$ - see front matter � 2007 Elsevier Ltd. All rights reserved.
doi:10.1016/j.ijsolstr.2007.08.030
* Corresponding author. Tel.: +82 32 8607383; fax: +82 32 8681716.E-mail address: [email protected] (Z. Yang).
714 Z. Yang et al. / International Journal of Solids and Structures 45 (2008) 713–731
of a hole should be required for reliable design of structural components. Particularly, the increasing use ofhigh strength materials in the design of structural parts with high mechanical performance requires a betterunderstanding and modeling the behaviour of these structures. Exhaustive stress concentration factor figuresand tables have been published by Pilkey (1997) and Young (Young and Budynas, 2002) which account for awide variety of possible specimen configurations. However, many of these readily available sources of stressconcentration factors consider only a two-dimensional theory of elasticity solution.
Experimental evidence shows that for relatively thin plates the crack either originates at the corner, wherethe hole meets the free surface of the plate, or at the center of the plate. On the other hand for relatively thickplates the crack almost always originates in the vicinity of the corner (Broek, 1974). Evidently, the stress andstrain distributions near the edge of a hole are three-dimensional. Knowledge of the three-dimensional stressconcentration factor is a prerequisite for an accurate design of structural components. The actual three-dimen-sional stress and strain fields near a curved boundary are very complex and there are only few analytical three-dimensional solutions available in the literature for non-trivial geometries and particular boundary conditions.By using series expansion and taking finite terms into account, Sternberg et al. (1949) obtained an approxi-mate solution for 3D stress distributions near a circular hole in an infinite plate of arbitrary thickness. Detailanalyses for the out-of-plane stress constraint were provided, but for stress concentrations only a brief discus-sion was given. To develop rigorous analytical solutions a number of approximate theories have been devel-oped to consider the effects of three-dimensional constraint around a stress concentrator (Gregory and Wan,1988). Many of these theories are based on an asymptotic expansion with respect to a small parameter, whichis usually the ratio of the thickness to a characteristic length of the problem. However, underlying assumptionlimits the validity of any solutions obtained within these theories to only small values of the chosen parameterfor thin plates. Analytical as well as numerical investigations reported in the literature show a slight differencebetween the in-plane stresses obtained from plane-strain theory and these 3D solutions. For example, theincrease in the stress concentration factor for an infinite plate with a cylindrical hole subjected to uniaxialloading is less than 3% (Sternberg et al., 1949). In order to obtain a more general solution to the stress con-centration problem, Folias and Wang developed a 3D solution using Navier’s equation for plates of uniformthickness and with plate faces free of stress (Folias and Wang, 1990). Their results showed the stress concen-tration factor to be sensitive to the plate thickness and to Poisson’s ratio. For thin plate, it was found that thestress concentration factor attains its maximum in the middle of the plate. On the other hand, for thick plate,the stress concentration factor attains its maximum close to the plate surfaces.
Recently, Kotousov and Wang (2002) presented analytical solutions for the three-dimensional stress distri-bution around typical stress concentrators in an isotropic plate of arbitrary thickness basing on the generalizedplane strain theory assumption (Kane and Mindlin, 1956), which assumes that the out-of-plane strain is a con-stant in the thickness direction. The results were presented on the effects of the plate thickness and Poisson’sratio on the in-plane stress concentration factor and the out-of-plane stress constraint factor. It is shown thatthe stress concentration factor for a circular hole in an infinite plate is only slightly perturbed from the plane-strain solution over a wide range of thickness to radius ratio. Dealing with stress distributions due to holes,such hypothesis was rejected by Krishnaswamy et al. (1998). With reference to U and V-notches, Li and Guo(2001) also suggested that the assumption constant strain through the thickness can only be used in very thinor very thick plates and this kind of assumption was not suitable near the free surface. The validation of theassumption of generalized plane-strain theory in general stress concentration problems is suspectable. Consid-ering plates of arbitrary thickness containing V-shaped notches, Berto et al. (2004) presented analytical solu-tions for the three dimensional stress field in the close neighborhood of the stress concentration region bycombining Kotousov and Wang’s solution (2002) for Cz and Filippi et al.’s solution (2002) for in-plane stres-ses. The influence of the plate thickness on three-dimensional stress field near notch root was examined by Liet al. (Li et al., 2000; Li and Guo, 2001) using 3D finite element analyses. While keeping the Poisson’s ratioconstant, Li et al. analyzed the plate thickness influence on the theoretical stress concentration factor, thestress distributions and the out-of-plane stress constraint factor. Bellett et al. (2005) showed experimentallythat the common 2D methods for fatigue assessments of isotropic-notched bodies might lead to conservativepredictions when applied to three-dimensional geometries. It has been confirmed that the SCF (Stress Concen-tration Factor) in the interior of the linear elastic isotropic plate with a hole or notch is significantly higherthan that on the plate surface or the corresponding planar solutions (Livieri and Nicoletto, 2003). The

Z. Yang et al. / International Journal of Solids and Structures 45 (2008) 713–731 715
influence of Poisson’s ratio on the thickness-dependent stress concentration factor (SCF) along the root ofelliptic holes in elastic plates subjected to tension was investigated by use of three-dimensional finite elementmethod. Some empirical formulae had been obtained by fitting the numerical results (She and Guo, 2007; Yuet al., 2007).
On the other hand, stress concentration factor is practically determined through strain measured on theplate surface. However the strain concentration factor is different from the stress concentration factor in realstructures. This is a potential risk in 3D stress concentrated structures. So the strain concentration factor andthe maximum strain concentration factor are also important parameters. The corresponding relationshipsbetween the interior stress concentration factor and the strain concentration factor for a 3D plate with a holeare invaluable for safety design or assessment of structures. Despite of its importance, to the best of authors’knowledge, there is not any report on the coupled influence of the Poisson’s ratio and plate thickness upon thestrain concentration factor and the relationship between stress and strain concentration factor of finite thick-ness plate.
In this paper, the coupled influence of the Poisson’s ratio and plate thickness upon the stress concentrationfactor, the strain concentration factor and their relations of finite thickness plate containing a hole subjected touniaxial tension are vastly investigated using the finite element method. The main purpose of this work is notprimarily to provide numerical solutions for certain geometries but to highlight to the effect of Poisson’s ratioon stress and strain concentration factors for the three-dimensional stress or strain concentration problemsand consequently to provide general advice used to investigate the fatigue strength of materials.
2. Computational procedure and modeling
2.1. Definition
This study considers the finite thickness large plate containing a hole subjected to uniaxial tension (seeFig. 1). The radius of hole, the thickness, height and width of plate are a, 2B, 2H and 2W, respectively.The plate material is homogeneous, isotropic and elastic. The plane x–y (plane z = 0) is the mid plane of plateand the two plate surfaces are z = B and z = �B, respectively. For convenience, the line corresponding z-axisis named as notch root in this paper. The stress concentration factor (Kr) is
Kr ¼ ryy=rnet;
Kr0 ¼ ryy=rnet at x ¼ y ¼ 0:ð1Þ
The strain concentration factor (Ke) is
Ke ¼ eyy=enet;
Ke0 ¼ eyy=enet at x ¼ y ¼ 0:ð2Þ
σy
σxx
σzz
σyyY
Z
X
σy
2H
2B
2a
2W
Fig. 1. The analysis model and the coordinate system.

716 Z. Yang et al. / International Journal of Solids and Structures 45 (2008) 713–731
Here, ryy and eyy are the opening stress and strain of plate, rnet = ryW/(W � a) and enet = ryW/E(W � a) arethe mean stress and strain of the net section on the ligament, respectively. E is the Young’s modulus. ry is theremotely applied nominal stress. The Kr0 and Ke0 are Kr and Ke at the notch root, respectively. The maximumvalues of Kr and Ke along the notch root are denoted as Kr max and Ke max, of which values on the mid plane ofthe plate are denoted as Kr mp and Ke mp, respectively. K0 is the stress concentration factor corresponding tothe plate of plane stress state. According to the theory of elasticity (Timoshenko and Goodier, 1970), K0 isindependent of the Poisson’s ratio and Young’s modulus of plate.
For the stress fields in the finite thickness plate, two constraint parameters are introduced to describe the3D characteristics of the stress fields near the notch root. The out-of-plane stress constraint factor is
T z ¼rzz
rxx þ ryy; ð3Þ
and the in-plane stress factor is
T x ¼rxx
ryy: ð4Þ
Tz = 0 for the plane stress state and Tz = m for the plane strain state. For the finite thickness plate of elasticmaterial, 0 6 Tz 6 m, m is the Poisson’s ratio of material.
2.2. Finite element model
All analyses are carried out using the code ANSYS. Owing to the symmetry, only one-eighth of each plate ismodeled. Appropriate boundary condition constraints are placed at all planes of symmetry. The large plateassumes that the width and height of plate may be 100 times of the hole diameter, respectively. In our 3DFE computations, the radius of hole is 1 mm, both the half-height and half-width of plate are set to be100 mm. The plate thickness is varied from 0 to 5 mm. Poisson’s ratio is from 0.15 to 0.45 and Young’s mod-ulus, E is set to be 200 GPa. A uniform stress of 100 MPa is applied on the boundary of the plate that isremote from the hole. To avoid human-made uncertainties in choosing the element types, the standard simplelinear elements are applied. The finite element meshes are constructed with 8-node solid linear elements. 50and 100 planar layers are divided through the half-thickness of the plate for thinner and thicker plate, respec-tively. To accommodate the variations of the field quantities through the plate thickness, the thickness of eachsuccessive element layer is gradually reduced toward the plate surface. Within each layer, the size of elementdecreases gradually with distance from the notch root decreasing. These 3D models represent a compromisebetween the required level of mesh refinement to solve the in-plane and through-thickness gradients of thestress fields and the extensive computation times required for each analysis.
3. In-plane stress distribution
The Tx distribution on different plane layer is very similar, so is the Kr. They have relation to the thicknessof plate and the location of plane layer. For plate with a hole, the in-plane stress ratio and stress concentrationfactor on different plane layers near the hole can be uniformly expressed, respectively as:
T xzB
� �¼ h
xa;
zB;Ba
� �; ð5Þ
KrzB
� �¼ g
xa;
zB;Ba
� �: ð6Þ
Many efforts have been made to construct approximate expressions for stress distribution ahead of a notch-tip in elastic bodies (Creager and Paris, 1967;Glinka and Newport, 1987; Shin et al., 1994; Lazzarin and Tovo,1996). The best-known expressions for calculating stresses in the vicinity of a notch-tip are for circular andelliptical notches in an infinite plate under remote loading. When the stress concentration factor of notch root,Kr0, is introduced, the stress components in the plane y = 0 in an infinite plate having a circular hole can beobtained under uniaxial loading condition from the classical solution (Timoshenko and Goodier, 1970):

Fig.
Z. Yang et al. / International Journal of Solids and Structures 45 (2008) 713–731 717
rxx ¼Kr0ry
21þ x
a
� ��2
1� 1þ xa
� ��2� �
; ð7Þ
ryy ¼Kr0ry
31þ 1
21þ x
a
� ��2
þ 3
21þ x
a
� ��4� �
: ð8Þ
It is easy to derive from Eqs. (7) and (8) that
T x ¼rxx
ryy¼
3 1þ xa
� �21� 1þ x
a
� �2h i
2þ 1þ xa
� �2 þ 3 1þ xa
� �4h i ; ð9Þ
Kr
Kr0
¼ 1
31þ 1
21þ x
a
� ��2
þ 3
21þ x
a
� ��4� �
: ð10Þ
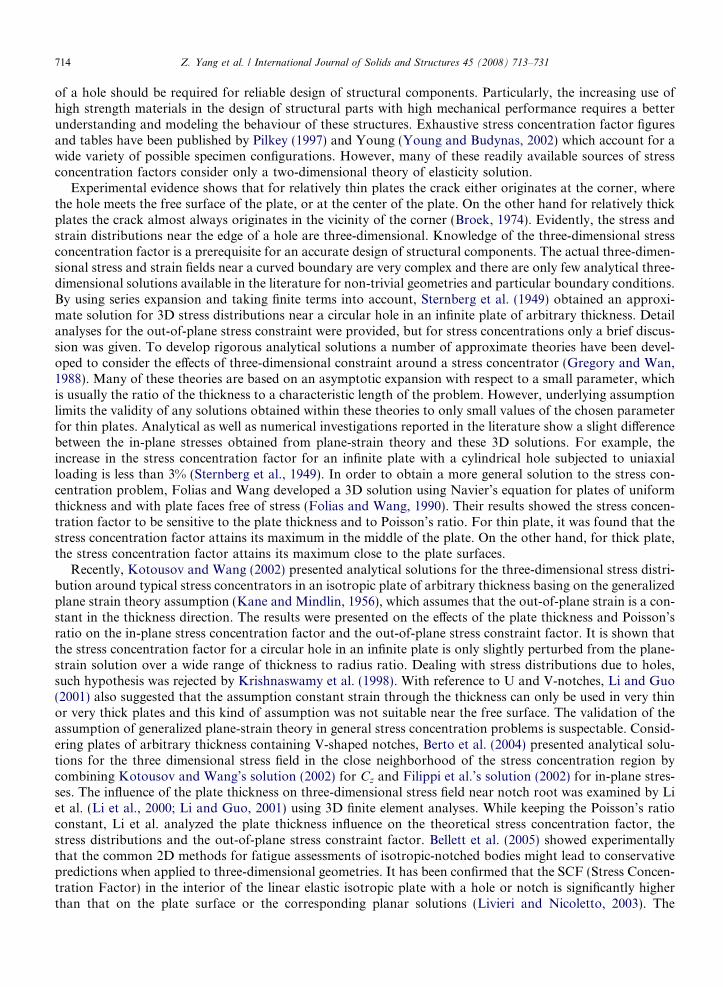
Figs. 2 and 3 show the distributions of in-plane stress ratio and stress concentration factor in front of notchroot on different plane layer for thickness B/a = 4.0 and B/a = 1.0, respectively. In Fig. 3, the stress concen-tration factor is normalized by its value at the notch root on the same plane layer. It can be easily seen that thecurves Tx � x/a and Kr/Kr0 � x/a are different on different plane layer paralleling mid plane for both B/a = 4.0 and B/a = 1.0. The curves Tx � x/a are sensitive to the location z/B of plane layer and the Eq. (9)can describe the Tx distribution well only near mid plane or near the notch root. The curves Kr/Kr0 � x/aare insensitive to the location z/B of plane layer except in a very narrow region near the plate surface. Butit should be noticed that the stress concentration factor along the notch root is not uniform and the stressconcentration factor used in these expressions is the value of notch root corresponding to each z/B plane layer.
Comparisons of solutions (Eqs. (9) and (10)) with 3D results, the in-plane stress ratio and stress concentra-tion factor distribution on the mid plane (z/B = 0 plane) can be predicted very well by 2D solution modified byconsidering 3D effect, the distributions of in-plane stress ratio and stress concentration factor in the vicinity ofnotch root can also be predicted using the modified 2D solutions except in narrow region near the plane surface.
4. The distributions of stress and strain concentration factor near the notch root
4.1. The relation of stress, strain concentration factor and plate thickness
In the same plate, the through-thickness distribution of stress concentration factor is different from the oneof strain concentration factor. The maximum stress and strain do not always occur on the mid plane of the
0.0 0.4 0.8 1.2 1.6 2.00.00
0.05
0.10
0.15
0.20
0.25
0.30
z/B=0.0 (mid plane)z/B=0.2z/B=0.4z/B=0.6z/B=0.8z/B=1.0 (surface)
x/a
B/a=4.0 B/a=1.0z/B=0.0z/B=0.2z/B=0.4z/B=0.6z/B=0.8z/B=1.0
Tx
Eq. (9)
2. The distribution of in-plane stress ratio in front of notch root on different plane layer for thickness B/a = 4.0 and B/a = 1.0.
0.0 0.4 0.8 1.2 1.6 2.00.3
0.4
0.5
0.6
0.7
0.8
0.9
1.0
z/B=0.0 (mid plane)z/B=0.2z/B=0.4z/B=0.6z/B=0.8z/B=1.0 (surface)K
σ /K
σ 0
x/a
z/B=0.0z/B=0.2z/B=0.4z/B=0.6z/B=0.8z/B=1.0
B/a=4.0 B/a=1.0
Eq. (10)
Fig. 3. The distribution of normalized stress concentration factor in front of notch root on different plane layer for thickness B/a = 4.0and B/a = 1.0.
718 Z. Yang et al. / International Journal of Solids and Structures 45 (2008) 713–731
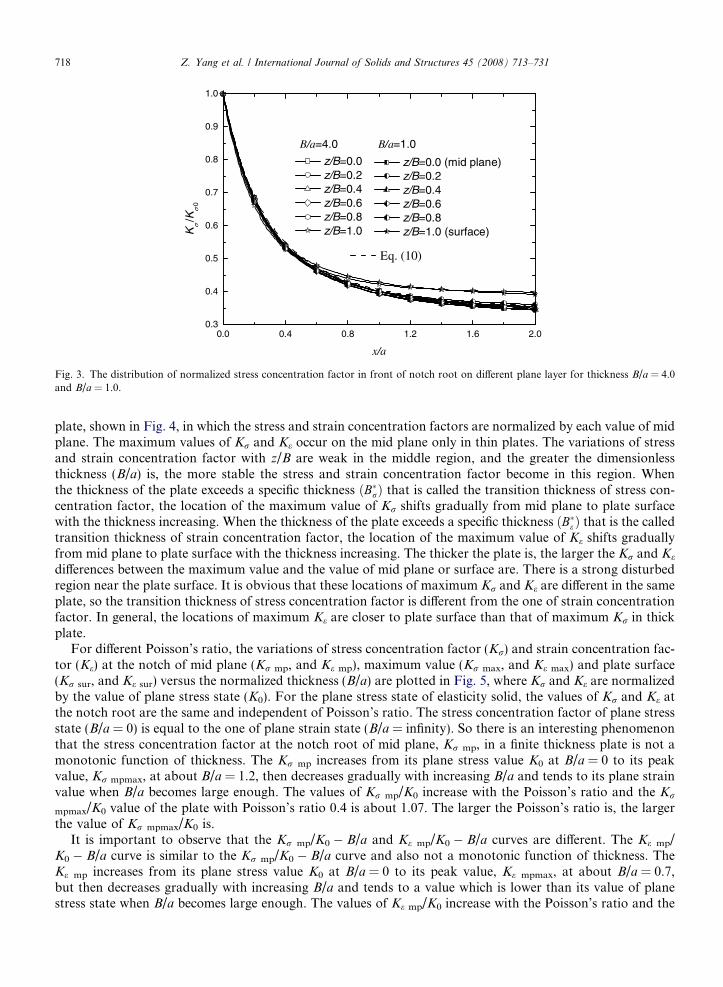
plate, shown in Fig. 4, in which the stress and strain concentration factors are normalized by each value of midplane. The maximum values of Kr and Ke occur on the mid plane only in thin plates. The variations of stressand strain concentration factor with z/B are weak in the middle region, and the greater the dimensionlessthickness (B/a) is, the more stable the stress and strain concentration factor become in this region. Whenthe thickness of the plate exceeds a specific thickness ðB�rÞ that is called the transition thickness of stress con-centration factor, the location of the maximum value of Kr shifts gradually from mid plane to plate surfacewith the thickness increasing. When the thickness of the plate exceeds a specific thickness ðB�e Þ that is the calledtransition thickness of strain concentration factor, the location of the maximum value of Ke shifts graduallyfrom mid plane to plate surface with the thickness increasing. The thicker the plate is, the larger the Kr and Ke
differences between the maximum value and the value of mid plane or surface are. There is a strong disturbedregion near the plate surface. It is obvious that these locations of maximum Kr and Ke are different in the sameplate, so the transition thickness of stress concentration factor is different from the one of strain concentrationfactor. In general, the locations of maximum Ke are closer to plate surface than that of maximum Kr in thickplate.
For different Poisson’s ratio, the variations of stress concentration factor (Kr) and strain concentration fac-tor (Ke) at the notch of mid plane (Kr mp, and Ke mp), maximum value (Kr max, and Ke max) and plate surface(Kr sur, and Ke sur) versus the normalized thickness (B/a) are plotted in Fig. 5, where Kr and Ke are normalizedby the value of plane stress state (K0). For the plane stress state of elasticity solid, the values of Kr and Ke atthe notch root are the same and independent of Poisson’s ratio. The stress concentration factor of plane stressstate (B/a = 0) is equal to the one of plane strain state (B/a = infinity). So there is an interesting phenomenonthat the stress concentration factor at the notch root of mid plane, Kr mp, in a finite thickness plate is not amonotonic function of thickness. The Kr mp increases from its plane stress value K0 at B/a = 0 to its peakvalue, Kr mpmax, at about B/a = 1.2, then decreases gradually with increasing B/a and tends to its plane strainvalue when B/a becomes large enough. The values of Kr mp/K0 increase with the Poisson’s ratio and the Kr
mpmax/K0 value of the plate with Poisson’s ratio 0.4 is about 1.07. The larger the Poisson’s ratio is, the largerthe value of Kr mpmax/K0 is.
It is important to observe that the Kr mp/K0 � B/a and Ke mp/K0 � B/a curves are different. The Ke mp/K0 � B/a curve is similar to the Kr mp/K0 � B/a curve and also not a monotonic function of thickness. TheKe mp increases from its plane stress value K0 at B/a = 0 to its peak value, Ke mpmax, at about B/a = 0.7,but then decreases gradually with increasing B/a and tends to a value which is lower than its value of planestress state when B/a becomes large enough. The values of Ke mp/K0 increase with the Poisson’s ratio and the
a
b
0.0 0.2 0.4 0.6 0.8 1.00.825
0.850
0.875
0.900
0.925
0.950
0.975
1.000
1.025
Kσ /
Kσ
mp
z/B
B/a =0.5B/a =1.0B/a =1.5B/a =2.0B/a =2.5B/a =3.0B/a =3.5B/a =4.0
ν =0.3
0.0 0.2 0.4 0.6 0.8 1.00.825
0.850
0.875
0.900
0.925
0.950
0.975
1.000
1.025
Kε /
Kε m
p
z/B
B/a =0.5B/a =1.0B/a =1.5B/a =2.0B/a =2.5B/a =3.0B/a =3.5B/a =4.0
ν =0.3
Fig. 4. The through-thickness distributions of the (a) stress and, (b) strain concentration factor along notch root for different thickness.
Z. Yang et al. / International Journal of Solids and Structures 45 (2008) 713–731 719
Ke mpmax/K0 value of the plate with Poisson’s ratio 0.4 is about 1.02. Though the Ke mpmax/K0 value is lowerthan the Kr mpmax/K0 value, the Ke mp will decrease to the value below its plane stress value. When B/a = 5, theKe mp/K0 value of the plate with Poisson’s ratio 0.4 is only about 0.91 and it is about 10% lower than the Kr mp/K0 value of the same plate. The larger the Poisson’s ratio of plate is, the larger the value of Ke mpmax/K0 is andthe lower the Ke mp/K0 � B/a curve tends to when B/a becomes large enough. The lower limits of Ke mp/K0 � B/a curve for the plate with Poisson’s ratio 0.2, 0.3 and 0.4 are about 0.98, 0.94 and 0.90, respectively.The transition points of maximum Kr/K0 and Ke/K0 (Kr max/K0 and Ke max/K0) are all in descending segmentof the curves. The Kr max/K0 and Ke max/K0 decrease gradually with increasing B/a and tend to each constantfor different Poisson’s ratio when B/a becomes large enough. This constant of stress concentration factor willbe larger than 1. The larger the Poisson’s ratio of plate is, the larger the constant of stress concentration factortends to when B/a becomes large enough, whereas this constant of strain concentration factor will be smallerthan 1. The larger the Poisson’s ratio is, the smaller this constant of strain concentration factor tends to whenB/a becomes large enough.
0.0 0.5 1.0 1.5 2.0 2.5 3.0 3.5 4.0 4.5 5.00.76
0.78
0.80
0.82
0.84
0.86
0.88
0.90
0.92
0.94
0.96
0.98
1.00
Kσ sur
Kε sur
ν =0.2ν =0.3ν =0.4
K /
K0
B/a
0.0 0.5 1.0 1.5 2.0 2.5 3.0 3.5 4.0 4.5 5.00.90
0.92
0.94
0.96
0.98
1.00
1.02
1.04
1.06
1.08
ν =0.2ν =0.3ν =0.4
K /
K0
B/a
Kσ mp
Kσ max
Kε mp
Kε max
a
b
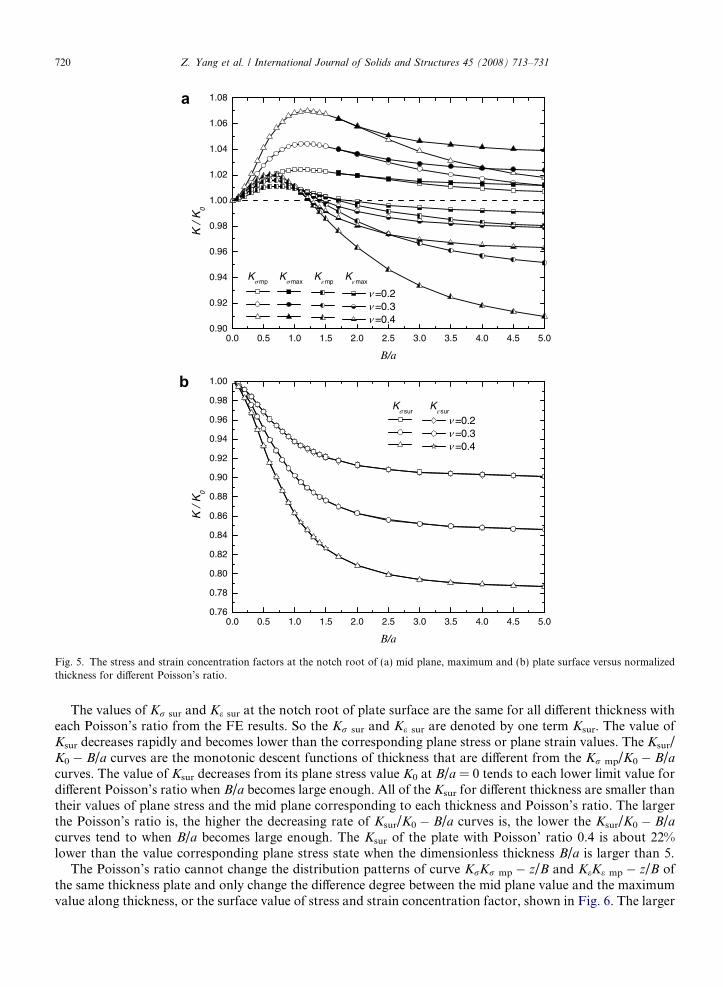
Fig. 5. The stress and strain concentration factors at the notch root of (a) mid plane, maximum and (b) plate surface versus normalizedthickness for different Poisson’s ratio.
720 Z. Yang et al. / International Journal of Solids and Structures 45 (2008) 713–731
The values of Kr sur and Ke sur at the notch root of plate surface are the same for all different thickness witheach Poisson’s ratio from the FE results. So the Kr sur and Ke sur are denoted by one term Ksur. The value ofKsur decreases rapidly and becomes lower than the corresponding plane stress or plane strain values. The Ksur/K0 � B/a curves are the monotonic descent functions of thickness that are different from the Kr mp/K0 � B/acurves. The value of Ksur decreases from its plane stress value K0 at B/a = 0 tends to each lower limit value fordifferent Poisson’s ratio when B/a becomes large enough. All of the Ksur for different thickness are smaller thantheir values of plane stress and the mid plane corresponding to each thickness and Poisson’s ratio. The largerthe Poisson’s ratio is, the higher the decreasing rate of Ksur/K0 � B/a curves is, the lower the Ksur/K0 � B/acurves tend to when B/a becomes large enough. The Ksur of the plate with Poisson’ ratio 0.4 is about 22%lower than the value corresponding plane stress state when the dimensionless thickness B/a is larger than 5.
The Poisson’s ratio cannot change the distribution patterns of curve KrKr mp � z/B and KeKe mp � z/B ofthe same thickness plate and only change the difference degree between the mid plane value and the maximumvalue along thickness, or the surface value of stress and strain concentration factor, shown in Fig. 6. The larger

0.0 0.2 0.4 0.6 0.8 1.00.70
0.75
0.80
0.85
0.90
0.95
1.00
1.05
ν =0.15ν =0.20ν =0.25ν =0.30ν =0.35ν =0.40ν =0.45
Kσ / K
σm
p
z/B
B/a =1
B/a =4
0.0 0.2 0.4 0.6 0.8 1.00.80
0.84
0.88
0.92
0.96
1.00
1.04
1.08
ν =0.15ν =0.20ν =0.25ν =0.30ν =0.35ν =0.40ν =0.45
Kε / K
εm
p
z/B
B/a =1
B/a =4
b
a
Fig. 6. The through-thickness distributions of (a) the stress and, (b) strain concentration factor along notch root for different Poissonratio.
Z. Yang et al. / International Journal of Solids and Structures 45 (2008) 713–731 721
the Poisson’s ratio is or the thicker the plate is, the larger this difference degree is. When the Poisson’s ratiochanges from 0.15 to 0.45, for the plate of thickness B/a = 1 (thin plate), the difference between mid planevalue and surface value of stress concentration factor changes from 6.1% to 22.2% and the corresponding dif-ference of strain concentration factor changes from 5.3% to 16.6%, respectively, whereas for the plate of thick-ness B/a = 4 (thick plate), the difference of stress concentration factor changes from 7.9% to 28.5% and thedifference of strain concentration factor changes from 6.8% to 22.2%, respectively.
4.2. The difference between surface and maximum value of stress and strain concentration factor
The difference between mid plan and surface value of stress concentration factor is not a monotonic func-tion of thickness. After its maximum value, it decreases gradually with increasing B/a and tends to a constantvalue corresponding different Poisson’s ratio when B/a becomes large enough. But the difference between

722 Z. Yang et al. / International Journal of Solids and Structures 45 (2008) 713–731
maximum and surface value of stress concentration factor is a monotonic ascent function of thickness. Itincreases with increasing B/a and rapidly tends to other constant corresponding each Poisson’s ratio whenB/a becomes large enough. This difference relationship of strain concentration factor is similar to the oneof stress concentration factor, shown in Fig. 7. The constant of stress concentration factor between maximumand surface value may be over 11.1%, 17.8% and 25.3% for plate with Poisson’s ratio 0.2, 0.3 and 0.4, respec-tively. This constant of strain concentration factor may be over 9.0%, 13.4% and 17.6% for plate with Pois-son’s ratio 0.2, 0.3 and 0.4, respectively.
The through-thickness distributions of Kr/Kr mp and Ke/Ke mp are sensitive to the thickness and Poisson’sratio. The effects of thickness and Poisson’s ratio on the through-thickness distributions of Kr/Kr mp and Ke/Ke
mp are shown in Figs. 4 and 6, respectively. The Kr and Ke at the notch root of plate surface decrease as thick-ness or Poisson’s ratio increases. It is also shown that the Kr on mid plane in a finite thickness plate is higherthan that in the plane stress or plane strain states and the Ke on mid plane in a finite thickness plate may belower than that in the plane stress or plane strain states. For the thick plate, the maximum Kr which is larger
0 1 2 3 4 50.00
0.03
0.06
0.09
0.12
0.15
0.18
0.21
0.24
0.27
(Kσ max
- Kσ sur
) / K0
ν =0.2ν =0.3ν =0.4
(Kσ -
Kσ
sur )
/ K
0
B/a
ν =0.2ν =0.3ν =0.4
(Kσ mp
- Kσ sur
) / K0
0 1 2 3 4 50.00
0.02
0.04
0.06
0.08
0.10
0.12
0.14
0.16
0.18
(Kε max
- Kε sur
) / K0
(Kε mp
- Kε sur
) / K0
ν =0.2ν =0.3ν =0.4
ν =0.2ν =0.3ν =0.4
(Kε -
Kε
sur )
/ K
0
B/a
a
b
Fig. 7. The differences between mid-plan, or maximum value and surface value of (a) stress and, (b) strain concentration factor versusnormalized thickness for different Poisson’s ratio.

Z. Yang et al. / International Journal of Solids and Structures 45 (2008) 713–731 723
than that on the mid plane, is close to the plate surface. However, the Kr and Ke values at notch root of platesurface are the same and they are lower than that in the plane stress or plane strain states. They decrease rap-idly near the plate surface and are too lower to reflect the overall stress concentration as thickness or Poisson’sratio increases. Fig. 7 also shows that it is risky to use the Ke measured directly on the plate surface or calcu-lated by 2D theories in the engineering design. The influence of thickness and Poisson’s ratio on stress andstrain concentration factor must be taken account of.
4.3. The relation of stress and strain concentration factor
In three-dimensional stress state, the distributions of stress and strain concentration factor are differentalong the thickness of notch root, shown in Figs. 4 and 6. For three-dimensional stress state of elastic medium,the strain components produced by each of the three stresses can be denoted as
exx ¼1
E½rxx � mðryy þ rzzÞ�;
eyy ¼1
E½ryy � mðrxx þ rzzÞ�;
ezz ¼1
E½rzz � mðrxx þ ryyÞ�:
According to Eqs. (1)–(4), the following expression can be obtained
Ke ¼ Kr½1� mðT x þ T z þ T x � T zÞ�: ð11Þ
It is indicated that the stress concentration factor and the strain concentration factor of the finite thicknessplate are different even if the material is in elasticity state. The Ke/Kr distributions in front of notch rooton different plane layer for the plate of B/a = 4 and m = 0.3 are shown in Fig. 8. From theory and finite ele-ment results, it is showed that the distribution of Ke/Kr depends on the Poisson’s ratio and the distributions ofin-plane and out-of-plane stress constraint factor. The Ke/Kr value is different in different location near thenotch root. The stress concentration factor is equal to the strain concentration factor only at the notch rootof plate surface, where the out-of-plane and in-plane stresses, rzz and rxx, are zero simultaneously (that is,Tz = 0 and Tx = 0), or at the notch root under the plane stress state. This has been confirmed by the FE re-sults, shown in Fig. 5b.The values of Ke in finite thickness plate are all less than the one of Kr except at the notch root of platesurface where the Ke is equal to the Kr. The distributions of Ke/Kr are different on different layers paralleled
0.0 0.4 0.8 1.2 1.6 2.0
0.88
0.90
0.92
0.94
0.96
0.98
1.00
z/B=0.0 (mid plane)z/B=0.2z/B=0.4z/B=0.6z/B=0.8z/B=1.0 (surface)
Kε /
Kσ
x/a
B/a=4, ν =0.3
Fig. 8. The Ke/Kr distributions in front of notch root on different plane layer.
724 Z. Yang et al. / International Journal of Solids and Structures 45 (2008) 713–731
to the mid plane of plate. Each Ke /Kr � x/a curve in front of notch root on different layer has a minimumwhich quantity and location lie on the layer location, thickness and Poisson’s ratio of plate, and tends to 1when distance x tends to infinity where there is no stress concentration and the stress rxx and rzz are zerosimultaneously.
The in-plane stress factor Tx is zero along the notch root. From Eq. (11), the distribution of Ke/Kr alongthis line can be expressed as
Ke ¼ Kr½1� mT z�: ð12Þ
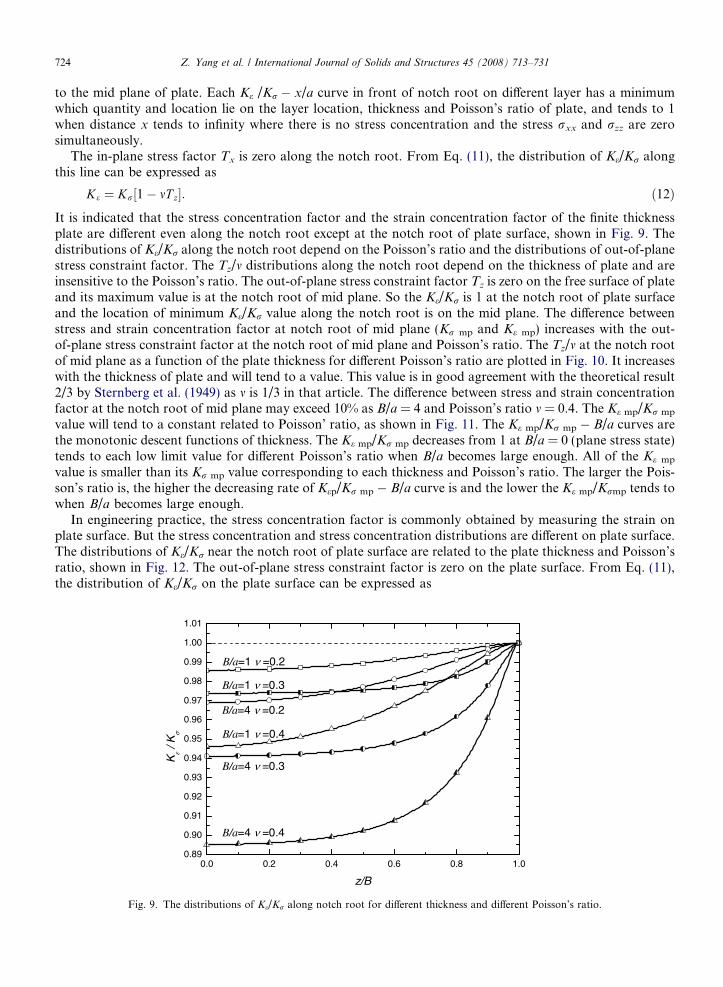
It is indicated that the stress concentration factor and the strain concentration factor of the finite thicknessplate are different even along the notch root except at the notch root of plate surface, shown in Fig. 9. Thedistributions of Ke/Kr along the notch root depend on the Poisson’s ratio and the distributions of out-of-planestress constraint factor. The Tz/m distributions along the notch root depend on the thickness of plate and areinsensitive to the Poisson’s ratio. The out-of-plane stress constraint factor Tz is zero on the free surface of plateand its maximum value is at the notch root of mid plane. So the Ke/Kr is 1 at the notch root of plate surfaceand the location of minimum Ke/Kr value along the notch root is on the mid plane. The difference betweenstress and strain concentration factor at notch root of mid plane (Kr mp and Ke mp) increases with the out-of-plane stress constraint factor at the notch root of mid plane and Poisson’s ratio. The Tz/m at the notch rootof mid plane as a function of the plate thickness for different Poisson’s ratio are plotted in Fig. 10. It increaseswith the thickness of plate and will tend to a value. This value is in good agreement with the theoretical result2/3 by Sternberg et al. (1949) as m is 1/3 in that article. The difference between stress and strain concentrationfactor at the notch root of mid plane may exceed 10% as B/a = 4 and Poisson’s ratio m = 0.4. The Ke mp/Kr mpvalue will tend to a constant related to Poisson’ ratio, as shown in Fig. 11. The Ke mp/Kr mp � B/a curves arethe monotonic descent functions of thickness. The Ke mp/Kr mp decreases from 1 at B/a = 0 (plane stress state)tends to each low limit value for different Poisson’s ratio when B/a becomes large enough. All of the Ke mp
value is smaller than its Kr mp value corresponding to each thickness and Poisson’s ratio. The larger the Pois-son’s ratio is, the higher the decreasing rate of Kep/Kr mp � B/a curve is and the lower the Ke mp/Krmp tends towhen B/a becomes large enough.
In engineering practice, the stress concentration factor is commonly obtained by measuring the strain onplate surface. But the stress concentration and stress concentration distributions are different on plate surface.The distributions of Ke/Kr near the notch root of plate surface are related to the plate thickness and Poisson’sratio, shown in Fig. 12. The out-of-plane stress constraint factor is zero on the plate surface. From Eq. (11),the distribution of Ke/Kr on the plate surface can be expressed as
0.0 0.2 0.4 0.6 0.8 1.00.89
0.90
0.91
0.92
0.93
0.94
0.95
0.96
0.97
0.98
0.99
1.00
1.01
B/a=4 ν =0.4
B/a=4 ν =0.3
B/a=1 ν =0.4
B/a=4 ν =0.2
B/a=1 ν =0.3
Kε /
Kσ
z/B
B/a=1 ν =0.2
Fig. 9. The distributions of Ke/Kr along notch root for different thickness and different Poisson’s ratio.

0 1 2 3 4 50.0
0.1
0.2
0.3
0.4
0.5
0.6
0.7
B/a
Tz
mp /
ν
ν =0.2ν =0.3ν =0.4
Tz/ ν =2/3
Fig. 10. The variations of out-of-plane constraint at notch root of mid plane with plate thickness for different Poisson’s ratio.
0 1 2 3 4 50.88
0.90
0.92
0.94
0.96
0.98
1.00
ν =0.4
ν =0.3
Kε
mp /
Kσ
mp
B/a
ν =0.2
Fig. 11. The Ke/Kr at the notch root of mid plane versus normalized thickness for different Poisson’s ratio.
Z. Yang et al. / International Journal of Solids and Structures 45 (2008) 713–731 725
Ke ¼ Kr½1� mT x�: ð13Þ
If we know the distribution of in-plane stress on plate surface, we can obtain the exact relation of stress con-centration and strain concentration factor on it. But the distribution of strain near the notch root of finitethickness plate is very complicated. Here we substitute Eq. (9) into Eq. (13) to obtain the approximate expres-sion of Ke/Kr � x/a curve in front of notch root on plate surface,
Ke
Kr¼ 1� m
3 1þ xa
� �21� 1þ x
a
� �2h i
2þ 1þ xa
� �2 þ 3 1þ xa
� �4h i
24
35: ð14Þ
It has been confirmed in Section 3 that Eq. (9) is suitable to express the distribution of in-plane stress factoronly near the notch root. So the Eq. (14) may be used to depict the distribution of Ke/Kr only near the notch
0.0 0.4 0.8 1.2 1.6 2.00.92
0.94
0.96
0.98
1.00
Kε /
Kσ
x/a
B/a=0.5B/a=1.0B/a=2.0B/a=3.0B/a=4.0B/a=5.0
ν =0.3
0.0 0.4 0.8 1.2 1.6 2.00.88
0.90
0.92
0.94
0.96
0.98
1.00ν =0.30ν =0.35ν =0.40
ν =0.15ν =0.20ν =0.25
ν =0.15ν =0.20ν =0.25ν =0.30ν =0.35ν =0.40
Kε /
Kσ
x/a
a
b
Eq. (14)
Eq. (14)
Finite element results B/a=4.0
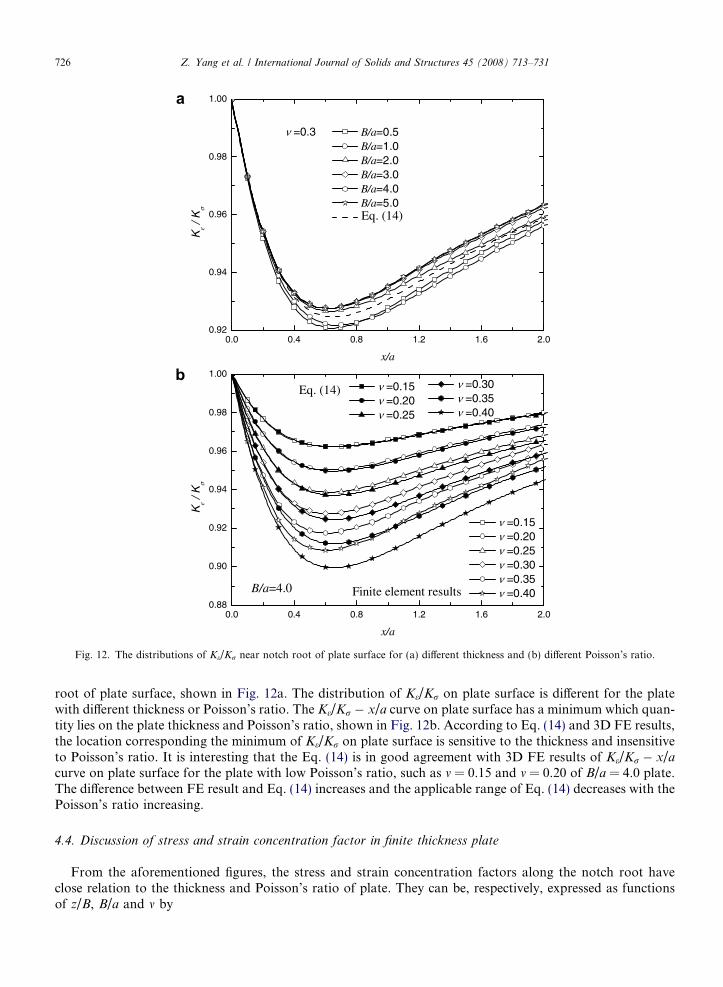
Fig. 12. The distributions of Ke/Kr near notch root of plate surface for (a) different thickness and (b) different Poisson’s ratio.
726 Z. Yang et al. / International Journal of Solids and Structures 45 (2008) 713–731
root of plate surface, shown in Fig. 12a. The distribution of Ke/Kr on plate surface is different for the platewith different thickness or Poisson’s ratio. The Ke/Kr � x/a curve on plate surface has a minimum which quan-tity lies on the plate thickness and Poisson’s ratio, shown in Fig. 12b. According to Eq. (14) and 3D FE results,the location corresponding the minimum of Ke/Kr on plate surface is sensitive to the thickness and insensitiveto Poisson’s ratio. It is interesting that the Eq. (14) is in good agreement with 3D FE results of Ke/Kr � x/acurve on plate surface for the plate with low Poisson’s ratio, such as m = 0.15 and m = 0.20 of B/a = 4.0 plate.The difference between FE result and Eq. (14) increases and the applicable range of Eq. (14) decreases with thePoisson’s ratio increasing.
4.4. Discussion of stress and strain concentration factor in finite thickness plate
From the aforementioned figures, the stress and strain concentration factors along the notch root haveclose relation to the thickness and Poisson’s ratio of plate. They can be, respectively, expressed as functionsof z/B, B/a and m by
Z. Yang et al. / International Journal of Solids and Structures 45 (2008) 713–731 727
KrzB
� �¼ f1
zB;Ba; m
� �; ð15Þ
KezB
� �¼ f2
zB;Ba; m
� �: ð16Þ
According to the symmetry, the stress and strain concentration factors along the notch root are of the follow-ing characters:
KrzB
� �¼ Ke
zB
� �ðz ¼ �BÞ:
For the thin plate, the maximums of Kr/Kr mp � z/B and Ke/Ke mp � z/B curves are all at the notch root of midplane. But for the thick plate, the values of Kr and Ke at notch root of mid plane are the minimums of Kr/Kr
mp � z/B and Ke/Ke mp � z/B curves, respectively. The point of maximum concentration factor moves awayfrom the mid plane of plate by increasing plate thickness. Respective stress and strain concentration factorsin a plate may not reach their maximums at the same location, that is, when B=a > B�r=a
oKr
oz¼ 0 and
o2Kr
oz2< 0
zB¼ z�r
B
� �;
when B=a > B�e=a
oKe
oz¼ 0 and
o2Ke
oz2< 0
zB¼ z�e
B
� �;
where z�r and z�e are the locations of maximum stress and strain concentration factor along the notch root,respectively. The z�r=B and z�e=B values of the same plate are different. But both of them increase with the platethickness. The values of z�r=B and z�e=B tend to 1 when the plate thickness tends to infinite and they are zerowhen B=a < B�r=a and B=a < B�e=a, respectively.
The variations of stress and strain concentration factor at the notch root of mid plane with thickness can beexpressed as functions of B/a and m by
KrmpBa
� K0
¼ f3
Ba; m
� �; ð17Þ
KempBa
� K0
¼ f4
Ba; m
� �; ð18Þ
respectively. The variations of maximum stress and strain concentration factor along the thickness of notchroot with thickness can be expressed as functions of B/a and m by
Kr maxBa
� K0
¼ f5
Ba; m
� �; ð19Þ
Ke maxBa
� K0
¼ f6
Ba; m
� �; ð20Þ
respectively. The variations of stress and strain concentration factor at the notch root of plate surface withthickness can be expressed by a same function of B/a and m,
KsurBa
� K0
¼ f7Ba; m
� �: ð21Þ
Here f1 and f2 are the functions of z/B, B/a and m. f3, f4, f5, f6 and f7 are the functions of B/a and m, respectively.These functions are of the following characters:
f3
Ba; m
� �¼ f4
Ba; m
� �¼ f5
Ba; m
� �¼ f6
Ba; m
� �¼ f7
Ba; m
� �¼ 1; when
Ba¼ 0:
When Ba 6
B�ra ,

728 Z. Yang et al. / International Journal of Solids and Structures 45 (2008) 713–731
KrmpBa
� K0
¼Kr max
Ba
� K0
; so f 3
Ba; m
� �¼ f5
Ba; m
� �:
When Ba >
B�ra ,
1 6 f3
Ba; m
� �< f5
Ba; m
� �:
When Ba 6
B�ea ,
KempBa
� K0
¼Ke max
Ba
� K0
; so f 4
Ba; m
� �¼ f6
Ba; m
� �:
When Ba >
B�ea ,
f4
Ba; m
� �< f6
Ba; m
� �:
Here B�r and B�e are the transition thickness of stress and strain concentration factor, respectively.When B
a !1,
KrmpBa
� K0
¼ f3
Ba; m
� �! 1:
As Ba !1, T z ! 2m
3. According to the relation of stress and strain concentration factor, Eq. (12),
KempBa
� K0
¼ f4
Ba; m
� �! 1� 2
3m2:
Kr maxBa
� K0
¼ f5
Ba; m
� �! C5ðmÞ > 1;
Ke maxBa
� K0
¼ f6Ba; m
� �! C6ðmÞ < 1;
KsurBa
� K0
¼ f7
Ba; m
� �! C7ðmÞ < 1:
Here, C5 > C6 > C7 for the plate with same Poisson’s ratio. C5, C6, and C7 are the constants related to Poisson’ratio. According to the FE results, the values of C5, C6, and C7 are about 1.024, 0.979 and 0.846, respectively,for the plate of Poisson’s ratio m = 0.3.
5. The stress and strain concentration factor distributions near plate surface
The through-thickness distribution of out-of-plane strain normalized by each value of plate surface isshown in Fig. 13. The plate thickness is normalized by hole radius in this figure. The out-of-plane strain dis-tributions of different thickness plate are very similar near the plate surface. The influence of surface on strainand stress field is only in a limited thickness near the surface. But within this narrow thickness, the variety ofdeformation is very intense and the intense degree is almost same for different thickness plate. For the thinplate, the influence thickness of surface may exceed the half thickness of plate and the deformation is influ-enced by the plate surface of opposite side. The thicker the plate is, the weaker the opposite side influencesthe deformation. For the thick plates, the distributions of out-of-plane strain are almost same near the surface.It’s evident Kane-Mindlin’s plate theory and similar theories assuming constant strain through the thicknesscan only be applied to the small central zone of thick plate with stress concentration problem. It may not bereasonable to use this kind of assumption near the plate surface.
Because of symmetry, the tangent line of Kr/Kr sur � z/a curve at mid plane is a horizontal line. The max-imum stress concentration factor is not always at the mid plane. The maximum value and its location depend onthe plate thickness, shown in Fig. 14. The thinner the plate is, the more the Kr/Kr sur � z/a curve is linear. For

0.0 0.5 1.0 1.5 2.0 2.5 3.0 3.5 4.0 4.5 5.01.00
1.02
1.04
1.06
1.08
1.10
1.12
1.14
1.16
1.18
1.20
1.22
z/a
B/a =5.0 B/a =4.0 B/a =3.0
B/a =2.0B/a =1.5
B/a =1.0
B/a =0.5Kσ /
Kσ
sur
surface
4.5 4.6 4.7 4.8 4.9 5.01.00
1.04
1.08
1.12
1.16
1.20
B/a=1.5
B/a=1.0
B/a=0.5Kσ
/ Kσ
sur
z/a
Fig. 14. The through-thickness distributions of stress concentration factor normalized by each value of plate surface.
0.0 0.5 1.0 1.5 2.0 2.5 3.0 3.5 4.0 4.5 5.00.4
0.5
0.6
0.7
0.8
0.9
1.0
1.1
B/a=5.0 B/a=4.0B/a=3.0
B/a=2.0
B/a=1.5
B/a=1.0ε zz
/εzz
sur
z/a
B/a=0.5
4.5 4.6 4.7 4.8 4.9 5.00.80
0.85
0.90
0.95
1.00
1.05
B/a=1.0ε zz/ε
zzsu
rz/a
B/a=0.5
surface
surface
Fig. 13. The through-thickness distributions of out-of-plane strain normalized by each value of plate surface.
Z. Yang et al. / International Journal of Solids and Structures 45 (2008) 713–731 729
the thin plate, the maximum stress concentration factor is at the notch root of mid plane, the maximum stressconcentration factor and the curvature of Kr/Kr sur � z/a curve increase as the plate thickness increases. Theinfluence of surface on stress concentration factor distribution increases with the plate thickness increasing.But the influence thickness of surface is a limited thickness near surface. The stress concentration factor inthe influence thickness will increase and tend to a constant value, C5K0, with the plate thickness increasing.For the thick plate, the stress concentration factor at the notch root of mid plane will tend to the value of planestrain state, which is equal to the value of plane stress state, when the plate thickness becomes large enough. Sothere is a maximum point of the stress concentration factor near the plate surface, where the value of stress con-centration factor is larger than the value of mid plane and plate surface. From the FE results, it is found that thelocations of maximum are almost equidistance from surface for the plate with different thickness that exceedsthe transition thickness of stress concentration factor. This distance is about 1.2a from the surface. For thethick plate, there is a plain segment in Kr/Kr sur � z/a curve near the mid plane. The thicker the plate is, thelonger the plain segment in Kr/Kr sur � z/a curve is and the closer the Kr/Kr sur � z/a curves are to each other

0.0 0.5 1.0 1.5 2.0 2.5 3.0 3.5 4.0 4.5 5.01.00
1.02
1.04
1.06
1.08
1.10
1.12
1.14
1.16
z/a
B/a =2.0
B/a =5.0 B/a =4.0B/a =3.0
B/a =1.5
B/a =1.0
B/a =0.5
Kε / K
ε su
r
surface
4.5 4.6 4.7 4.8 4.9 5.01.00
1.04
1.08
1.12
1.16
B/a=1.5
B/a=1.0
B/a=0.5
z/a
Kε
/ Kε
sur
Fig. 15. The through-thickness distributions of strain concentration factor normalized by each value of plate surface.
730 Z. Yang et al. / International Journal of Solids and Structures 45 (2008) 713–731
near surface. The Ke/Ke sur � z/a curve is similar to the Kr/Kr sur � z/a curve, shown in Fig. 15. The strain con-centration factor in the influence thickness will increase and tend to a constant value, C6K0, with the plate thick-ness increasing. For the thick plate, the strain concentration factor at the notch root of mid plane will tend to(1 � 2m2/3)K0, when the plate thickness becomes large enough. There is a maximum point of the strain concen-tration factor near the plate surface. The distance from maximum point to surface is about 0.7a for the platewith different thickness that exceeds the transition thickness of strain concentration factor.
In summary, the influence of plate surface on stress field is only in a limited thickness near the surface, butthe variety of deformation near the notch root is very intense in this narrow thickness. The strain and stressdistributions of different thickness plate are very similar near surface. They are influenced by the couple effectof surface and internal three-dimensional constraint. The plate surface influences on strain and stress field ofdifferent thickness plate are almost same, whereas the influences of internal three-dimensional constraints aredependent on the plate thickness. This couple effect in thick plate makes the stress and strain near plate surfacehigher than that near mid plane and on the plate surface. But in the thin plate, the internal three-dimensionalconstraint is weak and the strain and stress distributions are mainly influenced by the surface. The maximumstress and strain are at the notch root of mid plane.
6. Conclusions
In the present article, the elastic stress and strain fields of finite thickness large plate containing a hole sub-jected to uniaxial tension are systematically examined using 3D finite element method. The sensitivity of thestress and strain concentration factor to plate thickness as well as the Poisson’s ratio was examined. By com-parison of 2D fields, some special characters of 3D fields are revealed:
(1) The maximum stress and strain concentration factors do not always occur on the mid plane of the plate.They occur on the mid plane only in thin plates. The location of maximum concentration factor movesaway from the mid plane of plate by increasing plate thickness. The locations of maximum stress andstrain concentration factor are not same in the same thick plate.
(2) The stress concentration factor and the strain concentration factor of the finite thickness plate are dif-ferent even if the plate is in elasticity state. The stress concentration factor is equal to the strain concen-tration factor only at the notch root of plate surface. The stress and strain concentration factors at notchroot of mid plane, maximum point and plate surface are the functions of thickness, which depend on thePoisson’s ratio of plate.
Z. Yang et al. / International Journal of Solids and Structures 45 (2008) 713–731 731
(3) The difference between maximum and surface value of stress concentration factor is a monotonic ascentfunction of thickness, which depends on the Poisson’s ratio of plate. The larger the thickness or Poisson’sratio of plate is, the larger this difference is. This difference relationship of strain concentration factor issimilar to the one of stress concentration factor. But the difference magnitude of stress concentration fac-tor is larger than the one of strain concentration factor in the same plate.
(4) The strain and stress distributions of different thickness plate are very similar near plate surface. Theyare influenced by the couple effect of surface and internal three-dimensional constraint. The plate surfaceinfluences on strain and stress field of different thickness plate are almost same in a limited thickness nearthe surface, whereas the internal three-dimensional constraints of plate are dependent on the plate thick-ness. This couple effect in thick plate makes the stress and strain concentration factor near plate surfacehigher than that near mid plane.
Acknowledgement
This work was supported by Inha University.
References
Bellett, D., Taylor, D., Marco, S., Mazzeo, E., Guillois, J., Pircher, T., 2005. The fatigue behaviour of three-dimensional stressconcentrations. Int. J. Fatigue 27, 207–221.
Berto, F., Lazzarin, P., Wang, C.H., 2004. Three-dimensional elastic distribution of stress and strain energy density ahead of V-shapednotches in plates of arbitrary thickness. Int. J. Fracture 127, 265–282.
Broek, D., 1974. Elementary engineering fracture mechanics, Fourth ed. Nordhoff, Groningen.Creager, M., Paris, P.C., 1967. Elastic field equations for blunt cracks with reference to stress corrosion cracking. Int. J. Fract. Mech. 3,
247–252.Filippi, S., Lazzarin, P., Tovo, R., 2002. Developments of some explicit formulas useful to describe elastic stress fields ahead of notches in
plates. Int. J. Solids Struct. 39, 4543–4565.Folias, E.S., Wang, J.J., 1990. On the three-dimensional stress field around a circular hole in a plate of arbitrary thickness. Comput. Mech.
6, 379–391.Glinka, G., Newport, A., 1987. Universal features of elastic notch-tip stress fields. Int. J. Fatigue 9, 143–150.Gregory, R.D., Wan, F.Y.M., 1988. The interior solution for linear problems of elastic plates. J. Appl. Mech. 55, 551–559.Kane, T.R., Mindlin, R.D., 1956. High frequency extensional vibrations of plates. J. Appl. Mech. 23, 277–283.Kotousov, A., Wang, C.H., 2002. Three-dimensional stress constraint in an elastic plate with a notch. Int. J. Solids Struct. 39, 4311–4326.Krishnaswamy, S., Jin, Z.H., Barta, R.C., 1998. Stress concentration in an elastic Cosserat plate undergoing extensional deformations. J.
Appl. Mech. 65, 66–70.Lazzarin, P., Tovo, R., 1996. A unified approach to the evaluation of linear elastic stress fields in the neighbourhood of cracks and
notches. Int. J. Fract. 78, 3–19.Li, Z.H., Guo, W.L., Kuang, Z.B., 2000. Three-dimensional elastic stress fields near notches in finite thickness plates. Int. J. Solids Struct.
37, 7617–7631.Li, Z.H., Guo, W.L., 2001. Three-dimensional elastic stress fields ahead of blunt V-notches in finite thickness plates. Int. J. Fract. 107, 53–
71.Livieri, P., Nicoletto, G., 2003. Elastoplastic strain concentration factors in finite thickness plates. J. Strain Anal. 38, 31–36.Pilkey, W.D., 1997. Peterson’s Stress Concentration Factors, Second ed. John Wiley and Sons, Inc., New York, USA.She, C.M., Guo, W.L., 2007. Three-dimensional stress concentrations at elliptic holes in elastic isotropic plates subjected to tensile stress.
Int. J. Fatigue 29, 330–335.Shin, C.S., Man, K.C., Wang, C.M., 1994. A practical method to estimate the stress concentration of notches. Int. J. Fatigue 16, 242–256.Sternberg, E., Sadowsky, M.A., Chicago, I.L.L., 1949. Three-dimensional solution for the stress concentration around a circular hole in a
plate of arbitrary thickness. J. Appl. Mech. 16, 27–36.Timoshenko, S., Goodier, J.N., 1970. Theory of Elasticity. McGraw Hill, New York, USA.Young, W.C., Budynas, R.G., 2002. Roark’s Formulas for Stress and Strain, Seventh ed. McGraw-Hill, New York, USA.Yu, P.S., Guo, W.L., She, C.M., Zhao, J.H., 2007. The influence of Poisson’s ratio on thickness-dependent stress concentration at elliptic
holes in elastic plates. Int. J. Fatigue. doi:10.1016/j.ijfatigue.2007.02.007.