The Complex Motor Sprint Start Performance as a Double ...
20
HAL Id: hal-01828714 https://hal-insep.archives-ouvertes.fr/hal-01828714 Submitted on 3 Jul 2018 HAL is a multi-disciplinary open access archive for the deposit and dissemination of sci- entific research documents, whether they are pub- lished or not. The documents may come from teaching and research institutions in France or abroad, or from public or private research centers. L’archive ouverte pluridisciplinaire HAL, est destinée au dépôt et à la diffusion de documents scientifiques de niveau recherche, publiés ou non, émanant des établissements d’enseignement et de recherche français ou étrangers, des laboratoires publics ou privés. The Complex Motor Sprint Start Performance as a Double Constraint Management Françoise Natta, Alexandre Boisnoir, Didier Cholet To cite this version: Françoise Natta, Alexandre Boisnoir, Didier Cholet. The Complex Motor Sprint Start Performance as a Double Constraint Management. Sport Science Review, De Gruyter Open, 2012, 21 (3-4), pp.5-23. 10.2478/v10237-012-0008-4. hal-01828714
Transcript of The Complex Motor Sprint Start Performance as a Double ...

HAL Id: hal-01828714https://hal-insep.archives-ouvertes.fr/hal-01828714
Submitted on 3 Jul 2018
HAL is a multi-disciplinary open accessarchive for the deposit and dissemination of sci-entific research documents, whether they are pub-lished or not. The documents may come fromteaching and research institutions in France orabroad, or from public or private research centers.
L’archive ouverte pluridisciplinaire HAL, estdestinée au dépôt et à la diffusion de documentsscientifiques de niveau recherche, publiés ou non,émanant des établissements d’enseignement et derecherche français ou étrangers, des laboratoirespublics ou privés.
The Complex Motor Sprint Start Performance as aDouble Constraint Management
Françoise Natta, Alexandre Boisnoir, Didier Cholet
To cite this version:Françoise Natta, Alexandre Boisnoir, Didier Cholet. The Complex Motor Sprint Start Performance asa Double Constraint Management. Sport Science Review, De Gruyter Open, 2012, 21 (3-4), pp.5-23.�10.2478/v10237-012-0008-4�. �hal-01828714�

Sport Science Review, vol. XXI, No. 3-4, August 2012
5
The Complex Motor Sprint Start Performance as a Double Constraint Management
Françoise NATTA1 • Alexandre BOISNOIR1,2
Didier CHOLET2
In this study, the sprint start was investigated as a double constraint management: straightening 8 up from the ground to sprint forward.
This management was explored using three separate groups of expertise defined according to individual sprint performance over 100 m (expert, intermediate and non sprinter). Two experimental conditions were studied according to the position in the starting-blocks: a spontaneous condition (S) and a forward perturbed condition (P) which aimed to carry the body weight more on the arms. In S condition, the statistical analyses showed that subjects were split into three classes according to the similarity of the data. These classes were not totally similar to the original groups of differing expertise. Class 1S subjects presented an efficient motor organization in which initial posture, straightening up and velocity were linked. In P condition, the sprinters were only split into two classes and sprint start efficiency was degraded. Nevertheless, the class 1P was perfectly superimposed on the expert group and presented a more homogenous response than that observed in class 1S. The motor synergies of the intermediate level could not be stabilized. This group and the non sprinter group belonged to the same class due to the similarity of their motor structure as the result of the perturbation.
Keywords: biomechanics, motor synergies, postural changes, training
1 Research Service, National Institute of Sport, Expertise and Performance (INSEP), Paris, France2 CETAPS UPRES EA 3832, Faculty of Sports Sciences, University of Rouen, Mont Saint Aignan Cedex, France
DOI: 10.2478/v10237-012-0008-4

Double Constraint in Sprint Start
6
Introduction
The 100-m running sprint is a very short sporting activity that requires multidimensional skills (Van Coppenolle et al., 1990; Delecluse et al., 1995). Therefore, the breakdown of biomechanical factors in the different phases of sprinting is useful because of their critical value to performance (Mero et al., 1992). The first part of the 100-m sprint is the acceleration phase. This phase ends at 36-m for non sprinters (Delecluse, 1997) but may continue up to 70-m for experts (Ae et al., 1992). Prior to this phase is the ejection of athletes from a quadruped static position in the starting blocks: the sprint start. This phase has been investigated in detail in order to propose an optimal start position according to specific biomechanical parameters (Baumann, 1976; Mero, 1988; Mero and Komi, 1990; Jacobs and van Ingen Schenau, 1992; Schot and Knutzen, 1992; Harland and Steele, 1997; Mero et al., 2006). For example, research has shown that the optimisation of both the position of the feet and the centre of mass (CoM) helped increase the force and the power developed by the athlete in the starting position (Mero et al., 1983; Kraan et al., 2001).
From the initial position in the starting-blocks which provides a wide support base when the hands take off the ground, the body weight creates a great forward and downward imbalance, because of the large distance between the feet and the CoM’s vertical projection on the ground. The greater the imbalance, the greater is the necessity for the production of forces to avoid falling. Based on these findings, Natta (1990, 1998) investigated the sprint start as the management by the athlete of a double constraint: running forward with high velocity while straightening up. Findings from analyses of kinematics and dynamics of the CoM, obtained using a large force platform in a population of female athletes demonstrated that this management process varied according to the level of expertise. High level female sprinters increased their potential imbalance as their CoM was placed closer to the hands. These athletes presented a peak of vertical velocity just before ejection from the blocks, whereas non-experts presented a peak of vertical velocity after leaving the hands. A later study by Natta and Réga, (2001) in male populations presented similar results. This investigation analyzed the first few meters of the sprint start and also demonstrated that high level sprinters produced a high forward velocity and a progressive straightening up which was not still complete at the third running step.
In contrast, only a limited amount of studies (Ropret et al., 1998) have investigated the role played by the trunk in the global kinematics of the sprint start. As the trunk corresponds to the major part of the body weight, it plays a major role in the body’s geometric configuration and consequently on global kinematics.
Sport Science Review, vol. XXI, No. 3-4, August 2012
7
The aim of this study was to analyze, using some performance indicators identified as relevant in previous studies, the modalities of motor synergies implemented in leaving the starting-blocks in order to increase efficiency in running velocity. Two hypotheses were proposed: 1) the most efficient motor strategies depend on the level of expertise of the athlete. Only experts seek imbalance and maintain it by a progressive change in the postural configuration of the trunk; 2) the modification of the spontaneous initial posture can be considered as “a forward mechanical perturbation”. The latter might cause instability of motor synergies but also shows the invariants of motor behaviour.
Methods
Fifteen, well-motivated male athletes voluntary participated in the present study after they were informed of the nature and possible inconveniences associated with the protocol. The studied population was divided into three groups: an “expert” group (E) composed of five international level sprinters who trained at least six times a week; an “intermediate” group (I) including five nationally-ranked sprinters who trained at least four times a week; and a “trained” group (T) of five high level competitors in athletic disciplines other than the sprint event. Thus, the main difference between the three experimental groups was the quantity of training undertaken in the sprint running activity. The two sprinter groups had previously demonstrated a chronometric record of 10.54 ± 0.26 s (E) and 11.36 ± 0.14 s (I). Respectively, the characteristics of E, I and T were: age: 25.0 ± 2.2, 27.3 ± 3.7, 24.0 ± 2.5 years; weight: 76.4 ± 5.5, 71.2 ± 7.2, 66.9 ± 12.1 kg; and leg height: 97.1 ± 5.3, 93.4 ± 5.3, 92.4 ± 2.4 cm.
An indoor hall was specifically adapted for the experimental procedures (Boisnoir et al., 2007). The E and I groups carried out a first series of sprint starts in which they adjusted and positioned the starting-blocks according to their habitual methods in competition. This series constituted the spontaneous experimental condition (S). In the T group, the placement of the starting-blocks was based on the relationship between the mean starting-blocks position and the leg length of the E group. The second series of the experimental condition, or perturbed experimental condition (P) was characterized by the modification of the rear block position. The rear block was placed 5% closer to the start line than in the S condition but the same height of the hips was maintained (height was verified through the use of a height gauge). This procedure entailed a forward placement of the CoM and created higher imbalance at time of the hands take off. The purpose of this modification was not explained to the subjects. This higher imbalance can be considered as a forward perturbation to the sprint start.
Double Constraint in Sprint Start
8
After an appropriate warm-up, each subject performed eight 20 m runs at maximum intensity with a complete recovery between efforts. The sprint intensity was verified by the chronometric performance of the effort at 20 m. The digital chronometer (1/1000 s) was triggered by an electric impulse and was stopped by the breaking of a light beam emitted by a flashlight and captured by a photocell.
Three-dimensional kinematic data were obtained from an environment measuring at least 6.0 x 1.5 x 2.0 m by an optoelectronic system (Vicon 612) with six cameras (VCam, 300,000 pixels) at a sampling rate of 200 Hz. Twenty-seven passive skin-markers were placed on each athlete (edge of the eye, edge of the ear canal, acromion, lateral epicondyle, radial styloid, cubital styloid, lateral edge at the 10th rib, iliac crest, greater trochanter, lateral condyle, lateral malleolus, calcaneal tuberosity, 5th metatarsal, on both sides and 7th cervical vertebra). The markers were spherical and the Vicon system searched the centre of the sphere. The origin of the marker coordinates was set at the start line in the extension of the axis of the starting-blocks. An anthropometric model (Zatsiorsky et al., 1990) was applied to calculate the position of the global CoM from the positions of segmental CoMs (head, forearms plus hands, arms, thorax, abdomen, hips, thighs, legs and feet). The raw data consisting of coordinates of markers were low-pass-filtered with a fourth-order Butterworth filter at a cut-off frequency of 50 Hz only for calculate the global CoM coordinates (3D Vision Software).
A synchronization system was developed to build a common identical time base for all the signals recorded by the various pieces of equipment. The system distributes the starting electric impulse towards three devices (1) the chronometer, (2) two loudspeakers emitting a sound signal to provide the starting signal and (3) an analog channel box. All the channels were transferred to the central unit of the Vicon system, which was connected in turn to a PC (Workstation software).
Six variables were chosen as indicators of the double constraint management. The time at the 20 m (t20m) was selected as a chronometric indicator of the intensity of the first phase of sprint running. The horizontal velocity of the CoM at the third ground support phase (VS3) was selected as the indicator of the going-forward component in the double constraint. The investigators chose to retain this support made by the foot pushing on the ground for the first time and not on the starting-block. This choice was made to measure chronometric performance after “block phase”. The angular velocity peak of the trunk (ωP1) calculated from the angular displacement of this body segment in the sagittal plane was selected as the segmental indicator of straightening up. Both initial coordinates of the CoM (yin and zin) in the sagittal plane were selected as variables to represent the set position and the initial potential imbalance. The

Sport Science Review, vol. XXI, No. 3-4, August 2012
9
initial vertical extension in the CoM (∆zn), measured between the initial vertical coordinate of the CoM and the peak value at the end of the block ejection phase were selected as global indicators of the change in postural configuration. These last three variables were normalized to account for anthropometric differences across subjects and groups: ∆zn and zin according to leg length measured from the greater trochanter to the ground (shoes included), yin according to base support length. All variables were positive and analyzed by the Kolmogorov-Smirnov test and all presented a normal distribution (p > .20).
The multidimensional performance structure in the 100 m led us to suppose that the experts might not perform the best in every single phase of the race. We subsequently sought the characteristics of the best sprinters in the start phase. In order to obtain an overall view of profiles of motor synergy profiles and to determine whether they were structured in classes, Principal Component Analysis (PCA)1 was used in conjunction with Hierarchical Ascending Classification (HAC)2.
PCA was employed to determine what organization emerged from the relationships between variables and how athletes were distributed in this organization. The four variables of the study concerning the centre of mass were used as active variables in PCA. This analysis was performed separately for the both experimental conditions. As the PCA factors lead one to suspect the existence of classes, HAC was used to identify these. HAC provided the classes of athletes, according to the proximity of results which could be different from the initial constituted groups, according to performance over 100 meters. In a second stage, it was wise to explore the similarities (and dissimilarities) between individuals by focusing on both results in the spontaneous condition and on results in the perturbed condition according to the hypothesis that the proximities (or distances) between individuals might probably be influenced by the perturbation.
For each condition, other tests performed were: Kendall’s tau coefficients (τ) between the six variables and an Anova (S condition) with Post-Hoc (HSD of Tukey for different N) and a Mann-Whitney U test (P condition).
For both conditions, Wilcoxon tests were performed between same variables for the same subject (paired test).
All statistical tests were performed on the best trial of each athlete according to the time at the third step. Statistical significance was set as p < .05 (Tables 1 and 2).

Double Constraint in Sprint Start
10
Results
Overall, in the S condition, significant relationships were obtained between variables but the adoption of body geometry in the initial position in the best sprinters was not enough to initiate an efficient motor behaviour at the start of movement. Level classes from the sprint start analysis were not in total accordance with the level of expertise groups defined by performing the task.
Table 1. Comparison of classes for straightening up and forward displacement variables in spontaneous condition (S)
Note: yin: initial horizontal coordinate of the centre of mass; zin: initial vertical coordinate of the centre of mass; ∆zn: first extension of the CoM between the initial vertical coordinate of the CoM and the peak value at the end of block ejection; ωP1: trunk rotation velocity peak at the end of block ejection; VS3: horizontal velocity of the CoM at the third step; t20m: chronometric performance at 20 meters; zin and ∆zn values were normalized according to leg length, yin values were normalized according to support base length; SD: standard deviation; Anova: F values in bold were significantly different at p< 0.05.
The significant relationships between variables were analyzed. The Kendall’s tau coefficients presented significant negative relationship between initial extension and vertical initial position of the CoM (Δzn and zin, τ = -0.752; Ζ = -3.91, p < .05). The time at 20 m was significantly and positively linked with the initial coordinate y of the CoM (t20m and yin, τ = 0.440; Ζ = -3.910, p < .05), but also negatively with the velocity at the third step (t20m and VS3, τ = -0.689; Ζ = -3.58, p < .05) and with the velocity in straightening up (t20m and ωP1, τ = -0.402; Ζ = -2.09, p < .05). In addition, the velocity at the third step was significantly and positively linked with the velocity of straightening up (VS3 and ωP1, τ = 0.390; Ζ= 2.03, p < .05). The Class1S reported the shortest chronometric performance at
Class1s Class2s Class3s AnovaMean SD Mean SD Mean SD F
yin (%) 24.6 3.2 26.1 7.3 28.6 5.6 0.491
zin (%) 64.0 5.5 63.2 3.2 65.6 3.5 0.419
Δzn 24.1 3.8 26.1 3.5 23.3 4.0 0.758
ωp1(deg/s) 232.2 51.7 185.3 33.8 151.9 38.9 4.234
VS3(m/s) 5.57 0.11 5.20 0.07 5.01 0.05 56.948
t20m(sec) 3.16 0.08 3.30 0.09 3.40 0.12 6.935
Sport Science Review, vol. XXI, No. 3-4, August 2012
11
20 m, the highest values of speed in the third step, the highest values for speed in straightening up and the vertical projection in the set position closest to the start line (Table 1).
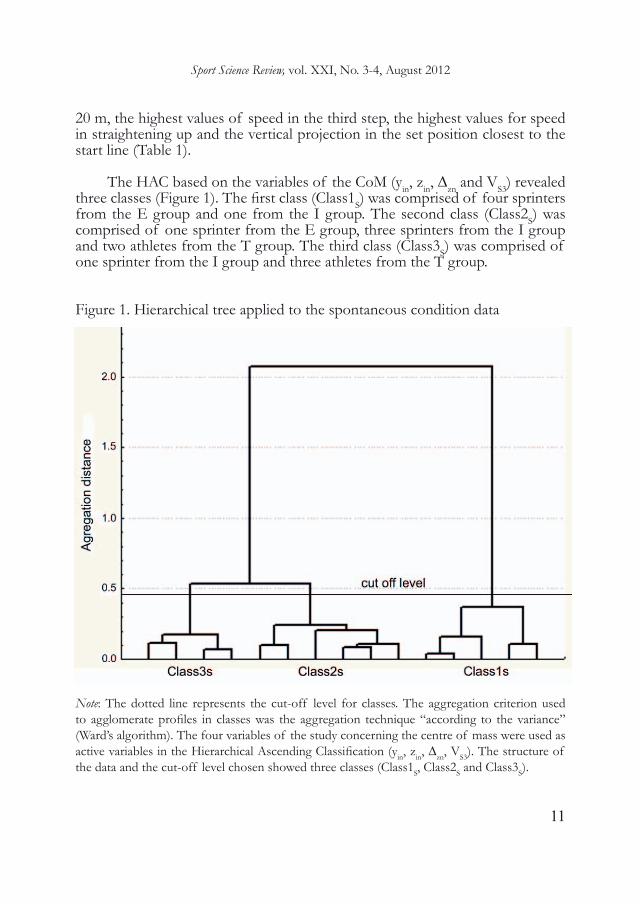
The HAC based on the variables of the CoM (yin, zin, ∆zn and VS3) revealed three classes (Figure 1). The first class (Class1S) was comprised of four sprinters from the E group and one from the I group. The second class (Class2S) was comprised of one sprinter from the E group, three sprinters from the I group and two athletes from the T group. The third class (Class3S) was comprised of one sprinter from the I group and three athletes from the T group.
Figure 1. Hierarchical tree applied to the spontaneous condition data
Note: The dotted line represents the cut-off level for classes. The aggregation criterion used to agglomerate profiles in classes was the aggregation technique “according to the variance” (Ward’s algorithm). The four variables of the study concerning the centre of mass were used as active variables in the Hierarchical Ascending Classification (yin, zin, ∆zn, VS3). The structure of the data and the cut-off level chosen showed three classes (Class1S, Class2S and Class3S).

Double Constraint in Sprint Start
12
The PCA with subjects belonging to all classes (Figure 2) presented two principal components (81.22% of the variance: PC1 = 48.11% and PC2 = 33.11%), the initial extension and the initial coordinate z of the CoM were well represented on PC1 (∆zn: x > 0; zin: x < 0). The initial coordinates y of the CoM and the velocity at the third support were well represented on PC2 (yin: y < 0; VS3: y > 0). The projection of trials and the representation of classes on the principal plan indicated differences in the organization of classes (Figure 2). Subjects in the Class1S were essentially distributed on y > 0 and spread along the x axis and subjects in the Class3S were essentially distributed on y < 0 and x < 0. Finally, subjects belonging to the Class2S were intermediate and distributed along the y and x axes, but a proportion of these subjects was specifically arranged in the y < 0 and x > 0 quadrant.
Figure 2. Correlation circle (left) and factorial map (right) obtained from PCA using the spontaneous condition data
Note: The four variables of the study concerning the centre of mass were used as active variables in the Principal Component Analysis, (yin: initial horizontal coordinate of the centre of mass; zin: initial vertical coordinate of the centre of mass; ∆zn: first extension of the CoM between the initial vertical coordinate of the CoM and the peak value at the end of block ejection; ωP1: rotation velocity peak of trunk at the end of block ejection; VS3: horizontal velocity of the CoM at the third step). PC1: principal component 1 (x axis of the factorial map); PC2: principal component 2 (y axis of the factorial map). Both these components explained 81.22 % of the variance in the spontaneous condition. The graphical representation of individuals on the factorial map shows the best trial per subject.

Sport Science Review, vol. XXI, No. 3-4, August 2012
13
The results from Anova (Table 1) and the Post-Hoc tests confirmed the existence of differences between the classes. Primarily, the velocity at the third step was shown to be significantly different between the three classes, (VS3 5.57 ± 0.11 m/s vs. 5.20 ± 0.07 m/s and 5.01 ± 0.05 m/s). The rise occurred significantly faster in Class1S than in the Class3S (ωP1 232.2 ± 51.7 deg/s vs. 151.9 ± 38.9 deg/s) and the time at 20 meters was shorter in Class1S than in Class3S (t20m 3.160 ± 0.079 sec vs. 3.394 ± 0.117 sec).
In the P condition, the results demonstrated that the motor organizations previously underlined in the S condition, did not resist during the perturbation. The perturbation adaptation could contribute to the understanding of elements about the modality passage across one level of motor ability acquisition to another. The aim of the second experimental condition was to increase the potential imbalance (displace the CoM closer to the start line). The Wilcoxon test used to test for differences between both conditions, confirmed that the forward displacement of the rear block allowed all the athletes to significantly advance their CoM without raising height: yin: S = 26.2 ± 5.6% vs. P = 24.9 ± 5.3%, t = 2.31, p < .05; zin: S = 64.1 ± 4.0% vs. P = 63.8 ± 5.1%, t = 0.54, p > .05. These results in the P condition confirmed that a higher potential imbalance than in the S condition with the present experimental protocol was a reasonable assumption.
The HAC with the best trial revealed two classes in the P condition. Class1P comprised the five high level sprinters and Class2P was made up of all subjects from the I and T groups (Figure 3). The relationship between all variables in the best trial for all subjects showed that the velocity at the third step was not related to the other variables, in contrast to the observation in the S condition. One coefficient was significantly negative between initial extension and vertical initial position of the CoM (Δzn and zin, τ = -0.619; Ζ = -3.217, p < .05). The significant relationships between yin or ωP1 and other variables did not exist as observed in the S condition. In the P condition, the relationships between variables were almost non-existent.

Double Constraint in Sprint Start
14
Figure 3. Hierarchical tree applied to the perturbed condition data
Note: The dotted line represents the cut-off level for classes. The aggregation criterion used to agglomerate profiles in classes was the aggregation technique “according to the variance” (Ward’s algorithm). The four variables of the study concerning the centre of mass were used as active variables in the Hierarchical Ascending Classification (yin, zin, ∆zn, VS3). The structure of the data and the cut-off level chosen showed two classes (Class1P, Class2P).
A PCA with subjects from both classes was conducted to determine the modifications brought about by the perturbation. This PCA presented two principal components (80.26% of the variance: PC1 = 50.58% and PC2 = 29.68%). The initial extension and initial coordinate z of the CoM were well represented on PC1 (∆zn: x > 0; zin; x < 0) and the initial coordinate y of the CoM was well represented on PC2 (yin; y < 0). While this configuration of variables was quite similar to that in the S condition, the projection of subjects and the representation of classes demonstrated differences in organization (Figure 4). Subjects in the Class1P were totally present in the y > 0 and x > 0 quadrant, whereas subjects in the Class2P were distributed along PC1 and PC2

Sport Science Review, vol. XXI, No. 3-4, August 2012
15
essentially on y < 0. This division was arranged according to two variables: the velocity at the third step and the initial coordinate y of the CoM. This geometric representation also indicated that the distribution of trials in the Class1P was more homogenous than that in the Class2P.
Figure 4. Correlation circle (left) and factorial map (right) obtained from PCA using the perturbed condition data
Note: The four variables of the study concerning the centre of mass were used as active variables in the Principal Component Analysis, (yin: initial horizontal coordinate of the centre of mass; zin: initial vertical coordinate of the centre of mass; ∆zn: first extension of the CoM between the initial vertical coordinate of the CoM and the peak value at the end of block ejection; ωP1: rotation velocity peak of trunk at the end of block ejection; VS3: horizontal velocity of the CoM at the third step). PC1: principal component 1 (x axis of the factorial map); PC2: principal component 2 (y axis of the factorial map). Both these components explained 80.26 % of the variance in the perturbed condition. The graphical representation of individuals on the factorial map shows the best trial per subject.
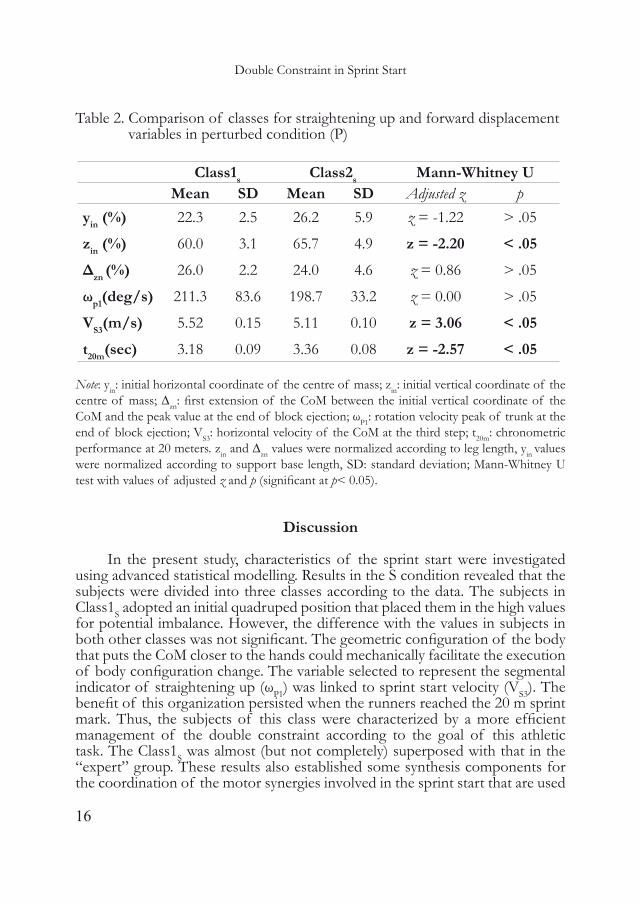
Results from the Mann-Whitney U test analyses confirmed statistical differences between the classes (Table 2). Class1P presented a significantly higher velocity and improved performance (VS3 and t20m) than Class2P. However, the Class1P also presented an initial position that was lower than in Class2P (zin). Nevertheless, the other variables were not significantly different between the two classes.
Double Constraint in Sprint Start
16
Table 2. Comparison of classes for straightening up and forward displacement variables in perturbed condition (P)
Note: yin: initial horizontal coordinate of the centre of mass; zin: initial vertical coordinate of the centre of mass; ∆zn: first extension of the CoM between the initial vertical coordinate of the CoM and the peak value at the end of block ejection; ωP1: rotation velocity peak of trunk at the end of block ejection; VS3: horizontal velocity of the CoM at the third step; t20m: chronometric performance at 20 meters. zin and ∆zn values were normalized according to leg length, yin values were normalized according to support base length, SD: standard deviation; Mann-Whitney U test with values of adjusted z and p (significant at p< 0.05).
Discussion
In the present study, characteristics of the sprint start were investigated using advanced statistical modelling. Results in the S condition revealed that the subjects were divided into three classes according to the data. The subjects in Class1S adopted an initial quadruped position that placed them in the high values for potential imbalance. However, the difference with the values in subjects in both other classes was not significant. The geometric configuration of the body that puts the CoM closer to the hands could mechanically facilitate the execution of body configuration change. The variable selected to represent the segmental indicator of straightening up (ωP1) was linked to sprint start velocity (VS3). The benefit of this organization persisted when the runners reached the 20 m sprint mark. Thus, the subjects of this class were characterized by a more efficient management of the double constraint according to the goal of this athletic task. The Class1S was almost (but not completely) superposed with that in the “expert” group. These results also established some synthesis components for the coordination of the motor synergies involved in the sprint start that are used
Class1s Class2s Mann-Whitney UMean SD Mean SD Adjusted z p
yin (%) 22.3 2.5 26.2 5.9 z = -1.22 > .05
zin (%) 60.0 3.1 65.7 4.9 z = -2.20 < .05
Δzn (%) 26.0 2.2 24.0 4.6 z = 0.86 > .05
ωp1(deg/s) 211.3 83.6 198.7 33.2 z = 0.00 > .05
VS3(m/s) 5.52 0.15 5.11 0.10 z = 3.06 < .05
t20m(sec) 3.18 0.09 3.36 0.08 z = -2.57 < .05

Sport Science Review, vol. XXI, No. 3-4, August 2012
17
by the best sprinters over 20 meters. These synergies were characterized by a moderate global extension (vertical amplitude) but a fast executed straightening up (peak angular velocity of the trunk) and a rapid forward displacement. This motor organization could be initiated by a specific ‘set’ placement of the CoM. These results are in accordance with previous observations (Natta et al. 1990, 2001) which showed that initial parameters must be controlled to perform an efficient sprint start.
The subjects in Class3S (mostly made up of athletes not specialised in sprint running) presented lower values for rotation velocity of the trunk and for horizontal velocity at the third step (VS3). Moreover, this class adopted an initial posture with a CoM placed in more backwards position compared to that of Class1S (but this result was not significantly different). Therefore, the potential imbalance was perhaps less than that observed in Class1S. But afterward this class demonstrated the same extension values as those observed in Class1S. Thus, we supposed that the athletes in Class3S and in Class1S had not more difficulty in managing their respective potential imbalance. In this class 3, the double constraint of the sprint start was essentially managed: first, to ensure general body balance and; second, to carry out the main task: which was sprinting maximally running. The athletes in this class did not rely on imbalance to increase their start velocity. The observed motor behaviour of Class2S could be characterized as being midway between those of the two other classes. The body configuration in the initial position of this class was similar to that of Class1S. However, subjects belonging to Class2S was placed in the high values of extension amplitude in the PCA and in the lower values of velocity rotation of the trunk (but not significantly different) compared to the Class1S subjects. Therefore, Class2S subjects could not exploit their potential imbalance and their response to the double constraint presented the same characteristics as observed in Class3S with the aim of achieving more stable balance.
However, a larger number of subjects would probably have increased classical statistical power of the results.
Finally, in the sprint start, only the subjects in Class1S were able to simultaneously integrate the characteristics of the initial posture, straightening up and velocity into their motor behaviour in an effective way. Therefore, only these subjects could control the response of the double constraint in a parallel management.
In the perturbation experimental condition (P), the subjects were split into only two classes based on the HAC results. No relationship was observed between the velocity indicator and the other variables. This result indicated that

Double Constraint in Sprint Start
18
even the Class1P subjects did not succeed in achieving an efficient biomechanical organization of the sprint start. From these results, we may suggest that in the perturbed experimental condition the percentage of body weight carried by the hands was probably close to the biomechanical limits of the system at the moment of this study. Thus, these sprinters could not immediately modify their motor program to exploit this new imbalance and searched a means of compensating for this element of performance. The perturbation might be centrally analyzed as a danger to body balance (Massion, 1998). In response to this perturbation, other kinematic strategies were made available, for example, an erect posture which could be more important since the sprinters had left the starting-blocks. The sprinters in Class1P adopted an initial posture that placed their CoM closer to the ground. This difference in posture probably limited the increase in the imbalance. However, the subjects belonging to the Class1P who were discriminated by similar motor behaviour adaptations when responding to the perturbation were high level sprinters. Therefore, Class1P and the high expertise group were perfectly superposed and so much so that results revealed that the motor organization of this class was more homogenous than the other class and even more homogenous than classes in the S condition. This finding seems to confirm that adaptation modalities to new postural configurations are dependant on the level of expertise and motor experience of the athlete (Bonnet et al., 1981). The high level sprinters, who presented stable and efficient management in the velocity gain in the S condition, were perturbed by the postural modification and sought to stabilise body movement (Vernazza et al., 1996; Mihelj et al., 2000).
The Class2P, which was constituted of all the subjects from both the intermediate and the trained groups, presented sprint behaviour similar to that of peers in Class3S which included trained subjects. Overall, intermediate subjects therefore adopted the same motor behaviour as the trained subjects. The following suggestion can be advanced: for the trained group, the biomechanical constraints may have already been disturbed in the sprint start of the S condition and so in the P condition, the system did not undergo further perturbation. However, these results showed that the intermediate group was the most sensitive to the perturbation. The motor behaviour in these subjects seemed more unstable. Thus, another theory may be advanced to explain the findings in this group: the perturbation imposed by the protocol may have created such great biomechanical constraints that these exceed the “posturo-kinetic capacity” (Bouisset and Zattara, 1992). Indeed, in this group, the ability to manage the perturbation to balance associated with the forthcoming movement was decreased (Bouisset and Le Bozec, 2002). The only relationship that remained significant for all subjects in both conditions was between the initial vertical position of CoM and its elevation at the end of the block ejection phase. This relation was

Sport Science Review, vol. XXI, No. 3-4, August 2012
19
negative and could be an invariant of motor synergies implemented in the sprint start. It can be hypothesized that the goal of this motor organization was to maintain the same direction of the velocity vector at ejection from the blocks.
Previous studies have shown that motor patterns depend on the initial conditions of the movement (Crenna and Frigo, 1991). In the present study, motor behaviour seemed to be stabilized and efficient according to the level of expertise, but the change in the initial conditions of movement altered this efficiency. These results are in accordance with those observed in studies on other athletic movements (Bonnet et al., 1981; Lepers et al., 1999). However, the present experimental protocol did not allow us to determine whether adaptations in motor organization would be observed after a training session specifically designed to prepare the athletes for the forward displacement of the centre of mass.
Implications
For an optimal and high-performance sprint start construction, coaches would not only have to examine the measurement of the chronometric time but would also have to focus on the acquisition by athletes of a parallel management of the double constraint. The successive modifications must be introduced after the control of the parallel management. Thus, coaches must obtain gradually more imbalance in the initial position but, without increasing the extension of the trunk and without loss of velocity in the first meters. Specific upper body training should be made in order: 1) to carry more weight on the arms; 2) to push on the ground using a greater percentage of body weight on the hands; 3) to accelerate the rotation of the trunk and 4) to maintain the trunk tilted.
At the same time, coaches must ensure that the other sprint phases (between 20 m and 100 m) are not affected. Indeed, the multidimensional structure of performance in sprint events requires sprinters to efficiently maintain all necessary skills for optimum performance.
Conclusion
The present study on three standards of athletic populations has shown that only a high-standard group was able to manage jointly and in an efficient way, the double constraint that is intrinsic to the sprint start. The intermediate level sprinter population seemed to dissociate motor responses (straightening up and going forward) in the same way as a population of non-experts, though this intermediate population level adopted an initial posture configuration closer to that of the expert sprinters. Thus, this group could not structure the change in the posture configuration in relation to seeking forward displacement velocity.

Double Constraint in Sprint Start
20
In the presence of a perturbation, a modification of the initial conditions demonstrated a non stability of the motor program in the intermediate level which subsequently would present some characteristics similar to the lower level behaviour. On the other hand, for the expert level, if this perturbation produced an adaptation that was not immediately efficient, the adopted motor responses seemed to be homogeneous and specific to this level. Some populations and even high level sprinters in some conditions seem to be able to efficiently manage a high imbalance. In order to further our understanding of the reasons behind these findings, it would also be necessary to evaluate the capacity of the athlete to produce forces, principally in the lower limbs. In a future study, the present findings should be completed by tests performed on several force platforms in order to calculate the effective torque imbalance. In addition, a larger number of subjects would probably have increased statistical difference. However, the present statistical tests using multivariate exploratory techniques employed have led to the emergence of patterns of motor synergies that are specific to each group and to expertise in the start phase.
Endnotes
1. The Principal Component Analysis (PCA) is a multifactor statistical method used to summarize information provided by a large number of numerical variables. It allows reducing the number of dimensions in order to have a geometric representation of data. This geometric representation transforms statistical proximity between elements in Euclidean distances. In this study, we tried to assess the similarity of individuals: the more two individuals are similar, the more their values for all the variables are similar. We also tried to evaluate the relationships between the variables. In PCA, the link between two variables is measured by the linear correlation coefficient, r. It can substitute the initial variables by linear combinations of these variables: the “Principal Component” (PC). A PC can be regarded as representative of a group of interrelated variables. For interpretation, we examined axis by axis to define the principal components. Examination of the factorial map allows the displaying of the correlations between variables and identifying groups of individuals who obtained the same values for the same variables. Circle of correlations: in space, the variables significantly correlated with axis will contribute to the definition of that axis. This correlation reads directly on the graph as it is the coordinate of point-variable on the axis. It looks therefore to the variables with the highest coordinates (which is close to the circle of correlations) and we interpreted the principal components based on certain combinations of these variables and the opposition with others. Place and importance of individuals: if the points-individuals are not anonymous the study looks at those involved in the formation of axes. Individuals who contribute most to the determination of the axis are the most eccentric and examination of factorial coordinates or simply reading the graph to interpret the factors in this case. The graphical representation of individuals on the factorial map allows to assess their distribution and to identify areas of densities more or less strong.
2. Using the Hierarchical Ascending Classification (HAC) is based on the hypothesis of the existence of subsets of homogeneous individuals. The division into groups takes place from the structure of

Sport Science Review, vol. XXI, No. 3-4, August 2012
21
the data. This requires determining: a) the variables that will form the basis for the formation of groups; b) The measure of distance between profiles. The distance chosen for our analysis is the squared Euclidean distance; c) The aggregation criterion used to agglomerate profiles in groups. The aggregation technique “according to the variance” (Ward’s algorithm) appears most interesting by the compatibility of results with some factor analysis (which the Principal Component Analysis). The principle of the algorithm is to create at each step, a partition obtained by aggregating two by two the elements closest. The algorithm does not partition into q classes of a set of I individuals, but a hierarchy of partitions, is the form of trees and container I-1 partitions. The interest of these trees is that they can give an idea of how many classes actually exist in the population. Each cut of a tree provides a partition, with even less classes and classes less homogeneous than is cut above.
Bibliography
Ae, M., Ito, A., & Suzuki, M. (1992). The men’s 100 metres. IAAF quaterly, 7, 47-52.
Baumann, W. (1976). Kinematic and dynamic characteristics of sprint start. In P. V. Komi, (ed.), Biomechanics V-B (pp. 194-199). Baltimore: University Park Press.
Boisnoir, A., Decker, L., Reine, B., & Natta, F. (2007). Validation of an integrated experimental set-up for kinetic and kinematic three-dimensional analyses in a training environment. Sports Biomechanics, 6, 215-223.
Bonnet, M., Requin, J., & Semjen, A. (1981). Human reflexology and motor preparation. Exercice and Sport Sciences Revews, 9, 119-157.
Bouisset, S. & Zattara, M. (1992). Intentional movement as a perturbation tobalance and posturo-kinetic capacity. In A. Pedotti, & M. Ferrarin, (eds), Restoration of walking for paraplegics. Recent advancements and Trends (pp. 75-81). Milano: Pro Juventute pub.
Bousset, S. & Le Bozec, S. (2002). Posturo-kinetic capacity and postural function in volontary movements. In M. L. Latash (ed). Progress in motor control: Structure-function, relations in voluntary movements (pp. 25-52). Human Kinetics.
Breniere, Y., & Do, M. C. (1986). When and how does steady state gait movement induced from upright posture begin? Journal of Biomechanics, 19, 1035-1040.
Breniere, Y., & Do, M. C. (1991). Control of gait initiation. Journal of motor behaviour, 24, 235-240.
Crenna, P., & Frigo, C. (1991). A motor programme for the initiation of forward-oriented movements in humans. Journal of Physiology, 437, 635-653.

Double Constraint in Sprint Start
22
Delecluse, C., van Coppenolle, H., Willems, E., Diels, R., Goris, M., van Leemputte, M. & Vuylsteke, M. (1995). Analysis of 100 meter sprint performance as a multidimensional skill. Journal of Human Movement Studies, 28, 87-101.
Delecluse, C. (1997). Influence of strength training on sprint running performan-ce. Current findings and implications for training. Sports Medicine, 24, 147-156.
Harland, M. J., & Steele, J. R. (1997). Biomechanics of the sprint start. Sports Medicine, 23, 11-20.
Jacobs, R., & van Ingen Schenau, G. J. (1992). Intermuscular coordination in a sprint push-off. Journal of Biomechanics, 25, 953-965.
Kraan, G. A., van Veen, J., Snijders, C. J., & Storm, J. (2001). Starting from standing; why step backwards? Journal of Biomechanics, 34, 211-215.
Lepers, R., Breniere, Y., & Maton, B. (1999). Changes to the gait initiation programme following a running exercise in human subjects. Neuroscience Letters, 260, 69-73.
Massion, J. (1998). Postural Control Systems in Developmental Perspective. Neuroscience & Biobehavioral Reviews, 22, 465-472.
Mero, A., Luhtanen, P., & Komi, P. V. (1983). A biomechanical study of the sprint start. Scandinavian Journal of Medicine and Science in Sport, 5, 20-28.
Mero, A. (1988). Force-time characteristics and running velocity of male sprinters during the acceleration phase of sprinting. Research Quarterly for Exercise and Sport, 59, 94-98.
Mero, A., & Komi, P. V. (1990). Reaction time and electromyographic activity during a sprint start. European Journal of Applied Physiology and Occupational Physiology, 61, 73-80.
Mero, A., Komi, P. V., & Gregor, R. J. (1992). Biomechanics of sprint running. A review. Sports Medicine, 13, 376-392.
Mero, A., Kuitunen, S., Harland, M., Kyrolainen, H., & Komi, P. V. (2006). Effects of muscle-tendon length on joint moment and power during sprint starts. Journal of Sports Sciences, 24, 165-173.
Sport Science Review, vol. XXI, No. 3-4, August 2012
23
Mihelj, M., Matjacic, Z., & Bajd, T. (2000). Postural activity of constrained subject in response to disturbance in sagittal plane. Gait & Posture, 12, 94-104.
Natta, F., & Brenière, Y. (1998). Influence de la posture initiale dans le départ de sprint en starting-blocks. Science et Motricité, 34, 44-51.
Natta, F. (1990). Effets de la posture initiale sur l’initiation de la course: recherche d’une position optimale pour le départ du sprint. Unpublished PhD’s thesis, University of Paris-sud Orsay, France.
Natta, F., & Réga, C. (2001). Analyse cinétique et cinématique du départ en starting-blockset de la foulée de course à pleine vitesse. Rapport de recherche Ministère de la Jeunesse et des Sports. Paris: Institut National du Sport et de l’Education Physique, Département des Sciences du Sport.
Ropret, R., Kukolj, M., Ugarkovic, D., Matavulj, D., & Jaric, S. (1998). Effects of arm and leg loading on sprint performance. European Journal of Applied Physiology and Occupational Physiology, 77, 547-550.
Schot, P. K., & Knutzen, K. M. (1992). A biomechanical analysis of four sprint start positions. Reseach Quarterly for Exercise and Sport, 63, 137-147.
Vernazza, S., Alexandrov, A., & Massion, J. (1996). Is the centre of gravity controlled during upper trunk movements? Neuroscience Letters, 206, 77-80.
Van Coppenolle, H., Delecluse, C., Goris, M., & Diels, R. (1990). Evaluation of the start and sprint action. In G. P. Brüggeman & J. K. Rühl (eds.). Techniques in athletics (pp. 396-401). Cologne: Sporthochschüle.
Zatsiorsky, V., Seluyanov, V., & Chugunova, L. (1990). In vivo body segment inertial parameters determination using a gamma-scanner method. In N. Berne & A. Cappozzo (eds). Biomechanics of human movement: application in rehabilitation, sports and ergonomics (pp. 186-202). Worthington: Bertec Corporation.
Corresponding author: Francoise NATTA, PhD, is a full-time researcher at the Laboratory of Movement Action and Performance within the National Institute for Sport, Expertise and Performance, Paris, France since 1995. She can be contacted at: [email protected]