The Complete Guide to Sales Force Incentive Compensation
511
-
Upload
deirdre100 -
Category
Recruiting & HR
-
view
192 -
download
3
Transcript of The Complete Guide to Sales Force Incentive Compensation
The Complete Guide to
Sales ForceIncentive
CompensationHow to Design and
Implement Plans That Work
Andris A. Zoltners,Prabhakant Sinha,
and Sally E. Lorimer
American Management AssociationNew York • Atlanta • Brussels • Chicago • Mexico City • San Francisco
Shanghai • Tokyo • Toronto • Washington, D.C.
PAGE i................. 15869$ $$FM 05-19-06 09:21:47 PS
Special discounts on bulk quantities of AMACOM books areavailable to corporations, professional associations, and otherorganizations. For details, contact Special Sales Department,AMACOM, a division of American Management Association,1601 Broadway, New York, NY 10019.Tel.: 212-903-8316. Fax: 212-903-8083.Website: www.amacombooks.org
This publication is designed to provide accurate and authoritativeinformation in regard to the subject matter covered. It is sold withthe understanding that the publisher is not engaged in renderinglegal, accounting, or other professional service. If legal advice or otherexpert assistance is required, the services of a competent professionalperson should be sought.
Library of Congress Cataloging-in-Publication Data
Zoltners, Andris A.The complete guide to sales force incentive compensation : how to design and
implement plans that work / Andris A. Zoltners, Prabhakant Sinha, and Sally E. Lorimer.p. cm.
Includes index.ISBN-10: 0-8144-7324-5ISBN-13: 978-0-8144-7324-51. Sales personnel—Salaries, etc. 2. Incentives in industry.
3. Compensation management. I. Sinha, Prabhakant. II. Lorimer, Sally E. III. Title.
HF5439.7.Z65 2006658.3�2—dc22
2006012201
� 2006 Andris A. Zoltners, Prabhakant Sinha, and Sally E. Lorimer.All rights reserved.Printed in the United States of America.
This publication may not be reproduced,stored in a retrieval system,or transmitted in whole or in part,in any form or by any means, electronic,mechanical, photocopying, recording, or otherwise,without the prior written permission of AMACOM,a division of American Management Association,1601 Broadway, New York, NY 10019.
Printing number
10 9 8 7 6 5 4 3 2 1
PAGE ii................. 15869$ $$FM 05-19-06 09:21:48 PS

To Linda, Sally, and Prabha, who make writingbooks easy and enjoyable.
—AZ
To Joe Balintfy, my teacher and mentor,who taught me to always keep learning.
—PS
To my husband, Al Cotrone, and our children,Jamie and Jack, with love.
—SL
PAGE iii................. 15869$ $$FM 05-19-06 09:21:48 PS

This page intentionally left blank
Contents
Preface viiiAcknowledgments xi
Chapter 1 Sales Force Incentive Compensation and the SuccessfulSales Organization
Introduction 2The Drivers of Sales Force Compensation Change 12The Sales Force Compensation Challenge 17The Sales Management System 19The Role of Incentive Compensation Within the Sales
Management System 23Diagnosing Sales Force Issues 29How This Book Is Organized 32
Chapter 2 Reviewing a Current Incentive Compensation Plan andSetting Objectives for a New Plan
Introduction 40Is It Really an Incentive Compensation Plan Problem? 41An Overview of a Sales Incentive Plan Assessment Process 44Assessment of Current Sales Compensation Plan Consequences 45Assessment of Current Sales Compensation Plan Consistency and
Compatibility 76Developing New Plan Objectives 83
PAGE v
v
................. 15869$ CNTS 05-19-06 09:21:54 PS
vi Contents
Chapter 3 Plan Design FundamentalsIntroduction 93Sales Compensation Plan Design Terminology 94
Chapter 4 Plan Design Part 1: Determining the Correct Pay LevelIs Your Sales Force Pay Level Correct? 108The Range of Sales Force Pay Levels 112How to Determine the Right Sales Force Pay Level 115Conclusion 137
Chapter 5 Plan Design Part 2: Finding the Best Salary–IncentiveMix
Introduction 141Do You Have the Right Pay Mix? 143The Range of Salary–Incentive Mix 151How to Determine the Right Salary–Incentive Mix 160A Pay Mix Scorecard 179
Chapter 6 Plan Design Part 3: Selecting Performance MeasuresAre You Using the Most Appropriate Performance Measures to
Determine Your Incentive Plan Payout? 184Types of Measures 187How to Determine the Most Appropriate Sales Incentive
Measures: An Advisory 192How to Determine the Most Appropriate Sales Incentive
Measures: Specifics 198
Chapter 7 Plan Design Part 4: Determining the RightPerformance–Payout Relationship
Introduction 226Is the Most Appropriate Performance—Payout Relationship
Used for Determining the Incentive Plan Payout? 227Representing Performance—Payout Relationships 228Decision 1: Bonus Plan or Commission Plan? 231Decision 2: Progressive or Regressive Plan? 237Decision 3: Caps or No Caps? 243Decision 4: Pay from the First Dollar or from Goal or a Fraction
of Goal? 245Decision 5: Single Measure or Multiple Measures? 251Concluding Insights 261
Chapter 8 Evaluating Proposed Sales Incentive CompensationPlan Alternatives and Selecting a New Plan
Introduction 265An Overview of Candidate Sales Compensation Plan Assessment 267
PAGE vi................. 15869$ CNTS 05-19-06 09:21:55 PS
viiContents
Quantitative Assessment of a Candidate Sales Compensation Plan 271Qualitative Assessment of a Candidate Sales Compensation Plan 295Future-Proofing Assessment of a Candidate Sales Compensation
Plan 306Conclusion: From Objectives to Reality 308
Chapter 9 Setting Effective Goals and ObjectivesIntroduction 313Are Your Sales Force Goals Appropriate? 314Types of Goals 327How to Set Effective Sales Force Goals: a Five Step Process 330Tracking Performance Against Goals 369Goal-Setting Recommendations 372Concluding Insights 375
Chapter 10 Increasing Sales Force Motivation Through SalesContests, SPIFFs, and Recognition Programs
Introduction 378Sales Contests and SPIFFS 380Recognition Programs 403Insights 407
Chapter 11 Making an Effective Transition with a MajorIncentive Compensation Plan Change
Introduction 410Sales Incentive Compensation Plan Change and the Sales
Management System 415Challenging Sales Incentive Compensation Plan Transitions 421A Sales Force Change Process Framework 435
Chapter 12 Incentive Compensation Plan AdministrationIntroduction 454Is the Incentive Compensation Plan Administered Well? 458IC Plan Administration Systems and Processes 461How to Design an Effective IC Plan Administration System 476Summary 489
Index 491About the Authors 000
PAGE vii................. 15869$ CNTS 05-19-06 09:21:55 PS
Preface
The use of incentives for effective sales force management is a two-edged sword.On the one side, the right incentive plan can inspire and energize a sales force towork hard to achieve challenging goals. Incentives provide salespeople, who oftenface rejection, with the motivation to keep going and to perform the difficultwork of finding new accounts and closing sales. They also set expectations forsalespeople of what is important to the company. Incentives help to hold sales-people, who often work alone and unsupervised, accountable for results. They area powerful recognition of a sales force’s efforts. Incentives are an important meansthrough which many firms reinforce a sales-oriented culture and attract high-performing achievers to the sales job. Paying for performance helps a companyhire and retain salespeople who are highly motivated to do what it takes to drivecompany results.
On the other side, incentives also create many sales force management chal-lenges. Incentives can inspire mercenary, greedy sales force behaviors that createshort-term sales, but conflict with long-term company success. Incentives can ac-tually reduce motivation and lead to turnover among salespeople who feel thatthey are not getting as much incentive money as they deserve or who feel thatothers who are performing worse are making more money. Incentives also limitsales force flexibility and reduce management’s ability to control the sales forcethrough means other than money. Sales strategy changes (such as changes incustomer responsibilities, product emphasis, or selling activity focus) that are inthe company’s best interest may meet resistance from salespeople, if they feel thatthe changes will reduce their personal income. Other company employees mayfeel that sales force incentives are excessive, thereby hindering teamwork amongdepartments and compromising customer relationships. Finally, sales incentive
PAGE viii
viii
................. 15869$ PREF 05-19-06 09:22:00 PS
ixPreface
programs can be costly to manage, requiring considerable investment in internalsupport systems and people and/or substantial fees paid to consultants.
The Complete Guide to Sales Force Incentive Compensation: How to Design andImplement Plans That Work was written to help firms harvest the positive aspectsand eliminate or mitigate the negative consequences of using incentive compensa-tion as a means of motivating salespeople. The right incentive plan, when imple-mented effectively, can help a firm attract and retain the best salespeople and canmotivate the sales force to engage in activities and behaviors that drive sales suc-cess. On the other hand, the wrong plan or a good plan that is implementedpoorly has the potential to do considerable harm. Salespeople may feel discour-aged and let down. The best sales candidates may not join the company, goodsalespeople may leave, the sales force may not be motivated to work hard or spendtime effectively, relationships with customers may suffer, and sales performancemay fail to reach company expectations. With an ineffective incentive plan, theconsiderable money spent on incentives generates very low incremental sales.
Our goal in writing The Complete Guide to Sales Force Incentive Compensation:How to Design and Implement Plans That Work is to create a comprehensive andhighly practical book that is unique within the compensation literature. Kash Ran-gan, Malcolm McNair Professor of Marketing at the Harvard Business School,sums up the book’s contribution when he writes:
‘‘This third book in the remarkable series on sales force management providesa strategic overview as well as an in-depth guide to the subject of incentivecompensation for the sales force. The book is brilliantly architected alongthree important dimensions for the reader. First is the strategic overview fortop management provided by a compelling 3-Cs framework, which serves asthe platform within which each of the twelve chapters fits. Second is the in-depth treatment of the design issues in the first half of the book. Each chapteris illustrated with problems faced by managers in a wide range of industries.The examples are crisp and the accompanying figures and descriptions makethe problems come alive. The proposed solutions are nuanced and rich indetail, reflecting the deep expertise of the authors on the topic. Finally, in thelast several chapters, the authors provide many practical tips and a wealth ofadvice on implementation issues. If your firm has significant sales force activ-ity, this book is not just a ‘must read,’ it is a ‘must act upon’ if you want toimprove your bottom line.’’
The book is designed as a sourcebook for sales, marketing, finance, andhuman resource managers and executives—anyone who is responsible for design-ing, implementing, and/or administering a sales incentive compensation plan. Wedraw on our extensive experience consulting with companies on a wide range ofstrategic and tactical sales force issues to position sales compensation effectively asone component of a successful sales management system and advising how toavoid the common trap of using changes in the incentive plan to fix problems thatoriginate elsewhere within the sales management system. We use hundreds of
PAGE ix................. 15869$ PREF 05-19-06 09:22:00 PS
x Preface
examples and illustrations to transform complex and elusive concepts into easy-to-understand and practical ideas. We present concepts in considerable detail sothat new ideas can be immediately applied by compensation plan designers. Wedescribe numerous innovative approaches and metrics for measuring how effectivethe current sales compensation program has been and how effective alternativenew incentive plans are likely to be if they are implemented. We emphasize imple-mentation by sharing practical ideas for successfully making the transition to anew incentive compensation plan, for establishing efficient and effective incentivecompensation plan management systems and processes, and for setting effectiveterritory-level goals.
The Complete Guide to Sales Force Incentive Compensation: How to Design andImplement Plans That Work is part of a series of sales management referencebooks. The first book in the series, entitled The Complete Guide to AcceleratingSales Force Performance (AMACOM Books, American Management Association,2001), presents innovative, yet practical ideas for improving sales force productiv-ity in all areas of sales management, including sales force assessment, sizing, struc-turing, territory design, recruiting, training, first-line management, motivation,compensation, goal setting, precision selling, customer relationship management,performance management, and culture. Subsequent books in the series explorespecific areas of sales management in greater detail. The second book, entitledSales Force Design for Strategic Advantage (Palgrave/Macmillan, 2004), focuseson strategic issues of sales force planning and management, including sales strat-egy, go-to-market strategy, sales force structure and roles, sales force size, salesterritory alignment, and sales force assessment and implementation. This thirdbook in the series, entitled The Complete Guide to Sales Force Incentive Compensa-tion: How to Design and Implement Plans That Work (AMACOM Books, AmericanManagement Association, 2006), focuses on sales force incentive compensation.
How the Book Is Organized
The Complete Guide to Sales Force Incentive Compensation: How to Design andImplement Plans That Work emphasizes four main themes:
• The role of incentives within the context of the sales management system(Chapter 1)
• Techniques and analytical methods for effective incentive compensationplan assessment (Chapters 2 and 8)
• Frameworks and approaches that enable successful incentive compensa-tion plan design (Chapters 3, 4, 5, 6, 7, 9 and 10)
• Approaches for successful incentive plan implementation (Chapters 11 and12)
A road map illustrating these themes is provided in Figure 1-10 at the end ofChapter 1.
PAGE x................. 15869$ PREF 05-19-06 09:22:01 PS
Acknowledgments
As academic researchers and consultants, we have worked personally with execu-tives, sales managers, and salespeople at hundreds of companies all over the world.Our thanks go to all the people at these fine companies who have helped us todiscover and develop the material presented in this book. Because of confidential-ity, many of the people and companies must remain nameless, but we owe a greatdeal of gratitude to all the clients who have worked with us to improve the pro-ductivity of their sales forces.
We would like to thank Northwestern University’s Kellogg School of Manage-ment for providing a fertile environment for ideas to flourish. We owe our grati-tude to thousands of executives and midlevel managers who have participated inthe Executive Education and MBA programs at Kellogg. Our classroom interac-tions with these individuals have been invaluable for transforming our theoriesand frameworks into practical sales force management tools. We are grateful toall our colleagues at Northwestern and elsewhere who have supported us, bothacademically and as friends.
We would also like to thank the people of ZS Associates, the consulting firmthat we founded in 1983. ZS Associates today has grown to more than 650 em-ployees, with offices in eight countries. ZS employs some of the finest consultantsand businesspeople in the world, and those people have contributed to the bookimmensely through their creativity as well as through their evaluation of our con-cepts. Special contributions came from the following people: Chad Albrecht,Chris Arzt, Vibhooti Ashar, Jaideep Bajaj, Adrian Cook, Tony Ehrbar, AmmarFeroz, Scott Fink, Jeff Gold, Kevin Josephson, Jude Konzelmann, Songjun Luo,Yogesh Madaan, Sharif Omar, Marissa Paine, Stephen Redden, Scott Shimamoto,
PAGE xi
xi
................. 15869$ $ACK 05-19-06 09:22:08 PS

xii Acknowledgments
Nancy Smith, Marshall Solem, Joel Stevenson, Subbu Thekenkattil, Neeraj Vas-hisht, and Jim Wartinbee.
Thank you to our Incentive Compensation Advisory Board. This board wascreated for the purpose of writing this book to share best practices in the salesincentive compensation area and to brainstorm solutions to difficult compensa-tion issues. The board members brought experience, creativity, judgment, andinteresting examples of good and inappropriate incentive compensation practices.Their input and guidance strengthened the book significantly. Corporate boardmembers include Mark Bate (MBCI/HomeCrest Cabinetry), Steve Broas (Ft.Wayne Newspaper, Inc.), John Early (Harley Davidson Financial Services), Cas-sandra Faurote (Roche Diagnostics), Jeff Foland (United Airlines), Peggy Forssell(Novartis Ophthalmics), Stephen Grimaldi (GE Consumer Finance), ThomasKenney (Abbott Laboratories), Lilia Kiselev (Abbott Laboratories), Bill Kotcher(UGI/AmeriGas Propane), and Joseph Strasinger (GE Energy). Board membersfrom ZS Associates include Chad Albrecht, Stephen Redden, Scott Shimamoto,and Marshall Solem.
We owe very special thanks to several research and editorial assistants whosework has improved the quality of the book substantially. Mary Henske (ZS Associ-ates) carefully reviewed every chapter for clarity and content, suggesting revisionsbased on her extensive sales force knowledge and expertise. Linda Kluver (ZSAssociates) developed many of the book’s illustrations, and her careful attentionto detail improved the consistency and clarity of the more than 250 figures in thebook. Ramya Balasubramanian applied her outstanding research skills to discovermany of the examples used throughout the book. Greg Zoltners researched anddeveloped content as a coauthor of one of our earlier books, providing a strongfoundation upon which to build the ideas for this book. Without the help of thesefine collaborators, this book would not be in your hands today.
PAGE xii................. 15869$ $ACK 05-19-06 09:22:09 PS
C H A P T E R 1
Sales Force IncentiveCompensation and theSuccessful Sales Organization
How This Chapter Is Organized
Introduction 2Examples of Some Common Sales Incentive Plan Design Successesand Failures 4
Can Incentives Encourage Effective Cross-Selling? 4Will Incentives Enhance the Success of a New ProductIntroduction? 5Can Sales Contests and SPIFFs (Special PerformanceIncentives for Field Force) Promote Attainment of CompanyGoals? 6Will an Incentive Plan That Works Today Still Be EffectiveTomorrow? 6Is the Incentive Compensation Plan Too Complex? 7Does Paying Incentives on Sales Force Activity Drive theDesired Results? 7Can Sales Force Pay Levels Be Reduced Successfully? 8Can the Impact of a New Incentive Plan Be Predicted? 9Is the Sales Compensation Plan Consistent with the New SalesStrategy? 10
Why Companies Use Sales Incentives 11Salespeople Drive the Company’s Top Line 11The Output of Salespeople Is Usually Measurable 11
PAGE 1
1
................. 15869$ $CH1 05-19-06 09:22:13 PS
2 The Complete Guide to Sales Force Incentive Compensation
Variable Pay Helps Ensure That Salespeople (Who Are LargelyUnsupervised) Produce Results 12Variable Pay Acknowledges a Salesperson’s Success 12
The Drivers of Sales Force Compensation Change 12The Need to Adapt 12The Desire to Improve 15
The Sales Force Compensation Challenge 17The Sales Management System 19The Role of Incentive Compensation Within the Sales ManagementSystem 23
Consistency: An Upstream View 23Compatibility: Alignment with Other Sales Force Effectiveness Drivers 24Consequences: A Downstream View 25
How the Sales Incentive Compensation Plan AffectsSalespeople 26How the Sales Incentive Plan Affects Sales Force Activities 26How the Sales Incentive Plan Affects Customer Results 28How the Sales Incentive Plan Affects Company Results 28
Diagnosing Sales Force Issues 29How This Book Is Organized 32
Introduction
Variable sales force compensation—or incentive compensation—represents amajor investment for many firms. In the United States alone, companies spend$200 billion each year on variable sales force compensation—approximately asmuch as they spend on advertising. Almost all companies use some form of vari-able compensation for their sales force, including cash bonuses, commissions,trips, or other awards that are tied to the achievement of performance outcomes.The average salesperson in the United States earns approximately 40 percent ofhis total cash compensation through performance-based incentives. At one end ofthe spectrum, approximately 15 percent of salespeople do not earn any salary atall—100 percent of their income comes from variable pay that is tied to perform-ance. A small percentage of U.S. companies pay their salespeople 100 percentsalary with no incentive opportunity.
The impact of a sales force incentive program goes well beyond cost. The salesforce compensation plan is an important driver of sales success. A well-designedplan that is implemented effectively helps a company attract and retain the bestsalespeople. It energizes salespeople, who often work alone, face frequent cus-tomer rejection, and consequently seek positive reinforcement for success. It mo-
PAGE 2................. 15869$ $CH1 05-19-06 09:22:13 PS
3Sales Force Incentive Compensation and the Successful Sales Organization
tivates salespeople to engage in activities and behaviors that will drive high levelsof customer satisfaction and good company results. An effective incentive plancan be a considerable source of sales force enthusiasm and inspiration. On theother hand, an ineffective plan can cause salespeople to feel discouraged and dis-engaged. If the incentive plan is not right, the best salespeople may not cometo work for the company, and above-average salespeople may leave for betteropportunities. Salespeople may not be motivated to work hard or may focus onthe wrong customers, products, or selling activities. Even worse, salespeople mayspend their time looking for ways to game the incentive plan to maximize theirpersonal earnings, rather than acting in the company’s and their customers’ bestinterests. Relationships with customers may suffer. Sales, growth, market share,or profits may fail to reach company expectations. An inappropriate sales incentiveplan, or the poor implementation of a good plan, has the potential to do consider-able harm to a firm.
Lack of an Incentive Plan Hurts Retention at a CourierCompany; Introducing a Plan Turns Performance Around
A small local courier service set a company objective to ‘‘grow revenues bypositioning the company as the fastest, most reliable, most competitivelypriced courier service in the local area.’’ Unfortunately, the sales compen-sation plan did not align well with this business objective. Salespeople werepaid a straight salary, and good salespeople would demand raises when-ever they grew their business. Many of them left the firm for competitorswho offered higher pay for top performance by paying salespeople an at-tractive commission. Revenue growth was severely hampered by the highsales force turnover. In addition, the sales force sold too much unprofitablebusiness, acquiring customers who were so distant from the home officethat drivers were left stranded, too far away to be dispatched to anotherjob quickly.
In an effort to fuel sales growth and improve profitability, the companychanged its incentive plan. A new commission-based plan was imple-mented. Salespeople earned 5 percent commission on business generatedwithin a defined geographic area close to the home office. Commissionrates rose to 7 percent at $75,000 in sales and to 10 percent at $100,000in sales. Sales jumped 130 percent after the new pay plan was instituted.
FedEx Revamps Compensation Plan to Address Sales Forceand Management Concerns
In 2002, executives at shipping and logistics giant FedEx realized that theyneeded a new compensation plan. Both salespeople and top managementhad voiced significant concerns about the current pay plan. Field sales-people complained excessively to management about how confusing andunpredictable the plan was. The plan had been adjusted so many times that
PAGE 3................. 15869$ $CH1 05-19-06 09:22:14 PS
4 The Complete Guide to Sales Force Incentive Compensation
it had become overly complex and was no longer motivating to the salesforce. At the same time, as the FedEx product line was becoming morediverse, top management felt that the current plan was not encouragingsalespeople to spend their time on the right mix of products.
FedEx developed a new compensation plan to address these concerns.Salespeople were given quotas for each of the three major FedEx productlines, and certain bonuses and commissions could be earned only if thequota were achieved for all three. This made it clear to the sales force thatall product lines were important, since the highest payout levels could beattained only by salespeople who did well in selling all three product lines.The new plan was supported with a comprehensive communication programthat educated salespeople about the new plan and provided constant feed-back on performance.
Authors’ note: Tying significant payouts to achievement of multiplegoals is not always a positive feature. If salespeople have unrealistic goalsfor even one of the product lines, the incentive plan can become demoti-vating. Does the company believe, for example, that for every salesperson,achieving 120 percent of goal on two product lines and 95 percent on oneis worse than being at 100 percent on all three product lines?
In addition, incentive plans need to adapt to new situations over time. Plansthat worked well yesterday in one environment can fail in tomorrow’s context.Sales incentive compensation has high salience for sales leaders, since sales incen-tives have a high cost, high impact, considerable opportunity for misdirection,and the need to evolve. Designing and managing an effective sales incentive pro-gram is a complex and difficult sales management challenge.
Examples of Some Common Sales Incentive Plan DesignSuccesses and FailuresSuccessful incentive compensation plan design requires a complex mixture ofexperience-based wisdom and analytics. Without both of these, serious mistakesare easy to make and are in fact very common. Experience enables a managementteam to foresee the consequences of plan features and to design a plan with lon-gevity. Analytics provide insights regarding the likely impact of future events onsales force motivation and plan costs. Here are some examples of incentive plandesign successes and mistakes that have resulted from the presence or lack ofexperience and analytical rigor in the incentive plan design process.
Can Incentives Encourage Effective Cross-Selling? A bank wants to encourageits tellers to upsell customers when they come into a branch location to depositmoney. Tellers are offered $10 for every customer who opens an account with thebank’s investment division as a result of teller referral to one of the bank’s invest-ment advisers. This incentive has almost no impact on teller behavior; the vastmajority of the tellers feel that the prospect of earning a $10 reward is not worth
PAGE 4................. 15869$ $CH1 05-19-06 09:22:14 PS
5Sales Force Incentive Compensation and the Successful Sales Organization
the effort and the possible humiliation of appearing to be ‘‘pushy.’’ In addition,the tellers do not know the investment advisers and therefore do not trust themto necessarily act in the customers’ best interest.
In addition to incentives, successful implementation of cross-selling initiativesusually involves adjustments to other sales force effectiveness drivers. For example,management at Iowa-based Brenton Banks wanted to encourage successful cross-selling of banking and brokerage products and services. The banking division,which sold deposits, loans, and trust services, operated totally independently fromthe brokerage division, which sold investment products. A strong referral culturebetween the two divisions did not exist, and bankers and brokers preferred to keeptheir customers to themselves. Brenton’s management recognized that incentivesalone would not be enough to change this culture. To start, management redrewthe organization chart, creating a single Brenton sales force. Bankers and brokerswere given a single net income goal that was not broken down according to theold banking and brokerage divisions. Bankers and brokers met twice a week, atfirst to discuss their plans for the week, and later to share their best client names.Joint sales calls crossing the traditional banking and brokerage boundaries wereencouraged. A training company was hired to provide training across the salesforce on the full range of product offerings. In addition, the incentive plan wasrevamped so that bankers could receive commissions for broker product sales andbrokers could receive commissions for bank product sales. The new approach,incorporating multiple sales force effectiveness driver changes, encouraged theentire sales force to be much more sales-oriented and proactive about developingleads and cross-selling.
Will Incentives Enhance the Success of a New Product Introduction? A companythat currently sells one major product is launching a new product. The sales forceuses a quarterly bonus plan that begins payouts at 95 percent of territory goalachievement. Historically, the vast majority of salespeople have achieved at least95 percent of their goal each quarter. When the company adds the new productto the incentive plan, it uses the same payout schedule for the new product asfor the existing product. Within two months, it is clear that the company’s salesexpectations for the new product are too high, with sales tracking at only 70percent of goal. Not a single salesperson is expected to hit the 95 percent thresh-old. The sales force is so demotivated that it spends much less time than plannedon the new product, making the problem of low sales even worse.
It is usually a mistake to treat a new product like an existing product in anincentive plan. For example, in the following year, the same company launchesanother new product, and this time a more appropriate incentive plan is adopted.The company realizes that the national forecast for the new product is likely to bewrong (either way too low or way too high), and the design of the new incentiveplan takes this uncertainty into account. In the first quarter following launch,salespeople are paid a commission on new product sales. This rewards the salesforce for early success, ensures that every salesperson is engaged, and protects thesales force and the company in the likely event of a national goal-setting error. In
PAGE 5................. 15869$ $CH1 05-19-06 09:22:15 PS
6 The Complete Guide to Sales Force Incentive Compensation
the second through fourth quarters following launch, commissions are paid forsales growth, thus encouraging the sales force to continue to build sales momen-tum and drive product success. By the second year following launch, the firm hasgained considerable experience in the market, and sales become more predictable.At that point, the product is incorporated into the firm’s regular quarterly quotabonus plan.
Can Sales Contests and SPIFFs (Special Performance Incentives for Field Force)Promote Attainment of Company Goals? A sales force sells two strategically im-portant products that account for the vast majority of company sales and profitsand 90 percent of the incentive plan focus. A small product that accounts for just10 percent of target incentive pay is also sold. The small product is being largelyignored by the sales force, and so its product manager launches a sales contest fora three-month period to stimulate sales. Any salesperson who grows sales to 105percent or more of goal during the contest period will receive a 42-inch plasmatelevision set. The contest is a huge success for the small product, with over halfof the sales force exceeding 105 percent goal attainment. However, the contestcauses a significant loss of sales focus for the two strategic products. Neither coreproduct achieves goal. Company sales and profits suffer measurably.
Effective sales contests and SPIFFs are aligned with the firm’s strategic priorit-ies. For example, a sales force that sells computer servers to medium-sized busi-nesses becomes demotivated when it becomes clear that most salespeople will notmake their territory sales goal and therefore will not make any incentive moneybecause the firm’s management has set an overly aggressive national goal for a newserver line. Sales leaders do not want the sales force to abandon this strategicallyimportant new server line, and so they establish a supplemental incentive programto encourage the sales force to continue to support it. Salespeople receive a sup-plemental bonus of $200 to $500 per server sold (depending on the model) dur-ing the last five months of the year. The program encourages the sales force tocontinue selling the new product, thus strengthening the company’s competitiveposition and enhancing the new server line’s chance for future success.
Will an Incentive Plan That Works Today Still Be Effective Tomorrow? A manu-facturing company has maintained the same sales compensation plan for over 30years. The plan targets 80 percent incentives and 20 percent salary. Incentives arepaid as a commission on total revenues from the first dollar, with an acceleratedrate for revenues beyond goal. With this plan design, the firm’s veteran salespeopleearn generous commissions on the book of business they have built over the years.Management has been reluctant to change the plan, for fear of angering the sales-people who control the majority of the business. However, lately it has becomeincreasingly difficult to recruit and hire new salespeople at the low guaranteedsalary level that the firm offers. In addition, many veteran salespeople seem com-placent, content to live off their earnings from existing customers and unwillingto work hard to grow sales in an increasingly competitive market. Managementwonders if perhaps the time has come to revamp the sales incentive plan. Yet it
PAGE 6................. 15869$ $CH1 05-19-06 09:22:15 PS
7Sales Force Incentive Compensation and the Successful Sales Organization
fears that veteran salespeople might leave for competitors (and take accounts withthem) if an incentive plan change were to reduce sales force earning power.
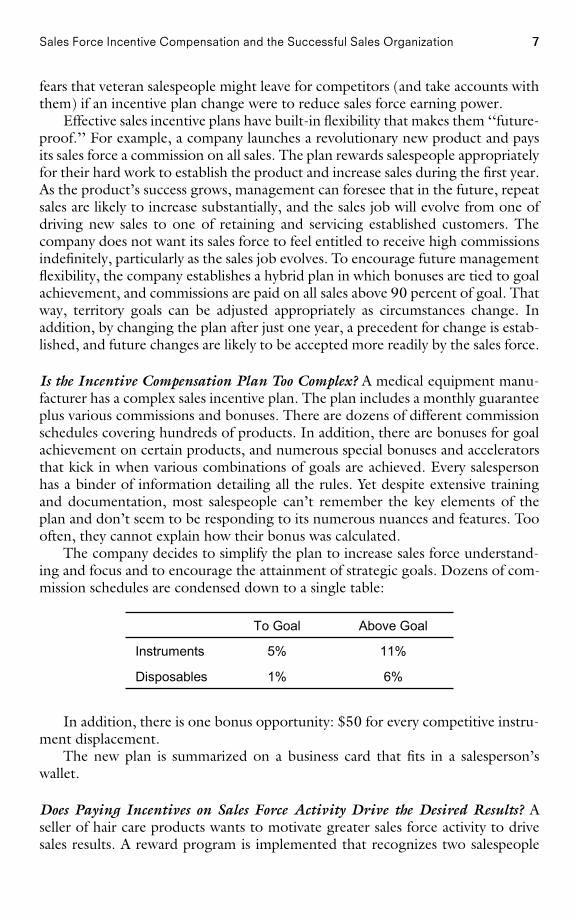
Effective sales incentive plans have built-in flexibility that makes them ‘‘future-proof.’’ For example, a company launches a revolutionary new product and paysits sales force a commission on all sales. The plan rewards salespeople appropriatelyfor their hard work to establish the product and increase sales during the first year.As the product’s success grows, management can foresee that in the future, repeatsales are likely to increase substantially, and the sales job will evolve from one ofdriving new sales to one of retaining and servicing established customers. Thecompany does not want its sales force to feel entitled to receive high commissionsindefinitely, particularly as the sales job evolves. To encourage future managementflexibility, the company establishes a hybrid plan in which bonuses are tied to goalachievement, and commissions are paid on all sales above 90 percent of goal. Thatway, territory goals can be adjusted appropriately as circumstances change. Inaddition, by changing the plan after just one year, a precedent for change is estab-lished, and future changes are likely to be accepted more readily by the sales force.
Is the Incentive Compensation Plan Too Complex? A medical equipment manu-facturer has a complex sales incentive plan. The plan includes a monthly guaranteeplus various commissions and bonuses. There are dozens of different commissionschedules covering hundreds of products. In addition, there are bonuses for goalachievement on certain products, and numerous special bonuses and acceleratorsthat kick in when various combinations of goals are achieved. Every salespersonhas a binder of information detailing all the rules. Yet despite extensive trainingand documentation, most salespeople can’t remember the key elements of theplan and don’t seem to be responding to its numerous nuances and features. Toooften, they cannot explain how their bonus was calculated.
The company decides to simplify the plan to increase sales force understand-ing and focus and to encourage the attainment of strategic goals. Dozens of com-mission schedules are condensed down to a single table:
6%1%Disposables
11%5%Instruments
Above GoalTo Goal
In addition, there is one bonus opportunity: $50 for every competitive instru-ment displacement.
The new plan is summarized on a business card that fits in a salesperson’swallet.
Does Paying Incentives on Sales Force Activity Drive the Desired Results? Aseller of hair care products wants to motivate greater sales force activity to drivesales results. A reward program is implemented that recognizes two salespeople
PAGE 7................. 15869$ $CH1 05-19-06 09:22:16 PS
8 The Complete Guide to Sales Force Incentive Compensation
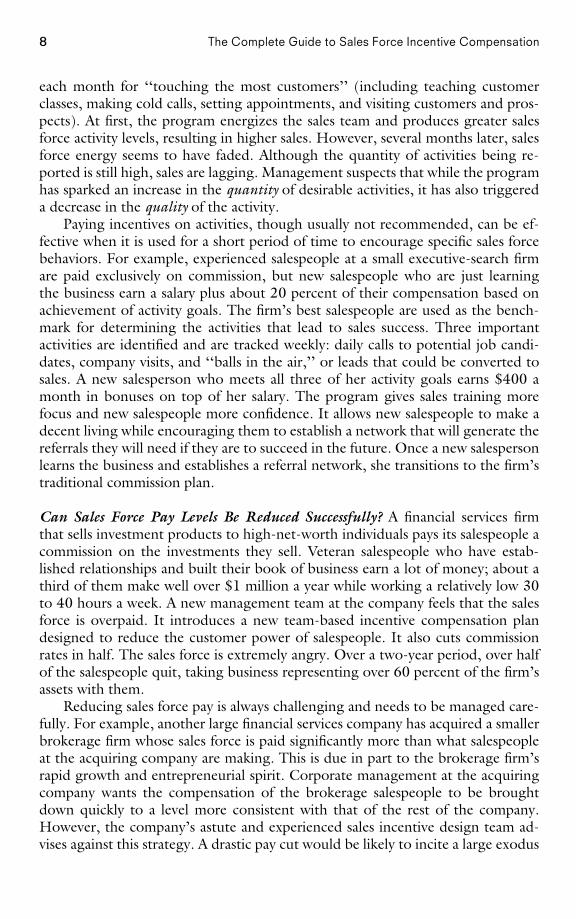
each month for ‘‘touching the most customers’’ (including teaching customerclasses, making cold calls, setting appointments, and visiting customers and pros-pects). At first, the program energizes the sales team and produces greater salesforce activity levels, resulting in higher sales. However, several months later, salesforce energy seems to have faded. Although the quantity of activities being re-ported is still high, sales are lagging. Management suspects that while the programhas sparked an increase in the quantity of desirable activities, it has also triggereda decrease in the quality of the activity.
Paying incentives on activities, though usually not recommended, can be ef-fective when it is used for a short period of time to encourage specific sales forcebehaviors. For example, experienced salespeople at a small executive-search firmare paid exclusively on commission, but new salespeople who are just learningthe business earn a salary plus about 20 percent of their compensation based onachievement of activity goals. The firm’s best salespeople are used as the bench-mark for determining the activities that lead to sales success. Three importantactivities are identified and are tracked weekly: daily calls to potential job candi-dates, company visits, and ‘‘balls in the air,’’ or leads that could be converted tosales. A new salesperson who meets all three of her activity goals earns $400 amonth in bonuses on top of her salary. The program gives sales training morefocus and new salespeople more confidence. It allows new salespeople to make adecent living while encouraging them to establish a network that will generate thereferrals they will need if they are to succeed in the future. Once a new salespersonlearns the business and establishes a referral network, she transitions to the firm’straditional commission plan.
Can Sales Force Pay Levels Be Reduced Successfully? A financial services firmthat sells investment products to high-net-worth individuals pays its salespeople acommission on the investments they sell. Veteran salespeople who have estab-lished relationships and built their book of business earn a lot of money; about athird of them make well over $1 million a year while working a relatively low 30to 40 hours a week. A new management team at the company feels that the salesforce is overpaid. It introduces a new team-based incentive compensation plandesigned to reduce the customer power of salespeople. It also cuts commissionrates in half. The sales force is extremely angry. Over a two-year period, over halfof the salespeople quit, taking business representing over 60 percent of the firm’sassets with them.
Reducing sales force pay is always challenging and needs to be managed care-fully. For example, another large financial services company has acquired a smallerbrokerage firm whose sales force is paid significantly more than what salespeopleat the acquiring company are making. This is due in part to the brokerage firm’srapid growth and entrepreneurial spirit. Corporate management at the acquiringcompany wants the compensation of the brokerage salespeople to be broughtdown quickly to a level more consistent with that of the rest of the company.However, the company’s astute and experienced sales incentive design team ad-vises against this strategy. A drastic pay cut would be likely to incite a large exodus
PAGE 8................. 15869$ $CH1 05-19-06 09:22:17 PS
9Sales Force Incentive Compensation and the Successful Sales Organization
of salespeople from the acquired company who control key customer relation-ships. If these salespeople were to leave the firm and go to work for competitors,they would certainly take many of their customers with them. The company de-cides to keep the brokerage incentive plan intact in the short term. Meanwhile,management focuses on learning the brokerage business and establishing addi-tional links (besides the brokerage salespeople) between the company and keycustomers. Once the necessary market knowledge and customer relationshipshave been established, the pay reduction is implemented, with some short-termearnings protection built into the plan. Even though this prompts some brokeragesalespeople to leave the firm, the company retains most of the customers, and theintegration is considered a success.
Can the Impact of a New Incentive Plan Be Predicted? A sales force has a quar-terly quota bonus plan for its core product lines. When a new product is launched,rather than incorporating the new product into the core incentive plan, the com-pany develops a separate plan that pays the sales force a commission on all sales ofthe new product. The new product is extremely successful, and the sales forceearns a lot of money selling it. In fact, commissions on the new product are solucrative that the sales force all but abandons the firm’s core products, devotingalmost all its time to the new product. Core product sales suffer, along with com-pany profits. The sales force makes too much money—people get a windfall. Fi-nance is concerned about plan costs. Company leaders are concerned thatunrealistic sales force income expectations have been established.
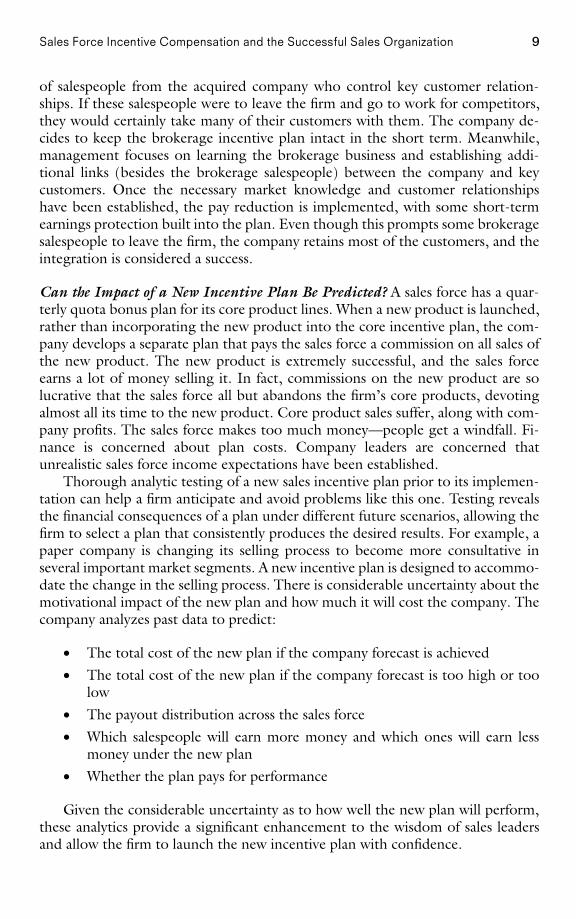
Thorough analytic testing of a new sales incentive plan prior to its implemen-tation can help a firm anticipate and avoid problems like this one. Testing revealsthe financial consequences of a plan under different future scenarios, allowing thefirm to select a plan that consistently produces the desired results. For example, apaper company is changing its selling process to become more consultative inseveral important market segments. A new incentive plan is designed to accommo-date the change in the selling process. There is considerable uncertainty about themotivational impact of the new plan and how much it will cost the company. Thecompany analyzes past data to predict:
• The total cost of the new plan if the company forecast is achieved• The total cost of the new plan if the company forecast is too high or too
low• The payout distribution across the sales force• Which salespeople will earn more money and which ones will earn less
money under the new plan• Whether the plan pays for performance
Given the considerable uncertainty as to how well the new plan will perform,these analytics provide a significant enhancement to the wisdom of sales leadersand allow the firm to launch the new incentive plan with confidence.
PAGE 9................. 15869$ $CH1 05-19-06 09:22:17 PS
10 The Complete Guide to Sales Force Incentive Compensation
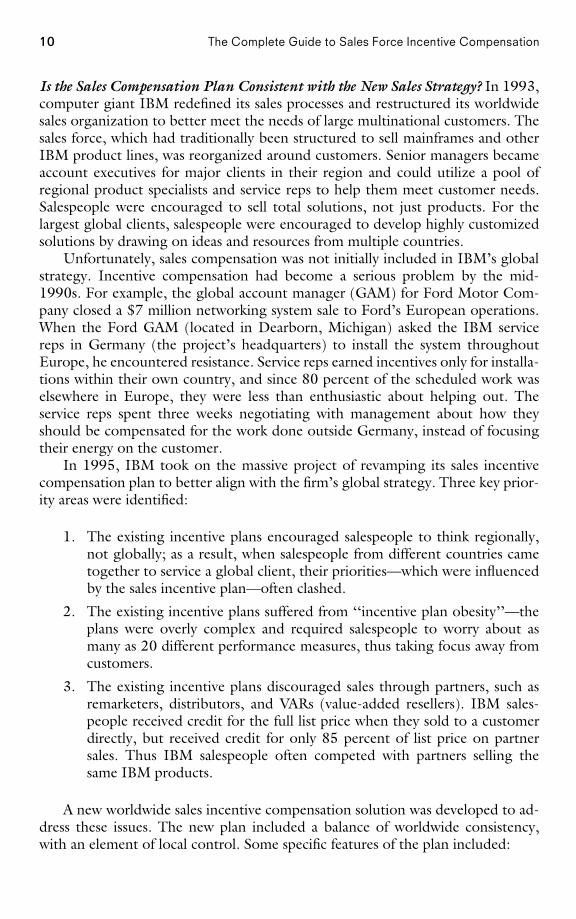
Is the Sales Compensation Plan Consistent with the New Sales Strategy? In 1993,computer giant IBM redefined its sales processes and restructured its worldwidesales organization to better meet the needs of large multinational customers. Thesales force, which had traditionally been structured to sell mainframes and otherIBM product lines, was reorganized around customers. Senior managers becameaccount executives for major clients in their region and could utilize a pool ofregional product specialists and service reps to help them meet customer needs.Salespeople were encouraged to sell total solutions, not just products. For thelargest global clients, salespeople were encouraged to develop highly customizedsolutions by drawing on ideas and resources from multiple countries.
Unfortunately, sales compensation was not initially included in IBM’s globalstrategy. Incentive compensation had become a serious problem by the mid-1990s. For example, the global account manager (GAM) for Ford Motor Com-pany closed a $7 million networking system sale to Ford’s European operations.When the Ford GAM (located in Dearborn, Michigan) asked the IBM servicereps in Germany (the project’s headquarters) to install the system throughoutEurope, he encountered resistance. Service reps earned incentives only for installa-tions within their own country, and since 80 percent of the scheduled work waselsewhere in Europe, they were less than enthusiastic about helping out. Theservice reps spent three weeks negotiating with management about how theyshould be compensated for the work done outside Germany, instead of focusingtheir energy on the customer.
In 1995, IBM took on the massive project of revamping its sales incentivecompensation plan to better align with the firm’s global strategy. Three key prior-ity areas were identified:
1. The existing incentive plans encouraged salespeople to think regionally,not globally; as a result, when salespeople from different countries cametogether to service a global client, their priorities—which were influencedby the sales incentive plan—often clashed.
2. The existing incentive plans suffered from ‘‘incentive plan obesity’’—theplans were overly complex and required salespeople to worry about asmany as 20 different performance measures, thus taking focus away fromcustomers.
3. The existing incentive plans discouraged sales through partners, such asremarketers, distributors, and VARs (value-added resellers). IBM sales-people received credit for the full list price when they sold to a customerdirectly, but received credit for only 85 percent of list price on partnersales. Thus IBM salespeople often competed with partners selling thesame IBM products.
A new worldwide sales incentive compensation solution was developed to ad-dress these issues. The new plan included a balance of worldwide consistency,with an element of local control. Some specific features of the plan included:
PAGE 10................. 15869$ $CH1 05-19-06 09:22:17 PS
11Sales Force Incentive Compensation and the Successful Sales Organization
• Local countries could determine the frequency of incentive payouts andthe split between base salary and incentive pay.
• All plans followed a worldwide framework of performance measures andwere limited to a total of 10 measures to reduce plan complexity.
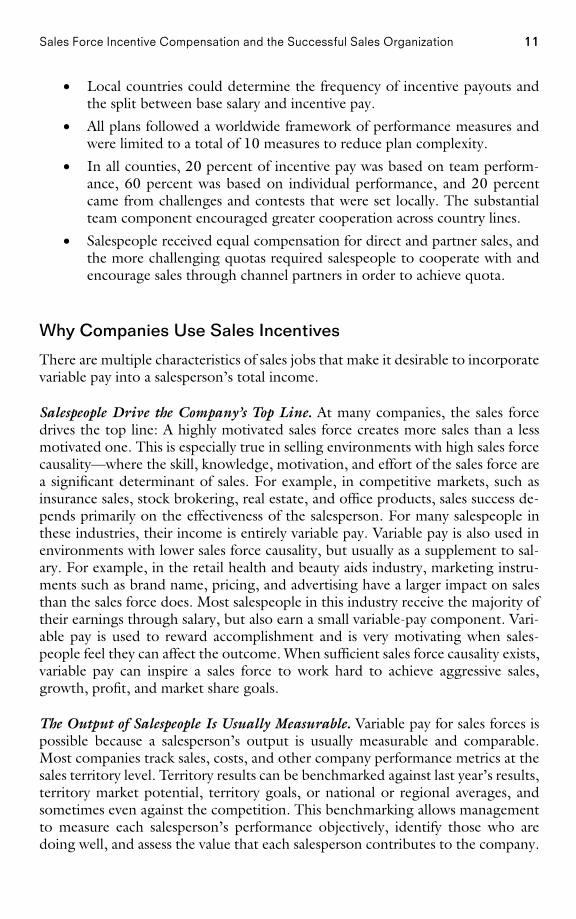
• In all counties, 20 percent of incentive pay was based on team perform-ance, 60 percent was based on individual performance, and 20 percentcame from challenges and contests that were set locally. The substantialteam component encouraged greater cooperation across country lines.
• Salespeople received equal compensation for direct and partner sales, andthe more challenging quotas required salespeople to cooperate with andencourage sales through channel partners in order to achieve quota.
Why Companies Use Sales Incentives
There are multiple characteristics of sales jobs that make it desirable to incorporatevariable pay into a salesperson’s total income.
Salespeople Drive the Company’s Top Line. At many companies, the sales forcedrives the top line: A highly motivated sales force creates more sales than a lessmotivated one. This is especially true in selling environments with high sales forcecausality—where the skill, knowledge, motivation, and effort of the sales force area significant determinant of sales. For example, in competitive markets, such asinsurance sales, stock brokering, real estate, and office products, sales success de-pends primarily on the effectiveness of the salesperson. For many salespeople inthese industries, their income is entirely variable pay. Variable pay is also used inenvironments with lower sales force causality, but usually as a supplement to sal-ary. For example, in the retail health and beauty aids industry, marketing instru-ments such as brand name, pricing, and advertising have a larger impact on salesthan the sales force does. Most salespeople in this industry receive the majority oftheir earnings through salary, but also earn a small variable-pay component. Vari-able pay is used to reward accomplishment and is very motivating when sales-people feel they can affect the outcome. When sufficient sales force causality exists,variable pay can inspire a sales force to work hard to achieve aggressive sales,growth, profit, and market share goals.
The Output of Salespeople Is Usually Measurable. Variable pay for sales forces ispossible because a salesperson’s output is usually measurable and comparable.Most companies track sales, costs, and other company performance metrics at thesales territory level. Territory results can be benchmarked against last year’s results,territory market potential, territory goals, or national or regional averages, andsometimes even against the competition. This benchmarking allows managementto measure each salesperson’s performance objectively, identify those who aredoing well, and assess the value that each salesperson contributes to the company.
PAGE 11................. 15869$ $CH1 05-19-06 09:22:18 PS
12 The Complete Guide to Sales Force Incentive Compensation
As sales organizations become more complex, with shared responsibilities for out-comes and blurred causality across multiple members of a sales team, the role ofvariable pay has to evolve as well. This is a transition that firms need to managewell.
Variable Pay Helps Ensure that Salespeople (Who Are Largely Unsupervised)Produce Results. Incentive pay also helps with control and risk management.Salespeople often work alone and unsupervised. Many of them spend the vastmajority of their time ‘‘on the road’’ visiting customers. As a result, managementcannot possibly know exactly how salespeople are spending their time every day.A manager cannot look over a salesperson’s shoulder and provide guidance or tellhim to ‘‘get back to work.’’ By paying for results, management gives the salesforce a strong economic incentive to work hard to accomplish what is expected.
Variable Pay Acknowledges a Salesperson’s Success. Many sales jobs are devoid ofthe supportive social interaction that comes from working with supervisors andpeers on a daily basis. A salesperson’s primary social contacts are with her custom-ers. The sales job also involves considerable rejection, and in some environments,customers perceive the salesperson as intrusive. An incentive payout provides botha reward for and a measure of a salesperson’s success. Incentives provide the moti-vation to go forth and get the next sale. The sales job attracts people who areexcited by the possibility of earning high returns through incentives. Many salesjobs in the United States would not attract people with the right skills, capabilities,and instincts if compensation consisted of salary alone.
The Drivers of Sales Force Compensation Change
As markets and company strategies evolve, successful firms adapt their sales incen-tive compensation plans in order to ensure that sales force energy stays alignedappropriately. Most companies fine-tune their incentive compensation plans atleast every year and make major changes to those plans at least every two to threeyears. The decision to change a sales incentive compensation plan is never takenlightly, as it can have a significant impact on customers, salespeople, and companyperformance.
The Need to Adapt
Constant change is both an opportunity and a threat for a sales force. On theone hand, opportunities arise when new customers emerge, helpful technologiesappear, competitors go out of business, or there is innovation in the company’sproducts and sales processes. On the other hand, threats emerge when sales strate-gies become dated as customers change their buying approaches, the number of
PAGE 12................. 15869$ $CH1 05-19-06 09:22:18 PS
13Sales Force Incentive Compensation and the Successful Sales Organization
competitors increases and/or existing competitors become more aggressive, radi-cal unanticipated technologies appear, and salespeople’s skills and knowledge pla-teau. These changes can have a significant impact on the sales force. The scope ofthis impact often extends beyond the sales compensation plan and can includeother aspects of sales management that define the sales job and influence thesalesperson.
Major events that drive sales force compensation change can be either externalor internal to the company. External events include evolving customer needs, achanging competitive landscape, and environmental changes such as advancingtechnology, economic swings, or new government regulations. Internal eventsthat lead to incentive plan change include the launch of new products, entry intonew markets, and mergers and acquisitions. Often, major events like these requiresignificant changes to the sales job itself. New go-to-market strategies may beneeded. Sales force design may be required to change, with a new organizationalstructure, different sales roles, or changes in sales force size and territory align-ment. The incentive compensation plan will need to adapt to all of these changes.Even in situations where the influence of major internal and external events onthe sales force does not lead to significant adjustments in sales and go-to-marketstrategies and sales force design, the sales incentive plan may still need to evolvein order to encourage sales force behaviors that are more appropriate for newmarket and company conditions.
External Change Prompts an Incentive Plan Revamping atCircuit City
Prior to 2003, Circuit City had long embraced its commissioned sales forceas a key point of differentiation between it and its main competitor, BestBuy. The in-store commissioned salespeople at Circuit City provided cus-tomers with service and advice regarding complex technology purchases.However, as more and more consumers began to rely on outside sourcesof information about technology, such as Internet research, the valueadded by commissioned salespeople diminished substantially. Customersno longer wanted or needed advice from a salesperson. Instead, theywanted low prices, the opportunity to browse on their own, and the chanceto ask additional questions and to purchase or sign up for services. In re-sponse, Circuit City eliminated all of its 3,900 commissioned sales posi-tions, replacing them with 2,100 new in-store associates who were paid anhourly wage. The move was projected to save the firm approximately $130million per year.
Internal Changes at Compaq Lead to Sales Strategy ChangesThat Prompt an Incentive Plan Revamping
Compaq’s acquisitions of Tandem Computers and Digital Equipment Cor-poration in 1997 and 1998, respectively, gave the Compaq sales force
PAGE 13................. 15869$ $CH1 05-19-06 09:22:18 PS
14 The Complete Guide to Sales Force Incentive Compensation
many new products and services to sell. This increased the complexity ofthe selling process and required successful salespeople to become well-rounded business advisers. As a result, Compaq revised its compensationsystem. In addition to receiving variable pay based on revenue growth andprofitability, Compaq salespeople began to receive 20 to 40 percent oftheir variable pay based on the accomplishment of focused sales objectives(FSOs). The FSOs rewarded salespeople for strategic, nonrevenue accom-plishments, such as engaging with a new business partner to develop acustomer proposal, improving customer satisfaction, or increasing sales ona specific product line.
Reasons for Reassessing Your Sales Force Incentive Plan ThatReflect the Need to Adapt to Change
When we asked this question of sales and HR managers attending ourexecutive education course on sales force compensation at NorthwesternUniversity, we got many responses focusing on the need to adapt tochange. For example:
• ‘‘We are moving into new markets with different sales cycle times.’’(Software)
• ‘‘Our sales force has restructured due to customer consolidation andincreasing demands, as well as revised stakeholder expectations.’’(Chemicals)
• ‘‘A competitor has become very aggressive. We want to elevate theimportance of design wins (market share) versus revenues in our in-centive plan.’’ (Semiconductors)
• ‘‘The market has matured and competition has increased.’’ (Pharma-ceuticals)
• ‘‘Our competitors are changing their compensation plans (for sales-people). We need a plan that helps us stay in line with plans used byother sales forces.’’ (Food)
• ‘‘The industry has become more competitive after deregulation.’’ (Pe-troleum)
• ‘‘New technology—electronic inventory management—is affecting ourbusiness.’’ (Chemicals)
• ‘‘Distribution channels are changing. An increase in business at largenational chains, as well as through the Internet and mail order, meansthat more business is spanning across territory lines.’’ (Musical instru-ments)
• ‘‘Our product portfolio and strategic focus are changing.’’ (Healthcare)
PAGE 14................. 15869$ $CH1 05-19-06 09:22:19 PS
15Sales Force Incentive Compensation and the Successful Sales Organization
• ‘‘We want to align our compensation plan with product marketing pro-grams for new products.’’ (Telecommunications)
• ‘‘We just merged two companies, and the new plan has not been ac-cepted well.’’ (Human resource recruiting)
• ‘‘We want to encourage cross-selling.’’ (Office equipment)
• ‘‘Our plan encourages transactional selling, and we want to emphasizesolution selling.’’ (Office products)
• ‘‘We just started measuring profitability at the territory level. Shouldwe pay on this instead of on revenue?’’ (Transportation)
• ‘‘We are working with an outside firm that is helping us measure cus-tomer satisfaction. Should we pay salespeople on customer satisfac-tion?’’ (High-tech)
The Desire to Improve
Best-in-class sales forces do not wait until major market and company changesnecessitate incentive plan adjustments. Successful companies are constantly look-ing for ways to improve, particularly in areas like incentive compensation that areclosely linked to sales success.
The sales incentive plan influences the firm’s ability to attract and retain goodsalespeople. A plan that is not competitive will not draw the best salespeople tothe firm. In addition, the wrong plan may cause rainmakers to leave, while averageperformers stay with the company too long. Management may also improve thefirm’s ability to motivate and direct the activities of salespeople through the incen-tive plan. For example, management may feel that veteran salespeople have be-come complacent and are not motivated to pursue new accounts, since they canlive comfortably on the high commissions they make from repeat business. Or itmay feel that the sales incentive plan no longer sends a message that is consistentwith company objectives. To illustrate, if the company wants to emphasize long-term relationships and customer service, but pays salespeople for short-term re-sults, a change in the incentive plan may help the firm better achieve its goals.Sometimes management feels that a sales force compensation plan has becometoo complex to be motivational. One sales manager at a leading technology firmadvised a new salesperson during training, ‘‘Don’t worry about the compensationplan—it’s so complex that it’s nearly impossible to understand it. Just do yourjob.’’
Carpet Manufacturer Changes the Sales Incentive Program toImprove Profitability
When a manufacturer of residential carpeting that is sold through retailersfaced declining margins, management looked to the sales incentive plan to
PAGE 15................. 15869$ $CH1 05-19-06 09:22:19 PS
16 The Complete Guide to Sales Force Incentive Compensation
help boost profits. Like its competitors, the company had historically paidsalespeople a draw against a commission on sales. The gross margins ondifferent carpet brands and styles ranged from 25 to 45 percent, but sales-people had little incentive to emphasize the more profitable carpets be-cause they were paid based on sales volume alone. Management needed aplan that would encourage salespeople to emphasize the more profitableproduct lines, while at the same time continuing to build volume and main-tain high levels of customer service.
Before changing the incentive plan, management saw that some adjust-ments to the firm’s sales strategy were required. Greater sales force em-phasis needed to be directed toward the best prospects for the higher-margin products: upscale retailers and medium-sized dealers. The salesforce was trained on how to execute this new sales strategy. Next, a newsales incentive plan was designed and implemented. The new plan paidsalespeople 60 percent salary plus 40 percent variable pay. The variableportion of pay included two components: a bonus for making a sales volumequota, plus a 3 percent commission on sales of ‘‘emphasis products’’— thehigh-margin styles that management wanted to sell. The ‘‘emphasis’’ groupwas reviewed and adjusted twice a year, in alignment with the firm’s exist-ing selling seasons.
One year into the program, management proclaimed the new plan asuccess. Although sales volume had risen just 1 percent, sales of ‘‘empha-sis’’ products were up 3 percent and gross margins had jumped 12 percent.In addition, sales force turnover, never high to begin with, actually declinedafter the new program was introduced.
Authors’ note: What about doing what is best for the customer? Onechallenge to the long-term success of a plan that encourages salespeopleto spend time on high-profit-margin products is to ensure that salespeoplealso continue to focus on meeting the needs of customers.
Reasons for Reassessing Your Sales Force Incentive Plan ThatReflect the Desire to Improve
When we asked this question of sales and HR managers attending ourexecutive education course on sales compensation at Northwestern Uni-versity, we got many responses focusing on the desire to improve. Forexample:
• ‘‘We need to better align our incentive plan with the firm’s strategicinitiatives.’’ (Not-for-profit)
• ‘‘Too many salespeople have become comfortable with the incomethey earn from sales to current clients.’’ (Insurance)
• ‘‘We want to eliminate loopholes and be fair and equitable to everyonein the sales force.’’ (Computer maintenance)
PAGE 16................. 15869$ $CH1 05-19-06 09:22:20 PS
17Sales Force Incentive Compensation and the Successful Sales Organization
• ‘‘We want to achieve greater differentiation between high and low per-formers.’’ (Pharmaceuticals)
• ‘‘Our current plan focuses on financial targets, not strategic activities.’’(Telecommunications)
• ‘‘Our plan is too hard for the sales force to understand.’’ (Mortgagebanking)
• ‘‘Many customers are unhappy because the sales force is not meetingall their important service needs, particularly for those products thatare not part of the incentive plan.’’ (Tools manufacturing)
• ‘‘Too many of our best salespeople are being lured to the competition.’’(Health care)
• ‘‘Our top performers ‘max out’ and quit, while low performers stay toolong.’’ (Building products)
• ‘‘We need a plan that ties our labor costs more directly to sales.’’ (Med-ical instruments)
• ‘‘We want to make our plan more aggressive.’’ (Educational testing)
• ‘‘We want to make the plan more consistent with our corporate cul-ture.’’ (Software)
The Sales Force Compensation Challenge
Designing and implementing an effective sales incentive compensation plan is asizable management challenge. The impact of the sales incentive plan can be sig-nificant, and the forces at work can be subtle. Sales force compensation dynamicscan be understood through the framework shown in Figure 1-1.
Three major constituents are affected by the compensation plan: the company,the sales force, and the customer. These three constituents make decisions andsee results. The company decides upon a compensation plan. The sales force de-cides how it will spend its time. Although numerous factors affect the salesper-son’s choice of activities, the compensation plan has a significant influence. Thecustomer decides if she wants to buy the company’s products or services. Althoughmany factors influence customer purchase decisions, the sales compensation planaffects the relationship between salespeople and customers and therefore affectscustomer satisfaction and purchasing.
It is important to note that the company can decide upon only the plan. Theother two decisions, sales force activities and customer purchasing, are not underits direct control, although they are influenced by the compensation plan selected.
Since each stakeholder has a different perspective, each one looks for differentresults. Customers want their needs to be met. They want a good product at a fairprice along with the appropriate mixture of advice, service, and support throughan effective working relationship with the selling company. Salespeople want good
PAGE 17................. 15869$ $CH1 05-19-06 09:22:20 PS
18 The Complete Guide to Sales Force Incentive Compensation
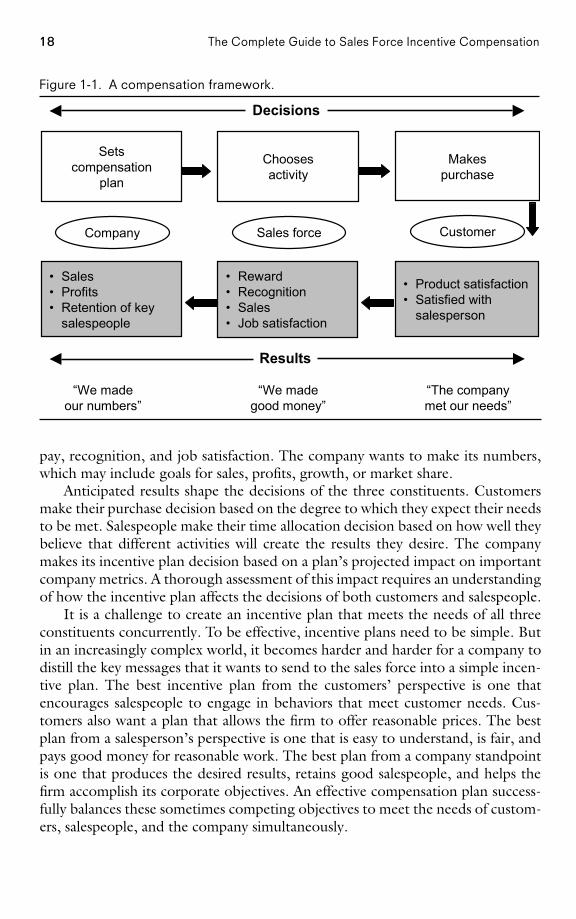
Figure 1-1. A compensation framework.
• Sales• Profits• Retention of key
salespeople
• Reward• Recognition• Sales• Job satisfaction
• Product satisfaction• Satisfied with
salesperson
Company Sales force Customer
Setscompensation
plan
Choosesactivity
Makespurchase
“We madeour numbers”
“The companymet our needs”
“We madegood money”
Decisions
Results
pay, recognition, and job satisfaction. The company wants to make its numbers,which may include goals for sales, profits, growth, or market share.
Anticipated results shape the decisions of the three constituents. Customersmake their purchase decision based on the degree to which they expect their needsto be met. Salespeople make their time allocation decision based on how well theybelieve that different activities will create the results they desire. The companymakes its incentive plan decision based on a plan’s projected impact on importantcompany metrics. A thorough assessment of this impact requires an understandingof how the incentive plan affects the decisions of both customers and salespeople.
It is a challenge to create an incentive plan that meets the needs of all threeconstituents concurrently. To be effective, incentive plans need to be simple. Butin an increasingly complex world, it becomes harder and harder for a company todistill the key messages that it wants to send to the sales force into a simple incen-tive plan. The best incentive plan from the customers’ perspective is one thatencourages salespeople to engage in behaviors that meet customer needs. Cus-tomers also want a plan that allows the firm to offer reasonable prices. The bestplan from a salesperson’s perspective is one that is easy to understand, is fair, andpays good money for reasonable work. The best plan from a company standpointis one that produces the desired results, retains good salespeople, and helps thefirm accomplish its corporate objectives. An effective compensation plan success-fully balances these sometimes competing objectives to meet the needs of custom-ers, salespeople, and the company simultaneously.
PAGE 18................. 15869$ $CH1 05-19-06 09:22:22 PS
19Sales Force Incentive Compensation and the Successful Sales Organization
Balancing Customer, Employee, and Company Objectives atUS West
When workers at communications giant US West went on strike in Augustof 1998, the firm’s pay-for-performance incentive plan was one of the majorissues in contention. Customer service representatives at US West earnedvariable pay for selling extra services to customers, as well as for servicingcustomers quickly. Workers argued that this plan was simply a way tospeed them up, and was designed more to enhance company revenues thanto improve customer service. While revenues generated and speed of ser-vice are easily tracked and measured, they are not necessarily integral toproviding the type of service that customers really need. Management ar-gued that speedy service was, in fact, one of several things that customersvalue. The union was not very successful in its quest to eliminate the incen-tive program. Management did agree to make the plan voluntary for someworkers, and also gave the union more say in the plan’s design and imple-mentation.
The Sales Management System
Sales compensation is just one component of an effective sales management sys-tem. It is not possible to successfully diagnose sales compensation problems anddevelop effective solutions without understanding the entire sales managementsystem and the role of the incentive compensation plan within this system. Often,companies blame their problems on the compensation plan when, in fact, the truesource of the problems lies elsewhere within the sales management system.
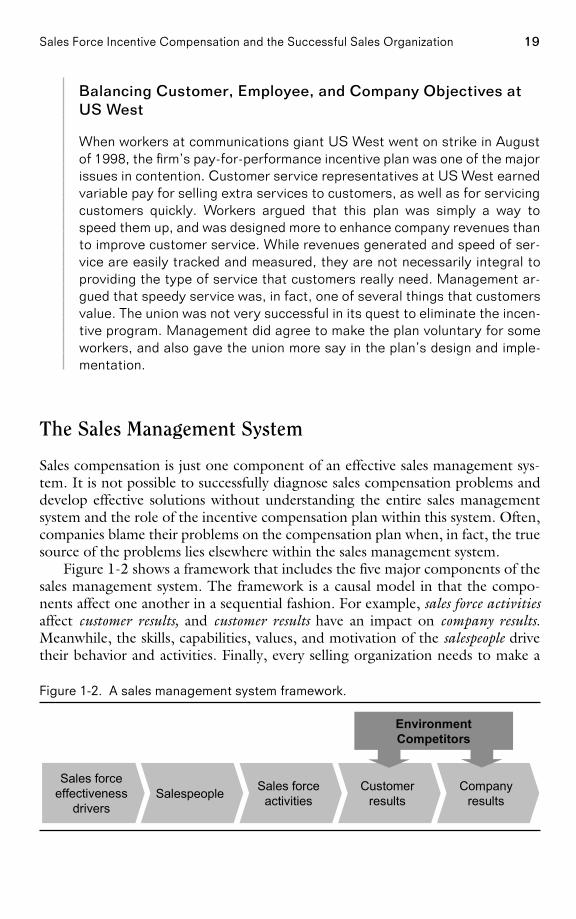
Figure 1-2 shows a framework that includes the five major components of thesales management system. The framework is a causal model in that the compo-nents affect one another in a sequential fashion. For example, sales force activitiesaffect customer results, and customer results have an impact on company results.Meanwhile, the skills, capabilities, values, and motivation of the salespeople drivetheir behavior and activities. Finally, every selling organization needs to make a
Figure 1-2. A sales management system framework.
Sales forceeffectiveness
driversSalespeople Sales force
activitiesCustomer
resultsCompany
results
EnvironmentCompetitors
PAGE 19................. 15869$ $CH1 05-19-06 09:22:23 PS
20 The Complete Guide to Sales Force Incentive Compensation
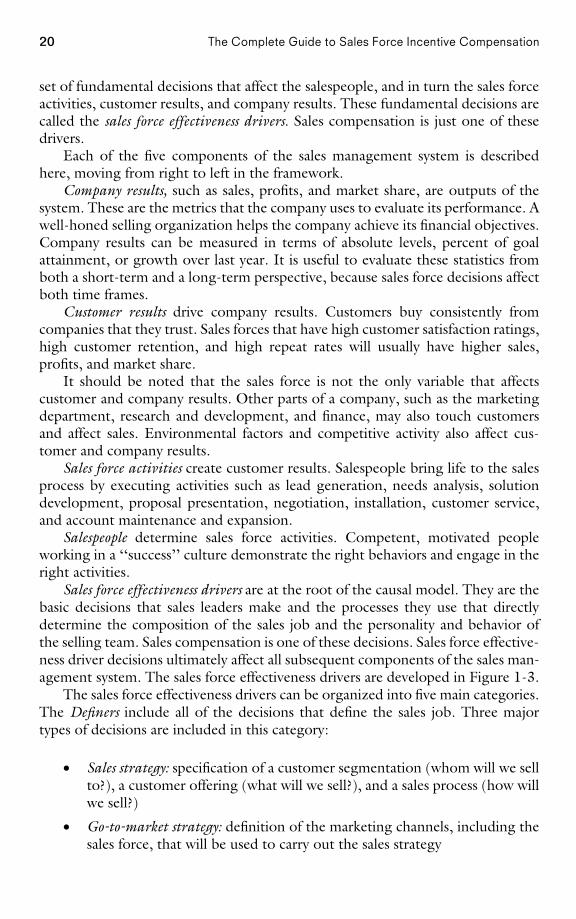
set of fundamental decisions that affect the salespeople, and in turn the sales forceactivities, customer results, and company results. These fundamental decisions arecalled the sales force effectiveness drivers. Sales compensation is just one of thesedrivers.
Each of the five components of the sales management system is describedhere, moving from right to left in the framework.
Company results, such as sales, profits, and market share, are outputs of thesystem. These are the metrics that the company uses to evaluate its performance. Awell-honed selling organization helps the company achieve its financial objectives.Company results can be measured in terms of absolute levels, percent of goalattainment, or growth over last year. It is useful to evaluate these statistics fromboth a short-term and a long-term perspective, because sales force decisions affectboth time frames.
Customer results drive company results. Customers buy consistently fromcompanies that they trust. Sales forces that have high customer satisfaction ratings,high customer retention, and high repeat rates will usually have higher sales,profits, and market share.
It should be noted that the sales force is not the only variable that affectscustomer and company results. Other parts of a company, such as the marketingdepartment, research and development, and finance, may also touch customersand affect sales. Environmental factors and competitive activity also affect cus-tomer and company results.
Sales force activities create customer results. Salespeople bring life to the salesprocess by executing activities such as lead generation, needs analysis, solutiondevelopment, proposal presentation, negotiation, installation, customer service,and account maintenance and expansion.
Salespeople determine sales force activities. Competent, motivated peopleworking in a ‘‘success’’ culture demonstrate the right behaviors and engage in theright activities.
Sales force effectiveness drivers are at the root of the causal model. They are thebasic decisions that sales leaders make and the processes they use that directlydetermine the composition of the sales job and the personality and behavior ofthe selling team. Sales compensation is one of these decisions. Sales force effective-ness driver decisions ultimately affect all subsequent components of the sales man-agement system. The sales force effectiveness drivers are developed in Figure 1-3.
The sales force effectiveness drivers can be organized into five main categories.The Definers include all of the decisions that define the sales job. Three majortypes of decisions are included in this category:
• Sales strategy: specification of a customer segmentation (whom will we sellto?), a customer offering (what will we sell?), and a sales process (how willwe sell?)
• Go-to-market strategy: definition of the marketing channels, including thesales force, that will be used to carry out the sales strategy
PAGE 20................. 15869$ $CH1 05-19-06 09:22:23 PS

21S
alesFo
rceIncentive
Co
mp
ensation
andthe
SuccessfulS
alesO
rganizatio
nFigure 1-3. A sales management system framework: the sales force effectiveness drivers.
Shapers• Recruiting• Training• Coaching• Culture formation• Compensation
Enlighteners• Customer research• Targeting• Data and tools• CRM systems
Exciters• Leadership• Compensation• Motivation programs• Meaningful work
Controllers• Performance
management• Coordination systems• Vertical and
horizontalcommunication
• Compensation
Salesperson Drivers
Sales Job Definer Drivers
Sales Force Effectiveness Drivers
Salespeople Sales forceactivities
Customerresults
CompanyresultsDefiners
• Sales strategy• Go-to-market
strategy• Sales force design
PA
GE
21.................15869$
$CH
105-19-06
09:22:24P
S
22 The Complete Guide to Sales Force Incentive Compensation
• Sales force design: development of organization structure, sales roles, salesforce size, and sales territory alignment
Our 2004 book, Sales Force Design for Strategic Advantage, focuses exclusivelyon the sales force definers.
The remaining four categories of sales force effectiveness drivers contain thedecisions that influence the salesperson. The categories are:
• Shapers. The processes that shape the skills, capabilities, and values of thesales team, including strategies for culture formation; processes for hiring,training, and coaching salespeople; and processes for hiring and develop-ing the management team. Sales compensation plays an indirect role inshaping the sales force, as it influences what type of person is attracted tothe sales job and helps to shape the sales force culture.
• Enlighteners. The processes that provide the sales force with customer in-sight, enabling salespeople to understand the marketplace, prioritize op-portunities, solve customer problems, and use their time more effectively.Customer research, targeting, product prioritization, sales process design,CRM, and account planning are programs that fall into this category.
• Exciters. The decisions and programs that affect the selling organization’sinspiration and motivation, including how sales leaders inspire, the fulfill-ing nature of the work, and motivational programs. The sales compensa-tion plan has a major influence within the exciter category of drivers.
• Controllers. The systems that manage performance by defining success,setting expectations, and tracking performance. Sales compensation canalso play a role in controlling the sales force. For example, by paying ahigher commission rate on sales of the most profitable product lines or bypaying a bonus for sales to strategically important customers, the companyencourages sales force behaviors that are aligned with firm objectives.
The drivers are presented here in categories with clean lines of causality, butin reality the influence of each driver may cut across categories. For example,coaching has been placed in the shaper category, but it also has an element ofcontrol. Similarly, communication has been placed in the controller category, butit also can enlighten a salesperson. Compensation is the only driver that has beenplaced in multiple categories within the framework, since it is the focus of thisbook.
All of the sales force effectiveness drivers have consequences for the down-stream components of the sales management system: salespeople, sales force activ-ities, customer results, and company results. If the driver decisions are madecorrectly, the sales force is much more likely to be successful. Salespeople will beof top quality and will work within a success culture. The sales force will performthe right activities to satisfy customers. The firm’s strategic and financial objectives
PAGE 22................. 15869$ $CH1 05-19-06 09:22:25 PS
23Sales Force Incentive Compensation and the Successful Sales Organization
are much more likely to be achieved when a management team makes smart salesforce driver decisions and implements them well.
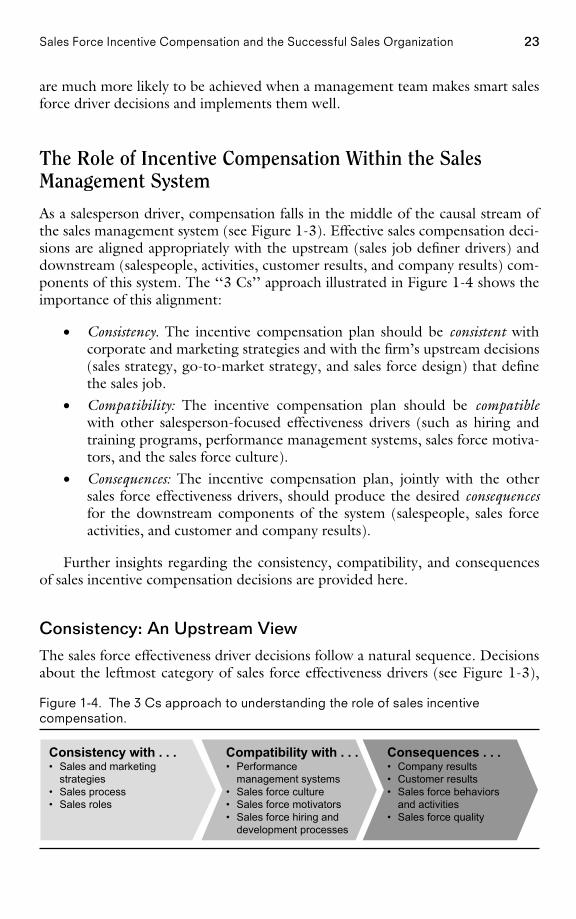
The Role of Incentive Compensation Within the SalesManagement System
As a salesperson driver, compensation falls in the middle of the causal stream ofthe sales management system (see Figure 1-3). Effective sales compensation deci-sions are aligned appropriately with the upstream (sales job definer drivers) anddownstream (salespeople, activities, customer results, and company results) com-ponents of this system. The ‘‘3 Cs’’ approach illustrated in Figure 1-4 shows theimportance of this alignment:
• Consistency. The incentive compensation plan should be consistent withcorporate and marketing strategies and with the firm’s upstream decisions(sales strategy, go-to-market strategy, and sales force design) that definethe sales job.
• Compatibility: The incentive compensation plan should be compatiblewith other salesperson-focused effectiveness drivers (such as hiring andtraining programs, performance management systems, sales force motiva-tors, and the sales force culture).
• Consequences: The incentive compensation plan, jointly with the othersales force effectiveness drivers, should produce the desired consequencesfor the downstream components of the system (salespeople, sales forceactivities, and customer and company results).
Further insights regarding the consistency, compatibility, and consequencesof sales incentive compensation decisions are provided here.
Consistency: An Upstream View
The sales force effectiveness driver decisions follow a natural sequence. Decisionsabout the leftmost category of sales force effectiveness drivers (see Figure 1-3),
Figure 1-4. The 3 Cs approach to understanding the role of sales incentivecompensation.
Compatibility with . . .• Performance
management systems• Sales force culture• Sales force motivators• Sales force hiring and
development processes
Consequences . . .• Company results• Customer results• Sales force behaviors
and activities• Sales force quality
Consistency with . . .• Sales and marketing
strategies• Sales process• Sales roles
PAGE 23................. 15869$ $CH1 05-19-06 09:22:26 PS
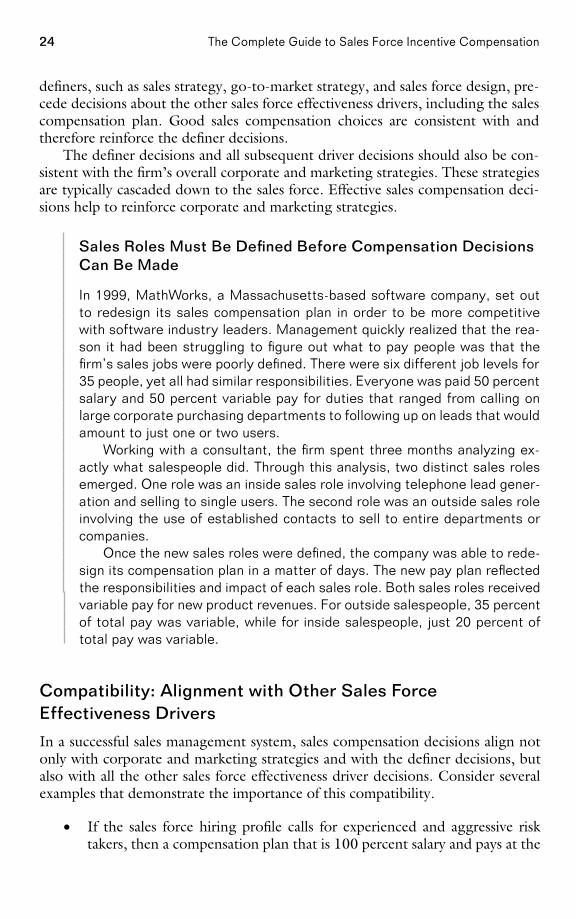
24 The Complete Guide to Sales Force Incentive Compensation
definers, such as sales strategy, go-to-market strategy, and sales force design, pre-cede decisions about the other sales force effectiveness drivers, including the salescompensation plan. Good sales compensation choices are consistent with andtherefore reinforce the definer decisions.
The definer decisions and all subsequent driver decisions should also be con-sistent with the firm’s overall corporate and marketing strategies. These strategiesare typically cascaded down to the sales force. Effective sales compensation deci-sions help to reinforce corporate and marketing strategies.
Sales Roles Must Be Defined Before Compensation DecisionsCan Be Made
In 1999, MathWorks, a Massachusetts-based software company, set outto redesign its sales compensation plan in order to be more competitivewith software industry leaders. Management quickly realized that the rea-son it had been struggling to figure out what to pay people was that thefirm’s sales jobs were poorly defined. There were six different job levels for35 people, yet all had similar responsibilities. Everyone was paid 50 percentsalary and 50 percent variable pay for duties that ranged from calling onlarge corporate purchasing departments to following up on leads that wouldamount to just one or two users.
Working with a consultant, the firm spent three months analyzing ex-actly what salespeople did. Through this analysis, two distinct sales rolesemerged. One role was an inside sales role involving telephone lead gener-ation and selling to single users. The second role was an outside sales roleinvolving the use of established contacts to sell to entire departments orcompanies.
Once the new sales roles were defined, the company was able to rede-sign its compensation plan in a matter of days. The new pay plan reflectedthe responsibilities and impact of each sales role. Both sales roles receivedvariable pay for new product revenues. For outside salespeople, 35 percentof total pay was variable, while for inside salespeople, just 20 percent oftotal pay was variable.
Compatibility: Alignment with Other Sales ForceEffectiveness Drivers
In a successful sales management system, sales compensation decisions align notonly with corporate and marketing strategies and with the definer decisions, butalso with all the other sales force effectiveness driver decisions. Consider severalexamples that demonstrate the importance of this compatibility.
• If the sales force hiring profile calls for experienced and aggressive risktakers, then a compensation plan that is 100 percent salary and pays at the
PAGE 24................. 15869$ $CH1 05-19-06 09:22:27 PS
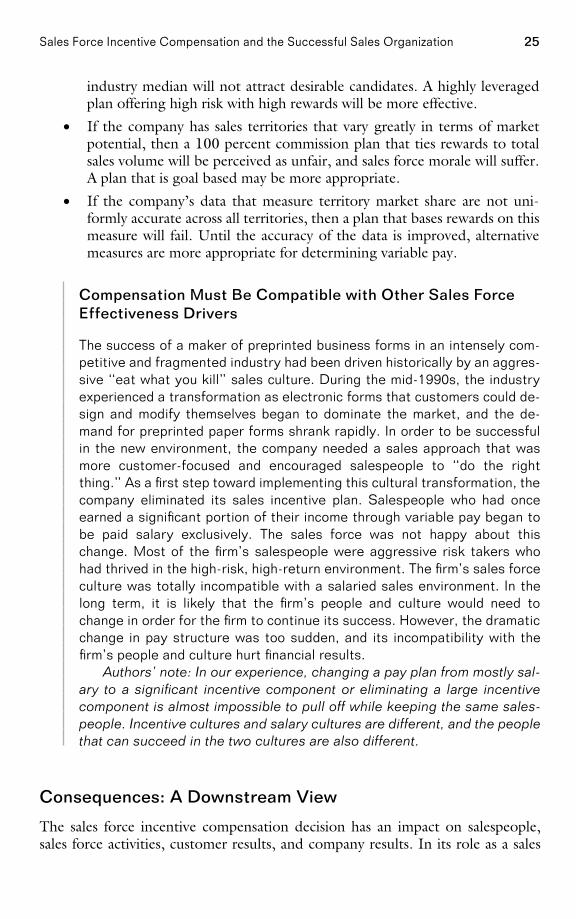
25Sales Force Incentive Compensation and the Successful Sales Organization
industry median will not attract desirable candidates. A highly leveragedplan offering high risk with high rewards will be more effective.
• If the company has sales territories that vary greatly in terms of marketpotential, then a 100 percent commission plan that ties rewards to totalsales volume will be perceived as unfair, and sales force morale will suffer.A plan that is goal based may be more appropriate.
• If the company’s data that measure territory market share are not uni-formly accurate across all territories, then a plan that bases rewards on thismeasure will fail. Until the accuracy of the data is improved, alternativemeasures are more appropriate for determining variable pay.
Compensation Must Be Compatible with Other Sales ForceEffectiveness Drivers
The success of a maker of preprinted business forms in an intensely com-petitive and fragmented industry had been driven historically by an aggres-sive ‘‘eat what you kill’’ sales culture. During the mid-1990s, the industryexperienced a transformation as electronic forms that customers could de-sign and modify themselves began to dominate the market, and the de-mand for preprinted paper forms shrank rapidly. In order to be successfulin the new environment, the company needed a sales approach that wasmore customer-focused and encouraged salespeople to ‘‘do the rightthing.’’ As a first step toward implementing this cultural transformation, thecompany eliminated its sales incentive plan. Salespeople who had onceearned a significant portion of their income through variable pay began tobe paid salary exclusively. The sales force was not happy about thischange. Most of the firm’s salespeople were aggressive risk takers whohad thrived in the high-risk, high-return environment. The firm’s sales forceculture was totally incompatible with a salaried sales environment. In thelong term, it is likely that the firm’s people and culture would need tochange in order for the firm to continue its success. However, the dramaticchange in pay structure was too sudden, and its incompatibility with thefirm’s people and culture hurt financial results.
Authors’ note: In our experience, changing a pay plan from mostly sal-ary to a significant incentive component or eliminating a large incentivecomponent is almost impossible to pull off while keeping the same sales-people. Incentive cultures and salary cultures are different, and the peoplethat can succeed in the two cultures are also different.
Consequences: A Downstream View
The sales force incentive compensation decision has an impact on salespeople,sales force activities, customer results, and company results. In its role as a sales
PAGE 25................. 15869$ $CH1 05-19-06 09:22:28 PS
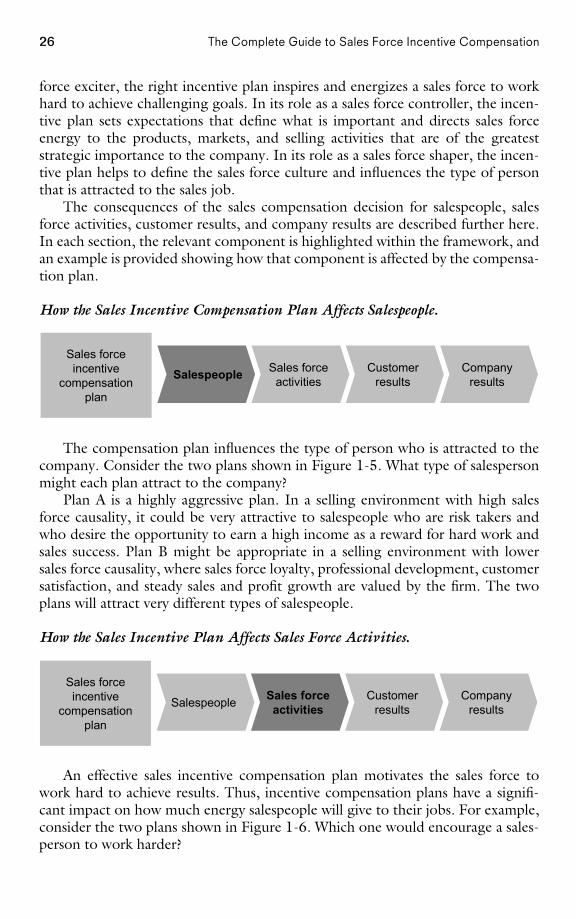
26 The Complete Guide to Sales Force Incentive Compensation
force exciter, the right incentive plan inspires and energizes a sales force to workhard to achieve challenging goals. In its role as a sales force controller, the incen-tive plan sets expectations that define what is important and directs sales forceenergy to the products, markets, and selling activities that are of the greateststrategic importance to the company. In its role as a sales force shaper, the incen-tive plan helps to define the sales force culture and influences the type of personthat is attracted to the sales job.
The consequences of the sales compensation decision for salespeople, salesforce activities, customer results, and company results are described further here.In each section, the relevant component is highlighted within the framework, andan example is provided showing how that component is affected by the compensa-tion plan.
How the Sales Incentive Compensation Plan Affects Salespeople.
Salespeople Sales forceactivities
Customerresults
Companyresults
Sales forceincentive
compensationplan
The compensation plan influences the type of person who is attracted to thecompany. Consider the two plans shown in Figure 1-5. What type of salespersonmight each plan attract to the company?
Plan A is a highly aggressive plan. In a selling environment with high salesforce causality, it could be very attractive to salespeople who are risk takers andwho desire the opportunity to earn a high income as a reward for hard work andsales success. Plan B might be appropriate in a selling environment with lowersales force causality, where sales force loyalty, professional development, customersatisfaction, and steady sales and profit growth are valued by the firm. The twoplans will attract very different types of salespeople.
How the Sales Incentive Plan Affects Sales Force Activities.
Salespeople Sales forceactivities
Customerresults
Companyresults
Sales forceincentive
compensationplan
An effective sales incentive compensation plan motivates the sales force towork hard to achieve results. Thus, incentive compensation plans have a signifi-cant impact on how much energy salespeople will give to their jobs. For example,consider the two plans shown in Figure 1-6. Which one would encourage a sales-person to work harder?
PAGE 26................. 15869$ $CH1 05-19-06 09:22:29 PS
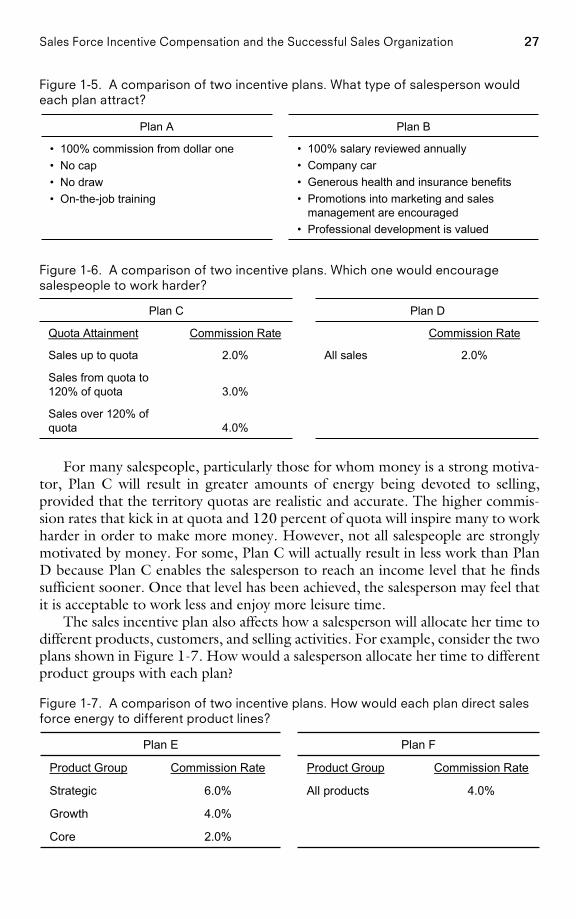
27Sales Force Incentive Compensation and the Successful Sales Organization
Figure 1-5. A comparison of two incentive plans. What type of salesperson wouldeach plan attract?
• 100% salary reviewed annually• Company car• Generous health and insurance benefits• Promotions into marketing and sales
management are encouraged• Professional development is valued
• 100% commission from dollar one• No cap• No draw• On-the-job training
Plan BPlan A
Figure 1-6. A comparison of two incentive plans. Which one would encouragesalespeople to work harder?
4.0%Sales over 120% ofquota
3.0%Sales from quota to120% of quota
2.0%All sales2.0%Sales up to quota
Commission RateCommission RateQuota Attainment
Plan DPlan C
For many salespeople, particularly those for whom money is a strong motiva-tor, Plan C will result in greater amounts of energy being devoted to selling,provided that the territory quotas are realistic and accurate. The higher commis-sion rates that kick in at quota and 120 percent of quota will inspire many to workharder in order to make more money. However, not all salespeople are stronglymotivated by money. For some, Plan C will actually result in less work than PlanD because Plan C enables the salesperson to reach an income level that he findssufficient sooner. Once that level has been achieved, the salesperson may feel thatit is acceptable to work less and enjoy more leisure time.
The sales incentive plan also affects how a salesperson will allocate her time todifferent products, customers, and selling activities. For example, consider the twoplans shown in Figure 1-7. How would a salesperson allocate her time to differentproduct groups with each plan?
Figure 1-7. A comparison of two incentive plans. How would each plan direct salesforce energy to different product lines?
2.0%Core
4.0%Growth
4.0%All products6.0%Strategic
Commission RateProduct GroupCommission RateProduct Group
Plan FPlan E
PAGE 27................. 15869$ $CH1 05-19-06 09:22:32 PS
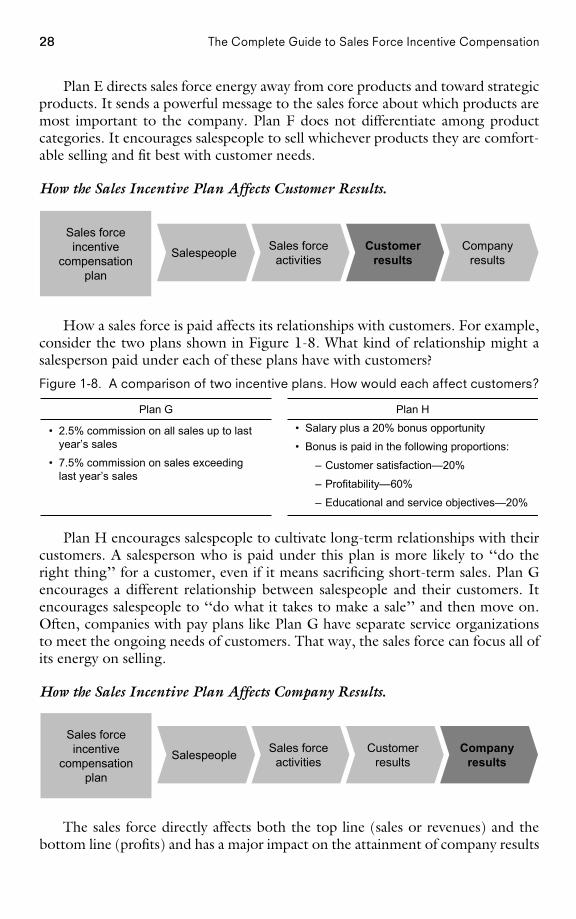
28 The Complete Guide to Sales Force Incentive Compensation
Plan E directs sales force energy away from core products and toward strategicproducts. It sends a powerful message to the sales force about which products aremost important to the company. Plan F does not differentiate among productcategories. It encourages salespeople to sell whichever products they are comfort-able selling and fit best with customer needs.
How the Sales Incentive Plan Affects Customer Results.
Salespeople Sales forceactivities
Customerresults
Companyresults
Sales forceincentive
compensationplan
How a sales force is paid affects its relationships with customers. For example,consider the two plans shown in Figure 1-8. What kind of relationship might asalesperson paid under each of these plans have with customers?
Figure 1-8. A comparison of two incentive plans. How would each affect customers?
• Salary plus a 20% bonus opportunity
• Bonus is paid in the following proportions:
– Customer satisfaction—20%
– Profitability—60%
– Educational and service objectives—20%
• 2.5% commission on all sales up to lastyear’s sales
• 7.5% commission on sales exceedinglast year’s sales
Plan HPlan G
Plan H encourages salespeople to cultivate long-term relationships with theircustomers. A salesperson who is paid under this plan is more likely to ‘‘do theright thing’’ for a customer, even if it means sacrificing short-term sales. Plan Gencourages a different relationship between salespeople and their customers. Itencourages salespeople to ‘‘do what it takes to make a sale’’ and then move on.Often, companies with pay plans like Plan G have separate service organizationsto meet the ongoing needs of customers. That way, the sales force can focus all ofits energy on selling.
How the Sales Incentive Plan Affects Company Results.
Salespeople Sales forceactivities
Customerresults
Companyresults
Sales forceincentive
compensationplan
The sales force directly affects both the top line (sales or revenues) and thebottom line (profits) and has a major impact on the attainment of company results
PAGE 28................. 15869$ $CH1 05-19-06 09:22:35 PS
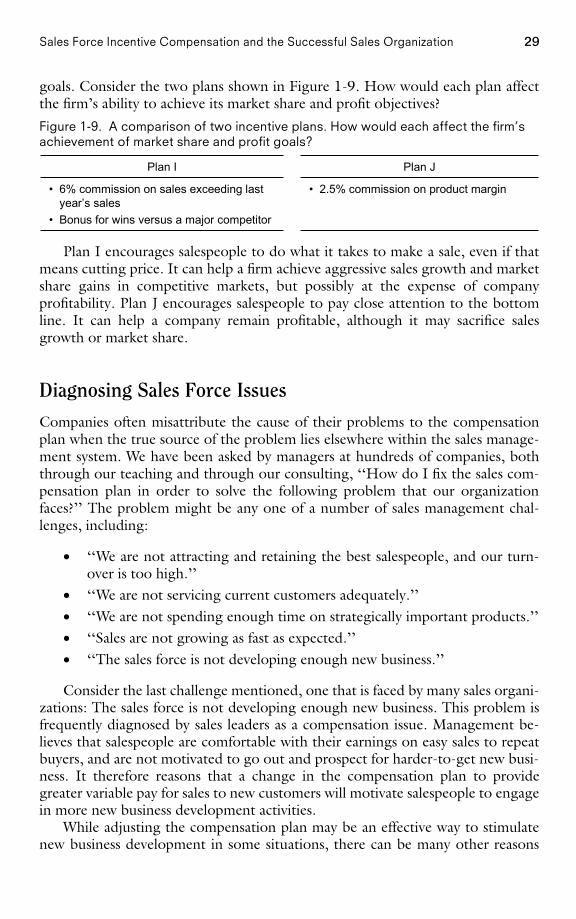
29Sales Force Incentive Compensation and the Successful Sales Organization
goals. Consider the two plans shown in Figure 1-9. How would each plan affectthe firm’s ability to achieve its market share and profit objectives?
Figure 1-9. A comparison of two incentive plans. How would each affect the firm’sachievement of market share and profit goals?
• 2.5% commission on product margin• 6% commission on sales exceeding lastyear’s sales
• Bonus for wins versus a major competitor
Plan JPlan I
Plan I encourages salespeople to do what it takes to make a sale, even if thatmeans cutting price. It can help a firm achieve aggressive sales growth and marketshare gains in competitive markets, but possibly at the expense of companyprofitability. Plan J encourages salespeople to pay close attention to the bottomline. It can help a company remain profitable, although it may sacrifice salesgrowth or market share.
Diagnosing Sales Force Issues
Companies often misattribute the cause of their problems to the compensationplan when the true source of the problem lies elsewhere within the sales manage-ment system. We have been asked by managers at hundreds of companies, boththrough our teaching and through our consulting, ‘‘How do I fix the sales com-pensation plan in order to solve the following problem that our organizationfaces?’’ The problem might be any one of a number of sales management chal-lenges, including:
• ‘‘We are not attracting and retaining the best salespeople, and our turn-over is too high.’’
• ‘‘We are not servicing current customers adequately.’’• ‘‘We are not spending enough time on strategically important products.’’• ‘‘Sales are not growing as fast as expected.’’• ‘‘The sales force is not developing enough new business.’’
Consider the last challenge mentioned, one that is faced by many sales organi-zations: The sales force is not developing enough new business. This problem isfrequently diagnosed by sales leaders as a compensation issue. Management be-lieves that salespeople are comfortable with their earnings on easy sales to repeatbuyers, and are not motivated to go out and prospect for harder-to-get new busi-ness. It therefore reasons that a change in the compensation plan to providegreater variable pay for sales to new customers will motivate salespeople to engagein more new business development activities.
While adjusting the compensation plan may be an effective way to stimulatenew business development in some situations, there can be many other reasons
PAGE 29................. 15869$ $CH1 05-19-06 09:22:36 PS
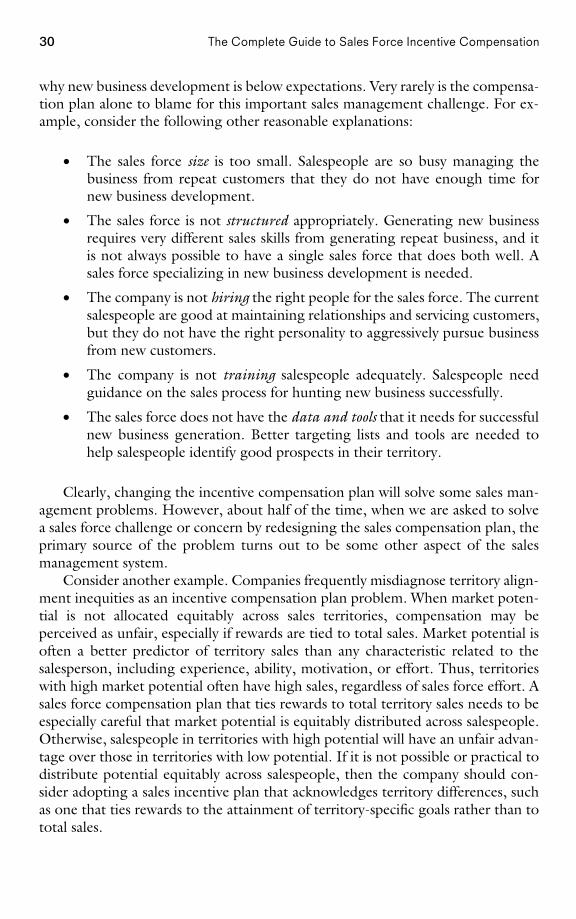
30 The Complete Guide to Sales Force Incentive Compensation
why new business development is below expectations. Very rarely is the compensa-tion plan alone to blame for this important sales management challenge. For ex-ample, consider the following other reasonable explanations:
• The sales force size is too small. Salespeople are so busy managing thebusiness from repeat customers that they do not have enough time fornew business development.
• The sales force is not structured appropriately. Generating new businessrequires very different sales skills from generating repeat business, and itis not always possible to have a single sales force that does both well. Asales force specializing in new business development is needed.
• The company is not hiring the right people for the sales force. The currentsalespeople are good at maintaining relationships and servicing customers,but they do not have the right personality to aggressively pursue businessfrom new customers.
• The company is not training salespeople adequately. Salespeople needguidance on the sales process for hunting new business successfully.
• The sales force does not have the data and tools that it needs for successfulnew business generation. Better targeting lists and tools are needed tohelp salespeople identify good prospects in their territory.
Clearly, changing the incentive compensation plan will solve some sales man-agement problems. However, about half of the time, when we are asked to solvea sales force challenge or concern by redesigning the sales compensation plan, theprimary source of the problem turns out to be some other aspect of the salesmanagement system.
Consider another example. Companies frequently misdiagnose territory align-ment inequities as an incentive compensation plan problem. When market poten-tial is not allocated equitably across sales territories, compensation may beperceived as unfair, especially if rewards are tied to total sales. Market potential isoften a better predictor of territory sales than any characteristic related to thesalesperson, including experience, ability, motivation, or effort. Thus, territorieswith high market potential often have high sales, regardless of sales force effort. Asales force compensation plan that ties rewards to total territory sales needs to beespecially careful that market potential is equitably distributed across salespeople.Otherwise, salespeople in territories with high potential will have an unfair advan-tage over those in territories with low potential. If it is not possible or practical todistribute potential equitably across salespeople, then the company should con-sider adopting a sales incentive plan that acknowledges territory differences, suchas one that ties rewards to the attainment of territory-specific goals rather than tototal sales.
PAGE 30................. 15869$ $CH1 05-19-06 09:22:37 PS
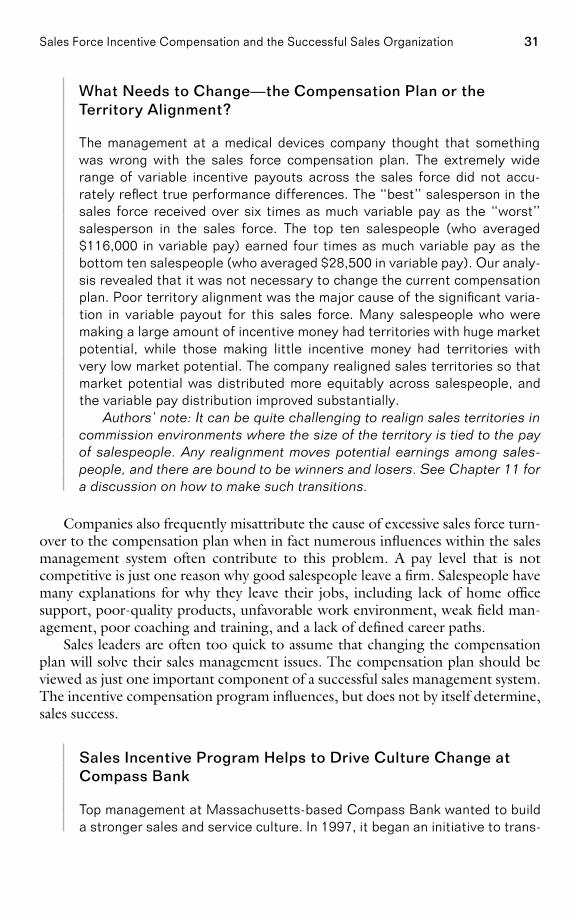
31Sales Force Incentive Compensation and the Successful Sales Organization
What Needs to Change—the Compensation Plan or theTerritory Alignment?
The management at a medical devices company thought that somethingwas wrong with the sales force compensation plan. The extremely widerange of variable incentive payouts across the sales force did not accu-rately reflect true performance differences. The ‘‘best’’ salesperson in thesales force received over six times as much variable pay as the ‘‘worst’’salesperson in the sales force. The top ten salespeople (who averaged$116,000 in variable pay) earned four times as much variable pay as thebottom ten salespeople (who averaged $28,500 in variable pay). Our analy-sis revealed that it was not necessary to change the current compensationplan. Poor territory alignment was the major cause of the significant varia-tion in variable payout for this sales force. Many salespeople who weremaking a large amount of incentive money had territories with huge marketpotential, while those making little incentive money had territories withvery low market potential. The company realigned sales territories so thatmarket potential was distributed more equitably across salespeople, andthe variable pay distribution improved substantially.
Authors’ note: It can be quite challenging to realign sales territories incommission environments where the size of the territory is tied to the payof salespeople. Any realignment moves potential earnings among sales-people, and there are bound to be winners and losers. See Chapter 11 fora discussion on how to make such transitions.
Companies also frequently misattribute the cause of excessive sales force turn-over to the compensation plan when in fact numerous influences within the salesmanagement system often contribute to this problem. A pay level that is notcompetitive is just one reason why good salespeople leave a firm. Salespeople havemany explanations for why they leave their jobs, including lack of home officesupport, poor-quality products, unfavorable work environment, weak field man-agement, poor coaching and training, and a lack of defined career paths.
Sales leaders are often too quick to assume that changing the compensationplan will solve their sales management issues. The compensation plan should beviewed as just one important component of a successful sales management system.The incentive compensation program influences, but does not by itself determine,sales success.
Sales Incentive Program Helps to Drive Culture Change atCompass Bank
Top management at Massachusetts-based Compass Bank wanted to builda stronger sales and service culture. In 1997, it began an initiative to trans-
PAGE 31................. 15869$ $CH1 05-19-06 09:22:38 PS
32 The Complete Guide to Sales Force Incentive Compensation
form tellers and other retail customer–facing bank employees from mereorder takers to proactive sellers of the bank’s products and services. Topmanagement was anxious to put a sales incentive program in place quicklyto jump-start the effort. However, an assessment of the bank’s currentsales climate revealed that several other sales force effectiveness driversneeded to be upgraded first. Job descriptions were enhanced to make itclear to employees that selling was an expected part of their job. A salestraining program was implemented to teach employees how to spot salesopportunities and sell effectively. A PC-based sales tracking and measure-ment system was put in place. Back-office processes were improved, mak-ing it possible for salespeople to deliver effectively on their promises tocustomers. Branch managers hired assistants so that they would haveenough time to both oversee the sales effort and manage the day-to-daybusiness operations.
After considerable preparation, the bank implemented a new sales in-centive compensation plan. Every branch was assigned a quota to meet fordeposits and deposit-related services. Incentive money began to accumu-late in a branch incentive pool once the branch passed its historical level ofsales for these products. An additional kicker was added to the pool oncethe branch passed its quota. The pool provided payouts for tellers, salesemployees, and branch managers. Additional incentive money was given tothe branch that came in first among all the branches. Based on the successof the scheme, the bank extended the incentive program to loan productsand services.
How This Book Is Organized
This book is designed to help answer two major questions:
1. What is the best design for the sales force incentive compensation plan?
2. How does a sales organization effectively make the transition to a newincentive compensation plan?
As shown in the organizational overview of the book in Figure 1-10, fourmain themes are emphasized:
1. The role of incentives within the context of the sales management system(Chapter 1)
2. Techniques and analytical methods for effective incentive compensationplan assessment (Chapters 2 and 8)
3. Frameworks and approaches that enable successful incentive compensa-tion plan design (Chapters 3, 4, 5, 6, 7, 9 and 10)
PAGE 32................. 15869$ $CH1 05-19-06 09:22:38 PS
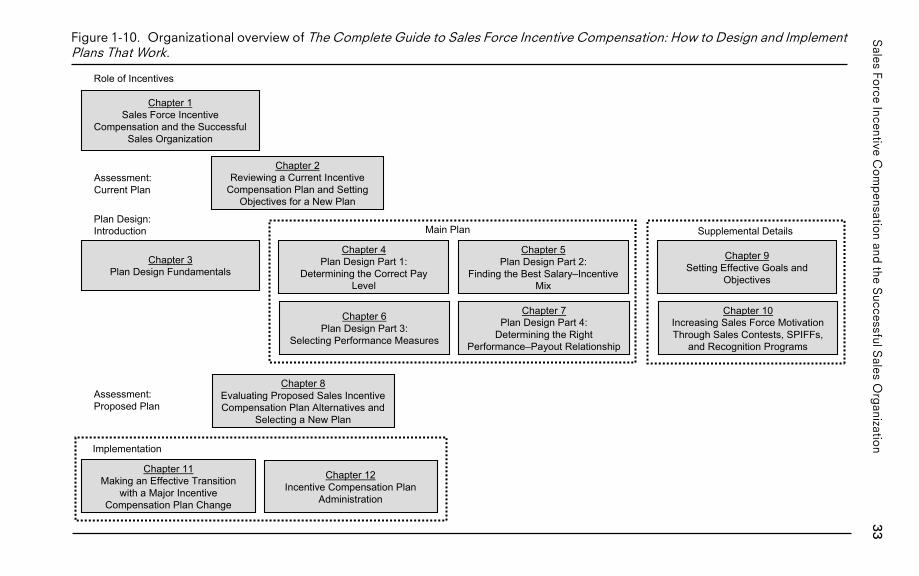
33S
alesFo
rceIncentive
Co
mp
ensation
andthe
SuccessfulS
alesO
rganizatio
nFigure 1-10. Organizational overview of The Complete Guide to Sales Force Incentive Compensation: How to Design and ImplementPlans That Work.
Chapter 1Sales Force Incentive
Compensation and the SuccessfulSales Organization
Role of Incentives
Plan Design:Introduction
Assessment:Proposed Plan
Supplemental Details
Implementation
Chapter 2Reviewing a Current Incentive
Compensation Plan and SettingObjectives for a New Plan
Assessment:Current Plan
Chapter 3Plan Design Fundamentals
Chapter 4Plan Design Part 1:
Determining the Correct PayLevel
Chapter 5Plan Design Part 2:
Finding the Best Salary–IncentiveMix
Main Plan
Chapter 9Setting Effective Goals and
Objectives
Chapter 6Plan Design Part 3:
Selecting Performance Measures
Chapter 7Plan Design Part 4:
Determining the RightPerformance–Payout Relationship
Chapter 10Increasing Sales Force MotivationThrough Sales Contests, SPIFFs,
and Recognition Programs
Chapter 8Evaluating Proposed Sales IncentiveCompensation Plan Alternatives and
Selecting a New Plan
Chapter 11Making an Effective Transition
with a Major IncentiveCompensation Plan Change
Chapter 12Incentive Compensation Plan
Administration
PA
GE
33.................15869$
$CH
105-19-06
09:22:39P
S
34 The Complete Guide to Sales Force Incentive Compensation
4. Approaches for successful incentive plan implementation (Chapters 11 and12)
A summary of each chapter is provided here.
Chapter 1: Sales Force Incentive Compensation and theSuccessful Sales Organization
As markets and company strategies evolve, successful companies adapt their salesincentive compensation plans to ensure that sales force energy stays appropriatelyaligned. Sales force compensation decisions are never taken lightly, as they have asignificant impact on customers, salespeople, and company performance. Thischapter presents a framework for understanding the important role that a salesforce compensation plan plays within the sales management system.
Chapter 2: Reviewing a Current Incentive Compensation Planand Setting Objectives for a New Plan
Does your company’s sales incentive compensation plan attract and retain theright salespeople? Does it motivate the sales force to perform the activities thatsupport the firm’s business strategy? Does it help to create satisfied customers? Isit producing the business results that the firm desires? This chapter presents aframework for assessing the effectiveness of an existing sales incentive compensa-tion plan and for identifying how the plan may need to be adapted as companystrategies and market conditions evolve. Specific metrics and diagnostic tools areprovided to help you identify potential problems and areas for improvement andchange.
Chapter 3: Plan Design Fundamentals
This chapter organizes the sales compensation plan design process by introducingsome important terminology and summarizing four key sales compensation plandesign decisions.
Chapter 4: Plan Design Part 1: Determining the Correct PayLevel
This chapter focuses on how to determine the level of total pay (target pay) thatis appropriate for the sales force, including both salary and incentive (or variablepay) components. The chapter also shares insights on how pay level should varywith performance; for example, how much should a top performer earn relative
PAGE 34................. 15869$ $CH1 05-19-06 09:22:39 PS
35Sales Force Incentive Compensation and the Successful Sales Organization
to an average performer? A variety of external and internal factors influence thesales force pay level and variation. From an external market perspective, the rightpay level allows the firm to attract and retain good salespeople who can implementthe firm’s selling process effectively. From an internal company perspective, thesales force pay level is commensurate with the value that a sales role creates and isconsistent with the firm’s culture.
Chapter 5: Plan Design Part 2: Finding the BestSalary–Incentive Mix
What proportion of sales force compensation should be salary and what propor-tion should be incentive? The answer to this question varies greatly across indus-tries, companies, and sales roles. This chapter describes a range of diversecompensation environments—from 100 percent salary to 100 percent incentive—and explores how the firm’s sales process and ability to measure results accuratelydrive pay mix decisions. In addition, industry norms and company history, cul-ture, and management philosophy influence the salary–incentive mix.
Chapter 6: Plan Design Part 3: Selecting PerformanceMeasures
This chapter explores how to select the performance measures used to determinethe incentive plan payout. For example, should salespeople be paid for their resultsor for their activities? Should they be paid for absolute performance or for per-formance relative to a goal or quota? Which products, customers, or sales channelsshould be included? What timing and frequency of performance measurement ismost effective? The best incentive plans are based on no more than three or fourperformance metrics that are important for the business and compatible with thefirm’s strategy, can be affected by sales force activity, and are objective, fair, andmeasurable.
Chapter 7: Plan Design Part 4: Determining the RightPerformance–Payout Relationship
This chapter focuses on how the performance–payout relationship in an incentiveplan affects the firm’s ability to achieve important objectives, such as rewardingtop performers, increasing sales force motivation, and controlling incentive plancosts. The chapter addresses numerous incentive plan design issues, such aswhether to include bonuses, commissions, or both; when to begin incentive pay-ment (for example, from the first dollar, from goal, or from some fraction of goal);under what conditions to make payout curves progressive or regressive (including
PAGE 35................. 15869$ $CH1 05-19-06 09:22:40 PS
36 The Complete Guide to Sales Force Incentive Compensation
when to use payout caps); and how to incorporate multiple performance mea-sures.
Chapter 8: Evaluating Proposed Sales Incentive CompensationPlan Alternatives and Selecting a New PlanNo single incentive plan can solve every sales management problem. A compensa-tion plan that has many advantages will at the same time encourage some salesforce behavior that is undesirable, and this must be planned for and managed.The prudent firm will test any proposed new incentive before it is launched. Thischapter explains how to evaluate and compare proposed sales incentive compensa-tion plans, both quantitatively and qualitatively, in order to select the best planfor a specific selling environment.
Chapter 9: Setting Effective Goals and ObjectivesOrganizations and individuals that are goal-focused are typically more successfulin the long run than those that do not set goals for themselves. Over 85 percentof companies incorporate goals into their sales force incentive plans. Yet whengoals are too difficult, too easy, or not assigned fairly across the sales force, thereare adverse consequences for sales force motivation, morale, costs, and expecta-tions. This chapter describes effective formulas and processes that companies canuse to set territory-level goals that are fair, realistic, and motivational.
Chapter 10: Increasing Sales Force Motivation Through SalesContests, SPIFFs, and Recognition ProgramsSales contests, SPIFFs (Special Performance Incentives for Field Force), and rec-ognition programs are a powerful and relatively inexpensive way to enhance a salesforce incentive program. When used appropriately, such add-on incentives caneffectively focus sales force attention on specific short-term goals, improve moraleand team effort, and recognize the extraordinary efforts of top-performing sales-people. Yet contests, SPIFFs, and recognition programs harbor some dangers.Too many add-on plans can confuse salespeople, or can divert sales force attentionaway from strategically important products or customers. This chapter providesadvice on how to create and manage fair and effective sales contests, SPIFFs, andrecognition programs that support the firm’s strategic goals.
Chapter 11: Making an Effective Transition with a MajorIncentive Compensation Plan ChangeImplementing a new sales incentive compensation plan successfully is often morechallenging than designing the plan itself. This chapter describes a framework for
PAGE 36................. 15869$ $CH1 05-19-06 09:22:40 PS
37Sales Force Incentive Compensation and the Successful Sales Organization
understanding sales force change and provides insight on how to successfullymake the transition to a new sales compensation philosophy. It addresses how toimplement a major change in the pay mix effectively, how to deal with incentiveplan changes that significantly redistribute money among salespeople, how to im-plement a pay cut, and how to deal with incentives during territory realignments.The chapter suggests work steps and best practices for managing a successful im-plementation, including how to effectively communicate plan features and bene-fits to the field.
Chapter 12: Incentive Compensation Plan Administration
Creating an efficient and effective process for ongoing compensation plan admin-istration is a challenge. A high-quality administration system enhances sales forcemotivation by producing accurate and timely payments and by communicatinginformation that lets salespeople know how they are doing and how they canimprove. In addition, an effective administration system produces plan healthcheck reports that allow sales leaders to assess plan quality and take mid-coursecorrective steps as needed. This chapter shares many insights for developing aflexible and cost-effective compensation administration system that supports thelong-term success of a sales incentive plan.
PAGE 37................. 15869$ $CH1 05-19-06 09:22:40 PS
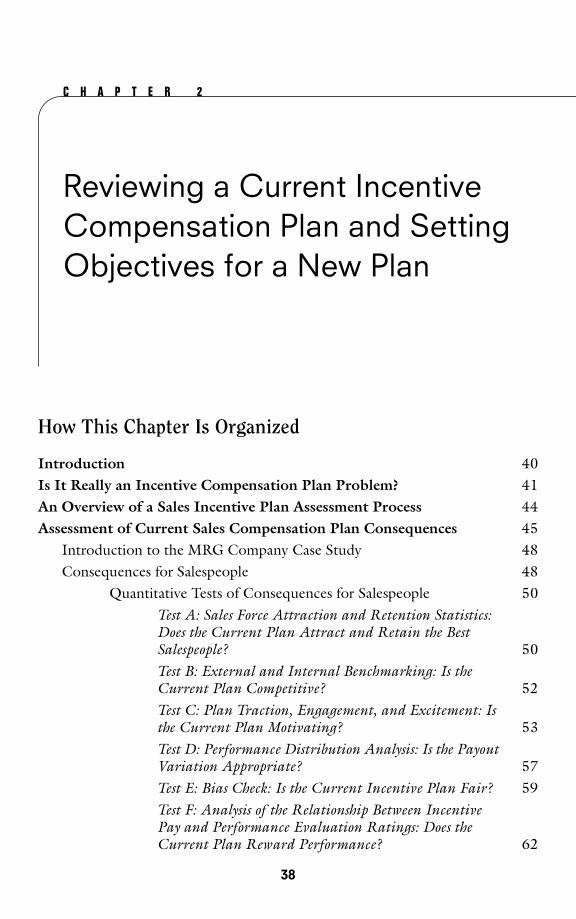
C H A P T E R 2
Reviewing a Current IncentiveCompensation Plan and SettingObjectives for a New Plan
How This Chapter Is Organized
Introduction 40Is It Really an Incentive Compensation Plan Problem? 41An Overview of a Sales Incentive Plan Assessment Process 44Assessment of Current Sales Compensation Plan Consequences 45
Introduction to the MRG Company Case Study 48Consequences for Salespeople 48
Quantitative Tests of Consequences for Salespeople 50Test A: Sales Force Attraction and Retention Statistics:Does the Current Plan Attract and Retain the BestSalespeople? 50Test B: External and Internal Benchmarking: Is theCurrent Plan Competitive? 52Test C: Plan Traction, Engagement, and Excitement: Isthe Current Plan Motivating? 53Test D: Performance Distribution Analysis: Is the PayoutVariation Appropriate? 57Test E: Bias Check: Is the Current Incentive Plan Fair? 59Test F: Analysis of the Relationship Between IncentivePay and Performance Evaluation Ratings: Does theCurrent Plan Reward Performance? 62
PAGE 38
38
................. 15869$ $CH2 05-19-06 09:22:21 PS
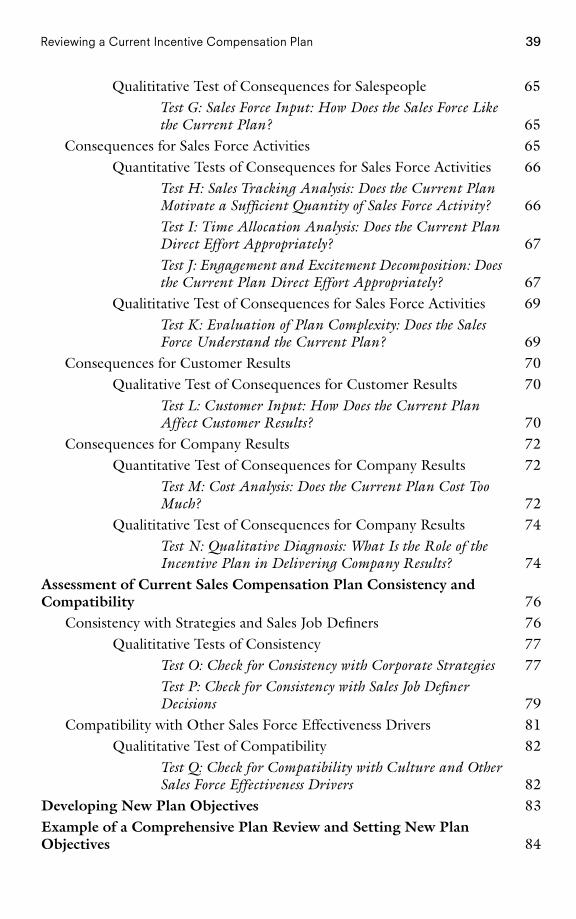
39Reviewing a Current Incentive Compensation Plan
Qualititative Test of Consequences for Salespeople 65Test G: Sales Force Input: How Does the Sales Force Likethe Current Plan? 65
Consequences for Sales Force Activities 65Quantitative Tests of Consequences for Sales Force Activities 66
Test H: Sales Tracking Analysis: Does the Current PlanMotivate a Sufficient Quantity of Sales Force Activity? 66Test I: Time Allocation Analysis: Does the Current PlanDirect Effort Appropriately? 67Test J: Engagement and Excitement Decomposition: Doesthe Current Plan Direct Effort Appropriately? 67
Qualititative Test of Consequences for Sales Force Activities 69Test K: Evaluation of Plan Complexity: Does the SalesForce Understand the Current Plan? 69
Consequences for Customer Results 70Qualitative Test of Consequences for Customer Results 70
Test L: Customer Input: How Does the Current PlanAffect Customer Results? 70
Consequences for Company Results 72Quantitative Test of Consequences for Company Results 72
Test M: Cost Analysis: Does the Current Plan Cost TooMuch? 72
Qualititative Test of Consequences for Company Results 74Test N: Qualitative Diagnosis: What Is the Role of theIncentive Plan in Delivering Company Results? 74
Assessment of Current Sales Compensation Plan Consistency andCompatibility 76
Consistency with Strategies and Sales Job Definers 76Qualititative Tests of Consistency 77
Test O: Check for Consistency with Corporate Strategies 77Test P: Check for Consistency with Sales Job DefinerDecisions 79
Compatibility with Other Sales Force Effectiveness Drivers 81Qualititative Test of Compatibility 82
Test Q: Check for Compatibility with Culture and OtherSales Force Effectiveness Drivers 82
Developing New Plan Objectives 83Example of a Comprehensive Plan Review and Setting New PlanObjectives 84
PAGE 39................. 15869$ $CH2 05-19-06 09:22:21 PS
40 The Complete Guide to Sales Force Incentive Compensation
Introduction
A sales executive at an insurance company recently asked, ‘‘How do I know if themultimillions of dollars my company spends on sales incentive compensation arereally driving the sales force behaviors we desire and are supporting our businessstrategy effectively?’’ This is an important question, but finding an answer is notalways easy. A sales incentive plan can have a significant impact on sales forcebehavior and on sales results, yet that impact is often subtle and nonobservable.A successful review of a company’s current sales force compensation plan is animportant first step for any management team that wants to determine if a changein the compensation plan can improve sales effectiveness. Such a review needs togo beyond simplistic observations such as ‘‘We made our numbers; the planworked great’’ or ‘‘The company is 7 percent below target; the plan needs to befixed.’’
Some parts of the sales compensation plan review are very simple—for exam-ple, ‘‘What did the incentive plan cost the firm versus the budgeted amount?’’Other parts of the review are more complex—for example, ‘‘Are salespeople moti-vated by the plan, and does the plan encourage salespeople to succeed?’’ Reviewscan include both quantitative and qualitative evaluations. Quantitative analysismight include a financial breakdown of the plan’s cost, while a qualitative evalua-tion might include a survey of the firm’s sales force to determine how salespeoplefeel about the plan. In addition, a review of the sales compensation plan caninclude views that are both short-term and long-term. A short-term view mightlook at the plan’s impact on sales this quarter or this year. A longer-term viewmight look at a sales trend over multiple years or at data on the attraction andretention of high-performing salespeople.
All companies reevaluate their sales incentive compensation plans periodically,and many make changes with some regularity. Incentive plan change tends to bedriven by two forces, as shown in Figure 2-1. First, there is the need to look aheadand adapt the plan to take into account external forces and company strategychanges. For example, evolving customer needs, changing competition, advanc-ing technology, a shifting economy, and company plans to launch new productsor enter new markets are just some of the forces that can require adjustments inthe sales incentive plan in order to keep sales force effort aligned with companyobjectives. The need to adapt all of the sales force effectiveness drivers, includingthe sales compensation plan, to the various customer, competitive, environmental,and company forces that influence a sales force is discussed in Chapter 1.
Second, successful companies are constantly examining their past performanceto find ways in which they can improve, particularly in areas that are closely linkedto sales success, such as incentive compensation. A historical review of the currentincentive plan may reveal that the incentive plan is not driving the activity or theresults that the company desires. By understanding what elements of the compen-sation plan have and have not worked well in the past, a management team learnsfrom its mistakes, fixes problems, and evolves to become better. This chapter
PAGE 40................. 15869$ $CH2 05-19-06 09:22:22 PS
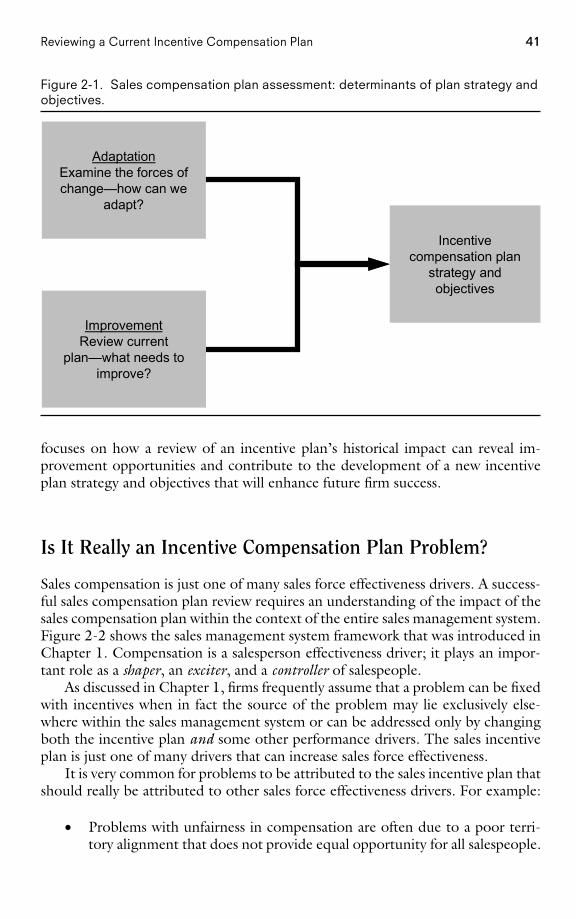
41Reviewing a Current Incentive Compensation Plan
Figure 2-1. Sales compensation plan assessment: determinants of plan strategy andobjectives.
ImprovementReview current
plan—what needs toimprove?
AdaptationExamine the forces ofchange—how can we
adapt?
Incentivecompensation plan
strategy andobjectives
focuses on how a review of an incentive plan’s historical impact can reveal im-provement opportunities and contribute to the development of a new incentiveplan strategy and objectives that will enhance future firm success.
Is It Really an Incentive Compensation Plan Problem?
Sales compensation is just one of many sales force effectiveness drivers. A success-ful sales compensation plan review requires an understanding of the impact of thesales compensation plan within the context of the entire sales management system.Figure 2-2 shows the sales management system framework that was introduced inChapter 1. Compensation is a salesperson effectiveness driver; it plays an impor-tant role as a shaper, an exciter, and a controller of salespeople.
As discussed in Chapter 1, firms frequently assume that a problem can be fixedwith incentives when in fact the source of the problem may lie exclusively else-where within the sales management system or can be addressed only by changingboth the incentive plan and some other performance drivers. The sales incentiveplan is just one of many drivers that can increase sales force effectiveness.
It is very common for problems to be attributed to the sales incentive plan thatshould really be attributed to other sales force effectiveness drivers. For example:
• Problems with unfairness in compensation are often due to a poor terri-tory alignment that does not provide equal opportunity for all salespeople.
PAGE 41................. 15869$ $CH2 05-19-06 09:22:23 PS
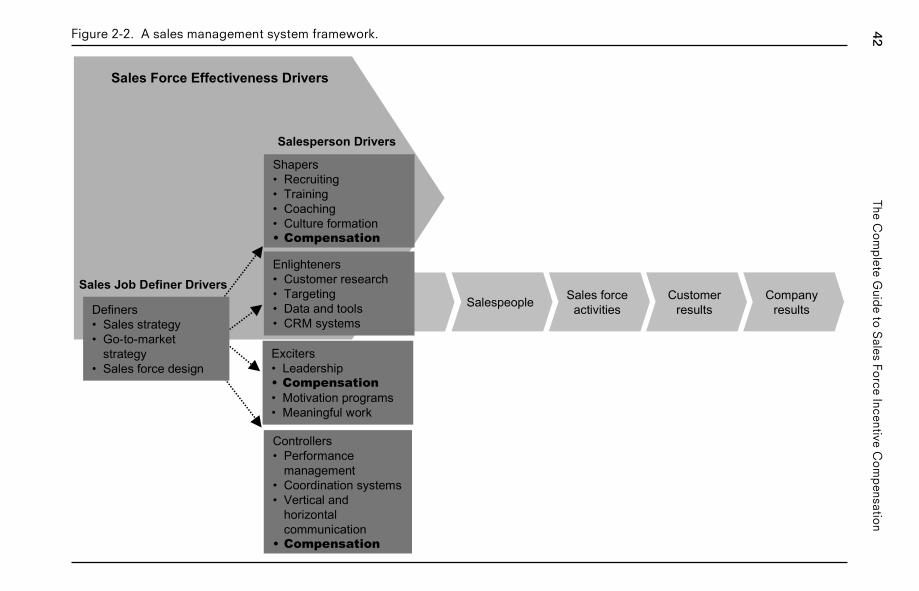
42The
Co
mp
leteG
uide
toS
alesFo
rceIncentive
Co
mp
ensation
Figure 2-2. A sales management system framework.
Shapers• Recruiting• Training• Coaching• Culture formation• Compensation
Enlighteners• Customer research• Targeting• Data and tools• CRM systems
Exciters• Leadership• Compensation• Motivation programs• Meaningful work
Controllers• Performance
management• Coordination systems• Vertical and
horizontalcommunication
• Compensation
Salesperson Drivers
Sales Job Definer DriversSalespeople Sales force
activitiesCustomer
resultsCompany
resultsDefiners• Sales strategy• Go-to-market
strategy• Sales force design
Sales Force Effectiveness Drivers
PA
GE
42.................15869$
$CH
205-19-06
09:22:24P
S
43Reviewing a Current Incentive Compensation Plan
• Problems with misdirection, such as the sales force not spending enoughtime on a particular product or a certain selling activity, may be due to alack of proper sales force training on that product or activity.
• Problems with retention of good salespeople may be caused by weak salesmanagers or an unhealthy sales force culture, rather than by the compen-sation plan.
• Problems of inadequate new account development may be due to too fewsalespeople, a lack of specialization, or poor training.
Before starting a major project to review and fix a sales compensation plan, besure to consider all the sales force effectiveness drivers that may contribute to theproblem. Very rarely is a redesign of the compensation plan a complete solutionby itself.
Even when the cause of a problem does originate within the compensationsystem, the problem is frequently not with the design of the main incentive planitself. For example:
• With goal-based sales incentive plans, poor goal setting is a common causeof inadequate sales force motivation, low morale, and high turnover.Goals that are not reasonable or fair can cause a good incentive plan tofail. Goal setting is discussed further in Chapter 9.
• Many firms run ad hoc SPIFFs and sales contests that are not part of thefirm’s main incentive plan. When such programs are not centrally coordi-nated and strategically aligned, they can divert sales force attention awayfrom the most important strategic priorities and dilute the impact of themain incentive plan. SPIFFs and sales contests are discussed further inChapter 10.
• Poor implementation of a transition to a new sales incentive plan can causea good plan to fail. Common implementation errors include insufficientcommunication with the sales force, a lack of key stakeholder buy-in, andineffective or nonexistent transition strategies for top-performing sales-people. Effective strategies for implementing a new incentive compensa-tion plan are discussed further in Chapter 11.
• Poor incentive compensation plan administration can lead to decreasedsales force effectiveness. Common plan administration errors include re-ports that are late in getting out to the field or that contain inaccuratedata and calculation errors, inflexible systems that cannot adapt to ad hocor medium-term needs, and inadequate or nonexistent feedback systemsthat provide too little or confusing information to the field and manage-ment about incentive plan performance. Incentive plan administration isdiscussed further in Chapter 12.
Before assuming that the compensation plan needs to be redesigned, considerthe possibility that the firm’s goal-setting method, ad hoc SPIFFs and sales con-
PAGE 43................. 15869$ $CH2 05-19-06 09:22:24 PS
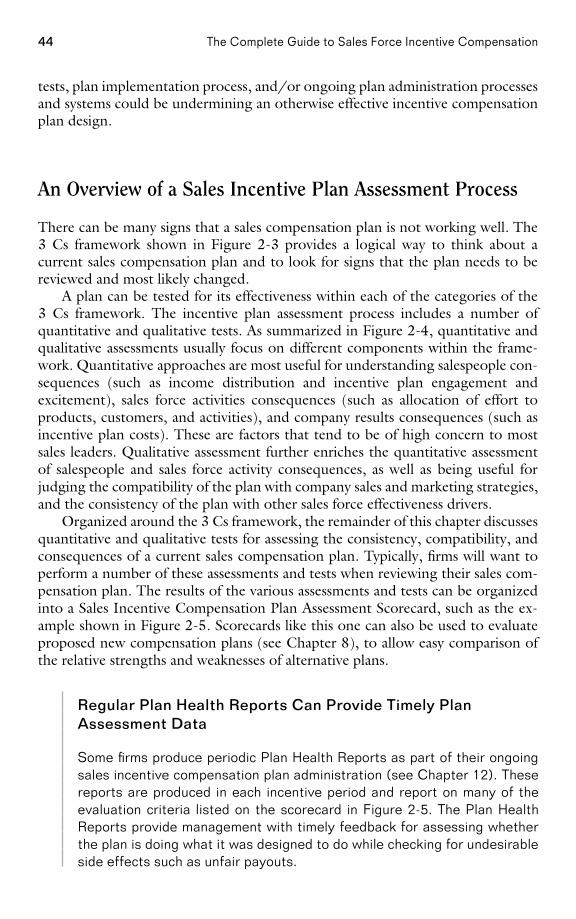
44 The Complete Guide to Sales Force Incentive Compensation
tests, plan implementation process, and/or ongoing plan administration processesand systems could be undermining an otherwise effective incentive compensationplan design.
An Overview of a Sales Incentive Plan Assessment Process
There can be many signs that a sales compensation plan is not working well. The3 Cs framework shown in Figure 2-3 provides a logical way to think about acurrent sales compensation plan and to look for signs that the plan needs to bereviewed and most likely changed.
A plan can be tested for its effectiveness within each of the categories of the3 Cs framework. The incentive plan assessment process includes a number ofquantitative and qualitative tests. As summarized in Figure 2-4, quantitative andqualitative assessments usually focus on different components within the frame-work. Quantitative approaches are most useful for understanding salespeople con-sequences (such as income distribution and incentive plan engagement andexcitement), sales force activities consequences (such as allocation of effort toproducts, customers, and activities), and company results consequences (such asincentive plan costs). These are factors that tend to be of high concern to mostsales leaders. Qualitative assessment further enriches the quantitative assessmentof salespeople and sales force activity consequences, as well as being useful forjudging the compatibility of the plan with company sales and marketing strategies,and the consistency of the plan with other sales force effectiveness drivers.
Organized around the 3 Cs framework, the remainder of this chapter discussesquantitative and qualitative tests for assessing the consistency, compatibility, andconsequences of a current sales compensation plan. Typically, firms will want toperform a number of these assessments and tests when reviewing their sales com-pensation plan. The results of the various assessments and tests can be organizedinto a Sales Incentive Compensation Plan Assessment Scorecard, such as the ex-ample shown in Figure 2-5. Scorecards like this one can also be used to evaluateproposed new compensation plans (see Chapter 8), to allow easy comparison ofthe relative strengths and weaknesses of alternative plans.
Regular Plan Health Reports Can Provide Timely PlanAssessment Data
Some firms produce periodic Plan Health Reports as part of their ongoingsales incentive compensation plan administration (see Chapter 12). Thesereports are produced in each incentive period and report on many of theevaluation criteria listed on the scorecard in Figure 2-5. The Plan HealthReports provide management with timely feedback for assessing whetherthe plan is doing what it was designed to do while checking for undesirableside effects such as unfair payouts.
PAGE 44
................. 15869$ $CH2 05-19-06 09:22:25 PS
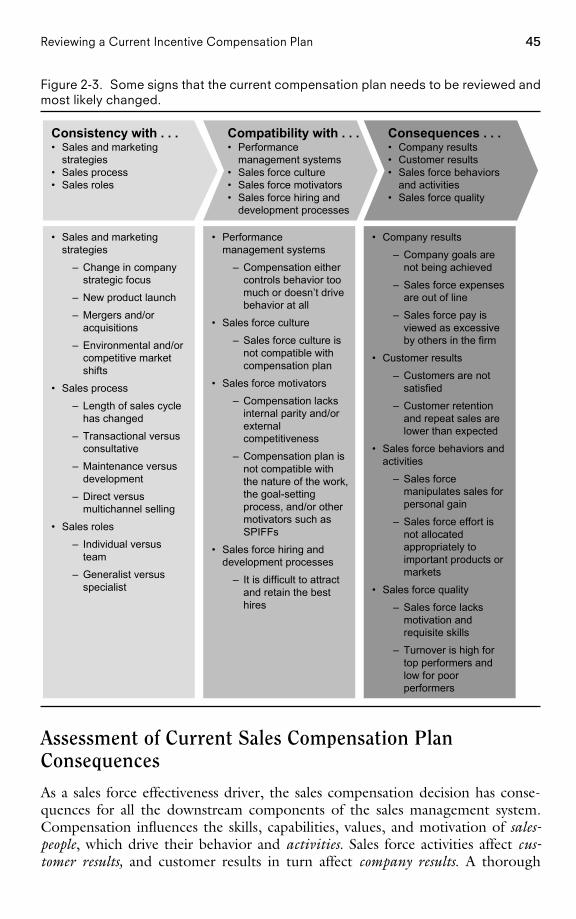
45Reviewing a Current Incentive Compensation Plan
Figure 2-3. Some signs that the current compensation plan needs to be reviewed andmost likely changed.
Compatibility with . . .• Performance
management systems• Sales force culture• Sales force motivators• Sales force hiring and
development processes
• Sales and marketingstrategies
– Change in companystrategic focus
– New product launch
– Mergers and/oracquisitions
– Environmental and/orcompetitive marketshifts
• Sales process
– Length of sales cyclehas changed
– Transactional versusconsultative
– Maintenance versusdevelopment
– Direct versusmultichannel selling
• Sales roles
– Individual versusteam
– Generalist versusspecialist
Consequences . . .• Company results• Customer results• Sales force behaviors
and activities• Sales force quality
Consistency with . . .• Sales and marketing
strategies• Sales process• Sales roles
• Performancemanagement systems
– Compensation eithercontrols behavior toomuch or doesn’t drivebehavior at all
• Sales force culture
– Sales force culture isnot compatible withcompensation plan
• Sales force motivators
– Compensation lacksinternal parity and/orexternalcompetitiveness
– Compensation plan isnot compatible withthe nature of the work,the goal-settingprocess, and/or othermotivators such asSPIFFs
• Sales force hiring anddevelopment processes
– It is difficult to attractand retain the besthires
• Company results
– Company goals arenot being achieved
– Sales force expensesare out of line
– Sales force pay isviewed as excessiveby others in the firm
• Customer results
– Customers are notsatisfied
– Customer retentionand repeat sales arelower than expected
• Sales force behaviors andactivities
– Sales forcemanipulates sales forpersonal gain
– Sales force effort isnot allocatedappropriately toimportant products ormarkets
• Sales force quality
– Sales force lacksmotivation andrequisite skills
– Turnover is high fortop performers andlow for poorperformers
Assessment of Current Sales Compensation PlanConsequences
As a sales force effectiveness driver, the sales compensation decision has conse-quences for all the downstream components of the sales management system.Compensation influences the skills, capabilities, values, and motivation of sales-people, which drive their behavior and activities. Sales force activities affect cus-tomer results, and customer results in turn affect company results. A thorough
PAGE 45
................. 15869$ $CH2 05-19-06 09:22:26 PS
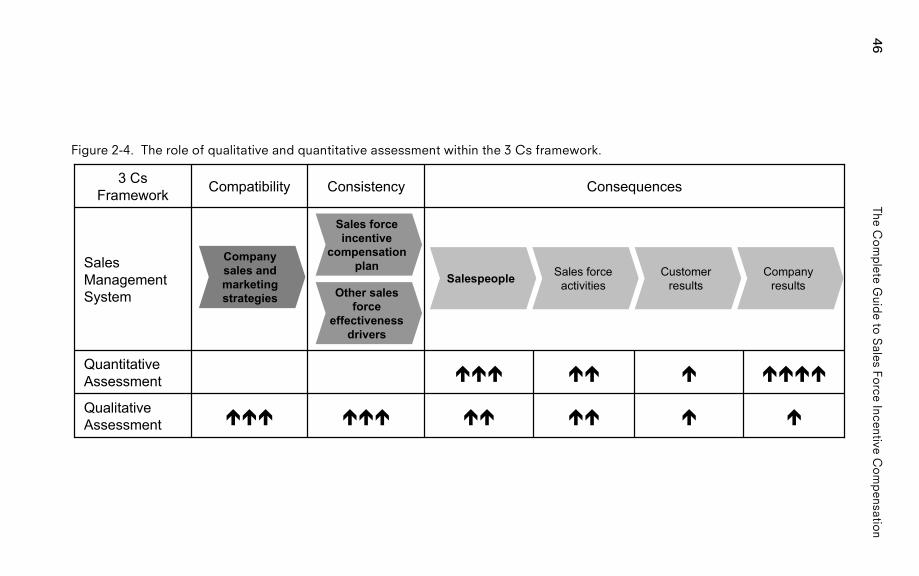
46The
Co
mp
leteG
uide
toS
alesFo
rceIncentive
Co
mp
ensation
Figure 2-4. The role of qualitative and quantitative assessment within the 3 Cs framework.
ConsequencesConsistencyCompatibility3 CsFramework
SalesManagementSystem
QualitativeAssessment
QuantitativeAssessment
������������
����������
Salespeople Sales forceactivities
Customerresults
Companyresults
Sales forceincentive
compensationplan
Other salesforce
effectivenessdrivers
Companysales andmarketingstrategies
PA
GE
46.................15869$
$CH
205-19-06
09:22:27P
S
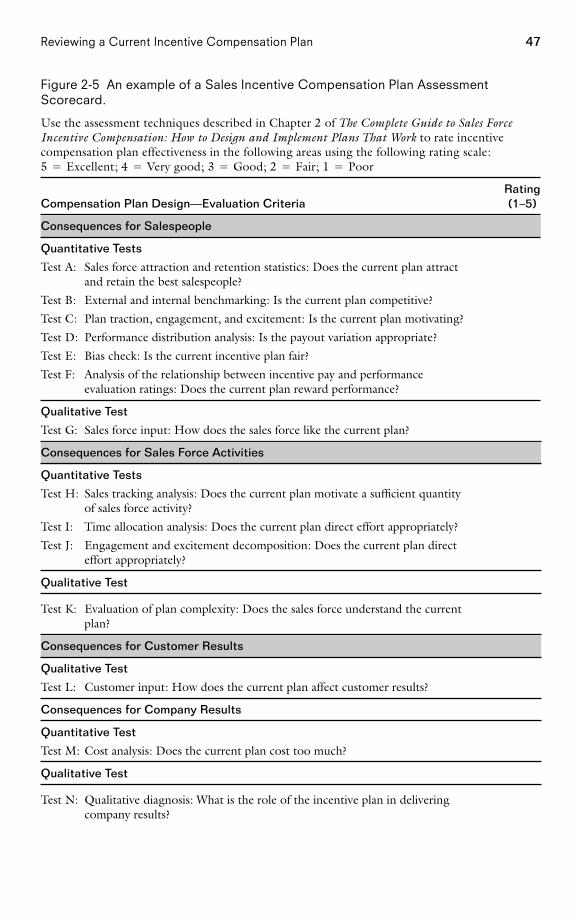
47Reviewing a Current Incentive Compensation Plan
Figure 2-5 An example of a Sales Incentive Compensation Plan AssessmentScorecard.
Use the assessment techniques described in Chapter 2 of The Complete Guide to Sales ForceIncentive Compensation: How to Design and Implement Plans That Work to rate incentivecompensation plan effectiveness in the following areas using the following rating scale:5 � Excellent; 4 � Very good; 3 � Good; 2 � Fair; 1 � Poor
RatingCompensation Plan Design—Evaluation Criteria (1–5)
Consequences for Salespeople
Quantitative Tests
Test A: Sales force attraction and retention statistics: Does the current plan attractand retain the best salespeople?
Test B: External and internal benchmarking: Is the current plan competitive?
Test C: Plan traction, engagement, and excitement: Is the current plan motivating?
Test D: Performance distribution analysis: Is the payout variation appropriate?
Test E: Bias check: Is the current incentive plan fair?
Test F: Analysis of the relationship between incentive pay and performanceevaluation ratings: Does the current plan reward performance?
Qualitative Test
Test G: Sales force input: How does the sales force like the current plan?
Consequences for Sales Force Activities
Quantitative Tests
Test H: Sales tracking analysis: Does the current plan motivate a sufficient quantityof sales force activity?
Test I: Time allocation analysis: Does the current plan direct effort appropriately?
Test J: Engagement and excitement decomposition: Does the current plan directeffort appropriately?
Qualitative Test
Test K: Evaluation of plan complexity: Does the sales force understand the currentplan?
Consequences for Customer Results
Qualitative Test
Test L: Customer input: How does the current plan affect customer results?
Consequences for Company Results
Quantitative Test
Test M: Cost analysis: Does the current plan cost too much?
Qualitative Test
Test N: Qualitative diagnosis: What is the role of the incentive plan in deliveringcompany results?
PAGE 47................. 15869$ $CH2 05-19-06 09:22:27 PS
48 The Complete Guide to Sales Force Incentive Compensation
Consistency with Company Strategies
Qualitative Tests
Test O: Check for consistency with corporate strategies
Test P: Check for consistency with sales and go-to-market strategies and sales forcedesign
Compatibility with Other Sales Force Effectiveness Drivers
Qualitative Test
Test Q: Check for compatibility with culture and other sales force effectiveness drivers
Note: This scorecard is an example that highlights some commonly used evaluation criteria for salescompensation plan assessment. Depending upon the particular circumstances, some evaluation areas may merita more detailed breakdown, while other areas may be less relevant. The scorecard is most effective when the listof evaluation criteria is tailored to specific sales force issues.
compensation plan review looks at the consequences of sales compensation foreach of the downstream components of the sales management system.
Introduction to the MRG Company Case StudyA discussion of the assessment of incentive plan consequences is enriched throughexamples from the MRG Company, a firm that is facing several sales incentivecompensation challenges. MRG Company examples are also used extensively inChapter 8 to enhance the discussion on assessing a proposed new sales compensa-tion plan. MRG’s current incentive compensation plan is a bonus–commissionplan that begins its incentive payout once territory goal is achieved. The plan isdepicted in Figure 2-6 along with the last 12 months’ payout distribution. Over60 percent of the salespeople did not achieve their territory goal and hence didnot receive any incentive compensation. The company is very disappointed withthe 96 percent achievement of the overall company sales goal. MRG’s leadershipteam theorizes that the sales force incentive compensation plan misfired, leadingto low morale and sales force underperformance.
The MRG sales leadership team hopes that an assessment of the current salescompensation plan can reveal improvement opportunities that will contribute tothe development of a new incentive plan that will improve sales force morale andperformance.
Consequences for Salespeople
Salespeople Sales forceactivities
Customerresults
Companyresults
Sales forceincentive
compensationplan
Othersalespersoneffectiveness
drivers
Companystrategies and
sales jobdefiners
• ‘‘Our top performers ‘max out’ and quit, while low performers stay too long,’’says a vice president of sales for a building products manufacturer.
PAGE 48
................. 15869$ $CH2 05-19-06 09:22:28 PS
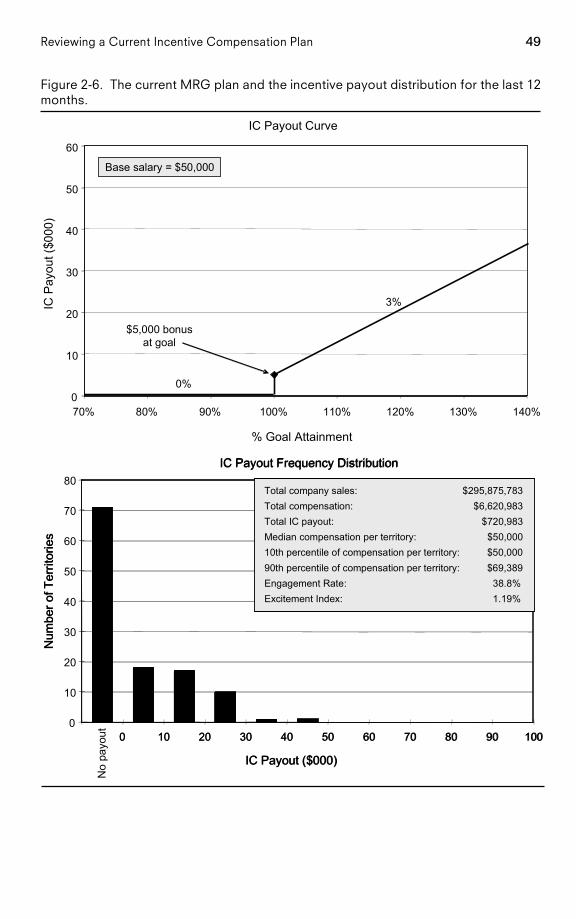
49Reviewing a Current Incentive Compensation Plan
Figure 2-6. The current MRG plan and the incentive payout distribution for the last 12months.
IC Payout Curve
0
10
20
30
40
50
60
70% 80% 90% 100% 110% 120% 130% 140%
% Goal Attainment
IC P
ayou
t ($0
00)
3%
$5,000 Bonus at Goal
0%
Base Salary = $50,000
3%
$5,000 bonusat goal
0%
Base salary = $50,000
IC Payout Frequency Distribution
0
10
20
30
40
50
60
70
80
0 10 20 30 40 50 60 70 80 90 100
IC Payout ($000)
Num
ber o
f Ter
ritor
ies
IC Payout Frequency Distribution
0 10 20 30 40 50 60 70 80 90 100
IC Payout ($000)
Num
ber o
f Ter
ritor
ies
Total company sales: $295,875,783Total compensation: $6,620,983Total IC payout: $720,983Median compensation per territory: $50,00010th percentile of compensation per territory: $50,00090th percentile of compensation per territory: $69,389Engagement Rate: 38.8%Excitement Index: 1.19%
No
payo
ut
PAGE 49
................. 15869$ $CH2 05-19-06 09:22:30 PS
50 The Complete Guide to Sales Force Incentive Compensation
• ‘‘We want to improve our ability to recruit top salespeople,’’ states a managerat a software firm.
• ‘‘Too many of our best salespeople are being lured to the competition. We needto pay more if we hope to be the ‘employer of choice’ within the industry,’’says a human resource director at a health-care firm.
• ‘‘Too many salespeople have become comfortable with the income they earnfrom sales to current customers,’’ says the director of field support for aninsurance company.
• ‘‘We want to eliminate loopholes and be fair and equitable to everyone inthe sales force,’’ says the director of sales operations at a computer mainte-nance company.
• ‘‘We want to achieve greater differentiation between high and low perform-ers,’’ says the director of sales incentives and compensation for a pharma-ceutical firm.
The sales compensation decision affects the type of salespeople that are at-tracted to the firm. It also affects sales force motivation and the extent to whichthe firm pays for performance. The following quantitative and qualitative testshelp sales leaders assess the impact that a current compensation plan has on theirsalespeople.
Quantitative Tests of Consequences for Salespeople. Test A: Sales Force Attractionand Retention Statistics: Does the Current Plan Attract and Retain the Best Sales-people? The sales compensation plan has a very important long-term impact onthe firm—it can be one of the key influences on a firm’s ability to attract andretain good salespeople. Management can look at several different human re-sources statistics to help determine whether the current plan is attracting andretaining the right salespeople. For example:
• What is the firm’s retention rate for salespeople who are currently or areexpected to be strong performers long-term?
• Does the sales force see adequate turnover of nonperformers?
• How successful has the firm been at attracting top candidates?
Direct Marketing Firm Reduces New Salesperson Turnover byEstablishing New Pay Metrics for First-Line Sales Managers
Analysis of turnover statistics for a direct marketing company revealed thatmany new salespeople left the firm within the first six months. Through exitinterviews, the company learned that lack of training and attention fromfirst-line district sales managers was the leading cause of this turnover.First-line district sales managers’ primary responsibility was to train andguide new salespeople, but these managers also retained some selling re-
PAGE 50................. 15869$ $CH2 05-19-06 09:22:31 PS
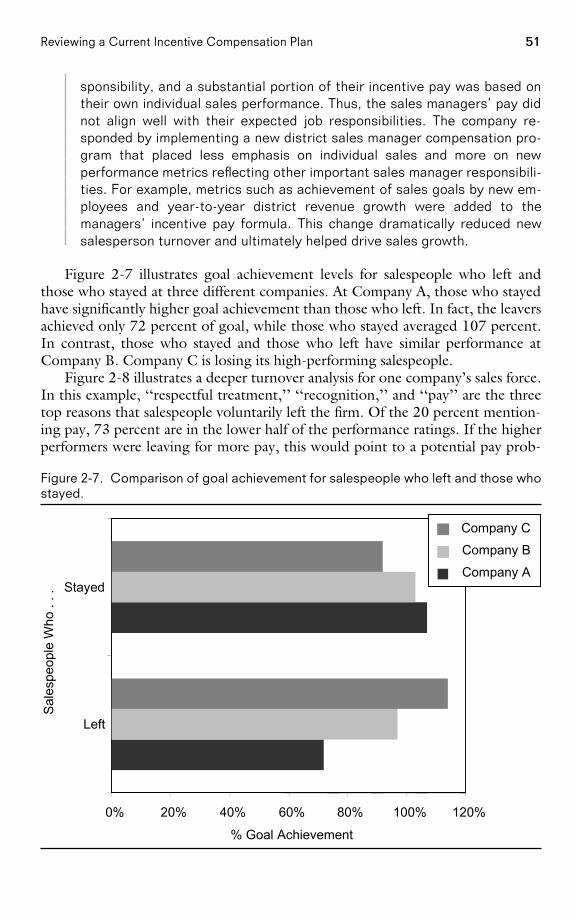
51Reviewing a Current Incentive Compensation Plan
sponsibility, and a substantial portion of their incentive pay was based ontheir own individual sales performance. Thus, the sales managers’ pay didnot align well with their expected job responsibilities. The company re-sponded by implementing a new district sales manager compensation pro-gram that placed less emphasis on individual sales and more on newperformance metrics reflecting other important sales manager responsibili-ties. For example, metrics such as achievement of sales goals by new em-ployees and year-to-year district revenue growth were added to themanagers’ incentive pay formula. This change dramatically reduced newsalesperson turnover and ultimately helped drive sales growth.
Figure 2-7 illustrates goal achievement levels for salespeople who left andthose who stayed at three different companies. At Company A, those who stayedhave significantly higher goal achievement than those who left. In fact, the leaversachieved only 72 percent of goal, while those who stayed averaged 107 percent.In contrast, those who stayed and those who left have similar performance atCompany B. Company C is losing its high-performing salespeople.
Figure 2-8 illustrates a deeper turnover analysis for one company’s sales force.In this example, ‘‘respectful treatment,’’ ‘‘recognition,’’ and ‘‘pay’’ are the threetop reasons that salespeople voluntarily left the firm. Of the 20 percent mention-ing pay, 73 percent are in the lower half of the performance ratings. If the higherperformers were leaving for more pay, this would point to a potential pay prob-
Figure 2-7. Comparison of goal achievement for salespeople who left and those whostayed.
0% 20% 40% 60% 80% 100% 120%
Left
Stayed
Sal
espe
ople
Who
. . .
% Goal Achievement
Company C
Company B
Company A
PAGE 51................. 15869$ $CH2 05-19-06 09:22:32 PS
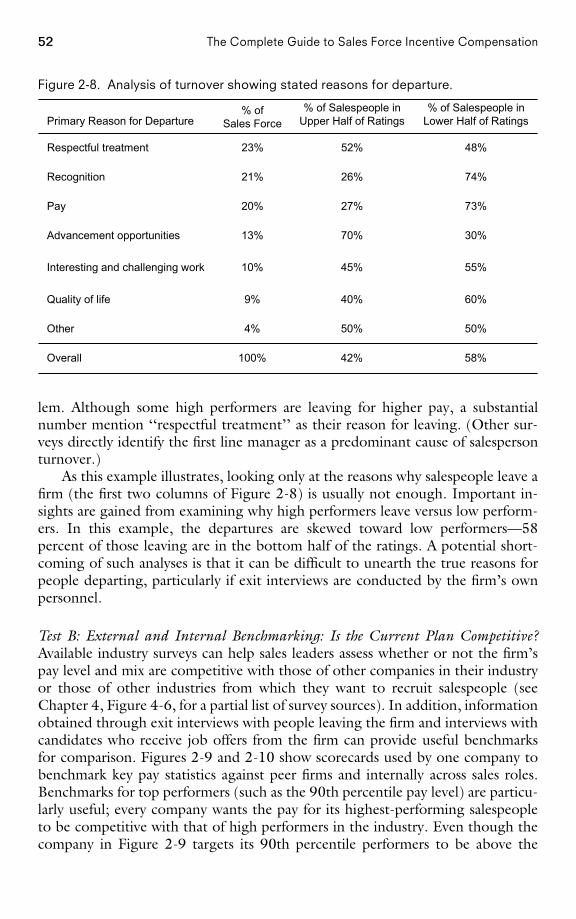
52 The Complete Guide to Sales Force Incentive Compensation
Figure 2-8. Analysis of turnover showing stated reasons for departure.
58%42%100%Overall
50%50%4%Other
60%40%9%Quality of life
55%45%10%Interesting and challenging work
30%70%13%Advancement opportunities
73%27%20%Pay
74%26%21%Recognition
48%52%23%Respectful treatment
% of Salespeople inLower Half of Ratings
% of Salespeople inUpper Half of Ratings
% ofSales ForcePrimary Reason for Departure
lem. Although some high performers are leaving for higher pay, a substantialnumber mention ‘‘respectful treatment’’ as their reason for leaving. (Other sur-veys directly identify the first line manager as a predominant cause of salespersonturnover.)
As this example illustrates, looking only at the reasons why salespeople leave afirm (the first two columns of Figure 2-8) is usually not enough. Important in-sights are gained from examining why high performers leave versus low perform-ers. In this example, the departures are skewed toward low performers—58percent of those leaving are in the bottom half of the ratings. A potential short-coming of such analyses is that it can be difficult to unearth the true reasons forpeople departing, particularly if exit interviews are conducted by the firm’s ownpersonnel.
Test B: External and Internal Benchmarking: Is the Current Plan Competitive?Available industry surveys can help sales leaders assess whether or not the firm’spay level and mix are competitive with those of other companies in their industryor those of other industries from which they want to recruit salespeople (seeChapter 4, Figure 4-6, for a partial list of survey sources). In addition, informationobtained through exit interviews with people leaving the firm and interviews withcandidates who receive job offers from the firm can provide useful benchmarksfor comparison. Figures 2-9 and 2-10 show scorecards used by one company tobenchmark key pay statistics against peer firms and internally across sales roles.Benchmarks for top performers (such as the 90th percentile pay level) are particu-larly useful; every company wants the pay for its highest-performing salespeopleto be competitive with that of high performers in the industry. Even though thecompany in Figure 2-9 targets its 90th percentile performers to be above the
PAGE 52................. 15869$ $CH2 05-19-06 09:22:33 PS
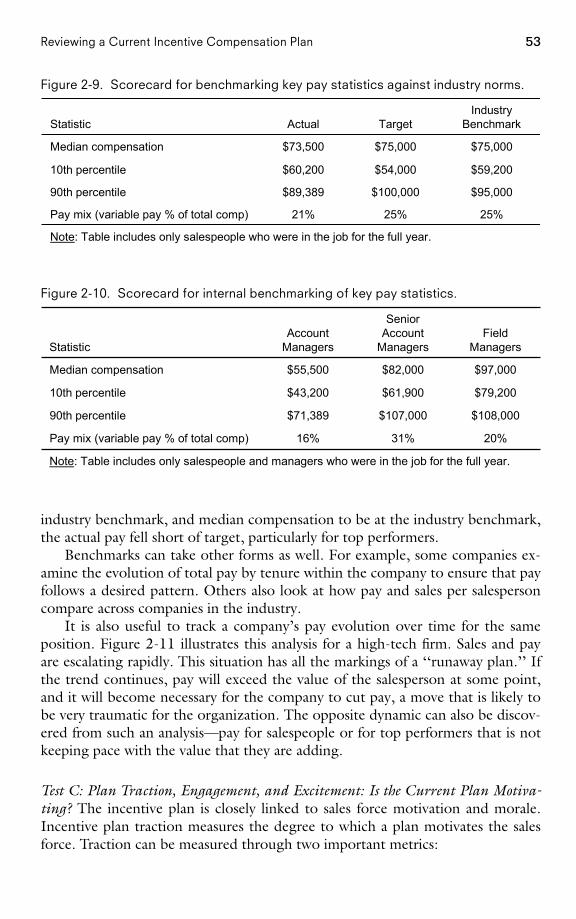
53Reviewing a Current Incentive Compensation Plan
Figure 2-9. Scorecard for benchmarking key pay statistics against industry norms.
Note: Table includes only salespeople who were in the job for the full year.
25%25%21%Pay mix (variable pay % of total comp)
$95,000$100,000$89,38990th percentile
$59,200$54,000$60,20010th percentile
$75,000$75,000$73,500Median compensation
IndustryBenchmarkTargetActualStatistic
Figure 2-10. Scorecard for internal benchmarking of key pay statistics.
Note: Table includes only salespeople and managers who were in the job for the full year.
20%31%16%Pay mix (variable pay % of total comp)
$108,000$107,000$71,38990th percentile
$79,200$61,900$43,20010th percentile
$97,000$82,000$55,500Median compensation
FieldManagers
SeniorAccount
ManagersAccount
ManagersStatistic
industry benchmark, and median compensation to be at the industry benchmark,the actual pay fell short of target, particularly for top performers.
Benchmarks can take other forms as well. For example, some companies ex-amine the evolution of total pay by tenure within the company to ensure that payfollows a desired pattern. Others also look at how pay and sales per salespersoncompare across companies in the industry.
It is also useful to track a company’s pay evolution over time for the sameposition. Figure 2-11 illustrates this analysis for a high-tech firm. Sales and payare escalating rapidly. This situation has all the markings of a ‘‘runaway plan.’’ Ifthe trend continues, pay will exceed the value of the salesperson at some point,and it will become necessary for the company to cut pay, a move that is likely tobe very traumatic for the organization. The opposite dynamic can also be discov-ered from such an analysis—pay for salespeople or for top performers that is notkeeping pace with the value that they are adding.
Test C: Plan Traction, Engagement, and Excitement: Is the Current Plan Motiva-ting? The incentive plan is closely linked to sales force motivation and morale.Incentive plan traction measures the degree to which a plan motivates the salesforce. Traction can be measured through two important metrics:
PAGE 53................. 15869$ $CH2 05-19-06 09:22:34 PS
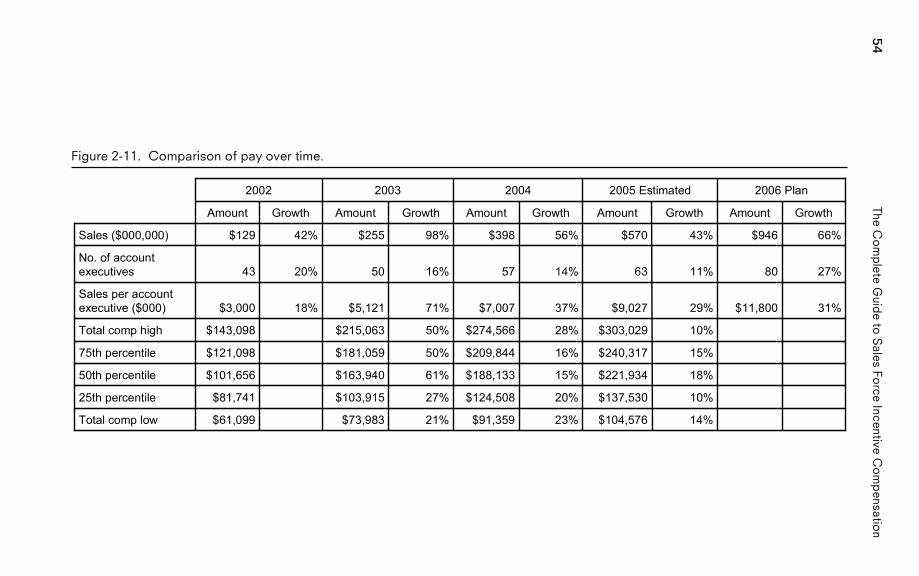
54The
Co
mp
leteG
uide
toS
alesFo
rceIncentive
Co
mp
ensation
Figure 2-11. Comparison of pay over time.
14%$104,57623%$91,35921%$73,983$61,099Total comp low
10%$137,53020%$124,50827%$103,915$81,74125th percentile
18%$221,93415%$188,13361%$163,940$101,65650th percentile
15%$240,31716%$209,84450%$181,059$121,09875th percentile
10%$303,02928%$274,56650%$215,063$143,098Total comp high
31%$11,80029%$9,02737%$7,00771%$5,12118%$3,000Sales per accountexecutive ($000)
27%8011%6314%5716%5020%43No. of accountexecutives
66%$94643%$57056%$39898%$25542%$129Sales ($000,000)
GrowthAmountGrowthAmountGrowthAmountGrowthAmountGrowthAmount
2006 Plan2005 Estimated200420032002
PA
GE
54.................15869$
$CH
205-19-06
09:22:35P
S
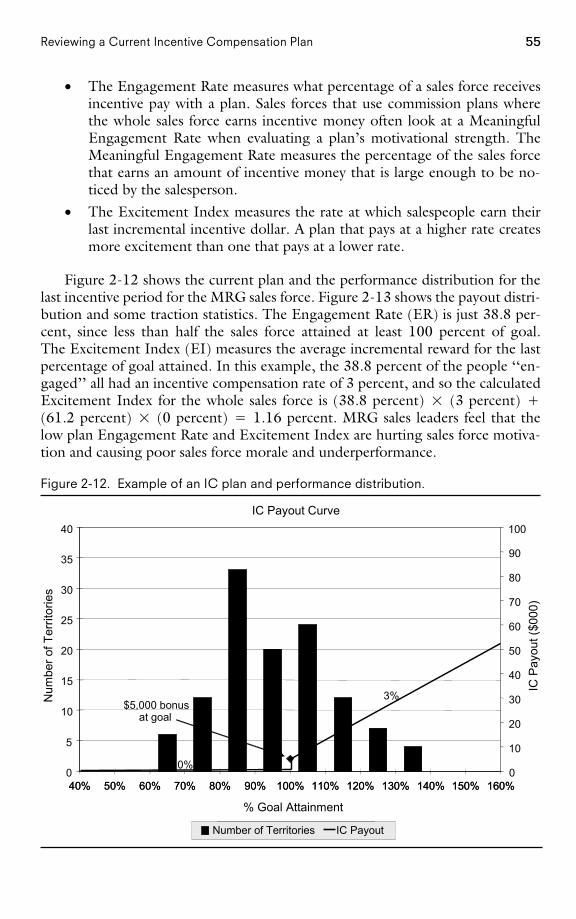
55Reviewing a Current Incentive Compensation Plan
• The Engagement Rate measures what percentage of a sales force receivesincentive pay with a plan. Sales forces that use commission plans wherethe whole sales force earns incentive money often look at a MeaningfulEngagement Rate when evaluating a plan’s motivational strength. TheMeaningful Engagement Rate measures the percentage of the sales forcethat earns an amount of incentive money that is large enough to be no-ticed by the salesperson.
• The Excitement Index measures the rate at which salespeople earn theirlast incremental incentive dollar. A plan that pays at a higher rate createsmore excitement than one that pays at a lower rate.
Figure 2-12 shows the current plan and the performance distribution for thelast incentive period for the MRG sales force. Figure 2-13 shows the payout distri-bution and some traction statistics. The Engagement Rate (ER) is just 38.8 per-cent, since less than half the sales force attained at least 100 percent of goal.The Excitement Index (EI) measures the average incremental reward for the lastpercentage of goal attained. In this example, the 38.8 percent of the people ‘‘en-gaged’’ all had an incentive compensation rate of 3 percent, and so the calculatedExcitement Index for the whole sales force is (38.8 percent) � (3 percent) �(61.2 percent) � (0 percent) � 1.16 percent. MRG sales leaders feel that thelow plan Engagement Rate and Excitement Index are hurting sales force motiva-tion and causing poor sales force morale and underperformance.
Figure 2-12. Example of an IC plan and performance distribution.
IC Payout Curve
0
5
10
15
20
25
30
35
40
40% 50% 60% 70% 80% 90% 100% 110% 120% 130% 140% 150% 160%
% Goal Attainment
Num
ber o
f Ter
ritor
ies
0
10
20
30
40
50
60
70
80
90
100IC
Pay
out (
$000
)
3%$5,000 Bonus
at Goal
0%
40% 50% 60% 70% 80% 90% 100% 110% 120% 130% 140% 150% 160%
3%$5,000 bonus
at goal
0%
Number of Territories IC PayoutNumber of Territories IC Payout
PAGE 55................. 15869$ $CH2 05-19-06 09:22:37 PS
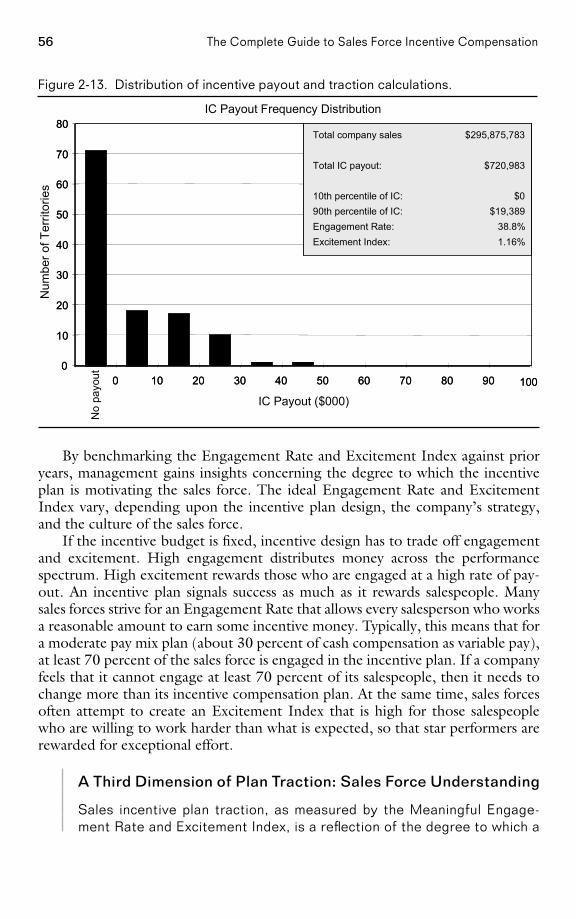
56 The Complete Guide to Sales Force Incentive Compensation
Figure 2-13. Distribution of incentive payout and traction calculations.
100100
IC Payout Frequency Distribution
0
10
20
30
40
50
60
70
80
0 10 20 30 40 50 60 70 80 90
IC Payout ($000)
Num
ber o
f Ter
ritor
ies
0
10
20
30
40
50
60
70
80
0 10 20 30 40 50 60 70 80 90
Total company sales $295,875,783
Total IC payout: $720,983
10th percentile of IC: $090th percentile of IC: $19,389Engagement Rate: 38.8%Excitement Index: 1.16%
No
payo
ut
By benchmarking the Engagement Rate and Excitement Index against prioryears, management gains insights concerning the degree to which the incentiveplan is motivating the sales force. The ideal Engagement Rate and ExcitementIndex vary, depending upon the incentive plan design, the company’s strategy,and the culture of the sales force.
If the incentive budget is fixed, incentive design has to trade off engagementand excitement. High engagement distributes money across the performancespectrum. High excitement rewards those who are engaged at a high rate of pay-out. An incentive plan signals success as much as it rewards salespeople. Manysales forces strive for an Engagement Rate that allows every salesperson who worksa reasonable amount to earn some incentive money. Typically, this means that fora moderate pay mix plan (about 30 percent of cash compensation as variable pay),at least 70 percent of the sales force is engaged in the incentive plan. If a companyfeels that it cannot engage at least 70 percent of its salespeople, then it needs tochange more than its incentive compensation plan. At the same time, sales forcesoften attempt to create an Excitement Index that is high for those salespeoplewho are willing to work harder than what is expected, so that star performers arerewarded for exceptional effort.
A Third Dimension of Plan Traction: Sales Force Understanding
Sales incentive plan traction, as measured by the Meaningful Engage-ment Rate and Excitement Index, is a reflection of the degree to which a
PAGE 56................. 15869$ $CH2 05-19-06 09:22:37 PS
57Reviewing a Current Incentive Compensation Plan
plan motivates the sales force. However, this assumes that the sales-people understand the plan and use it to influence their activity. Somefirms have plans that are so complex that salespeople are unwilling toinvest the time required to understand them. When a plan is overly com-plex, salespeople may continue to do their job and ignore the plan. TheEngagement Rate and Excitement Index may be high, and salespeoplemay appreciate the rewards that the plan provides, yet the plan is nottruly motivating sales force behavior. (See ‘‘Test K: Evaluation of PlanComplexity: Does the Sales Force Understand the Current Plan?’’ laterin this chapter.)
Test D: Performance Distribution Analysis: Is the Payout Variation Appropriate?Companies can conduct analyses to determine whether the sales incentive pay hasenough variation. It is useful to study the distribution of plan payout, and thencompare this distribution with what is known about performance variation withinthe sales force. For example at MRG, sales leaders feel that the payout distribution(see Figure 2-13) is unfair; more than 38.8 percent of the sales force deserves toearn incentive money. The low Engagement Rate is the primary symptom of planineffectiveness.
Payout distributions can reveal other problems as well. An appropriate payoutdistribution accurately reflects differences in value contribution across salespeople.
For example, evaluate the two sales force incentive payout distributions thatare compared in Figure 2-14. For Sales Force A, sales leaders are comfortable withthe payout distribution. The median payout for the sales force is approximately$8,400 per quarter (target incentive pay is $8,250), and 100 percent of sales-people earned at least 73 percent of target pay. The distribution is fairly tight; 90percent of the sales force earned between 73 percent and 127 percent of targetpay. The top salesperson earned about 179 percent of target. This is an unusuallytight distribution, yet sales leaders feel that it accurately reflects differences invalue contribution and performance across the sales force.
For Sales Force B, sales leaders are unhappy with the payout distribution.They are pleased that there is 80 percent engagement in the incentive plan, yetthe performance distribution reveals two problems. First, only 37 percent of thesales force achieved the target incentive pay level. This is the result of sales goalsfor one of the firm’s major products that are too aggressive. Second, while theaverage salesperson earned just over $5,200 in incentive pay, there is too wide adistribution in incentive earnings around that average. Sales leaders feel that thiswide payout distribution does not accurately reflect true performance differences.Further analysis reveals that unequal territory potential is not effectively accountedfor in this firm’s goal-setting process, and this contributes significantly to thepayout variation.
A sales force that is very heterogeneous in terms of the value contribution ofeach salesperson should have a wide variation in incentive pay across salespeople,
PAGE 57................. 15869$ $CH2 05-19-06 09:22:38 PS
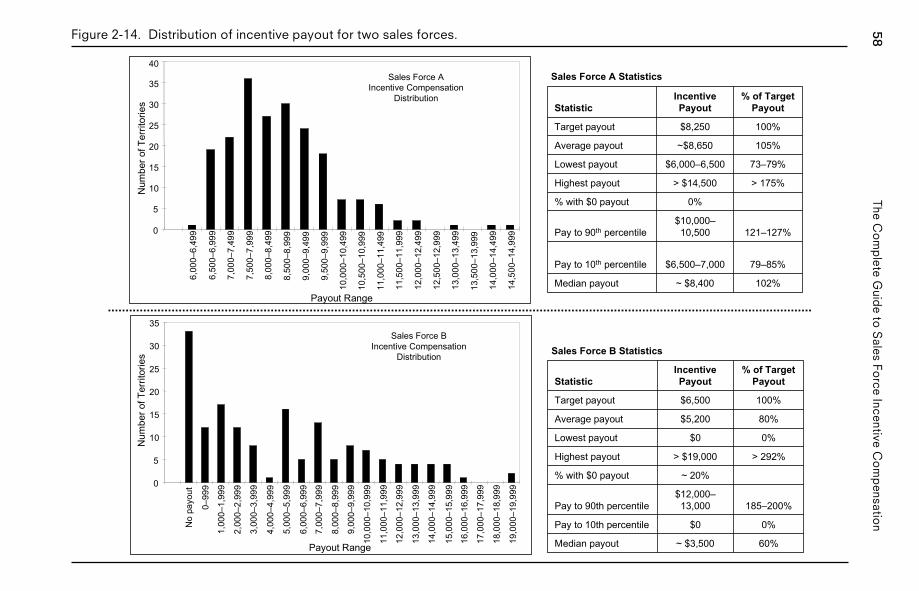
58The
Co
mp
leteG
uide
toS
alesFo
rceIncentive
Co
mp
ensation
Figure 2-14. Distribution of incentive payout for two sales forces.
102%~ $8,400Median payout
79–85%$6,500–7,000Pay to 10th percentile
121–127%$10,000–10,500Pay to 90th percentile
0%% with $0 payout
> 175%> $14,500Highest payout
73–79%$6,000–6,500Lowest payout
105%~$8,650Average payout
100%$8,250Target payout
% of TargetPayout
IncentivePayoutStatistic
60%~ $3,500Median payout
0%$0Pay to 10th percentile
185–200%$12,000–13,000Pay to 90th percentile
~ 20%% with $0 payout
> 292%> $19,000Highest payout
0%$0Lowest payout
80%$5,200Average payout
100%$6,500Target payout
% of TargetPayout
IncentivePayoutStatistic
Sales Force A StatisticsSales Force AIncentive Compensation
Distribution
0
5
10
15
20
25
30
35
40
6,00
0–6,
499
6,50
0–6,
999
7,00
0–7,
499
7,50
0–7,
999
8,00
0–8,
499
8,50
0–8,
999
9,00
0–9,
499
9,50
0–9,
999
10,0
00–1
0,49
9
10,5
00–1
0,99
9
11,0
00–1
1,49
9
11,5
00–1
1,99
9
12,0
00–1
2,49
9
12,5
00–1
2,99
9
13,0
00–1
3,49
9
13,5
00–1
3,99
9
14,0
00–1
4,49
9
14,5
00–1
4,99
9
Payout Range
Num
ber o
f Ter
ritor
ies
Sales Force B StatisticsSales Force B
Incentive CompensationDistribution
0
5
10
15
20
25
30
35
No
payo
ut
0–99
9
1,00
0–1,
999
2,00
0–2,
999
3,00
0–3,
999
4,00
0–4,
999
5,00
0–5,
999
6,00
0–6,
999
7,00
0–7,
999
8,00
0–8,
999
9,00
0–9,
999
10,0
00–1
0,99
9
11,0
00–1
1,99
9
12,0
00–1
2,99
9
13,0
00–1
3,99
9
14,0
00–1
4,99
9
15,0
00–1
5,99
9
16,0
00–1
6,99
9
17,0
00–1
7,99
9
18,0
00–1
8,99
9
19,0
00–1
9,99
9
Payout Range
Num
ber o
f Ter
ritor
ies
PA
GE
58.................15869$
$CH
205-19-06
09:22:39P
S
59Reviewing a Current Incentive Compensation Plan
while a sales force in which salespeople are more equal in value contributionshould have less variation.
Test E: Bias Check: Is the Current Incentive Plan Fair?
Our Sense of Fairness Demands a Relationship Between Workand Pay
It is innately human to care about fairness and to feel that rewards shouldbe linked rationally to accomplishments. A 2003 study by primatologistsSarah F. Brosnan and Frans B. M. de Waal showed that this innate desirefor fairness extends to the animal world as well. Pairs of monkeys weretrained to give a scientist pebbles in exchange for slices of cucumber. Oneday the scientists changed the reward for just one of the monkeys in eachpair to a delicious grape, while the other partner continued to receive theless appetizing cucumber. The monkeys given the cucumbers began to ex-hibit behaviors showing their severe unhappiness about the unfairness.They often refused to eat; 40 percent of the time, they stopped tradingaltogether. Things got worse when the lucky monkey in each pair was givena grape for doing nothing at all. The other monkeys then tossed away theirpebbles and refused to trade 80 percent of the time. The cucumber-rewarded monkeys were willing to give up their reward simply to expresstheir extreme displeasure at their partners’ undeserved better reward. Themonkeys seemed to believe that there should be a clear connection be-tween work and pay.
Sources of Unfairness in Sales Forces
All employees expect to be treated fairly by management; perceived unfair-ness can be extremely disruptive in any organization. In a sales force, in-centive compensation plans often accentuate any unfairness that exists.Eliminating unfairness can be very difficult, as there are so many potentialsources of unfairness that affect the sales force:
• Sales territory potential. For example, territories in the southeast re-gion have significant growth potential, while those in the northeast arestagnant.
• Sales territory difficulty. For example, the main competitor’s top sales-person has been working the Chicago market aggressively, while thecompetitor’s Minneapolis territory has been vacant for several months.
• Product assignment. For example, one sales team sells the high-growthproducts with easy goals, while another sells older products with chal-lenging goals.
PAGE 59................. 15869$ $CH2 05-19-06 09:22:40 PS
60 The Complete Guide to Sales Force Incentive Compensation
• Acts of nature. For example, a Category 4 hurricane season gives theFlorida sales district an unfair advantage in a sales force that sellspower tools.
• Goal setting. For example, the firm’s top performer last year is re-warded with an even higher goal this year, while last year’s averageperformers get easy goals.
Effective compensation plans do not have an inadvertent bias toward or againstsalespeople or territories with predictable characteristics.
Statistical analysis can be used to discover incentive plan biases. Figure 2-15shows several examples of bias testing for an incentive plan. The analysis demon-strates tests for three possible biases: geographic, market share, and market size.The territories displayed in Figure 2-15 have been clustered into five groups basedon geography, market share (low to high), and territory market potential (low tohigh). The median payout and payout range are shown for each cluster on eachdimension. Even though each dimension has five clusters, the clusters are com-posed of different territories across the three analyses.
The first test (top) compares the payout range for each of five regions of thecountry. Payouts for the South are lower than those for the other regions. Thesecond test (middle) groups territories based on historical market share, whichranges from about 0.5 percent to 2 percent. The analysis reveals a serious prob-lem—territories with higher historical market share have lower payout. The thirdtest (bottom) groups territories based on historical market sales, which range from$150 million up to $325 million. This analysis shows no clear pattern of payoutsbeing biased by the size of the market in a salesperson’s territory. Looking intothe situation more deeply reveals that the geographic problem (the South gettinglower pay) and the market share problem (high-share territories getting lowerpay) is mostly the same issue—market share tends to be higher in the South, andthe goal-setting process penalizes high-market-share territories.
Figure 2-16 shows another example of bias testing. This case shows how terri-tory level analysis reveals biases in the sales incentive plan of a company wherenational account contracting influences territory sales. The company’s sales forcesells to local customers and ‘‘pulls through’’ sales in local outlets of national ac-counts. As can be seen from Figure 2-16, sales success is strongly influenced bythe contract status. The average incentive payout is considerably higher for sales-people in territories where the contracts are favorable.
Incentive plan and quota-setting deficiencies are likely whenever there is asignificant correlation between incentive payout and an independent territoryvariable that does not reflect a salesperson’s effort or skill. Analyses like the onesjust given can reveal incentive plan biases based on variables such as territorysize, geographic region, served market segments, market potential, past sales level,market share, and quota increase.
What Types of Biases Are Tolerated?
It is practically impossible to eliminate all biases from an incentive plan.Companies tend to tolerate biases that can be justified in some way. For
PAGE 60................. 15869$ $CH2 05-19-06 09:22:40 PS
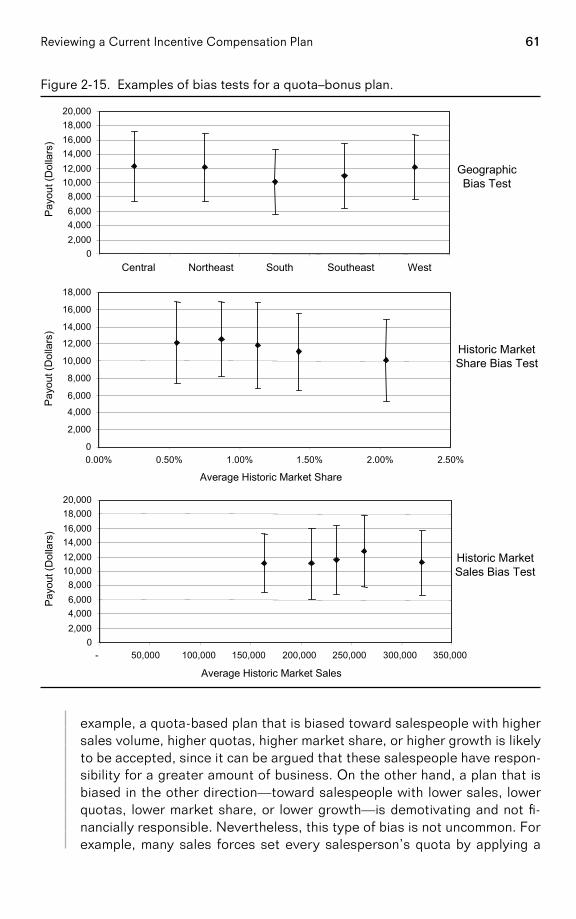
61Reviewing a Current Incentive Compensation Plan
Figure 2-15. Examples of bias tests for a quota–bonus plan.
02,0004,0006,0008,000
10,00012,00014,00016,00018,00020,000
Central Northeast South Southeast West
Pay
out (
Dol
lars
)
GeographicBias Test
0
2,000
4,000
6,000
8,000
10,000
12,000
14,000
16,000
18,000
0.00% 0.50% 1.00% 1.50% 2.00% 2.50%
Average Historic Market Share
Pay
out (
Dol
lars
)
Historic MarketShare Bias Test
02,0004,0006,0008,000
10,00012,00014,00016,00018,00020,000
- 50,000 100,000 150,000 200,000 250,000 300,000 350,000
Average Historic Market Sales
Pay
out (
Dol
lars
)
Historic MarketSales Bias Test
example, a quota-based plan that is biased toward salespeople with highersales volume, higher quotas, higher market share, or higher growth is likelyto be accepted, since it can be argued that these salespeople have respon-sibility for a greater amount of business. On the other hand, a plan that isbiased in the other direction—toward salespeople with lower sales, lowerquotas, lower market share, or lower growth—is demotivating and not fi-nancially responsible. Nevertheless, this type of bias is not uncommon. Forexample, many sales forces set every salesperson’s quota by applying a
PAGE 61................. 15869$ $CH2 05-19-06 09:22:42 PS
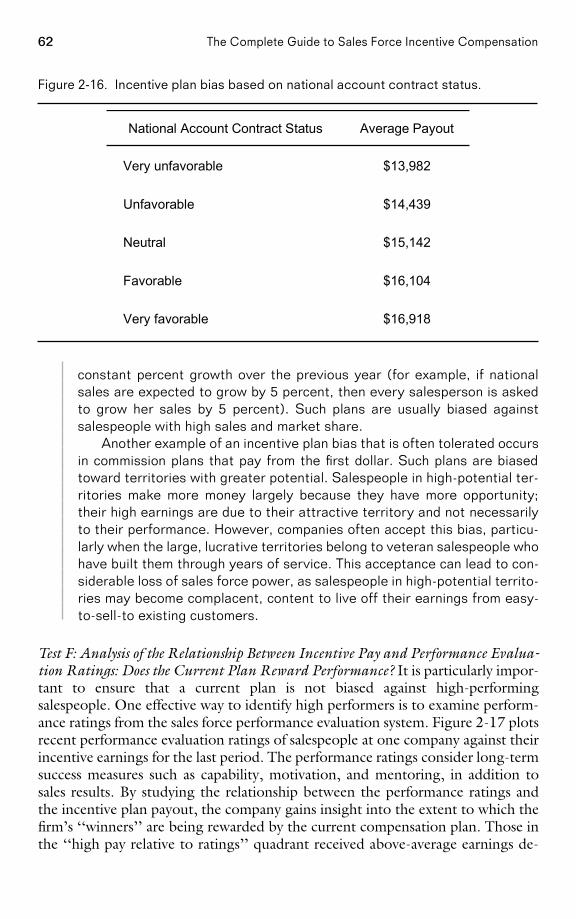
62 The Complete Guide to Sales Force Incentive Compensation
Figure 2-16. Incentive plan bias based on national account contract status.
$16,918Very favorable
$16,104Favorable
$15,142Neutral
$14,439Unfavorable
$13,982Very unfavorable
Average PayoutNational Account Contract Status
constant percent growth over the previous year (for example, if nationalsales are expected to grow by 5 percent, then every salesperson is askedto grow her sales by 5 percent). Such plans are usually biased againstsalespeople with high sales and market share.
Another example of an incentive plan bias that is often tolerated occursin commission plans that pay from the first dollar. Such plans are biasedtoward territories with greater potential. Salespeople in high-potential ter-ritories make more money largely because they have more opportunity;their high earnings are due to their attractive territory and not necessarilyto their performance. However, companies often accept this bias, particu-larly when the large, lucrative territories belong to veteran salespeople whohave built them through years of service. This acceptance can lead to con-siderable loss of sales force power, as salespeople in high-potential territo-ries may become complacent, content to live off their earnings from easy-to-sell-to existing customers.
Test F: Analysis of the Relationship Between Incentive Pay and Performance Evalua-tion Ratings: Does the Current Plan Reward Performance? It is particularly impor-tant to ensure that a current plan is not biased against high-performingsalespeople. One effective way to identify high performers is to examine perform-ance ratings from the sales force performance evaluation system. Figure 2-17 plotsrecent performance evaluation ratings of salespeople at one company against theirincentive earnings for the last period. The performance ratings consider long-termsuccess measures such as capability, motivation, and mentoring, in addition tosales results. By studying the relationship between the performance ratings andthe incentive plan payout, the company gains insight into the extent to which thefirm’s ‘‘winners’’ are being rewarded by the current compensation plan. Those inthe ‘‘high pay relative to ratings’’ quadrant received above-average earnings de-
PAGE 62................. 15869$ $CH2 05-19-06 09:22:43 PS
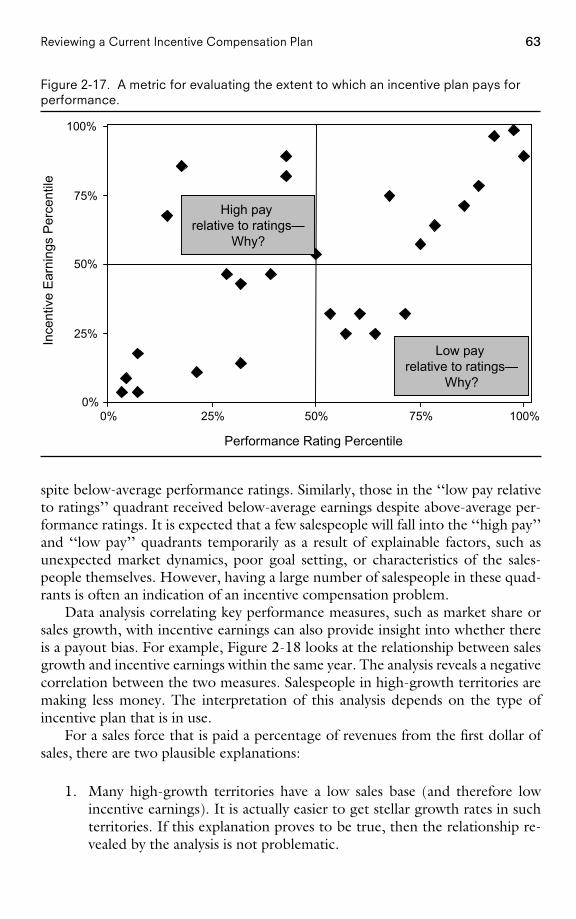
63Reviewing a Current Incentive Compensation Plan
Figure 2-17. A metric for evaluating the extent to which an incentive plan pays forperformance.
UNDERPAIDWHY?
OVERPAIDWHY?
0%
25%
50%
75%
100%
0% 25% 50% 75% 100%
Performance Rating Percentile
Ince
ntiv
e E
arni
ngs
Per
cent
ile
High pay relative to ratings—
Why?
Low pay relative to ratings—
Why?
spite below-average performance ratings. Similarly, those in the ‘‘low pay relativeto ratings’’ quadrant received below-average earnings despite above-average per-formance ratings. It is expected that a few salespeople will fall into the ‘‘high pay’’and ‘‘low pay’’ quadrants temporarily as a result of explainable factors, such asunexpected market dynamics, poor goal setting, or characteristics of the sales-people themselves. However, having a large number of salespeople in these quad-rants is often an indication of an incentive compensation problem.
Data analysis correlating key performance measures, such as market share orsales growth, with incentive earnings can also provide insight into whether thereis a payout bias. For example, Figure 2-18 looks at the relationship between salesgrowth and incentive earnings within the same year. The analysis reveals a negativecorrelation between the two measures. Salespeople in high-growth territories aremaking less money. The interpretation of this analysis depends on the type ofincentive plan that is in use.
For a sales force that is paid a percentage of revenues from the first dollar ofsales, there are two plausible explanations:
1. Many high-growth territories have a low sales base (and therefore lowincentive earnings). It is actually easier to get stellar growth rates in suchterritories. If this explanation proves to be true, then the relationship re-vealed by the analysis is not problematic.
PAGE 63................. 15869$ $CH2 05-19-06 09:22:44 PS
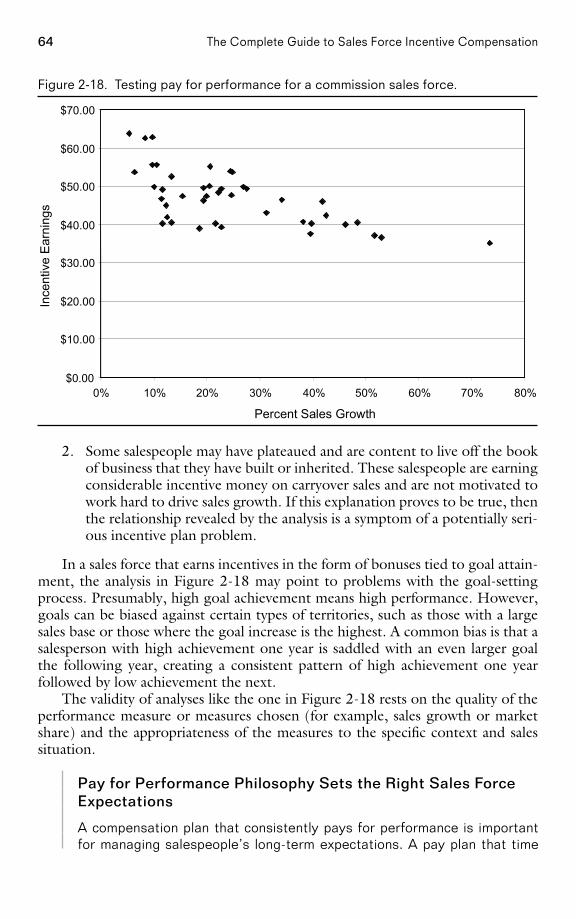
64 The Complete Guide to Sales Force Incentive Compensation
Figure 2-18. Testing pay for performance for a commission sales force.
$0.00
$10.00
$20.00
$30.00
$40.00
$50.00
$60.00
$70.00
0% 10% 20% 30% 40% 50% 60% 70% 80%
Percent Sales Growth
Ince
ntiv
e E
arni
ngs
2. Some salespeople may have plateaued and are content to live off the bookof business that they have built or inherited. These salespeople are earningconsiderable incentive money on carryover sales and are not motivated towork hard to drive sales growth. If this explanation proves to be true, thenthe relationship revealed by the analysis is a symptom of a potentially seri-ous incentive plan problem.
In a sales force that earns incentives in the form of bonuses tied to goal attain-ment, the analysis in Figure 2-18 may point to problems with the goal-settingprocess. Presumably, high goal achievement means high performance. However,goals can be biased against certain types of territories, such as those with a largesales base or those where the goal increase is the highest. A common bias is that asalesperson with high achievement one year is saddled with an even larger goalthe following year, creating a consistent pattern of high achievement one yearfollowed by low achievement the next.
The validity of analyses like the one in Figure 2-18 rests on the quality of theperformance measure or measures chosen (for example, sales growth or marketshare) and the appropriateness of the measures to the specific context and salessituation.
Pay for Performance Philosophy Sets the Right Sales ForceExpectations
A compensation plan that consistently pays for performance is importantfor managing salespeople’s long-term expectations. A pay plan that time
PAGE 64................. 15869$ $CH2 05-19-06 09:22:45 PS
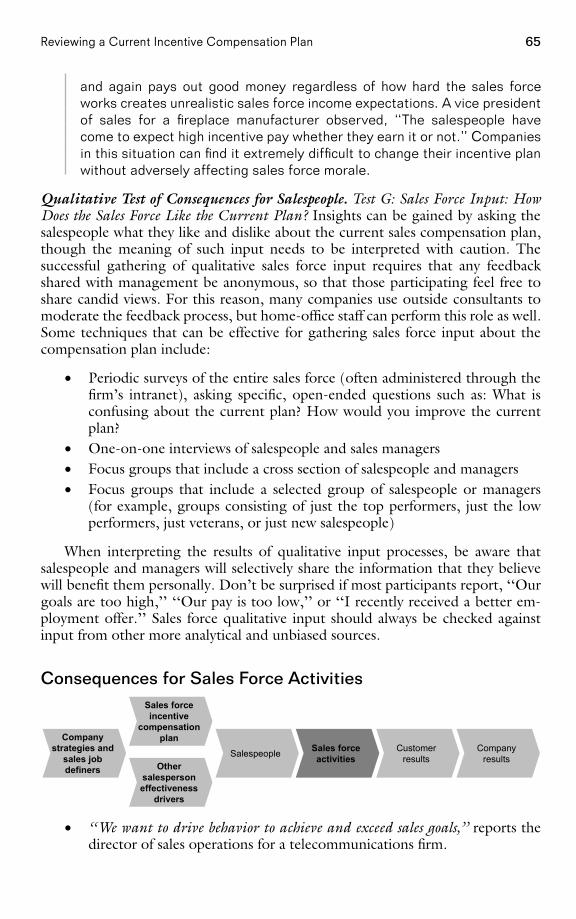
65Reviewing a Current Incentive Compensation Plan
and again pays out good money regardless of how hard the sales forceworks creates unrealistic sales force income expectations. A vice presidentof sales for a fireplace manufacturer observed, ‘‘The salespeople havecome to expect high incentive pay whether they earn it or not.’’ Companiesin this situation can find it extremely difficult to change their incentive planwithout adversely affecting sales force morale.
Qualitative Test of Consequences for Salespeople. Test G: Sales Force Input: HowDoes the Sales Force Like the Current Plan? Insights can be gained by asking thesalespeople what they like and dislike about the current sales compensation plan,though the meaning of such input needs to be interpreted with caution. Thesuccessful gathering of qualitative sales force input requires that any feedbackshared with management be anonymous, so that those participating feel free toshare candid views. For this reason, many companies use outside consultants tomoderate the feedback process, but home-office staff can perform this role as well.Some techniques that can be effective for gathering sales force input about thecompensation plan include:
• Periodic surveys of the entire sales force (often administered through thefirm’s intranet), asking specific, open-ended questions such as: What isconfusing about the current plan? How would you improve the currentplan?
• One-on-one interviews of salespeople and sales managers• Focus groups that include a cross section of salespeople and managers• Focus groups that include a selected group of salespeople or managers
(for example, groups consisting of just the top performers, just the lowperformers, just veterans, or just new salespeople)
When interpreting the results of qualitative input processes, be aware thatsalespeople and managers will selectively share the information that they believewill benefit them personally. Don’t be surprised if most participants report, ‘‘Ourgoals are too high,’’ ‘‘Our pay is too low,’’ or ‘‘I recently received a better em-ployment offer.’’ Sales force qualitative input should always be checked againstinput from other more analytical and unbiased sources.
Consequences for Sales Force Activities
Salespeople Sales forceactivities
Customerresults
Companyresults
Sales forceincentive
compensationplan
Othersalespersoneffectiveness
drivers
Companystrategies and
sales jobdefiners
• ‘‘We want to drive behavior to achieve and exceed sales goals,’’ reports thedirector of sales operations for a telecommunications firm.
PAGE 65................. 15869$ $CH2 05-19-06 09:22:47 PS
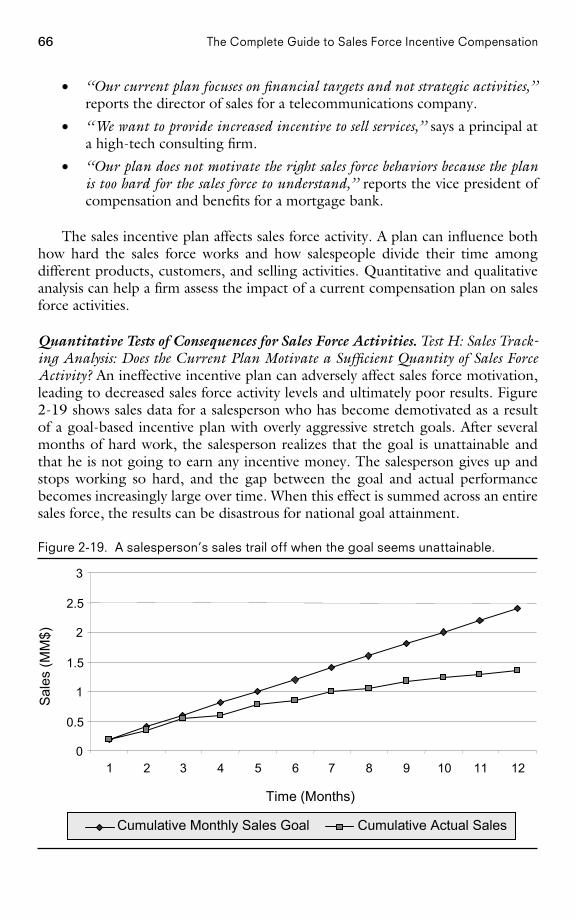
66 The Complete Guide to Sales Force Incentive Compensation
• ‘‘Our current plan focuses on financial targets and not strategic activities,’’reports the director of sales for a telecommunications company.
• ‘‘We want to provide increased incentive to sell services,’’ says a principal ata high-tech consulting firm.
• ‘‘Our plan does not motivate the right sales force behaviors because the planis too hard for the sales force to understand,’’ reports the vice president ofcompensation and benefits for a mortgage bank.
The sales incentive plan affects sales force activity. A plan can influence bothhow hard the sales force works and how salespeople divide their time amongdifferent products, customers, and selling activities. Quantitative and qualitativeanalysis can help a firm assess the impact of a current compensation plan on salesforce activities.
Quantitative Tests of Consequences for Sales Force Activities. Test H: Sales Track-ing Analysis: Does the Current Plan Motivate a Sufficient Quantity of Sales ForceActivity? An ineffective incentive plan can adversely affect sales force motivation,leading to decreased sales force activity levels and ultimately poor results. Figure2-19 shows sales data for a salesperson who has become demotivated as a resultof a goal-based incentive plan with overly aggressive stretch goals. After severalmonths of hard work, the salesperson realizes that the goal is unattainable andthat he is not going to earn any incentive money. The salesperson gives up andstops working so hard, and the gap between the goal and actual performancebecomes increasingly large over time. When this effect is summed across an entiresales force, the results can be disastrous for national goal attainment.
Figure 2-19. A salesperson’s sales trail off when the goal seems unattainable.
0
0.5
1
1.5
2
2.5
3
1 2 3 4 5 6 7 8 9 10 11 12
Time (Months)
Sale
s (M
M$)
Cumulative Monthly Sales Goal Cumulative Actual Sales
PAGE 66................. 15869$ $CH2 05-19-06 09:22:48 PS
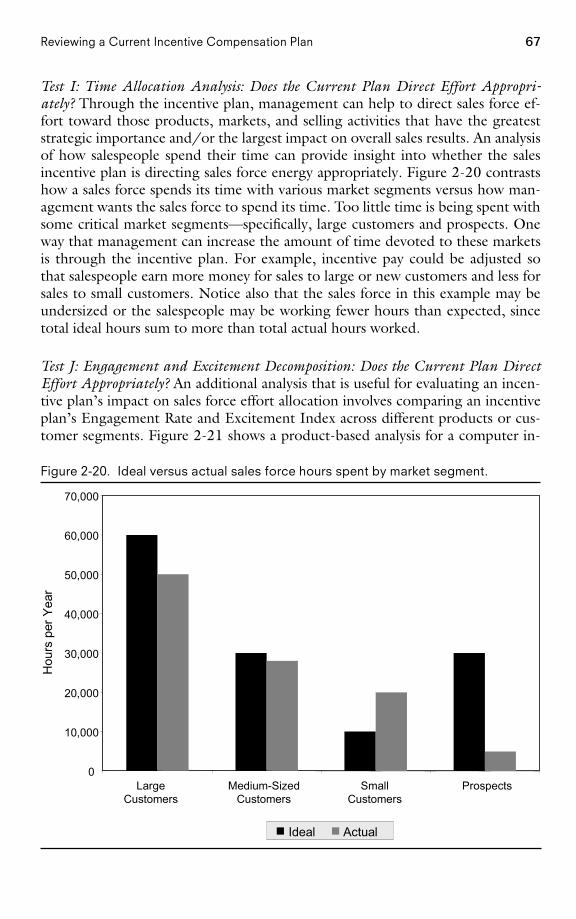
67Reviewing a Current Incentive Compensation Plan
Test I: Time Allocation Analysis: Does the Current Plan Direct Effort Appropri-ately? Through the incentive plan, management can help to direct sales force ef-fort toward those products, markets, and selling activities that have the greateststrategic importance and/or the largest impact on overall sales results. An analysisof how salespeople spend their time can provide insight into whether the salesincentive plan is directing sales force energy appropriately. Figure 2-20 contrastshow a sales force spends its time with various market segments versus how man-agement wants the sales force to spend its time. Too little time is being spent withsome critical market segments—specifically, large customers and prospects. Oneway that management can increase the amount of time devoted to these marketsis through the incentive plan. For example, incentive pay could be adjusted sothat salespeople earn more money for sales to large or new customers and less forsales to small customers. Notice also that the sales force in this example may beundersized or the salespeople may be working fewer hours than expected, sincetotal ideal hours sum to more than total actual hours worked.
Test J: Engagement and Excitement Decomposition: Does the Current Plan DirectEffort Appropriately? An additional analysis that is useful for evaluating an incen-tive plan’s impact on sales force effort allocation involves comparing an incentiveplan’s Engagement Rate and Excitement Index across different products or cus-tomer segments. Figure 2-21 shows a product-based analysis for a computer in-
Figure 2-20. Ideal versus actual sales force hours spent by market segment.
0
10,000
20,000
30,000
40,000
50,000
60,000
70,000
LargeCustomers
Medium-SizedCustomers
SmallCustomers
Prospects
Hou
rs p
er Y
ear
Ideal Actual
PAGE 67................. 15869$ $CH2 05-19-06 09:22:49 PS
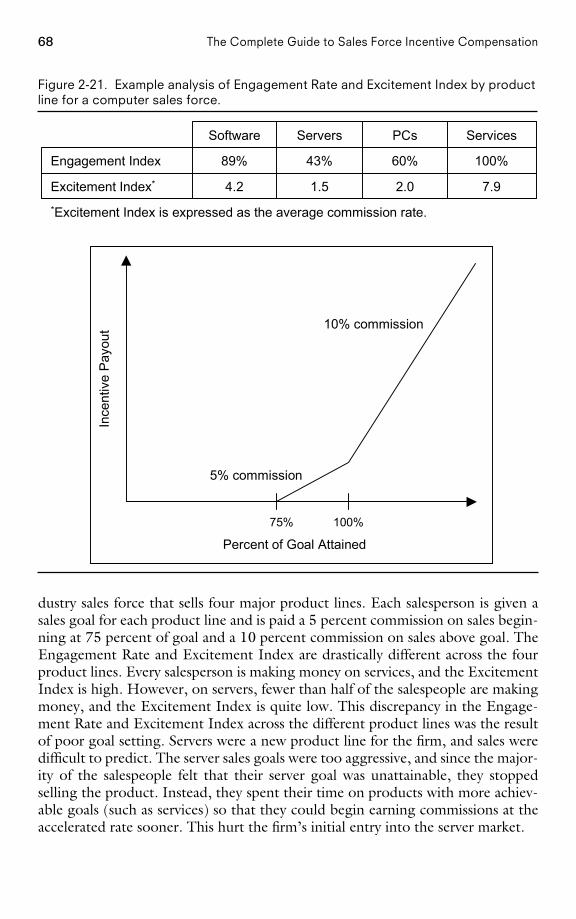
68 The Complete Guide to Sales Force Incentive Compensation
Figure 2-21. Example analysis of Engagement Rate and Excitement Index by productline for a computer sales force.
75% 100%
5% commission
10% commission
Percent of Goal Attained
Ince
ntiv
e P
ayou
t
ServicesPCsServersSoftware
*Excitement Index is expressed as the average commission rate.
7.92.01.54.2Excitement Index*
100%60%43%89%Engagement Index
dustry sales force that sells four major product lines. Each salesperson is given asales goal for each product line and is paid a 5 percent commission on sales begin-ning at 75 percent of goal and a 10 percent commission on sales above goal. TheEngagement Rate and Excitement Index are drastically different across the fourproduct lines. Every salesperson is making money on services, and the ExcitementIndex is high. However, on servers, fewer than half of the salespeople are makingmoney, and the Excitement Index is quite low. This discrepancy in the Engage-ment Rate and Excitement Index across the different product lines was the resultof poor goal setting. Servers were a new product line for the firm, and sales weredifficult to predict. The server sales goals were too aggressive, and since the major-ity of the salespeople felt that their server goal was unattainable, they stoppedselling the product. Instead, they spent their time on products with more achiev-able goals (such as services) so that they could begin earning commissions at theaccelerated rate sooner. This hurt the firm’s initial entry into the server market.
PAGE 68................. 15869$ $CH2 05-19-06 09:22:50 PS
69Reviewing a Current Incentive Compensation Plan
Qualitative Test of Consequences for Sales Force Activities. Test K: Evaluation ofPlan Complexity: Does the Sales Force Understand the Current Plan? A reviewof the current plan’s influence on sales force effort allocation should include anevaluation of how well the sales force understands the plan. Managers often reportthat their compensation plans do not direct effort appropriately because they aretoo complicated.
Six Months to Figure Out an Incentive Plan
New salespeople in a technology company’s printer division were told,‘‘Don’t worry about the sales incentive plan. It will take you six months tounderstand it. Just do your job in the meantime.’’
What Is This For?
A number of salespeople at a large pharmaceutical company recently re-ceived cash rewards but were totally unaware of why they received thebonuses. The incentive plan was just too complex.
As the complexity of an incentive plan increases, it becomes more likely thatthe sales force will ignore it. Often complex plans are rewarding but not motiva-ting to salespeople. If too much energy is required to understand the plan, sales-people either will pay no attention to the plan or may misinterpret its intent. Ineither case, the result can be that sales effort gets allocated inappropriately. Mostevaluations of incentive plan complexity are qualitative. Interviews with sales-people and sales managers will usually reveal complexity issues if they exist. Inaddition, a few heuristic tests for evaluating plan complexity can be useful:
• The elevator ride test. The average elevator ride lasts under one minute. Ifa plan cannot be explained to a salesperson in an elevator ride, it needs tobe simplified.
• The four-measures test. If the plan is tied to more than four key metrics, itneeds to be simplified.
• The business card test. If the plan cannot be summarized on a business cardthat fits into a salesperson’s wallet, it needs to be simplified.
Complexity Hinders Pay Plan’s Influence on Allocation of SalesEffort at Phoenix Technologies
Software company Phoenix Technologies started out each year with an in-centive plan consisting of three relatively simple components: a base sal-ary, a quota-based commission structure, and an annual bonus. Yet the
PAGE 69................. 15869$ $CH2 05-19-06 09:22:50 PS
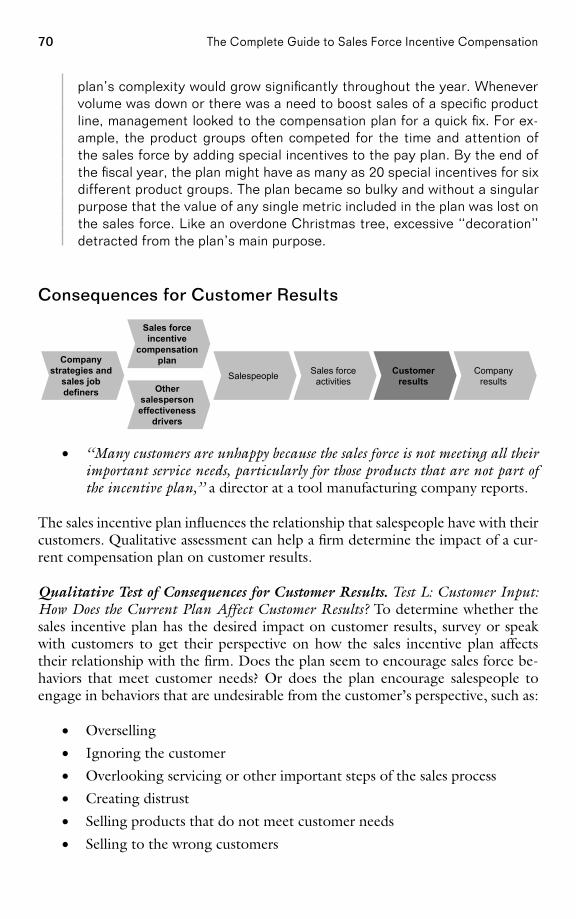
70 The Complete Guide to Sales Force Incentive Compensation
plan’s complexity would grow significantly throughout the year. Whenevervolume was down or there was a need to boost sales of a specific productline, management looked to the compensation plan for a quick fix. For ex-ample, the product groups often competed for the time and attention ofthe sales force by adding special incentives to the pay plan. By the end ofthe fiscal year, the plan might have as many as 20 special incentives for sixdifferent product groups. The plan became so bulky and without a singularpurpose that the value of any single metric included in the plan was lost onthe sales force. Like an overdone Christmas tree, excessive ‘‘decoration’’detracted from the plan’s main purpose.
Consequences for Customer Results
Salespeople Sales forceactivities
Customerresults
Companyresults
Sales forceincentive
compensationplan
Othersalespersoneffectiveness
drivers
Companystrategies and
sales jobdefiners
• ‘‘Many customers are unhappy because the sales force is not meeting all theirimportant service needs, particularly for those products that are not part ofthe incentive plan,’’ a director at a tool manufacturing company reports.
The sales incentive plan influences the relationship that salespeople have with theircustomers. Qualitative assessment can help a firm determine the impact of a cur-rent compensation plan on customer results.
Qualitative Test of Consequences for Customer Results. Test L: Customer Input:How Does the Current Plan Affect Customer Results? To determine whether thesales incentive plan has the desired impact on customer results, survey or speakwith customers to get their perspective on how the sales incentive plan affectstheir relationship with the firm. Does the plan seem to encourage sales force be-haviors that meet customer needs? Or does the plan encourage salespeople toengage in behaviors that are undesirable from the customer’s perspective, such as:
• Overselling
• Ignoring the customer
• Overlooking servicing or other important steps of the sales process
• Creating distrust
• Selling products that do not meet customer needs
• Selling to the wrong customers
PAGE 70................. 15869$ $CH2 05-19-06 09:22:51 PS
71Reviewing a Current Incentive Compensation Plan
Many companies use survey-based customer satisfaction measures to assesscustomer results. The advantages and disadvantages of basing incentives on suchmeasures are discussed in Chapter 6.
Insurance Industry Under Scrutiny for Paying BrokerCommissions That Encourage Deception of Customers
In October 2004, the world’s largest insurance broker, Marsh Inc. (a unitof the Marsh & McLennan Cos.), faced a New York State investigation foran incentive scheme that allegedly cheated customers out of the best dealsfor insurance. Customers ranging from major corporations to small busi-nesses hire insurance brokers like Marsh to find the proper insurancecoverage at the best possible price. Brokers receive commissions from cus-tomers for arranging the coverage. The controversy stems from the factthat brokers also collect commissions from the other side of the deal, theinsurers. Insurance companies often pay brokers a commission for steeringbusiness to their company or for arranging a particularly profitable form ofcoverage. These payments, investigators claimed, enticed Marsh to chooseinsurers for customers based on the size of the fees that the insurancecompanies paid Marsh, not on the price and value of the policies offered tothe customers. Marsh and the insurers were even accused of deceivingcustomers into believing that several bids for their business were beingcompetitively submitted, when in fact Marsh had determined in advancewhich company would get the sale based on the size of the commission itwould receive. As a result of these allegations, some insurance industrybrokers stopped accepting commissions from insurance companies. Otherindustry reforms are likely, in order to make sure that brokers’ financialinterests do not conflict with those of their customers.
Sears Modifies Pay Plan to Create Customer Focus
In the early 1990s, 3,500 employees of Sears Auto Center, the retailgiant’s very profitable automotive repair division, were paid straight com-mission on the parts and services they sold to customers who brought theircars in for repair. Not surprisingly, the company discovered that as a resultof this incentive scheme, some employees were charging customers forwork that was unnecessary. In 1992, the company faced several lawsuitsthat were tied directly to its incentive pay plan. Sears had to pay out mil-lions of dollars to consumers who felt that they had been enticed into au-thorizing and paying for needless repairs. In the wake of the scandal, Searsabolished commissions and sales goals in its automotive division, makingcustomer satisfaction its number one priority. The company continued touse at-risk, performance-based pay in many of its other divisions. The over-all compensation philosophy at Sears is to design pay plans that align with
PAGE 71................. 15869$ $CH2 05-19-06 09:22:52 PS
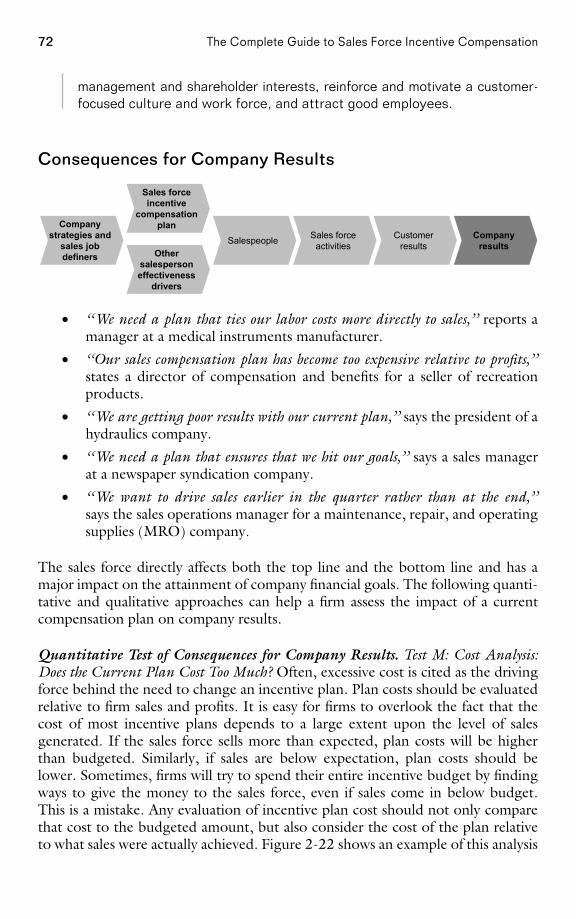
72 The Complete Guide to Sales Force Incentive Compensation
management and shareholder interests, reinforce and motivate a customer-focused culture and work force, and attract good employees.
Consequences for Company Results
Salespeople Sales forceactivities
Customerresults
Companyresults
Sales forceincentive
compensationplan
Othersalespersoneffectiveness
drivers
Companystrategies and
sales jobdefiners
• ‘‘We need a plan that ties our labor costs more directly to sales,’’ reports amanager at a medical instruments manufacturer.
• ‘‘Our sales compensation plan has become too expensive relative to profits,’’states a director of compensation and benefits for a seller of recreationproducts.
• ‘‘We are getting poor results with our current plan,’’ says the president of ahydraulics company.
• ‘‘We need a plan that ensures that we hit our goals,’’ says a sales managerat a newspaper syndication company.
• ‘‘We want to drive sales earlier in the quarter rather than at the end,’’says the sales operations manager for a maintenance, repair, and operatingsupplies (MRO) company.
The sales force directly affects both the top line and the bottom line and has amajor impact on the attainment of company financial goals. The following quanti-tative and qualitative approaches can help a firm assess the impact of a currentcompensation plan on company results.
Quantitative Test of Consequences for Company Results. Test M: Cost Analysis:Does the Current Plan Cost Too Much? Often, excessive cost is cited as the drivingforce behind the need to change an incentive plan. Plan costs should be evaluatedrelative to firm sales and profits. It is easy for firms to overlook the fact that thecost of most incentive plans depends to a large extent upon the level of salesgenerated. If the sales force sells more than expected, plan costs will be higherthan budgeted. Similarly, if sales are below expectation, plan costs should belower. Sometimes, firms will try to spend their entire incentive budget by findingways to give the money to the sales force, even if sales come in below budget.This is a mistake. Any evaluation of incentive plan cost should not only comparethat cost to the budgeted amount, but also consider the cost of the plan relativeto what sales were actually achieved. Figure 2-22 shows an example of this analysis
PAGE 72................. 15869$ $CH2 05-19-06 09:22:53 PS
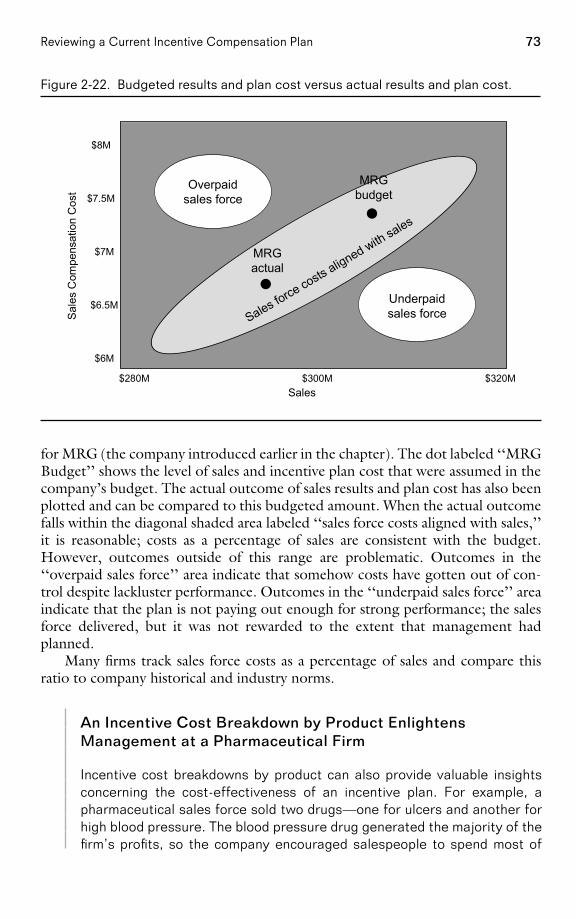
73Reviewing a Current Incentive Compensation Plan
Figure 2-22. Budgeted results and plan cost versus actual results and plan cost.
Sales
Sale
s C
ompe
nsat
ion
Cos
t Overpaidsales force
MRGbudget
Sales force costs aligned with sales
Underpaidsales force
$300M
$6M
$6.5M
$7M
$7.5M
$8M
$280M $320M
MRGactual
for MRG (the company introduced earlier in the chapter). The dot labeled ‘‘MRGBudget’’ shows the level of sales and incentive plan cost that were assumed in thecompany’s budget. The actual outcome of sales results and plan cost has also beenplotted and can be compared to this budgeted amount. When the actual outcomefalls within the diagonal shaded area labeled ‘‘sales force costs aligned with sales,’’it is reasonable; costs as a percentage of sales are consistent with the budget.However, outcomes outside of this range are problematic. Outcomes in the‘‘overpaid sales force’’ area indicate that somehow costs have gotten out of con-trol despite lackluster performance. Outcomes in the ‘‘underpaid sales force’’ areaindicate that the plan is not paying out enough for strong performance; the salesforce delivered, but it was not rewarded to the extent that management hadplanned.
Many firms track sales force costs as a percentage of sales and compare thisratio to company historical and industry norms.
An Incentive Cost Breakdown by Product EnlightensManagement at a Pharmaceutical Firm
Incentive cost breakdowns by product can also provide valuable insightsconcerning the cost-effectiveness of an incentive plan. For example, apharmaceutical sales force sold two drugs—one for ulcers and another forhigh blood pressure. The blood pressure drug generated the majority of thefirm’s profits, so the company encouraged salespeople to spend most of
PAGE 73................. 15869$ $CH2 05-19-06 09:22:54 PS
74 The Complete Guide to Sales Force Incentive Compensation
their time selling that product. Incentive payout was tied to goal attainmenton each product, and the more profitable product had a higher payout rate.Unfortunately, the company did a poor job of goal setting. Sales goals forthe more profitable blood pressure drug were set too high, while goals forthe ulcer drug were set too low. When it became evident to salespeoplethat the goals on the higher-profit product could not be attained and theycould not make any incentive money selling that product, they beganspending a disproportionately large amount of time selling the lower-profitulcer medicine. At the end of the year, the total cost of the incentive planwas within budget. However, too much money had been spent for sales ofthe lower-profit ulcer drug, and too little had been spent for sales of themore important blood pressure drug.
While the major cost component of most sales incentive plans is the actualpayout to salespeople, plan costs also include the expenses associated with admin-istering the plan. For example, a vice president of sales for a semiconductor firmreports a need to reevaluate a sales incentive plan in order to ‘‘simplify our planand eliminate administrative overhead.’’ At some firms, the cost of administeringthe incentive plan is quite significant. Efficient yet accurate processes for trackingperformance, calculating payouts, and distributing performance feedback to thefield are essential in order to keep administrative costs to a reasonable level. Asplan complexity increases, the additional cost of administering each new plan fea-ture should be evaluated relative to the benefit of offering that feature.
Plan Complexity Affects Administrative Costs
A large pharmaceutical company had an incentive plan that was so complexthat a consultant was hired to administer the plan. Plan administration costthe firm over $6 million annually, including both internal costs and consult-ing fees. Simplification of the plan eliminated the need for the consultantand resulted in a savings of approximately $4 million per year in administra-tive overhead.
Qualitative Test of Consequences for Company Results. Test N: Qualitative Diag-nosis: What Is the Role of the Incentive Plan in Delivering Company Results? Poorcompany results can signal the need to change an incentive plan, but poor resultscan also be an indication that other sales effectiveness drivers need adjustment aswell. The causality depicted within the sales management system framework canbe traced upstream to the drivers of sales force effectiveness in order to diagnosethe cause of many sales force problems. Compensation plan change is typicallyonly part of the solution to most problems (see ‘‘Is It Really an Incentive Com-pensation Plan Problem?’’ on page 41.
Cutler-Hammer Sales Force Fails to Produce Desired Results
In the early 1990s, sales management at the Cutler-Hammer division ofEaton Corporation faced some serious challenges. The division’s broad and
PAGE 74................. 15869$ $CH2 05-19-06 09:22:55 PS
75Reviewing a Current Incentive Compensation Plan
complex product line, which consisted of industrial controls, circuit break-ers, motor starters, and other electrical distribution equipment, was grow-ing and changing rapidly. Customers, including heavy manufacturers suchas automobile companies as well as contractors, were demanding solutionsthat required salespeople to have considerable technical expertise in manydifferent product areas. Keeping salespeople up-to-date with the latestproduct specifications was almost impossible. Competitors such as SquareD, Allen-Bradley, and General Electric had responded by establishing salesteams for major customers, made up of multiple product and technical salesspecialists. Yet Cutler-Hammer sales management was skeptical that teamselling could work, given the firm’s strong culture of individual achievement.Management tried offering a pooled component of incentive compensationto encourage teamwork, but this was an insufficient solution. Despite theincentive plan changes, salespeople were still not operating effectively asa team, the sales force was not meeting the demands of customers, andtoo many opportunities were being lost to competitors.
The successful transition to team selling at Cutler-Hammer took con-siderable time and hard work, and it became even more difficult when, inearly 1994, the division merged with the Distribution and Control BusinessUnit of Westinghouse. Ultimately, changes to several sales force effective-ness drivers contributed to the success of team selling at Cutler-Hammer:
• Sales roles and team structure. Within each sales district, salespeoplewere divided into three- and four-person groups called pods, based ongeography and market concentration. Each salesperson within eachpod became responsible for expertise in a subset of the products—12to 15 products. Approximately 30 to 40 percent of sales calls wereconducted as a team, with a pod product specialist helping her col-leagues explain technical product features or close an important deal.Pod members met weekly to discuss team strategy and share customerinformation.
• Recruiting. The old Cutler-Hammer and Westinghouse sales forces hadmany ‘‘lone rangers’’ who were used to working alone and did not havethe skills and personality to be successful team players. Hence, thechange to team selling required some tough personnel decisions. Sev-eral salespeople left the company or were demoted as a result of theirinability to adapt successfully to the new team sales environment.Teamwork became part of the hiring profile.
• Training. The sales training process was rebuilt and was updated regu-larly. Each salesperson was required to complete 80 hours of trainingannually, with a good deal of the instruction being conducted peer-to-peer during pod meetings.
• Performance management. Evaluating team performance was an im-portant part of each pod’s weekly meeting agenda. Team members
PAGE 75................. 15869$ $CH2 05-19-06 09:22:55 PS

76 The Complete Guide to Sales Force Incentive Compensation
commended top sellers and offered help to colleagues who were run-ning into hurdles.
• Sales compensation. While the majority of a Cutler-Hammer salesper-son’s pay was salary, incentives were designed to drive team selling.All pod members would benefit financially by working together as ateam. Commissions were distributed according to each team’s overallperformance, with payout based on salary grade. If, for instance, theteam reached 100 percent of its sales objective, a junior salespersonmight receive a payout equal to 15 percent of his monthly salary. Some-one with five to eight years of experience might receive a 20 percentpayout. For a senior salesperson, the payout could be as high as 25percent.
• Leadership. In the past, Cutler-Hammer management had said that itwas committed to team selling, but it hadn’t put sufficient resourcesbehind the effort. This time, top management developed and communi-cated a clear vision to inspire the sales force, and backed up that visionwith the resources to make it happen.
Assessment of Current Sales Compensation PlanConsistency and Compatibility
In order to produce appropriate consequences, a compensation plan must be con-sistent with corporate and marketing strategies, sales and go-to-market strategies,and sales force design. In addition, an effective plan is compatible with othersalesperson-focused effectiveness drivers, such as hiring and training programs,performance management systems, sales force motivators, and the sales force culture.
Consistency with Strategies and Sales Job Definers
Salespeople Sales forceactivities
Customerresults
Companyresults
Sales forceincentive
compensationplan
Othersalespersoneffectiveness
drivers
Companystrategies and
sales jobdefiners
• ‘‘Our current plan is not consistent with company goals,’’ reports a regionalsales manager for a medical sales company.
• ‘‘We need to better align our incentive plan with the firm’s strategic initia-tives,’’ says a director of business operations for a not-for-profit firm.
PAGE 76................. 15869$ $CH2 05-19-06 09:22:56 PS
77Reviewing a Current Incentive Compensation Plan
• ‘‘We need to direct sales force effort to better match channel strategies andexpectations,’’ states a director at a tools manufacturer.
• ‘‘Our incentive plan encourages transactional selling, but we want to em-phasize solution selling,’’ reports a compensation director for a seller ofoffice equipment.
As discussed in Chapter 1 and illustrated in Figure 2-2, sales force effectivenessdriver decisions follow a natural sequence. The sales compensation decision isone of several sales force effectiveness drivers that influence a salesperson. Severaldecisions called the definer drivers precede the sales compensation decision. Thesedefiner decisions characterize the sales job and include choices in three majorareas:
1. Sales strategy. Customer segmentation (whom will we sell to?), customeroffering (what will we sell?), and sales process (how will we sell?)
2. Go-to-market strategy. How different marketing channels, including thesales force, will be used to carry out the sales strategy
3. Sales force design. Sales force size, organization structure, roles, and terri-tory alignment
Sales compensation choices should always be made after the definer decisions andshould reinforce and be consistent with those decisions.
Looking further upstream, the definer decisions and all subsequent driver de-cisions should align with the firm’s overall corporate strategies. These strategiesare typically handed down to the sales force from top management. A thoroughcompensation plan review traces the sales management system all the way up-stream to ensure that sales compensation decisions are consistent with the firm’ssales strategy, go-to-market strategy, and sales force design, as well as with corpo-rate strategies.
Qualitative Tests of Consistency. Test O: Check for Consistency with CorporateStrategies. A review of the current sales incentive plan should include a comparisonof the company’s strategic corporate plan with the sales incentive plan. The com-parison should look for inconsistencies in the messages sent by the two plans.Figure 2-23 looks at some disconnects between a firm’s statements of corporatestrategy and a sales incentive plan that pays out solely based on total sales revenue.
Food Company Experiences Misalignment Between MarketingStrategy and Sales Incentives
A company in the food industry invested heavily in plant and equipmentand wanted a sales incentive plan that would encourage aggressive saleseffort in order to cover its overhead costs quickly. An incentive plan wasestablished that paid salespeople a commission based on total tonnage
PAGE 77................. 15869$ $CH2 05-19-06 09:22:57 PS
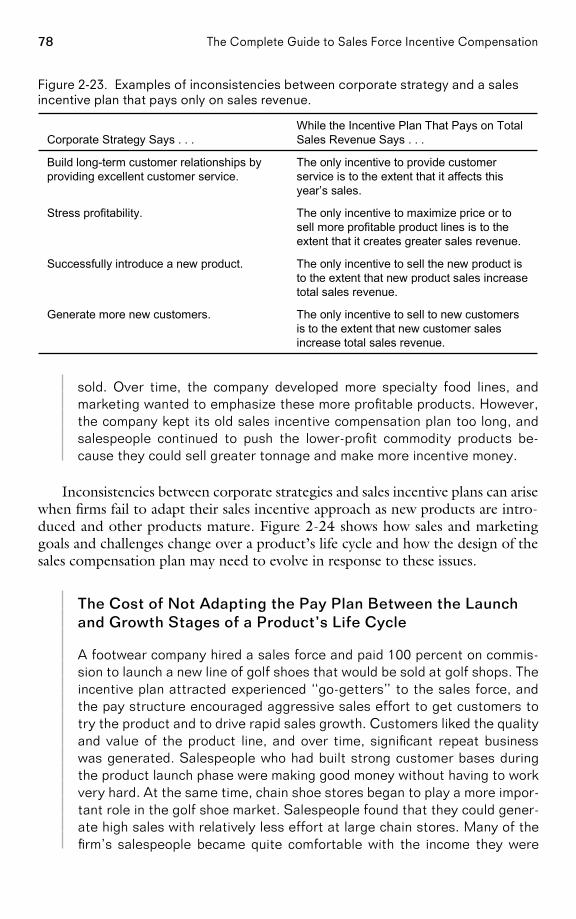
78 The Complete Guide to Sales Force Incentive Compensation
Figure 2-23. Examples of inconsistencies between corporate strategy and a salesincentive plan that pays only on sales revenue.
The only incentive to sell to new customersis to the extent that new customer salesincrease total sales revenue.
Generate more new customers.
The only incentive to sell the new product isto the extent that new product sales increasetotal sales revenue.
Successfully introduce a new product.
The only incentive to maximize price or tosell more profitable product lines is to theextent that it creates greater sales revenue.
Stress profitability.
The only incentive to provide customerservice is to the extent that it affects thisyear’s sales.
Build long-term customer relationships byproviding excellent customer service.
While the Incentive Plan That Pays on TotalSales Revenue Says . . .Corporate Strategy Says . . .
sold. Over time, the company developed more specialty food lines, andmarketing wanted to emphasize these more profitable products. However,the company kept its old sales incentive compensation plan too long, andsalespeople continued to push the lower-profit commodity products be-cause they could sell greater tonnage and make more incentive money.
Inconsistencies between corporate strategies and sales incentive plans can arisewhen firms fail to adapt their sales incentive approach as new products are intro-duced and other products mature. Figure 2-24 shows how sales and marketinggoals and challenges change over a product’s life cycle and how the design of thesales compensation plan may need to evolve in response to these issues.
The Cost of Not Adapting the Pay Plan Between the Launchand Growth Stages of a Product’s Life Cycle
A footwear company hired a sales force and paid 100 percent on commis-sion to launch a new line of golf shoes that would be sold at golf shops. Theincentive plan attracted experienced ‘‘go-getters’’ to the sales force, andthe pay structure encouraged aggressive sales effort to get customers totry the product and to drive rapid sales growth. Customers liked the qualityand value of the product line, and over time, significant repeat businesswas generated. Salespeople who had built strong customer bases duringthe product launch phase were making good money without having to workvery hard. At the same time, chain shoe stores began to play a more impor-tant role in the golf shoe market. Salespeople found that they could gener-ate high sales with relatively less effort at large chain stores. Many of thefirm’s salespeople became quite comfortable with the income they were
PAGE 78................. 15869$ $CH2 05-19-06 09:22:58 PS
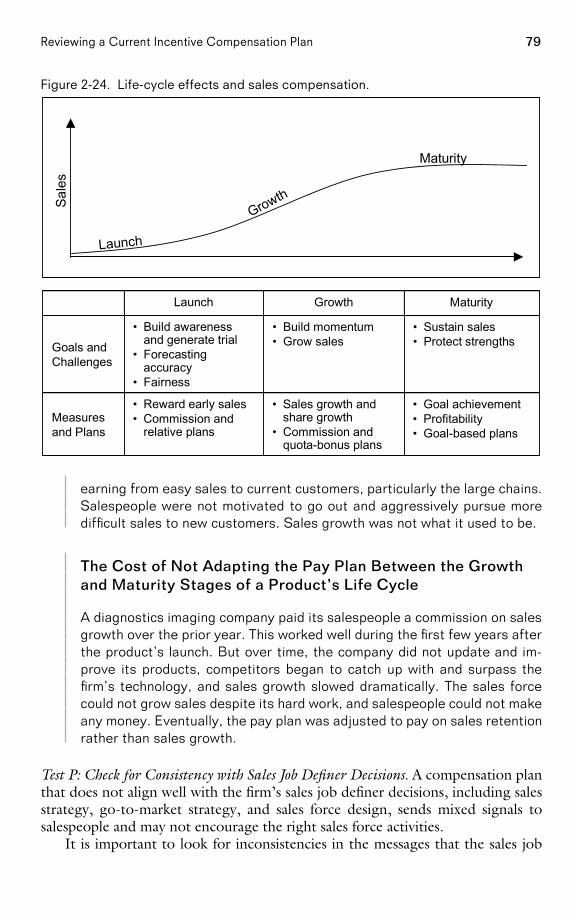
79Reviewing a Current Incentive Compensation Plan
Figure 2-24. Life-cycle effects and sales compensation.
MaturityGrowthLaunch
• Goal achievement• Profitability• Goal-based plans
• Sales growth andshare growth
• Commission andquota-bonus plans
• Reward early sales• Commission and
relative plansMeasuresand Plans
• Sustain sales• Protect strengths
• Build momentum• Grow sales
• Build awarenessand generate trial
• Forecastingaccuracy
• Fairness
Goals andChallenges
Sale
s
Launch
Growth
Maturity
earning from easy sales to current customers, particularly the large chains.Salespeople were not motivated to go out and aggressively pursue moredifficult sales to new customers. Sales growth was not what it used to be.
The Cost of Not Adapting the Pay Plan Between the Growthand Maturity Stages of a Product’s Life Cycle
A diagnostics imaging company paid its salespeople a commission on salesgrowth over the prior year. This worked well during the first few years afterthe product’s launch. But over time, the company did not update and im-prove its products, competitors began to catch up with and surpass thefirm’s technology, and sales growth slowed dramatically. The sales forcecould not grow sales despite its hard work, and salespeople could not makeany money. Eventually, the pay plan was adjusted to pay on sales retentionrather than sales growth.
Test P: Check for Consistency with Sales Job Definer Decisions. A compensation planthat does not align well with the firm’s sales job definer decisions, including salesstrategy, go-to-market strategy, and sales force design, sends mixed signals tosalespeople and may not encourage the right sales force activities.
It is important to look for inconsistencies in the messages that the sales job
PAGE 79................. 15869$ $CH2 05-19-06 09:23:00 PS
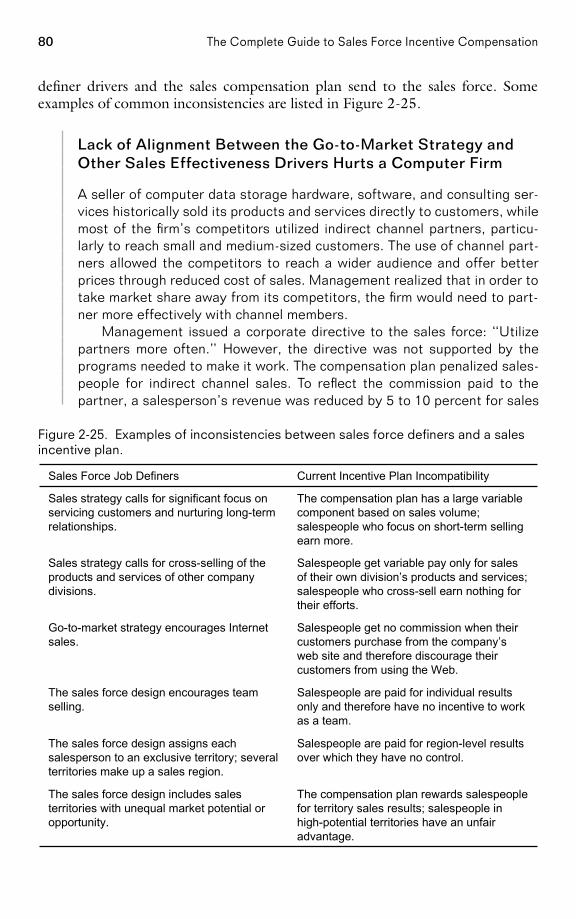
80 The Complete Guide to Sales Force Incentive Compensation
definer drivers and the sales compensation plan send to the sales force. Someexamples of common inconsistencies are listed in Figure 2-25.
Lack of Alignment Between the Go-to-Market Strategy andOther Sales Effectiveness Drivers Hurts a Computer Firm
A seller of computer data storage hardware, software, and consulting ser-vices historically sold its products and services directly to customers, whilemost of the firm’s competitors utilized indirect channel partners, particu-larly to reach small and medium-sized customers. The use of channel part-ners allowed the competitors to reach a wider audience and offer betterprices through reduced cost of sales. Management realized that in order totake market share away from its competitors, the firm would need to part-ner more effectively with channel members.
Management issued a corporate directive to the sales force: ‘‘Utilizepartners more often.’’ However, the directive was not supported by theprograms needed to make it work. The compensation plan penalized sales-people for indirect channel sales. To reflect the commission paid to thepartner, a salesperson’s revenue was reduced by 5 to 10 percent for sales
Figure 2-25. Examples of inconsistencies between sales force definers and a salesincentive plan.
The compensation plan rewards salespeoplefor territory sales results; salespeople inhigh-potential territories have an unfairadvantage.
The sales force design includes salesterritories with unequal market potential oropportunity.
Salespeople are paid for region-level resultsover which they have no control.
The sales force design assigns eachsalesperson to an exclusive territory; severalterritories make up a sales region.
Salespeople are paid for individual resultsonly and therefore have no incentive to workas a team.
The sales force design encourages teamselling.
Salespeople get no commission when theircustomers purchase from the company’sweb site and therefore discourage theircustomers from using the Web.
Go-to-market strategy encourages Internetsales.
Salespeople get variable pay only for salesof their own division’s products and services;salespeople who cross-sell earn nothing fortheir efforts.
Sales strategy calls for cross-selling of theproducts and services of other companydivisions.
The compensation plan has a large variablecomponent based on sales volume;salespeople who focus on short-term sellingearn more.
Sales strategy calls for significant focus onservicing customers and nurturing long-termrelationships.
Current Incentive Plan IncompatibilitySales Force Job Definers
PAGE 80................. 15869$ $CH2 05-19-06 09:23:01 PS
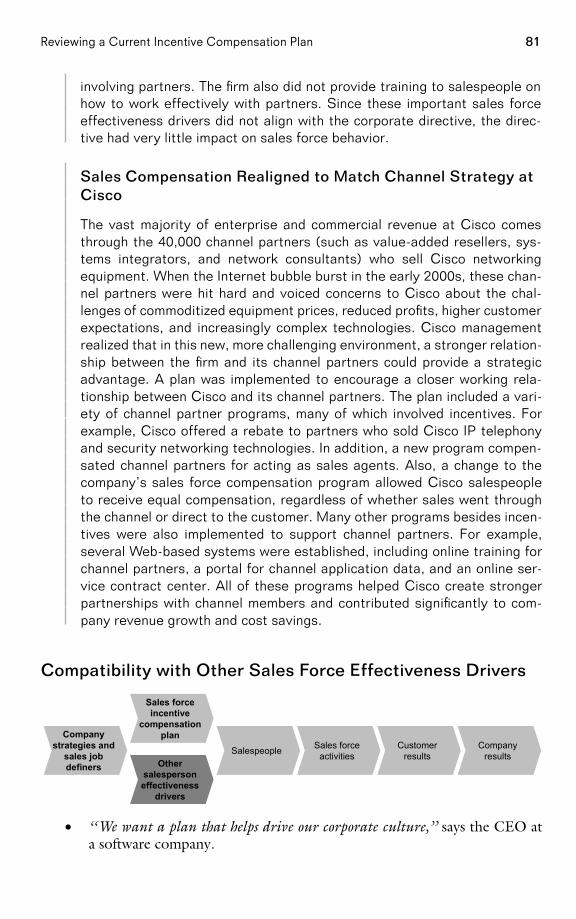
81Reviewing a Current Incentive Compensation Plan
involving partners. The firm also did not provide training to salespeople onhow to work effectively with partners. Since these important sales forceeffectiveness drivers did not align with the corporate directive, the direc-tive had very little impact on sales force behavior.
Sales Compensation Realigned to Match Channel Strategy atCisco
The vast majority of enterprise and commercial revenue at Cisco comesthrough the 40,000 channel partners (such as value-added resellers, sys-tems integrators, and network consultants) who sell Cisco networkingequipment. When the Internet bubble burst in the early 2000s, these chan-nel partners were hit hard and voiced concerns to Cisco about the chal-lenges of commoditized equipment prices, reduced profits, higher customerexpectations, and increasingly complex technologies. Cisco managementrealized that in this new, more challenging environment, a stronger relation-ship between the firm and its channel partners could provide a strategicadvantage. A plan was implemented to encourage a closer working rela-tionship between Cisco and its channel partners. The plan included a vari-ety of channel partner programs, many of which involved incentives. Forexample, Cisco offered a rebate to partners who sold Cisco IP telephonyand security networking technologies. In addition, a new program compen-sated channel partners for acting as sales agents. Also, a change to thecompany’s sales force compensation program allowed Cisco salespeopleto receive equal compensation, regardless of whether sales went throughthe channel or direct to the customer. Many other programs besides incen-tives were also implemented to support channel partners. For example,several Web-based systems were established, including online training forchannel partners, a portal for channel application data, and an online ser-vice contract center. All of these programs helped Cisco create strongerpartnerships with channel members and contributed significantly to com-pany revenue growth and cost savings.
Compatibility with Other Sales Force Effectiveness Drivers
Salespeople Sales forceactivities
Customerresults
Companyresults
Sales forceincentive
compensationplan
Othersalespersoneffectiveness
drivers
Companystrategies and
sales jobdefiners
• ‘‘We want a plan that helps drive our corporate culture,’’ says the CEO ata software company.
PAGE 81................. 15869$ $CH2 05-19-06 09:23:02 PS
82 The Complete Guide to Sales Force Incentive Compensation
• ‘‘We are sending mixed signals to the sales force,’’ says a vice president ofsales for a fireplace manufacturer.
• ‘‘Our recruiting process breaks down when we tell our candidates about ourincentive plan, or lack of incentive plan,’’ says a manager at a consumerpackaged goods company.
Thus far, the sales compensation plan assessment has included a view downstreamin the sales management system to assess the consequences of a plan for sales-people, sales force activities, and customer and company results, as well as a viewupstream to assess the plan’s consistency with the sales force definer drivers andcorporate strategies. One additional view is required in order to complete a re-view: a look at compatibility across all the salesperson effectiveness drivers. In asuccessful sales management system, the incentive compensation program workstogether with sales force hiring and training programs, performance managementsystems, sales information systems, sales force culture, and other sales force moti-vation programs. Together, these effectiveness drivers align to reinforce sales andmarketing strategies and accomplish company goals.
Qualitative Test of Compatibility. Test Q: Check for Compatibility with Cultureand Other Sales Force Effectiveness Drivers. It is useful for a firm to make a list ofall the major sales force effectiveness drivers and to look for inconsistencies in themessages that the different drivers deliver to the sales force. Figure 2-26 showssome examples of common incompatibilities between the sales compensation planand other sales force effectiveness drivers.
Sales Incentive Plan and Other Sales Force EffectivenessDrivers Align to Support a Unique Culture at W. L. Gore
Newark, Delaware–based industrial products company W. L. Gore, themaker of Gore-Tex lining for weatherproof jackets, has a unique culturebuilt around innovation, empowerment, and teamwork. All of the company’ssales force effectiveness drivers align to encourage this culture. The salesforce is organized into what Gore calls a lattice structure, in which thereare no titles and no official lines of reporting. Every salesperson has a spon-sor, who functions as a mentor, not a boss. Sales leaders function likecoaches. Salespeople work together in teams to meet the needs of theircustomers. Compensation is determined by a ranking from one’s own teammembers, as well as by the recommendations of a compensation committeethat looks at each individual’s overall long-term contribution to the firm.This includes factors such as long-term growth, customer retention, andtime devoted to sponsoring less-experienced salespeople or helping on ac-counts that aren’t the salesperson’s direct responsibility. Salespeople alsoparticipate in company stock ownership and profit-sharing plans. At W. L.
PAGE 82................. 15869$ $CH2 05-19-06 09:23:03 PS
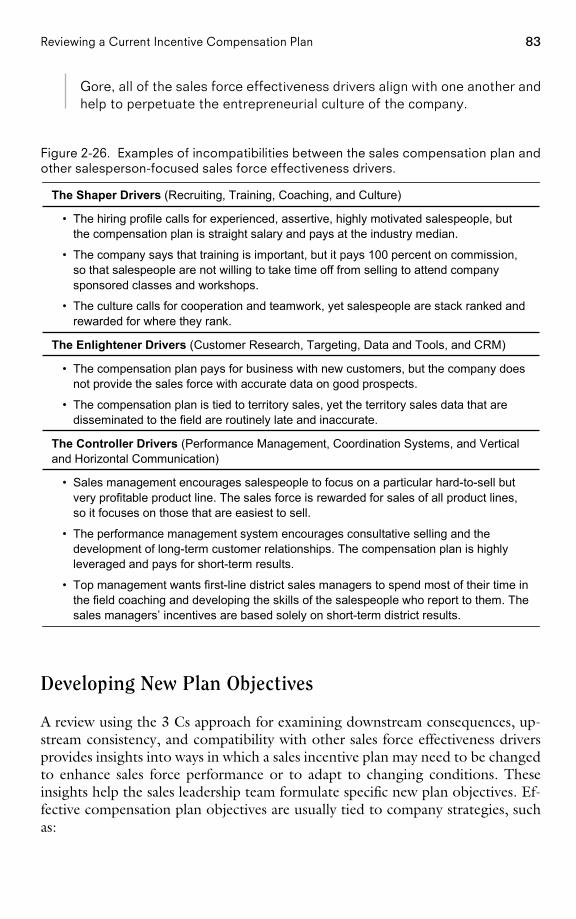
83Reviewing a Current Incentive Compensation Plan
Gore, all of the sales force effectiveness drivers align with one another andhelp to perpetuate the entrepreneurial culture of the company.
Figure 2-26. Examples of incompatibilities between the sales compensation plan andother salesperson-focused sales force effectiveness drivers.
• Sales management encourages salespeople to focus on a particular hard-to-sell butvery profitable product line. The sales force is rewarded for sales of all product lines,so it focuses on those that are easiest to sell.
• The performance management system encourages consultative selling and thedevelopment of long-term customer relationships. The compensation plan is highlyleveraged and pays for short-term results.
• Top management wants first-line district sales managers to spend most of their time inthe field coaching and developing the skills of the salespeople who report to them. Thesales managers’ incentives are based solely on short-term district results.
• The compensation plan pays for business with new customers, but the company doesnot provide the sales force with accurate data on good prospects.
• The compensation plan is tied to territory sales, yet the territory sales data that aredisseminated to the field are routinely late and inaccurate.
• The hiring profile calls for experienced, assertive, highly motivated salespeople, butthe compensation plan is straight salary and pays at the industry median.
• The company says that training is important, but it pays 100 percent on commission,so that salespeople are not willing to take time off from selling to attend companysponsored classes and workshops.
• The culture calls for cooperation and teamwork, yet salespeople are stack ranked andrewarded for where they rank.
The Controller Drivers (Performance Management, Coordination Systems, and Verticaland Horizontal Communication)
The Enlightener Drivers (Customer Research, Targeting, Data and Tools, and CRM)
The Shaper Drivers (Recruiting, Training, Coaching, and Culture)
Developing New Plan Objectives
A review using the 3 Cs approach for examining downstream consequences, up-stream consistency, and compatibility with other sales force effectiveness driversprovides insights into ways in which a sales incentive plan may need to be changedto enhance sales force performance or to adapt to changing conditions. Theseinsights help the sales leadership team formulate specific new plan objectives. Ef-fective compensation plan objectives are usually tied to company strategies, suchas:
PAGE 83................. 15869$ $CH2 05-19-06 09:23:04 PS
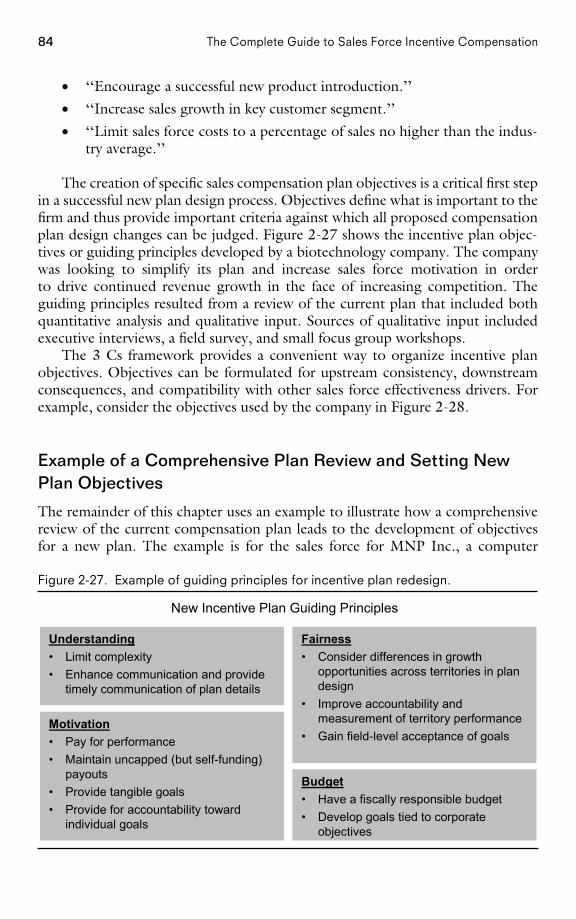
84 The Complete Guide to Sales Force Incentive Compensation
• ‘‘Encourage a successful new product introduction.’’
• ‘‘Increase sales growth in key customer segment.’’
• ‘‘Limit sales force costs to a percentage of sales no higher than the indus-try average.’’
The creation of specific sales compensation plan objectives is a critical first stepin a successful new plan design process. Objectives define what is important to thefirm and thus provide important criteria against which all proposed compensationplan design changes can be judged. Figure 2-27 shows the incentive plan objec-tives or guiding principles developed by a biotechnology company. The companywas looking to simplify its plan and increase sales force motivation in orderto drive continued revenue growth in the face of increasing competition. Theguiding principles resulted from a review of the current plan that included bothquantitative analysis and qualitative input. Sources of qualitative input includedexecutive interviews, a field survey, and small focus group workshops.
The 3 Cs framework provides a convenient way to organize incentive planobjectives. Objectives can be formulated for upstream consistency, downstreamconsequences, and compatibility with other sales force effectiveness drivers. Forexample, consider the objectives used by the company in Figure 2-28.
Example of a Comprehensive Plan Review and Setting NewPlan Objectives
The remainder of this chapter uses an example to illustrate how a comprehensivereview of the current compensation plan leads to the development of objectivesfor a new plan. The example is for the sales force for MNP Inc., a computer
Figure 2-27. Example of guiding principles for incentive plan redesign.
Understanding• Limit complexity• Enhance communication and provide
timely communication of plan details
Fairness• Consider differences in growth
opportunities across territories in plandesign
• Improve accountability andmeasurement of territory performance
• Gain field-level acceptance of goalsMotivation• Pay for performance• Maintain uncapped (but self-funding)
payouts• Provide tangible goals• Provide for accountability toward
individual goals
Budget• Have a fiscally responsible budget• Develop goals tied to corporate
objectives
New Incentive Plan Guiding Principles
PAGE 84................. 15869$ $CH2 05-19-06 09:23:05 PS
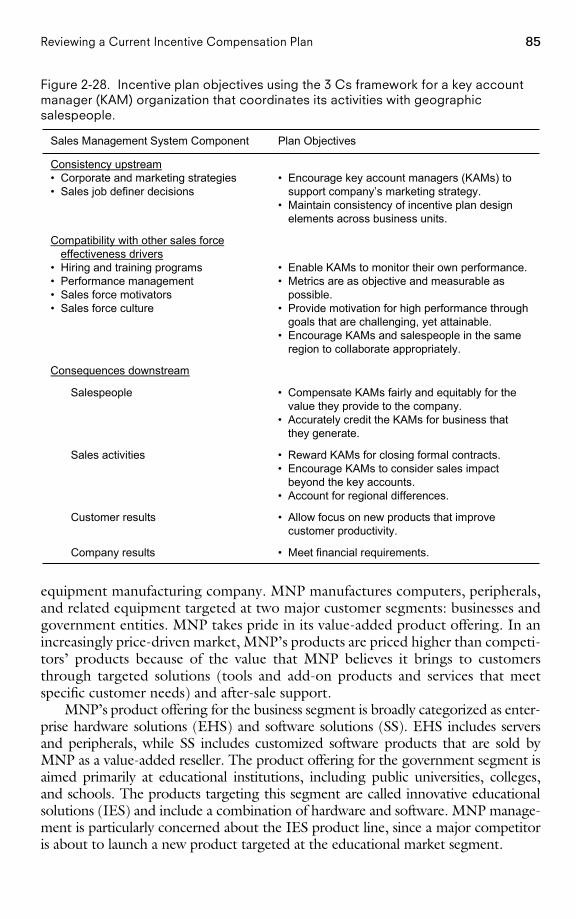
85Reviewing a Current Incentive Compensation Plan
Figure 2-28. Incentive plan objectives using the 3 Cs framework for a key accountmanager (KAM) organization that coordinates its activities with geographicsalespeople.
• Meet financial requirements.Company results
• Allow focus on new products that improvecustomer productivity.
Customer results
• Reward KAMs for closing formal contracts.• Encourage KAMs to consider sales impact
beyond the key accounts.• Account for regional differences.
Sales activities
• Compensate KAMs fairly and equitably for thevalue they provide to the company.
• Accurately credit the KAMs for business thatthey generate.
Salespeople
Consequences downstream
• Enable KAMs to monitor their own performance.• Metrics are as objective and measurable as
possible.• Provide motivation for high performance through
goals that are challenging, yet attainable.• Encourage KAMs and salespeople in the same
region to collaborate appropriately.
Compatibility with other sales forceeffectiveness drivers
• Hiring and training programs• Performance management• Sales force motivators• Sales force culture
• Encourage key account managers (KAMs) tosupport company’s marketing strategy.
• Maintain consistency of incentive plan designelements across business units.
Consistency upstream• Corporate and marketing strategies• Sales job definer decisions
Plan ObjectivesSales Management System Component
equipment manufacturing company. MNP manufactures computers, peripherals,and related equipment targeted at two major customer segments: businesses andgovernment entities. MNP takes pride in its value-added product offering. In anincreasingly price-driven market, MNP’s products are priced higher than competi-tors’ products because of the value that MNP believes it brings to customersthrough targeted solutions (tools and add-on products and services that meetspecific customer needs) and after-sale support.
MNP’s product offering for the business segment is broadly categorized as enter-prise hardware solutions (EHS) and software solutions (SS). EHS includes serversand peripherals, while SS includes customized software products that are sold byMNP as a value-added reseller. The product offering for the government segment isaimed primarily at educational institutions, including public universities, colleges,and schools. The products targeting this segment are called innovative educationalsolutions (IES) and include a combination of hardware and software. MNP manage-ment is particularly concerned about the IES product line, since a major competitoris about to launch a new product targeted at the educational market segment.
PAGE 85................. 15869$ $CH2 05-19-06 09:23:06 PS
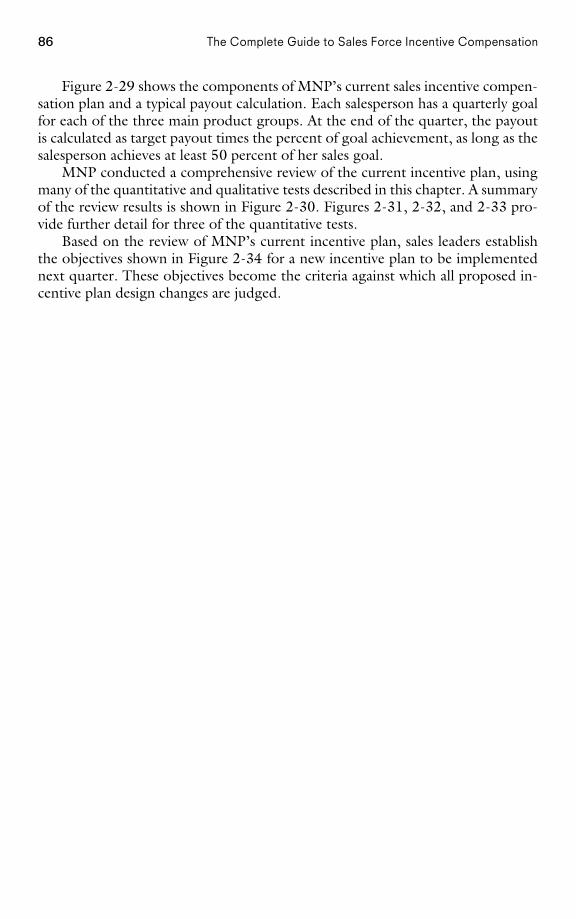
86 The Complete Guide to Sales Force Incentive Compensation
Figure 2-29 shows the components of MNP’s current sales incentive compen-sation plan and a typical payout calculation. Each salesperson has a quarterly goalfor each of the three main product groups. At the end of the quarter, the payoutis calculated as target payout times the percent of goal achievement, as long as thesalesperson achieves at least 50 percent of her sales goal.
MNP conducted a comprehensive review of the current incentive plan, usingmany of the quantitative and qualitative tests described in this chapter. A summaryof the review results is shown in Figure 2-30. Figures 2-31, 2-32, and 2-33 pro-vide further detail for three of the quantitative tests.
Based on the review of MNP’s current incentive plan, sales leaders establishthe objectives shown in Figure 2-34 for a new incentive plan to be implementednext quarter. These objectives become the criteria against which all proposed in-centive plan design changes are judged.
PAGE 86................. 15869$ $CH2 05-19-06 09:23:07 PS
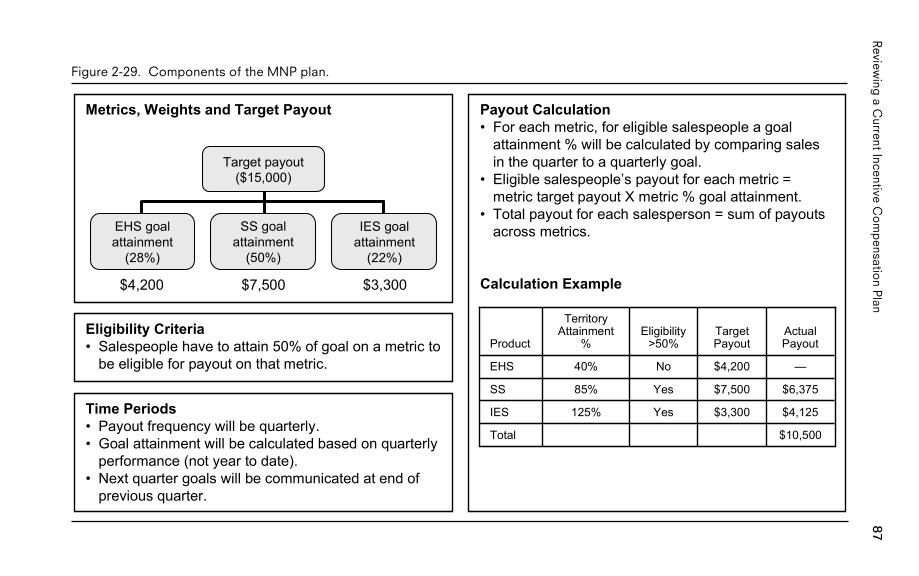
87R
eviewing
aC
urrentIncentive
Co
mp
ensation
Plan
Figure 2-29. Components of the MNP plan.
Payout Calculation• For each metric, for eligible salespeople a goal
attainment % will be calculated by comparing salesin the quarter to a quarterly goal.
• Eligible salespeople’s payout for each metric =metric target payout X metric % goal attainment.
• Total payout for each salesperson = sum of payoutsacross metrics.
Calculation Example
Eligibility Criteria• Salespeople have to attain 50% of goal on a metric to
be eligible for payout on that metric.
Time Periods• Payout frequency will be quarterly.• Goal attainment will be calculated based on quarterly
performance (not year to date).• Next quarter goals will be communicated at end of
previous quarter.
Metrics, Weights and Target Payout
$4,200 $7,500 $3,300
SS goalattainment
(50%)
Target payout($15,000)
EHS goalattainment
(28%)
IES goalattainment
(22%)
$10,500Total
$4,125$3,300Yes125%IES
$6,375$7,500Yes85%SS
—$4,200No40%EHS
ActualPayout
TargetPayout
Eligibility>50%
TerritoryAttainment
%Product
PA
GE
87.................15869$
$CH
205-19-06
09:23:08P
S
88 The Complete Guide to Sales Force Incentive Compensation
Figure 2-30. Review of the MNP current plan: A summary scorecard.
MNP sales leaders conducted a subset of the qualitative and quantitative tests from this chapterthat were appropriate given their specific sales force issues. The results of these tests are summa-rized in the following scorecard. Detailed results for three of the tests are included as separatefigures.
Compensation Plan Design—Evaluation Criteria Comments
Consequences for Salespeople
Quantitative Tests
Test C: Overall engagement is at 100 percent. All salespeople are earn-Plan traction, engage-ment, and excitement ing at least some incentive money.
Test D: Quarterly payout distribution is shown in Figure 2-31. SalesPerformance distributionanalysis leaders believe that there is not enough variation in pay across
the sales force.
Test E: No correlation is found between market size and payout. ABias checkslight geographic bias exists—a few regions of the country havemore favorable payouts.
Test F: Figure 2-32 shows the relationship between performance scorePay-for-performancecheck and payout. Sales leaders are pleased that performance ratings
and pay are positively correlated. However, they are concernedthat the lowest-rated salespeople make about half as muchmoney as the highest-paid people. They feel that outstandingperformers should make much more and poor performersshould make less.
Consequences for Salespeople
Qualitative Test
Test G: No formal surveys have been done, but there have been com-Qualitative sales forceinput plaints from top performers that the plan is too ‘‘socialistic.’’
Consequences for Sales Force Activities
Quantitative Tests
Test I: Sales force effort allocation appears consistent with pastTime allocation analysisstrategy.
Test J: Product Engagement Rates (the percentage of salespeopleEngagement and excite-ment decomposition making incentive money on each product, or those above 50
percent of goal) are high for all products: EHS, 86 percent; SS,100 percent; IES, 100 percent.
Consequences for Sales Force Activites
Qualitative Test
Test K: Salespeople are well versed in the plan and routinely see pastEvaluation of plan com-plexity payouts and forecast future payouts using a Web-based tool.
Consequences for Customers
Qualitative Test
Test L: Not gathered.Customer input
PAGE 88................. 15869$ $CH2 05-19-06 09:23:08 PS
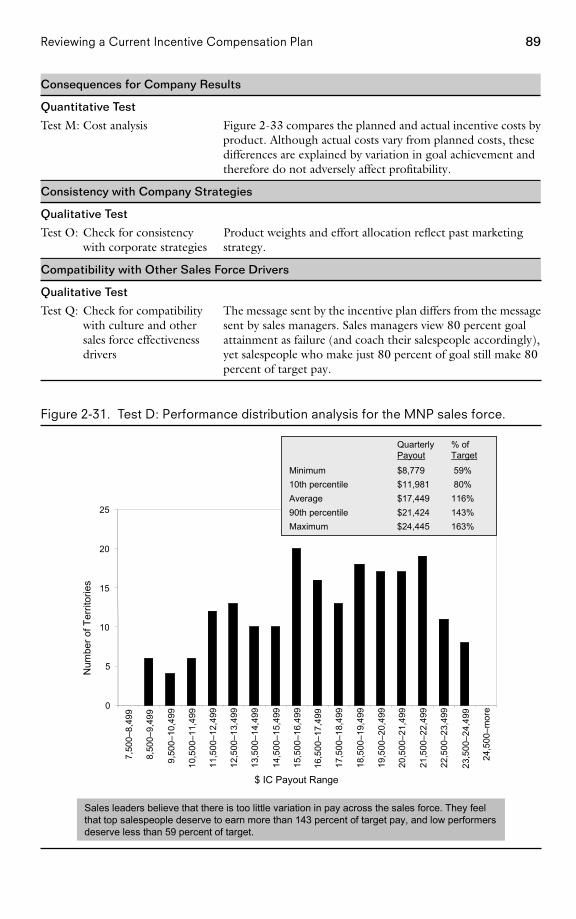
89Reviewing a Current Incentive Compensation Plan
Consequences for Company Results
Quantitative Test
Test M: Figure 2-33 compares the planned and actual incentive costs byCost analysisproduct. Although actual costs vary from planned costs, thesedifferences are explained by variation in goal achievement andtherefore do not adversely affect profitability.
Consistency with Company Strategies
Qualitative Test
Test O: Product weights and effort allocation reflect past marketingCheck for consistencywith corporate strategies strategy.
Compatibility with Other Sales Force Drivers
Qualitative Test
Test Q: The message sent by the incentive plan differs from the messageCheck for compatibilitywith culture and other sent by sales managers. Sales managers view 80 percent goalsales force effectiveness attainment as failure (and coach their salespeople accordingly),drivers yet salespeople who make just 80 percent of goal still make 80
percent of target pay.
Figure 2-31. Test D: Performance distribution analysis for the MNP sales force.
Sales leaders believe that there is too little variation in pay across the sales force. They feelthat top salespeople deserve to earn more than 143 percent of target pay, and low performersdeserve less than 59 percent of target.
0
5
10
15
20
25
7,50
0–8,
499
8,50
0–9,
499
9,50
0–10
,499
10,5
00–1
1,49
9
11,5
00–1
2,49
9
12,5
00–1
3,49
9
13,5
00–1
4,49
9
14,5
00–1
5,49
9
15,5
00–1
6,49
9
16,5
00–1
7,49
9
17,5
00–1
8,49
9
18,5
00–1
9,49
9
19,5
00–2
0,49
9
20,5
00–2
1,49
9
21,5
00–2
2,49
9
22,5
00–2
3,49
9
23,5
00–2
4,49
9
24,5
00–m
ore
Quarterly % ofPayout Target
Minimum $8,779 59%10th percentile $11,981 80%Average $17,449 116%90th percentile $21,424 143%Maximum $24,445 163%
Num
ber o
f Ter
ritor
ies
$ IC Payout Range
PAGE 89................. 15869$ $CH2 05-19-06 09:23:09 PS
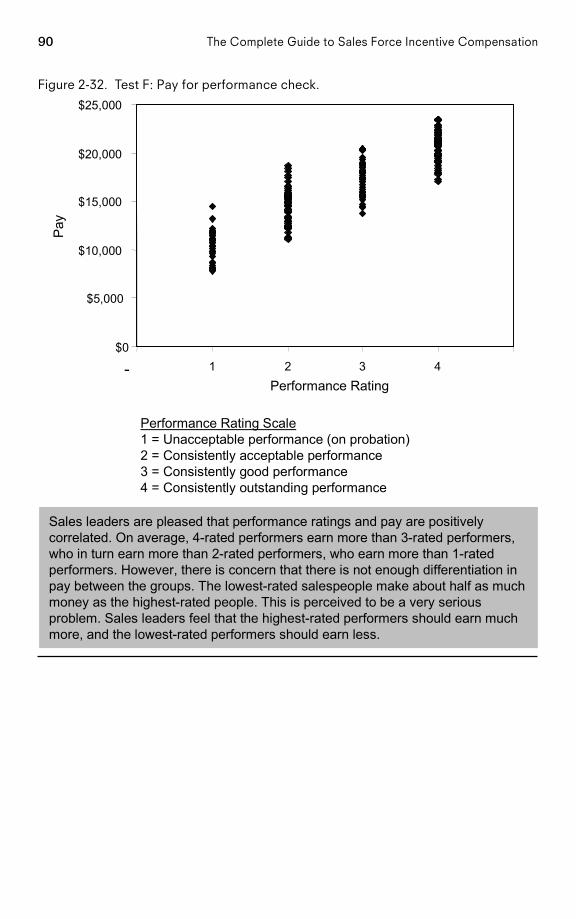
90 The Complete Guide to Sales Force Incentive Compensation
Figure 2-32. Test F: Pay for performance check.
$0
$5,000
$10,000
$15,000
$20,000
$25,000
- 1 2 3 4Performance Rating
Pay
Performance Rating Scale1 = Unacceptable performance (on probation)2 = Consistently acceptable performance3 = Consistently good performance4 = Consistently outstanding performance
Sales leaders are pleased that performance ratings and pay are positivelycorrelated. On average, 4-rated performers earn more than 3-rated performers,who in turn earn more than 2-rated performers, who earn more than 1-ratedperformers. However, there is concern that there is not enough differentiation inpay between the groups. The lowest-rated salespeople make about half as muchmoney as the highest-rated people. This is perceived to be a very seriousproblem. Sales leaders feel that the highest-rated performers should earn muchmore, and the lowest-rated performers should earn less.
PAGE 90................. 15869$ $CH2 05-19-06 09:23:10 PS
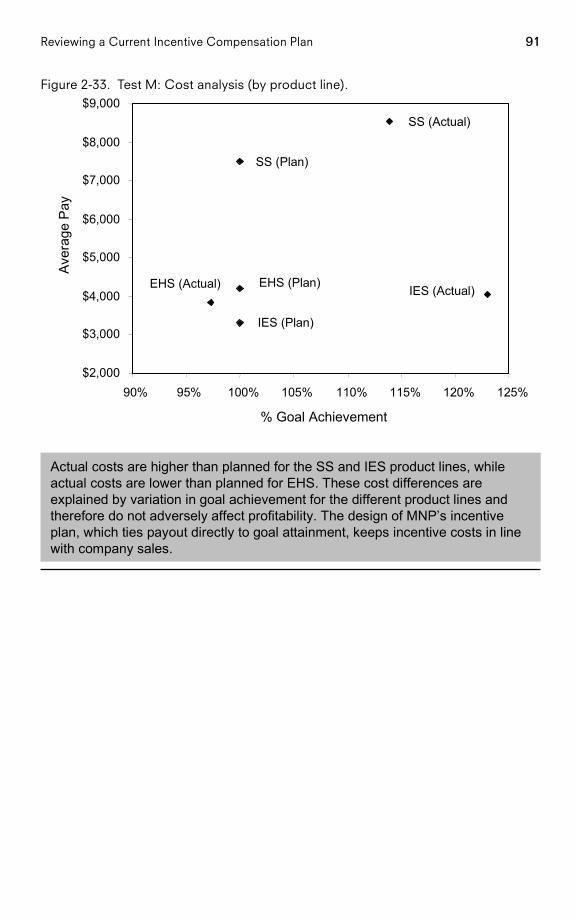
91Reviewing a Current Incentive Compensation Plan
Figure 2-33. Test M: Cost analysis (by product line).
IES (Actual)
SS (Actual)
EHS (Actual)
IES (Plan)
SS (Plan)
EHS (Plan)
$2,000
$3,000
$4,000
$5,000
$6,000
$7,000
$8,000
$9,000
90% 95% 100% 105% 110% 115% 120% 125%
% Goal Achievement
Aver
age
Pay
Actual costs are higher than planned for the SS and IES product lines, whileactual costs are lower than planned for EHS. These cost differences areexplained by variation in goal achievement for the different product lines andtherefore do not adversely affect profitability. The design of MNP’s incentiveplan, which ties payout directly to goal attainment, keeps incentive costs in linewith company sales.
PAGE 91
................. 15869$ $CH2 05-19-06 09:23:11 PS
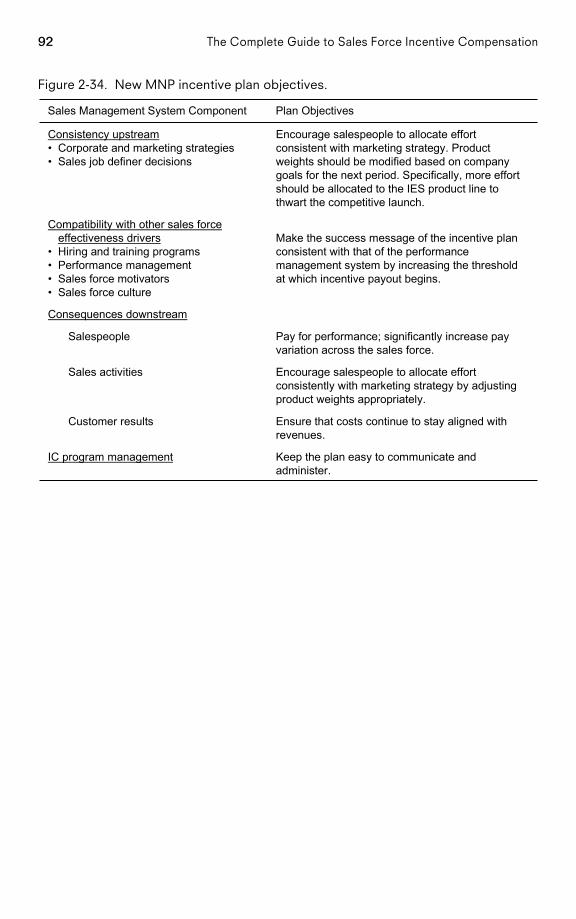
92 The Complete Guide to Sales Force Incentive Compensation
Figure 2-34. New MNP incentive plan objectives.
Keep the plan easy to communicate andadminister.
IC program management
Ensure that costs continue to stay aligned withrevenues.
Customer results
Encourage salespeople to allocate effortconsistently with marketing strategy by adjustingproduct weights appropriately.
Sales activities
Pay for performance; significantly increase payvariation across the sales force.
Salespeople
Consequences downstream
Make the success message of the incentive planconsistent with that of the performancemanagement system by increasing the thresholdat which incentive payout begins.
Compatibility with other sales forceeffectiveness drivers
• Hiring and training programs• Performance management• Sales force motivators• Sales force culture
Encourage salespeople to allocate effortconsistent with marketing strategy. Productweights should be modified based on companygoals for the next period. Specifically, more effortshould be allocated to the IES product line tothwart the competitive launch.
Consistency upstream• Corporate and marketing strategies• Sales job definer decisions
Plan ObjectivesSales Management System Component
PAGE 92................. 15869$ $CH2 05-19-06 09:23:13 PS
C H A P T E R 3
Plan Design Fundamentals
How This Chapter Is Organized
Introduction 93Sales Compensation Plan Design Terminology 94
Total Pay Components, Mix, and Leverage 94Risk 96Total Sales Components 97
Sales Force Causality and Prominence: Free Sales andSalesperson Sales 97The Effect of Market Volatility: Random Sales 101
Four Key Incentive Compensation Plan Design Decisions 103Pay Level 103Salary–Incentive Mix 104Performance Measures 104Performance–Payout Relationships 105Plan Design Choices: A Summary 105
Introduction
Designing or revamping a sales incentive compensation plan can be a challengingtask. Any plan designer who is given this responsibility struggles over when and
PAGE 93
93
................. 15869$ $CH3 05-19-06 09:22:21 PS
94 The Complete Guide to Sales Force Incentive Compensation
how to tackle such an important project. In the words of one IBM executive whoparticipated in a major redesign of the firm’s worldwide sales incentive plan,‘‘These projects can take on a life of their own.’’ Even with a small sales force, thetask of redesigning the sales compensation plan can be complex, and the impactof making a mistake significant.
This chapter organizes the sales compensation plan design process by intro-ducing some important terminology and summarizing four key sales compensa-tion plan design decisions. Chapters 4 through 7 of the book are organizedaround these four key decisions, and will use the concepts introduced here. Plandesigners can refer back to the definitions presented in this chapter throughoutthe compensation plan design process.
Sales Compensation Plan Design Terminology
The world of sales compensation plan design has its own language. Terms such astarget incentive, target pay, pay mix, variable pay, leverage, and at-risk pay areused frequently, but often inconsistently. Here, we define the way these terms areused throughout this book.
Total Pay Components, Mix, and Leverage
Figure 3-1 defines some terms that are commonly used when discussing salesforce pay. The figure shows three example compensation plans (called low, me-dium, and high) and breaks down total pay into three components within eachplan. Base salary is the fixed amount of compensation that salespeople receive,regardless of how much they sell or how well they perform in the short term.Target incentive is the amount of money the firm expects salespeople to earn invariable pay (or incentive pay), including bonuses and/or commissions. The ac-tual amount of variable pay that each salesperson earns depends upon how wellshe performs; target incentive is based on the firm’s prediction of what that per-formance should be. Base salary plus target incentive is often referred to as targetpay.
Target pay mix refers to the proportion of total target pay that is base salaryversus target incentive. Pay mix is often expressed as the percentage of salaryrelative to the percentage of target incentive. For example, Figure 3-1 includesplans with an 85/15 target pay mix, a 75/25 target pay mix, and a 50/50 targetpay mix.
It is important to note that target pay mix can be different from actual paymix. The firm’s compensation plan specifies the target pay mix. Actual pay mix,however, depends upon how well the sales force performs relative to expectations.For example, suppose a company expects its sales force to average $1 million insales per salesperson. Each salesperson receives a base salary of $50,000 plus a 5percent commission on sales. Target incentive is thus $50,000 ($1 million � 5
PAGE 94................. 15869$ $CH3 05-19-06 09:22:21 PS
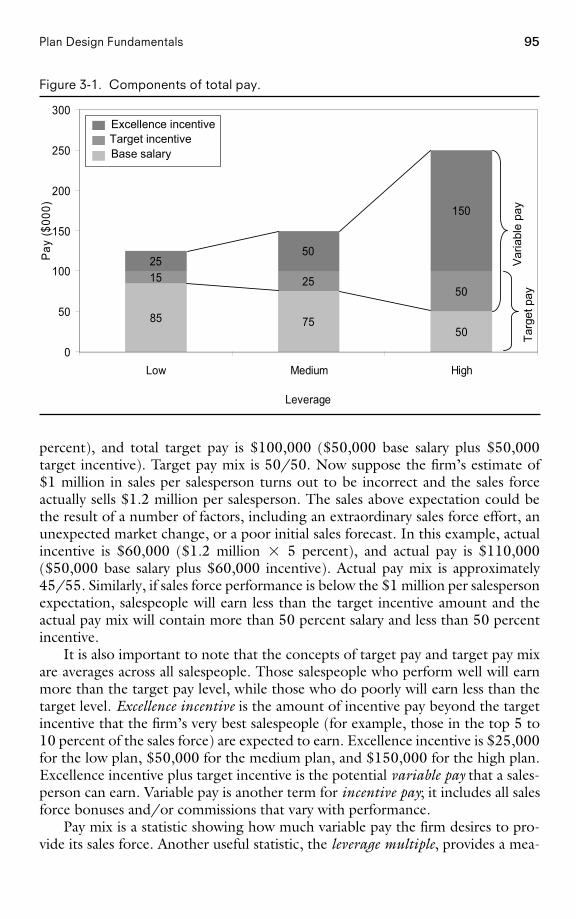
95Plan Design Fundamentals
Figure 3-1. Components of total pay.
85 7550
15 2550
2550
150
0
50
100
150
200
250
300
Low Medium High
Leverage
Pay
($00
0)
Var
iabl
e pa
yTa
rget
pay
Excellence incentiveTarget incentiveBase salary
percent), and total target pay is $100,000 ($50,000 base salary plus $50,000target incentive). Target pay mix is 50/50. Now suppose the firm’s estimate of$1 million in sales per salesperson turns out to be incorrect and the sales forceactually sells $1.2 million per salesperson. The sales above expectation could bethe result of a number of factors, including an extraordinary sales force effort, anunexpected market change, or a poor initial sales forecast. In this example, actualincentive is $60,000 ($1.2 million � 5 percent), and actual pay is $110,000($50,000 base salary plus $60,000 incentive). Actual pay mix is approximately45/55. Similarly, if sales force performance is below the $1 million per salespersonexpectation, salespeople will earn less than the target incentive amount and theactual pay mix will contain more than 50 percent salary and less than 50 percentincentive.
It is also important to note that the concepts of target pay and target pay mixare averages across all salespeople. Those salespeople who perform well will earnmore than the target pay level, while those who do poorly will earn less than thetarget level. Excellence incentive is the amount of incentive pay beyond the targetincentive that the firm’s very best salespeople (for example, those in the top 5 to10 percent of the sales force) are expected to earn. Excellence incentive is $25,000for the low plan, $50,000 for the medium plan, and $150,000 for the high plan.Excellence incentive plus target incentive is the potential variable pay that a sales-person can earn. Variable pay is another term for incentive pay; it includes all salesforce bonuses and/or commissions that vary with performance.
Pay mix is a statistic showing how much variable pay the firm desires to pro-vide its sales force. Another useful statistic, the leverage multiple, provides a mea-
PAGE 95................. 15869$ $CH3 05-19-06 09:22:22 PS
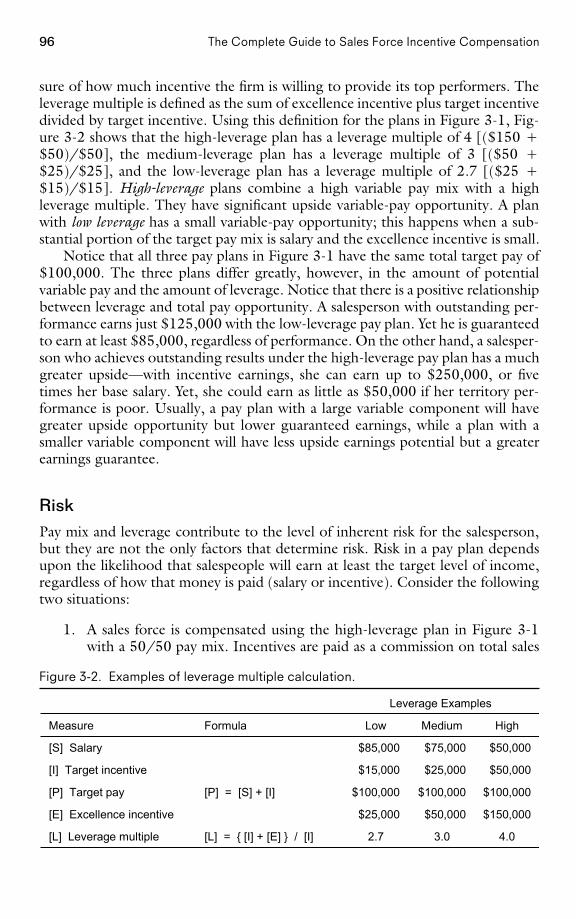
96 The Complete Guide to Sales Force Incentive Compensation
sure of how much incentive the firm is willing to provide its top performers. Theleverage multiple is defined as the sum of excellence incentive plus target incentivedivided by target incentive. Using this definition for the plans in Figure 3-1, Fig-ure 3-2 shows that the high-leverage plan has a leverage multiple of 4 [($150 �$50)/$50], the medium-leverage plan has a leverage multiple of 3 [($50 �$25)/$25], and the low-leverage plan has a leverage multiple of 2.7 [($25 �$15)/$15]. High-leverage plans combine a high variable pay mix with a highleverage multiple. They have significant upside variable-pay opportunity. A planwith low leverage has a small variable-pay opportunity; this happens when a sub-stantial portion of the target pay mix is salary and the excellence incentive is small.
Notice that all three pay plans in Figure 3-1 have the same total target pay of$100,000. The three plans differ greatly, however, in the amount of potentialvariable pay and the amount of leverage. Notice that there is a positive relationshipbetween leverage and total pay opportunity. A salesperson with outstanding per-formance earns just $125,000 with the low-leverage pay plan. Yet he is guaranteedto earn at least $85,000, regardless of performance. On the other hand, a salesper-son who achieves outstanding results under the high-leverage pay plan has a muchgreater upside—with incentive earnings, she can earn up to $250,000, or fivetimes her base salary. Yet, she could earn as little as $50,000 if her territory per-formance is poor. Usually, a pay plan with a large variable component will havegreater upside opportunity but lower guaranteed earnings, while a plan with asmaller variable component will have less upside earnings potential but a greaterearnings guarantee.
RiskPay mix and leverage contribute to the level of inherent risk for the salesperson,but they are not the only factors that determine risk. Risk in a pay plan dependsupon the likelihood that salespeople will earn at least the target level of income,regardless of how that money is paid (salary or incentive). Consider the followingtwo situations:
1. A sales force is compensated using the high-leverage plan in Figure 3-1with a 50/50 pay mix. Incentives are paid as a commission on total sales
Figure 3-2. Examples of leverage multiple calculation.
4.03.02.7[L] = { [I] + [E] } / [I][L] Leverage multiple
$150,000 $50,000 $25,000[E] Excellence incentive
$100,000$100,000$100,000[P] = [S] + [I][P] Target pay
$50,000 $25,000 $15,000[I] Target incentive
$50,000 $75,000 $85,000[S] Salary
HighMediumLowFormulaMeasure
Leverage Examples
PAGE 96................. 15869$ $CH3 05-19-06 09:22:23 PS
97Plan Design Fundamentals
from the first dollar sold. Since most sales are repeat purchases from exist-ing customers who have predictable usage and buying patterns, the firmcan project sales results at the territory level with great accuracy. Commis-sion rates are set and territories are aligned such that each salespersonearns very close to the target incentive. For the vast majority of sales-people, actual pay varies from total target pay by less than 10 percent.
2. A sales force is compensated using the medium-leverage plan in Figure 3-1 with a 75/25 pay mix. Incentives are paid as a commission on salesabove a territory goal. Territory goals are challenging ‘‘stretch’’ goals, de-signed to motivate the sales force to achieve peak performance. Over halfof the salespeople do not make goal and thus earn only the base salary of$75,000, which is 25 percent below the total target pay. Only those whomake the stretch goal can earn the target pay level or above.
Even though the first pay plan is more highly leveraged (i.e., has a greaterproportion of variable pay and greater upside opportunity) than the second payplan, the first pay plan has less risk for the salesperson. A good portion of thevariable pay in the first plan is actually a ‘‘hidden salary.’’ Salespeople earn manyof their commissions on repeat sales that will probably occur regardless of whatthey do. This pay is not truly at risk. Compensation plan designers sometimesrefer to the variable incentive portion of a pay plan as the ‘‘at-risk’’ component.These two examples show that high leverage does not always imply high risk. At-risk pay should be defined as that portion of variable pay that will be realized onlybecause of a salesperson’s skills, capabilities, motivation, and effort. We prefer touse the term performance pay for this concept. Performance pay is thus defined asthe portion of variable pay that will be earned because of a salesperson’s skills,competencies, motivation, and energy. In selling situations where a large propor-tion of sales is realized regardless of what the sales force does, performance pay isoften significantly smaller than variable pay.
Total Sales ComponentsEffective sales incentive compensation plan design requires understanding the var-ious factors that contribute to total sales, including the importance of the salesforce in the sales creation process. The sales force is just one influencer of sales.Product features and quality, brand name, pricing, and distribution are also im-portant factors. Other forms of promotion, such as advertising, direct mail, andweb sites, also have an impact. Environmental influences such as the economyand competitors’ moves are another important consideration. Understanding theimportance of the sales force in creating sales and the nature of salespeople’s im-pact helps an incentive plan designer create a plan that is appropriate for a specificselling situation.
Sales Force Causality and Prominence: Free Sales and Salesperson Sales. Theability of a sales force to affect total sales results is often called sales force causality
PAGE 97................. 15869$ $CH3 05-19-06 09:22:24 PS
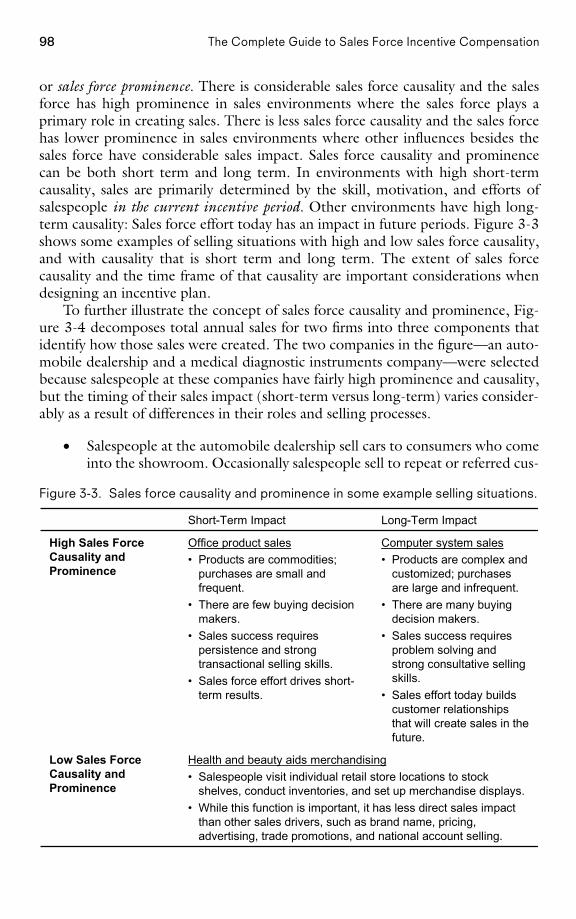
98 The Complete Guide to Sales Force Incentive Compensation
or sales force prominence. There is considerable sales force causality and the salesforce has high prominence in sales environments where the sales force plays aprimary role in creating sales. There is less sales force causality and the sales forcehas lower prominence in sales environments where other influences besides thesales force have considerable sales impact. Sales force causality and prominencecan be both short term and long term. In environments with high short-termcausality, sales are primarily determined by the skill, motivation, and efforts ofsalespeople in the current incentive period. Other environments have high long-term causality: Sales force effort today has an impact in future periods. Figure 3-3shows some examples of selling situations with high and low sales force causality,and with causality that is short term and long term. The extent of sales forcecausality and the time frame of that causality are important considerations whendesigning an incentive plan.
To further illustrate the concept of sales force causality and prominence, Fig-ure 3-4 decomposes total annual sales for two firms into three components thatidentify how those sales were created. The two companies in the figure—an auto-mobile dealership and a medical diagnostic instruments company—were selectedbecause salespeople at these companies have fairly high prominence and causality,but the timing of their sales impact (short-term versus long-term) varies consider-ably as a result of differences in their roles and selling processes.
• Salespeople at the automobile dealership sell cars to consumers who comeinto the showroom. Occasionally salespeople sell to repeat or referred cus-
Figure 3-3. Sales force causality and prominence in some example selling situations.
Computer system sales• Products are complex and
customized; purchasesare large and infrequent.
• There are many buyingdecision makers.
• Sales success requiresproblem solving andstrong consultative sellingskills.
• Sales effort today buildscustomer relationshipsthat will create sales in thefuture.
Office product sales• Products are commodities;
purchases are small andfrequent.
• There are few buying decisionmakers.
• Sales success requirespersistence and strongtransactional selling skills.
• Sales force effort drives short-term results.
High Sales ForceCausality andProminence
Health and beauty aids merchandising• Salespeople visit individual retail store locations to stock
shelves, conduct inventories, and set up merchandise displays.• While this function is important, it has less direct sales impact
than other sales drivers, such as brand name, pricing,advertising, trade promotions, and national account selling.
Low Sales ForceCausality andProminence
Long-Term ImpactShort-Term Impact
PAGE 98................. 15869$ $CH3 05-19-06 09:22:25 PS
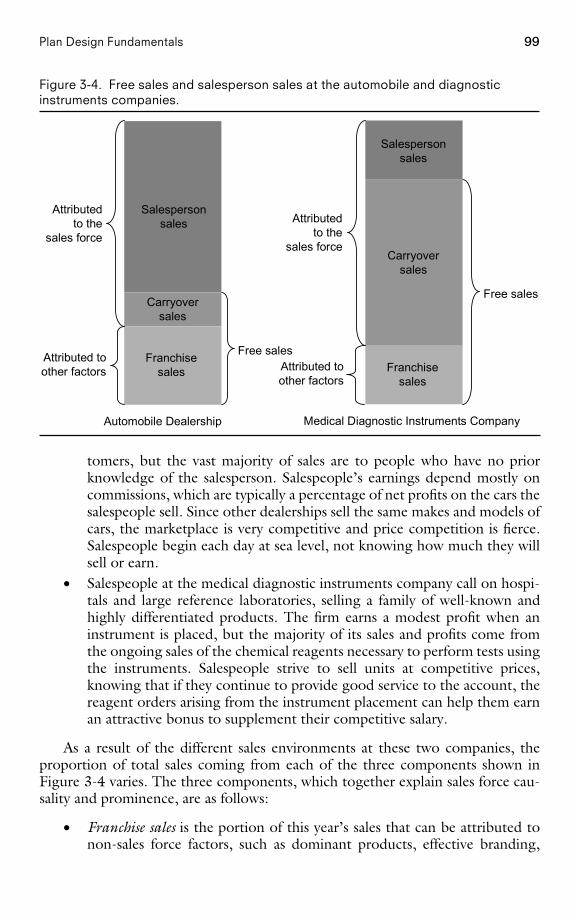
99Plan Design Fundamentals
Figure 3-4. Free sales and salesperson sales at the automobile and diagnosticinstruments companies.
Free sales
Salespersonsales
Carryoversales
Franchisesales
Attributed toother factors
Attributedto the
sales force
Automobile Dealership
Free sales
Attributed toother factors
Franchisesales
Carryoversales
Salespersonsales
Attributedto the
sales force
Medical Diagnostic Instruments Company
tomers, but the vast majority of sales are to people who have no priorknowledge of the salesperson. Salespeople’s earnings depend mostly oncommissions, which are typically a percentage of net profits on the cars thesalespeople sell. Since other dealerships sell the same makes and models ofcars, the marketplace is very competitive and price competition is fierce.Salespeople begin each day at sea level, not knowing how much they willsell or earn.
• Salespeople at the medical diagnostic instruments company call on hospi-tals and large reference laboratories, selling a family of well-known andhighly differentiated products. The firm earns a modest profit when aninstrument is placed, but the majority of its sales and profits come fromthe ongoing sales of the chemical reagents necessary to perform tests usingthe instruments. Salespeople strive to sell units at competitive prices,knowing that if they continue to provide good service to the account, thereagent orders arising from the instrument placement can help them earnan attractive bonus to supplement their competitive salary.
As a result of the different sales environments at these two companies, theproportion of total sales coming from each of the three components shown inFigure 3-4 varies. The three components, which together explain sales force cau-sality and prominence, are as follows:
• Franchise sales is the portion of this year’s sales that can be attributed tonon-sales force factors, such as dominant products, effective branding,
PAGE 99................. 15869$ $CH3 05-19-06 09:22:26 PS
100 The Complete Guide to Sales Force Incentive Compensation
competitive pricing, and effective advertising. Both the automobile sales-people and the diagnostic instruments salespeople realize a moderateamount of franchise sales. The automobile manufacturer spends largeamounts of money advertising to consumers. In addition, the dealershipruns local television, radio, and newspaper ads and has a well-known nameand reputation. The medical diagnostic instruments company sells brand-name products that are differentiated from those of competitors and arebacked by industrial advertising, trade shows, and other non-sales forcemarketing support. Franchise sales do not depend on the sales force.
• Carryover sales is the portion of this year’s sales that results from prioryears’ sales force effort. These sales are attributed to the relationships thatsalespeople have built with customers in the past; they are a consequenceof long-term sales force causality. The medical diagnostic instrumentssales force has high carryover sales. Customers have high switching costs,and each instrument placed creates future demand for reagents. As a re-sult, a diagnostic instruments salesperson’s impact is long term; the rela-tionships she develops today will pay off significantly in future years.Salespeople at the automobile dealership have low carryover sales. Cus-tomers will shop around with multiple dealers in order to get the bestprice, often using the Internet to find deals well outside of their localarea. Repeat customers are a small percentage of a car salesperson’s totalbusiness.
• Salesperson sales is sales resulting from the skill, knowledge, motivation,and effort of the sales force in the current incentive period. Salespersonsales is a consequence of short-term sales force causality. Most of the salesattributed to the sales force at the automobile dealership are salespersonsales. They result from an assertive, persuasive sales approach in which asalesperson quickly closes a deal before the consumer leaves the showroomto go to another dealership. The medical diagnostic instruments sales-people, on the other hand, generate a smaller level of salesperson sales.They spend the majority of their time servicing customers and nurturingrelationships, activities that may not result in immediate salesperson salesbut that pay off over the long term in the form of carryover sales.
Note that both the diagnostic instruments company and the automobile deal-ership have considerable sales force causality and prominence; the proportion oftotal sales attributed to the sales force is large. A primary difference between thetwo selling environments, however, is the time frame of the causality. At the auto-mobile dealership, causality is primarily short term. Sales effort this year results inconsiderable sales this year (large salesperson sales) and only very minor sales infuture years (small carryover sales). At the diagnostic instruments company, cau-sality is primarily long term. Sales effort this year creates modest sales this year(small salesperson sales) but substantial sales in future years (large carryover sales).
Carryover sales (which are created by past sales force effort) and franchise sales
PAGE 100................. 15869$ $CH3 05-19-06 09:22:27 PS
101Plan Design Fundamentals
(which are created by non-sales force factors) together equal free sales. Free saleswill be realized regardless of what the sales force does this year. This is an impor-tant concept in incentive plan design. An accurate estimation of the proportion oftotal sales that is free sales and the proportion that is salesperson sales in a givenselling situation has important implications for an incentive plan. These implica-tions are explored in future chapters.
The Effect of Market Volatility: Random Sales. Many environmental factors thatare outside of a company’s and a salesperson’s control also influence sales. Forexample, a seller of emergency home power generators sees dramatic sales in-creases when a major power outage affects customers in his territory. A businessservice company loses sales when an important customer is acquired by anotherfirm that uses a competitor’s service. Environmental volatility and uncertaintymake it difficult for firms to predict their sales accurately.
Market volatility varies considerably across sales environments. Some eventsthat can contribute significantly to market volatility include:
• Customer volatility
• The launch of a new product or a major competitive launch
• Changes in the channel structure or regulatory environment
• Technological advances
• Economic trends
• Unexpected events, such as major stock market swings or acts of nature
Windfall gains and losses that occur with very little sales force effort are an-other example of market volatility. Sometimes a salesperson gets a ‘‘bluebird.’’For example, a salesperson at a newspaper company sells advertising space to com-panies. She plays a very prominent role in creating most of her sales, so thatordinarily her free sales are very low. However, one day she happens to be in theoffice when the phone rings. She picks it up. A marketing executive for a globalelectronics firm is at the other end. The firm wants to place 30 pages of advertisingto launch a new product. The order makes the salesperson’s year. How much didshe have to do to generate the sale? Hardly anything—she gets a windfall gain.Windfall gains are a result of market volatility.
The effect of market volatility on sales is called random sales and is illustratedfor the automobile dealership and the medical diagnostic instruments company inFigure 3-5. Random sales are sales that come in unexpectedly and require veryminimal sales force effort relative to their value. Random sales can be high in oneyear and low in the next. Random sales can also be negative, such as when salesare lost as a result of customer consolidation or a successful competitive launch.Like free sales, random sales will be realized regardless of what the sales forcedoes.
Notice that random sales are larger at the automobile dealership than at the
PAGE 101................. 15869$ $CH3 05-19-06 09:22:27 PS
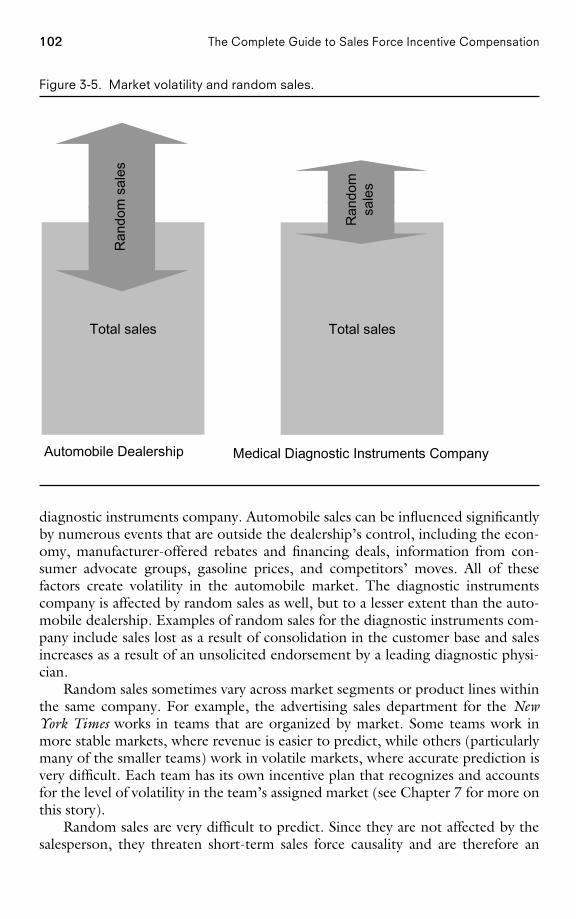
102 The Complete Guide to Sales Force Incentive Compensation
Figure 3-5. Market volatility and random sales.
Total Sales
Automobile Dealership
Total sales Total salesR
ando
msa
les
Ran
dom
sal
es
Medical Diagnostic Instruments Company
diagnostic instruments company. Automobile sales can be influenced significantlyby numerous events that are outside the dealership’s control, including the econ-omy, manufacturer-offered rebates and financing deals, information from con-sumer advocate groups, gasoline prices, and competitors’ moves. All of thesefactors create volatility in the automobile market. The diagnostic instrumentscompany is affected by random sales as well, but to a lesser extent than the auto-mobile dealership. Examples of random sales for the diagnostic instruments com-pany include sales lost as a result of consolidation in the customer base and salesincreases as a result of an unsolicited endorsement by a leading diagnostic physi-cian.
Random sales sometimes vary across market segments or product lines withinthe same company. For example, the advertising sales department for the NewYork Times works in teams that are organized by market. Some teams work inmore stable markets, where revenue is easier to predict, while others (particularlymany of the smaller teams) work in volatile markets, where accurate prediction isvery difficult. Each team has its own incentive plan that recognizes and accountsfor the level of volatility in the team’s assigned market (see Chapter 7 for more onthis story).
Random sales are very difficult to predict. Since they are not affected by thesalesperson, they threaten short-term sales force causality and are therefore an
PAGE 102................. 15869$ $CH3 05-19-06 09:22:29 PS
103Plan Design Fundamentals
important consideration for effective sales compensation plan design. The effectof random sales on incentive planning (as well as that of free sales and salespersonsales) will be explored in future chapters.
Four Key Incentive Compensation Plan Design Decisions
The next four chapters of this book are dedicated to the specifics of plan design,with each chapter focusing on one of four key incentive compensation plan designdecisions. These decisions are shown in Figure 3-6.
Chapters 4 through 7 provide thinking frameworks, practical advice, and ex-amples that will help you make the best sales incentive plan design choices in eachof these four areas. Each of the chapters is organized around two major themes:
1. Assessment of a current plan. Does an existing plan have the right pay level,pay mix, performance measures, or performance–payout relationship?
2. Designing a new plan. How do you determine the right pay level, pay mix,performance measures, or performance–payout relationship?
Pay Level
A first important sales incentive compensation plan design decision is how muchsalespeople should be paid in total. There are two parts to this decision: the aver-age target pay for each sales job, and how total pay should vary across salespeople(payout distribution) within each job. There are wide differences in sales force paylevels across industries. There are even differences in pay levels within the sameindustry. Several factors influence a company’s pay level and payout distributiondecisions, including:
• The level of sales force causality and prominence
• Labor market value
• Company job value assessment, pay level history, and budget
• Variation in performance, tenure, and levels across the sales force
• Firm culture
Some firms choose to lead the industry in total pay in order to attract the bestpossible candidates. Others choose a level of total pay that is competitive withinthe industry and use alternative strategies for attracting top talent, such as provid-ing a favorable working environment, collegial colleagues, an effective manage-
PAGE 103................. 15869$ $CH3 05-19-06 09:22:29 PS
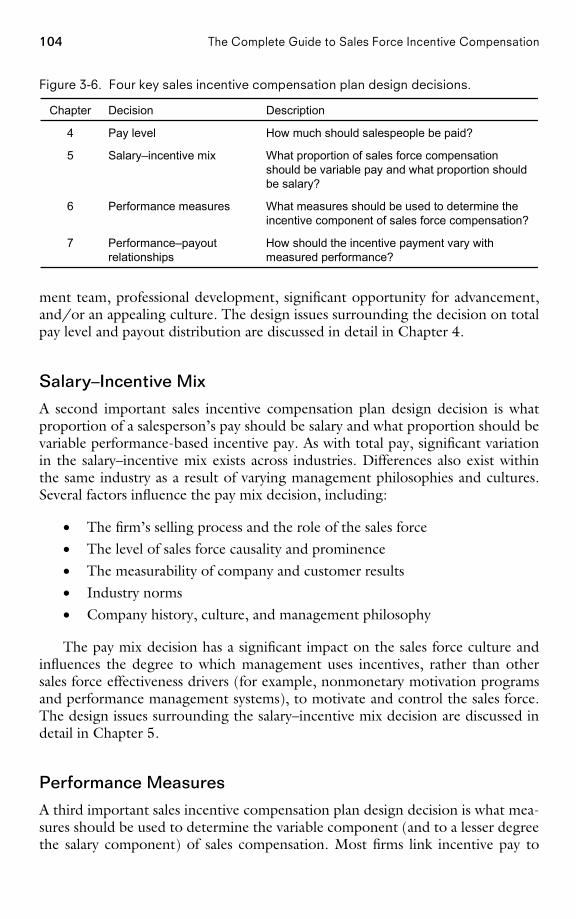
104 The Complete Guide to Sales Force Incentive Compensation
Figure 3-6. Four key sales incentive compensation plan design decisions.
How should the incentive payment vary withmeasured performance?
Performance–payoutrelationships
7
What measures should be used to determine theincentive component of sales force compensation?
Performance measures6
What proportion of sales force compensationshould be variable pay and what proportion shouldbe salary?
Salary–incentive mix5
How much should salespeople be paid?Pay level4
DescriptionDecisionChapter
ment team, professional development, significant opportunity for advancement,and/or an appealing culture. The design issues surrounding the decision on totalpay level and payout distribution are discussed in detail in Chapter 4.
Salary–Incentive Mix
A second important sales incentive compensation plan design decision is whatproportion of a salesperson’s pay should be salary and what proportion should bevariable performance-based incentive pay. As with total pay, significant variationin the salary–incentive mix exists across industries. Differences also exist withinthe same industry as a result of varying management philosophies and cultures.Several factors influence the pay mix decision, including:
• The firm’s selling process and the role of the sales force• The level of sales force causality and prominence• The measurability of company and customer results• Industry norms• Company history, culture, and management philosophy
The pay mix decision has a significant impact on the sales force culture andinfluences the degree to which management uses incentives, rather than othersales force effectiveness drivers (for example, nonmonetary motivation programsand performance management systems), to motivate and control the sales force.The design issues surrounding the salary–incentive mix decision are discussed indetail in Chapter 5.
Performance Measures
A third important sales incentive compensation plan design decision is what mea-sures should be used to determine the variable component (and to a lesser degreethe salary component) of sales compensation. Most firms link incentive pay to
PAGE 104................. 15869$ $CH3 05-19-06 09:22:30 PS
105Plan Design Fundamentals
sales revenues, but other metrics can also be used as incentive pay determinants.Determining the best performance measure to use requires examining issues suchas:
• Should incentive pay be determined by results metrics (such as sales reve-nues, units, gross margin, market share, and customer satisfaction) or byactivity metrics (such as the number of calls, proposals, or demonstra-tions)?
• Should payout be determined by the absolute level of performance, bygrowth over last year, by percent of goal achieved, or by ranking versuspeers?
• Should the metrics used for incentives be broken down by market seg-ment, product, or channel?
• What proportion of sales force pay should be based on team performanceversus individual performance?
• How often should incentives be paid?
The design issues surrounding the performance measure decision are discussed indetail in Chapter 6.
Performance–Payout Relationships
A fourth important sales incentive compensation plan design decision is determin-ing how sales force incentive payout should vary with measured performance.Some important performance–payout relationship decisions include:
• Should the firm adopt a commission plan (where the salesperson earns aspecified percentage of every sale) or a bonus plan (where a bonus isearned only if a certain level of sales or some other goal is achieved)?
• Should plan payout accelerate as performance increases, or should earn-ings decelerate once a goal or other threshold has been achieved?
• Should the incentive plan be capped?• Should the plan pay out from the first dollar or from goal or some fraction
of goal?• Should plan payout be based on a single measure or multiple measures?
The design issues surrounding the decision on performance–payout relationshipsare discussed in detail in Chapter 7.
Plan Design Choices: A SummaryThere are many drivers of incentive plan design. Industry practice, the company’sfinancial situation, product marketing strategies, the firm’s selling process, sales
PAGE 105................. 15869$ $CH3 05-19-06 09:22:30 PS
106 The Complete Guide to Sales Force Incentive Compensation
force causality, data availability and accuracy, and the firm’s culture and manage-ment philosophy are all important factors to be considered by plan designers. Thespecific influence of these factors on each of the four key incentive plan designdecisions is explored further in the next four chapters.
A Holistic View of Plan Design Decisions
This book organizes the compensation plan design decision into fourparts—pay level, pay mix, performance measures, and performance–payout relationships—and these four parts are presented sequentially inthe following four chapters. Even though the decisions are discussed inseparate chapters, they are highly interdependent. For example:
• The pay level decision and the pay mix decision are closely linked. Acompensation plan that pays a high fixed salary with only a small vari-able component tied to performance is risky for a firm. Salaries mustbe paid regardless of performance. Thus, pay levels must be kept rea-sonable so that sales force costs are managed in case performance isbelow expectation. On the other hand, a compensation plan that paysa small salary and a large variable component tied to performance is toa great extent self-funding. The firm can afford to pay more because asubstantial portion of the cost is realized only if the desired results areachieved.
• The pay mix decision is linked to the performance measures decision.Accurate territory-level company and customer results measurement isessential for a pay plan with a large variable-pay component. If it is notpossible to measure performance accurately, then it is impossible topay fairly based on that performance. When salespeople perceive per-formance measures to be unfair, the desired motivational impact of thevariable-pay plan is lost, and the sales force may spend its time arguingabout the unfairness of the measures instead of selling. When resultsmeasurability is poor, a plan with mostly salary is usually the best op-tion.
• The performance measures and performance–payout relationship deci-sions are interdependent. An effective bonus plan requires that accu-rate territory-level goal setting be possible. A successful commissionplan requires frequent and accurate measurement of territory results,so that payments are timely and correct. A volatile market in which it isdifficult to set accurate territory-level goals may necessitate incomecaps or decelerators, so that salespeople do not receive undeservedwindfalls.
Although the decisions on pay level, pay mix, performance measures,and performance–payout relationships are presented as separate and se-quential decisions in this book, these decisions cannot be made indepen-dently of one another. A holistic view of sales compensation plan designensures the best possible plan result.
PAGE 106................. 15869$ $CH3 05-19-06 09:22:30 PS
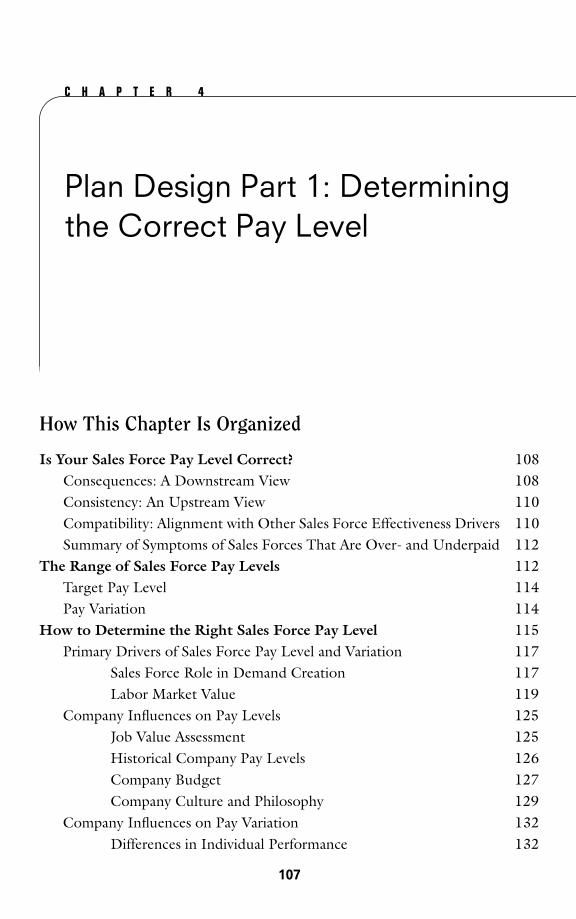
C H A P T E R 4
Plan Design Part 1: Determiningthe Correct Pay Level
How This Chapter Is Organized
Is Your Sales Force Pay Level Correct? 108Consequences: A Downstream View 108Consistency: An Upstream View 110Compatibility: Alignment with Other Sales Force Effectiveness Drivers 110Summary of Symptoms of Sales Forces That Are Over- and Underpaid 112
The Range of Sales Force Pay Levels 112Target Pay Level 114Pay Variation 114
How to Determine the Right Sales Force Pay Level 115Primary Drivers of Sales Force Pay Level and Variation 117
Sales Force Role in Demand Creation 117Labor Market Value 119
Company Influences on Pay Levels 125Job Value Assessment 125Historical Company Pay Levels 126Company Budget 127Company Culture and Philosophy 129
Company Influences on Pay Variation 132Differences in Individual Performance 132
PAGE 107
107
................. 15869$ $CH4 05-19-06 09:22:39 PS
108 The Complete Guide to Sales Force Incentive Compensation
Variation in Salesperson Tenure and Number of Job Levels 135Sales Force Culture and Values 137
Conclusion 137
Is Your Sales Force Pay Level Correct?
Determining the pay level for each sales position is an important sales manage-ment decision that has two components: determining the average target pay forthe position, and determining the pay variation across different performance levelsand tenures. Paying too little implies that the firm will not be able to attractsalespeople with the skills, knowledge, and/or motivation required to do the jobeffectively. Strong performers will leave the firm for more lucrative opportunities,resulting in low sales force productivity, lost customers, and the need to constantlyrecruit and train new salespeople. Yet paying the sales force too much createsproblems as well. The firm sacrifices profitability and creates a sense of high-payentitlement across the sales force. Overpaid salespeople may become complacentand not be motivated to work harder to earn more money. Poor performers willnot leave the company voluntarily, as they will not be able to find another job thatpays as well. While it is relatively easy to increase pay, it is very difficult to rein inpay once it is out of control.
Although the term pay level implies that there is a single number (target salesforce pay), there is really a distribution around target pay. Some salespeople willearn more than target pay, while others will earn less, based on tenure and/orperformance. Some firms set their target pay level appropriately, but get into trou-ble because their distribution around target pay is inappropriate and demotivat-ing. A common problem is that low performers are paid too much and topperformers are paid too little. This leads to excessive turnover among the firm’sbest salespeople—the ones the firm does not want to lose. At the same time, poorperformers stay on too long. The opposite situation is also possible: The variationbetween low and high performers can be too great. For example, in some situa-tions, new salespeople make so little money before they are able to build a ‘‘bookof business’’ that few survive for more than a few months.
There can be many signs that the current sales force pay level is not workingwell. The symptoms fall into clear categories within the sales management systemframework introduced in Chapter 1.
Consequences: A Downstream View
Sales compensation is a key salesperson-focused effectiveness driver; it plays animportant role in shaping, exciting, and controlling salespeople. How much sales-people are paid affects all the downstream components of the sales managementsystem. Pay level affects which salespeople are initially attracted to the firm, as well
PAGE 108................. 15869$ $CH4 05-19-06 09:22:39 PS

109Plan Design Part 1: Determining the Correct Pay Level
as who stays and who leaves. In addition, pay level influences the motivation ofsalespeople. Attraction, retention, and motivation affect sales force activities, whichin turn affect customer results and ultimately company results.
The Consequences of Paying the Sales Force Too Much
A large, diversified manufacturer of industrial and commercial fuel-handlingproducts has a compensation plan where salespeople on average earn$120,000 per year in salary plus 50 percent additional as a target bonus.Many salespeople make well over $200,000 per year—more than many vicepresidents at this company. No other sales force in the industry is paid sowell, and as a result no salesperson has left the company in over five years.Even though the company is the market leader, management feels thatmany of the salespeople are too complacent, living off their existing cus-tomer base, and not putting in the extra energy to go after new opportuni-ties.
The Consequences of Paying the Sales Force Too Little
Salespeople for a small financial consulting firm are paid an average salaryof $50,000, plus a 1.5 percent commission on sales that is equivalent to$33,000 for salespeople who achieve their sales goal. Thus, average targetpay is $83,000. Commission rates accelerate beyond goal. However, re-cent goals have been too aggressive, and last year only 20 percent of thesales force made goal. Average pay in the industry is $115,000, and manyof the firm’s best salespeople have left for more lucrative competitive of-fers. In fact, the firm lost more than one-third of the sales force last year,making the average sales force tenure just two years. Since it takes twoyears to fully train a salesperson to be effective in this market, sales lead-ership feels that it has too many inexperienced salespeople attempting tosell complex products, missing sales opportunities, damaging client rela-tionships, and harming the company’s reputation.
The Consequences of Paying Top Performers Too Little andLow Performers Too Much
Target pay for a building materials sales force is $60,000, earned 85 per-cent through salary and 15 percent through a quarterly bonus based onterritory revenue and revenue growth relative to goal. Pay ranges from$50,000 for the lowest-paid salespeople up to $90,000 for the highest-paidsalespeople. Management has observed that top performers often ‘‘maxout’’ and quit, while low performers seem to stay too long. This excessiveturnover of good salespeople has begun to hurt the firm’s relationships withits customers and is adversely affecting company sales and profits.
PAGE 109................. 15869$ $CH4 05-19-06 09:22:40 PS
110 The Complete Guide to Sales Force Incentive Compensation
Consistency: An Upstream View
Effective pay level decisions are compatible with all of the upstream sales forceeffectiveness driver decisions, including sales strategy, go-to-market strategy, andsales force design. A clear definition of sales roles (part of the sales force designdecision) is an important prerequisite to the pay level decision. A firm will needto pay more to attract salespeople for roles that are difficult, require great skill andknowledge, and have high customer impact, while lower pay may be adequate forroles that are easier, require less skill and knowledge, and have moderate customerimpact.
Sales force restructuring often necessitates changes in sales force pay levels.As sales roles are redefined, hiring profiles change. The appropriate pay level forsalespeople with the new hiring profile may be different from the appropriatepay level for salespeople with the old profile. Pay level issues can be particularlychallenging in merger situations when two merging partners have very differentsales force pay scales.
Pay Level Conflicts Following a Sales Force Merger
A large financing company acquired a small mortgage company whose salesforce compensation was way out of line with the acquiring company’s com-pensation practices. Salespeople at the mortgage company were making alot of money, in part because of the company’s rapid growth and entrepre-neurial spirit. The mortgage company had grown extremely fast, yet hadnever adjusted its original commission scale. Corporate management atthe acquiring company strongly suggested that the generous compensationfor these salespeople be brought down to a more palatable level. Salesmanagement wondered how to address this request while avoiding a mo-rale issue within the acquired sales force. ‘‘The last thing we need is for thenew division to think that we are changing everything—we can’t afford tolose folks who are critical to the company’s ongoing success.’’
Compatibility: Alignment with Other Sales ForceEffectiveness Drivers
Pay level decisions must also align well with the other sales force effectivenessdrivers. A salesperson values:
• The work content—how interesting, fulfilling, and satisfying it is
• The work environment—how supportive and enjoyable it is
• The skills gained on the job—how ‘‘employable’’ the salesperson becomes(some companies, such as Johnson & Johnson and General Electric, arewell-known ‘‘training’’ companies in their industries)
PAGE 110................. 15869$ $CH4 05-19-06 09:22:41 PS
111Plan Design Part 1: Determining the Correct Pay Level
• The company itself—its reputation and career progression opportunities
• The pay the job provides
• The benefits that go with the job
If a job is very attractive on other dimensions, the pay does not have to be thehighest competitively for the package to become dominant. On the other hand,in companies that are weak on some of these nonpay dimensions, salespeoplewill demand ‘‘combat pay’’ to compensate for the deficiencies and make the jobcompetitive in the marketplace.
Procter & Gamble Gives Employees Two Days Off
In 2004, Procter & Gamble gave employees an unexpected gift—two extravacation days—as a reward for outstanding stock performance over theprevious four years. P&G employees also had the option of taking two days’pay instead of the time off. Companies have used various forms of paidtime off to reward employees, including flextime core hours, shared posi-tions, extended lunches, and ‘‘hour off’’ passes. Rewarding employees withpaid time off shows that the company truly values its workers and believesthat employees with a balanced life are happier and more productive.
What Attracts and Motivates Younger Producers in theInsurance Industry?
Attracting young people to sales positions is a constant challenge for insur-ance companies. According to National Underwriter Life & Health maga-zine, monetary compensation is not the most important motivator forinsurance agents in their late twenties to mid-thirties. Workers in this agegroup value nonmonetary benefits, such as support of work-life balance;extra time off; continuing education benefits; in-house mentoring by experi-enced salespeople; stock options; perks such as paid vacations, club mem-berships, or box seats at sporting events; the opportunity to travel andattend conferences; and a positive work environment that provides profes-sional recognition, a sense of being needed, and opportunity for growthand advancement within the company.
Career Stage Influences Which Job Aspects Are Valued
Research shows that the importance of various job dimensions changesthroughout a salesperson’s career. Early in their career, salespeople placegreater value on intrinsic rewards, such as feelings of worthwhile accom-plishment, personal success, and respect from coworkers. Later in their
PAGE 111................. 15869$ $CH4 05-19-06 09:22:41 PS
112 The Complete Guide to Sales Force Incentive Compensation
career, the importance of these dimensions decreases and greater value isplaced on extrinsic rewards, such as pay increases and formal recognitionfor achievement.
Recruiting, training, and performance management processes need to bealigned with the type of people that will be attracted by the proposed pay level.For example:
• The recruiting applicant pool is affected by the established pay level.Higher pay creates a larger, more attractive applicant pool, making recruit-ing easier. If pay levels are below industry norms, hiring profiles may needto be adjusted in order to attract candidates.
• Training programs may need to change if applicant experience levels areeither above or below expectation.
• Sales managers will need to work differently with their direct reports, de-pending upon whether the reports feel that they are paid appropriately ornot.
Summary of Symptoms of Sales Forces That Are Over- andUnderpaid
Figures 4-1 and 4-2 summarize some common symptoms of sales forces that areoverpaid and underpaid.
The Range of Sales Force Pay Levels
The sales force pay level decision has two parts:
1. The first part of the decision is setting the target pay level. In other words,how much should a salesperson who meets the company’s expectationsearn? Actual earnings will depend upon the extent to which these expecta-tions are missed, met, or exceeded.
2. The second part of the sales force pay level decision is determining howmuch variation in pay should exist across the sales force. For example,how much more than the target pay level should a top performer earn,and how much less than the target should a salesperson who fails to meetexpectations receive? How much should an experienced salesperson whomakes his goal earn compared to a new person who makes her goal?
Sales force pay level and pay variation are important sales force incentive de-sign decisions.
PAGE 112................. 15869$ $CH4 05-19-06 09:22:41 PS
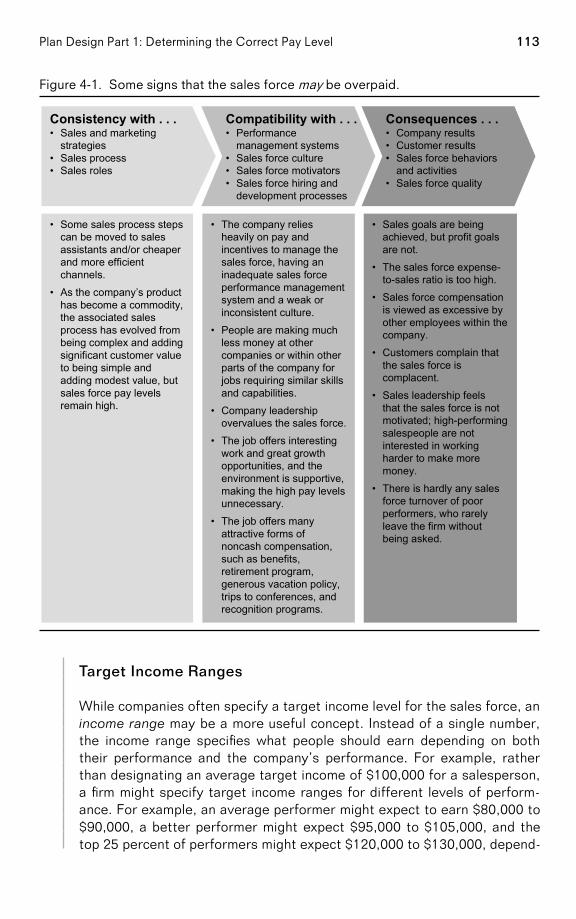
113Plan Design Part 1: Determining the Correct Pay Level
Figure 4-1. Some signs that the sales force may be overpaid.
• Some sales process stepscan be moved to salesassistants and/or cheaperand more efficientchannels.
• As the company’s producthas become a commodity,the associated salesprocess has evolved frombeing complex and addingsignificant customer valueto being simple andadding modest value, butsales force pay levelsremain high.
• The company reliesheavily on pay andincentives to manage thesales force, having aninadequate sales forceperformance managementsystem and a weak orinconsistent culture.
• People are making muchless money at othercompanies or within otherparts of the company forjobs requiring similar skillsand capabilities.
• Company leadershipovervalues the sales force.
• The job offers interestingwork and great growthopportunities, and theenvironment is supportive,making the high pay levelsunnecessary.
• The job offers manyattractive forms ofnoncash compensation,such as benefits,retirement program,generous vacation policy,trips to conferences, andrecognition programs.
• Sales goals are beingachieved, but profit goalsare not.
• The sales force expense-to-sales ratio is too high.
• Sales force compensationis viewed as excessive byother employees within thecompany.
• Customers complain thatthe sales force iscomplacent.
• Sales leadership feelsthat the sales force is notmotivated; high-performingsalespeople are notinterested in workingharder to make moremoney.
• There is hardly any salesforce turnover of poorperformers, who rarelyleave the firm withoutbeing asked.
Compatibility with . . .• Performance
management systems• Sales force culture• Sales force motivators• Sales force hiring and
development processes
Consequences . . .• Company results• Customer results• Sales force behaviors
and activities• Sales force quality
Consistency with . . .• Sales and marketing
strategies• Sales process• Sales roles
Target Income Ranges
While companies often specify a target income level for the sales force, anincome range may be a more useful concept. Instead of a single number,the income range specifies what people should earn depending on boththeir performance and the company’s performance. For example, ratherthan designating an average target income of $100,000 for a salesperson,a firm might specify target income ranges for different levels of perform-ance. For example, an average performer might expect to earn $80,000 to$90,000, a better performer might expect $95,000 to $105,000, and thetop 25 percent of performers might expect $120,000 to $130,000, depend-
PAGE 113................. 15869$ $CH4 05-19-06 09:22:42 PS
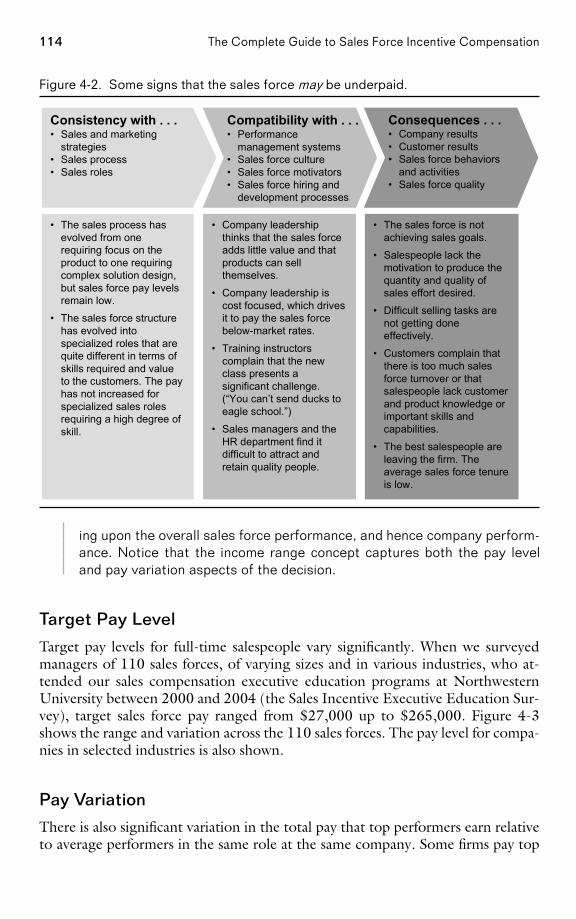
114 The Complete Guide to Sales Force Incentive Compensation
Figure 4-2. Some signs that the sales force may be underpaid.
• The sales process hasevolved from onerequiring focus on theproduct to one requiringcomplex solution design,but sales force pay levelsremain low.
• The sales force structurehas evolved intospecialized roles that arequite different in terms ofskills required and valueto the customers. The payhas not increased forspecialized sales rolesrequiring a high degree ofskill.
• Company leadershipthinks that the sales forceadds little value and thatproducts can sellthemselves.
• Company leadership iscost focused, which drivesit to pay the sales forcebelow-market rates.
• Training instructorscomplain that the newclass presents asignificant challenge.(“You can’t send ducks toeagle school.”)
• Sales managers and theHR department find itdifficult to attract andretain quality people.
• The sales force is notachieving sales goals.
• Salespeople lack themotivation to produce thequantity and quality ofsales effort desired.
• Difficult selling tasks arenot getting doneeffectively.
• Customers complain thatthere is too much salesforce turnover or thatsalespeople lack customerand product knowledge orimportant skills andcapabilities.
• The best salespeople areleaving the firm. Theaverage sales force tenureis low.
Compatibility with . . .• Performance
management systems• Sales force culture• Sales force motivators• Sales force hiring and
development processes
Consequences . . .• Company results• Customer results• Sales force behaviors
and activities• Sales force quality
Consistency with . . .• Sales and marketing
strategies• Sales process• Sales roles
ing upon the overall sales force performance, and hence company perform-ance. Notice that the income range concept captures both the pay leveland pay variation aspects of the decision.
Target Pay Level
Target pay levels for full-time salespeople vary significantly. When we surveyedmanagers of 110 sales forces, of varying sizes and in various industries, who at-tended our sales compensation executive education programs at NorthwesternUniversity between 2000 and 2004 (the Sales Incentive Executive Education Sur-vey), target sales force pay ranged from $27,000 up to $265,000. Figure 4-3shows the range and variation across the 110 sales forces. The pay level for compa-nies in selected industries is also shown.
Pay Variation
There is also significant variation in the total pay that top performers earn relativeto average performers in the same role at the same company. Some firms pay top
PAGE 114................. 15869$ $CH4 05-19-06 09:22:44 PS
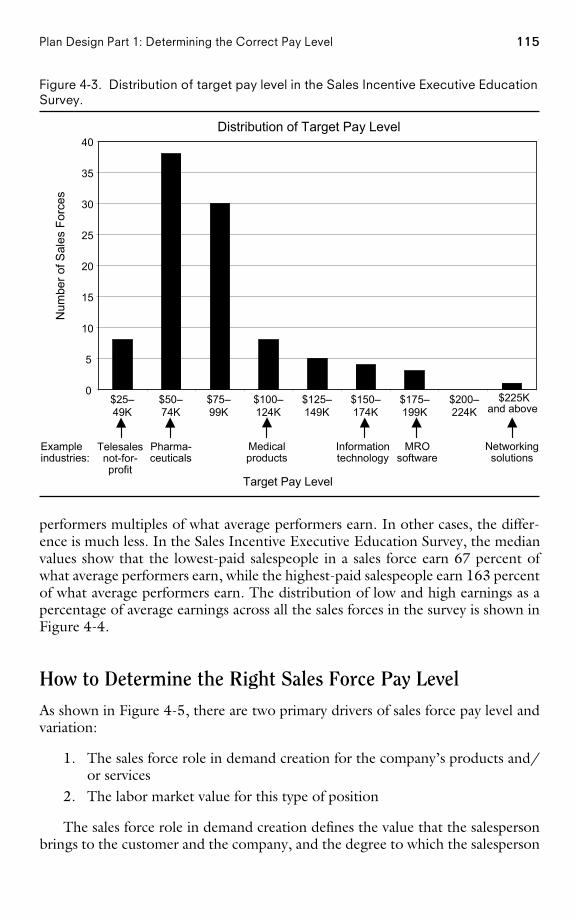
115Plan Design Part 1: Determining the Correct Pay Level
Figure 4-3. Distribution of target pay level in the Sales Incentive Executive EducationSurvey.
Distribution of Target Pay Level
0
5
10
15
20
25
30
35
40
$25–49K
$50–74K
$75–99K
$100–124K
$125–149K
$150–174K
$175–199K
$200–224K
$225Kand above
Telesalesnot-for-profit
Pharma-ceuticals
Informationtechnology
Medicalproducts
MROsoftware
Networkingsolutions
Exampleindustries:
Target Pay Level
Num
ber o
f Sal
es F
orce
s
performers multiples of what average performers earn. In other cases, the differ-ence is much less. In the Sales Incentive Executive Education Survey, the medianvalues show that the lowest-paid salespeople in a sales force earn 67 percent ofwhat average performers earn, while the highest-paid salespeople earn 163 percentof what average performers earn. The distribution of low and high earnings as apercentage of average earnings across all the sales forces in the survey is shown inFigure 4-4.
How to Determine the Right Sales Force Pay Level
As shown in Figure 4-5, there are two primary drivers of sales force pay level andvariation:
1. The sales force role in demand creation for the company’s products and/or services
2. The labor market value for this type of position
The sales force role in demand creation defines the value that the salespersonbrings to the customer and the company, and the degree to which the salesperson
PAGE 115................. 15869$ $CH4 05-19-06 09:22:45 PS
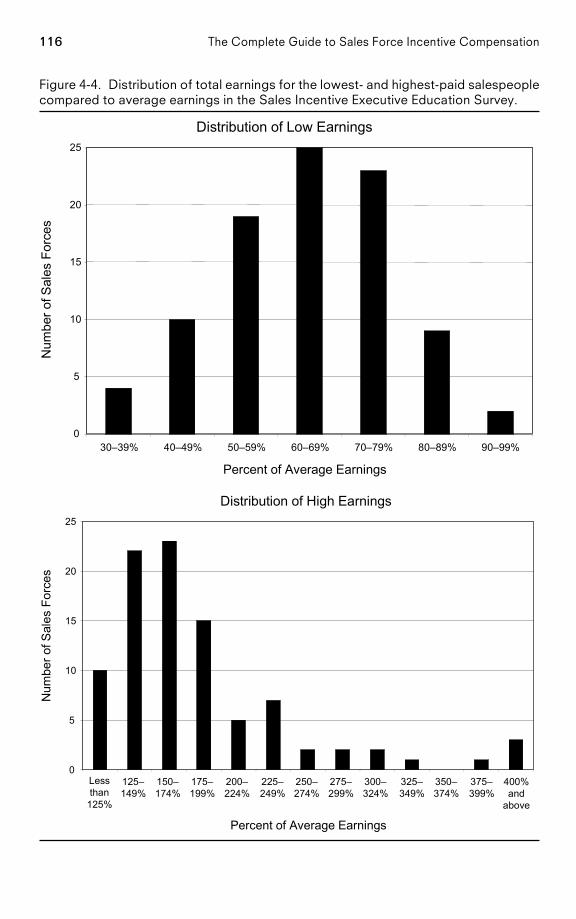
116 The Complete Guide to Sales Force Incentive Compensation
Figure 4-4. Distribution of total earnings for the lowest- and highest-paid salespeoplecompared to average earnings in the Sales Incentive Executive Education Survey.
Distribution of Low Earnings
0
5
10
15
20
25
30–39% 40–49% 50–59% 60–69% 70–79% 80–89% 90–99%
Percent of Average Earnings
Num
ber o
f Sal
es F
orce
s
Distribution of High Earnings
0
5
10
15
20
25
Lessthan
125%
125–149%
150–174%
175–199%
200–224%
225–249%
250–274%
275–299%
300–324%
325–349%
350–374%
375–399%
400%and
above
Percent of Average Earnings
Num
ber o
f Sal
es F
orce
s
PAGE 116................. 15869$ $CH4 05-19-06 09:22:47 PS
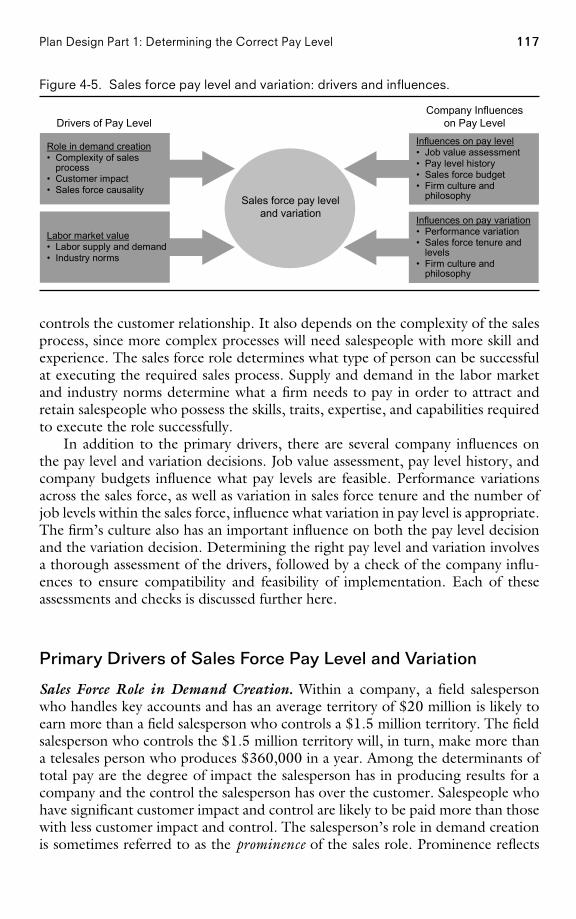
117Plan Design Part 1: Determining the Correct Pay Level
Figure 4-5. Sales force pay level and variation: drivers and influences.
Drivers of Pay LevelCompany Influences
on Pay Level
Role in demand creation• Complexity of sales
process• Customer impact• Sales force causality
Labor market value• Labor supply and demand• Industry norms
Influences on pay level• Job value assessment• Pay level history• Sales force budget• Firm culture and
philosophy
Influences on pay variation• Performance variation• Sales force tenure and
levels• Firm culture and
philosophy
Sales force pay leveland variation
controls the customer relationship. It also depends on the complexity of the salesprocess, since more complex processes will need salespeople with more skill andexperience. The sales force role determines what type of person can be successfulat executing the required sales process. Supply and demand in the labor marketand industry norms determine what a firm needs to pay in order to attract andretain salespeople who possess the skills, traits, expertise, and capabilities requiredto execute the role successfully.
In addition to the primary drivers, there are several company influences onthe pay level and variation decisions. Job value assessment, pay level history, andcompany budgets influence what pay levels are feasible. Performance variationsacross the sales force, as well as variation in sales force tenure and the number ofjob levels within the sales force, influence what variation in pay level is appropriate.The firm’s culture also has an important influence on both the pay level decisionand the variation decision. Determining the right pay level and variation involvesa thorough assessment of the drivers, followed by a check of the company influ-ences to ensure compatibility and feasibility of implementation. Each of theseassessments and checks is discussed further here.
Primary Drivers of Sales Force Pay Level and Variation
Sales Force Role in Demand Creation. Within a company, a field salespersonwho handles key accounts and has an average territory of $20 million is likely toearn more than a field salesperson who controls a $1.5 million territory. The fieldsalesperson who controls the $1.5 million territory will, in turn, make more thana telesales person who produces $360,000 in a year. Among the determinants oftotal pay are the degree of impact the salesperson has in producing results for acompany and the control the salesperson has over the customer. Salespeople whohave significant customer impact and control are likely to be paid more than thosewith less customer impact and control. The salesperson’s role in demand creationis sometimes referred to as the prominence of the sales role. Prominence reflects
PAGE 117................. 15869$ $CH4 05-19-06 09:22:48 PS
118 The Complete Guide to Sales Force Incentive Compensation
the ability of an individual salesperson to affect results and control the customerrelationship. The salesperson is the company to the customer in a high-prominenceenvironment. In high-prominence environments, sales are primarily determinedby the skill, motivation, and efforts of individual salespeople. In low-prominenceenvironments, other factors besides the sales force have a significant impact onsales. These include non-individual salesperson factors such as brand name, pric-ing, advertising, the economy, competitors’ moves, and the sales effort of othermembers of a sales team. Sales force pay levels tend to be higher and the variationbetween high and low performers larger in selling environments with high salesforce prominence.
All other things being equal, salespeople who perform complex sales processesthat require considerable knowledge and skill are likely to be paid more than thosewho perform simpler sales processes. For example, a salesperson who sells highlycustomized high-tech networking solutions needs to orchestrate the design of abeneficial solution with a technical team from his own company, while under-standing how the products will fit into the customer’s business, and perhaps evencoexist with products of co-suppliers or other vendors. The sales process requirescreative customization of the offering in order to meet each customer’s needs andstrong knowledge of the customer’s business and the company’s own products,services, and capabilities. High pay levels are required to attract salespeople withthe knowledge, skills, and capabilities required to do this job effectively. On theother hand, a consumer products merchandiser performs sales tasks that are morestraightforward (such as setting up store displays, stocking store shelves, andchecking product inventory) and works with customers (retail store managers)whose needs are more predictable and clearly defined. Merchandisers can acquirethe skill and knowledge needed to do their job in a relatively short period of time,and a great deal of experience is not necessary in order to be effective at executingthe necessary selling tasks. Thus, the firm does not need to pay as much to attractsalespeople who fit the profile of a successful merchandiser. The right pay levelattracts and retains salespeople with the skill, knowledge, and capabilities neces-sary to fill a sales role successfully, yet does not overpay and waste the firm’smoney.
Sales Force Pay Should Align with the Sales Role
Sales force pay levels can vary significantly within a single company if thereare salespeople in different sales roles. For example, a distributor of plasticcomponents pays outside field salespeople an average of $90,000 per year,but pays inside salespeople (telesales) an average of just $50,000 per year.This is because the selling tasks assigned to outside salespeople requiregreater skill and have higher customer impact than the tasks assigned toinside salespeople. In another example, ‘‘hunter’’ salespeople, who focuson lead generation, prospecting, and new customer development, usuallymake more money than ‘‘farmer’’ salespeople, who are responsible for ser-vicing, stocking, and customer maintenance. Customer assignments can
PAGE 118................. 15869$ $CH4 05-19-06 09:22:48 PS
119Plan Design Part 1: Determining the Correct Pay Level
also influence pay levels. Salespeople who are responsible for national orother major accounts usually make more money than those responsible foraccounts in a local area. For instance, at a telecommunications company,national account salespeople average $112,000 per year, large accountsalespeople average $91,000 per year, and salespeople who cover smallaccounts in geographic territories average $54,000 per year.
Labor Market Value. Labor Supply and Demand. The labor market affects mostsales forces. There is major competition for salespeople in high-employment econ-omies. In the United States during the late 1990s, workers had numerous jobopportunities and diverse career choices. As a result, sales forces needed to paymore in order to attract and retain the best people. As the economy slowed downand unemployment increased in the early 2000s, the demand for salespeople de-creased and the supply of potential workers increased, and as a result sales forcepay levels moderated. The supply–demand balance often varies across industriesas well as over time. Pay levels escalate when the supply of a particular type ofsalesperson is tight and demand for that type of salesperson is high. Demandusually exceeds supply in high-growth industries that need skilled salespeople. Themedical device industry experienced this in the 1980s, the data communicationsindustry experienced it in the 1990s, and the business-to-business e-commercecompanies saw it in the early 2000s.
High-Growth Sales Force Employment Opportunities for 2005
In February 2005, Sales and Marketing Management magazine surveyedrecruiters around the country and asked them which industries they be-lieved to have the greatest potential for sales professionals in terms of jobopportunities, compensation, and professional development. Five indus-tries were identified:
1. Health care and pharmaceuticals. Despite recent drug scandals, theindustry is booming, and sales departments within health-care andpharmaceutical firms can’t hire salespeople fast enough.
2. Office equipment. As the digital world expands, corporate businessneeds for copiers, printers, and other equipment are growing dramati-cally as companies look for new ways to take advantage of availableinformation.
3. Business services. More and more companies are cutting certain inter-nal operations and outsourcing them to business service firms in aneffort to keep budgets streamlined.
4. Insurance. The industry is thriving, particularly in areas such as benefitssales to companies. In addition, the industry is suffering from an im-mense talent drain, as the majority of agency owners are approachingretirement age.
PAGE 119................. 15869$ $CH4 05-19-06 09:22:49 PS
120 The Complete Guide to Sales Force Incentive Compensation
5. Technology. A new wave of innovation and evolution is driving growthas companies look to technology firms to provide solutions in a morecomplicated world.
Should You Vary Pay Levels by Metropolitan Area?
There are substantial cost-of-living differences across U.S. urban areas.For example, the cost of living in New York City or San Francisco is morethan double that in San Antonio or Oklahoma City. Some companies ac-count for geographic cost-of-living differences explicitly by varying paylevel according to the location of the salesperson. In our experience, mostcompanies have a single national pay level range, but allow local marketconditions to dictate specific pay levels within that range. Job candidatesin New York City, for example, are likely to require pay at the high end ofthe range, while those in Oklahoma City may be willing to work for pay atthe low end of the range.
Industry Norms. Sales force income differences across industries reflect variationsin the complexity of selling and the involvement of the sales force in demandcreation. Selling in some industries is difficult to do well, because of extensive orhighly technical product lines and/or complex customer needs. Successful sales-people in these industries require deep levels of product knowledge and customerknowledge, which are often acquired only over several years of experience in theindustry. On the other hand, selling in industries with simple product lines andeasy-to-understand customer needs does not require the same investment in ac-quiring customer and product expertise. The skills, capabilities, education, andexperience needed to be effective at selling in a particular industry help determinethe sales force pay level that is appropriate.
Industry profitability, growth, and competitive intensity also affect sales forcepay levels. Pay is usually higher in high-margin, high-growth industries, as well asin industries with considerable sales force prominence because of a lack of productdifferentiation and/or low customer switching costs. Pay is usually lower in low-margin, mature industries, as well as in industries with less sales force prominencebecause products are highly differentiated and/or customer switching costs arehigh. Sometimes the effects of these factors are in conflict with one another. Forexample, pay can be high if industry profitability is high and a salesperson hasconsiderable prominence in the creation of a high level of territory profitability.But if the high profitability is due to a differentiated product and high intrinsiccustomer demand, rather than to the salesperson’s efforts, pay can be low. Whenan industry leader sets a certain pay scale, followers and less competitive partici-pants tend to emulate the leader’s behavior. Over time, industry pay norms de-velop.
Sources of Information for Determining Market Pay Levels. Most firms use infor-mation gathered from external sources to determine industry sales force pay levels.
PAGE 120................. 15869$ $CH4 05-19-06 09:22:49 PS
121Plan Design Part 1: Determining the Correct Pay Level
External assessment involves benchmarking sales force pay against the competi-tion, analyzing market trends, and assessing the future labor supply–demand bal-ance. External assessment helps a firm ensure that its pay level is competitive inthe labor market and that the company will therefore be able to attract goodsalespeople. Market survey data, as well as information obtained through recruit-ing and exit interviews, can provide a firm with insights about market pay ratesand trends.
Most companies benchmark externally once a year to see whether their salesforce pay levels are competitive with the market. Many published market surveysare available for this purpose. There are surveys that:
• Focus exclusively on the sales function and include comparisons of pay forvarious sales positions across different industries.
• Focus on a particular industry and include comparisons across differentfunctions and positions (including sales) within the industry.
• Include global data.
• Focus on a particular geographic market.
• Include breakdowns of pay by performance level (for example, how muchdo average, better, and best performers earn?).
External market benchmarks tell the firm what pay level is needed in order tobe competitive with other firms for high-quality salespeople. Some sources ofcompensation survey data are listed in Figure 4-6.
With most of these surveys, a firm must agree to participate in future surveysin order to purchase the data. Some surveys will provide data to nonparticipants,but usually at a higher price than that for participants. Each survey has its ownunique characteristics, and selecting the best survey depends upon a company’sspecific needs. It is common for different surveys to give a slightly different marketrate for the same job. This is due to differences in the participating companies,the survey methodologies, and/or the judgments of the analysts providing thedata as to how their organizations’ sales roles map into the survey-defined roles.
‘‘When a survey says we are paying below the market rate, our sales forceenthusiastically believes the data. When a survey says we’re paying abovemarket rate, suddenly the sales force insists the data is all wrong.’’
A compensation manager at a large firm
Some key questions to consider when determining which survey is best for aparticular firm include the following:
• What types of data are collected, and how are the data reported? Is thelevel of detail provided (for example, the breakdowns by industry, com-
PAGE 121................. 15869$ $CH4 05-19-06 09:22:50 PS
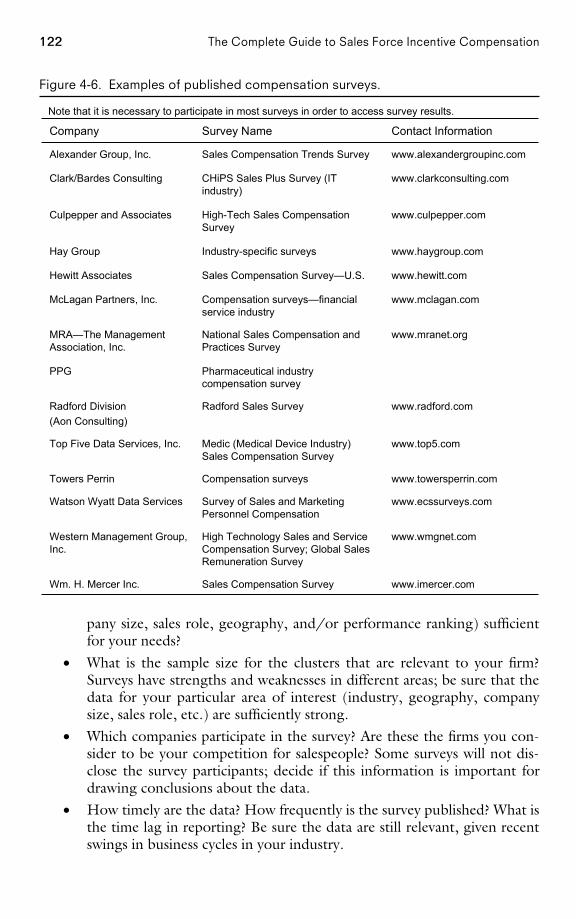
122 The Complete Guide to Sales Force Incentive Compensation
Figure 4-6. Examples of published compensation surveys.
www.imercer.comSales Compensation SurveyWm. H. Mercer Inc.
www.wmgnet.comHigh Technology Sales and ServiceCompensation Survey; Global SalesRemuneration Survey
Western Management Group,Inc.
www.ecssurveys.comSurvey of Sales and MarketingPersonnel Compensation
Watson Wyatt Data Services
www.towersperrin.comCompensation surveysTowers Perrin
www.top5.comMedic (Medical Device Industry)Sales Compensation Survey
Top Five Data Services, Inc.
www.radford.comRadford Sales SurveyRadford Division(Aon Consulting)
Pharmaceutical industrycompensation survey
PPG
www.mranet.orgNational Sales Compensation andPractices Survey
MRA—The ManagementAssociation, Inc.
www.mclagan.comCompensation surveys—financialservice industry
McLagan Partners, Inc.
www.hewitt.comSales Compensation Survey—U.S.Hewitt Associates
www.haygroup.comIndustry-specific surveysHay Group
www.culpepper.comHigh-Tech Sales CompensationSurvey
Culpepper and Associates
www.clarkconsulting.comCHiPS Sales Plus Survey (ITindustry)
Clark/Bardes Consulting
www.alexandergroupinc.comSales Compensation Trends SurveyAlexander Group, Inc.
Contact InformationSurvey NameCompany
Note that it is necessary to participate in most surveys in order to access survey results.
pany size, sales role, geography, and/or performance ranking) sufficientfor your needs?
• What is the sample size for the clusters that are relevant to your firm?Surveys have strengths and weaknesses in different areas; be sure that thedata for your particular area of interest (industry, geography, companysize, sales role, etc.) are sufficiently strong.
• Which companies participate in the survey? Are these the firms you con-sider to be your competition for salespeople? Some surveys will not dis-close the survey participants; decide if this information is important fordrawing conclusions about the data.
• How timely are the data? How frequently is the survey published? What isthe time lag in reporting? Be sure the data are still relevant, given recentswings in business cycles in your industry.
PAGE 122................. 15869$ $CH4 05-19-06 09:22:51 PS
123Plan Design Part 1: Determining the Correct Pay Level
• Is the survey well documented?
• What is the cost of the data?
• Are the delivery format choices compatible with your needs? Most surveysare available in multiple formats, such as hard copy, PDF, Excel spread-sheet, and online access.
Many companies find that the information obtained through published mar-ket surveys provides a reasonable benchmark for the majority of sales positions.However, some management teams are uncomfortable with published survey databecause of the data’s age or relevance to the firm’s specific situation. For example,the results of a published survey may be too broad in terms of the types of compa-nies or kinds of sales roles included in a single survey category. Many consultingfirms are willing to design and conduct custom compensation surveys that providea company with very timely, verifiable, and specifically relevant data. However,conducting a custom survey can be quite costly, time-consuming, and resource-intensive. An alternative between the extremes of purchasing a published surveyand contracting for a custom survey is to work with a consulting firm that main-tains a compensation database that includes many firms in the industry of interest.A selective extraction of companies from this database can provide a semicustom-ized benchmark at less cost and in less time than a custom survey conducted fromscratch.
Information about competitive pay levels can also be gathered through re-cruiting and exit interviews. Job candidates who either accept or reject the firm’semployment offer can share evidence of how they are valued by the market—particularly if they are choosing among multiple job offers. Recruiting firms canshare labor market insights gathered from their direct experience with companiesand potential recruits. New hires can provide information about the pay practicesof their former employer. Similarly, exit interviews with salespeople leaving forother jobs can provide insight into how the firm’s salespeople are valued exter-nally. Exiting employees are often more candid in an exit interview with a thirdparty who provides anonymous feedback to the company; they may be reluctantto taint their employment record by making unfavorable comments in an exitinterview with the firm’s human resource department.
Most firms use recruiting and exit interviews as a secondary source of pay levelinformation to reinforce and verify more formally gathered benchmarking data.While recruiting and exit interviews can provide valuable insights, data gatheredfrom these sources often lack the completeness and detail necessary for drawingdefinite conclusions.
Who Pays Below Industry Average?
We have yet to meet a sales management team that was willing to statethat its company’s goal is to pay the sales force below the industry aver-age. Practically every company claims to have a pay level at least in the
PAGE 123................. 15869$ $CH4 05-19-06 09:22:51 PS
124 The Complete Guide to Sales Force Incentive Compensation
top half of its industry, with the vast majority of companies claiming tobe in the top third of their industry. Of course, many of these claims aremisleading. It is not easy for management to tell a sales force that thecompany’s strategy is to pay in the lower half or lower quartile within theindustry. Thus companies often select their peer group of companies care-fully to create a benchmark to which their pay level compares favorably.
Perhaps this tendency to select a favorable peer group when comparingpay levels helps explain why CEO pay has escalated so dramatically inrecent years. In 1992, CEOs were paid 82 times the average of blue-collarworkers; in 2004, they were paid more than 400 times that average. Arecent study at Stanford University found that CEO pay levels are unre-lated to performance. Perhaps CEOs benchmark their pay against otherCEOs who make more money than they do, and then use this informationto demand greater pay.
Compare the Pay of the Company’s Best Performers with Thatof the Best Performers in the Industry
A meaningful way to benchmark total pay level against the industry is tocompare by performance level. For example, even if a firm pays below theindustry average overall, its top performers can still be among the top earn-ers in the industry. If poor performers earn only as much as the bottomquintile, they may be encouraged to look for a job elsewhere. Many firmsthat cannot afford to pay their entire sales force the market rate will stillpay their star performers very well in order to attract and retain them.
A Biotechnology Firm’s Hiring Strategy Influences Sales ForcePay Levels
When a biotechnology company was ready to launch its first product, themanagement team wanted to hire only the best pharmaceutical sales-people for its sales force quickly. The company’s profile of an ideal candi-date was a pharmaceutical salesperson with five or more years of experience,a life science degree, in-depth territory knowledge, and documented per-formance in his current position in the top 20 percent. Average target payfor a pharmaceutical salesperson was $60,000 to $70,000 a year in salaryplus $25,000 to $40,000 in variable pay and limited stock options. In orderto attract the best talent in the industry, new hires at the biotechnologyfirm were offered $100,000 a year in salary to start, $35,000 minimumvariable pay with an uncapped maximum, and generous stock options.
Market Sales Force Pay Levels May Be Internally Inconsistentwith Pay Levels in Other Company Departments
The need to offer salespeople a pay level that is competitive with the indus-try sometimes leads to internal parity problems. For example, an average
PAGE 124................. 15869$ $CH4 05-19-06 09:22:52 PS
125Plan Design Part 1: Determining the Correct Pay Level
salesperson may earn more than a product manager or sales manager atthe same company. While not inherently a problem, this can lead to lessdesire for lateral career moves, which in turn leads to cultural isolation forthe sales organization within the company.
Company Influences on Pay Levels
Information about external market pay levels should always be balanced with aview toward the company’s internal compensation standards. An internal assess-ment of the value that the sales job creates for the firm helps in fine-tuning marketpay rates. Additional internal influences on the pay level decision include historicalcompany pay trends and budgets. These internal checks help to ensure that salesforce pay levels are affordable, realistic, and appropriate. Internal checks also en-courage fairness and consistency of pay levels across different sales roles within thefirm.
Job Value Assessment. Job value assessment is based on the belief that pay shouldbe linked to the total value that a job delivers to the organization. Job valueassessment answers the question, ‘‘What is the sales job worth to the firm?’’
There are many different job value assessment methodologies available. TheHay method, which was developed during the 1950s for valuing manufacturingjobs, is perhaps the best known of these techniques. The Hay method, like all jobvalue assessment techniques, uses factors that measure a job’s requirements forskill, effort, and responsibility. Job characteristics are organized into three clusters:
1. Inputs, or the knowledge, capabilities, and skills that a job requires2. Throughputs, or the problem-solving competencies needed to be effective
at the job3. Outputs, or the results that the job produces
In addition, working conditions, such as the physical environment and haz-ards, physical effort required, and mental concentration demands, are taken intoaccount. Analysis of all of these job characteristics leads to an assessment of thetotal value that the job creates for the organization, which is translated into anappropriate pay level.
Many companies use job value assessment to price different roles across vari-ous departments of the company—not just sales roles. This can help to ensurethat sales force pay is fair and consistent with pay in other departments and withcompanywide values. This is particularly important if career progression involvesmovement between departments. For example, a salesperson with managementaspirations might benefit from working in an internal position in the marketingdepartment before getting promoted. Yet if salespeople are paid significantly morethan marketing people at a comparable level, few salespeople will be willing tomove to marketing and take a pay cut.
PAGE 125................. 15869$ $CH4 05-19-06 09:22:53 PS
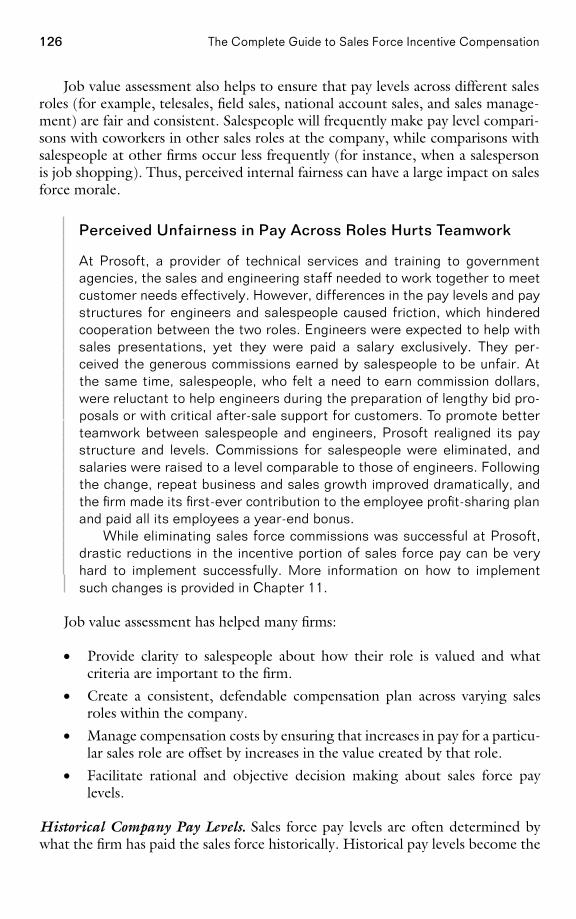
126 The Complete Guide to Sales Force Incentive Compensation
Job value assessment also helps to ensure that pay levels across different salesroles (for example, telesales, field sales, national account sales, and sales manage-ment) are fair and consistent. Salespeople will frequently make pay level compari-sons with coworkers in other sales roles at the company, while comparisons withsalespeople at other firms occur less frequently (for instance, when a salespersonis job shopping). Thus, perceived internal fairness can have a large impact on salesforce morale.
Perceived Unfairness in Pay Across Roles Hurts Teamwork
At Prosoft, a provider of technical services and training to governmentagencies, the sales and engineering staff needed to work together to meetcustomer needs effectively. However, differences in the pay levels and paystructures for engineers and salespeople caused friction, which hinderedcooperation between the two roles. Engineers were expected to help withsales presentations, yet they were paid a salary exclusively. They per-ceived the generous commissions earned by salespeople to be unfair. Atthe same time, salespeople, who felt a need to earn commission dollars,were reluctant to help engineers during the preparation of lengthy bid pro-posals or with critical after-sale support for customers. To promote betterteamwork between salespeople and engineers, Prosoft realigned its paystructure and levels. Commissions for salespeople were eliminated, andsalaries were raised to a level comparable to those of engineers. Followingthe change, repeat business and sales growth improved dramatically, andthe firm made its first-ever contribution to the employee profit-sharing planand paid all its employees a year-end bonus.
While eliminating sales force commissions was successful at Prosoft,drastic reductions in the incentive portion of sales force pay can be veryhard to implement successfully. More information on how to implementsuch changes is provided in Chapter 11.
Job value assessment has helped many firms:
• Provide clarity to salespeople about how their role is valued and whatcriteria are important to the firm.
• Create a consistent, defendable compensation plan across varying salesroles within the company.
• Manage compensation costs by ensuring that increases in pay for a particu-lar sales role are offset by increases in the value created by that role.
• Facilitate rational and objective decision making about sales force paylevels.
Historical Company Pay Levels. Sales force pay levels are often determined bywhat the firm has paid the sales force historically. Historical pay levels become the
PAGE 126................. 15869$ $CH4 05-19-06 09:22:53 PS
127Plan Design Part 1: Determining the Correct Pay Level
norm for corporate management, for financial planning, and for the salespeople.The pay history provides a benchmark for future pay. Companies try not to devi-ate significantly from the established norm: ‘‘It worked, didn’t it?’’ A poor prece-dent can be established if variable pay or salary increases rapidly. The annualincrease can become an expectation. A sales force that sees its pay escalate as thecompany and most of its salespeople exceed goal for several years in a row getsused to ‘‘being in the money.’’ Such a sales force can become quite demotivatedwhen growth slows or goals become more realistic and pay begins to moderate.Similarly, if the sales force has received a 5 percent pay increase in each of the lastfive years, there will be widespread disappointment if this year’s increase is lessthan 5 percent. Very often companies get into trouble when historical pay in-creases become an expectation among salespeople. Many companies find thatsome random variation in pay increases can actually improve sales force motivationand diminish salespeople’s feelings of entitlement.
Management at a Medical Device Firm Learns a Lesson: ThinkAbout Tomorrow When Setting Today’s Pay Levels
A start-up firm developed a revolutionary new cardiac medical device in theearly 1990s. The firm’s 50 salespeople were paid a 4 percent commissionon sales. In the first year after launch, salespeople made $100,000 to$150,000. As the use of the new device caught on across the medical com-munity, sales grew dramatically. Five years after launch, salespeople wereearning an average of $650,000. Since the company was incredibly profit-able and didn’t want to risk any decline in sales force morale, managementdecided that it should continue to ‘‘share the wealth’’ with the sales force.This caused some resentment among employees working in internal depart-ments, such as marketing and research and development, who felt that itwas unfair for the sales force to be rewarded so generously. In addition,competitors began to enter the market, cutting into company profits. It wasclear that given the new market conditions, the company could no longerafford its high sales force costs, yet changing the compensation plan wouldbe very disruptive and unpopular. The firm’s salespeople were in high de-mand by competitors, and many jumped ship to seek the next big payoff.According to a top sales executive at the firm, ‘‘A few years ago, I was busywalking around with a big smile on my face.’’ In 2004, the entire industryaveraged $250,000 target pay for a salesperson, which is high, but wellbelow the stratospheric levels of the mid-1990s.
Company Budget. Company profitability plays a role in determining sales forcepay levels. In general, profitable companies that focus on growth are willing topay more than unprofitable, stagnant, or cost-conscious companies. A companywith weak products may need to pay less than the industry norm because it simplycannot afford to pay more. A firm with high sales per territory and high product
PAGE 127................. 15869$ $CH4 05-19-06 09:22:54 PS
128 The Complete Guide to Sales Force Incentive Compensation
margins can afford to pay more than a firm with low sales per territory and lowproduct margins.
Most firms budget their sales force costs to ensure that company sales forceexpenditures are consistent with the achievement of corporate profit goals. Thecompany budget dictates how much a firm can afford to pay its sales force. Topmanagement typically takes a keen interest in the sales force budget because of itshigh cost. Many companies view their sales forces as an expensive way to connectwith their customers. Consequently, they watch the sales expense line. Most ofthe costs associated with sales forces are listed in Figure 4-7. Sales compensationcosts are typically the largest component of the total sales force expense.
Many companies manage sales force costs to a percentage of sales. The U.S.average is approximately 6.8 percent, although many industries spend 10 to 20percent or more of sales on the sales force. Maintaining a sales force cost-to-salesratio that is within historically established company and industry norms is oftenimportant to top financial management and shareholders, who want assurancethat the firm’s costs are under control. Industry benchmarks for sales force cost-to-sales ratios are available through some of the benchmarking data sources dis-cussed earlier in this chapter.
Figure 4-7. Sales force costs.
Compensation costs. Salaries, commissions, bonuses, FICA/FUTA, state and miscellaneoustaxes, insurance and retirement benefits, Medicare, benefit maintenance, reporting, andcompliance
Recruiting and hiring costs. Advertisements, recruiting fees, testing, reference checking,background checks, interview time, interview travel, training, employee relocation expense,legal expense for contracts
Government requirement costs. State and local taxes and laws, workers’ comp, licenses,required forms and filings
On-the-job costs. Travel and entertainment; auto expense; cell phone, laptop, and PDAexpenses; customer promos; recurrent training; product training; accounting expense; duesand subscriptions; legal expense for HR responsibilities
Facilities costs. Rent, furniture and fixtures, computers and software, communicationssystems, administrative support, postage, office supplies, utilities, maintenance, businessinsurance
Marketing costs. Account forecasting, market share data, competitive awareness, salesmeetings, product marketing materials
Account investment costs. Opening new markets and customers, new product developmentand introduction, routine distributor and customer training, interest on investment dollars
Sales support costs. Customer data, performance measurement, CRM systems
Source: Adapted from Manufacturers’ Representatives Educational Research Foundation web site, www.mrerf.org.
PAGE 128................. 15869$ $CH4 05-19-06 09:22:55 PS
129Plan Design Part 1: Determining the Correct Pay Level
A firm’s total sales compensation costs are a function of both the size of thesales force and the pay level of each salesperson. Thus the pay level decision affectsthe number of salespeople a firm can afford. For example, a firm with a total salescompensation budget of $10 million can afford 100 salespeople making $100,000each. Alternatively, if the firm pays $90,000 each, it can afford 11 additional sales-people. The decision to have a larger sales force with lower pay versus a smallersales force with higher pay has significant implications for sales force recruiting. Ifthe firm pays more, a larger pool of candidates will want the sales job, and therecruiting challenge will be to identify, attract, and retain the best of these candi-dates—candidates who are more talented and can generate higher sales than thosein the pool at the $90,000 pay level. If the firm is successful in finding and retain-ing these more talented salespeople, the higher-pay strategy may pay off—asmaller but more talented sales force often can generate higher sales. If the firm isnot successful in finding these best candidates, however, it may end up paying anextra $10,000 to salespeople who are no better than those willing to work for just$90,000. In this case, the firm is better off saving its money or spending the extra$10,000 per salesperson to hire additional salespeople, provided there is enoughpotential incremental business to support the additional people and a largeenough pool of good potential salesperson candidates. The trade-off becomes oneof quality versus coverage.
The Sales Force Is an Investment
Companies that focus excessively on cost containment and maintainingsales force cost-to-sales ratios tend to undersize and underpay their salesforces. While the sales force is a major expense, it is also a major producerof revenues. A larger, well-paid sales force creates more sales than asmaller, low-paid sales force. A motivated sales force creates more salesthan an unmotivated one. Cost containment is not the same thing as profitmaximization. A management team that views salespeople as a cost ratherthan an investment is likely to undersize and underpay its sales force.
Company Culture and Philosophy. Company culture and philosophy also play animportant role in shaping sales force pay levels. Many firms have a stated corporatecompensation philosophy that dictates how generously they will pay to attract andretain employees and top performers for all positions—for example, ‘‘we want tobe in the top third of the industry’’ or ‘‘we will pay in the top quintile to attractand retain top performers.’’ At the other end of the spectrum, ‘‘cheap’’ culturescan be found in sales forces run by frugal corporate leaders who are reluctant topart with their dollars.
Some firms will need to pay more than others in the industry in order toattract the best salespeople. Others can offer total pay that is competitive withinthe industry and attract top talent by providing other benefits, such as a favorableworking environment or significant opportunity for advancement. Figure 4-8 il-lustrates many of the factors, in addition to pay, that often attract salespeople to a
PAGE 129................. 15869$ $CH4 05-19-06 09:22:56 PS
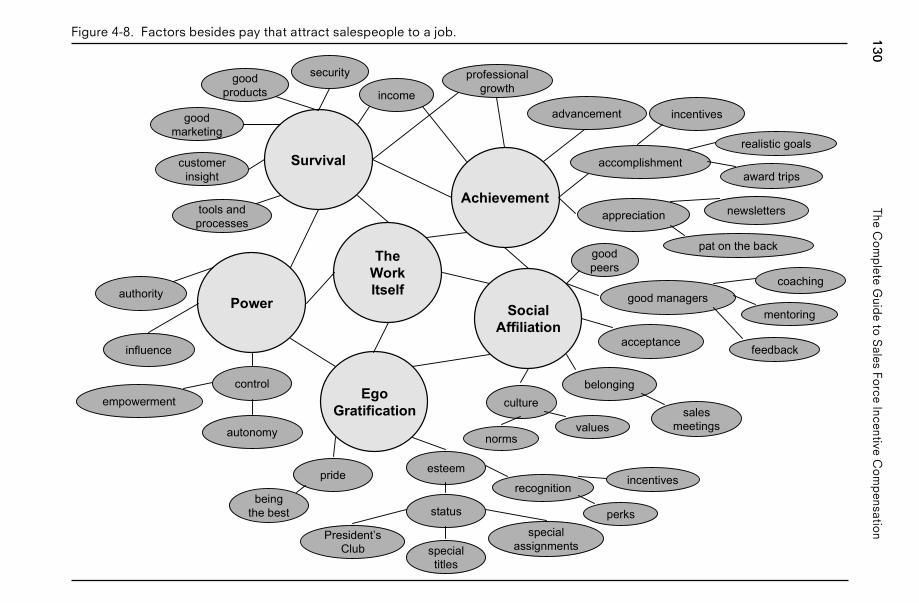
130The
Co
mp
leteG
uide
toS
alesFo
rceIncentive
Co
mp
ensation
Figure 4-8. Factors besides pay that attract salespeople to a job.
Power
Survival
TheWorkItself
SocialAffiliation
EgoGratification
Achievement
goodmarketing
customerinsight
professionalgrowthincome
securitygoodproducts
tools andprocesses
advancement
accomplishment
appreciation
goodpeers
good managers
acceptance
belongingculture
incentives
realistic goals
award trips
newsletters
pat on the back
coaching
mentoring
feedback
salesmeetingsvalues
norms
esteem
recognition
perks
incentives
status
specialtitles
President’sClub
pride
beingthe best
control
autonomy
empowerment
influence
authority
specialassignmentsP
AG
E130
.................15869$$C
H4
05-19-0609:22:57
PS
131Plan Design Part 1: Determining the Correct Pay Level
job. A company with a culture that does not emphasize many of these nonpayfactors will need to pay more to attract top salespeople.
Sales Force Turnover Statistics and Pay Levels
Since salespeople stay in their jobs for many reasons besides money, paylevel decisions are only one influence on the firm’s ability to attract andretain talented salespeople. Sales force turnover statistics are an impor-tant input to the pay level decision. If turnover is at an acceptable level,then perhaps the current pay level is appropriate, even if it is below themarket rate. Other elements that the company offers must be helping toretain people. If turnover is higher than desired, then possibly the pay levelis too low, even if it is above the market rate. If undesired turnover ofstrong performers is high, then perhaps the top salespeople are not beingpaid enough. If desirable turnover of underperforming salespeople is lessthan planned, then possibly poor performers are being paid too much.
Desirable Companies Have Strong Positive Cultures
When HR Magazine compiled its 2004 list of the best small- and medium-sized companies to work for, competitive pay and benefits were only oneconsideration. Perhaps the most important element shared by all compa-nies on the list was a strong positive culture. Some common attributes ofsuch a culture include:
• Management is responsive to employee needs.
• Management maintains good communication with employees.
• Management values employee input.
• Management values employee training and development.
• Employees feel respected and appreciated, and are treated as equals.
• Employees are empowered to make decisions.
• Employees are encouraged to pursue their professional passions.
• Employees actively participate in the operation of the business.
PNCBank Uses Company Culture to Attract and Retain GoodEmployees
PNCBank (www.pncbank.com) considers its culture to be a source of com-petitive advantage for attracting highly effective employees. The firm hasa web page devoted to the importance of attracting and retaining goodstaff that highlights the ingredients of its successful culture, including:
PAGE 131................. 15869$ $CH4 05-19-06 09:22:57 PS
132 The Complete Guide to Sales Force Incentive Compensation
1. An effective initiation process for new employees, including recruit-ment and orientation. According to the web page, ‘‘Interviewers needto be able to simultaneously pick out prospective employees who willfit in with the company, and sell these individuals on the company.’’Once the candidate is hired, an effective orientation program allowsnew hires ‘‘to quickly determine that they ’fit in’ and can make a contri-bution.’’ The firm puts a premium on training, stating that ‘‘the righttraining program will help the new employee ’bond’ with the companyand colleagues.’’
2. Two-way, ongoing communication. Everyone in the company ‘‘shouldunderstand that they have the opportunity to speak out and that thecompany is talking back to them . . . there should be outlets in the formof company meetings, open-door approaches by top executives, andmore formal techniques like newsletters.’’
3. An atmosphere of teamwork and appreciation. ‘‘Aside from obviousrecognition like salary and benefits, companies need to focus on theless obvious attractions to employees,’’ asserts PNC. These includeincentives that inspire interdepartmental cooperation, recognition re-wards, and sometimes ‘‘just a note or expression of thanks from thecompany president.’’
Company Influences on Pay Variation
Compensation experts occasionally suggest an ideal pay variation standard for allsales forces: Top performers should earn three times the target variable pay level.We disagree with the view that a standard variation is appropriate for all situations.External market factors drive the sales force pay variation decision to a large ex-tent; there is a market price that a firm must pay if it hopes to be successful inattracting and retaining top performers. In addition to market drivers, severalinternal factors influence sales force pay variation. These internal factors includedifferences in individual performance across salespeople, variation in salespersontenure, the number of job levels within the sales force, and sales force culture andvalues.
Differences in Individual Performance. Significant differences in pay acrosssalespeople are most appropriate when these differences are warranted by largevariations in performance. Sales leaders often desire a compensation plan that‘‘pays for performance,’’ one that rewards salespeople in proportion to the valuethey create. For example, Figure 4-9 illustrates pay variation across salespeople attwo different firms. Total pay for salespeople at Firm A varies from $20,000 up to$80,000. The range of total pay for salespeople at Firm B is much smaller, rangingfrom $37,000 up to $64,000.
If Firm A’s compensation plan truly pays for performance, then the top-performing salesperson creates four times the value and receives four times the
PAGE 132................. 15869$ $CH4 05-19-06 09:22:58 PS
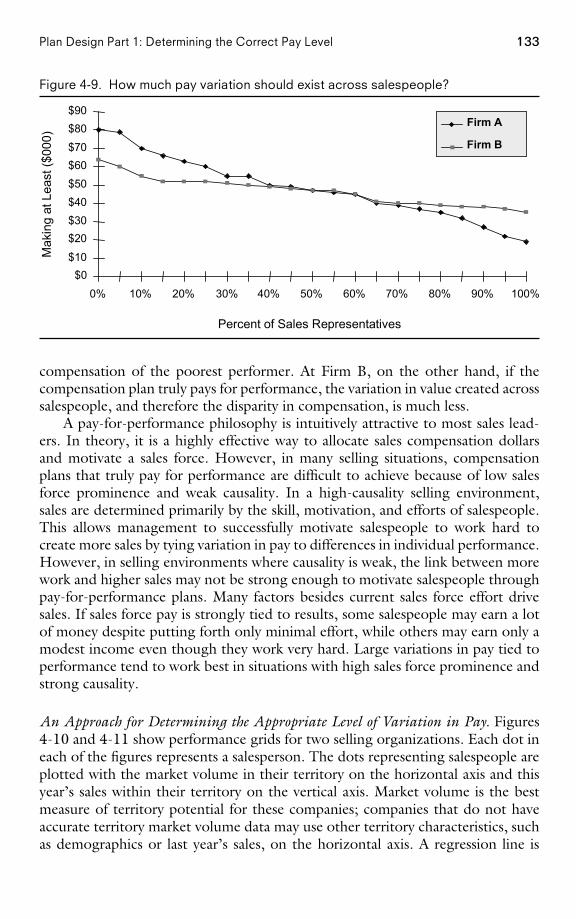
133Plan Design Part 1: Determining the Correct Pay Level
Figure 4-9. How much pay variation should exist across salespeople?
$0$10
$20$30$40$50$60$70
$80$90
0% 10% 20% 30% 40% 50% 60% 70% 80% 90% 100%
Percent of Sales Representatives
Mak
ing
at L
east
($00
0)
Firm A
Firm B
compensation of the poorest performer. At Firm B, on the other hand, if thecompensation plan truly pays for performance, the variation in value created acrosssalespeople, and therefore the disparity in compensation, is much less.
A pay-for-performance philosophy is intuitively attractive to most sales lead-ers. In theory, it is a highly effective way to allocate sales compensation dollarsand motivate a sales force. However, in many selling situations, compensationplans that truly pay for performance are difficult to achieve because of low salesforce prominence and weak causality. In a high-causality selling environment,sales are determined primarily by the skill, motivation, and efforts of salespeople.This allows management to successfully motivate salespeople to work hard tocreate more sales by tying variation in pay to differences in individual performance.However, in selling environments where causality is weak, the link between morework and higher sales may not be strong enough to motivate salespeople throughpay-for-performance plans. Many factors besides current sales force effort drivesales. If sales force pay is strongly tied to results, some salespeople may earn a lotof money despite putting forth only minimal effort, while others may earn only amodest income even though they work very hard. Large variations in pay tied toperformance tend to work best in situations with high sales force prominence andstrong causality.
An Approach for Determining the Appropriate Level of Variation in Pay. Figures4-10 and 4-11 show performance grids for two selling organizations. Each dot ineach of the figures represents a salesperson. The dots representing salespeople areplotted with the market volume in their territory on the horizontal axis and thisyear’s sales within their territory on the vertical axis. Market volume is the bestmeasure of territory potential for these companies; companies that do not haveaccurate territory market volume data may use other territory characteristics, suchas demographics or last year’s sales, on the horizontal axis. A regression line is
PAGE 133................. 15869$ $CH4 05-19-06 09:22:59 PS
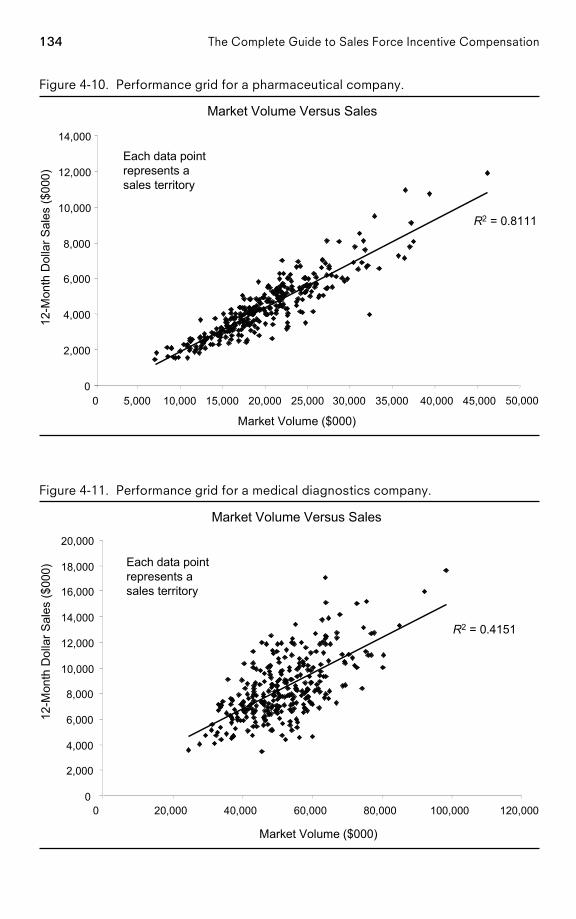
134 The Complete Guide to Sales Force Incentive Compensation
Figure 4-10. Performance grid for a pharmaceutical company.
Market Volume Versus Sales
0 5,000 10,000 15,000 20,000 25,000 30,000 35,000 40,000 45,000 50,000
Market Volume ($000)
0
2,000
4,000
6,000
8,000
10,000
12,000
14,000
12-M
onth
Dol
lar S
ales
($00
0)
Each data pointrepresents asales territory
R2 = 0.8111
Figure 4-11. Performance grid for a medical diagnostics company.
Market Volume Versus Sales
0 20,000 40,000 60,000 80,000 100,000 120,000
Market Volume ($000)
0
2,000
4,000
6,000
8,000
10,000
12,000
14,000
16,000
18,000
20,000
12-M
onth
Dol
lar S
ales
($00
0)
R2 = 0.4151
Each data pointrepresents asales territory
PAGE 134................. 15869$ $CH4 05-19-06 09:23:01 PS
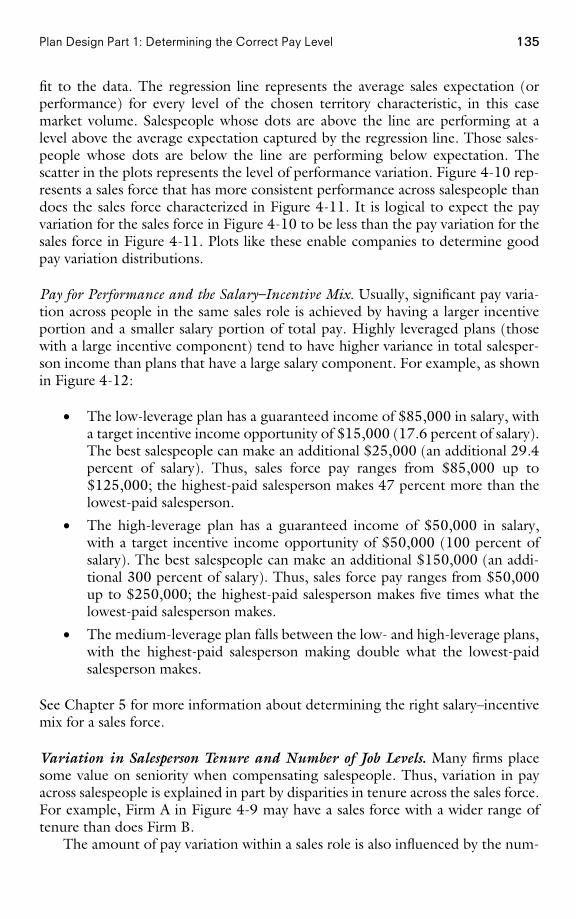
135Plan Design Part 1: Determining the Correct Pay Level
fit to the data. The regression line represents the average sales expectation (orperformance) for every level of the chosen territory characteristic, in this casemarket volume. Salespeople whose dots are above the line are performing at alevel above the average expectation captured by the regression line. Those sales-people whose dots are below the line are performing below expectation. Thescatter in the plots represents the level of performance variation. Figure 4-10 rep-resents a sales force that has more consistent performance across salespeople thandoes the sales force characterized in Figure 4-11. It is logical to expect the payvariation for the sales force in Figure 4-10 to be less than the pay variation for thesales force in Figure 4-11. Plots like these enable companies to determine goodpay variation distributions.
Pay for Performance and the Salary–Incentive Mix. Usually, significant pay varia-tion across people in the same sales role is achieved by having a larger incentiveportion and a smaller salary portion of total pay. Highly leveraged plans (thosewith a large incentive component) tend to have higher variance in total salesper-son income than plans that have a large salary component. For example, as shownin Figure 4-12:
• The low-leverage plan has a guaranteed income of $85,000 in salary, witha target incentive income opportunity of $15,000 (17.6 percent of salary).The best salespeople can make an additional $25,000 (an additional 29.4percent of salary). Thus, sales force pay ranges from $85,000 up to$125,000; the highest-paid salesperson makes 47 percent more than thelowest-paid salesperson.
• The high-leverage plan has a guaranteed income of $50,000 in salary,with a target incentive income opportunity of $50,000 (100 percent ofsalary). The best salespeople can make an additional $150,000 (an addi-tional 300 percent of salary). Thus, sales force pay ranges from $50,000up to $250,000; the highest-paid salesperson makes five times what thelowest-paid salesperson makes.
• The medium-leverage plan falls between the low- and high-leverage plans,with the highest-paid salesperson making double what the lowest-paidsalesperson makes.
See Chapter 5 for more information about determining the right salary–incentivemix for a sales force.
Variation in Salesperson Tenure and Number of Job Levels. Many firms placesome value on seniority when compensating salespeople. Thus, variation in payacross salespeople is explained in part by disparities in tenure across the sales force.For example, Firm A in Figure 4-9 may have a sales force with a wider range oftenure than does Firm B.
The amount of pay variation within a sales role is also influenced by the num-
PAGE 135................. 15869$ $CH4 05-19-06 09:23:01 PS
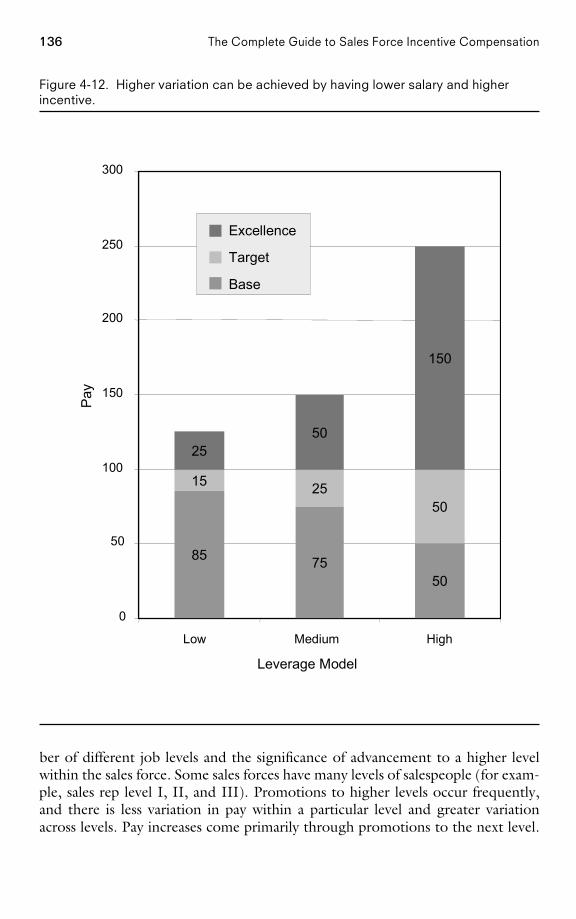
136 The Complete Guide to Sales Force Incentive Compensation
Figure 4-12. Higher variation can be achieved by having lower salary and higherincentive.
85 7550
15 2550
2550
150
0
50
100
150
200
250
300
Low Medium High
Leverage Model
Pay
Excellence
Target
Base
ber of different job levels and the significance of advancement to a higher levelwithin the sales force. Some sales forces have many levels of salespeople (for exam-ple, sales rep level I, II, and III). Promotions to higher levels occur frequently,and there is less variation in pay within a particular level and greater variationacross levels. Pay increases come primarily through promotions to the next level.
PAGE 136................. 15869$ $CH4 05-19-06 09:23:02 PS
137Plan Design Part 1: Determining the Correct Pay Level
In other sales forces, there are fewer levels, and promotions occur less frequently.As a result, more variation is needed within each level.
Sales Force Culture and Values. Sales force culture and values also play a role indetermining the degree of pay variation that is appropriate within a sales force.For instance:
• Sales forces composed of salespeople who are highly motivated by non-monetary factors such as career advancement, learning, or socializationtend to have less variation in pay across salespeople than those that consistof salespeople for whom money is a primary motivator.
• A sales force that encourages teamwork and cooperation among sales-people will want less variation in pay across salespeople than one that de-sires competition among salespeople to inspire individual success.
• A sales force that emphasizes personal development or encourages othernonselling activities will want less variation in total pay than one that em-phasizes output and results.
• A management team with little tolerance for sales force turnover will wantless variation in total pay than one that expects and manages turnover. Allother things being equal, a greater variation in pay will result in higherturnover of both high and low performers. On the positive side, low per-formers will get the message that they are not succeeding, and they willleave the firm. On the negative side, however, the plan will attract highperformers who are more motivated by money, and therefore will be con-stantly in search of new opportunities for earning more money, includingmoving to a competitor.
Conclusion
Figure 4-13 summarizes various sales force role drivers, market drivers, and com-pany influences that help explain why some salespeople make more money thanothers.
Figure 4-14 summarizes the various sales role drivers, market drivers, andcompany influences that help explain the degree of pay variation across sales-people.
PAGE 137................. 15869$ $CH4 05-19-06 09:23:03 PS
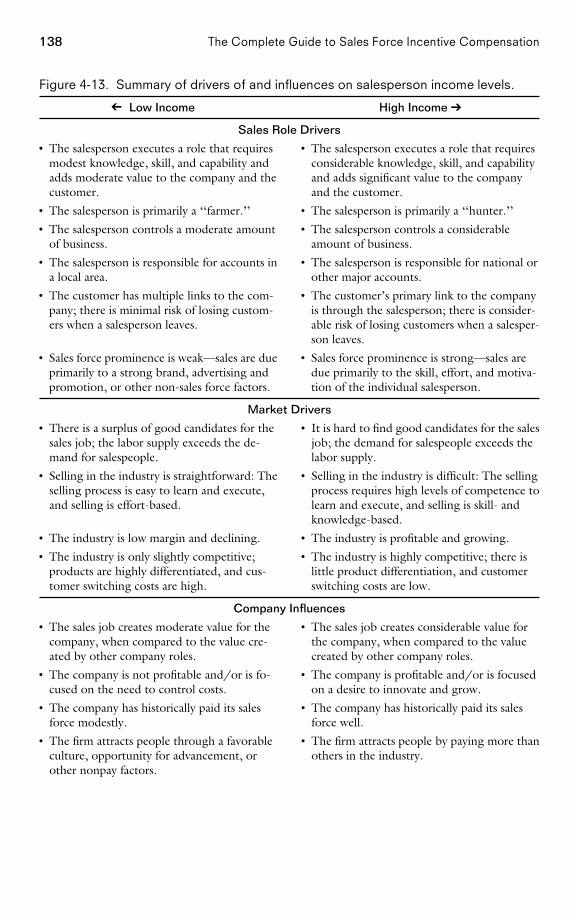
138 The Complete Guide to Sales Force Incentive Compensation
Figure 4-13. Summary of drivers of and influences on salesperson income levels.
➔
Low Income High Income ➔
Sales Role Drivers
• The salesperson executes a role that requires • The salesperson executes a role that requiresmodest knowledge, skill, and capability and considerable knowledge, skill, and capabilityadds moderate value to the company and the and adds significant value to the companycustomer. and the customer.
• The salesperson is primarily a ‘‘farmer.’’ • The salesperson is primarily a ‘‘hunter.’’
• The salesperson controls a moderate amount • The salesperson controls a considerableof business. amount of business.
• The salesperson is responsible for accounts in • The salesperson is responsible for national ora local area. other major accounts.
• The customer has multiple links to the com- • The customer’s primary link to the companypany; there is minimal risk of losing custom- is through the salesperson; there is consider-ers when a salesperson leaves. able risk of losing customers when a salesper-
son leaves.
• Sales force prominence is weak—sales are due • Sales force prominence is strong—sales areprimarily to a strong brand, advertising and due primarily to the skill, effort, and motiva-promotion, or other non-sales force factors. tion of the individual salesperson.
Market Drivers
• There is a surplus of good candidates for the • It is hard to find good candidates for the salessales job; the labor supply exceeds the de- job; the demand for salespeople exceeds themand for salespeople. labor supply.
• Selling in the industry is straightforward: The • Selling in the industry is difficult: The sellingselling process is easy to learn and execute, process requires high levels of competence toand selling is effort-based. learn and execute, and selling is skill- and
knowledge-based.
• The industry is low margin and declining. • The industry is profitable and growing.
• The industry is only slightly competitive; • The industry is highly competitive; there isproducts are highly differentiated, and cus- little product differentiation, and customertomer switching costs are high. switching costs are low.
Company Influences
• The sales job creates moderate value for the • The sales job creates considerable value forcompany, when compared to the value cre- the company, when compared to the valueated by other company roles. created by other company roles.
• The company is not profitable and/or is fo- • The company is profitable and/or is focusedcused on the need to control costs. on a desire to innovate and grow.
• The company has historically paid its sales • The company has historically paid its salesforce modestly. force well.
• The firm attracts people through a favorable • The firm attracts people by paying more thanculture, opportunity for advancement, or others in the industry.other nonpay factors.
PAGE 138................. 15869$ $CH4 05-19-06 09:23:03 PS
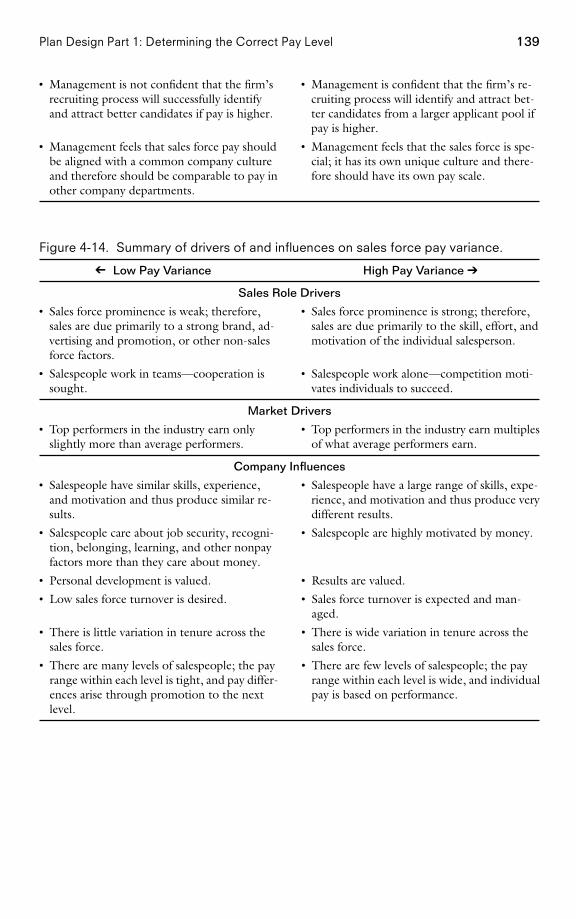
139Plan Design Part 1: Determining the Correct Pay Level
• Management is not confident that the firm’s • Management is confident that the firm’s re-recruiting process will successfully identify cruiting process will identify and attract bet-and attract better candidates if pay is higher. ter candidates from a larger applicant pool if
pay is higher.
• Management feels that sales force pay should • Management feels that the sales force is spe-be aligned with a common company culture cial; it has its own unique culture and there-and therefore should be comparable to pay in fore should have its own pay scale.other company departments.
Figure 4-14. Summary of drivers of and influences on sales force pay variance.
➔
Low Pay Variance High Pay Variance ➔
Sales Role Drivers
• Sales force prominence is weak; therefore, • Sales force prominence is strong; therefore,sales are due primarily to a strong brand, ad- sales are due primarily to the skill, effort, andvertising and promotion, or other non-sales motivation of the individual salesperson.force factors.
• Salespeople work in teams—cooperation is • Salespeople work alone—competition moti-sought. vates individuals to succeed.
Market Drivers
• Top performers in the industry earn only • Top performers in the industry earn multiplesslightly more than average performers. of what average performers earn.
Company Influences
• Salespeople have similar skills, experience, • Salespeople have a large range of skills, expe-and motivation and thus produce similar re- rience, and motivation and thus produce verysults. different results.
• Salespeople care about job security, recogni- • Salespeople are highly motivated by money.tion, belonging, learning, and other nonpayfactors more than they care about money.
• Personal development is valued. • Results are valued.
• Low sales force turnover is desired. • Sales force turnover is expected and man-aged.
• There is little variation in tenure across the • There is wide variation in tenure across thesales force. sales force.
• There are many levels of salespeople; the pay • There are few levels of salespeople; the payrange within each level is tight, and pay differ- range within each level is wide, and individualences arise through promotion to the next pay is based on performance.level.
PAGE 139................. 15869$ $CH4 05-19-06 09:23:04 PS
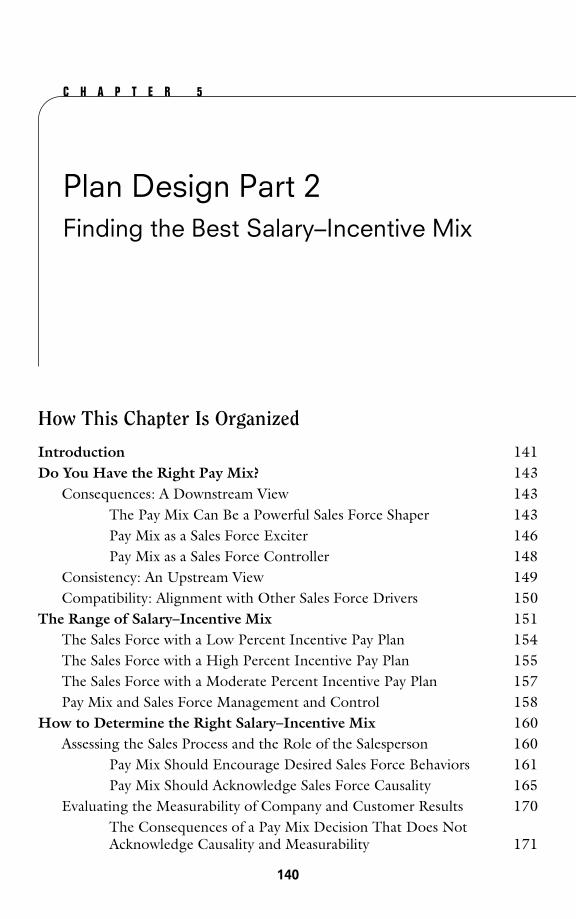
C H A P T E R 5
Plan Design Part 2Finding the Best Salary–Incentive Mix
How This Chapter Is Organized
Introduction 141Do You Have the Right Pay Mix? 143
Consequences: A Downstream View 143The Pay Mix Can Be a Powerful Sales Force Shaper 143Pay Mix as a Sales Force Exciter 146Pay Mix as a Sales Force Controller 148
Consistency: An Upstream View 149Compatibility: Alignment with Other Sales Force Drivers 150
The Range of Salary–Incentive Mix 151The Sales Force with a Low Percent Incentive Pay Plan 154The Sales Force with a High Percent Incentive Pay Plan 155The Sales Force with a Moderate Percent Incentive Pay Plan 157Pay Mix and Sales Force Management and Control 158
How to Determine the Right Salary–Incentive Mix 160Assessing the Sales Process and the Role of the Salesperson 160
Pay Mix Should Encourage Desired Sales Force Behaviors 161Pay Mix Should Acknowledge Sales Force Causality 165
Evaluating the Measurability of Company and Customer Results 170The Consequences of a Pay Mix Decision That Does NotAcknowledge Causality and Measurability 171
PAGE 140
140
................. 15869$ $CH5 05-19-06 09:22:52 PS
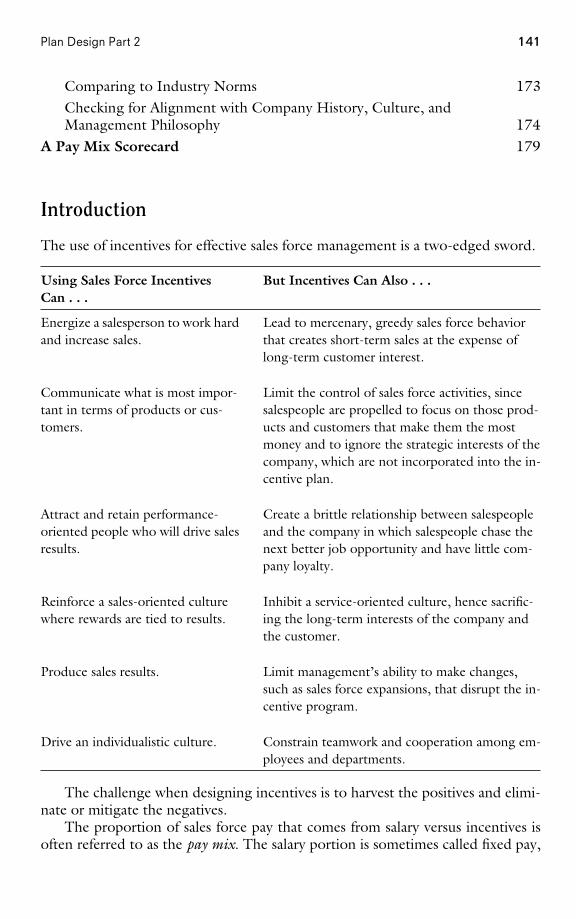
141Plan Design Part 2
Comparing to Industry Norms 173Checking for Alignment with Company History, Culture, andManagement Philosophy 174
A Pay Mix Scorecard 179
Introduction
The use of incentives for effective sales force management is a two-edged sword.
Using Sales Force Incentives But Incentives Can Also . . .Can . . .
Energize a salesperson to work hard Lead to mercenary, greedy sales force behaviorand increase sales. that creates short-term sales at the expense of
long-term customer interest.
Communicate what is most impor- Limit the control of sales force activities, sincetant in terms of products or cus- salespeople are propelled to focus on those prod-tomers. ucts and customers that make them the most
money and to ignore the strategic interests of thecompany, which are not incorporated into the in-centive plan.
Attract and retain performance- Create a brittle relationship between salespeopleoriented people who will drive sales and the company in which salespeople chase theresults. next better job opportunity and have little com-
pany loyalty.
Reinforce a sales-oriented culture Inhibit a service-oriented culture, hence sacrific-where rewards are tied to results. ing the long-term interests of the company and
the customer.
Produce sales results. Limit management’s ability to make changes,such as sales force expansions, that disrupt the in-centive program.
Drive an individualistic culture. Constrain teamwork and cooperation among em-ployees and departments.
The challenge when designing incentives is to harvest the positives and elimi-nate or mitigate the negatives.
The proportion of sales force pay that comes from salary versus incentives isoften referred to as the pay mix. The salary portion is sometimes called fixed pay,
PAGE 141................. 15869$ $CH5 05-19-06 09:22:52 PS
142 The Complete Guide to Sales Force Incentive Compensation
and the incentive portion is often referred to as variable pay. Pay mix is typicallyexpressed as the ratio of the percentage of cash compensation that comes fromsalary to the percentage that comes from incentives. For example, a sales forcethat receives 70 percent of its earnings through salary and 30 percent of its earn-ings through incentives at the expected or targeted performance level has a targetpay mix of 70/30. The actual pay mix will deviate from the target pay mix ifperformance is above or below expectations. Pay mix varies greatly across indus-tries, companies, and sales roles.
A Sales Environment Where Incentives Are a Large Proportionof the Pay Mix: Office Supplies
Joe sells office supplies to medium-sized businesses. Like many of his col-leagues, he is a seasoned sales veteran and has developed a large cus-tomer base. His number one priority is to close sales. Leads are generatedby the firm’s telemarketing group, and qualified leads are passed on to Joe(or another salesperson) for follow-up. Since Joe is a proven closer, hegets many new leads assigned to him. Once an account is given to Joe, he‘‘owns’’ the account, and no other salesperson can approach it. Joe visitspotential customers with a sales kit and a needs assessment questionnaire.He presents the firm’s products and services, describes the buying proc-ess, and provides a price estimate. He listens closely for closing signalsand attempts to take an order. If an order is placed, he gives the customera telephone number for a personal customer service representative whocan take future orders and handle all ongoing service issues. Joe checks inon the customer from time to time to discuss promoted products and tomake sure that the customer’s needs are being met. All of Joe’s earnings—100 percent—come from variable pay, based on a commission rate timesthe profit margin on his sales.
A Sales Environment Where Salary Is a Large Proportion of thePay Mix: Animal Laboratory Systems
Mary sells computerized, automated watering systems to animal labora-tories. These systems include many technical components, such as waterpurification and treatment processes, water distribution piping, and drink-ing valves that deliver water to animals automatically. The systems savecustomers time and labor and improve water quality. Solutions can be quitecomplex, are highly customized, and require a long sales process. Through-out this process, Mary works closely with animal laboratory managers (sheis a former animal lab manager herself), and also with veterinarians to en-sure that the system is designed to meet customer needs. Since many ofher sales come from new laboratory construction, Mary also works withbuilding contractors, often conducting the layout design of the watering
PAGE 142................. 15869$ $CH5 05-19-06 09:22:53 PS
143Plan Design Part 2
system at no cost. Sales visits with customers involve many nonselling ac-tivities, such as addressing equipment problems and learning about newbuilding plans. Maintaining good relationships with current customers isimportant to Mary, as most of her sales come through repeat business fromend users and referrals from building contractors. Mary is paid 100 percentfrom salary.
The firm’s selling process and the role of the sales force, combined with themeasurability of company and customer results, drive the pay mix decision. Inaddition, pay mix is influenced by industry norms and by the company’s history,culture, and management philosophy.
Do You Have the Right Pay Mix?
When diagnosing pay mix problems, sales leaders should look at the three viewswithin the sales management system framework. First, the downstream conse-quences of pay mix decisions need to be checked. Is the current mix appealing tothe salespeople the firm wants to attract and retain? Does the mix motivate theright activities that lead to appropriate treatment of customers and achievementof company financial results? Second, the upstream consistency of pay mix decisionsneeds to be assessed. Does the incentive mix reinforce the company’s marketingstrategy? Is it consistent with the firm’s go-to-market strategy, sales processes, andsales force roles? Third, pay mix decisions should be compatible with salespeople’sskills and capabilities, sales force culture, performance management systems, andnonmonetary sales force motivators.
Figures 5-1 and 5-2 provide a template for diagnosing whether the sales in-centive plan has the appropriate pay mix. Figure 5-1 lists examples of signs thatsuggest that the variable portion of sales force pay may be too large, while Figure5-2 lists examples of signs that suggest that the salary portion may be too large.
Consequences: A Downstream View
The pay mix decision affects which salespeople will be attracted to the firm, aswell as the motivation of salespeople, who carry out the sales force activities that inturn affect customer results and ultimately influence company results. The down-stream consequences of the pay mix decision can be understood by examining therole of pay mix as a shaper, exciter, and controller of the sales force.
The Pay Mix Can Be a Powerful Sales Force Shaper. ‘‘Our top performers ‘maxout’ and quit, while our low performers stay too long,’’ says the vice president ofsales at a building materials firm. ‘‘Our best personnel are being lured away by thecompetition,’’ says the director of human resources at a health-care company.
PAGE 143................. 15869$ $CH5 05-19-06 09:22:53 PS
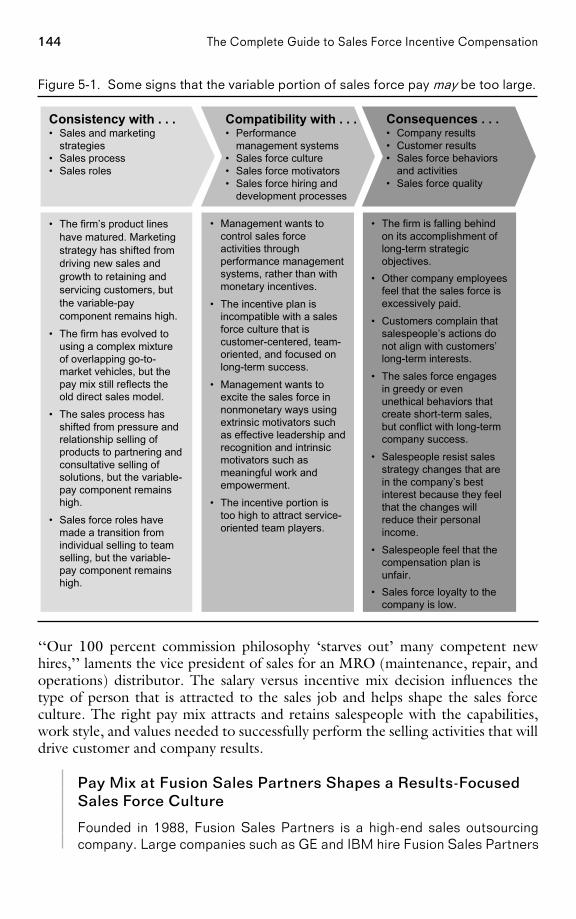
144 The Complete Guide to Sales Force Incentive Compensation
Figure 5-1. Some signs that the variable portion of sales force pay may be too large.
• The firm’s product lineshave matured. Marketingstrategy has shifted fromdriving new sales andgrowth to retaining andservicing customers, butthe variable-paycomponent remains high.
• The firm has evolved tousing a complex mixtureof overlapping go-to-market vehicles, but thepay mix still reflects theold direct sales model.
• The sales process hasshifted from pressure andrelationship selling ofproducts to partnering andconsultative selling ofsolutions, but the variable-pay component remainshigh.
• Sales force roles havemade a transition fromindividual selling to teamselling, but the variable-pay component remainshigh.
• Management wants tocontrol sales forceactivities throughperformance managementsystems, rather than withmonetary incentives.
• The incentive plan isincompatible with a salesforce culture that iscustomer-centered, team-oriented, and focused onlong-term success.
• Management wants toexcite the sales force innonmonetary ways usingextrinsic motivators suchas effective leadership andrecognition and intrinsicmotivators such asmeaningful work andempowerment.
• The incentive portion istoo high to attract service-oriented team players.
• The firm is falling behindon its accomplishment oflong-term strategicobjectives.
• Other company employeesfeel that the sales force isexcessively paid.
• Customers complain thatsalespeople’s actions donot align with customers’long-term interests.
• The sales force engagesin greedy or evenunethical behaviors thatcreate short-term sales,but conflict with long-termcompany success.
• Salespeople resist salesstrategy changes that arein the company’s bestinterest because they feelthat the changes willreduce their personalincome.
• Salespeople feel that thecompensation plan isunfair.
• Sales force loyalty to thecompany is low.
Compatibility with . . .• Performance
management systems• Sales force culture• Sales force motivators• Sales force hiring and
development processes
Consequences . . .• Company results• Customer results• Sales force behaviors
and activities• Sales force quality
Consistency with . . .• Sales and marketing
strategies• Sales process• Sales roles
‘‘Our 100 percent commission philosophy ‘starves out’ many competent newhires,’’ laments the vice president of sales for an MRO (maintenance, repair, andoperations) distributor. The salary versus incentive mix decision influences thetype of person that is attracted to the sales job and helps shape the sales forceculture. The right pay mix attracts and retains salespeople with the capabilities,work style, and values needed to successfully perform the selling activities that willdrive customer and company results.
Pay Mix at Fusion Sales Partners Shapes a Results-FocusedSales Force Culture
Founded in 1988, Fusion Sales Partners is a high-end sales outsourcingcompany. Large companies such as GE and IBM hire Fusion Sales Partners
PAGE 144................. 15869$ $CH5 05-19-06 09:22:54 PS
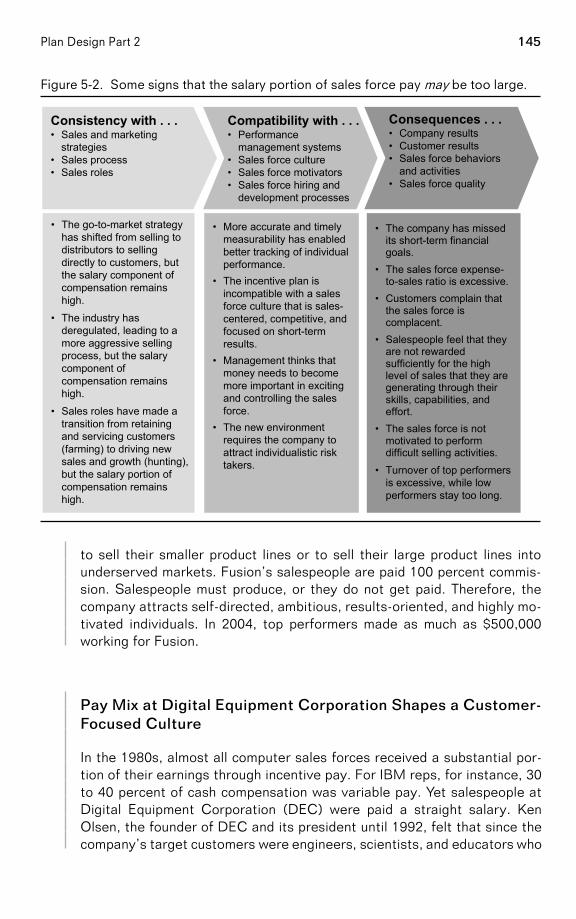
145Plan Design Part 2
Figure 5-2. Some signs that the salary portion of sales force pay may be too large.
• The go-to-market strategyhas shifted from selling todistributors to sellingdirectly to customers, butthe salary component ofcompensation remainshigh.
• The industry hasderegulated, leading to amore aggressive sellingprocess, but the salarycomponent ofcompensation remainshigh.
• Sales roles have made atransition from retainingand servicing customers(farming) to driving newsales and growth (hunting),but the salary portion ofcompensation remainshigh.
• More accurate and timelymeasurability has enabledbetter tracking of individualperformance.
• The incentive plan isincompatible with a salesforce culture that is sales-centered, competitive, andfocused on short-termresults.
• Management thinks thatmoney needs to becomemore important in excitingand controlling the salesforce.
• The new environmentrequires the company toattract individualistic risktakers.
• The company has missedits short-term financialgoals.
• The sales force expense-to-sales ratio is excessive.
• Customers complain thatthe sales force iscomplacent.
• Salespeople feel that theyare not rewardedsufficiently for the highlevel of sales that they aregenerating through theirskills, capabilities, andeffort.
• The sales force is notmotivated to performdifficult selling activities.
• Turnover of top performersis excessive, while lowperformers stay too long.
Compatibility with . . .• Performance
management systems• Sales force culture• Sales force motivators• Sales force hiring and
development processes
Consequences . . .• Company results• Customer results• Sales force behaviors
and activities• Sales force quality
Consistency with . . .• Sales and marketing
strategies• Sales process• Sales roles
to sell their smaller product lines or to sell their large product lines intounderserved markets. Fusion’s salespeople are paid 100 percent commis-sion. Salespeople must produce, or they do not get paid. Therefore, thecompany attracts self-directed, ambitious, results-oriented, and highly mo-tivated individuals. In 2004, top performers made as much as $500,000working for Fusion.
Pay Mix at Digital Equipment Corporation Shapes a Customer-Focused Culture
In the 1980s, almost all computer sales forces received a substantial por-tion of their earnings through incentive pay. For IBM reps, for instance, 30to 40 percent of cash compensation was variable pay. Yet salespeople atDigital Equipment Corporation (DEC) were paid a straight salary. KenOlsen, the founder of DEC and its president until 1992, felt that since thecompany’s target customers were engineers, scientists, and educators who
PAGE 145................. 15869$ $CH5 05-19-06 09:22:56 PS
146 The Complete Guide to Sales Force Incentive Compensation
knew what they wanted, engineers and problem solvers, rather than ag-gressive salespeople, would meet customer needs most effectively.
(See more in the example ‘‘Pay Mix Reinforces Diverse Sales Strate-gies and Cultures at DEC and IBM,’’ on p. 152.)
Pay Mix as a Sales Force Exciter. ‘‘We need a greater sense of urgency to prospectand close sales,’’ says the vice president and general manager at a medical instru-ments firm. ‘‘We want to increase the incentive to grow our business,’’ says amanager at a high-tech manufacturer. As an exciter, the salary–incentive mix deci-sion influences the degree to which the compensation plan inspires and motivatesthe sales force. In the right selling environment, high incentives encourage a salesforce to invest greater energy in the sales task in order to increase personal earn-ings
However, incentives will not create sales force excitement if the sales forceperceives them to be unfair. ‘‘We need to make pay more reflective of perform-ance; our sales force has no control over 30 to 40 percent of the accounts they arepaid on,’’ says a manager at an automotive company. ‘‘Our current system isdemotivating—it disassociates sales and money earned,’’ says a manager at a partsmanufacturer. If salespeople feel that an incentive plan is unfair, the desired moti-vational impact of the incentive is lost, and the plan may backfire and actuallydecrease sales force excitement.
A highly leveraged and fair compensation plan can create considerable salesforce excitement. A plan that pays mostly salary provides the sales force with secur-ity, but not excitement. In highly salaried sales forces, management must rely onother means besides compensation to create and sustain sales force excitement.The right pay mix decision is aligned with management’s desire to use incentivesas a means of creating sales force excitement and motivating salespeople to per-form the activities needed to drive customer and company results.
RV Dealer Uses Sales Force Incentives to Jump-Start Sales
The salespeople at a local recreational-vehicle (RV) dealership were notperforming up to management’s expectations. A sale was closed for onlyone out of every 200 customers who walked onto the lot. To increase sales,management replaced the $250 weekly salary for salespeople with a salesincentive plan designed to promote more proactive selling. Salespeoplecould earn $10 for each customer whose information they captured (in-cluding name, address, and phone number). This information was used forfollow-up calls and mailings. In addition, a $25 incentive was paid whena customer submitted a written offer for an RV. Total incentives that asalesperson could earn by capturing customer information and submittingoffers were capped at $300 per week. However, on top of this, salespeopleearned a generous 20 percent commission on net profits for every RV sold.The new incentive plan was a success. Follow-up calls increased and re-
PAGE 146................. 15869$ $CH5 05-19-06 09:22:56 PS
147Plan Design Part 2
sulted in more than half of the dealership’s RV sales, and the dealership’sclosing percentage improved from 0.5 to 10 percent in one year. Mostsalespeople reached the $300 cap each week, and sales-staff turnover de-creased.
Authors’ note: Incentive plans that tie earnings to specific salespersonactivities are generally most effective when used for only a short period oftime. If activity-based plans are left in place for too long, there is consider-able risk that salespeople will focus excessively on generating high quanti-ties of the desired activity at the expense of high-quality selling thatproduces good sales and profit results.
Much of Variable Pay Can Be Hidden Salary
Often, firms use the term at-risk pay to describe the incentive or variablecomponent of total pay. However, this term is often misleading. High incen-tive pay does not always mean high risk to the salesperson and does notguarantee high levels of sales force excitement. In fact, managers fromfirms that pay their sales forces 100 percent through variable pay oftenstate that the sales force is too complacent, content to live off income fromcurrent clients and unmotivated to seek out new accounts and drivegrowth. When motivation issues like this exist in sales forces that are paidlargely through variable pay, the traditional definition of pay mix is oftennot an accurate reflection of the extent to which pay is tied to performance.Recall that territory sales have two components: salesperson sales andfree sales. Salesperson sales are those sales that result from the skill,knowledge, motivation, and effort of the salesperson in the current year.Free sales will be realized regardless of what the sales force does; they canbe the result of a strong brand identity, non-sales force marketing efforts,superior products, and/or carryover from prior years’ sales efforts. True‘‘pay-for-performance’’ plans link incentives to salesperson sales alone. In-centives on salesperson sales are called performance pay, since they areearned only if the sales force works for them. Since it is often difficult toisolate and measure salesperson sales, many pay plans tie incentives tototal sales, which include both salesperson sales and free sales. The por-tion of incentives linked to free sales will be paid regardless of the salesper-son’s effort, and is therefore really a hidden salary, not performance pay.
When free sales are a large component of total sales and sales forceincentives are tied to total sales, the traditional definition of pay mix (salarypercentage/variable-pay percentage) is a misleading indicator of the ex-tent to which pay is tied to performance. A more insightful definition of paymix, called the effective pay mix, is the ratio of the total ‘‘salary’’ percent-age (including both traditional salary and hidden salary) to the performance-
PAGE 147................. 15869$ $CH5 05-19-06 09:22:57 PS
148 The Complete Guide to Sales Force Incentive Compensation
pay percentage. For example, consider a sales force that is paid 100 per-cent through variable pay, but where 60 percent of total sales are freesales. While the traditional salary–incentive mix is 0/100, the effective mixis 60/40.
Pay Mix as a Sales Force Controller. ‘‘Our sales force pay has become too expen-sive relative to our profits,’’ says a corporate director of compensation and benefitsat a recreation products company. ‘‘The sales force needs to service all products—not just those they receive commission on,’’ protests an e-business director at atools manufacturing firm. The pay mix decision influences the degree to whichthe compensation plan is a controller of sales force costs as well as sales forceactivities.
A pay plan with a large variable-pay component helps management controlthe sales force expense-to-sales ratio because incentives are paid out only if thesales force earns them by generating sales. However, total sales force expenses willbe harder to predict because compensation costs vary with performance. In a payplan with a large salary component, the majority of sales force costs are fixed anddo not depend on sales force performance, at least in the short term. Thus, a payplan with a large salary component gives management more control over the totalsales force expense, but less control over the sales force expense-to-sales ratio.
Salary and incentives also have an important role as controllers of sales forceactivity. The compensation plan helps to define success, set expectations, and en-courage sales force behaviors that align with the firm’s objectives. Most firmsdefine a target pay amount or range for salespeople, which can include both salaryand target incentive. The target incentive is based on the firm’s prediction of whata salesperson’s performance should be. Thus, there is an implicit (and sometimesexplicit) message that success is defined as making and exceeding the target payamount.
Figure 5-3 shows how salary and incentives act as levers of control for variouscomponents of the sales management system. Salary is usually the most appro-priate lever of control for components near the beginning (left-hand side) of thesales management system. Salary rewards salespeople for accomplishments in thesalespeople category (for example, enhancing product and market knowledge anddeveloping selling skills) as well as for performance in the sales force activitiescategory (for example, completing a number of calls to key customers and provid-ing customer follow-up after closing a sale). These accomplishments have a long-to medium-term impact on the firm, and this impact is difficult to measure. Thus,salary is the preferred lever of control. Incentives, on the other hand, can be avery effective way to reward salespeople for accomplishments further downstream(right-hand side) in the sales management system. Incentives typically rewardachievement of company results (for example, sales, sales growth, and marketshare). These accomplishments define the short-term success of the firm and areoften accurately and objectively measurable. Incentives can also be used in part toreward salespeople for customer results (for example, customer satisfaction and
PAGE 148................. 15869$ $CH5 05-19-06 09:22:58 PS
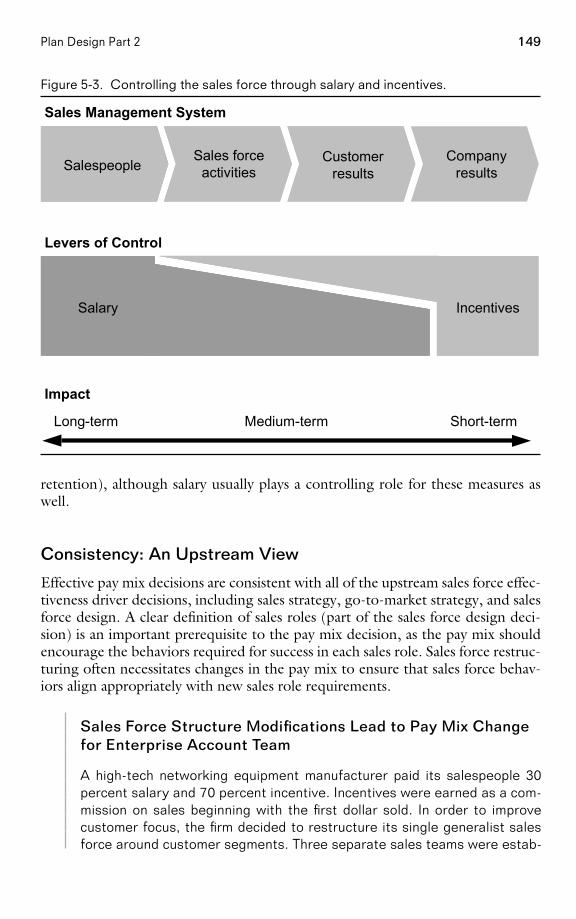
149Plan Design Part 2
Figure 5-3. Controlling the sales force through salary and incentives.
Salespeople Sales force activities
Customer results
Impact
Levers of Control
Salary Incentives
SalespeopleSalespeopleSales force
activitiesCustomer
resultsCompany
results
Long-term Medium-term Short-term
Salary IncentivesSalary Incentives
Sales Management System
retention), although salary usually plays a controlling role for these measures aswell.
Consistency: An Upstream View
Effective pay mix decisions are consistent with all of the upstream sales force effec-tiveness driver decisions, including sales strategy, go-to-market strategy, and salesforce design. A clear definition of sales roles (part of the sales force design deci-sion) is an important prerequisite to the pay mix decision, as the pay mix shouldencourage the behaviors required for success in each sales role. Sales force restruc-turing often necessitates changes in the pay mix to ensure that sales force behav-iors align appropriately with new sales role requirements.
Sales Force Structure Modifications Lead to Pay Mix Changefor Enterprise Account Team
A high-tech networking equipment manufacturer paid its salespeople 30percent salary and 70 percent incentive. Incentives were earned as a com-mission on sales beginning with the first dollar sold. In order to improvecustomer focus, the firm decided to restructure its single generalist salesforce around customer segments. Three separate sales teams were estab-
PAGE 149................. 15869$ $CH5 05-19-06 09:22:59 PS
150 The Complete Guide to Sales Force Incentive Compensation
lished, one for the largest enterprise accounts, a second for medium tolarge corporate accounts, and a third for smaller accounts. Managementdecided to continue to use the existing sales incentive plan for all threesales teams, in order to avoid excessive disruption at a time when the salesforce was adjusting to new sales roles and learning new customer assign-ments. However, the highly leveraged compensation plan was not appro-priate for all of the sales teams, particularly the enterprise account team.Enterprise accounts were primarily long-standing, loyal customers thatgenerated significant carryover sales. Since commissions were paid fromthe first dollar, enterprise salespeople earned many of their commissionson free sales. Approximately one year after implementing the new struc-ture, the firm initiated a project to develop a new compensation plan withless variable pay and higher salary for the enterprise sales team.
Sales territory alignment is another upstream sales force effectiveness driverthat can have a tricky effect on the outcome of an incentive plan. Often, the resultsa salesperson achieves are closely tied not only to the salesperson’s own efforts,but also to sales territory opportunity. Incentive plans that pay on total sales favorterritories with large opportunity (because there is more low-hanging fruit), whilethose that pay on market share favor territories with small opportunity (becausethe salesperson can spend more time penetrating each account). When sales terri-tories have unequal potential, a highly variable compensation plan can reward thesalesperson more for territory opportunity than for true performance. Incentiveplan designers need to assess sales territory equity when designing incentive plans.An effective way to neutralize territory inequities is to have a goal-based plan withgoals that account for differences in territory opportunity.
Compatibility: Alignment with Other Sales Force Drivers
An effective pay mix decision reinforces the desired sales force culture. For in-stance:
• A culture that is customer-centered, team-oriented, and focused on long-term success is compatible with a pay mix with a high proportion of salary.
• A culture that is sales-centered, competitive, and focused on short-termresults is compatible with a pay mix having a high proportion of variablepay.
Pay mix decisions must also align well with the exciter and controller salesforce effectiveness driver decisions. Compensation plans that have a considerablevariable-pay component can be a powerful means of stimulating sales force excite-ment and controlling sales force activities and costs. Thus, nonmonetary salesforce exciters and controllers are not as critical when the variable component ofsales force pay is large. On the other hand, a management team that chooses a pay
PAGE 150................. 15869$ $CH5 05-19-06 09:22:59 PS
151Plan Design Part 2
plan that is mostly salary has to rely heavily on nonmonetary sales force effective-ness drivers for creating excitement and maintaining control. In sales forces thatare paid primarily salary, excitement is created through extrinsic motivators suchas effective sales leadership, coaching, professional development, recognition, andtrips for top performers and through intrinsic motivators such as meaningfulwork, achievement, and empowerment. Control is maintained through strongperformance management and communication and control systems.
Companies Use Many Different Motivators to Create SalesForce Excitement
Motivators other than incentives can be very powerful. The following exam-ples highlight companies that use intrinsic and extrinsic motivators to cre-ate sales force excitement:
• Management at an insurance company boosts sales force motivationby emphasizing to salespeople the value that life insurance creates forcustomers. Through training, the firm continuously reinforces the roleof the insurance agent as an advocate for each customer’s family mem-bers and business partners, who will benefit from the insurance when itis needed. When salespeople see their role as helpers of people, notpeddlers of insurance, they feel more relevant, have an increased senseof purpose, and are more motivated in their jobs.
• Pharmaceutical giant Merck increases employee motivation by promot-ing a culture of empowerment. For example, in 1992 the firm imple-mented a sales force suggestion program called Improvement Drivenby Employee Action (IDEA). Over 20 percent of the sales force submit-ted ideas for improving the productivity and profitability of the firm’ssales and marketing efforts. Salespeople whose suggestions were im-plemented received merchandise, and winners were announced in Mer-ck’s daily newspaper.
• TruStar Solutions, a seller of Internet-based recruiting programs to cor-porations, increases the motivation of its top salespeople by askingthem to help with recruiting and mentoring new salespeople. Thisshows top performers that the company values their input (and not justthe sales they have brought in). The program has helped to improveretention of the firm’s best salespeople.
The Range of Salary–Incentive Mix
When we surveyed managers at 110 sales forces, of varying sizes and in variousindustries, who attended our sales compensation executive education programs atNorthwestern University between 2000 and 2004 (the Sales Incentive Executive
PAGE 151................. 15869$ $CH5 05-19-06 09:23:00 PS
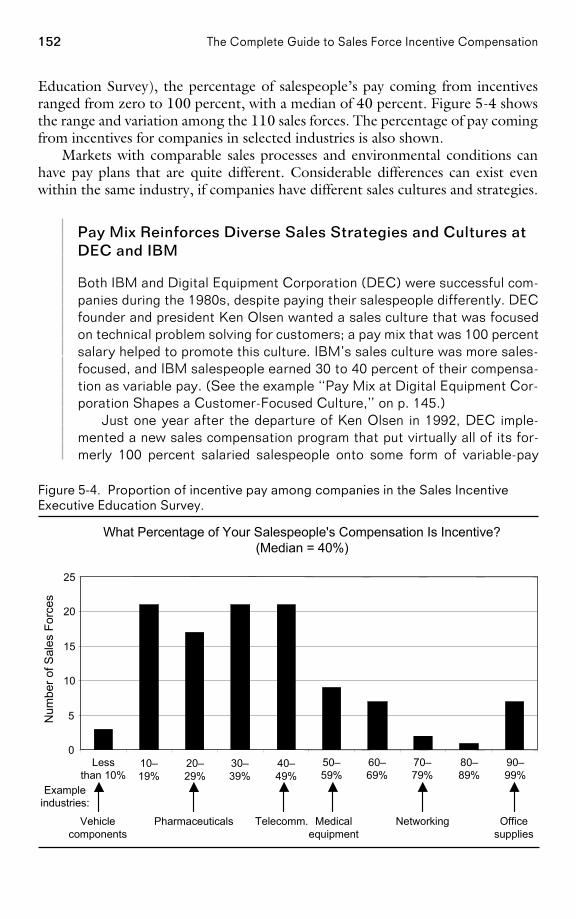
152 The Complete Guide to Sales Force Incentive Compensation
Education Survey), the percentage of salespeople’s pay coming from incentivesranged from zero to 100 percent, with a median of 40 percent. Figure 5-4 showsthe range and variation among the 110 sales forces. The percentage of pay comingfrom incentives for companies in selected industries is also shown.
Markets with comparable sales processes and environmental conditions canhave pay plans that are quite different. Considerable differences can exist evenwithin the same industry, if companies have different sales cultures and strategies.
Pay Mix Reinforces Diverse Sales Strategies and Cultures atDEC and IBM
Both IBM and Digital Equipment Corporation (DEC) were successful com-panies during the 1980s, despite paying their salespeople differently. DECfounder and president Ken Olsen wanted a sales culture that was focusedon technical problem solving for customers; a pay mix that was 100 percentsalary helped to promote this culture. IBM’s sales culture was more sales-focused, and IBM salespeople earned 30 to 40 percent of their compensa-tion as variable pay. (See the example ‘‘Pay Mix at Digital Equipment Cor-poration Shapes a Customer-Focused Culture,’’ on p. 145.)
Just one year after the departure of Ken Olsen in 1992, DEC imple-mented a new sales compensation program that put virtually all of its for-merly 100 percent salaried salespeople onto some form of variable-pay
Figure 5-4. Proportion of incentive pay among companies in the Sales IncentiveExecutive Education Survey.
Vehiclecomponents
Pharmaceuticals Telecomm. Medicalequipment
Networking Officesupplies
Exampleindustries:
What Percentage of Your Salespeople's Compensation Is Incentive?(Median = 40%)
0
5
10
15
20
25
Lessthan 10%
10–19%
20–29%
30–39%
40–49%
50–59%
60–69%
70–79%
80–89%
90–99%
Num
ber o
f Sal
es F
orce
s
PAGE 152................. 15869$ $CH5 05-19-06 09:23:01 PS
153Plan Design Part 2
plan. The new plan had 15 variations, ranging from 60 percent salary and40 percent variable pay to 90 percent salary and 10 percent variable pay,depending upon the sales role. To ease the transition to the new plan,salespeople were offered a draw on future earnings for the first fourmonths of the new program. Extensive training was provided to sales man-agers on how the plan would work and how to manage in an incentive envi-ronment. Salespeople were provided with an earnings simulation programon their PC so that they could see how their present sales would pay outunder the new plan and what the upside potential was for exceeding quota.Sales force turnover rates did not increase when the new plan was put intoplace as a result of the extensive communication and training that wasprovided to the sales force during this transition.
In 1998, DEC was acquired by Compaq, which in 2002 was acquired byHewlett-Packard.
There can be significant variation in the salary–incentive mix across differentsales roles within the same company. A major accounts salesperson may have adifferent incentive opportunity from a geographic salesperson who covers smalleraccounts. An inside salesperson may earn a different proportion of his incomefrom incentives than an outside salesperson. Figure 5-5 shows some examples ofhow and why both total compensation and the salary–incentive mix vary acrossdifferent sales positions.
Here we describe the characteristics of sales forces that have varying propor-tions of salary and incentive in their pay plans. Three distinctive categories areincluded:
• A low percent incentive pay plan: up to 15 percent of total pay is incentive.
• A high percent incentive pay plan: 50 percent or more of total pay isincentive.
• A moderate percent incentive pay plan: between 20 and 35 percent oftotal pay is incentive.
Pay plans with a percent incentive falling between the defined ranges willexhibit characteristics moderating those described in the categories on either end.
The Sales Force with a Low Percent Incentive Pay Plan
An Example of a Low Percent Incentive Compensation Plan:Engineering Sales
A maker of complex vehicle component systems pays its salespeople 100percent salary. The firm sells to a limited number of customers (vehiclemakers), and the sales force plays a critical role in maintaining strong ongo-
PAGE 153................. 15869$ $CH5 05-19-06 09:23:01 PS
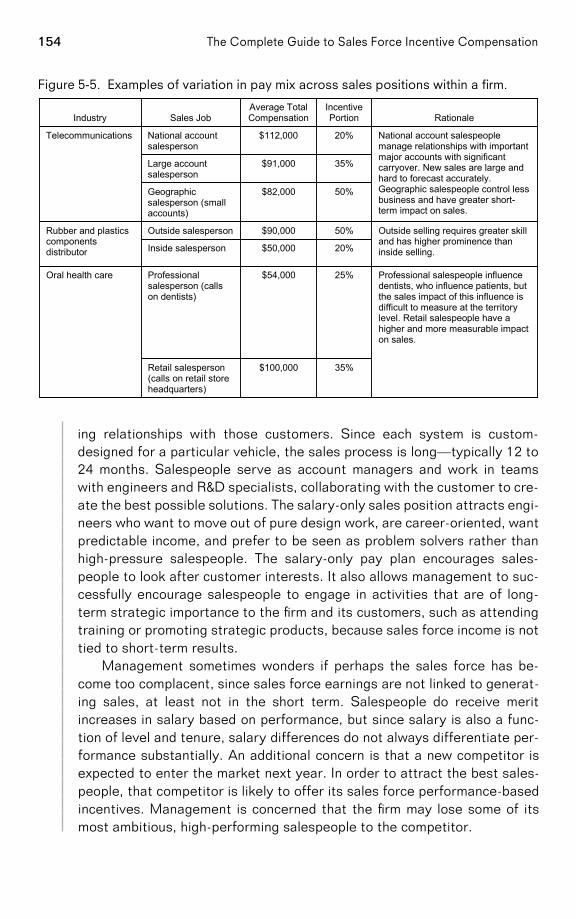
154 The Complete Guide to Sales Force Incentive Compensation
Figure 5-5. Examples of variation in pay mix across sales positions within a firm.
35%$100,000Retail salesperson(calls on retail storeheadquarters)
Professional salespeople influencedentists, who influence patients, butthe sales impact of this influence isdifficult to measure at the territorylevel. Retail salespeople have ahigher and more measurable impacton sales.
25%$54,000Professionalsalesperson (callson dentists)
Oral health care
20%$50,000Inside salesperson
Outside selling requires greater skilland has higher prominence thaninside selling.
50%$90,000Outside salespersonRubber and plasticscomponentsdistributor
50%$82,000Geographicsalesperson (smallaccounts)
35%$91,000Large accountsalesperson
National account salespeoplemanage relationships with importantmajor accounts with significantcarryover. New sales are large andhard to forecast accurately.Geographic salespeople control lessbusiness and have greater short-term impact on sales.
20%$112,000National accountsalesperson
Telecommunications
RationaleIncentivePortion
Average TotalCompensationSales JobIndustry
ing relationships with those customers. Since each system is custom-designed for a particular vehicle, the sales process is long—typically 12 to24 months. Salespeople serve as account managers and work in teamswith engineers and R&D specialists, collaborating with the customer to cre-ate the best possible solutions. The salary-only sales position attracts engi-neers who want to move out of pure design work, are career-oriented, wantpredictable income, and prefer to be seen as problem solvers rather thanhigh-pressure salespeople. The salary-only pay plan encourages sales-people to look after customer interests. It also allows management to suc-cessfully encourage salespeople to engage in activities that are of long-term strategic importance to the firm and its customers, such as attendingtraining or promoting strategic products, because sales force income is nottied to short-term results.
Management sometimes wonders if perhaps the sales force has be-come too complacent, since sales force earnings are not linked to generat-ing sales, at least not in the short term. Salespeople do receive meritincreases in salary based on performance, but since salary is also a func-tion of level and tenure, salary differences do not always differentiate per-formance substantially. An additional concern is that a new competitor isexpected to enter the market next year. In order to attract the best sales-people, that competitor is likely to offer its sales force performance-basedincentives. Management is concerned that the firm may lose some of itsmost ambitious, high-performing salespeople to the competitor.
PAGE 154................. 15869$ $CH5 05-19-06 09:23:03 PS
155Plan Design Part 2
Low percent incentive pay plans include those in which salespeople earn atleast 85 percent of their income as salary and 15 percent or less as performance-based incentives. A decision to pay salespeople low incentives and high salary hasadvantages for salespeople, customers, and the firm. These advantages, along withthe challenges of managing a sales force with a low percent incentive pay plan, aresummarized in the middle column of Figure 5-6.
The Sales Force with a High Percent Incentive Pay Plan
An Example of a High Percent Incentive Compensation Plan:High-Tech Sales
A direct marketer of computers and technology products uses telesalesaccount managers to reach small and medium-sized business customers.Account managers are paid entirely through commission on the gross profitthey generate, with commission rates varying depending on the salesper-son’s gross profit per day performance ranking and on her tenure with thecompany. The pay plan reflects the firm’s ‘‘pay-for-performance’’ philoso-phy; top salespeople earn multiples of what average performers earn. Inaddition, the pay plan communicates the company’s primary objective ofprofitable growth very effectively to the sales force. The 100 percentvariable-pay plan is attractive to salespeople with the right personality forthe job—the sales force is tenacious, aggressive, and effective at creatingsales in a competitive commodity market. In addition, since sales force payis tied closely to gross profit results, sales force costs stay in line withcompany profits.
Management is concerned that many salespeople view their relation-ship with the company as purely financial; many salespeople act more likeagents than like employees. The result is low sales force loyalty and fairlyhigh turnover. At the same time, some veteran salespeople have developedvery strong relationships with their customers, and as a result have builtvery lucrative, multimillion-dollar territories. Many of these veterans arecontent with the generous commissions they earn on easily obtained repeatbusiness, and are not driven to penetrate new markets or promote aggres-sive growth with existing customers. As the market becomes more compet-itive and industry growth slows, it is becoming more difficult for neweraccount managers to build their book of business, and turnover of newsales talent is especially high. When the company tried to realign someaccounts in order to balance account loads and provide better opportunityfor new salespeople, several of the longer-tenure account managers re-fused to relinquish ‘‘ownership’’ of their accounts. Recently, the companywas forced to abandon a plan to create vertical specialists for key markets
PAGE 155................. 15869$ $CH5 05-19-06 09:23:03 PS
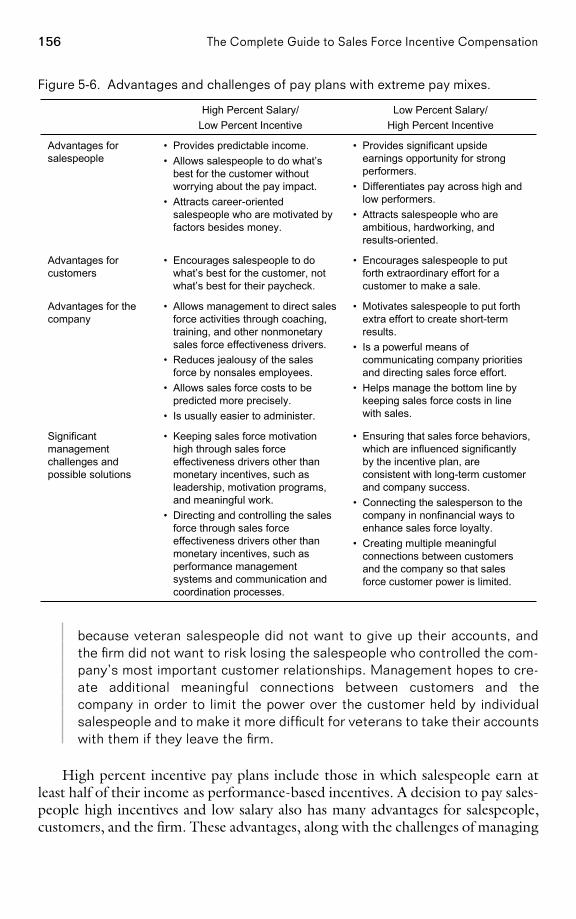
156 The Complete Guide to Sales Force Incentive Compensation
Figure 5-6. Advantages and challenges of pay plans with extreme pay mixes.
• Ensuring that sales force behaviors,which are influenced significantlyby the incentive plan, areconsistent with long-term customerand company success.
• Connecting the salesperson to thecompany in nonfinancial ways toenhance sales force loyalty.
• Creating multiple meaningfulconnections between customersand the company so that salesforce customer power is limited.
• Keeping sales force motivationhigh through sales forceeffectiveness drivers other thanmonetary incentives, such asleadership, motivation programs,and meaningful work.
• Directing and controlling the salesforce through sales forceeffectiveness drivers other thanmonetary incentives, such asperformance managementsystems and communication andcoordination processes.
Significantmanagementchallenges andpossible solutions
• Motivates salespeople to put forthextra effort to create short-termresults.
• Is a powerful means ofcommunicating company prioritiesand directing sales force effort.
• Helps manage the bottom line bykeeping sales force costs in linewith sales.
• Allows management to direct salesforce activities through coaching,training, and other nonmonetarysales force effectiveness drivers.
• Reduces jealousy of the salesforce by nonsales employees.
• Allows sales force costs to bepredicted more precisely.
• Is usually easier to administer.
Advantages for thecompany
• Encourages salespeople to putforth extraordinary effort for acustomer to make a sale.
• Encourages salespeople to dowhat’s best for the customer, notwhat’s best for their paycheck.
Advantages forcustomers
• Provides significant upsideearnings opportunity for strongperformers.
• Differentiates pay across high andlow performers.
• Attracts salespeople who areambitious, hardworking, andresults-oriented.
• Provides predictable income.• Allows salespeople to do what’s
best for the customer withoutworrying about the pay impact.
• Attracts career-orientedsalespeople who are motivated byfactors besides money.
Advantages forsalespeople
Low Percent Salary/High Percent Incentive
High Percent Salary/Low Percent Incentive
because veteran salespeople did not want to give up their accounts, andthe firm did not want to risk losing the salespeople who controlled the com-pany’s most important customer relationships. Management hopes to cre-ate additional meaningful connections between customers and thecompany in order to limit the power over the customer held by individualsalespeople and to make it more difficult for veterans to take their accountswith them if they leave the firm.
High percent incentive pay plans include those in which salespeople earn atleast half of their income as performance-based incentives. A decision to pay sales-people high incentives and low salary also has many advantages for salespeople,customers, and the firm. These advantages, along with the challenges of managing
PAGE 156................. 15869$ $CH5 05-19-06 09:23:04 PS
157Plan Design Part 2
a sales force with a high percent incentive pay plan, are summarized in the right-hand column of Figure 5-6.
The Sales Force with a Moderate Percent Incentive Pay Plan
An Example of a Moderate Incentive Compensation Plan:Pharmaceutical Sales
A pharmaceutical manufacturer pays its salespeople 75 percent salary and25 percent incentive. The incentive is significant enough to motivate thesales force and is implemented with a weighted goal-based plan that helpsmanagement direct effort to strategically important products and customersegments. Since salary is the largest component of total pay, managementalso guides sales force behavior with sales force drivers other than incen-tives, such as training, coaching, and culture. These other drivers are criti-cal for ensuring that salespeople educate physicians about complexpharmaceutical products effectively with accurate sales messages that arewithin FDA guidelines. Paying salespeople primarily salary also gives thefirm the flexibility to make frequent changes to its sales strategy. For exam-ple, last year the firm expanded its sales force, realigned sales territories,and introduced two new products, and all the changes were accepted bythe sales force. Occasionally, the firm experiences undesired turnover oftop producers, who leave the firm to go to biotechnology start-ups offeringhigher total pay or to medical equipment sellers with more highly leveragedcompensation plans with significant upside potential.
Most companies attempt to balance the advantages and disadvantages of highand low percent incentive pay plans by establishing incentive schemes that aresomewhere in the middle of the low and high extremes. Moderate percent incen-tive pay plans include those in which salespeople earn 20 to 35 percent of theirincome as performance-based incentives. A moderate percent incentive pay planhas many advantages, including the following:
• Salespeople have the security of a reasonable salary, yet simultaneouslyhave upside earnings potential for high achievement.
• Customers see salespeople who are motivated to both sell and performservice activities that meet the customer’s total needs.
• The firm maintains reasonable control of the sales force while providingsalespeople with moderate incentive to deliver results.
These plans moderate the advantages and disadvantages described in Figure5-6.
PAGE 157................. 15869$ $CH5 05-19-06 09:23:05 PS
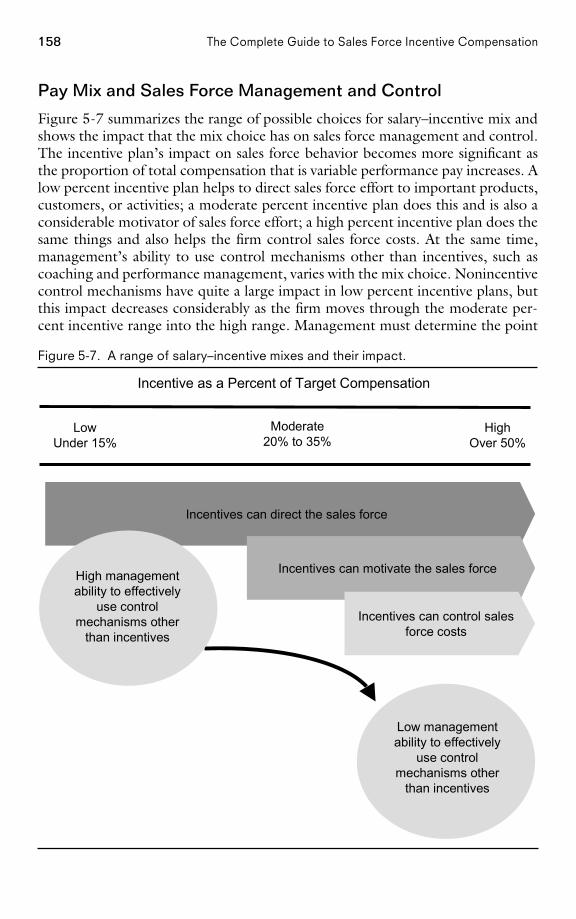
158 The Complete Guide to Sales Force Incentive Compensation
Pay Mix and Sales Force Management and Control
Figure 5-7 summarizes the range of possible choices for salary–incentive mix andshows the impact that the mix choice has on sales force management and control.The incentive plan’s impact on sales force behavior becomes more significant asthe proportion of total compensation that is variable performance pay increases. Alow percent incentive plan helps to direct sales force effort to important products,customers, or activities; a moderate percent incentive plan does this and is also aconsiderable motivator of sales force effort; a high percent incentive plan does thesame things and also helps the firm control sales force costs. At the same time,management’s ability to use control mechanisms other than incentives, such ascoaching and performance management, varies with the mix choice. Nonincentivecontrol mechanisms have quite a large impact in low percent incentive plans, butthis impact decreases considerably as the firm moves through the moderate per-cent incentive range into the high range. Management must determine the point
Figure 5-7. A range of salary–incentive mixes and their impact.
LowUnder 15%
Moderate20% to 35%
HighOver 50%
Incentive as a Percent of Target Compensation
Incentives can direct the sales force
Incentives can motivate the sales force
Incentives can control salesforce costs
High managementability to effectively
use controlmechanisms other
than incentives
Low managementability to effectively
use controlmechanisms other
than incentives
PAGE 158................. 15869$ $CH5 05-19-06 09:23:06 PS
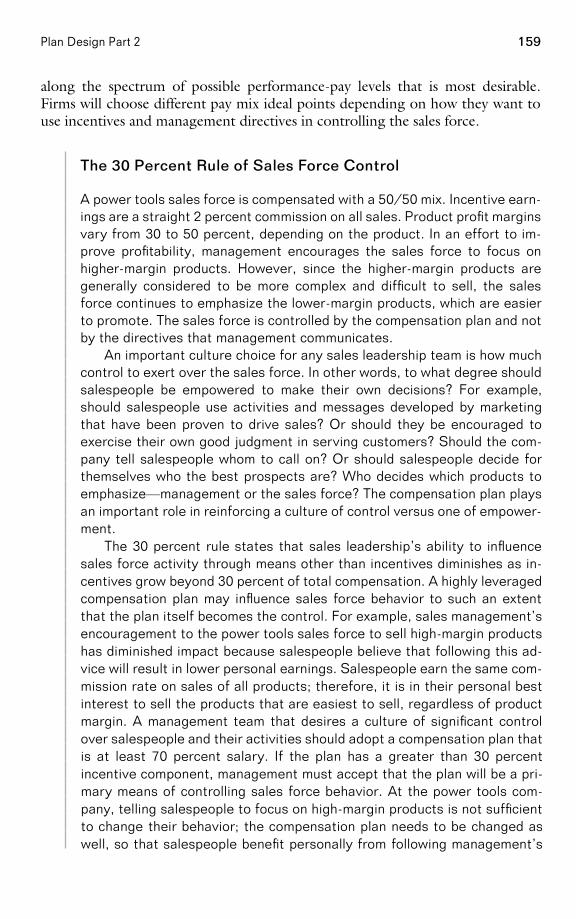
159Plan Design Part 2
along the spectrum of possible performance-pay levels that is most desirable.Firms will choose different pay mix ideal points depending on how they want touse incentives and management directives in controlling the sales force.
The 30 Percent Rule of Sales Force Control
A power tools sales force is compensated with a 50/50 mix. Incentive earn-ings are a straight 2 percent commission on all sales. Product profit marginsvary from 30 to 50 percent, depending on the product. In an effort to im-prove profitability, management encourages the sales force to focus onhigher-margin products. However, since the higher-margin products aregenerally considered to be more complex and difficult to sell, the salesforce continues to emphasize the lower-margin products, which are easierto promote. The sales force is controlled by the compensation plan and notby the directives that management communicates.
An important culture choice for any sales leadership team is how muchcontrol to exert over the sales force. In other words, to what degree shouldsalespeople be empowered to make their own decisions? For example,should salespeople use activities and messages developed by marketingthat have been proven to drive sales? Or should they be encouraged toexercise their own good judgment in serving customers? Should the com-pany tell salespeople whom to call on? Or should salespeople decide forthemselves who the best prospects are? Who decides which products toemphasize—management or the sales force? The compensation plan playsan important role in reinforcing a culture of control versus one of empower-ment.
The 30 percent rule states that sales leadership’s ability to influencesales force activity through means other than incentives diminishes as in-centives grow beyond 30 percent of total compensation. A highly leveragedcompensation plan may influence sales force behavior to such an extentthat the plan itself becomes the control. For example, sales management’sencouragement to the power tools sales force to sell high-margin productshas diminished impact because salespeople believe that following this ad-vice will result in lower personal earnings. Salespeople earn the same com-mission rate on sales of all products; therefore, it is in their personal bestinterest to sell the products that are easiest to sell, regardless of productmargin. A management team that desires a culture of significant controlover salespeople and their activities should adopt a compensation plan thatis at least 70 percent salary. If the plan has a greater than 30 percentincentive component, management must accept that the plan will be a pri-mary means of controlling sales force behavior. At the power tools com-pany, telling salespeople to focus on high-margin products is not sufficientto change their behavior; the compensation plan needs to be changed aswell, so that salespeople benefit personally from following management’s
PAGE 159................. 15869$ $CH5 05-19-06 09:23:06 PS
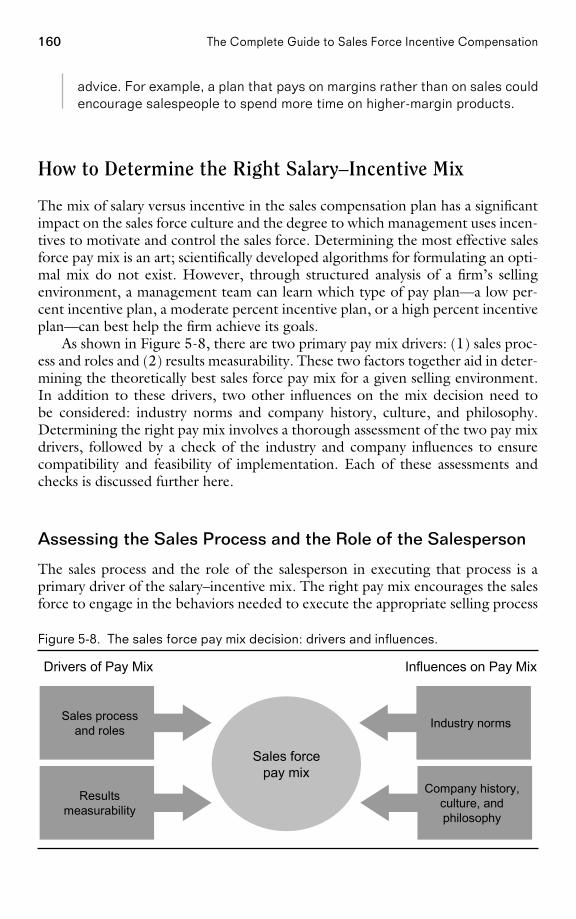
160 The Complete Guide to Sales Force Incentive Compensation
advice. For example, a plan that pays on margins rather than on sales couldencourage salespeople to spend more time on higher-margin products.
How to Determine the Right Salary–Incentive Mix
The mix of salary versus incentive in the sales compensation plan has a significantimpact on the sales force culture and the degree to which management uses incen-tives to motivate and control the sales force. Determining the most effective salesforce pay mix is an art; scientifically developed algorithms for formulating an opti-mal mix do not exist. However, through structured analysis of a firm’s sellingenvironment, a management team can learn which type of pay plan—a low per-cent incentive plan, a moderate percent incentive plan, or a high percent incentiveplan—can best help the firm achieve its goals.
As shown in Figure 5-8, there are two primary pay mix drivers: (1) sales proc-ess and roles and (2) results measurability. These two factors together aid in deter-mining the theoretically best sales force pay mix for a given selling environment.In addition to these drivers, two other influences on the mix decision need tobe considered: industry norms and company history, culture, and philosophy.Determining the right pay mix involves a thorough assessment of the two pay mixdrivers, followed by a check of the industry and company influences to ensurecompatibility and feasibility of implementation. Each of these assessments andchecks is discussed further here.
Assessing the Sales Process and the Role of the Salesperson
The sales process and the role of the salesperson in executing that process is aprimary driver of the salary–incentive mix. The right pay mix encourages the salesforce to engage in the behaviors needed to execute the appropriate selling process
Figure 5-8. The sales force pay mix decision: drivers and influences.
Sales processand roles
Resultsmeasurability
Sales forcepay mix
Drivers of Pay Mix Influences on Pay Mix
Industry norms
Company history,culture, andphilosophy
PAGE 160................. 15869$ $CH5 05-19-06 09:23:08 PS
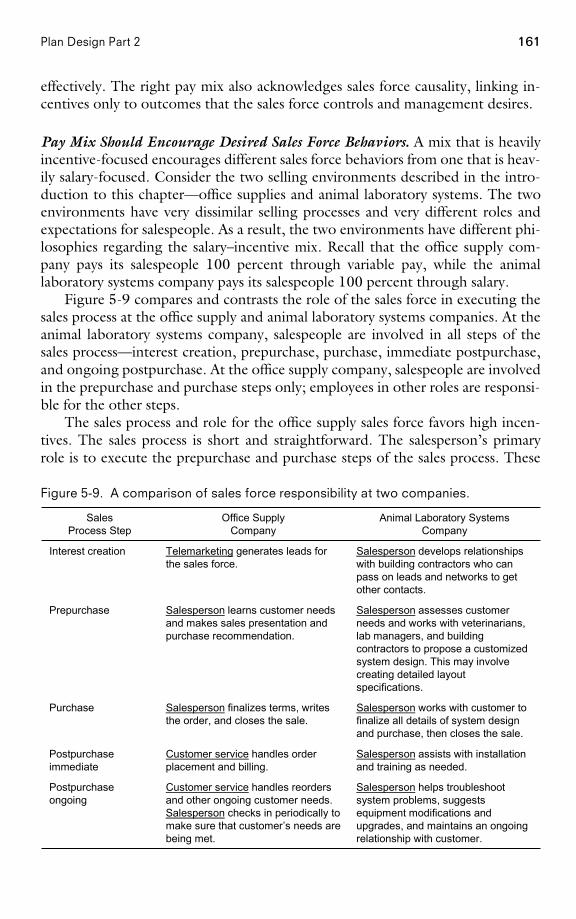
161Plan Design Part 2
effectively. The right pay mix also acknowledges sales force causality, linking in-centives only to outcomes that the sales force controls and management desires.
Pay Mix Should Encourage Desired Sales Force Behaviors. A mix that is heavilyincentive-focused encourages different sales force behaviors from one that is heav-ily salary-focused. Consider the two selling environments described in the intro-duction to this chapter—office supplies and animal laboratory systems. The twoenvironments have very dissimilar selling processes and very different roles andexpectations for salespeople. As a result, the two environments have different phi-losophies regarding the salary–incentive mix. Recall that the office supply com-pany pays its salespeople 100 percent through variable pay, while the animallaboratory systems company pays its salespeople 100 percent through salary.
Figure 5-9 compares and contrasts the role of the sales force in executing thesales process at the office supply and animal laboratory systems companies. At theanimal laboratory systems company, salespeople are involved in all steps of thesales process—interest creation, prepurchase, purchase, immediate postpurchase,and ongoing postpurchase. At the office supply company, salespeople are involvedin the prepurchase and purchase steps only; employees in other roles are responsi-ble for the other steps.
The sales process and role for the office supply sales force favors high incen-tives. The sales process is short and straightforward. The salesperson’s primaryrole is to execute the prepurchase and purchase steps of the sales process. These
Figure 5-9. A comparison of sales force responsibility at two companies.
Salesperson helps troubleshootsystem problems, suggestsequipment modifications andupgrades, and maintains an ongoingrelationship with customer.
Customer service handles reordersand other ongoing customer needs.Salesperson checks in periodically tomake sure that customer’s needs arebeing met.
Postpurchaseongoing
Salesperson assists with installationand training as needed.
Customer service handles orderplacement and billing.
Postpurchaseimmediate
Salesperson works with customer tofinalize all details of system designand purchase, then closes the sale.
Salesperson finalizes terms, writesthe order, and closes the sale.
Purchase
Salesperson assesses customerneeds and works with veterinarians,lab managers, and buildingcontractors to propose a customizedsystem design. This may involvecreating detailed layoutspecifications.
Salesperson learns customer needsand makes sales presentation andpurchase recommendation.
Prepurchase
Salesperson develops relationshipswith building contractors who canpass on leads and networks to getother contacts.
Telemarketing generates leads forthe sales force.
Interest creation
Animal Laboratory SystemsCompany
Office SupplyCompany
SalesProcess Step
PAGE 161................. 15869$ $CH5 05-19-06 09:23:09 PS
162 The Complete Guide to Sales Force Incentive Compensation
are the steps that involve the direct pursuit of immediate sales. With a highlyleveraged compensation plan, salespeople are motivated to focus on these specificactivities. By doing so, they create more short-term sales for the firm and makemore money for themselves. The nonselling support activities that are part of thefirm’s sales process and are necessary for maintaining ongoing relationships withcustomers are not handled by the sales force. These activities are performed byseparate customer service and telemarketing departments. By paying the salesforce 100 percent through variable pay, the office supply firm encourages sales-people to execute their role effectively and generate short-term results.
The sales process and role for the animal laboratory systems sales force, on theother hand, is not conducive to high incentives. The firm’s selling cycle is long andcomplex—sales force actions today may not generate results for many months, oreven until next year. Salespeople are involved in all stages of the selling process,which include many support activities in addition to selling. Excessive short-termincentives could drive salespeople to focus too heavily on short-term selling, atthe expense of providing the support and partnership that are necessary to meetthe customer’s lasting needs and help the company achieve long-term success. Bypaying the sales force 100 percent through salary, the firm encourages salespeopleto execute their role effectively and perform all the tasks necessary to maintainsuccessful long-term customer relationships.
Psychological Theory Suggests that Incentive Levels ShouldVary with the Nature of the Sales Role
Insights regarding the best salary–incentive mix can be gained by lookingat the work of psychologists Robert M. Yerkes and John D. Dodson, whostudied the relationship between arousal and performance in white mice.Mice were placed in a box that had several compartments and had to learnwhich compartment to enter. The mice were ‘‘encouraged’’ to learn withelectric shocks that had three levels of intensity: low, medium, and high. Itwas discovered that medium-intensity shocks encouraged the fastestlearning. Thus, the Yerkes-Dodson law, first published in 1908, predicts aninverted U-shaped relationship between arousal and performance. A cer-tain amount of arousal motivates performance, yet too much createsstress, which hurts performance. Moderate levels of arousal produced thebest results for the tasks to be performed by the mice in this experiment.
Of course, salespeople are not mice, and incentive pay (or lack of it) isnot the same as electric shocks, but the Yerkes-Dodson law has been usedto link stress and performance, which has some relevance in sales forces.When too little money is tied to performance, salespeople are not ade-quately motivated to perform. When too much money is tied to perform-ance and salespeople feel stress about whether or not they can achievetheir desired income level, the excessive stress leads to inferior results.The right stress level (or incentive level) depends upon the nature of the
PAGE 162................. 15869$ $CH5 05-19-06 09:23:09 PS
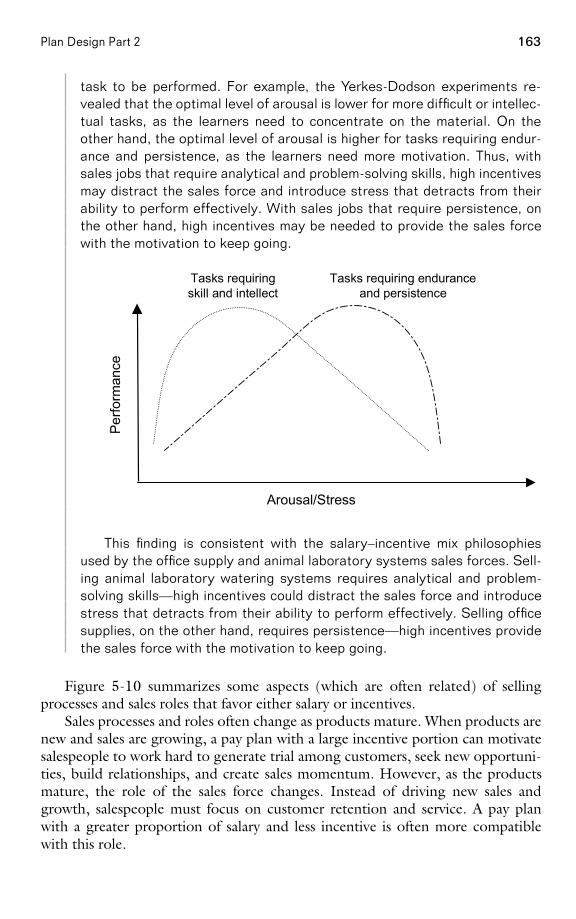
163Plan Design Part 2
task to be performed. For example, the Yerkes-Dodson experiments re-vealed that the optimal level of arousal is lower for more difficult or intellec-tual tasks, as the learners need to concentrate on the material. On theother hand, the optimal level of arousal is higher for tasks requiring endur-ance and persistence, as the learners need more motivation. Thus, withsales jobs that require analytical and problem-solving skills, high incentivesmay distract the sales force and introduce stress that detracts from theirability to perform effectively. With sales jobs that require persistence, onthe other hand, high incentives may be needed to provide the sales forcewith the motivation to keep going.
Arousal/Stress
Perfo
rman
ce
Tasks requiringskill and intellect
Tasks requiring enduranceand persistence
This finding is consistent with the salary–incentive mix philosophiesused by the office supply and animal laboratory systems sales forces. Sell-ing animal laboratory watering systems requires analytical and problem-solving skills—high incentives could distract the sales force and introducestress that detracts from their ability to perform effectively. Selling officesupplies, on the other hand, requires persistence—high incentives providethe sales force with the motivation to keep going.
Figure 5-10 summarizes some aspects (which are often related) of sellingprocesses and sales roles that favor either salary or incentives.
Sales processes and roles often change as products mature. When products arenew and sales are growing, a pay plan with a large incentive portion can motivatesalespeople to work hard to generate trial among customers, seek new opportuni-ties, build relationships, and create sales momentum. However, as the productsmature, the role of the sales force changes. Instead of driving new sales andgrowth, salespeople must focus on customer retention and service. A pay planwith a greater proportion of salary and less incentive is often more compatiblewith this role.
PAGE 163................. 15869$ $CH5 05-19-06 09:23:10 PS
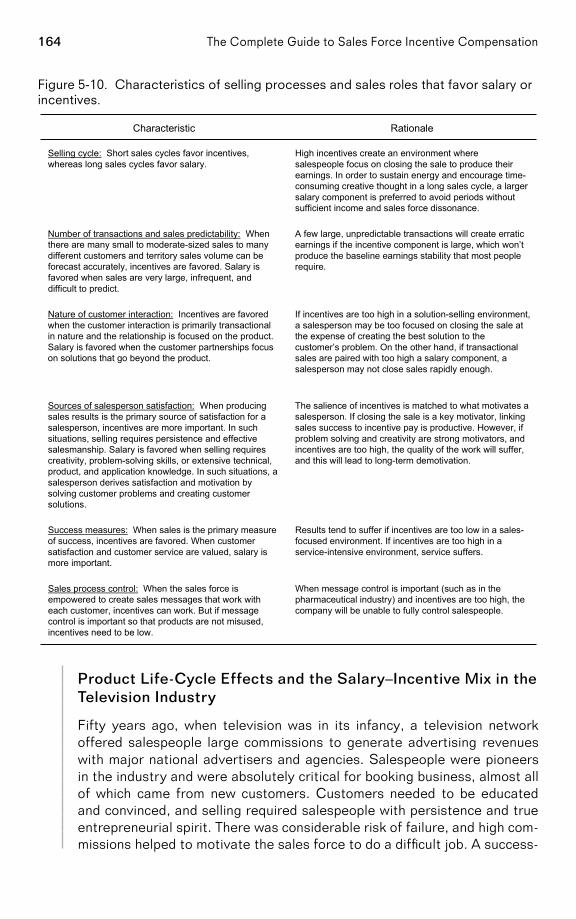
164 The Complete Guide to Sales Force Incentive Compensation
Figure 5-10. Characteristics of selling processes and sales roles that favor salary orincentives.
When message control is important (such as in thepharmaceutical industry) and incentives are too high, thecompany will be unable to fully control salespeople.
Sales process control: When the sales force isempowered to create sales messages that work witheach customer, incentives can work. But if messagecontrol is important so that products are not misused,incentives need to be low.
Results tend to suffer if incentives are too low in a sales-focused environment. If incentives are too high in aservice-intensive environment, service suffers.
Success measures: When sales is the primary measureof success, incentives are favored. When customersatisfaction and customer service are valued, salary ismore important.
The salience of incentives is matched to what motivates asalesperson. If closing the sale is a key motivator, linkingsales success to incentive pay is productive. However, ifproblem solving and creativity are strong motivators, andincentives are too high, the quality of the work will suffer,and this will lead to long-term demotivation.
Sources of salesperson satisfaction: When producingsales results is the primary source of satisfaction for asalesperson, incentives are more important. In suchsituations, selling requires persistence and effectivesalesmanship. Salary is favored when selling requirescreativity, problem-solving skills, or extensive technical,product, and application knowledge. In such situations, asalesperson derives satisfaction and motivation bysolving customer problems and creating customersolutions.
If incentives are too high in a solution-selling environment,a salesperson may be too focused on closing the sale atthe expense of creating the best solution to thecustomer’s problem. On the other hand, if transactionalsales are paired with too high a salary component, asalesperson may not close sales rapidly enough.
Nature of customer interaction: Incentives are favoredwhen the customer interaction is primarily transactionalin nature and the relationship is focused on the product.Salary is favored when the customer partnerships focuson solutions that go beyond the product.
A few large, unpredictable transactions will create erraticearnings if the incentive component is large, which won’tproduce the baseline earnings stability that most peoplerequire.
Number of transactions and sales predictability: Whenthere are many small to moderate-sized sales to manydifferent customers and territory sales volume can beforecast accurately, incentives are favored. Salary isfavored when sales are very large, infrequent, anddifficult to predict.
High incentives create an environment wheresalespeople focus on closing the sale to produce theirearnings. In order to sustain energy and encourage time-consuming creative thought in a long sales cycle, a largersalary component is preferred to avoid periods withoutsufficient income and sales force dissonance.
Selling cycle: Short sales cycles favor incentives,whereas long sales cycles favor salary.
RationaleCharacteristic
Product Life-Cycle Effects and the Salary–Incentive Mix in theTelevision Industry
Fifty years ago, when television was in its infancy, a television networkoffered salespeople large commissions to generate advertising revenueswith major national advertisers and agencies. Salespeople were pioneersin the industry and were absolutely critical for booking business, almost allof which came from new customers. Customers needed to be educatedand convinced, and selling required salespeople with persistence and trueentrepreneurial spirit. There was considerable risk of failure, and high com-missions helped to motivate the sales force to do a difficult job. A success-
PAGE 164................. 15869$ $CH5 05-19-06 09:23:11 PS
165Plan Design Part 2
ful salesperson earned a lot of money, typically 25 percent salary and 75percent incentive, paid as a commission on revenues. This compensationplan helped the network accomplish its objective of making difficult newsales in order to build a strong base of business.
By the 1970s, the television network had become well established, andthe role of the sales force in booking advertising sales had evolved. Thesales job had become more service-oriented, as many customer purchasingdecisions had become routine and most pricing decisions were predeter-mined. The salesperson’s primary job was to develop and harvest knownopportunities with long-time customers. The risk of failure was significantlyless. Yet the same sales compensation plan remained in place, as the com-pany was reluctant to change it for fear of disrupting the sales force andcreating turnover. Salespeople continued to be paid very high variable payeven though they were no longer as prominent in creating sales as they hadbeen in the early years. The high variable pay was really a hidden salary,since very little was truly at risk; a large fraction of territory sales werecarried over from year to year through relationships and routines that hadbeen established in the past.
Today, advertisers and agencies have many more media choices, in-cluding numerous electronic media options and cable television. Becauseof the competitive landscape, the sales force’s role has once again becomevery prominent in creating sales, and most television networks offer highsales force incentives.
The Salary–Incentive Mix Can Vary with a Salesperson’sExperience
A seller of automobile manufacturing components adjusts the salary–incentive mix based on the experience of the salesperson. New salespeopleare paid 100 percent salary for their first year. From 12 to 18 months,salespeople are paid 50 percent salary and 50 percent commission. After18 months, salespeople are paid 100 percent commission. Most companiesthat pay the sales force 100 percent variable pay, such as companies in theinsurance industry, provide some form of safety net for new salespeople,allowing them to be compensated fairly while they are learning the job.
Pay Mix Should Acknowledge Sales Force Causality. Sales force causality is influ-enced by a firm’s selling process and is an important consideration when decidingon the appropriate salary–incentive mix. Causality reflects the ability of individualsalespeople to affect short-term results. In high-causality environments, salesper-son sales are large: A considerable portion of total sales is determined by the skill,motivation, and efforts of salespeople in the current incentive period. In low-causality environments, free sales are large: Other factors besides current sales
PAGE 165................. 15869$ $CH5 05-19-06 09:23:12 PS
166 The Complete Guide to Sales Force Incentive Compensation
force effort have a large impact on sales. Factors that decrease sales force causalityinclude the following:
• Brand name. Brands that are well known and differentiated from competi-tive products often have high sales, even in the absence of effective salesforce support. These products sell themselves.
• Non-sales force marketing instruments. When pricing, advertising, tele-sales, and direct mail play a significant role in generating sales, sales forcecausality is typically less.
• Team selling. Several people working together to create a sale muddies thecausal link between individual effort and results.
Selling environments with high sales force causality tend to favor incentives,while those with low causality usually favor salary. Incentives have a larger impactin high-causality environments. Salespeople like to feel that their effort will berewarded. In a high-causality environment, work effort has high short-term salesimpact. Immediate sales increases occur in such an environment when the salesforce puts forth extra effort. Salespeople see sales rise and feel a sense of accom-plishment. They receive commensurate financial reward when a high-variable-payplan is adopted. The synergistic effects of high causality and high variable pay arevery motivating.
Perceived Causality Motivates a High-Tech Sales Force
In order for incentives to be effective, salespeople must believe that theirefforts lead to the rewarded results. The perception of causality—not ac-tual causality—is what is important. Firms in rapidly growing markets cancreate incentive plans that are highly motivational—even in cases whereactual causality is not high. For example, a networking equipment manufac-turer sold through a complex distribution system and thus did not havesales data available at the territory level. Sales were growing rapidly, andmanagement wanted to motivate the sales force by showing each salesper-son how his effort led to territory success and then paying an appropriateincentive. The firm developed a complex formula for allocating salesthrough distributors to individual territories. The formula provided only anestimate—it was not possible to measure actual sales with a high degreeof accuracy at the territory level. Nonetheless, the sales force was thrilledto see how quickly territory sales were growing. Salespeople concludedthat their personal efforts had caused the growth estimated for their terri-tory. As long as sales kept growing rapidly, incentives kept growing andeveryone was happy. However, when sales growth slowed and stopped,salespeople began to look more deeply into the measurement of resultsand to challenge the allocation model. As more and more flaws in the model
PAGE 166................. 15869$ $CH5 05-19-06 09:23:12 PS
167Plan Design Part 2
were discovered, the perception of causality disappeared, and the incentiveplan had to be changed.
When high variable pay is used in a low-causality selling environment, sales-people may miss the connection between work effort and rewards. Plans that arenot crafted well can be perceived as behaving like lotteries. Plans with high vari-able pay are effective only when the level of free sales is estimated accurately, sothat incentives can be paid for salesperson sales alone. Often firms accomplish thisby setting territory goals and paying incentives only upon goal attainment beyondfree sales. Such plans can motivate the sales force to work to create salespersonsales and thus earn incentive pay, provided the goals are fair and accurate. Whenincentives are used to pay for free sales, the firm is actually paying a hidden salary.A good portion of variable pay does not depend on performance when incentivesare paid for sales that will be realized regardless of what the sales force does.Incentives should reward accomplishment. They lose their emotional impactwhen a salesperson feels that her actions do not have a large effect on the out-come. Of course, companies that are designing a plan to pay incentives for sales-person sales will need to estimate the level of free sales for the sales force accuratelyand fairly. Otherwise, the sales force is likely to be dissatisfied with the compensa-tion plan, particularly if the estimated level of free sales is too high, and as a resultsalespeople are underrewarded for their efforts.
Team selling is a common threat to causality. When several salespeople are in aposition to influence the same customer, and each individual’s sales are influencedsignificantly by the efforts of other team members, it is often difficult to determineeach individual salesperson’s contribution to company and customer results.Hence, environments that emphasize team selling typically favor higher salary,while those that emphasize individual selling are more likely to favor incentives.There are many different types of team-selling situations. Sometimes, a sales forcehas multiple salespeople calling on the same decision makers. Other times, a salesforce has multiple salespeople calling on different decision makers who influencethe same result. Team selling is common in sales forces with broad, complex prod-uct lines, where a single salesperson is unable to perform all the necessary sellingtasks effectively. It is also common in sales forces that cover large national orglobal accounts with multiple locations.
Team-Selling Example: Multiple Salespeople Call on the SameDecision Maker
A firm that sells a broad line of software products to banks has a teamsales structure. At large banks, an account manager (AM) represents thecompany’s full product line. The AM is expected to understand the fullspectrum of needs at the account and to act as a primary point of contactfor the customer. Since the needs of large customers are complex and thefirm’s product line is broad, it is not possible for the AM to understand allthe details required to sell each of the company’s complex products. Thus,
PAGE 167................. 15869$ $CH5 05-19-06 09:23:13 PS
168 The Complete Guide to Sales Force Incentive Compensation
the AM relies on product specialists to provide technical details and con-sulting and to help close sales. Product specialists also provide customerswith training and installation assistance. The AM coordinates the activitiesof the product specialists as needed. Since the AM and the product special-ists work together as a team to create sales and meet customer needs,causality is attributed to the entire team, not to a specific sales role. Re-sponsibility for results is shared, and, as a result, individual incentives arenot effective.
Team-Selling Example: Multiple Salespeople Call on DifferentDecision Makers Who Influence the Same Result
Diabetics use blood glucose monitors to test their blood sugar daily. Theypurchase the monitor and testing strips in drugstores and health-care out-lets. Since testing strips are not interchangeable between monitors, thepatient’s choice of monitor is a critical decision for the manufacturer. Amonitor purchase generates many years of strip purchases.
Up to four different people often influence a patient’s choice of moni-tor. First, the patient’s treating physician may make a recommendation.Second, since the disease is diagnosed in a hospital, a hospital staff mem-ber may recommend a specific monitor. Third, most patients are referredto a diabetes nurse educator, who provides information about the disease,treatment options, and lifestyle implications. The diabetes nurse educatoris in a position to recommend a product. Finally, when the patient visits aretail outlet to purchase a product, the pharmacist may provide adviceabout which monitor is best.
None of these buying influences can be ignored. Manufacturers usuallyask their sales forces to call on all of them. Typically, multiple independentsales roles are used. For example, one salesperson calls on treating physi-cians, a second calls on hospital staff, a third calls on diabetes nurse educa-tors, and a fourth calls on pharmacists. The impact of each sales role isimpossible to measure—all of them influence the buying decision. Thewhole team shares the causality—salespeople in all roles contribute to thesalesperson sales component. But since an individual salesperson’s impacton the patient’s final purchase decision is impossible to determine, individ-ual incentives may not be very motivational for the sales force.
Team-Selling Example: Large National or Global AccountsHave Multiple Locations That Need Sales Force Coverage
The salespeople at a consumer packaged goods firm need to call on Wal-Mart headquarters, where companywide buying decisions are made. Sell-ing at headquarters spans a wide range of activities, including promotion
PAGE 168................. 15869$ $CH5 05-19-06 09:23:14 PS
169Plan Design Part 2
planning, category plan-o-grams, co-op advertising, packaging, and logis-tics. Experts from the consumer packaged goods firm participate in each ofthese along with Wal-Mart personnel. In addition, the firm needs to call onlocal stores to sell-in and pull through products and to provide merchandis-ing services. Since people in different sales roles work together to providethe various kinds of coverage the customer needs, sales force causalitygets blurred across the various sales positions. Individuals feel less per-sonal control over results, and hence the motivational power of individualincentives is reduced.
While team-selling environments generally favor higher salary, many firms thatsell through teams do use incentives successfully. Team-based incentive plans varygreatly in their design, depending upon the type of selling team, the types of salesroles, and the firm’s culture. Team incentives are often paid into a pool based onthe team’s total results. This pool is then divided appropriately among team mem-bers based on the nature and content of each member’s role and his perceivedcontribution to results. Alternatively, some firms double-count sales and give eachsalesperson on the team credit for the entire sale. Many firms with team-basedincentive plans continue to pay a portion of incentives based on individual per-formance as well. Several examples of team-based incentive plans are provided inChapter 6.
Market Volatility Can Threaten Sales Force Causality
Market volatility is another common threat to sales force causality. In vola-tile markets, sales are very hard to predict. Sales that require minimal salesforce effort relative to their value—often referred to as ‘‘windfalls’’ or‘‘bluebirds’’—are booked unexpectedly and frequently. These randomsales can be very high in one year and low in the next. Companies thatdevelop highly leveraged compensation plans that ignore market volatilitycan incur two negative consequences. First, the sales force develops highincome expectations subsequent to a successful year in which randomsales are high and salespeople receive considerable windfall gains. Thesales force takes credit for the success and feels entitled to a similar in-come level in the future. Then, sales force morale suffers the following yearwhen random sales are low. Second, a perception of unfairness envelopsthe sales force when the windfalls are not uniform across all salespeople.Paying a higher salary and lower incentive in volatile markets is one way toensure a more fair and predictable distribution of earnings. Another way isto try to measure and account for random sales. For example, some firmsput a cap on earnings to limit the impact of windfall gains resulting fromrandom sales. Other firms account for volatility by flattening the payoutand spreading incentive payments across a wider performance range, sothat random sales have less impact on the payout distribution. Chapter 7
PAGE 169................. 15869$ $CH5 05-19-06 09:23:14 PS
170 The Complete Guide to Sales Force Incentive Compensation
provides more detail on performance–payout relationships that effectivelyaccount for market volatility.
In markets that are not excessively volatile, paying incentives on occa-sional bluebirds or windfalls can actually have a positive impact on salesforce morale. A random, unexpected hit makes a salesperson feel good,and may inspire her to go out and work harder to create future sales. Oth-ers in the sales organization are motivated to await their turn at a bluebird.Thus, paying incentives for bluebirds can be a positive strategy, as long asthese windfalls occur infrequently and are spread randomly across thesales force so that every salesperson feels that he can benefit over time.
Evaluating the Measurability of Company and CustomerResults
Incentives cannot work if the measures on which they are based are unavailable orinaccurate. Thus, selling environments in which company and customer resultsare highly measurable at the territory level allow incentives, while those with poormeasurability favor salary.
Measurement Inaccuracies Lead to Decreased Productivity ata Health-Care Firm
The management team at a health-care products manufacturer believedstrongly in the concept of variable sales force pay and wanted to create a‘‘pay-for-performance’’ culture. The firm’s products were used in hospitals,although sales went through distributors. Salespeople spent the majorityof their time influencing hospital-based decision makers in an assigned geo-graphic territory, and these decision makers would then purchase the prod-ucts from a distributor. Often the distributor was located geographicallyclose to the hospital, but this was not always the case.
Unfortunately, sales could be tracked only to the distributor level, notto the hospital level. The firm based incentives on sales to distributors ineach salesperson’s geographic sales territory; it was assumed that thesesales were eventually realized at the local hospitals that the salespersoncalled on. Salespeople knew that this logic was flawed; hospitals often pur-chased from distributors outside their local area. Salespeople challengedthe method of sales crediting. To prove their point, they began to trackdown hospital invoices that confirmed that they should receive credit forsales to distributors that were not in their local territory. This activity wasan incredible drain on sales force productivity; at one point, managementestimated that the sales force was spending as much as one-third of itstime tracking invoices, rather than selling.
PAGE 170................. 15869$ $CH5 05-19-06 09:23:15 PS
171Plan Design Part 2
The most effective sales incentive programs tie incentive pay to the achieve-ment of company and customer results. Each salesperson’s performance is assessedin terms of one or more performance criteria. For example, territory revenues,contribution, and market share are typical ways to measure a salesperson’s contri-bution to company results. Customer satisfaction and retention are commonlyused measures of customer results. (See Chapter 6 for a more detailed discussionof incentive plan measures.) Whatever measures are selected, incentive pay is tiedto the salesperson’s success on these performance criteria.
Accurate measurability of the selected criteria at the individual salespersonlevel is critical to the success of any incentive-based plan. If it is not possible tomeasure performance accurately, then it is impossible to pay fairly on that per-formance. The less accurate the measurement is, the less desirable its use to rewardsalespeople with incentive pay is. When salespeople perceive performance mea-surement to be unfair, the desired motivational impact of the incentive is lost.Salespeople will spend their time arguing about measures instead of focusing oncustomers. The entire incentive plan may backfire, causing low sales force morale,reduced productivity, and high turnover.
Measurability depends upon data availability, accuracy, and timeliness. Atmany companies, accurate performance data are simply not available at the terri-tory level. Some sales tracking systems do not capture all of the sales transactionsand thus cannot give a salesperson full credit for her results. In addition, manycompanies (such as the health-care products manufacturer described in the exam-ple above) have multitiered distribution systems and know how much they sell todistributors, but not how much those distributors sell to end users. As a result,the outcome of salespeople’s work with end users cannot be determined. Often,distributors are willing to sell data to a manufacturer that tracks the distributor’ssales to the end-user level. In many circumstances, the benefits of improved salesforce measurement justify the cost of buying these data. In other situations, dis-tributors view these data as a competitive advantage and are unwilling to sharethem with manufacturers. In such cases, manufacturers need to be more creativein devising performance metrics.
Data accuracy and timeliness are an important part of measurability and thusinfluence the degree to which a firm can use incentive-based sales compensation.In some cases, performance measures are estimated from a sample when a censusis not available. Such estimates can have sampling errors, and few salespeoplewill be content to accept a sampling error that they feel adversely affects theircompensation. Customer satisfaction surveys often have data accuracy issues, par-ticularly when a salesperson can influence a customer inappropriately to providegood survey results. Data timeliness is also important for measurability. Data thatare months late because of collection delays and data processing errors are notvery motivational to a sales force.
The Consequences of a Pay Mix Decision That Does Not Acknowledge Causalityand Measurability. A sales compensation plan that is incompatible with salesforce causality and measurability creates dissonance within the sales organization.
PAGE 171................. 15869$ $CH5 05-19-06 09:23:15 PS
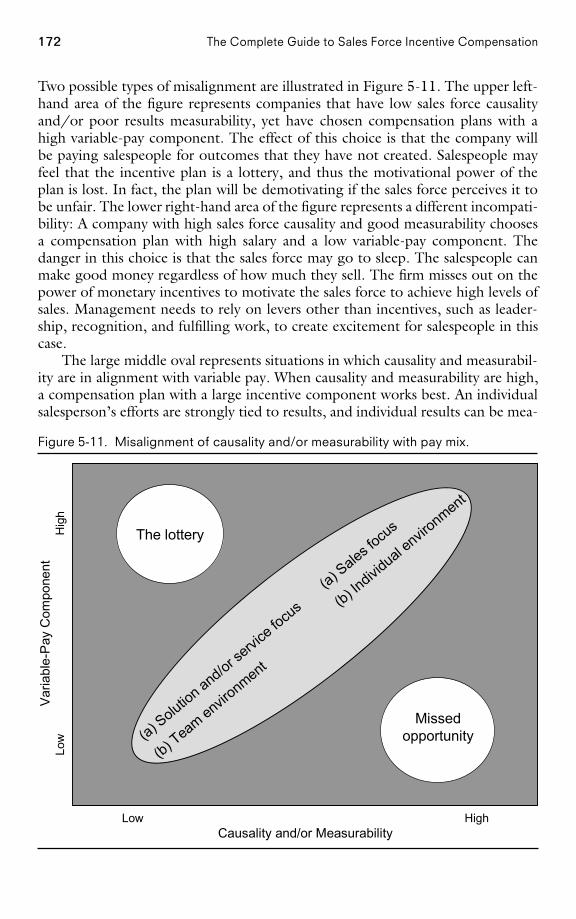
172 The Complete Guide to Sales Force Incentive Compensation
Two possible types of misalignment are illustrated in Figure 5-11. The upper left-hand area of the figure represents companies that have low sales force causalityand/or poor results measurability, yet have chosen compensation plans with ahigh variable-pay component. The effect of this choice is that the company willbe paying salespeople for outcomes that they have not created. Salespeople mayfeel that the incentive plan is a lottery, and thus the motivational power of theplan is lost. In fact, the plan will be demotivating if the sales force perceives it tobe unfair. The lower right-hand area of the figure represents a different incompati-bility: A company with high sales force causality and good measurability choosesa compensation plan with high salary and a low variable-pay component. Thedanger in this choice is that the sales force may go to sleep. The salespeople canmake good money regardless of how much they sell. The firm misses out on thepower of monetary incentives to motivate the sales force to achieve high levels ofsales. Management needs to rely on levers other than incentives, such as leader-ship, recognition, and fulfilling work, to create excitement for salespeople in thiscase.
The large middle oval represents situations in which causality and measurabil-ity are in alignment with variable pay. When causality and measurability are high,a compensation plan with a large incentive component works best. An individualsalesperson’s efforts are strongly tied to results, and individual results can be mea-
Figure 5-11. Misalignment of causality and/or measurability with pay mix.
The lottery
(a) Solutio
n and/or servi
ce fo
cus
(a) Sales fo
cus
(b) Team envir
onment
(b) Individ
ual envir
onment
Missedopportunity
Var
iabl
e-P
ay C
ompo
nent
Low
Hig
h
Low HighCausality and/or Measurability
PAGE 172................. 15869$ $CH5 05-19-06 09:23:17 PS
173Plan Design Part 2
sured accurately. Therefore, having a larger portion of compensation at risk ismotivational for the sales force. When causality and measurability are low, a com-pensation plan with a small incentive component works best. An individual sales-person’s efforts are not strongly tied to results, and individual results cannot bemeasured accurately. In this situation, the sales force can work collaboratively andfocus on meeting the long-term needs of customers, knowing that most of theircompensation is predetermined.
Comparing to Industry Norms
Most companies look at industry norms when determining pay mix for two rea-sons. First, since companies in the same industry often have comparable sellingprocesses and have access to similar performance measures, industry normsprovide a good model of what pay mix has worked well for other companiesin analogous situations. Second, awareness of industry norms is important forcompetitiveness in the market for salespeople. Particularly in industries where jobhopping is common, companies that deviate unfavorably from the mix of salaryand incentive offered by their competitors may experience excessive sales forceturnover. The pay mix is particularly important to the extent that it affects the payrange for top performers. Plans with a greater incentive component typically havegreater upside potential. If a firm’s best performers feel that they can make moremoney at another firm with a more highly leveraged compensation plan, they willmigrate to that opportunity (all other things being equal). A success strategy usedby many companies is to ensure that top performers can earn as much money withthem as anywhere else in the industry.
Many industry surveys, including those discussed in Chapter 4, provide infor-mation about the mix of salary versus incentive by industry, in addition to provid-ing data on total pay for average and top performers.
Blue Cross Blue Shield Creates a More AggressiveSalary–Incentive Mix Based on Benchmarking Outside ItsIndustry
When management at Blue Cross Blue Shield (BCBS) of Massachusettsdecided to revamp the company’s sales compensation plan, it compared itsplan not only with the plans of other managed-care companies, but alsowith those of successful service companies in industries such as bankingand technology. Management had observed that many of the high-performingsalespeople who had left BCBS had joined companies in other service in-dustries. Thus, the firm’s industry competitors were only a subset of itspersonnel competitors. After reviewing the benchmarking data, manage-ment felt that service firms with more aggressive incentive structures cre-ated hunger in the sales organization, while those offering larger basesalaries fostered complacency. Thus, the firm reversed its compensation
PAGE 173................. 15869$ $CH5 05-19-06 09:23:17 PS
174 The Complete Guide to Sales Force Incentive Compensation
plan from 60 percent base salary and 40 percent incentive to a plan offering40 percent base and 60 percent incentive.
Service Firm Adjusts Pay Mix to Attract the Right People
When new management took over at a small Chicago-based service firm, acomplete makeover of the sales organization was a top priority. A newsales force hiring profile was developed, and since the majority of the cur-rent salespeople did not match this profile, two-thirds of the sales forcewas let go. Management wanted to attract experienced salespeople fromorganizations such as Dun & Bradstreet and RR Donnelley who were ag-gressive and motivated but also had the skill, poise, and charm to sell busi-ness services effectively. In order to attract people with the right attitudeand aptitude, they discovered that a change in the salary–incentive mixwas needed. The base salary was raised from $50,000 to $80,000, andcommission rates were lowered.
When Should Industry Norms Be Ignored?
Industry norms may be irrelevant for a company that has a very differentsales strategy or selling process from other firms in the same industry. Inaddition, industry pay mix norms occasionally get out of whack with indus-try sales strategies because pay plan changes often lag sales strategychanges. For example, in the early 2000s, most pharmaceutical sales-people earned approximately 20 to 25 percent of their cash compensationas variable pay. However, several recent trends in the industry have blurredcausality at the individual salesperson level, suggesting that perhaps thisvariable-pay percentage is too high. These trends include the increasedprevalence of team selling, the influence of managed care, the effect ofdirect-to-consumer advertising, and more rapid dissemination of medicalnews via the Internet. Despite these trends, most companies have beenreluctant to deviate from industry norms by reducing the incentive paycomponent for fear of losing their top performers to competitors offeringgreater upside earnings potential. Today, industry leaders are just begin-ning to adjust pay plans to include a larger salary component, laggingseveral years behind the changes in the sales strategy and selling environ-ment.
Checking for Alignment with Company History, Culture, andManagement Philosophy
Company history, culture, and management philosophy play an important role indetermining the appropriate mix of salary versus incentive. Salespeople base their
PAGE 174................. 15869$ $CH5 05-19-06 09:23:18 PS
175Plan Design Part 2
expectations about how they will be paid in the future on how they have beenpaid in the past. Making major changes to the pay mix—for example, going froma high-salary environment to a high-incentive environment, or vice versa—can bevery disruptive and challenging. Often, companies are reluctant to make suchmajor changes, for fear of unsettling the sales force. Pay mix changes often have aconsiderable impact on the distribution of earnings across salespeople. This redis-tribution is particularly problematic for sales forces that are making the transitionfrom a highly incentive-focused pay mix to a highly salary-focused mix. Pay planswith large salary components tend to have smaller variation in earnings acrosssalespeople than plans with large incentive components. Thus, top performerstypically make less money when the salary component is large and more when theincentive component is large. As a result, a move to a larger salary componentruns the risk of disappointing top-performing salespeople and causing undesiredsales force turnover.
Mix decisions also have a considerable impact on sales force culture. Figure 5-12 characterizes five attributes of sales force culture by describing diametricallyopposed management philosophies that help to define the culture. The figurehypothesizes about how the salary–incentive mix decision helps to shape the cul-ture by reinforcing the desired management philosophy. The figure also providesinsight into the type of person that will be attracted to each incentive plan. Be-cause of the considerable differences between cultures that favor incentives andthose that favor salary, a substantial change to the salary–incentive mix in eitherdirection often leads to significant sales force turnover. After the implementationof a significant mix change, it is common for over 50 percent of salespeople toleave a company within three years. Chapter 11 shares some strategies for imple-menting significant salary–incentive mix changes successfully.
Who Bears the Risk of Poor Company Results?
The salary–incentive mix decision makes a culture statement about the sell-ing organization’s risk-taking posture. It influences how much financial riskis assumed by the firm and how much by the sales force. This has a majoreffect on the type of salesperson that is attracted to the firm. With a highlyleveraged compensation plan, the sales force assumes the risk of poor per-formance. Salespeople will not make much money in a bad year, even if thepoor performance is the result of factors beyond the sales force’s control,such as a bad economy or poor product quality. On the other hand, thesalespeople benefit from higher upside potential in good years. The com-pany may still be profitable in both good and bad years, since sales forcecosts are tied to sales. When salespeople are paid mostly salary, on theother hand, the company assumes the risk of poor performance. In a badyear, company profits will take a hit, since sales force costs are mostlyfixed. However, salespeople will continue to earn good incomes despite thepoor performance. Salespeople who are willing to risk income swings fromyear to year in exchange for higher upside earnings potential prefer high-
PAGE 175................. 15869$ $CH5 05-19-06 09:23:18 PS
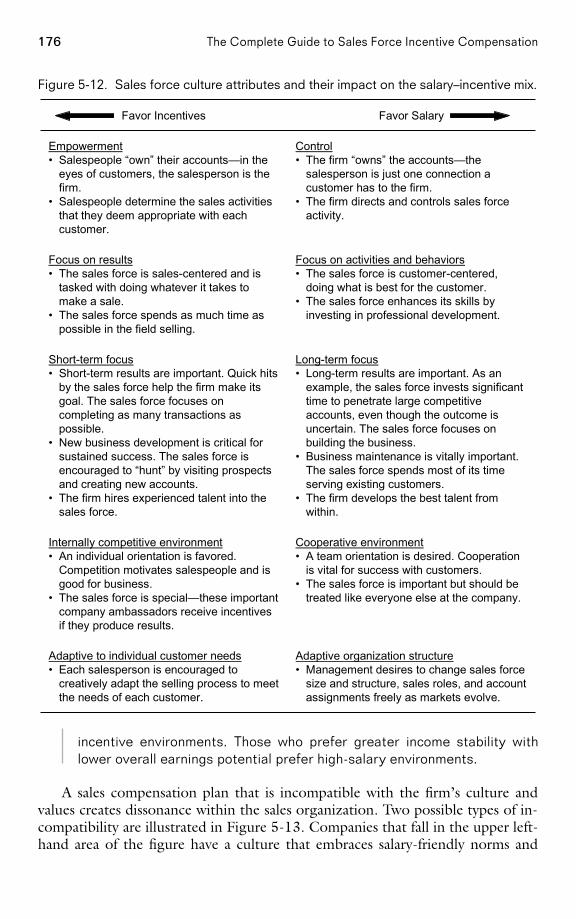
176 The Complete Guide to Sales Force Incentive Compensation
Figure 5-12. Sales force culture attributes and their impact on the salary–incentive mix.
Adaptive organization structure• Management desires to change sales force
size and structure, sales roles, and accountassignments freely as markets evolve.
Adaptive to individual customer needs• Each salesperson is encouraged to
creatively adapt the selling process to meetthe needs of each customer.
Cooperative environment• A team orientation is desired. Cooperation
is vital for success with customers.• The sales force is important but should be
treated like everyone else at the company.
Internally competitive environment• An individual orientation is favored.
Competition motivates salespeople and isgood for business.
• The sales force is special—these importantcompany ambassadors receive incentivesif they produce results.
Long-term focus• Long-term results are important. As an
example, the sales force invests significanttime to penetrate large competitiveaccounts, even though the outcome isuncertain. The sales force focuses onbuilding the business.
• Business maintenance is vitally important.The sales force spends most of its timeserving existing customers.
• The firm develops the best talent fromwithin.
Short-term focus• Short-term results are important. Quick hits
by the sales force help the firm make itsgoal. The sales force focuses oncompleting as many transactions aspossible.
• New business development is critical forsustained success. The sales force isencouraged to “hunt” by visiting prospectsand creating new accounts.
• The firm hires experienced talent into thesales force.
Focus on activities and behaviors• The sales force is customer-centered,
doing what is best for the customer.• The sales force enhances its skills by
investing in professional development.
Focus on results• The sales force is sales-centered and is
tasked with doing whatever it takes tomake a sale.
• The sales force spends as much time aspossible in the field selling.
Control• The firm “owns” the accounts—the
salesperson is just one connection acustomer has to the firm.
• The firm directs and controls sales forceactivity.
Empowerment• Salespeople “own” their accounts—in the
eyes of customers, the salesperson is thefirm.
• Salespeople determine the sales activitiesthat they deem appropriate with eachcustomer.
Favor SalaryFavor Incentives
incentive environments. Those who prefer greater income stability withlower overall earnings potential prefer high-salary environments.
A sales compensation plan that is incompatible with the firm’s culture andvalues creates dissonance within the sales organization. Two possible types of in-compatibility are illustrated in Figure 5-13. Companies that fall in the upper left-hand area of the figure have a culture that embraces salary-friendly norms and
PAGE 176................. 15869$ $CH5 05-19-06 09:23:19 PS
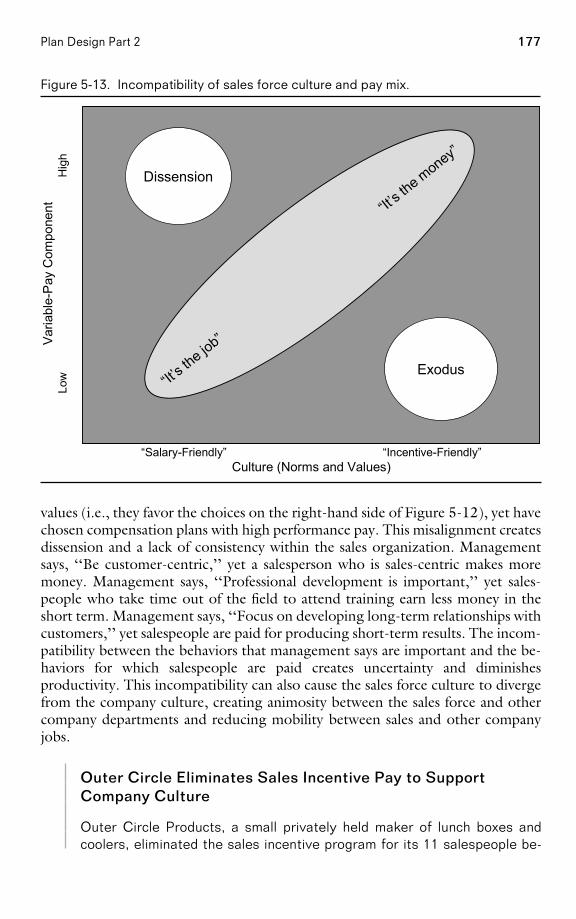
177Plan Design Part 2
Figure 5-13. Incompatibility of sales force culture and pay mix.
Dissension
Exodus
Var
iabl
e-P
ay C
ompo
nent
Low
Hig
h
“Salary-Friendly” “Incentive-Friendly”Culture (Norms and Values)
“It’s th
e job”
“It’s th
e money”
values (i.e., they favor the choices on the right-hand side of Figure 5-12), yet havechosen compensation plans with high performance pay. This misalignment createsdissension and a lack of consistency within the sales organization. Managementsays, ‘‘Be customer-centric,’’ yet a salesperson who is sales-centric makes moremoney. Management says, ‘‘Professional development is important,’’ yet sales-people who take time out of the field to attend training earn less money in theshort term. Management says, ‘‘Focus on developing long-term relationships withcustomers,’’ yet salespeople are paid for producing short-term results. The incom-patibility between the behaviors that management says are important and the be-haviors for which salespeople are paid creates uncertainty and diminishesproductivity. This incompatibility can also cause the sales force culture to divergefrom the company culture, creating animosity between the sales force and othercompany departments and reducing mobility between sales and other companyjobs.
Outer Circle Eliminates Sales Incentive Pay to SupportCompany Culture
Outer Circle Products, a small privately held maker of lunch boxes andcoolers, eliminated the sales incentive program for its 11 salespeople be-
PAGE 177................. 15869$ $CH5 05-19-06 09:23:20 PS
178 The Complete Guide to Sales Force Incentive Compensation
cause management felt that the plan clashed with the company’s all-for-one culture. The sales incentive plan motivated salespeople to manipulatenumbers and make decisions that benefited their wallets, but not necessar-ily their customers. Under the new compensation plan, salespeople werepaid straight salaries, just like everyone else in the firm. In addition, allemployees (including salespeople) could participate in the firm’s profit-sharing plan. Management recognized that the unique culture at Outer Cir-cle was not right for everyone: A candidate who saw the salaried salescompensation plan as a negative was not right for the company.
Companies in the lower right-hand corner of Figure 5-13 have a differentincompatibility: These companies embrace incentive-friendly norms and valuesthat celebrate results and sales performance differences, yet they have chosen acompensation plan with high salary and low performance pay. This misalignmentis likely to result in significant sales force turnover, as the lack of monetary incen-tives will make it difficult to retain and attract salespeople with the right successprofile. The firm also misses out on the power of monetary incentives to motivatethe sales force to achieve higher levels of sales.
Disney Offers Sales Force Incentives to Support Its AggressiveMarketing Campaign
In 1996, Disney Attractions wanted to attack the marketplace with a pow-erful sales message: Disney is much more than just a family destination.Disney launched a marketing campaign emphasizing the fact that many ofits theme parks cater to adults as well as children, offering recreationalactivities such as golfing and water sports and educational courses at theDisney Institute. Disney’s 100 salespeople were critical to the success ofthe campaign, as they had the power to influence travel agents and meetingplanners who could persuade travelers to try a Disney vacation. To supportthe marketing effort, Disney expanded its sales force and added regionaloffices. To enhance sales force motivation, the firm revamped its sales com-pensation plan. Salespeople who had previously been paid a straight salarycould now earn commissions for meeting and exceeding ambitious salesquotas.
Finally, the extent to which management desires to use incentives as a meansof motivating and controlling salespeople is an important consideration in thepay mix decision. Some management teams have a strong pay-for-performancephilosophy. They feel that ‘‘pay should be more reflective of performance,’’‘‘there should be greater differentiation between high and low performers,’’ and‘‘labor costs should be tied more directly to sales.’’ Other sales management teamshave a more long-term customer-oriented view. They tell us, ‘‘We need to en-courage closer customer relationships and improve customer satisfaction,’’ ‘‘thecompensation plan should be better aligned with long-term company goals,’’ and
PAGE 178................. 15869$ $CH5 05-19-06 09:23:21 PS
179Plan Design Part 2
‘‘we want to focus sales effort on strategic activities, not just short-term salestargets.’’ The pay mix decision should reflect and reinforce management’s beliefsand philosophies.
A Pay Mix Scorecard
The discussion thus far on how to determine the right salary–incentive mix hasexamined the company and market conditions that favor sales compensation planswith either a high, moderate, or low percent incentive. These drivers and influ-ences were discussed individually. A final mix decision requires that they be con-sidered jointly. The pay mix scorecard provides a mechanism for integrating thevarious factors that lead to an appropriate salary–incentive mix decision. Using ascorecard, an incentive plan designer evaluates how the various drivers and influ-ences affect the pay mix decision, based on the company’s specific situation. Thebest scorecards are customized to the specific selling organization. Figure 5-14presents a generic scorecard.
Each factor can be weighted to reflect its importance to the mix decision. It ispossible that some factors will clearly dominate. For example, the firm may decidethat it will modify an existing compensation plan only slightly. In this case, Com-pany History is a dominant factor. Figures 5-15 and 5-16 illustrate pay mix score-cards for the office supply company and the animal laboratory systems companydescribed earlier in the chapter.
The pay mix decision for both the office supply company and the animal labo-ratory systems company is reasonably clear, since the arrows on each company’spay mix scorecard are aligned fairly consistently. On occasion, companies facemore difficult pay mix decisions. Figure 5-17 shows a pay mix scorecard for anewspaper company whose advertising sales force is paid primarily salary. Thedecision to have a mostly salaried sales force dates back to a time when the news-paper had a virtual monopoly on advertising in its local market and the sales forcewas selling to a captive audience. In recent years, the number of print mediaoptions has expanded, and electronic media and cable television have becomeviable alternatives to newspaper advertising. As a result, the newspaper’s sales forcehas become much more prominent in creating advertising sales. Managementneeds to decide whether it should change its historical incentive system and movetoward one that is more consistent with its market.
PAGE 179................. 15869$ $CH5 05-19-06 09:23:22 PS
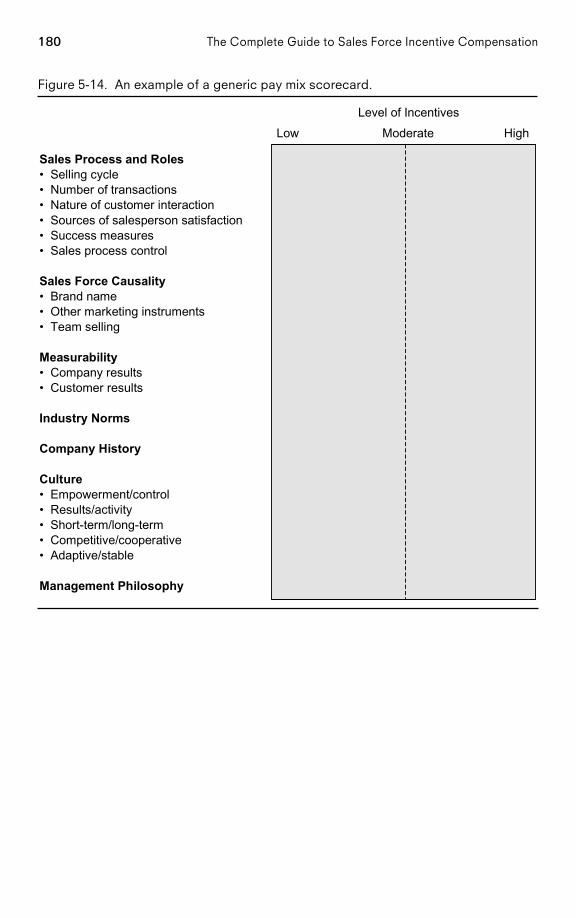
180 The Complete Guide to Sales Force Incentive Compensation
Figure 5-14. An example of a generic pay mix scorecard.
Sales Process and Roles• Selling cycle• Number of transactions• Nature of customer interaction• Sources of salesperson satisfaction• Success measures• Sales process control
Sales Force Causality• Brand name• Other marketing instruments• Team selling
Measurability• Company results• Customer results
Industry Norms
Company History
Culture• Empowerment/control• Results/activity• Short-term/long-term• Competitive/cooperative• Adaptive/stable
Management Philosophy
Level of Incentives
Low Moderate High
PAGE 180................. 15869$ $CH5 05-19-06 09:23:23 PS
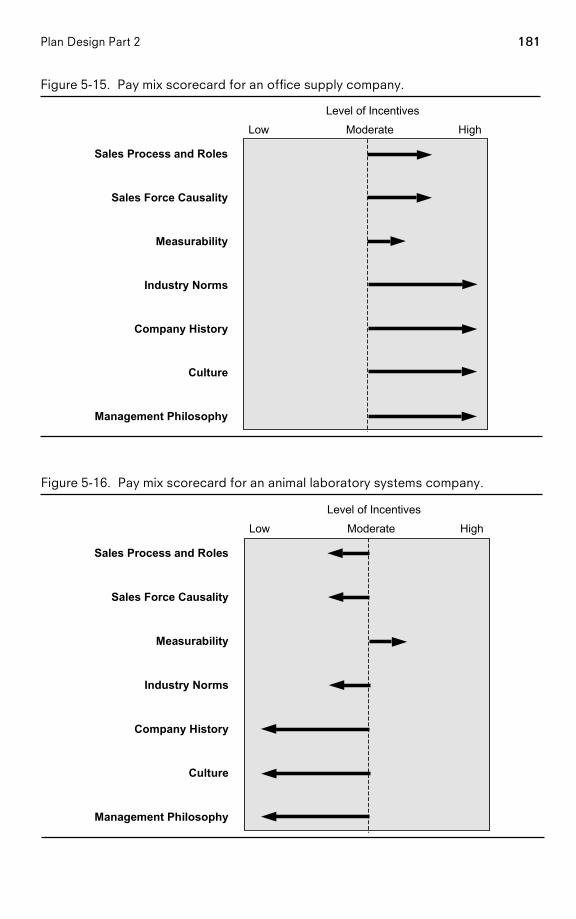
181Plan Design Part 2
Figure 5-15. Pay mix scorecard for an office supply company.
Level of Incentives
Low Moderate High
Sales Process and Roles
Sales Force Causality
Measurability
Industry Norms
Company History
Culture
Management Philosophy
Figure 5-16. Pay mix scorecard for an animal laboratory systems company.
Level of Incentives
Low Moderate High
Sales Process and Roles
Sales Force Causality
Measurability
Industry Norms
Company History
Culture
Management Philosophy
PAGE 181................. 15869$ $CH5 05-19-06 09:23:25 PS
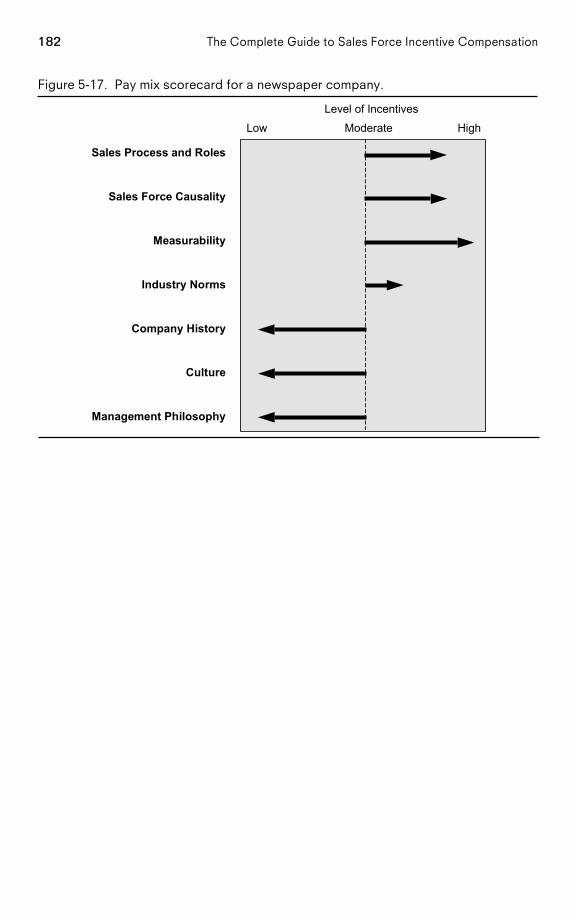
182 The Complete Guide to Sales Force Incentive Compensation
Figure 5-17. Pay mix scorecard for a newspaper company.
Level of Incentives
Low Moderate High
Sales Process and Roles
Sales Force Causality
Measurability
Industry Norms
Company History
Culture
Management Philosophy
PAGE 182................. 15869$ $CH5 05-19-06 09:23:26 PS
C H A P T E R 6
Plan Design Part 3Selecting Performance Measures
How This Chapter Is OrganizedAre You Using the Most Appropriate Performance Measures toDetermine Your Incentive Plan Payout? 184Types of Measures 187
The Role of Performance Management Versus Incentives 188Who Should Take Accountability for the Performance Measures? 190
How to Determine the Most Appropriate Sales Incentive Measures:An Advisory 191
Effective Incentive Plan Performance Measures Pass the 3 Cs Test 192Effective Incentive Plan Performance Measures Are Objectively andAccurately Measurable 192Effective Incentive Plan Performance Measures Should Be Affected bySales Force Capability and Activity 193Effective Incentive Plan Performance Measures Do Not Favor AnyParticular Group 194Effective Incentive Plan Performance Measures Are Adaptive toBusiness Strategy Change 195Keep It Simple: Have No More than Three or Four Total Measures 196
How to Determine the Most Appropriate Sales Incentive Measures:Specifics 198
Metrics 199Company Results Metrics 200
Sales Revenue Metrics 201Contribution Margin and Profit Metrics 201
PAGE 183
183
................. 15869$ $CH6 05-19-06 09:23:14 PS
184 The Complete Guide to Sales Force Incentive Compensation
Market Share Metrics 203Customer Results Metrics 204Activity Metrics 206Salespeople Metrics 208
Data Views 209Absolute-Level Metrics 209Comparing to Past Performance 210Comparing to a Goal 210Ranking Relative to Peers 215
Focus 216Market Segment Focus 216Product Focus 216Channel Focus 216Organizational-Level Focus and Team Rewards 216
Timing 221How Often Should Incentives Be Paid? 221Should Incentives Be Paid When the Order Is Taken or Whenthe Company Collects the Funds from the Customer? 223
Are You Using the Most Appropriate Performance Measuresto Determine Your Incentive Plan Payout?Incentives reward successful sales force performance. Performance cannot bejudged without evaluative criteria. Selecting the performance measures that areused to determine incentive plan payout is a critical incentive plan design decision,and the impact of choosing the wrong measures is significant. Consider the fol-lowing situations:
Paying on Scales Encourages Undesired Discounting
The sales force of an office equipment maker is paid a commission on salesvolume; salespeople earn 2 percent of sales up to quota and 5 percent ofsales above quota. The sales force books very few sales at list price, de-spite the fact that the firm’s products are widely recognized to be superiorto those of competitors. Salespeople have the authority to offer discountsof up to 20 percent, and further discounts are possible with approval fromsenior levels. On average, sales are booked at a 29 percent discount offlist price. Salespeople typically start pricing discussions with the preau-thorized 20 percent discount and then push their managers for deeper dis-counts. The compensation plan provides no incentive for salespeople tothink in terms of margin. Salespeople are constantly looking for a low-riskway (by cutting prices to the bone) to build volume and get to the 5 percentcommission level as quickly as possible.
PAGE 184................. 15869$ $CH6 05-19-06 09:23:15 PS
185Plan Design Part 3
Paying on Short-Term Sales Undermines Teamwork andCustomer Relationships
A computer products and services company pays salespeople 25 percentbase salary and 75 percent commission, based on quarterly sales goalachievement. The pay plan promotes a sales force culture that is hungry,aggressive, and focused on short-term results. This worked well in thefirm’s early years, when sales cycles were short and selling was straightfor-ward. However, over the last decade, as the industry has evolved and thefirm’s product line has broadened, the sales process has become increas-ingly long, complex, and team-oriented. Today, sales success involvessalespeople working together with systems engineers, service managers,technical consultants, and product specialists over a period of manymonths to reach multiple decision makers. The importance of developingand maintaining long-term customer relationships has increased consider-ably. Yet an intense quarter-to-quarter focus by management puts pressureon salespeople to deliver short-term results. This focus is beginning to hurtthe firm; many customers have expressed doubt that the firm’s salespeopleare truly concerned with their interests.
Paying on Growth in a Stagnant Market Causes ExcessiveSales Force Turnover
A diagnostics imaging company pays its salespeople a 1 percent commis-sion on all sales up to the sales achieved in the same six-month period lastyear, and a 6 percent commission on sales growth over the base sales.Most of the salespeople’s earnings come from the growth component. Thisplan worked well during the first few years after a major product launch, assales grew smartly every year. However, as competitors launched similarproducts and the market became saturated, sales growth has slowed dra-matically. Most salespeople are not making much incentive money, andthere has been a steady exodus of the best salespeople, who have left towork for competitors and other medical device companies.
Paying on Sales That Salespeople Cannot Influence CreatesMorale Problems
A distributor of tools and maintenance equipment for automobiles sells toautomotive parts retailers, mobile tool dealers, and fleets. The companyhas a national accounts manager for major national accounts with central-ized buying (for example, Advance Auto Parts), and local territory sales-people who may service the local stores of national accounts and also sellto independently owned accounts within their territory. Local salespeopleearn commissions on all territory sales. This means that they sometimesreceive commissions on sales to outlets of national accounts that requirelittle or no effort on their part. As the sales to national accounts have in-creased, complaints of unfairness from salespeople who have few national
PAGE 185................. 15869$ $CH6 05-19-06 09:23:15 PS
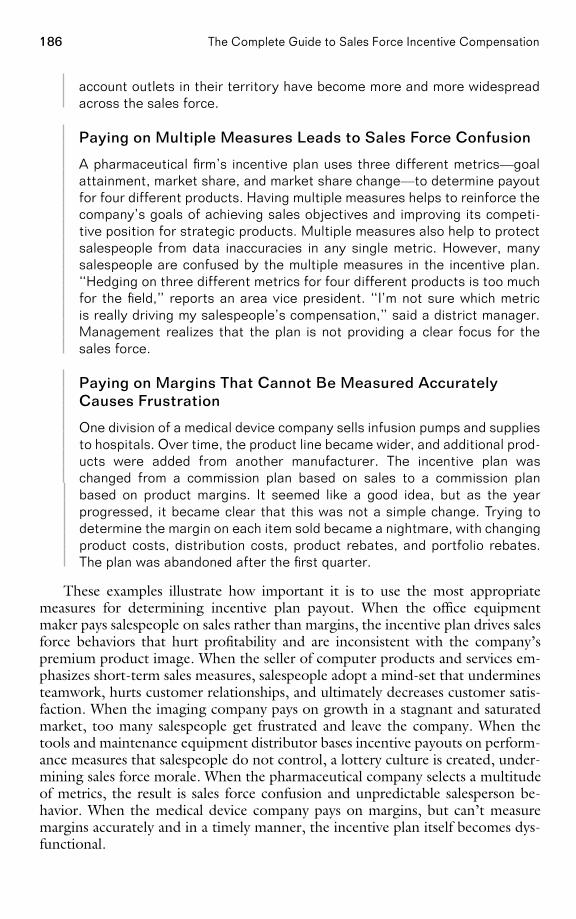
186 The Complete Guide to Sales Force Incentive Compensation
account outlets in their territory have become more and more widespreadacross the sales force.
Paying on Multiple Measures Leads to Sales Force Confusion
A pharmaceutical firm’s incentive plan uses three different metrics—goalattainment, market share, and market share change—to determine payoutfor four different products. Having multiple measures helps to reinforce thecompany’s goals of achieving sales objectives and improving its competi-tive position for strategic products. Multiple measures also help to protectsalespeople from data inaccuracies in any single metric. However, manysalespeople are confused by the multiple measures in the incentive plan.‘‘Hedging on three different metrics for four different products is too muchfor the field,’’ reports an area vice president. ‘‘I’m not sure which metricis really driving my salespeople’s compensation,’’ said a district manager.Management realizes that the plan is not providing a clear focus for thesales force.
Paying on Margins That Cannot Be Measured AccuratelyCauses Frustration
One division of a medical device company sells infusion pumps and suppliesto hospitals. Over time, the product line became wider, and additional prod-ucts were added from another manufacturer. The incentive plan waschanged from a commission plan based on sales to a commission planbased on product margins. It seemed like a good idea, but as the yearprogressed, it became clear that this was not a simple change. Trying todetermine the margin on each item sold became a nightmare, with changingproduct costs, distribution costs, product rebates, and portfolio rebates.The plan was abandoned after the first quarter.
These examples illustrate how important it is to use the most appropriatemeasures for determining incentive plan payout. When the office equipmentmaker pays salespeople on sales rather than margins, the incentive plan drives salesforce behaviors that hurt profitability and are inconsistent with the company’spremium product image. When the seller of computer products and services em-phasizes short-term sales measures, salespeople adopt a mind-set that underminesteamwork, hurts customer relationships, and ultimately decreases customer satis-faction. When the imaging company pays on growth in a stagnant and saturatedmarket, too many salespeople get frustrated and leave the company. When thetools and maintenance equipment distributor bases incentive payouts on perform-ance measures that salespeople do not control, a lottery culture is created, under-mining sales force morale. When the pharmaceutical company selects a multitudeof metrics, the result is sales force confusion and unpredictable salesperson be-havior. When the medical device company pays on margins, but can’t measuremargins accurately and in a timely manner, the incentive plan itself becomes dys-functional.
PAGE 186................. 15869$ $CH6 05-19-06 09:23:16 PS
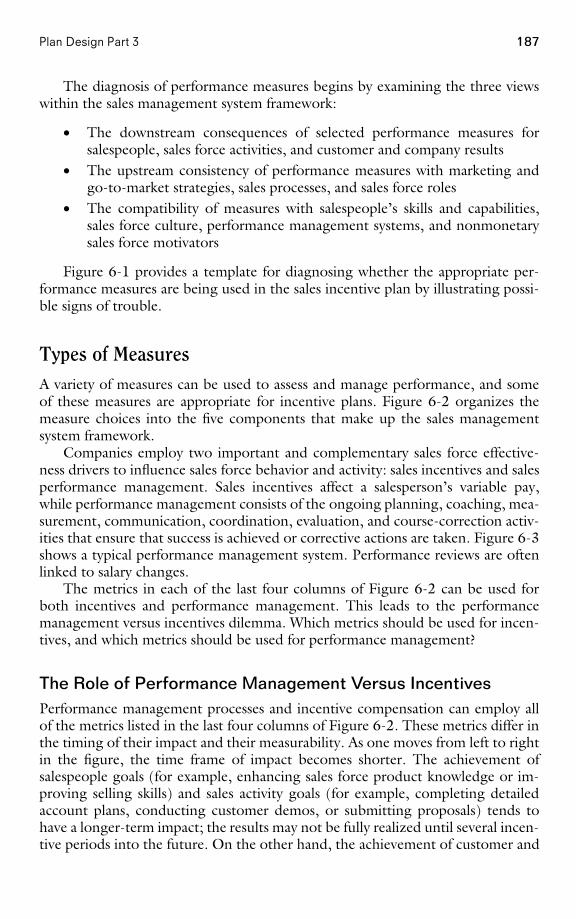
187Plan Design Part 3
The diagnosis of performance measures begins by examining the three viewswithin the sales management system framework:
• The downstream consequences of selected performance measures forsalespeople, sales force activities, and customer and company results
• The upstream consistency of performance measures with marketing andgo-to-market strategies, sales processes, and sales force roles
• The compatibility of measures with salespeople’s skills and capabilities,sales force culture, performance management systems, and nonmonetarysales force motivators
Figure 6-1 provides a template for diagnosing whether the appropriate per-formance measures are being used in the sales incentive plan by illustrating possi-ble signs of trouble.
Types of MeasuresA variety of measures can be used to assess and manage performance, and someof these measures are appropriate for incentive plans. Figure 6-2 organizes themeasure choices into the five components that make up the sales managementsystem framework.
Companies employ two important and complementary sales force effective-ness drivers to influence sales force behavior and activity: sales incentives and salesperformance management. Sales incentives affect a salesperson’s variable pay,while performance management consists of the ongoing planning, coaching, mea-surement, communication, coordination, evaluation, and course-correction activ-ities that ensure that success is achieved or corrective actions are taken. Figure 6-3shows a typical performance management system. Performance reviews are oftenlinked to salary changes.
The metrics in each of the last four columns of Figure 6-2 can be used forboth incentives and performance management. This leads to the performancemanagement versus incentives dilemma. Which metrics should be used for incen-tives, and which metrics should be used for performance management?
The Role of Performance Management Versus IncentivesPerformance management processes and incentive compensation can employ allof the metrics listed in the last four columns of Figure 6-2. These metrics differ inthe timing of their impact and their measurability. As one moves from left to rightin the figure, the time frame of impact becomes shorter. The achievement ofsalespeople goals (for example, enhancing sales force product knowledge or im-proving selling skills) and sales activity goals (for example, completing detailedaccount plans, conducting customer demos, or submitting proposals) tends tohave a longer-term impact; the results may not be fully realized until several incen-tive periods into the future. On the other hand, the achievement of customer and
PAGE 187................. 15869$ $CH6 05-19-06 09:23:16 PS
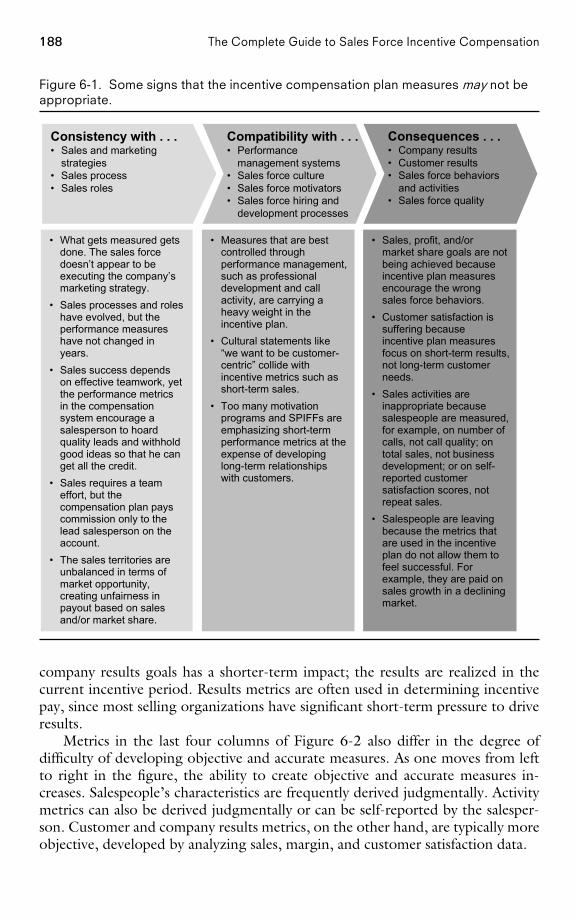
188 The Complete Guide to Sales Force Incentive Compensation
Figure 6-1. Some signs that the incentive compensation plan measures may not beappropriate.
• What gets measured getsdone. The sales forcedoesn’t appear to beexecuting the company’smarketing strategy.
• Sales processes and roleshave evolved, but theperformance measureshave not changed inyears.
• Sales success dependson effective teamwork, yetthe performance metricsin the compensationsystem encourage asalesperson to hoardquality leads and withholdgood ideas so that he canget all the credit.
• Sales requires a teameffort, but thecompensation plan payscommission only to thelead salesperson on theaccount.
• The sales territories areunbalanced in terms ofmarket opportunity,creating unfairness inpayout based on salesand/or market share.
• Measures that are bestcontrolled throughperformance management,such as professionaldevelopment and callactivity, are carrying aheavy weight in theincentive plan.
• Cultural statements like“we want to be customer-centric” collide withincentive metrics such asshort-term sales.
• Too many motivationprograms and SPIFFs areemphasizing short-termperformance metrics at theexpense of developinglong-term relationshipswith customers.
• Sales, profit, and/ormarket share goals are notbeing achieved becauseincentive plan measuresencourage the wrongsales force behaviors.
• Customer satisfaction issuffering becauseincentive plan measuresfocus on short-term results,not long-term customerneeds.
• Sales activities areinappropriate becausesalespeople are measured,for example, on number ofcalls, not call quality; ontotal sales, not businessdevelopment; or on self-reported customersatisfaction scores, notrepeat sales.
• Salespeople are leavingbecause the metrics thatare used in the incentiveplan do not allow them tofeel successful. Forexample, they are paid onsales growth in a decliningmarket.
Compatibility with . . .• Performance
management systems• Sales force culture• Sales force motivators• Sales force hiring and
development processes
Consequences . . .• Company results• Customer results• Sales force behaviors
and activities• Sales force quality
Consistency with . . .• Sales and marketing
strategies• Sales process• Sales roles
company results goals has a shorter-term impact; the results are realized in thecurrent incentive period. Results metrics are often used in determining incentivepay, since most selling organizations have significant short-term pressure to driveresults.
Metrics in the last four columns of Figure 6-2 also differ in the degree ofdifficulty of developing objective and accurate measures. As one moves from leftto right in the figure, the ability to create objective and accurate measures in-creases. Salespeople’s characteristics are frequently derived judgmentally. Activitymetrics can also be derived judgmentally or can be self-reported by the salesper-son. Customer and company results metrics, on the other hand, are typically moreobjective, developed by analyzing sales, margin, and customer satisfaction data.
PAGE 188................. 15869$ $CH6 05-19-06 09:23:17 PS
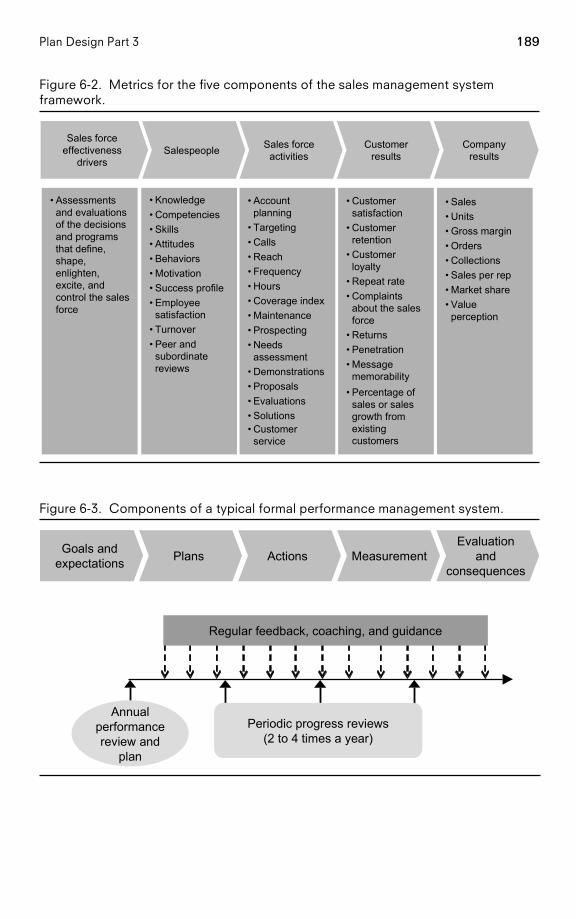
189Plan Design Part 3
Figure 6-2. Metrics for the five components of the sales management systemframework.
Sales forceeffectiveness
driversSalespeople Sales force
activitiesCustomer
resultsCompany
results
• Assessmentsand evaluationsof the decisionsand programsthat define,shape,enlighten,excite, andcontrol the salesforce
• Knowledge• Competencies• Skills• Attitudes• Behaviors• Motivation• Success profile• Employee
satisfaction• Turnover• Peer and
subordinatereviews
• Accountplanning
• Targeting• Calls• Reach• Frequency• Hours• Coverage index• Maintenance• Prospecting• Needs
assessment• Demonstrations• Proposals• Evaluations• Solutions• Customer
service
• Customersatisfaction
• Customerretention
• Customerloyalty
• Repeat rate• Complaints
about the salesforce
• Returns• Penetration• Message
memorability• Percentage of
sales or salesgrowth fromexistingcustomers
• Sales• Units• Gross margin• Orders• Collections• Sales per rep• Market share• Value
perception
Figure 6-3. Components of a typical formal performance management system.
Goals andexpectations Plans Actions Measurement
Evaluationand
consequences
Periodic progress reviews(2 to 4 times a year)
Annualperformancereview and
plan
Regular feedback, coaching, and guidance
PAGE 189................. 15869$ $CH6 05-19-06 09:23:19 PS
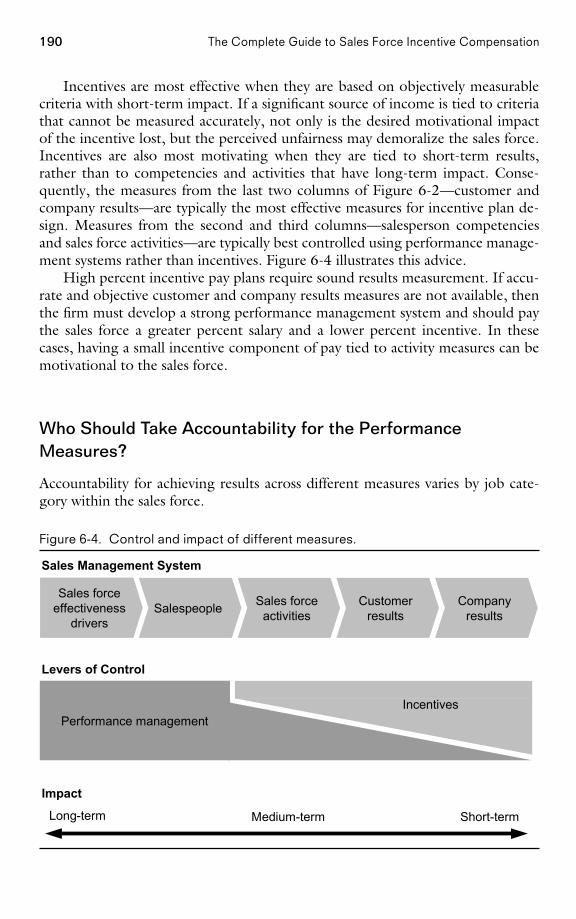
190 The Complete Guide to Sales Force Incentive Compensation
Incentives are most effective when they are based on objectively measurablecriteria with short-term impact. If a significant source of income is tied to criteriathat cannot be measured accurately, not only is the desired motivational impactof the incentive lost, but the perceived unfairness may demoralize the sales force.Incentives are also most motivating when they are tied to short-term results,rather than to competencies and activities that have long-term impact. Conse-quently, the measures from the last two columns of Figure 6-2—customer andcompany results—are typically the most effective measures for incentive plan de-sign. Measures from the second and third columns—salesperson competenciesand sales force activities—are typically best controlled using performance manage-ment systems rather than incentives. Figure 6-4 illustrates this advice.
High percent incentive pay plans require sound results measurement. If accu-rate and objective customer and company results measures are not available, thenthe firm must develop a strong performance management system and should paythe sales force a greater percent salary and a lower percent incentive. In thesecases, having a small incentive component of pay tied to activity measures can bemotivational to the sales force.
Who Should Take Accountability for the PerformanceMeasures?
Accountability for achieving results across different measures varies by job cate-gory within the sales force.
Figure 6-4. Control and impact of different measures.
Sales Management System
Levers of Control
Performance managementIncentives
Sales forceeffectiveness
driversSalespeople Sales force
activitiesCustomer
resultsCompany
results
Long-term Medium-term Short-term
Impact
PAGE 190................. 15869$ $CH6 05-19-06 09:23:20 PS
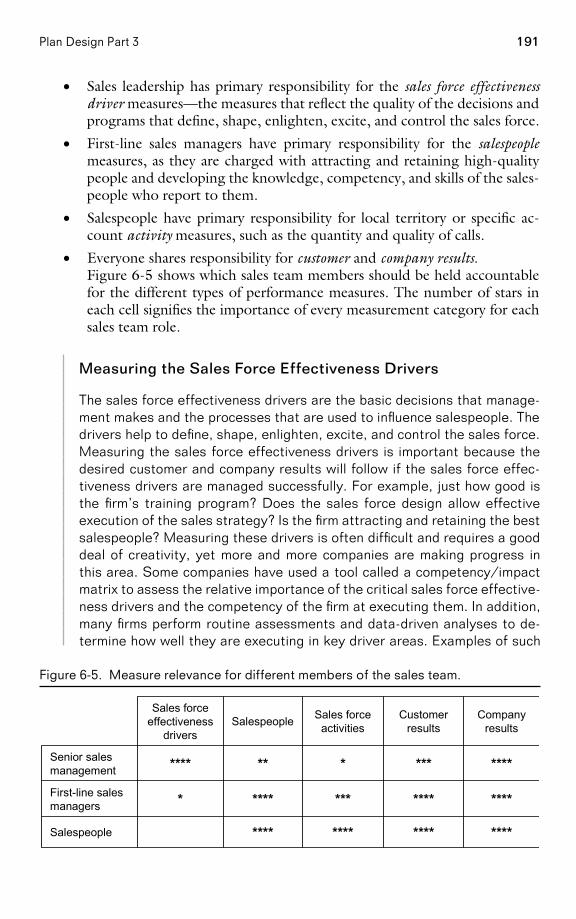
191Plan Design Part 3
• Sales leadership has primary responsibility for the sales force effectivenessdriver measures—the measures that reflect the quality of the decisions andprograms that define, shape, enlighten, excite, and control the sales force.
• First-line sales managers have primary responsibility for the salespeoplemeasures, as they are charged with attracting and retaining high-qualitypeople and developing the knowledge, competency, and skills of the sales-people who report to them.
• Salespeople have primary responsibility for local territory or specific ac-count activity measures, such as the quantity and quality of calls.
• Everyone shares responsibility for customer and company results.Figure 6-5 shows which sales team members should be held accountablefor the different types of performance measures. The number of stars ineach cell signifies the importance of every measurement category for eachsales team role.
Measuring the Sales Force Effectiveness Drivers
The sales force effectiveness drivers are the basic decisions that manage-ment makes and the processes that are used to influence salespeople. Thedrivers help to define, shape, enlighten, excite, and control the sales force.Measuring the sales force effectiveness drivers is important because thedesired customer and company results will follow if the sales force effec-tiveness drivers are managed successfully. For example, just how good isthe firm’s training program? Does the sales force design allow effectiveexecution of the sales strategy? Is the firm attracting and retaining the bestsalespeople? Measuring these drivers is often difficult and requires a gooddeal of creativity, yet more and more companies are making progress inthis area. Some companies have used a tool called a competency/impactmatrix to assess the relative importance of the critical sales force effective-ness drivers and the competency of the firm at executing them. In addition,many firms perform routine assessments and data-driven analyses to de-termine how well they are executing in key driver areas. Examples of such
Figure 6-5. Measure relevance for different members of the sales team.
****************Salespeople
****************First-line salesmanagers
**************Senior salesmanagement
Companyresults
Customerresults
Sales forceactivitiesSalespeople
Sales forceeffectiveness
drivers
PAGE 191................. 15869$ $CH6 05-19-06 09:23:21 PS
192 The Complete Guide to Sales Force Incentive Compensation
assessments and analyses for measuring the effectiveness of the salescompensation effectiveness driver are discussed in Chapter 2. Sales forceeffectiveness driver measures should be part of the firm’s performancemanagement process for the sales leadership team.
How to Determine the Most Appropriate Sales IncentiveMeasures: An Advisory
The best incentive plan performance measures share several common characteris-tics.
• Effective incentive plan performance measures pass the consistency, com-patibility, and consequence test (the 3 Cs test).
• They are objectively and accurately measurable.
• They are influenced by sales force capability and activity.
• They do not favor any particular group within the sales force.
• They are adaptive to business strategy change.
• Effective incentive plans use a limited number of performance measuresto encourage sales force focus and understanding.
Effective Incentive Plan Performance MeasuresPass the 3 Cs Test
The selected incentive plan measures need to be consistent with company market-ing and go-to-market strategies as well as with the sales roles that have been de-fined by the desired selling process. The measures need to be compatible with theother sales force effectiveness drivers, such as performance management systemsand sales force culture. In addition, the measures should not produce unwantedbehaviors and activities in the field that lead to substandard sales and profit results.A quick qualitative upstream look for consistency, a downstream look for appro-priate consequences, and an alignment check for compatibility help sales leadersspot inappropriate measures (see Figure 6-1).
Powerful Incentive Plan Performance Measures Link BusinessStrategy to Sales Force Activity
Selecting incentive plan metrics is a powerful way to align sales force activ-ities with company goals and strategies. For example, a company with highgrowth aspirations rewards salespeople for sales growth over the prioryear. A company that is attacking the market leader rewards salespeople
PAGE 192................. 15869$ $CH6 05-19-06 09:23:22 PS
193Plan Design Part 3
for competitive wins or market share growth. A sales force that is sellingmature, profit-producing products rewards its salespeople for customer re-tention and contribution.
Effective Incentive Plan Performance Measures AreObjectively and Accurately MeasurableMeasurability of the selected performance criteria is critical to the success of anyincentive-based plan. If it is not possible to measure performance accurately, thenit is impossible to pay fairly on that performance. The less accurate and moresubjective the measure, the less desirable it is to reward salespeople with incentivepay based on that measure. When salespeople perceive performance measurementto be unfair, the desired motivational impact of the incentive is lost. Salespeoplewill spend their time arguing about measures or trying to game the system insteadof focusing on customers. The entire incentive plan may backfire, causing lowsales force morale and unwanted turnover.
Data Inaccuracies Prevent a Firm From Paying Incentives onTerritory Market Share
A firm has a strategic objective of increasing market share in a competitivemarket, and the sales force plays an important role in achieving this objec-tive. In order to align sales force effort with company strategy, manage-ment desires to pay salespeople incentives for increasing market sharewithin their territory. However, market share data is based on a sampleand is reliable only at a regional level—in most geographic markets, thesample size is not large enough to provide accurate territory-level results.Consequently, the company continues to pay incentives based on individualterritory sales, but also pays a bonus to salespeople in regions that in-crease market share.
Effective Incentive Plan Performance Measures Should BeAffected by Sales Force Capability and ActivityCausality, or the ability of individual salespeople to affect short-term results, is animportant consideration in the selection of the performance measures that willdetermine incentive pay. Salespeople should be able to affect the measures thatwill be used to evaluate and reward them. If factors other than current sales forceskills, capabilities, and effort have a large impact on a measure, then the motiva-tional impact of that measure is weakened. For example, a sales force withoutpricing authority has more influence over sales than it does over contribution.Paying salespeople for contribution might create frustration, since the sales forcedoes not influence a significant aspect of the measure. Finding performance mea-sures with high sales force causality can be problematic in team-selling environ-ments, where multiple salespeople often influence results.
PAGE 193................. 15869$ $CH6 05-19-06 09:23:22 PS
194 The Complete Guide to Sales Force Incentive Compensation
Pharmaceutical Company Pays on Units, Not Dollars
The incentive plan for the salespeople who call on physicians for a specialtypharmaceuticals manufacturer pays on unit sales rather than dollar sales.This is because the price that customers pay for drugs is heavily influencedby third-party payers, such as insurance companies or public aid programs(Medicare and Medicaid). Thus, the salespeople who educate physiciansabout the therapeutic qualities of the firm’s drugs have greater control overthe units sold in their territory than they do over the dollars.
Effective Incentive Plan Performance Measures Do Not FavorAny Particular Group
The performance measures in an incentive plan should be fair; they should notfavor specific territories, accounts, or salespeople with particular characteristicsthat are outside a salesperson’s control. For example:
• An activity metric such as ‘‘calls per day’’ favors salespeople in urban terri-tories with little drive time between calls, while penalizing those in ruralterritories with significant travel requirements
• A sales volume metric favors salespeople in territories with large marketpotential and penalizes those with fewer opportunities
• A market share metric favors salespeople in territories with low marketpotential, who have time to penetrate every account deeply, and penalizesthose with too many opportunities to cover effectively.
To compensate for differences across sales territories, companies frequently setterritory-specific goals and base incentive pay on goal attainment. For example, asalesperson in a high-potential territory gets a larger sales goal than one in a low-potential territory, so that equal sales skill, salesperson capabilities, and effort ineach territory result in the same level of goal attainment and thus the same incen-tive pay. However, goal-setting processes can also have biases. Figure 6-6 showsdata from a sales force with a goal-based plan that was biased toward territorieswith higher starting market share. Processes for overcoming goal-setting biasesare discussed in Chapter 9.
Effective Incentive Plan Performance Measures Are Adaptiveto Business Strategy Change
Chapter 1 discussed the need to adapt incentive plans over time as markets andcompany strategies evolve. Performance measures are an important aspect of thisevolution. For example, Figure 6-7 shows how the measures in the firm’s com-
PAGE 194................. 15869$ $CH6 05-19-06 09:23:23 PS
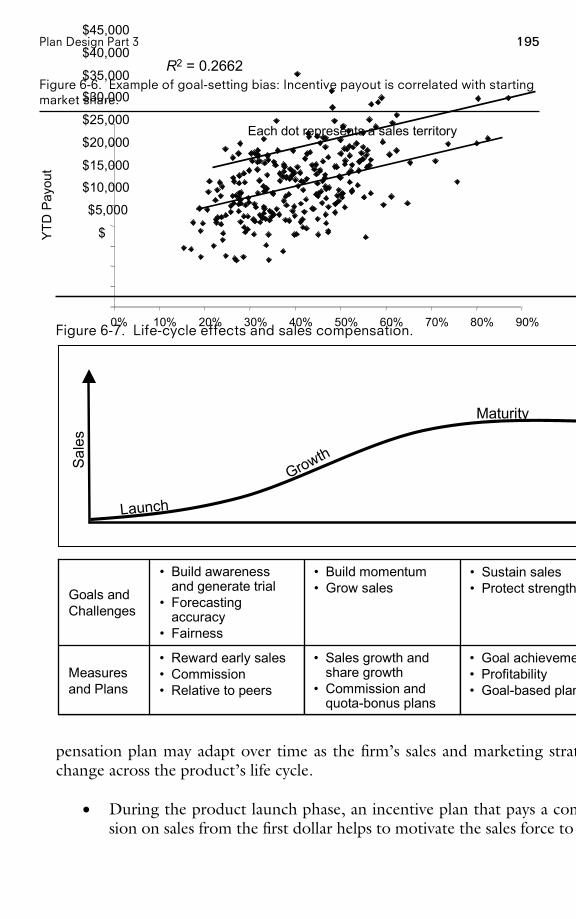
195Plan Design Part 3
Figure 6-6. Example of goal-setting bias: Incentive payout is correlated with startingmarket share.
Each dot represents a sales territory
0% 10% 20% 30% 40% 50% 60% 70% 80% 90%
Starting Market Share
YTD
Pay
out
$5,000
$10,000
$15,000
$20,000
$25,000
$30,000$35,000
$40,000
$45,000
$
R2 = 0.2662
Figure 6-7. Life-cycle effects and sales compensation.
Sale
s
Launch
Growth
Maturity
• Goal achievement• Profitability• Goal-based plans
• Sales growth andshare growth
• Commission andquota-bonus plans
• Reward early sales• Commission• Relative to peers
Measuresand Plans
• Sustain sales• Protect strengths
• Build momentum• Grow sales
• Build awarenessand generate trial
• Forecastingaccuracy
• Fairness
Goals andChallenges
pensation plan may adapt over time as the firm’s sales and marketing strategieschange across the product’s life cycle.
• During the product launch phase, an incentive plan that pays a commis-sion on sales from the first dollar helps to motivate the sales force to work
PAGE 195................. 15869$ $CH6 05-19-06 09:23:25 PS
196 The Complete Guide to Sales Force Incentive Compensation
hard to generate trial among customers without requiring accurate fore-casting by the company.
• During the product’s growth phase, an incentive compensation plan thatrewards growth helps reinforce key company objectives. Tying incentivepayout at least in part to the accomplishment of individual sales goals isalso effective, since the firm’s ability to forecast sales accurately increasessignificantly as the firm gains experience in the market.
• During a product’s maturity phase, effective sales incentive plan measuresare often goal-based, rewarding sales retention and profitability.
The Cost of Not Adapting the Incentive Plan PerformanceMeasures Between the Growth and Maturity Stages of aProduct’s Life Cycle
Recall the diagnostics imaging company from the introduction to this chap-ter. The company paid its salespeople a commission on sales growth overthe prior year, despite the fact that the firm’s market share was decliningin a stagnant market. The sales force could not grow sales despite its hardwork. Salespeople could not make any money, and therefore they startedto leave the company. Eventually, the company adjusted the pay plan topay on sales retention rather than growth.
Keep It Simple: Have No More than Three orFour Total Measures
New measures and features tend to be forced into plans as new objectives andinitiatives emerge. For example, new products get launched, business develop-ment needs more focus, and product managers ask for unique incentive levers toget the sales force to pay attention to their products. In addition, sometimescompanies use multiple measures to increase the objectivity and fairness of a plan.For example, many firms have weighted plans that determine incentive payout bycalculating a weighted average of performance across several metrics, includingsales of different products, gross margin, market share, customer satisfaction, ac-tivity, and salesperson-specific objectives or key performance measures. More in-formation about such plans is included in Chapter 7.
Having too many measures in an incentive plan can be confusing for a salesforce, since multiple measures can send mixed signals about company strategy anddirection. Salespeople may question which metric is most important or may worrytoo much about the company’s expectations, rather than taking care of customers.Incentives based upon too many measures lose impact. For example, if a salesforce that earns 30 percent of its cash compensation as variable pay has a plan with10 equally weighted measures, each measure contributes just 3 percent to the
PAGE 196................. 15869$ $CH6 05-19-06 09:23:26 PS
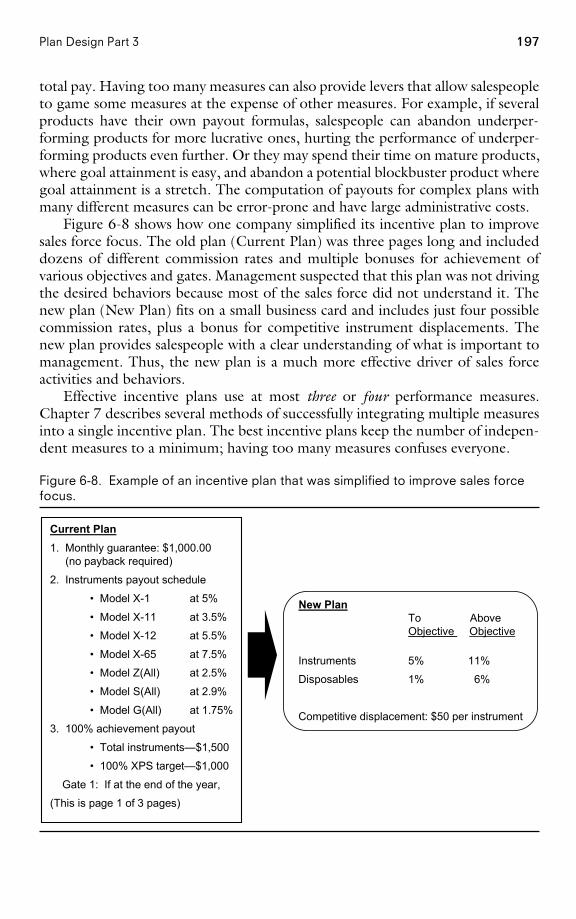
197Plan Design Part 3
total pay. Having too many measures can also provide levers that allow salespeopleto game some measures at the expense of other measures. For example, if severalproducts have their own payout formulas, salespeople can abandon underper-forming products for more lucrative ones, hurting the performance of underper-forming products even further. Or they may spend their time on mature products,where goal attainment is easy, and abandon a potential blockbuster product wheregoal attainment is a stretch. The computation of payouts for complex plans withmany different measures can be error-prone and have large administrative costs.
Figure 6-8 shows how one company simplified its incentive plan to improvesales force focus. The old plan (Current Plan) was three pages long and includeddozens of different commission rates and multiple bonuses for achievement ofvarious objectives and gates. Management suspected that this plan was not drivingthe desired behaviors because most of the sales force did not understand it. Thenew plan (New Plan) fits on a small business card and includes just four possiblecommission rates, plus a bonus for competitive instrument displacements. Thenew plan provides salespeople with a clear understanding of what is important tomanagement. Thus, the new plan is a much more effective driver of sales forceactivities and behaviors.
Effective incentive plans use at most three or four performance measures.Chapter 7 describes several methods of successfully integrating multiple measuresinto a single incentive plan. The best incentive plans keep the number of indepen-dent measures to a minimum; having too many measures confuses everyone.
Figure 6-8. Example of an incentive plan that was simplified to improve sales forcefocus.
Current Plan1. Monthly guarantee: $1,000.00 (no payback required)
2. Instruments payout schedule
• Model X-1 at 5%
• Model X-11 at 3.5%
• Model X-12 at 5.5%
• Model X-65 at 7.5%
• Model Z(All) at 2.5%
• Model S(All) at 2.9%
• Model G(All) at 1.75%
3. 100% achievement payout
• Total instruments—$1,500
• 100% XPS target—$1,000
Gate 1: If at the end of the year,
(This is page 1 of 3 pages)
New PlanTo AboveObjective Objective
Instruments 5% 11%
Disposables 1% 6%
Competitive displacement: $50 per instrument
PAGE 197................. 15869$ $CH6 05-19-06 09:23:28 PS
198 The Complete Guide to Sales Force Incentive Compensation
Simplifying Sales Incentive Plans at IBM
In 1995, an IBM task force took on the massive project of revamping thecompany’s worldwide sales incentive compensation plan to better alignwith a new global strategy. One of the major challenges that the task forcefaced was that the current sales compensation plans in many countries anddivisions suffered from what IBM executives called ‘‘incentive plan obe-sity.’’ Sales leaders in many IBM divisions managed the sales force bythrowing money at every problem. Corporate provided its own set of incen-tive measures, such as revenue or market share, and then divisional salesleaders would add their own sales contests onto those measures to focussalespeople on specific regional objectives. IBM salespeople were torn be-tween as many as 20 different performance measurements, and focus wastaken away from the customer. In some instances, bonuses were awardedfor responsibilities that should have been covered by base salary. The newglobal plan that resulted from the task force’s efforts utilized a relevantcollection of worldwide performance metrics. To reduce plan complexity,the total number of measures in any single plan was limited to 10.
How to Determine the Most Appropriate Sales IncentiveMeasures: Specifics
The wide variety of evaluative criteria or measures that can be used to assess salesforce performance and determine incentive payment is illustrated in the two in-centive compensation plans summarized in Figure 6-9.
The measures used to determine the incentive payout in these two plans differin several important ways. First, the plans use different metrics. Plan A uses terri-tory sales to determine incentive payout, while Plan B uses territory gross margin.A territory sales metric says to the sales force, ‘‘Sell!’’ while a gross margin metricsays, ‘‘Sell profitable product lines at the highest possible price.’’ Incentive planscan incorporate many different performance metrics. Most firms use sales as theirmost important metric. Other common metrics include company results metricslike gross margin and market share, customer-oriented metrics like customer satis-faction and repeat rate, sales force activity metrics such as number of calls andproposals, and salesperson capability metrics such as skills and knowledge.
Plans A and B also differ in their data view. Plan A determines payout basedon sales, beginning with the first dollar sold; it is the absolute level of sales that isimportant. With Plan B, payout is determined by comparing territory performanceto a territory objective that was established ahead of time; it is the comparisonwith the expectation that is important. Plan B can motivate a sales force to achievechallenging goals, provided that the firm sets goals that are achievable. Plan Amay be more appropriate in environments where accurate goal setting is not possi-ble. In addition to absolute performance and percent of goal attainment, data
PAGE 198................. 15869$ $CH6 05-19-06 09:23:28 PS
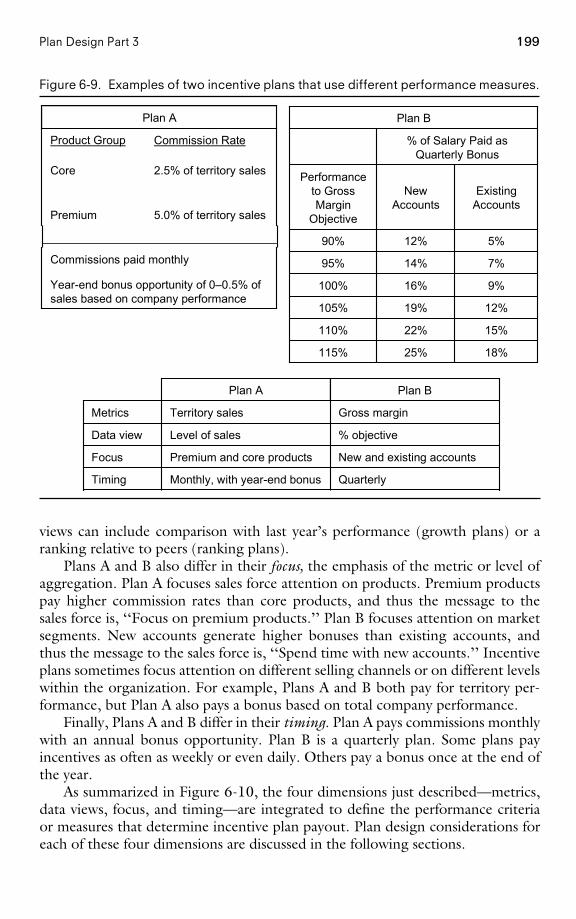
199Plan Design Part 3
Figure 6-9. Examples of two incentive plans that use different performance measures.
18%25%115%
15%22%110%
12%19%105%
9%16%100%
7%14%95%
5%12%90%
ExistingAccounts
NewAccounts
Performanceto GrossMargin
Objective
% of Salary Paid asQuarterly Bonus
Plan B
Commissions paid monthly
Year-end bonus opportunity of 0–0.5% ofsales based on company performance
5.0% of territory salesPremium
2.5% of territory salesCore
Commission RateProduct Group
Plan A
QuarterlyMonthly, with year-end bonusTiming
New and existing accountsPremium and core productsFocus
% objectiveLevel of salesData view
Gross marginTerritory salesMetrics
Plan BPlan A
views can include comparison with last year’s performance (growth plans) or aranking relative to peers (ranking plans).
Plans A and B also differ in their focus, the emphasis of the metric or level ofaggregation. Plan A focuses sales force attention on products. Premium productspay higher commission rates than core products, and thus the message to thesales force is, ‘‘Focus on premium products.’’ Plan B focuses attention on marketsegments. New accounts generate higher bonuses than existing accounts, andthus the message to the sales force is, ‘‘Spend time with new accounts.’’ Incentiveplans sometimes focus attention on different selling channels or on different levelswithin the organization. For example, Plans A and B both pay for territory per-formance, but Plan A also pays a bonus based on total company performance.
Finally, Plans A and B differ in their timing. Plan A pays commissions monthlywith an annual bonus opportunity. Plan B is a quarterly plan. Some plans payincentives as often as weekly or even daily. Others pay a bonus once at the end ofthe year.
As summarized in Figure 6-10, the four dimensions just described—metrics,data views, focus, and timing—are integrated to define the performance criteriaor measures that determine incentive plan payout. Plan design considerations foreach of these four dimensions are discussed in the following sections.
PAGE 199................. 15869$ $CH6 05-19-06 09:23:29 PS
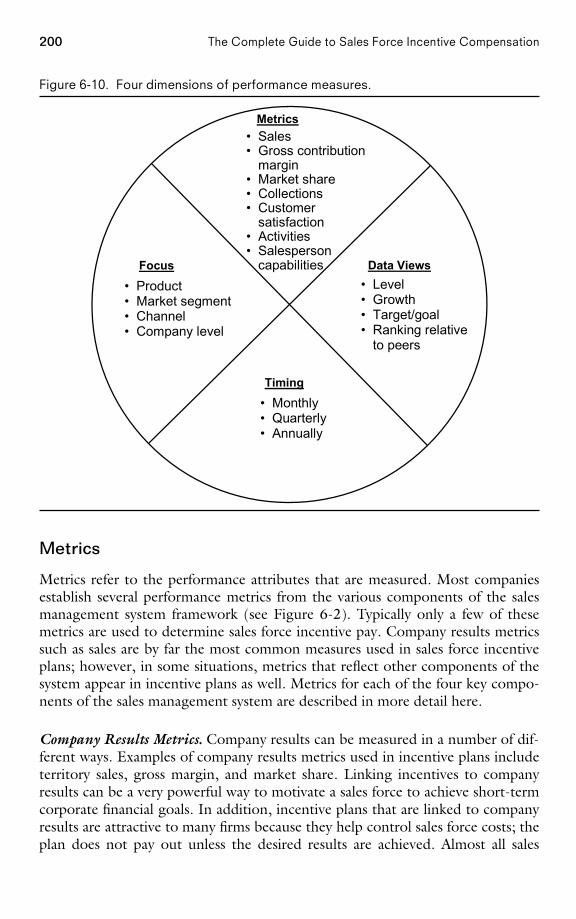
200 The Complete Guide to Sales Force Incentive Compensation
Figure 6-10. Four dimensions of performance measures.
• Sales• Gross contribution
margin• Market share• Collections• Customer
satisfaction• Activities• Salesperson
capabilities
• Monthly• Quarterly• Annually
• Product• Market segment• Channel• Company level
Metrics
Focus
Timing
• Level• Growth• Target/goal• Ranking relative
to peers
Data Views
Metrics
Metrics refer to the performance attributes that are measured. Most companiesestablish several performance metrics from the various components of the salesmanagement system framework (see Figure 6-2). Typically only a few of thesemetrics are used to determine sales force incentive pay. Company results metricssuch as sales are by far the most common measures used in sales force incentiveplans; however, in some situations, metrics that reflect other components of thesystem appear in incentive plans as well. Metrics for each of the four key compo-nents of the sales management system are described in more detail here.
Company Results Metrics. Company results can be measured in a number of dif-ferent ways. Examples of company results metrics used in incentive plans includeterritory sales, gross margin, and market share. Linking incentives to companyresults can be a very powerful way to motivate a sales force to achieve short-termcorporate financial goals. In addition, incentive plans that are linked to companyresults are attractive to many firms because they help control sales force costs; theplan does not pay out unless the desired results are achieved. Almost all sales
PAGE 200................. 15869$ $CH6 05-19-06 09:23:30 PS
201Plan Design Part 3
incentive programs tie the majority of sales force incentive compensation to com-pany results metrics. In the Sales Incentive Executive Education Survey (intro-duced in Chapter 4), for over 95 percent of the sales forces, at least a portion ofincentive pay was based on company results metrics; for 55 percent of the salesforces, 100 percent of incentive pay was based on company results metrics.
Company results metrics can apply to all roles within the sales force. A sales-person is rewarded for results at the territory or account level, a district managerfor results at the district level, and so on up the sales organization chart. Havingconsistency of metrics across the various levels can be a very powerful way to focussales force attention on the metrics that are most important for company success.
Sales force incentives based on company results metrics are most effective inselling environments with most or all of the following characteristics:
• It is possible to measure results accurately at the territory or account level.• Sales are determined primarily by the skill, motivation, and effort of the
individual salesperson.• Salespeople have a very good understanding of the activities that drive
sales success; they are highly qualified and well trained, and they haveintimate knowledge of what approach works best with each of their ac-counts.
• Management has a strong empowerment focus; it feels that salespeopleare closest to the customer and should therefore be empowered to deter-mine the appropriate activity and held accountable for company results.
• Management feels that salespeople should assume the risk for the attain-ment of results and for their own success.
• There is a ‘‘pay-for-performance’’ culture.• Salespeople value extrinsically based motivators like money and recogni-
tion more than they do intrinsically based motivators like job satisfactionand personal growth.
The particular company results metric chosen for an incentive plan usuallyreflects a firm’s strategy. The rationale for choosing three common company re-sults metrics—sales, contribution, and market share—is described here.
Sales Revenue Metrics. Sales is the most commonly used incentive plan metric.Top management promises sales to the shareholders, often specifying the level ofsales that can be expected in the next quarter and/or the next year. Delivering onthis ‘‘sales promise’’ becomes the responsibility of the sales force. As a result, it islogical that sales metrics should be used to judge sales force performance. Sales isusually also the least complicated of all the company results metrics to measure atthe territory or account level, and it is easy for the sales force to understand. Inaddition, since a salesperson’s job is to create sales, it is typically the companyresults metric that salespeople have the most influence over. In the Sales IncentiveExecutive Education Survey, for 88 percent of the sales forces, some part of incen-tive pay was based on sales metrics (revenue or revenue growth).
PAGE 201................. 15869$ $CH6 05-19-06 09:23:30 PS
202 The Complete Guide to Sales Force Incentive Compensation
Contribution Margin and Profit Metrics. Contribution margin can be an effectiveincentive plan metric for firms focusing on profitability. Paying for contributionmargin encourages salespeople to focus on profitable customers and product lines.It also discourages price cutting in sales forces that have pricing authority. Inaddition, salespeople with such an incentive plan are more likely to exercise ex-pense control. In the Sales Incentive Executive Education Survey, 23 percent ofthe sales forces had some part of their incentive pay based on profit metrics (profitor profit growth).
Office Equipment Maker Revamps Compensation Plan toStress Profitability
Recall the office equipment maker from the introduction to this chapter.The sales force was booking almost no sales at list price, despite the factthat the firm’s products were widely recognized to be superior to thoseof its competitors. Since salespeople were paid on sales volume (and notcontribution margin), there was little incentive for them to think in terms ofprofitability. In an effort to discourage discounting, the company restruc-tured its commission plan. A variable commission schedule was developed:a sliding scale that paid 1/2 of a percent of sales for orders booked at 40percent off list price, 2.5 percent for those at 20 percent off list, and 6percent for business sold at list price. This change had a dramatic impacton profitability. In the first year, the average discount dropped from 25percent to 18 percent. Approximately 40 percent of orders were bookedat list price versus virtually none before. Largely because of this, profitsincreased by $10 million. Successful salespeople earned 12 percent morecommission, yet compensation costs as a percent of gross margin de-clined.
Figure 6-11 shows an incentive plan that bases payout on increase in grossmargin over last year. To encourage the sales force to spend time on certain strate-gic products, gross margin on these products gets double weight in the net gainformula. Since the quarterly payouts are based on year-to-date growth, part of thequarterly commissions are held back and paid out at the end of the year as a fifth-quarter bonus to help ensure that salespeople who start the year strong but finishweak do not owe the firm money at the end of the year.
One of the challenges of paying on territory gross margin is getting the mea-surement right and gaining sales force understanding and acceptance of the mea-sure.
Understandability of Measures Is Important
In an effort to drive profitability, a lease financing firm changed its revenue-based sales incentive plan to a profit-based plan. The new plan did getsalespeople to focus more on the profitability of transactions. However, theterritory-level profit calculations were complex and difficult for the sales
PAGE 202................. 15869$ $CH6 05-19-06 09:23:31 PS
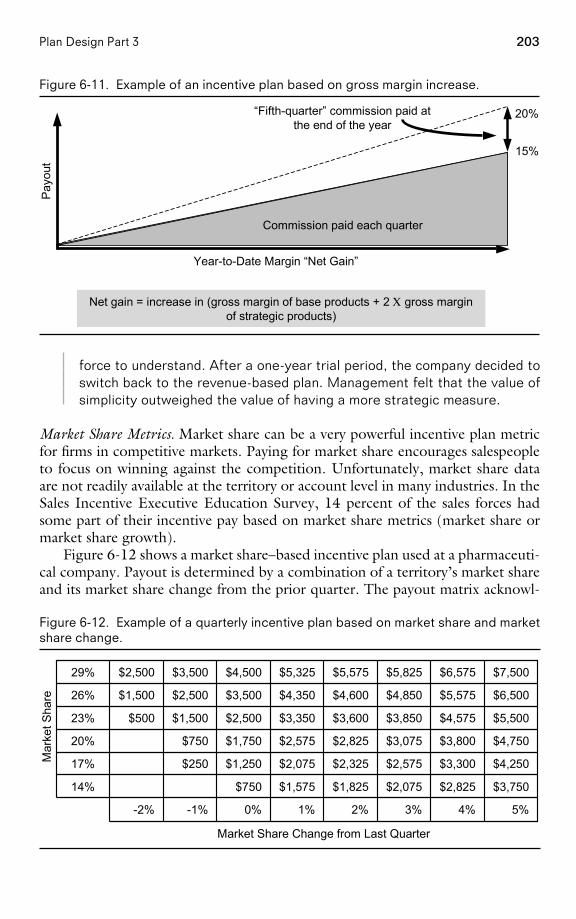
203Plan Design Part 3
Figure 6-11. Example of an incentive plan based on gross margin increase.
Net gain = increase in (gross margin of base products + 2 Χ gross marginof strategic products)
Pay
out
Year-to-Date Margin “Net Gain”
15%
20%
Commission paid each quarter
“Fifth-quarter” commission paid atthe end of the year
force to understand. After a one-year trial period, the company decided toswitch back to the revenue-based plan. Management felt that the value ofsimplicity outweighed the value of having a more strategic measure.
Market Share Metrics. Market share can be a very powerful incentive plan metricfor firms in competitive markets. Paying for market share encourages salespeopleto focus on winning against the competition. Unfortunately, market share dataare not readily available at the territory or account level in many industries. In theSales Incentive Executive Education Survey, 14 percent of the sales forces hadsome part of their incentive pay based on market share metrics (market share ormarket share growth).
Figure 6-12 shows a market share–based incentive plan used at a pharmaceuti-cal company. Payout is determined by a combination of a territory’s market shareand its market share change from the prior quarter. The payout matrix acknowl-
Figure 6-12. Example of a quarterly incentive plan based on market share and marketshare change.
Market Share Change from Last Quarter
5%4%3%2%1%0%-1%-2%
$3,750$2,825$2,075$1,825$1,575$75014%
$4,250$3,300$2,575$2,325$2,075$1,250$25017%
$4,750$3,800$3,075$2,825$2,575$1,750$75020%
$5,500$4,575$3,850$3,600$3,350$2,500$1,500$50023%
$6,500$5,575$4,850$4,600$4,350$3,500$2,500$1,50026%
$7,500$6,575$5,825$5,575$5,325$4,500$3,500$2,50029%
Mar
ket S
hare
PAGE 203................. 15869$ $CH6 05-19-06 09:23:33 PS
204 The Complete Guide to Sales Force Incentive Compensation
edges the assumption that for this product, more sales effort is required to grow(or not lose) market share in a high-share territory than in a low-share territory.For example, a salesperson who maintains a 29 percent market share earns morecommission than someone who grows market share from 23 percent to 26 per-cent.
Customer Results Metrics. Common customer results metrics include customersatisfaction, customer retention and repeat rates, and customer returns or com-plaints. The use of customer results metrics in a sales incentive plan can helpreinforce a culture with a strong customer focus. ‘‘What gets measured getsdone,’’ said William Hewlett, co-founder of Hewlett-Packard Company. If thecompany wants to ‘‘put the customer first’’ and get competitive advantage fromits customer relationships, then it is logical to make the sales compensation planconsistent with this objective by rewarding salespeople for customer results. Inaddition, customer results measures may be a better reflection of a salesperson’ssuccess than company results measures. Company results such as sales, profits, andmarket share are affected by many factors that are not under the salesperson’sdirect control, including the economy, market conditions, and competition. Well-designed customer results measures can isolate the true salesperson impact on thecustomer.
Customer results metrics are particularly relevant in selling environments withsome or all of the following characteristics:
• It is necessary to spend a lot of time learning a prospective customer’sneeds, making it much easier to get new business from existing customersthan to sell to new customers.
• Company success depends upon maintaining good relationships with im-portant accounts.
• Management wants to emphasize the development of long-term customerrelationships.
• The firm sells in a commodity market, where a strong customer relation-ship may be the only source of differential competitive advantage.
IT Companies Tie Sales Incentives to Customer Satisfaction
Information technology (IT) companies generally have long selling cycles.To be effective, salespeople must spend a lot of time learning a prospectivecustomer’s existing technology, business, and industry. As a result, it ismuch easier to get new business from existing customers than to court newcustomers. To encourage the development of long-term customer relation-ships, some IT companies pay sales incentives based on customer satisfac-tion. Siebel Systems ties 40 percent of sales force incentive compensationto the results of customer satisfaction surveys.
PAGE 204................. 15869$ $CH6 05-19-06 09:23:33 PS
205Plan Design Part 3
eBay Improved Customer Satisfaction Through Its IncentivePlan
eBay bases up to 25 percent of a salesperson’s compensation on customerservice scores. Customer satisfaction scores for the entire sales force areposted, and sales managers are encouraged to have weekly coaching ses-sions on how to improve the scores. As a result, customer satisfactionscores at eBay improved by 30 percent in one year.
Objective measures of customer results, such as repeat rate or customer re-turns, can be used effectively at the territory level. More subjective measures likecustomer satisfaction, however, may lack veracity at the territory level for severalreasons. When a salesperson knows that he will be evaluated or possibly paid inpart on customer satisfaction survey results, the salesperson has significant incen-tive to influence the results. For example, car salespeople have been known to‘‘buy a score’’—to promise customers free merchandise or a free tank of gas inexchange for positive ratings on a customer satisfaction survey. One customersuccessfully negotiated $150 off the price of a car by agreeing to fill out a cus-tomer satisfaction survey with all ‘‘excellent’’ ratings. Customer satisfaction sur-veys can also suffer from small sample size problems. Many salespeople do nothave enough responding customers for the results of such surveys to be statisti-cally valid, particularly when the data are collected over a short period of time.Selection bias can also be a problem with customer satisfaction surveys. Fre-quently, the customers who are most likely to fill out such surveys are those whohave had a bad experience with the salesperson. Thus the survey may not be a truereflection of the overall customer base.
During the 1990s, many companies tried using territory customer satisfactionmetrics as a basis for determining short-term incentive pay for salespeople. Thepopularity of this practice has declined in recent years. In the Sales Incentive Exec-utive Education Survey (which includes data from 2000 to 2004), under 8 per-cent of sales forces reported the use of customer satisfaction as an incentive paydeterminant.
While survey-based customer satisfaction measures frequently fail at the indi-vidual salesperson level, such measures can be used quite successfully to identifygeneral trends and issues with customer relationships across an entire region orfor the whole company. Sample size and salesperson ‘‘rating chasing’’ tend to besignificantly less problematic when the data are summarized at a more aggregatelevel. In addition, customer satisfaction always needs to be assessed relative tocompany sales and profitability. Obviously, customers are very satisfied if they canhave the product for free.
Customer Satisfaction Measurement Flawed at SouthernCalifornia Edison
In 1997, the California Public Utilities Commission (PUC) implemented anew performance measurement system designed to encourage Southern
PAGE 205................. 15869$ $CH6 05-19-06 09:23:34 PS
206 The Complete Guide to Sales Force Incentive Compensation
California Edison to meet several operational goals. Each year, the com-pany could receive monetary bonuses for scoring well on customer satis-faction surveys, reducing the frequency and duration of blackouts, andholding employee injuries below a certain threshold. Edison could also bepenalized for poor performance in each category. Unfortunately, the sys-tem created an incentive for Edison management to falsify data. The mea-surement of worker injuries was so flawed that in 2004 the company wasunable to document the safety improvements that it had been claiming forseven years. Even more embarrassing for the company was the admissionby management that some staff members had manipulated records so thata survey firm could not track down people who might give the utility lowmarks for customer satisfaction. Instead, they steered the firm towardfriends whom they knew would provide top ratings. In November 2004, thecompany proposed to return $35 million in worker safety bonuses and$14.2 million in customer satisfaction bonuses, while consumer groupspressured the PUC to investigate further.
Activity Metrics. Activity metrics are tracked at many companies in order to drivespecific sales force behaviors. Examples of activity metrics include calls per day,customer reach and frequency, and number of demonstrations, proposals, or ser-vice calls. In the Sales Incentive Executive Education Survey, only 15 percent ofsales forces reported using activity metrics as a measure for determining incentivepay. However, many companies use activity measures to enhance their perform-ance management system.
The rationale behind using activity metrics is that sales force activity drivescustomer and company results. A high quantity and quality of sales force activitygenerates incrementally better results. A poor quantity and quality of activity gen-erates incrementally inferior results. The firm benefits when the sales force per-forms the activities that make up a successful selling process effectively. So whynot pay on activity? There are several reasons that most firms choose not to basethe majority of their incentive pay on activity:
• The firm’s investors reward the company for results, not activity.
• It is very difficult to measure activity accurately:• Salespeople report when it is convenient.• Salespeople may misstate what they actually do.
• While tracking activity metrics often motivates an increase in the quantityof the desired activity, it may also trigger a decrease in the quality of thatactivity.
Still, there are situations in which activity measurement is more appropriatethan results measurement. These situations are summarized in Figure 6-13. Activ-ity measurement is used primarily as part of performance management (ratherthan as a determinant of incentive pay). Thus, the salary component of the incen-
PAGE 206................. 15869$ $CH6 05-19-06 09:23:34 PS
207Plan Design Part 3
tive plan assumes that the sales force engages in the appropriate activity. Activity,performance management, and salary increases are linked at many companies todrive sales success.
Executive Search Firm Uses Activity Measures for NewSalespeople
Recall the story from Chapter 1 about a small executive-search firm. Expe-rienced salespeople are paid a straight commission, while new salespeoplewho are just learning the business earn a salary plus about 20 percent oftheir compensation based on the achievement of activity goals. The goalsare based on activities that lead to sales success, such as daily calls topotential job candidates, company visits, and ‘‘balls in the air,’’ or leadsthat could be converted to sales. A new salesperson who meets all of hisor her activity goals earns $400 a month in bonuses on top of her salary.Management has observed that the program gives sales training morefocus and new salespeople more confidence. It encourages new sales-people to establish a network that will generate the referrals they will needif they are to succeed down the road. Management understands what stepsit takes to be successful in the industry, and thus it rewards new sales-people for following those steps.
Activity Goals Are Common for Retail Merchandisers
It is very difficult to measure the sales contribution of the retail merchandis-ers who are part of the sales force for many consumer packaged goodsfirms. These individuals spend their time in retail stores restocking mer-chandise, rearranging shelves, and setting up displays. Attractive displayssell merchandise—but how much? Nonmerchandising activities, such asconsumer advertising, store promotions, and the efforts of salespeople atthe retailer’s headquarters, clearly play an important part in creating salesas well. As a result, incentives for merchandisers are often based on activ-ity metrics, such as the number of stores visited or the number of displaysset up.
Activity-Based Incentives Encourage Systems Selling at Slater
Slater Industrial Supply is a distributor of abrasives used in manufacturing.Slater management realized that in order to fuel sales growth, it was neces-sary to demonstrate to customers how they could save money through theuse of new products and systems improvements. This required a systemsselling approach, which was incompatible with the current sales force in-centive plan that paid commission on sales volume alone. To encouragethe new selling approach, Slater added a new activity-based bonus to its
PAGE 207................. 15869$ $CH6 05-19-06 09:23:34 PS
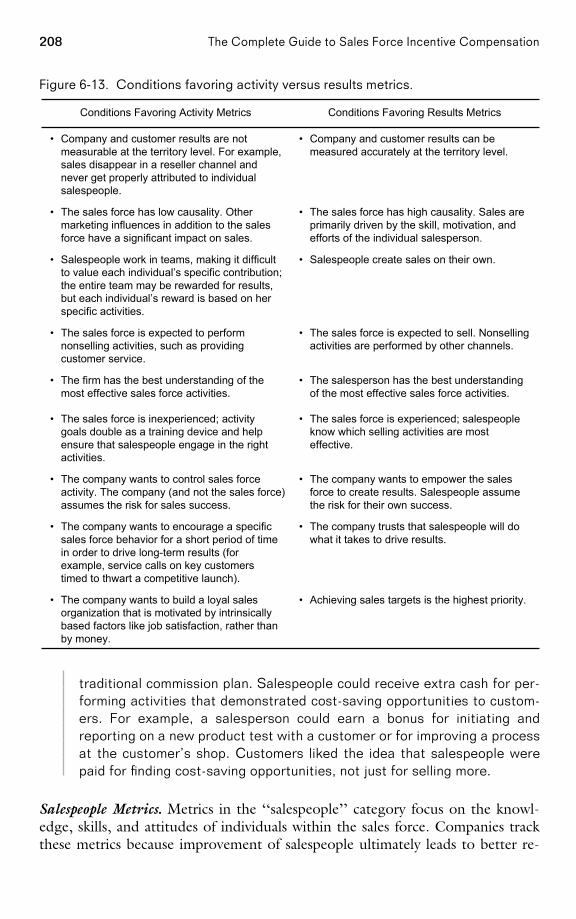
208 The Complete Guide to Sales Force Incentive Compensation
Figure 6-13. Conditions favoring activity versus results metrics.
Conditions Favoring Results MetricsConditions Favoring Activity Metrics
• Achieving sales targets is the highest priority.• The company wants to build a loyal salesorganization that is motivated by intrinsicallybased factors like job satisfaction, rather thanby money.
• The company trusts that salespeople will dowhat it takes to drive results.
• The company wants to encourage a specificsales force behavior for a short period of timein order to drive long-term results (forexample, service calls on key customerstimed to thwart a competitive launch).
• The company wants to empower the salesforce to create results. Salespeople assumethe risk for their own success.
• The company wants to control sales forceactivity. The company (and not the sales force)assumes the risk for sales success.
• The sales force is experienced; salespeopleknow which selling activities are mosteffective.
• The sales force is inexperienced; activitygoals double as a training device and helpensure that salespeople engage in the rightactivities.
• The salesperson has the best understandingof the most effective sales force activities.
• The firm has the best understanding of themost effective sales force activities.
• The sales force is expected to sell. Nonsellingactivities are performed by other channels.
• The sales force is expected to performnonselling activities, such as providingcustomer service.
• Salespeople create sales on their own.• Salespeople work in teams, making it difficultto value each individual’s specific contribution;the entire team may be rewarded for results,but each individual’s reward is based on herspecific activities.
• The sales force has high causality. Sales areprimarily driven by the skill, motivation, andefforts of the individual salesperson.
• The sales force has low causality. Othermarketing influences in addition to the salesforce have a significant impact on sales.
• Company and customer results can bemeasured accurately at the territory level.
• Company and customer results are notmeasurable at the territory level. For example,sales disappear in a reseller channel andnever get properly attributed to individualsalespeople.
traditional commission plan. Salespeople could receive extra cash for per-forming activities that demonstrated cost-saving opportunities to custom-ers. For example, a salesperson could earn a bonus for initiating andreporting on a new product test with a customer or for improving a processat the customer’s shop. Customers liked the idea that salespeople werepaid for finding cost-saving opportunities, not just for selling more.
Salespeople Metrics. Metrics in the ‘‘salespeople’’ category focus on the knowl-edge, skills, and attitudes of individuals within the sales force. Companies trackthese metrics because improvement of salespeople ultimately leads to better re-
PAGE 208................. 15869$ $CH6 05-19-06 09:23:36 PS
209Plan Design Part 3
sults. Salespeople metrics can include tests that measure the knowledge, compe-tency, skills, and attitudes of the sales force, as well as measures, such as employeeturnover, that provide insight about employee satisfaction. Since salespeople met-rics encourage the personal and professional growth of the sales force, they can beused for people at all levels within the selling organization. First-level sales manag-ers often have goals encouraging them not only to develop themselves profession-ally, but also to develop the salespeople who report to them. Sales leadershipneeds to maintain high standards across the entire sales force: ‘‘You need to havethe right people on the bus.’’
Since metrics in the ‘‘salespeople’’ category have a long-term effect on thefirm, the immediate impact of these metrics on company results can be very dif-ficult to measure. Most firms track salesperson metrics through performancemanagement processes, but do not tie these metrics to short-term monetary in-centives. Focus on salespeople metrics is more common in sales forces where:
• The culture encourages long-term success rather than short-term results.• The culture stresses intrinsic rewards such as job satisfaction and profes-
sional growth over financial rewards.• The firm has a philosophy of hiring salespeople with minimal experience
and developing them, rather than hiring only experienced salespeople.
Data Views
Metrics can be viewed from different perspectives or data views, either as absolutevalues or as comparisons. Sales, gross margin contribution, number of calls, andcustomer satisfaction scales are all examples of absolute-level metrics. Here, theprecise level of the metric is important. Level metrics can be evaluated withphrases such as ‘‘low, average, or high’’ or ‘‘weak, good, or exceptional.’’ Alterna-tively, metrics can be stated as comparisons with some standard or level of expecta-tion. Specifying the comparison computation within the measure enhancescomparability. For example, metrics can be contrasted with the past (e.g., growthor decline over last year), compared to a goal or target (e.g., percent of goalattainment), or compared to a peer group (e.g., district or region ranking). Thecircumstances under which different data views are appropriate in an incentiveplan are discussed here.
Absolute-Level Metrics. Paying incentives based on the absolute value of a metric(for example, a straight commission on all sales) is a very straightforward incentiveapproach that is easy for salespeople to understand. A problem with paying incen-tives on absolute-level metrics is that often these measures are strongly influencedby territory differences. For example, high sales occur in territories with highpotential, independent of sales effort. Thus, an incentive plan that pays on totalsales favors salespeople with high-potential territories. Similarly, level metrics thatpay salespeople on market share favor low-potential territories. Metrics that com-
PAGE 209................. 15869$ $CH6 05-19-06 09:23:36 PS
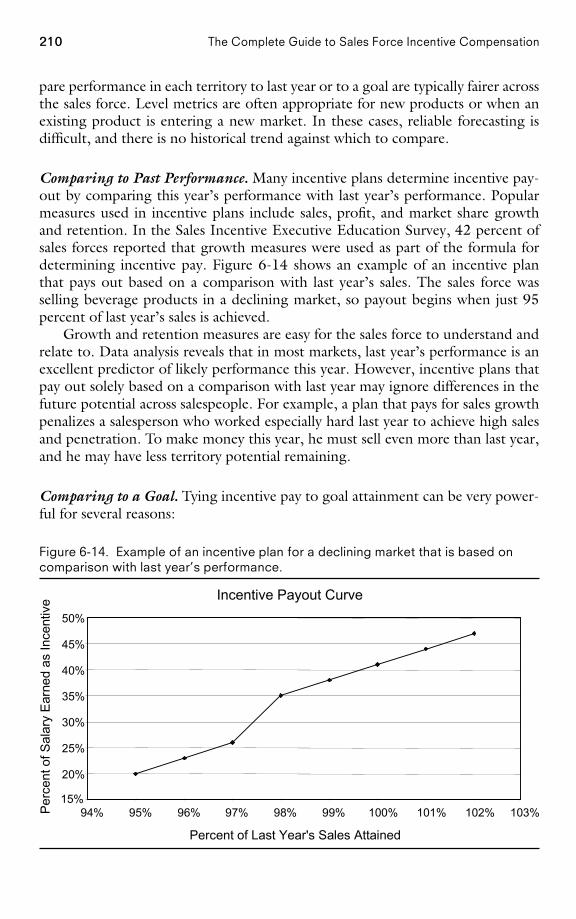
210 The Complete Guide to Sales Force Incentive Compensation
pare performance in each territory to last year or to a goal are typically fairer acrossthe sales force. Level metrics are often appropriate for new products or when anexisting product is entering a new market. In these cases, reliable forecasting isdifficult, and there is no historical trend against which to compare.
Comparing to Past Performance. Many incentive plans determine incentive pay-out by comparing this year’s performance with last year’s performance. Popularmeasures used in incentive plans include sales, profit, and market share growthand retention. In the Sales Incentive Executive Education Survey, 42 percent ofsales forces reported that growth measures were used as part of the formula fordetermining incentive pay. Figure 6-14 shows an example of an incentive planthat pays out based on a comparison with last year’s sales. The sales force wasselling beverage products in a declining market, so payout begins when just 95percent of last year’s sales is achieved.
Growth and retention measures are easy for the sales force to understand andrelate to. Data analysis reveals that in most markets, last year’s performance is anexcellent predictor of likely performance this year. However, incentive plans thatpay out solely based on a comparison with last year may ignore differences in thefuture potential across salespeople. For example, a plan that pays for sales growthpenalizes a salesperson who worked especially hard last year to achieve high salesand penetration. To make money this year, he must sell even more than last year,and he may have less territory potential remaining.
Comparing to a Goal. Tying incentive pay to goal attainment can be very power-ful for several reasons:
Figure 6-14. Example of an incentive plan for a declining market that is based oncomparison with last year’s performance.
Incentive Payout Curve
20%
25%
30%
35%
40%
45%
50%
94% 95% 96% 97% 98% 99% 100% 101% 102% 103%
Percent of Last Year's Sales Attained
Per
cent
of S
alar
y E
arne
d as
Ince
ntiv
e
15%
PAGE 210................. 15869$ $CH6 05-19-06 09:23:37 PS
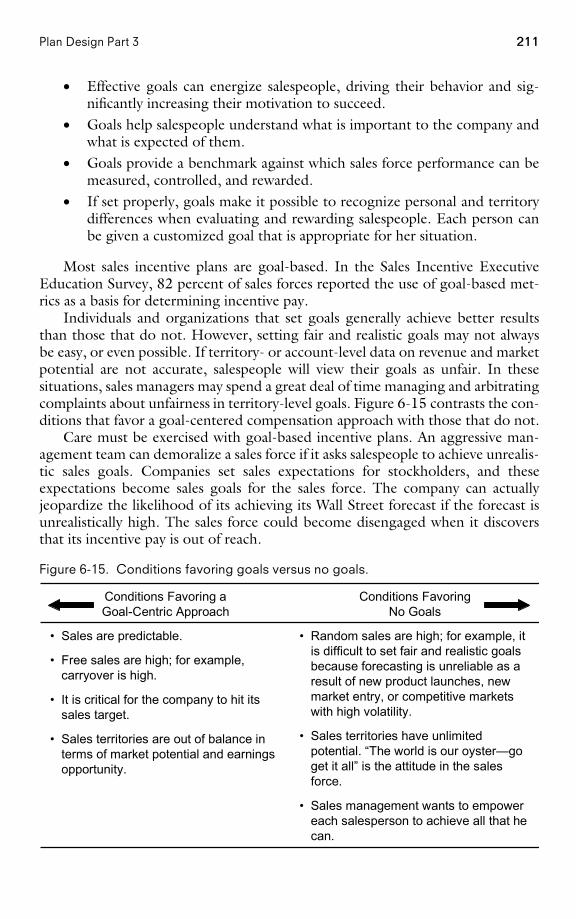
211Plan Design Part 3
• Effective goals can energize salespeople, driving their behavior and sig-nificantly increasing their motivation to succeed.
• Goals help salespeople understand what is important to the company andwhat is expected of them.
• Goals provide a benchmark against which sales force performance can bemeasured, controlled, and rewarded.
• If set properly, goals make it possible to recognize personal and territorydifferences when evaluating and rewarding salespeople. Each person canbe given a customized goal that is appropriate for her situation.
Most sales incentive plans are goal-based. In the Sales Incentive ExecutiveEducation Survey, 82 percent of sales forces reported the use of goal-based met-rics as a basis for determining incentive pay.
Individuals and organizations that set goals generally achieve better resultsthan those that do not. However, setting fair and realistic goals may not alwaysbe easy, or even possible. If territory- or account-level data on revenue and marketpotential are not accurate, salespeople will view their goals as unfair. In thesesituations, sales managers may spend a great deal of time managing and arbitratingcomplaints about unfairness in territory-level goals. Figure 6-15 contrasts the con-ditions that favor a goal-centered compensation approach with those that do not.
Care must be exercised with goal-based incentive plans. An aggressive man-agement team can demoralize a sales force if it asks salespeople to achieve unrealis-tic sales goals. Companies set sales expectations for stockholders, and theseexpectations become sales goals for the sales force. The company can actuallyjeopardize the likelihood of its achieving its Wall Street forecast if the forecast isunrealistically high. The sales force could become disengaged when it discoversthat its incentive pay is out of reach.
Figure 6-15. Conditions favoring goals versus no goals.
Conditions FavoringNo Goals
Conditions Favoring aGoal-Centric Approach
• Random sales are high; for example, itis difficult to set fair and realistic goalsbecause forecasting is unreliable as aresult of new product launches, newmarket entry, or competitive marketswith high volatility.
• Sales territories have unlimitedpotential. “The world is our oyster—goget it all” is the attitude in the salesforce.
• Sales management wants to empowereach salesperson to achieve all that hecan.
• Sales are predictable.
• Free sales are high; for example,carryover is high.
• It is critical for the company to hit itssales target.
• Sales territories are out of balance interms of market potential and earningsopportunity.
PAGE 211................. 15869$ $CH6 05-19-06 09:23:38 PS
212 The Complete Guide to Sales Force Incentive Compensation
Biotech Start-up Shifts Emphasis on Goals as MarketExperience Grows
The sales management team at a new biotech start-up felt that goal-basedincentives could provide powerful motivation for the firm’s start-up salesforce to succeed. Goals would help salespeople understand what was im-portant to the company and what was expected of them, and could providean important benchmark for measuring, controlling, and rewarding salesforce performance. However, with the launch of the firm’s first major newproduct on the horizon, management faced the challenge of setting realisticsales goals in a new and largely unknown market. The team did not have ahigh degree of confidence that its national sales forecast was accurate.Predicting sales at the local territory level was virtually impossible. Thus,during the first few months after the new product’s launch, the sales forceincentive pay was based on achievement of individual salesperson objec-tives that were developed using a management-by-objectives (MBO) ap-proach. Points were awarded to a salesperson for strategically importantactivities such as completing product training, developing account plans,and making sales calls. A salesperson’s incentive payout was determinedby the number of points he earned. Several months following the launch,as access to historical data increased and the firm’s ability to predict salesimproved, the firm changed to a sales incentive plan based 50 percent onMBO attainment and 50 percent on territory sales. Territory sales weretracked against a territory quota, but since management still did not havea high degree of confidence that the quotas were accurate, commissionswere based on total territory sales, with an added bonus if the nationalsales quota was achieved.
In the second full year following launch, the firm’s management feelsthat it has enough experience and data to establish reasonable territory-level quotas that accurately reflect territory differences. The firm plans tomove to a true territory quota–based incentive plan. Salespeople will beginto receive incentive payout when 80 percent of quota is attained, and thepayout rate will accelerate beyond 100 percent attainment. The 80 percentis reasonable, since there will still be some uncertainty in the sales fore-cast. The majority of incentive money will be tied to territory sales quotaachievement, with a smaller portion linked to individual MBO attainmentand national quota achievement.
Figure 6-16 shows an example of a goal-based incentive plan. Each salesper-son receives a quarterly territory sales goal for Products A, B, and C, and incentivepayout is based on weighted goal attainment across the three products. Theweights reflect the strategic value of each product to the company and the poten-tial market for each product. Individual territory product goals are set based onfactors such as past territory sales performance, territory growth potential, com-petitive intensity, and the salesperson’s skill and experience.
PAGE 212................. 15869$ $CH6 05-19-06 09:23:39 PS
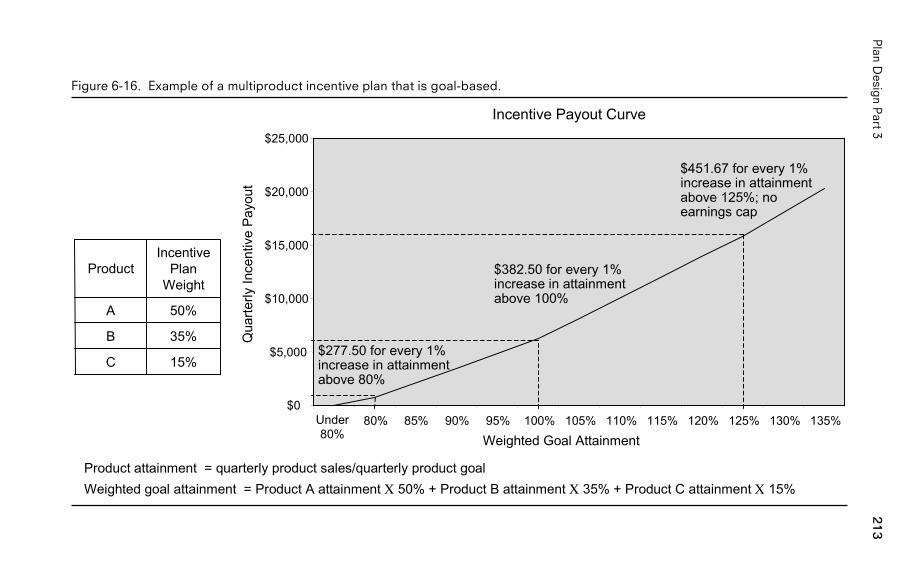
213P
lanD
esign
Part
3
Figure 6-16. Example of a multiproduct incentive plan that is goal-based.
Product attainment = quarterly product sales/quarterly product goalWeighted goal attainment = Product A attainment Χ 50% + Product B attainment Χ 35% + Product C attainment Χ 15%
Incentive Payout Curve
$0
$5,000
$10,000
$15,000
$20,000
$25,000
Under80%
80% 85% 90% 95% 100% 105% 110% 115% 120% 125% 130% 135%
Weighted Goal Attainment
Qua
rterly
Ince
ntiv
e Pa
yout
$277.50 for every 1%increase in attainmentabove 80%
$382.50 for every 1%increase in attainmentabove 100%
$451.67 for every 1%increase in attainmentabove 125%; noearnings cap
15%C
35%B
50%A
IncentivePlan
WeightProduct
PA
GE
213.................15869$
$CH
605-19-06
09:23:40P
S
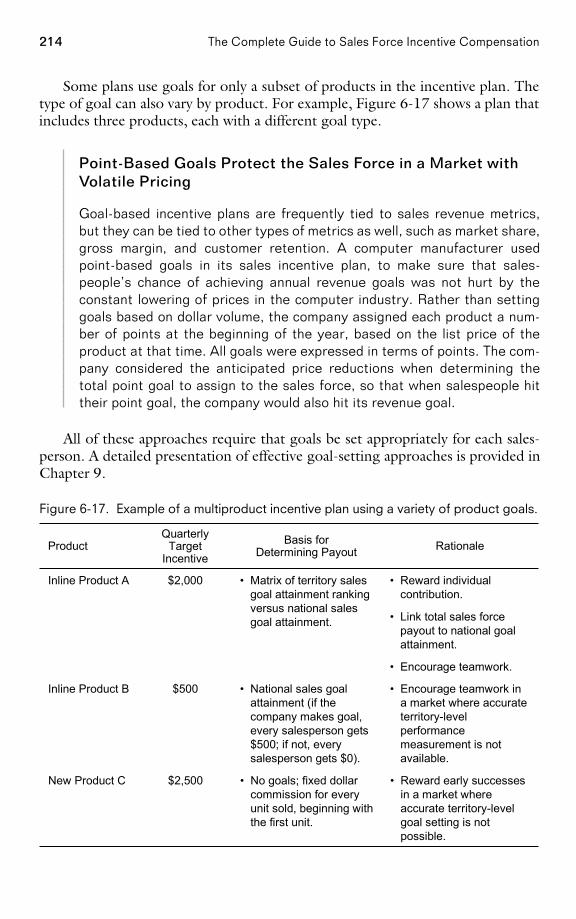
214 The Complete Guide to Sales Force Incentive Compensation
Some plans use goals for only a subset of products in the incentive plan. Thetype of goal can also vary by product. For example, Figure 6-17 shows a plan thatincludes three products, each with a different goal type.
Point-Based Goals Protect the Sales Force in a Market withVolatile Pricing
Goal-based incentive plans are frequently tied to sales revenue metrics,but they can be tied to other types of metrics as well, such as market share,gross margin, and customer retention. A computer manufacturer usedpoint-based goals in its sales incentive plan, to make sure that sales-people’s chance of achieving annual revenue goals was not hurt by theconstant lowering of prices in the computer industry. Rather than settinggoals based on dollar volume, the company assigned each product a num-ber of points at the beginning of the year, based on the list price of theproduct at that time. All goals were expressed in terms of points. The com-pany considered the anticipated price reductions when determining thetotal point goal to assign to the sales force, so that when salespeople hittheir point goal, the company would also hit its revenue goal.
All of these approaches require that goals be set appropriately for each sales-person. A detailed presentation of effective goal-setting approaches is provided inChapter 9.
Figure 6-17. Example of a multiproduct incentive plan using a variety of product goals.
• Reward early successesin a market whereaccurate territory-levelgoal setting is notpossible.
• No goals; fixed dollarcommission for everyunit sold, beginning withthe first unit.
$2,500New Product C
• Encourage teamwork ina market where accurateterritory-levelperformancemeasurement is notavailable.
• National sales goalattainment (if thecompany makes goal,every salesperson gets$500; if not, everysalesperson gets $0).
$500Inline Product B
• Reward individualcontribution.
• Link total sales forcepayout to national goalattainment.
• Encourage teamwork.
• Matrix of territory salesgoal attainment rankingversus national salesgoal attainment.
$2,000Inline Product A
RationaleBasis forDetermining Payout
QuarterlyTarget
IncentiveProduct
PAGE 214................. 15869$ $CH6 05-19-06 09:23:41 PS
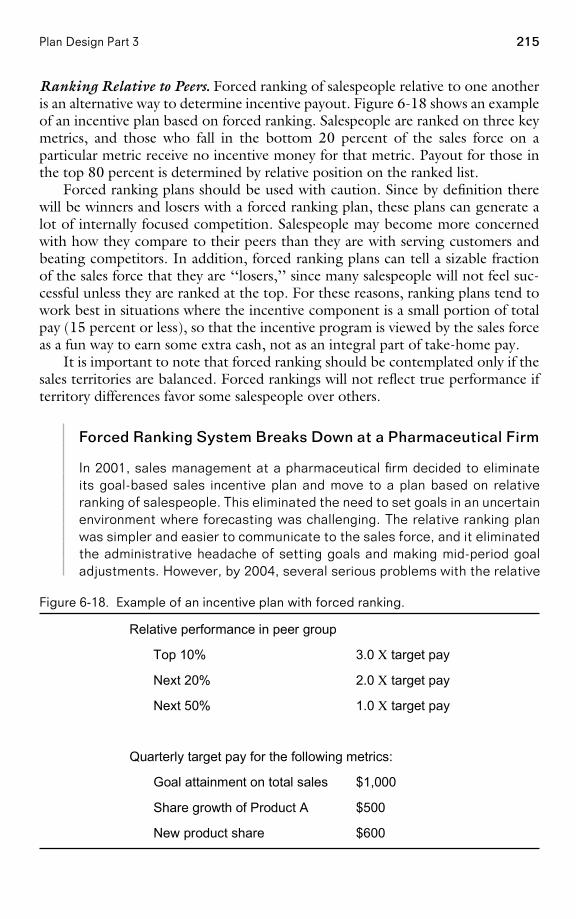
215Plan Design Part 3
Ranking Relative to Peers. Forced ranking of salespeople relative to one anotheris an alternative way to determine incentive payout. Figure 6-18 shows an exampleof an incentive plan based on forced ranking. Salespeople are ranked on three keymetrics, and those who fall in the bottom 20 percent of the sales force on aparticular metric receive no incentive money for that metric. Payout for those inthe top 80 percent is determined by relative position on the ranked list.
Forced ranking plans should be used with caution. Since by definition therewill be winners and losers with a forced ranking plan, these plans can generate alot of internally focused competition. Salespeople may become more concernedwith how they compare to their peers than they are with serving customers andbeating competitors. In addition, forced ranking plans can tell a sizable fractionof the sales force that they are ‘‘losers,’’ since many salespeople will not feel suc-cessful unless they are ranked at the top. For these reasons, ranking plans tend towork best in situations where the incentive component is a small portion of totalpay (15 percent or less), so that the incentive program is viewed by the sales forceas a fun way to earn some extra cash, not as an integral part of take-home pay.
It is important to note that forced ranking should be contemplated only if thesales territories are balanced. Forced rankings will not reflect true performance ifterritory differences favor some salespeople over others.
Forced Ranking System Breaks Down at a Pharmaceutical Firm
In 2001, sales management at a pharmaceutical firm decided to eliminateits goal-based sales incentive plan and move to a plan based on relativeranking of salespeople. This eliminated the need to set goals in an uncertainenvironment where forecasting was challenging. The relative ranking planwas simpler and easier to communicate to the sales force, and it eliminatedthe administrative headache of setting goals and making mid-period goaladjustments. However, by 2004, several serious problems with the relative
Figure 6-18. Example of an incentive plan with forced ranking.
$600New product share
$500Share growth of Product A
$1,000Goal attainment on total sales
Quarterly target pay for the following metrics:
1.0 Χ target payNext 50%
2.0 Χ target payNext 20%
3.0 Χ target payTop 10%
Relative performance in peer group
PAGE 215................. 15869$ $CH6 05-19-06 09:23:42 PS
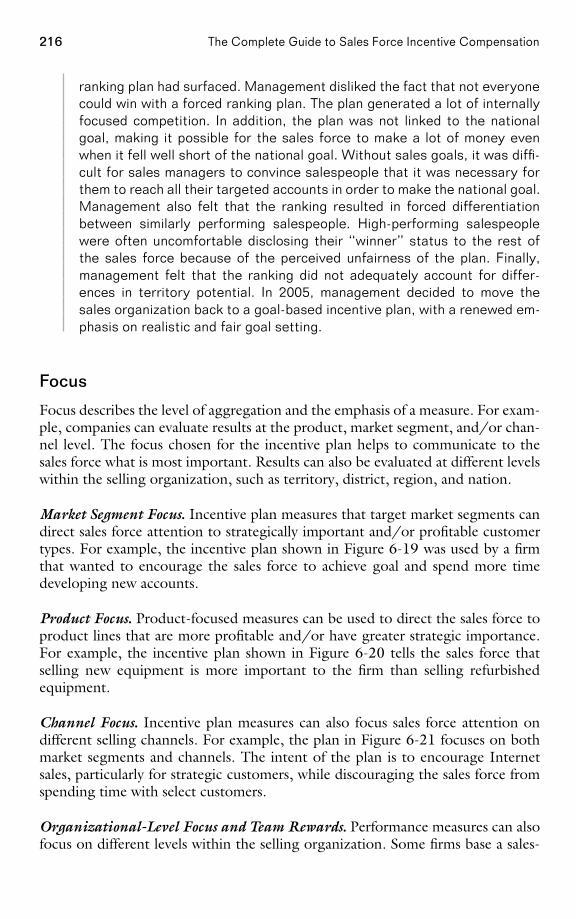
216 The Complete Guide to Sales Force Incentive Compensation
ranking plan had surfaced. Management disliked the fact that not everyonecould win with a forced ranking plan. The plan generated a lot of internallyfocused competition. In addition, the plan was not linked to the nationalgoal, making it possible for the sales force to make a lot of money evenwhen it fell well short of the national goal. Without sales goals, it was diffi-cult for sales managers to convince salespeople that it was necessary forthem to reach all their targeted accounts in order to make the national goal.Management also felt that the ranking resulted in forced differentiationbetween similarly performing salespeople. High-performing salespeoplewere often uncomfortable disclosing their ‘‘winner’’ status to the rest ofthe sales force because of the perceived unfairness of the plan. Finally,management felt that the ranking did not adequately account for differ-ences in territory potential. In 2005, management decided to move thesales organization back to a goal-based incentive plan, with a renewed em-phasis on realistic and fair goal setting.
Focus
Focus describes the level of aggregation and the emphasis of a measure. For exam-ple, companies can evaluate results at the product, market segment, and/or chan-nel level. The focus chosen for the incentive plan helps to communicate to thesales force what is most important. Results can also be evaluated at different levelswithin the selling organization, such as territory, district, region, and nation.
Market Segment Focus. Incentive plan measures that target market segments candirect sales force attention to strategically important and/or profitable customertypes. For example, the incentive plan shown in Figure 6-19 was used by a firmthat wanted to encourage the sales force to achieve goal and spend more timedeveloping new accounts.
Product Focus. Product-focused measures can be used to direct the sales force toproduct lines that are more profitable and/or have greater strategic importance.For example, the incentive plan shown in Figure 6-20 tells the sales force thatselling new equipment is more important to the firm than selling refurbishedequipment.
Channel Focus. Incentive plan measures can also focus sales force attention ondifferent selling channels. For example, the plan in Figure 6-21 focuses on bothmarket segments and channels. The intent of the plan is to encourage Internetsales, particularly for strategic customers, while discouraging the sales force fromspending time with select customers.
Organizational-Level Focus and Team Rewards. Performance measures can alsofocus on different levels within the selling organization. Some firms base a sales-
PAGE 216................. 15869$ $CH6 05-19-06 09:23:43 PS
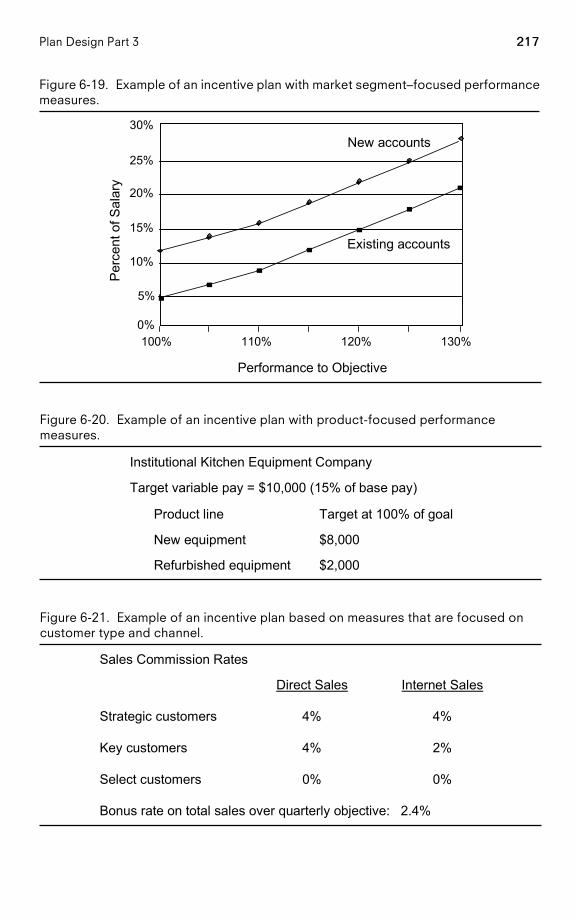
217Plan Design Part 3
Figure 6-19. Example of an incentive plan with market segment–focused performancemeasures.
0%
5%
10%
15%
20%
25%
30%
100% 110% 120% 130%
Performance to Objective
Per
cent
of S
alar
y
New accounts
Existing accounts
Figure 6-20. Example of an incentive plan with product-focused performancemeasures.
$2,000Refurbished equipment
$8,000New equipment
Target at 100% of goalProduct line
Target variable pay = $10,000 (15% of base pay)
Institutional Kitchen Equipment Company
Figure 6-21. Example of an incentive plan based on measures that are focused oncustomer type and channel.
Bonus rate on total sales over quarterly objective: 2.4%
0%0%Select customers
2%4%Key customers
4%4%Strategic customers
Internet SalesDirect Sales
Sales Commission Rates
PAGE 217................. 15869$ $CH6 05-19-06 09:23:45 PS
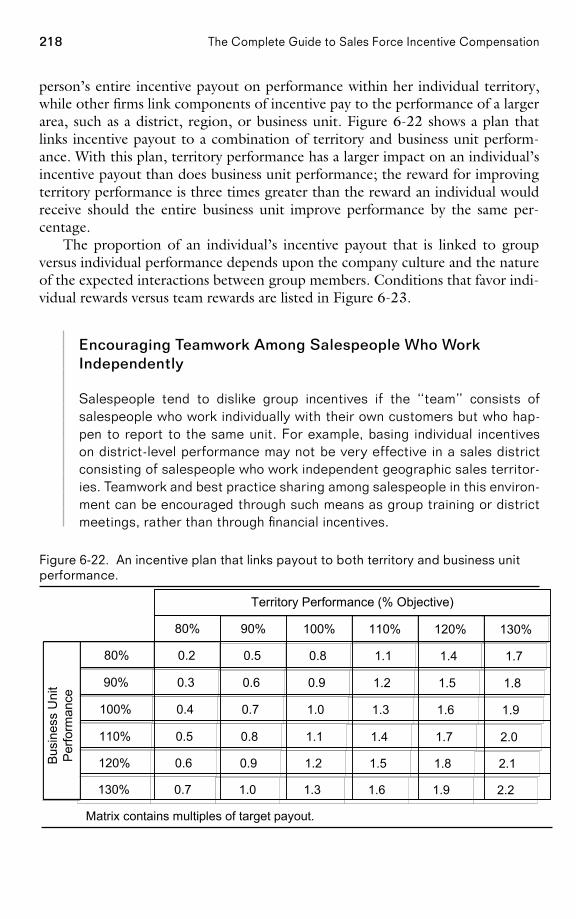
218 The Complete Guide to Sales Force Incentive Compensation
person’s entire incentive payout on performance within her individual territory,while other firms link components of incentive pay to the performance of a largerarea, such as a district, region, or business unit. Figure 6-22 shows a plan thatlinks incentive payout to a combination of territory and business unit perform-ance. With this plan, territory performance has a larger impact on an individual’sincentive payout than does business unit performance; the reward for improvingterritory performance is three times greater than the reward an individual wouldreceive should the entire business unit improve performance by the same per-centage.
The proportion of an individual’s incentive payout that is linked to groupversus individual performance depends upon the company culture and the natureof the expected interactions between group members. Conditions that favor indi-vidual rewards versus team rewards are listed in Figure 6-23.
Encouraging Teamwork Among Salespeople Who WorkIndependently
Salespeople tend to dislike group incentives if the ‘‘team’’ consists ofsalespeople who work individually with their own customers but who hap-pen to report to the same unit. For example, basing individual incentiveson district-level performance may not be very effective in a sales districtconsisting of salespeople who work independent geographic sales territor-ies. Teamwork and best practice sharing among salespeople in this environ-ment can be encouraged through such means as group training or districtmeetings, rather than through financial incentives.
Figure 6-22. An incentive plan that links payout to both territory and business unitperformance.
Matrix contains multiples of target payout.
2.21.91.61.31.00.7130%
2.11.81.51.20.90.6120%
2.01.71.41.10.80.5110%
1.91.61.31.00.70.4100%
1.81.51.20.90.60.390%
1.71.41.10.80.50.280%
130%120%110%100%90%80%
Territory Performance (% Objective)
Busi
ness
Uni
tPe
rform
ance
PAGE 218................. 15869$ $CH6 05-19-06 09:23:47 PS
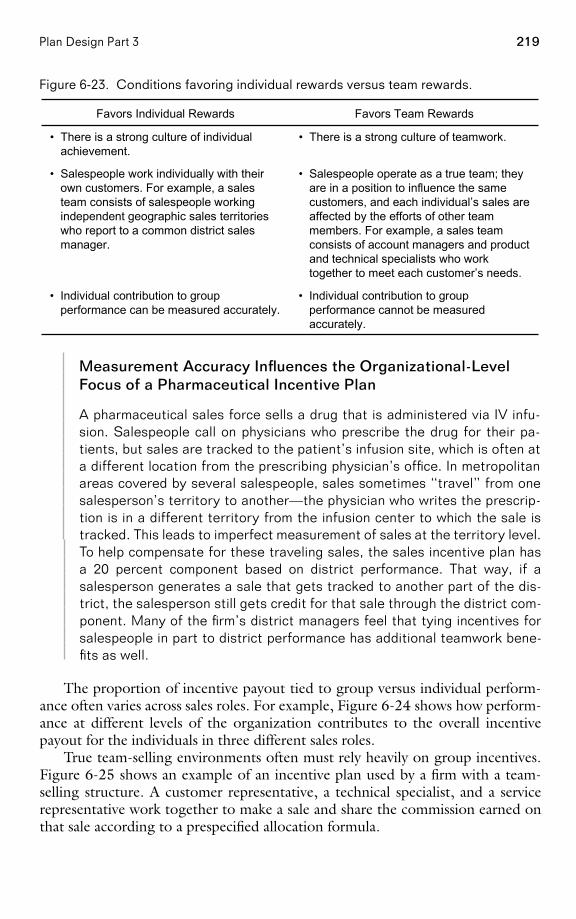
219Plan Design Part 3
Figure 6-23. Conditions favoring individual rewards versus team rewards.
Favors Team RewardsFavors Individual Rewards
• Individual contribution to groupperformance cannot be measuredaccurately.
• Individual contribution to groupperformance can be measured accurately.
• Salespeople operate as a true team; theyare in a position to influence the samecustomers, and each individual’s sales areaffected by the efforts of other teammembers. For example, a sales teamconsists of account managers and productand technical specialists who worktogether to meet each customer’s needs.
• Salespeople work individually with theirown customers. For example, a salesteam consists of salespeople workingindependent geographic sales territorieswho report to a common district salesmanager.
• There is a strong culture of teamwork.• There is a strong culture of individualachievement.
Measurement Accuracy Influences the Organizational-LevelFocus of a Pharmaceutical Incentive Plan
A pharmaceutical sales force sells a drug that is administered via IV infu-sion. Salespeople call on physicians who prescribe the drug for their pa-tients, but sales are tracked to the patient’s infusion site, which is often ata different location from the prescribing physician’s office. In metropolitanareas covered by several salespeople, sales sometimes ‘‘travel’’ from onesalesperson’s territory to another—the physician who writes the prescrip-tion is in a different territory from the infusion center to which the sale istracked. This leads to imperfect measurement of sales at the territory level.To help compensate for these traveling sales, the sales incentive plan hasa 20 percent component based on district performance. That way, if asalesperson generates a sale that gets tracked to another part of the dis-trict, the salesperson still gets credit for that sale through the district com-ponent. Many of the firm’s district managers feel that tying incentives forsalespeople in part to district performance has additional teamwork bene-fits as well.
The proportion of incentive payout tied to group versus individual perform-ance often varies across sales roles. For example, Figure 6-24 shows how perform-ance at different levels of the organization contributes to the overall incentivepayout for the individuals in three different sales roles.
True team-selling environments often must rely heavily on group incentives.Figure 6-25 shows an example of an incentive plan used by a firm with a team-selling structure. A customer representative, a technical specialist, and a servicerepresentative work together to make a sale and share the commission earned onthat sale according to a prespecified allocation formula.
PAGE 219................. 15869$ $CH6 05-19-06 09:23:48 PS
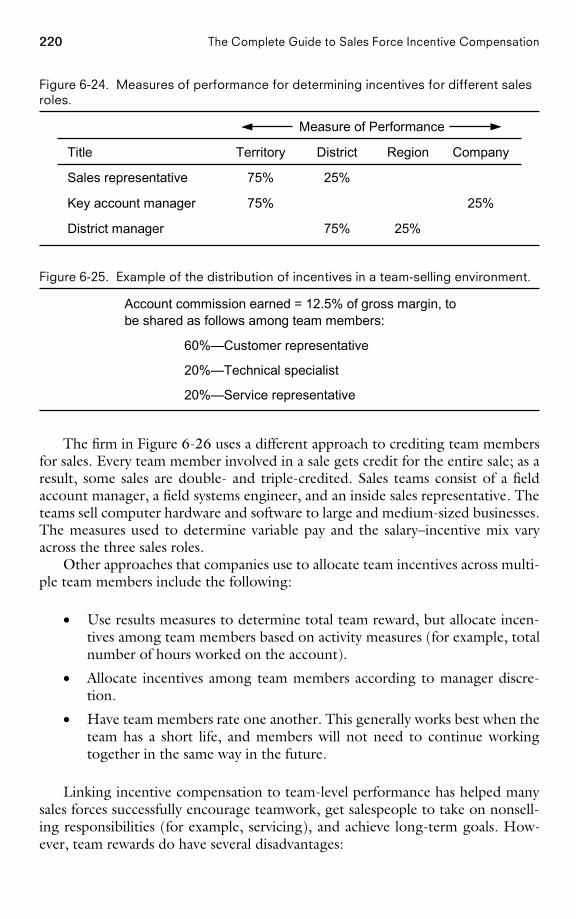
220 The Complete Guide to Sales Force Incentive Compensation
Figure 6-24. Measures of performance for determining incentives for different salesroles.
25%75%District manager
25%75%Key account manager
25%75%Sales representative
CompanyRegionDistrictTerritoryTitle
Measure of Performance
Figure 6-25. Example of the distribution of incentives in a team-selling environment.
Account commission earned = 12.5% of gross margin, tobe shared as follows among team members:
60%—Customer representative
20%—Technical specialist
20%—Service representative
The firm in Figure 6-26 uses a different approach to crediting team membersfor sales. Every team member involved in a sale gets credit for the entire sale; as aresult, some sales are double- and triple-credited. Sales teams consist of a fieldaccount manager, a field systems engineer, and an inside sales representative. Theteams sell computer hardware and software to large and medium-sized businesses.The measures used to determine variable pay and the salary–incentive mix varyacross the three sales roles.
Other approaches that companies use to allocate team incentives across multi-ple team members include the following:
• Use results measures to determine total team reward, but allocate incen-tives among team members based on activity measures (for example, totalnumber of hours worked on the account).
• Allocate incentives among team members according to manager discre-tion.
• Have team members rate one another. This generally works best when theteam has a short life, and members will not need to continue workingtogether in the same way in the future.
Linking incentive compensation to team-level performance has helped manysales forces successfully encourage teamwork, get salespeople to take on nonsell-ing responsibilities (for example, servicing), and achieve long-term goals. How-ever, team rewards do have several disadvantages:
PAGE 220................. 15869$ $CH6 05-19-06 09:23:49 PS
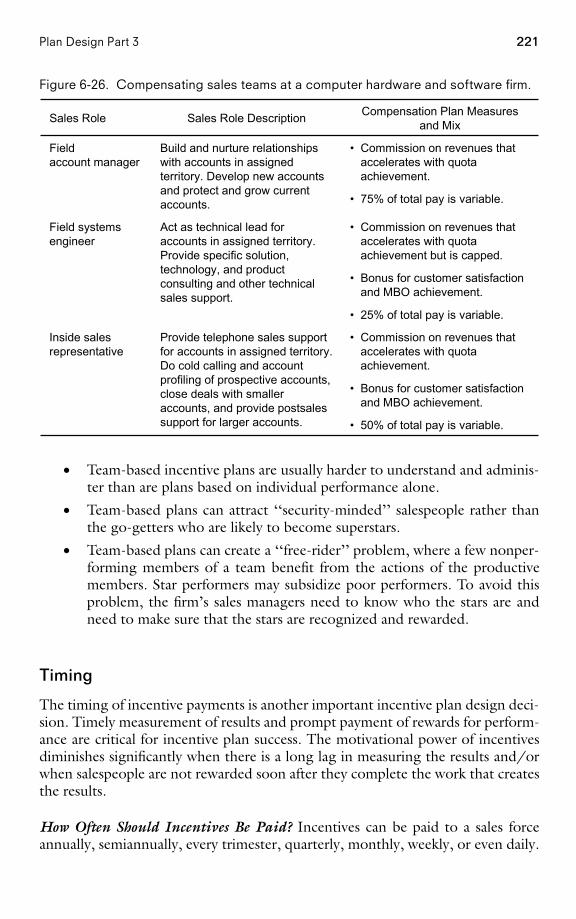
221Plan Design Part 3
Figure 6-26. Compensating sales teams at a computer hardware and software firm.
• Commission on revenues thataccelerates with quotaachievement.
• Bonus for customer satisfactionand MBO achievement.
• 50% of total pay is variable.
Provide telephone sales supportfor accounts in assigned territory.Do cold calling and accountprofiling of prospective accounts,close deals with smalleraccounts, and provide postsalessupport for larger accounts.
Inside salesrepresentative
• Commission on revenues thataccelerates with quotaachievement but is capped.
• Bonus for customer satisfactionand MBO achievement.
• 25% of total pay is variable.
Act as technical lead foraccounts in assigned territory.Provide specific solution,technology, and productconsulting and other technicalsales support.
Field systemsengineer
• Commission on revenues thataccelerates with quotaachievement.
• 75% of total pay is variable.
Build and nurture relationshipswith accounts in assignedterritory. Develop new accountsand protect and grow currentaccounts.
Fieldaccount manager
Compensation Plan Measuresand MixSales Role DescriptionSales Role
• Team-based incentive plans are usually harder to understand and adminis-ter than are plans based on individual performance alone.
• Team-based plans can attract ‘‘security-minded’’ salespeople rather thanthe go-getters who are likely to become superstars.
• Team-based plans can create a ‘‘free-rider’’ problem, where a few nonper-forming members of a team benefit from the actions of the productivemembers. Star performers may subsidize poor performers. To avoid thisproblem, the firm’s sales managers need to know who the stars are andneed to make sure that the stars are recognized and rewarded.
Timing
The timing of incentive payments is another important incentive plan design deci-sion. Timely measurement of results and prompt payment of rewards for perform-ance are critical for incentive plan success. The motivational power of incentivesdiminishes significantly when there is a long lag in measuring the results and/orwhen salespeople are not rewarded soon after they complete the work that createsthe results.
How Often Should Incentives Be Paid? Incentives can be paid to a sales forceannually, semiannually, every trimester, quarterly, monthly, weekly, or even daily.
PAGE 221................. 15869$ $CH6 05-19-06 09:23:51 PS
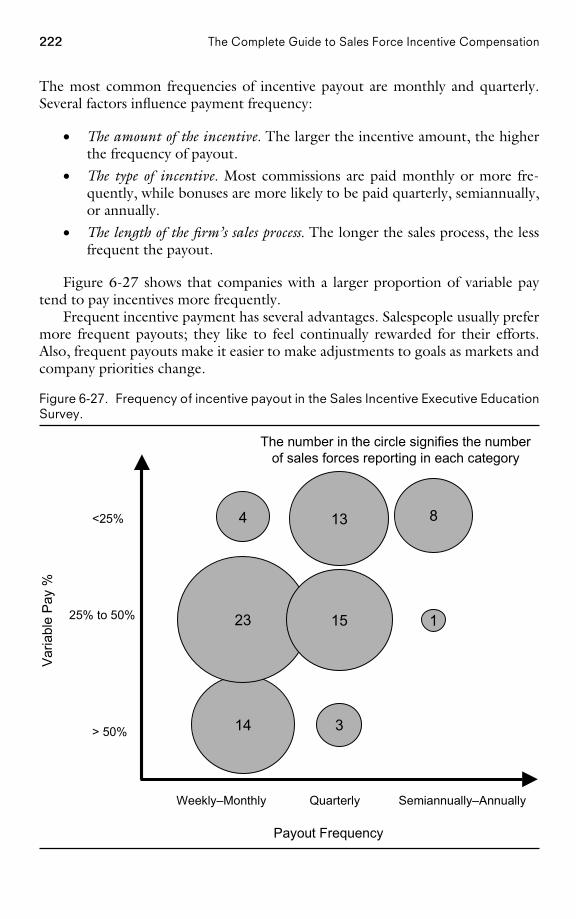
222 The Complete Guide to Sales Force Incentive Compensation
The most common frequencies of incentive payout are monthly and quarterly.Several factors influence payment frequency:
• The amount of the incentive. The larger the incentive amount, the higherthe frequency of payout.
• The type of incentive. Most commissions are paid monthly or more fre-quently, while bonuses are more likely to be paid quarterly, semiannually,or annually.
• The length of the firm’s sales process. The longer the sales process, the lessfrequent the payout.
Figure 6-27 shows that companies with a larger proportion of variable paytend to pay incentives more frequently.
Frequent incentive payment has several advantages. Salespeople usually prefermore frequent payouts; they like to feel continually rewarded for their efforts.Also, frequent payouts make it easier to make adjustments to goals as markets andcompany priorities change.
Figure 6-27. Frequency of incentive payout in the Sales Incentive Executive EducationSurvey.
14
23
4
3
15
13
1
8
Weekly–Monthly Quarterly Semiannually–Annually
> 50%
25% to 50%
<25%
Payout Frequency
Var
iabl
e P
ay %
The number in the circle signifies the numberof sales forces reporting in each category
PAGE 222................. 15869$ $CH6 05-19-06 09:23:52 PS
223Plan Design Part 3
There are also arguments for paying incentives less frequently:
• Less frequent payments mean that each payment will be larger and moreimpressive to the salesperson.
• With goal-based plans, less frequent payment allows more time for goalsto drive behavior, and less time is consumed by the difficult and resource-intensive task of goal setting.
• Longer time lags between payments can encourage the sales force to ad-dress the longer-term needs of customers, rather than focusing on maxim-izing short-term performance.
• It is easier to change from a plan that is less frequent to one that is morefrequent—the sales force is likely to resist a change in the other direction.
• Incentive compensation plan administration time is greatly reduced withfewer payments. There will also be fewer computational errors to upsetthe sales force.
As a general rule, an incentive plan should pay incentives as frequently as ispossible without compromising customer focus, generating excessive administra-tive overhead, or making the award size trivial.
Sales Force Resists Move to Quarterly Incentive Payout at aHealth-Care Firm
A health-care firm had historically set monthly sales goals and paid thesales force based on goal attainment every month. Quarterly goals andpayments were the norm in the industry, and the firm wanted to move thesales force to a quarterly bonus plan. ‘‘If we could get away from a monthlyplan, salespeople would think about the bigger picture and long-term strat-egy,’’ reasoned one of the firm’s product managers. In addition, manage-ment felt that quarterly payouts would be easier and less costly toadminister, would have less variability, and, since the amount of each pay-ment would be larger, would be more appreciated by the sales force. How-ever, the field strongly resisted the move to quarterly payments. ‘‘If wemove to quarterly payouts, people will leave,’’ threatened a sales districtmanager. ‘‘I have been with the company for a long-time, and I am amonthly person,’’ said one of the firm’s regional directors. As a first step inthe transition to the quarterly plan, the firm is considering setting quarterlygoals, but continuing to pay out monthly based on progress toward thequarterly goal.
Should Incentives Be Paid When the Order Is Taken or When the CompanyCollects the Funds From the Customer? The salesperson’s main job is to get theorder or book the sale. Incentives are most motivating when they are granted
PAGE 223................. 15869$ $CH6 05-19-06 09:23:52 PS
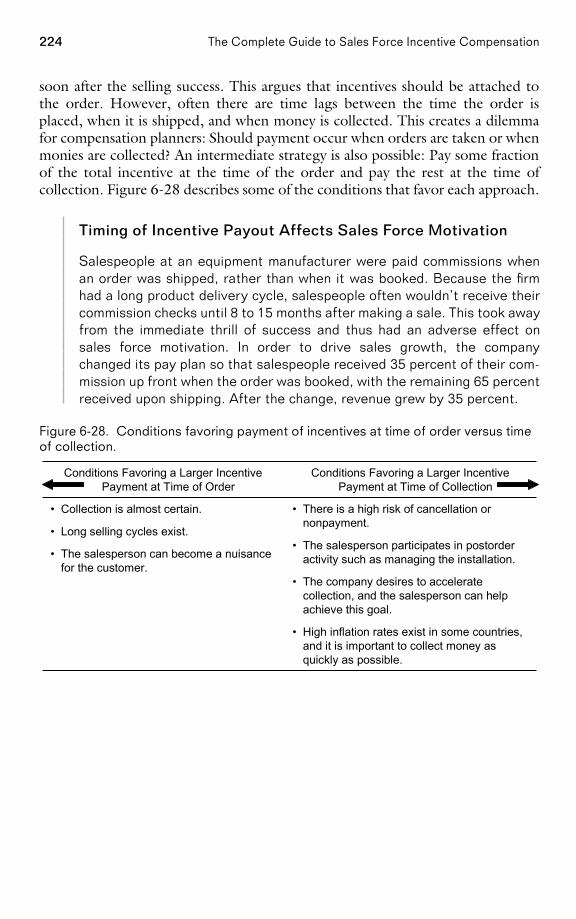
224 The Complete Guide to Sales Force Incentive Compensation
soon after the selling success. This argues that incentives should be attached tothe order. However, often there are time lags between the time the order isplaced, when it is shipped, and when money is collected. This creates a dilemmafor compensation planners: Should payment occur when orders are taken or whenmonies are collected? An intermediate strategy is also possible: Pay some fractionof the total incentive at the time of the order and pay the rest at the time ofcollection. Figure 6-28 describes some of the conditions that favor each approach.
Timing of Incentive Payout Affects Sales Force Motivation
Salespeople at an equipment manufacturer were paid commissions whenan order was shipped, rather than when it was booked. Because the firmhad a long product delivery cycle, salespeople often wouldn’t receive theircommission checks until 8 to 15 months after making a sale. This took awayfrom the immediate thrill of success and thus had an adverse effect onsales force motivation. In order to drive sales growth, the companychanged its pay plan so that salespeople received 35 percent of their com-mission up front when the order was booked, with the remaining 65 percentreceived upon shipping. After the change, revenue grew by 35 percent.
Figure 6-28. Conditions favoring payment of incentives at time of order versus timeof collection.
Conditions Favoring a Larger IncentivePayment at Time of Collection
Conditions Favoring a Larger IncentivePayment at Time of Order
• There is a high risk of cancellation ornonpayment.
• The salesperson participates in postorderactivity such as managing the installation.
• The company desires to acceleratecollection, and the salesperson can helpachieve this goal.
• High inflation rates exist in some countries,and it is important to collect money asquickly as possible.
• Collection is almost certain.
• Long selling cycles exist.
• The salesperson can become a nuisancefor the customer.
PAGE 224................. 15869$ $CH6 05-19-06 09:23:53 PS
C H A P T E R 7
Plan Design Part 4Determining the Right Performance–PayoutRelationship
How This Chapter Is Organized
Introduction 226Is the Most Appropriate Performance–Payout Relationship Used forDetermining the Incentive Plan Payout? 227Representing Performance–Payout Relationships 228Decision 1: Bonus Plan or Commission Plan? 231
A Comparison of Plan Structures 231Which Plan Structure Is Appropriate for the Selling Environment andManagement Culture? 235
Decision 2: Progressive or Regressive Plan? 237Payout Curve Possibilities 238Payout Curves and the Achievement of Sales Force Objectives 239
Decision 3: Caps or No Caps? 243Decision 4: Pay from the First Dollar or from Goal or a Fraction ofGoal? 245
Paying from the First Dollar 247Paying from Goal or a Fraction of Goal 248
A Company Perspective 248A Sales Force Perspective 248A Marketplace Perspective 250
Decision 5: Single Measure or Multiple Measures? 251
PAGE 225
225
................. 15869$ $CH7 05-19-06 09:23:26 PS
226 The Complete Guide to Sales Force Incentive Compensation
Single-Measure Approach 251Multiple-Measure Approaches 251
Single Measure with Multiple Qualifiers 252Multiple Independent Measures 253Multiple Integrated Measures 253
Weighted Measures 253Matrix 255
Points 257The Impact of Aggregation 259
Concluding Insights 261Use Commission Plans when Short-Term Sales Force Causality IsHigh 261Use Bonus Plans when Considerable Management Flexibility IsNeeded 261Tie Payout to Territory Goal Attainment when Sales Territories HaveUnequal Potential 262Aggregate Plan Measures Whenever Possible 262Invest in Goal-Setting Methodologies if High Plan Excitement IsDesired 262Adapt Performance–Payout Strategies for Volatile Markets 263Create Simple and Memorable Plans for High Impact 263
Introduction
The performance–payout relationship defines how incentive payments are calcu-lated and how they vary with measured performance. For example:
• Should incentive payments be determined by multiplying a commissionrate by a territory performance measure? Or should a fixed bonus amountbe paid when a specified performance level, such as a territory goal, isattained?
• Should incentive payments accelerate as performance increases, or shouldthey slow down to ensure that sales force costs are contained in volatilemarkets?
• Should sales force earnings be capped?• Should the incentive plan pay out from the first dollar, from goal, or from
some fraction of goal?• Should payout depend on a single performance measure or on multiple
measures?
PAGE 226................. 15869$ $CH7 05-19-06 09:23:27 PS
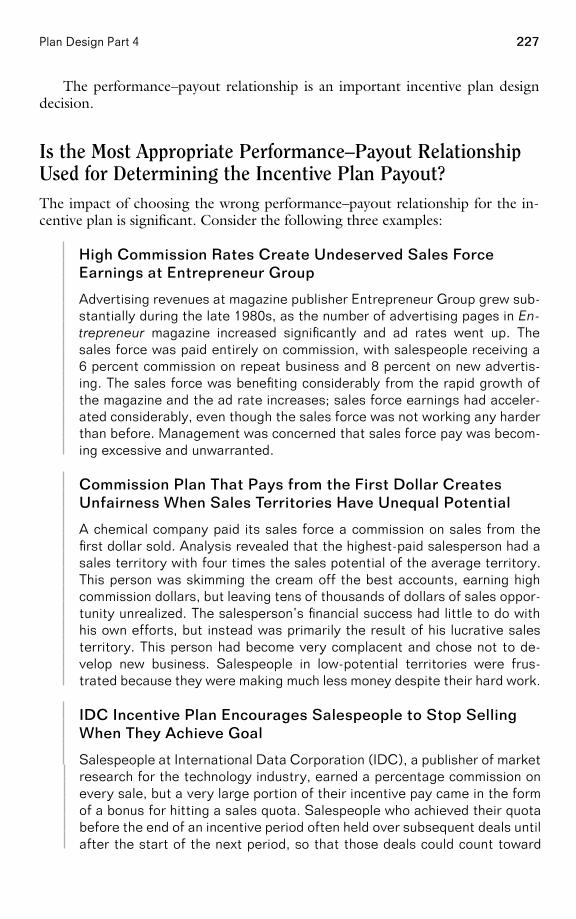
227Plan Design Part 4
The performance–payout relationship is an important incentive plan designdecision.
Is the Most Appropriate Performance–Payout RelationshipUsed for Determining the Incentive Plan Payout?The impact of choosing the wrong performance–payout relationship for the in-centive plan is significant. Consider the following three examples:
High Commission Rates Create Undeserved Sales ForceEarnings at Entrepreneur Group
Advertising revenues at magazine publisher Entrepreneur Group grew sub-stantially during the late 1980s, as the number of advertising pages in En-trepreneur magazine increased significantly and ad rates went up. Thesales force was paid entirely on commission, with salespeople receiving a6 percent commission on repeat business and 8 percent on new advertis-ing. The sales force was benefiting considerably from the rapid growth ofthe magazine and the ad rate increases; sales force earnings had acceler-ated considerably, even though the sales force was not working any harderthan before. Management was concerned that sales force pay was becom-ing excessive and unwarranted.
Commission Plan That Pays from the First Dollar CreatesUnfairness When Sales Territories Have Unequal Potential
A chemical company paid its sales force a commission on sales from thefirst dollar sold. Analysis revealed that the highest-paid salesperson had asales territory with four times the sales potential of the average territory.This person was skimming the cream off the best accounts, earning highcommission dollars, but leaving tens of thousands of dollars of sales oppor-tunity unrealized. The salesperson’s financial success had little to do withhis own efforts, but instead was primarily the result of his lucrative salesterritory. This person had become very complacent and chose not to de-velop new business. Salespeople in low-potential territories were frus-trated because they were making much less money despite their hard work.
IDC Incentive Plan Encourages Salespeople to Stop SellingWhen They Achieve Goal
Salespeople at International Data Corporation (IDC), a publisher of marketresearch for the technology industry, earned a percentage commission onevery sale, but a very large portion of their incentive pay came in the formof a bonus for hitting a sales quota. Salespeople who achieved their quotabefore the end of an incentive period often held over subsequent deals untilafter the start of the next period, so that those deals could count toward
PAGE 227................. 15869$ $CH7 05-19-06 09:23:27 PS
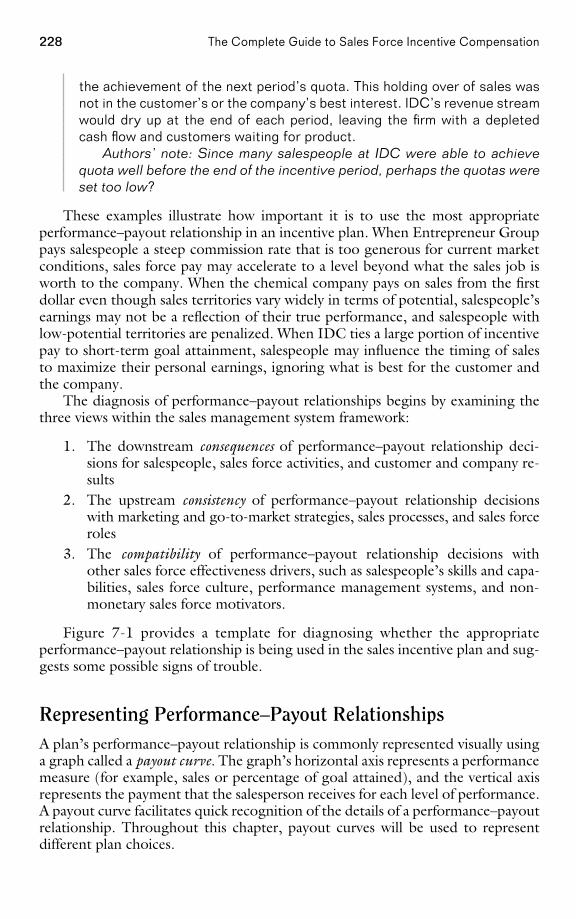
228 The Complete Guide to Sales Force Incentive Compensation
the achievement of the next period’s quota. This holding over of sales wasnot in the customer’s or the company’s best interest. IDC’s revenue streamwould dry up at the end of each period, leaving the firm with a depletedcash flow and customers waiting for product.
Authors’ note: Since many salespeople at IDC were able to achievequota well before the end of the incentive period, perhaps the quotas wereset too low?
These examples illustrate how important it is to use the most appropriateperformance–payout relationship in an incentive plan. When Entrepreneur Grouppays salespeople a steep commission rate that is too generous for current marketconditions, sales force pay may accelerate to a level beyond what the sales job isworth to the company. When the chemical company pays on sales from the firstdollar even though sales territories vary widely in terms of potential, salespeople’searnings may not be a reflection of their true performance, and salespeople withlow-potential territories are penalized. When IDC ties a large portion of incentivepay to short-term goal attainment, salespeople may influence the timing of salesto maximize their personal earnings, ignoring what is best for the customer andthe company.
The diagnosis of performance–payout relationships begins by examining thethree views within the sales management system framework:
1. The downstream consequences of performance–payout relationship deci-sions for salespeople, sales force activities, and customer and company re-sults
2. The upstream consistency of performance–payout relationship decisionswith marketing and go-to-market strategies, sales processes, and sales forceroles
3. The compatibility of performance–payout relationship decisions withother sales force effectiveness drivers, such as salespeople’s skills and capa-bilities, sales force culture, performance management systems, and non-monetary sales force motivators.
Figure 7-1 provides a template for diagnosing whether the appropriateperformance–payout relationship is being used in the sales incentive plan and sug-gests some possible signs of trouble.
Representing Performance–Payout RelationshipsA plan’s performance–payout relationship is commonly represented visually usinga graph called a payout curve. The graph’s horizontal axis represents a performancemeasure (for example, sales or percentage of goal attained), and the vertical axisrepresents the payment that the salesperson receives for each level of performance.A payout curve facilitates quick recognition of the details of a performance–payoutrelationship. Throughout this chapter, payout curves will be used to representdifferent plan choices.
PAGE 228................. 15869$ $CH7 05-19-06 09:23:28 PS
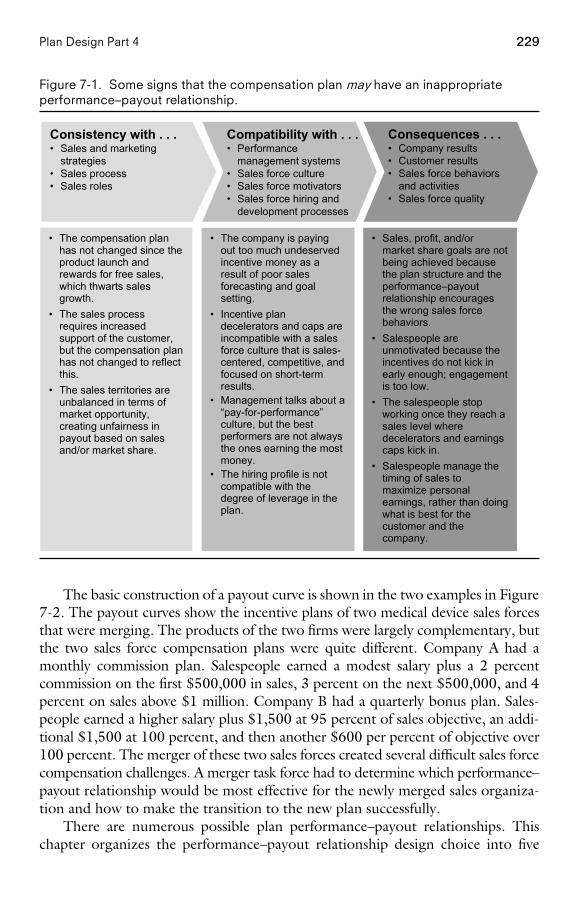
229Plan Design Part 4
Figure 7-1. Some signs that the compensation plan may have an inappropriateperformance–payout relationship.
• The company is payingout too much undeservedincentive money as aresult of poor salesforecasting and goalsetting.
• Incentive plandecelerators and caps areincompatible with a salesforce culture that is sales-centered, competitive, andfocused on short-termresults.
• Management talks about a“pay-for-performance”culture, but the bestperformers are not alwaysthe ones earning the mostmoney.
• The hiring profile is notcompatible with thedegree of leverage in theplan.
• Sales, profit, and/ormarket share goals are notbeing achieved becausethe plan structure and theperformance–payoutrelationship encouragesthe wrong sales forcebehaviors.
• Salespeople areunmotivated because theincentives do not kick inearly enough; engagementis too low.
• The salespeople stopworking once they reach asales level wheredecelerators and earningscaps kick in.
• Salespeople manage thetiming of sales tomaximize personalearnings, rather than doingwhat is best for thecustomer and thecompany.
• The compensation planhas not changed since theproduct launch andrewards for free sales,which thwarts salesgrowth.
• The sales processrequires increasedsupport of the customer,but the compensation planhas not changed to reflectthis.
• The sales territories areunbalanced in terms ofmarket opportunity,creating unfairness inpayout based on salesand/or market share.
Compatibility with . . .• Performance
management systems• Sales force culture• Sales force motivators• Sales force hiring and
development processes
Consequences . . .• Company results• Customer results• Sales force behaviors
and activities• Sales force quality
Consistency with . . .• Sales and marketing
strategies• Sales process• Sales roles
The basic construction of a payout curve is shown in the two examples in Figure7-2. The payout curves show the incentive plans of two medical device sales forcesthat were merging. The products of the two firms were largely complementary, butthe two sales force compensation plans were quite different. Company A had amonthly commission plan. Salespeople earned a modest salary plus a 2 percentcommission on the first $500,000 in sales, 3 percent on the next $500,000, and 4percent on sales above $1 million. Company B had a quarterly bonus plan. Sales-people earned a higher salary plus $1,500 at 95 percent of sales objective, an addi-tional $1,500 at 100 percent, and then another $600 per percent of objective over100 percent. The merger of these two sales forces created several difficult sales forcecompensation challenges. A merger task force had to determine which performance–payout relationship would be most effective for the newly merged sales organiza-tion and how to make the transition to the new plan successfully.
There are numerous possible plan performance–payout relationships. Thischapter organizes the performance–payout relationship design choice into five
PAGE 229................. 15869$ $CH7 05-19-06 09:23:29 PS
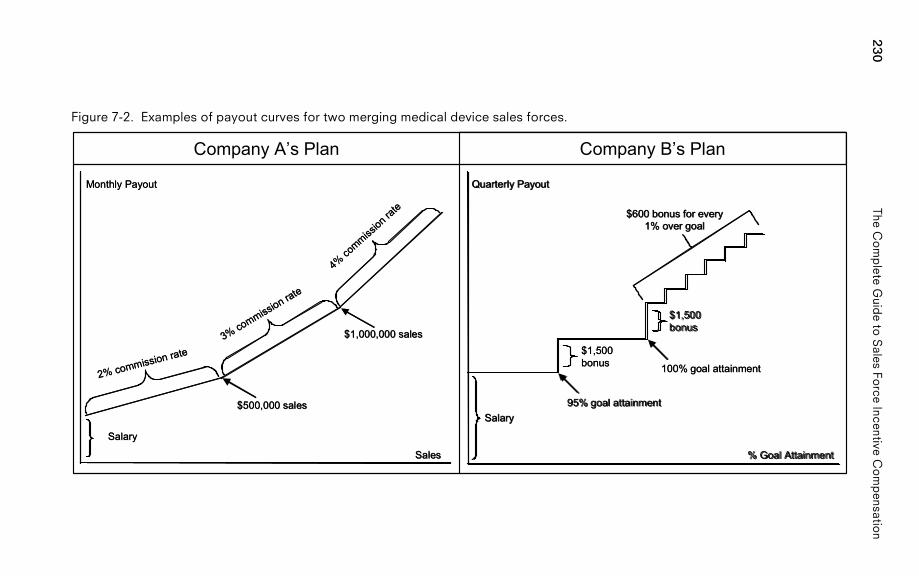
230The
Co
mp
leteG
uide
toS
alesFo
rceIncentive
Co
mp
ensation
Figure 7-2. Examples of payout curves for two merging medical device sales forces.
Company B’s PlanCompany A’s Plan
$500,000 sales
2% commission rate
Monthly Payout
Sales
3% commission rate
4% co
mmission
rate
$1,000,000 sales
Salary
$500,000 sales
2% commission rate
Monthly Payout
Sales
3% commission rate
4% co
mmission
rate
$1,000,000 sales
Salary
Quarterly Payout
% Goal Attainment
95% goal attainment
$600 bonus for every 1% over goal
$1,500bonus 100% goal attainment
Salary
$1,500 bonus
Quarterly Payout
% Goal Attainment
95% goal attainment
$600 bonus for every 1% over goal
$1,500bonus 100% goal attainment
Salary
$1,500 bonus
PA
GE
230.................15869$
$CH
705-19-06
09:23:30P
S
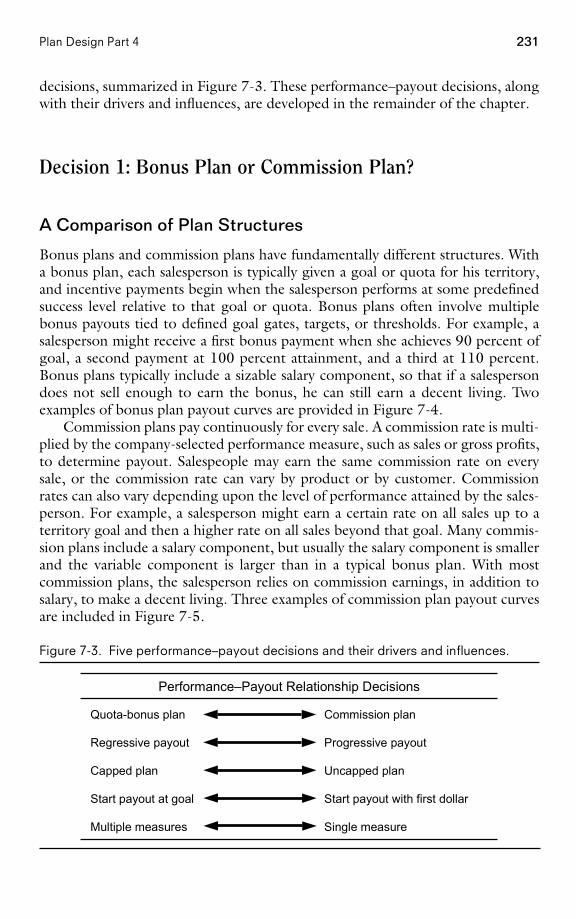
231Plan Design Part 4
decisions, summarized in Figure 7-3. These performance–payout decisions, alongwith their drivers and influences, are developed in the remainder of the chapter.
Decision 1: Bonus Plan or Commission Plan?
A Comparison of Plan Structures
Bonus plans and commission plans have fundamentally different structures. Witha bonus plan, each salesperson is typically given a goal or quota for his territory,and incentive payments begin when the salesperson performs at some predefinedsuccess level relative to that goal or quota. Bonus plans often involve multiplebonus payouts tied to defined goal gates, targets, or thresholds. For example, asalesperson might receive a first bonus payment when she achieves 90 percent ofgoal, a second payment at 100 percent attainment, and a third at 110 percent.Bonus plans typically include a sizable salary component, so that if a salespersondoes not sell enough to earn the bonus, he can still earn a decent living. Twoexamples of bonus plan payout curves are provided in Figure 7-4.
Commission plans pay continuously for every sale. A commission rate is multi-plied by the company-selected performance measure, such as sales or gross profits,to determine payout. Salespeople may earn the same commission rate on everysale, or the commission rate can vary by product or by customer. Commissionrates can also vary depending upon the level of performance attained by the sales-person. For example, a salesperson might earn a certain rate on all sales up to aterritory goal and then a higher rate on all sales beyond that goal. Many commis-sion plans include a salary component, but usually the salary component is smallerand the variable component is larger than in a typical bonus plan. With mostcommission plans, the salesperson relies on commission earnings, in addition tosalary, to make a decent living. Three examples of commission plan payout curvesare included in Figure 7-5.
Figure 7-3. Five performance–payout decisions and their drivers and influences.
Single measureMultiple measures
Start payout with first dollarStart payout at goal
Uncapped planCapped plan
Progressive payoutRegressive payout
Commission planQuota-bonus plan
Performance–Payout Relationship Decisions
PAGE 231................. 15869$ $CH7 05-19-06 09:23:31 PS
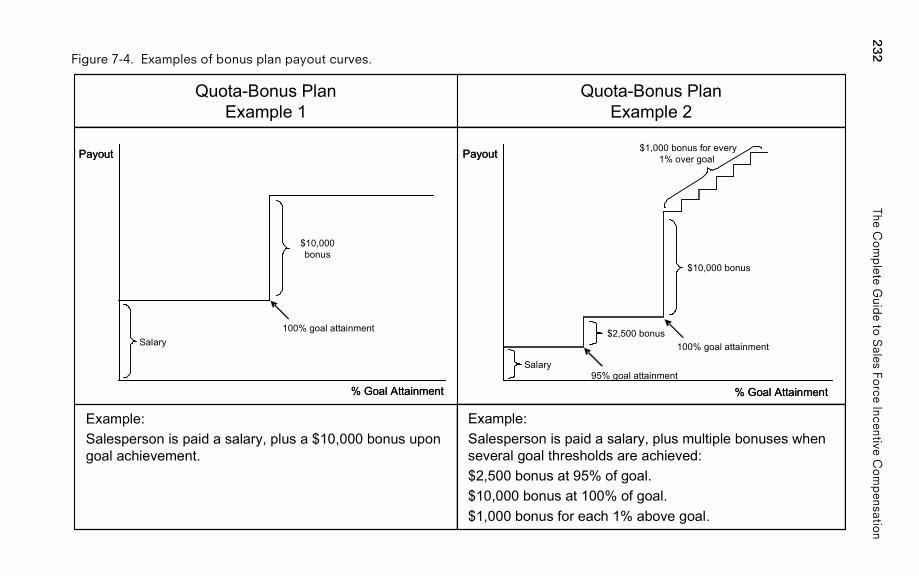
232The
Co
mp
leteG
uide
toS
alesFo
rceIncentive
Co
mp
ensation
Figure 7-4. Examples of bonus plan payout curves.
Example:Salesperson is paid a salary, plus multiple bonuses whenseveral goal thresholds are achieved:$2,500 bonus at 95% of goal.$10,000 bonus at 100% of goal.$1,000 bonus for each 1% above goal.
Example:Salesperson is paid a salary, plus a $10,000 bonus upongoal achievement.
Quota-Bonus PlanExample 2
Quota-Bonus PlanExample 1
% Goal Attainment
Payout
% Goal Attainment
Payout
$10,000bonus
Salary100% goal attainment
% Goal Attainment
Payout
% Goal Attainment
Payout $1,000 bonus for every1% over goal
100% goal attainment
95% goal attainmentSalary
$2,500 bonus
$10,000 bonus
PA
GE
232.................15869$
$CH
705-19-06
09:23:32P
S
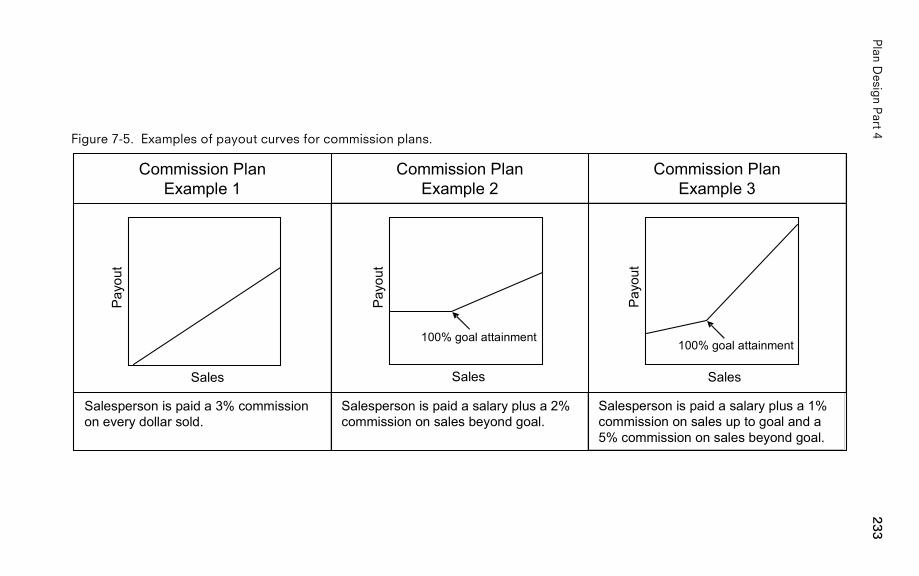
233P
lanD
esign
Part
4
Figure 7-5. Examples of payout curves for commission plans.
Salesperson is paid a salary plus a 1%commission on sales up to goal and a5% commission on sales beyond goal.
Salesperson is paid a salary plus a 2%commission on sales beyond goal.
Salesperson is paid a 3% commissionon every dollar sold.
Commission PlanExample 3
Commission PlanExample 2
Commission PlanExample 1
Sales
Pay
out
100% goal attainment
SalesP
ayou
tSales
Pay
out
100% goal attainment
PA
GE
233.................15869$
$CH
705-19-06
09:23:33P
S
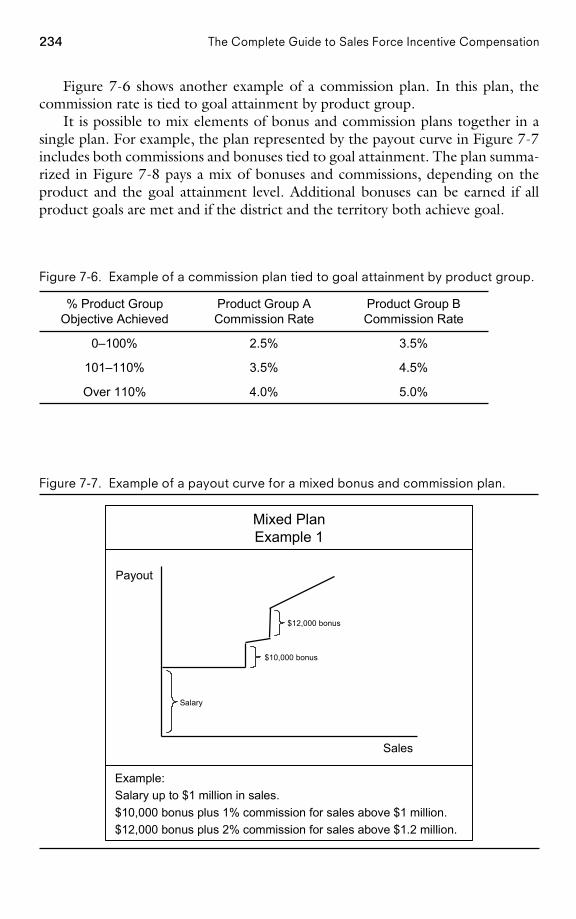
234 The Complete Guide to Sales Force Incentive Compensation
Figure 7-6 shows another example of a commission plan. In this plan, thecommission rate is tied to goal attainment by product group.
It is possible to mix elements of bonus and commission plans together in asingle plan. For example, the plan represented by the payout curve in Figure 7-7includes both commissions and bonuses tied to goal attainment. The plan summa-rized in Figure 7-8 pays a mix of bonuses and commissions, depending on theproduct and the goal attainment level. Additional bonuses can be earned if allproduct goals are met and if the district and the territory both achieve goal.
Figure 7-6. Example of a commission plan tied to goal attainment by product group.
5.0%4.0%Over 110%
4.5%3.5%101–110%
3.5%2.5%0–100%
Product Group BCommission Rate
Product Group ACommission Rate
% Product GroupObjective Achieved
Figure 7-7. Example of a payout curve for a mixed bonus and commission plan.
Example:Salary up to $1 million in sales.$10,000 bonus plus 1% commission for sales above $1 million.$12,000 bonus plus 2% commission for sales above $1.2 million.
Mixed PlanExample 1
Payout
Sales
Salary
$10,000 bonus
$12,000 bonus
PAGE 234................. 15869$ $CH7 05-19-06 09:23:35 PS
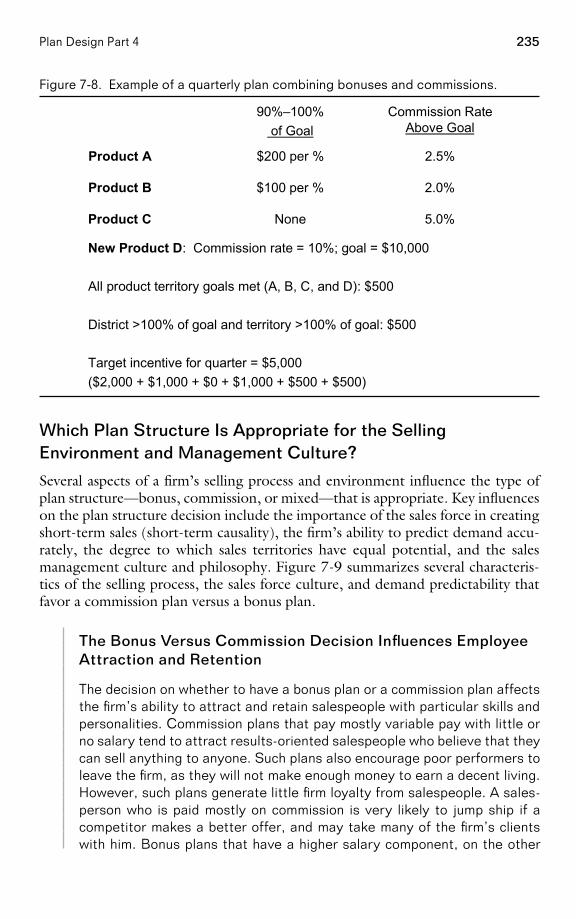
235Plan Design Part 4
Figure 7-8. Example of a quarterly plan combining bonuses and commissions.
New Product D: Commission rate = 10%; goal = $10,000
All product territory goals met (A, B, C, and D): $500
District >100% of goal and territory >100% of goal: $500
Target incentive for quarter = $5,000($2,000 + $1,000 + $0 + $1,000 + $500 + $500)
5.0%NoneProduct C
2.0%$100 per %Product B
2.5%$200 per %Product A
Commission RateAbove Goal
90%–100% of Goal
Which Plan Structure Is Appropriate for the SellingEnvironment and Management Culture?
Several aspects of a firm’s selling process and environment influence the type ofplan structure—bonus, commission, or mixed—that is appropriate. Key influenceson the plan structure decision include the importance of the sales force in creatingshort-term sales (short-term causality), the firm’s ability to predict demand accu-rately, the degree to which sales territories have equal potential, and the salesmanagement culture and philosophy. Figure 7-9 summarizes several characteris-tics of the selling process, the sales force culture, and demand predictability thatfavor a commission plan versus a bonus plan.
The Bonus Versus Commission Decision Influences EmployeeAttraction and Retention
The decision on whether to have a bonus plan or a commission plan affectsthe firm’s ability to attract and retain salespeople with particular skills andpersonalities. Commission plans that pay mostly variable pay with little orno salary tend to attract results-oriented salespeople who believe that theycan sell anything to anyone. Such plans also encourage poor performers toleave the firm, as they will not make enough money to earn a decent living.However, such plans generate little firm loyalty from salespeople. A sales-person who is paid mostly on commission is very likely to jump ship if acompetitor makes a better offer, and may take many of the firm’s clientswith him. Bonus plans that have a higher salary component, on the other
PAGE 235................. 15869$ $CH7 05-19-06 09:23:36 PS
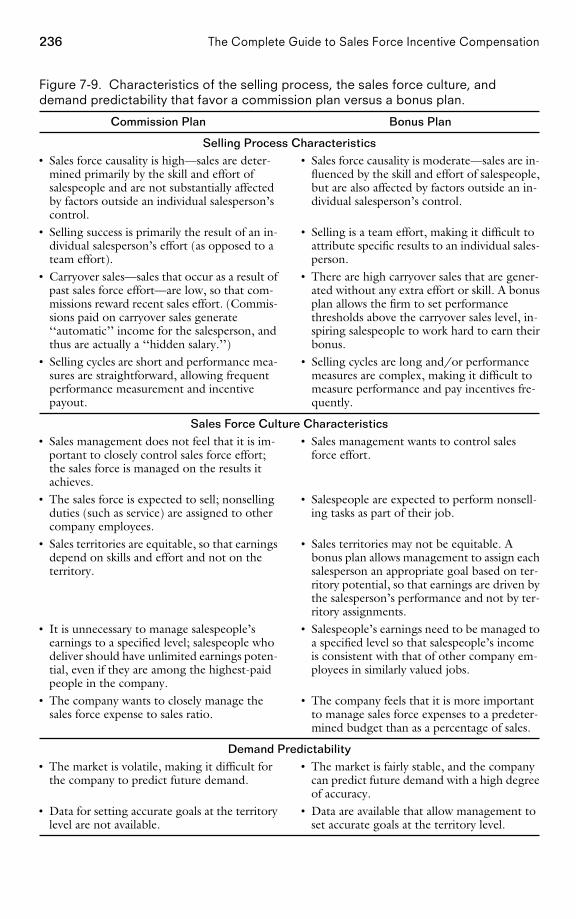
236 The Complete Guide to Sales Force Incentive Compensation
Figure 7-9. Characteristics of the selling process, the sales force culture, anddemand predictability that favor a commission plan versus a bonus plan.
Commission Plan Bonus Plan
Selling Process Characteristics• Sales force causality is high—sales are deter- • Sales force causality is moderate—sales are in-
mined primarily by the skill and effort of fluenced by the skill and effort of salespeople,salespeople and are not substantially affected but are also affected by factors outside an in-by factors outside an individual salesperson’s dividual salesperson’s control.control.
• Selling success is primarily the result of an in- • Selling is a team effort, making it difficult todividual salesperson’s effort (as opposed to a attribute specific results to an individual sales-team effort). person.
• Carryover sales—sales that occur as a result of • There are high carryover sales that are gener-past sales force effort—are low, so that com- ated without any extra effort or skill. A bonusmissions reward recent sales effort. (Commis- plan allows the firm to set performancesions paid on carryover sales generate thresholds above the carryover sales level, in-‘‘automatic’’ income for the salesperson, and spiring salespeople to work hard to earn theirthus are actually a ‘‘hidden salary.’’) bonus.
• Selling cycles are short and performance mea- • Selling cycles are long and/or performancesures are straightforward, allowing frequent measures are complex, making it difficult toperformance measurement and incentive measure performance and pay incentives fre-payout. quently.
Sales Force Culture Characteristics• Sales management does not feel that it is im- • Sales management wants to control sales
portant to closely control sales force effort; force effort.the sales force is managed on the results itachieves.
• The sales force is expected to sell; nonselling • Salespeople are expected to perform nonsell-duties (such as service) are assigned to other ing tasks as part of their job.company employees.
• Sales territories are equitable, so that earnings • Sales territories may not be equitable. Adepend on skills and effort and not on the bonus plan allows management to assign eachterritory. salesperson an appropriate goal based on ter-
ritory potential, so that earnings are driven bythe salesperson’s performance and not by ter-ritory assignments.
• It is unnecessary to manage salespeople’s • Salespeople’s earnings need to be managed toearnings to a specified level; salespeople who a specified level so that salespeople’s incomedeliver should have unlimited earnings poten- is consistent with that of other company em-tial, even if they are among the highest-paid ployees in similarly valued jobs.people in the company.
• The company wants to closely manage the • The company feels that it is more importantsales force expense to sales ratio. to manage sales force expenses to a predeter-
mined budget than as a percentage of sales.
Demand Predictability• The market is volatile, making it difficult for • The market is fairly stable, and the company
the company to predict future demand. can predict future demand with a high degreeof accuracy.
• Data for setting accurate goals at the territory • Data are available that allow management tolevel are not available. set accurate goals at the territory level.
PAGE 236................. 15869$ $CH7 05-19-06 09:23:37 PS
237Plan Design Part 4
hand, attract salespeople with a longer-term focus who are more likely tostay with the firm. They also attract salespeople who, in addition to selling,are interested in problem solving, consulting, and servicing customers.Thus, the desired firm culture and the sales force skills necessary for imple-menting an effective selling process are important considerations whenmaking the commission versus bonus plan decision.
Commission Plan Makes Change Difficult at a ChemicalCompany
Recall the chemical company described in the introductory section of thischapter. The company paid its sales force a commission on sales from thefirst dollar sold, despite the fact that sales territories varied greatly interms of market potential. Salespeople in high-potential territories couldcall on the easy-to-sell accounts and earn high commissions without havingto work very hard. They did not need to develop new business. Meanwhile,millions of dollars of sales opportunity companywide were unrealized. Inorder to improve customer coverage and give everyone in the sales force amore equal chance to earn higher commissions, management consideredrealigning sales territories. However, it feared that territory changes wouldbe met with considerable resistance by salespeople in lucrative, high-potential territories. These salespeople controlled many of the firm’s mostimportant customer relationships, and management did not want to risklosing those relationships. Thus, management was forced to back off fromits effort to make sales territory changes.
A solution to this common problem is to change the structure of thesales force compensation plan. A goal-based plan provides greater flexi-bility to make territory changes than a commission plan that pays fromthe first dollar does, because territory quotas or goals can change when-ever territories are realigned. Thus, if a salesperson with a high-potentialterritory has accounts taken away, her quota is adjusted downward ap-propriately. Sales forces that anticipate a need for future territory re-alignment—such as those that are planning to expand—should considerimplementing a quota-based plan rather than a plan that pays from dollarone in order to maintain greater flexibility.
Decision 2: Progressive or Regressive Plan?
An incentive plan can include many possible relationships between performanceand payout. The most appropriate relationship—or the shape of the payoutcurve—is driven by the degree to which the firm can predict demand accurately,as well as by the firm’s financial and marketing goals and its management cultureand philosophy.
PAGE 237................. 15869$ $CH7 05-19-06 09:23:37 PS
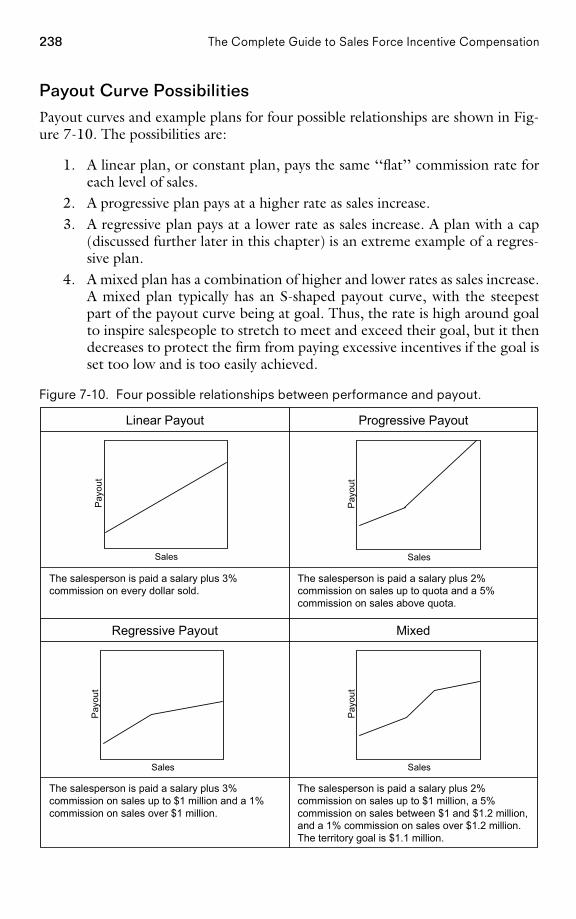
238 The Complete Guide to Sales Force Incentive Compensation
Payout Curve PossibilitiesPayout curves and example plans for four possible relationships are shown in Fig-ure 7-10. The possibilities are:
1. A linear plan, or constant plan, pays the same ‘‘flat’’ commission rate foreach level of sales.
2. A progressive plan pays at a higher rate as sales increase.3. A regressive plan pays at a lower rate as sales increase. A plan with a cap
(discussed further later in this chapter) is an extreme example of a regres-sive plan.
4. A mixed plan has a combination of higher and lower rates as sales increase.A mixed plan typically has an S-shaped payout curve, with the steepestpart of the payout curve being at goal. Thus, the rate is high around goalto inspire salespeople to stretch to meet and exceed their goal, but it thendecreases to protect the firm from paying excessive incentives if the goal isset too low and is too easily achieved.
Figure 7-10. Four possible relationships between performance and payout.
The salesperson is paid a salary plus 2%commission on sales up to $1 million, a 5%commission on sales between $1 and $1.2 million,and a 1% commission on sales over $1.2 million.The territory goal is $1.1 million.
The salesperson is paid a salary plus 3%commission on sales up to $1 million and a 1%commission on sales over $1 million.
MixedRegressive Payout
The salesperson is paid a salary plus 2%commission on sales up to quota and a 5%commission on sales above quota.
The salesperson is paid a salary plus 3%commission on every dollar sold.
Progressive PayoutLinear Payout
Sales
Pay
out
Sales
Pay
out
Sales
Pay
out
Sales
Pay
out
PAGE 238................. 15869$ $CH7 05-19-06 09:23:39 PS
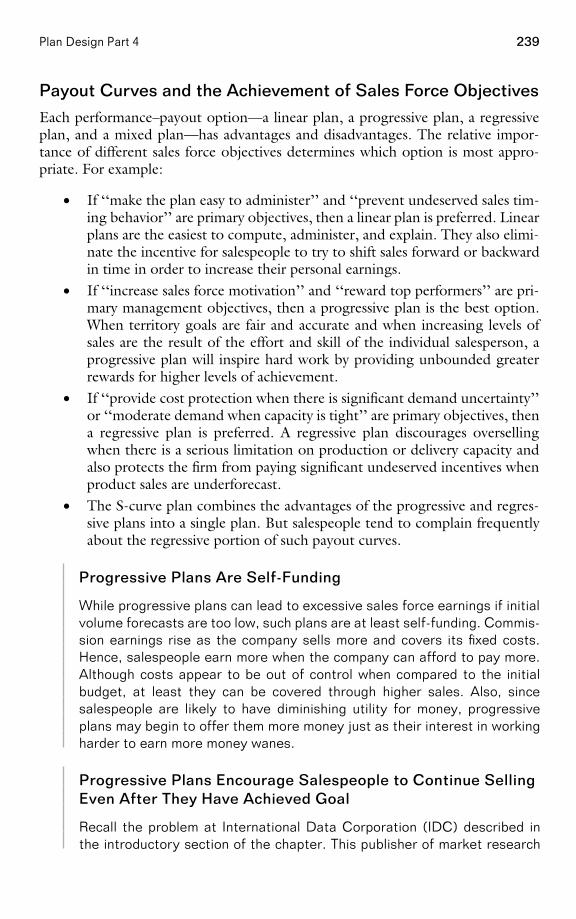
239Plan Design Part 4
Payout Curves and the Achievement of Sales Force Objectives
Each performance–payout option—a linear plan, a progressive plan, a regressiveplan, and a mixed plan—has advantages and disadvantages. The relative impor-tance of different sales force objectives determines which option is most appro-priate. For example:
• If ‘‘make the plan easy to administer’’ and ‘‘prevent undeserved sales tim-ing behavior’’ are primary objectives, then a linear plan is preferred. Linearplans are the easiest to compute, administer, and explain. They also elimi-nate the incentive for salespeople to try to shift sales forward or backwardin time in order to increase their personal earnings.
• If ‘‘increase sales force motivation’’ and ‘‘reward top performers’’ are pri-mary management objectives, then a progressive plan is the best option.When territory goals are fair and accurate and when increasing levels ofsales are the result of the effort and skill of the individual salesperson, aprogressive plan will inspire hard work by providing unbounded greaterrewards for higher levels of achievement.
• If ‘‘provide cost protection when there is significant demand uncertainty’’or ‘‘moderate demand when capacity is tight’’ are primary objectives, thena regressive plan is preferred. A regressive plan discourages oversellingwhen there is a serious limitation on production or delivery capacity andalso protects the firm from paying significant undeserved incentives whenproduct sales are underforecast.
• The S-curve plan combines the advantages of the progressive and regres-sive plans into a single plan. But salespeople tend to complain frequentlyabout the regressive portion of such payout curves.
Progressive Plans Are Self-Funding
While progressive plans can lead to excessive sales force earnings if initialvolume forecasts are too low, such plans are at least self-funding. Commis-sion earnings rise as the company sells more and covers its fixed costs.Hence, salespeople earn more when the company can afford to pay more.Although costs appear to be out of control when compared to the initialbudget, at least they can be covered through higher sales. Also, sincesalespeople are likely to have diminishing utility for money, progressiveplans may begin to offer them more money just as their interest in workingharder to earn more money wanes.
Progressive Plans Encourage Salespeople to Continue SellingEven After They Have Achieved Goal
Recall the problem at International Data Corporation (IDC) described inthe introductory section of the chapter. This publisher of market research
PAGE 239................. 15869$ $CH7 05-19-06 09:23:39 PS
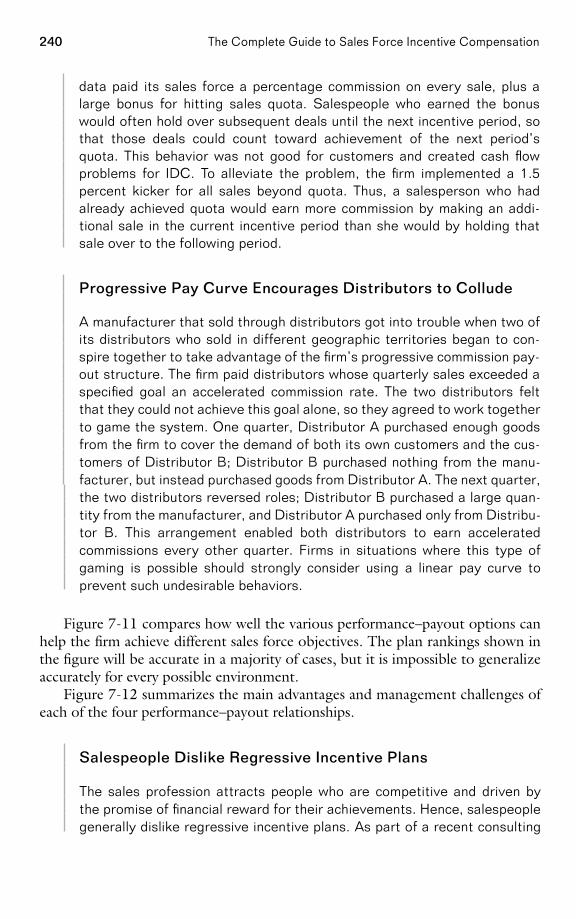
240 The Complete Guide to Sales Force Incentive Compensation
data paid its sales force a percentage commission on every sale, plus alarge bonus for hitting sales quota. Salespeople who earned the bonuswould often hold over subsequent deals until the next incentive period, sothat those deals could count toward achievement of the next period’squota. This behavior was not good for customers and created cash flowproblems for IDC. To alleviate the problem, the firm implemented a 1.5percent kicker for all sales beyond quota. Thus, a salesperson who hadalready achieved quota would earn more commission by making an addi-tional sale in the current incentive period than she would by holding thatsale over to the following period.
Progressive Pay Curve Encourages Distributors to Collude
A manufacturer that sold through distributors got into trouble when two ofits distributors who sold in different geographic territories began to con-spire together to take advantage of the firm’s progressive commission pay-out structure. The firm paid distributors whose quarterly sales exceeded aspecified goal an accelerated commission rate. The two distributors feltthat they could not achieve this goal alone, so they agreed to work togetherto game the system. One quarter, Distributor A purchased enough goodsfrom the firm to cover the demand of both its own customers and the cus-tomers of Distributor B; Distributor B purchased nothing from the manu-facturer, but instead purchased goods from Distributor A. The next quarter,the two distributors reversed roles; Distributor B purchased a large quan-tity from the manufacturer, and Distributor A purchased only from Distribu-tor B. This arrangement enabled both distributors to earn acceleratedcommissions every other quarter. Firms in situations where this type ofgaming is possible should strongly consider using a linear pay curve toprevent such undesirable behaviors.
Figure 7-11 compares how well the various performance–payout options canhelp the firm achieve different sales force objectives. The plan rankings shown inthe figure will be accurate in a majority of cases, but it is impossible to generalizeaccurately for every possible environment.
Figure 7-12 summarizes the main advantages and management challenges ofeach of the four performance–payout relationships.
Salespeople Dislike Regressive Incentive Plans
The sales profession attracts people who are competitive and driven bythe promise of financial reward for their achievements. Hence, salespeoplegenerally dislike regressive incentive plans. As part of a recent consulting
PAGE 240................. 15869$ $CH7 05-19-06 09:23:40 PS
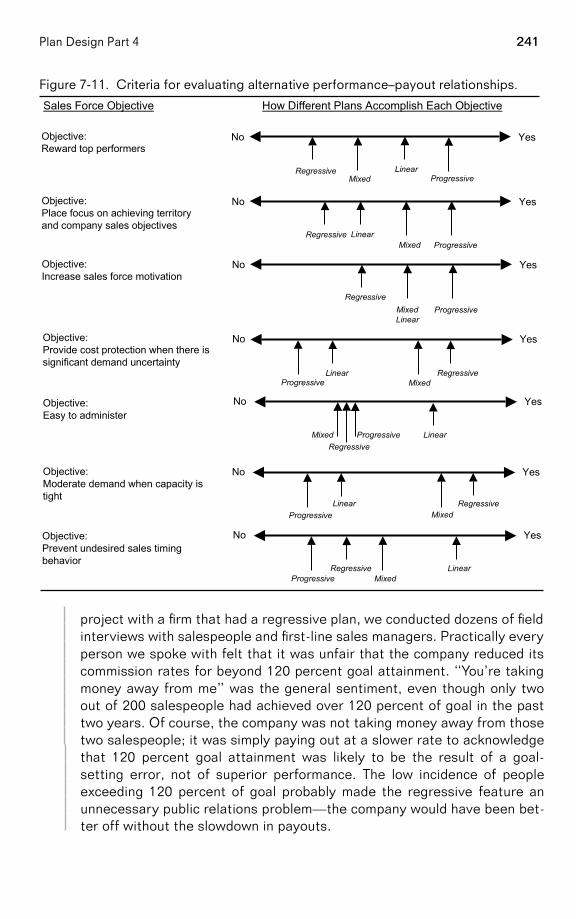
241Plan Design Part 4
Figure 7-11. Criteria for evaluating alternative performance–payout relationships.
Objective:Reward top performers
No Yes
Regressive Mixed
LinearProgressive
Objective:Place focus on achieving territoryand company sales objectives
RegressiveProgressive Mixed
Linear
No Yes
Objective:Increase sales force motivation
RegressiveMixedLinear
Progressive
No Yes
Objective:Provide cost protection when there issignificant demand uncertainty
No Yes
LinearMixed
Regressive Progressive
Objective:Easy to administer
Objective:Moderate demand when capacity istight
No Yes
Progressive Regressive
MixedLinear
Objective:Prevent undesired sales timingbehavior
No Yes
Regressive LinearProgressive Mixed
No Yes
Regressive Mixed LinearProgressive
Sales Force Objective How Different Plans Accomplish Each Objective
project with a firm that had a regressive plan, we conducted dozens of fieldinterviews with salespeople and first-line sales managers. Practically everyperson we spoke with felt that it was unfair that the company reduced itscommission rates for beyond 120 percent goal attainment. ‘‘You’re takingmoney away from me’’ was the general sentiment, even though only twoout of 200 salespeople had achieved over 120 percent of goal in the pasttwo years. Of course, the company was not taking money away from thosetwo salespeople; it was simply paying out at a slower rate to acknowledgethat 120 percent goal attainment was likely to be the result of a goal-setting error, not of superior performance. The low incidence of peopleexceeding 120 percent of goal probably made the regressive feature anunnecessary public relations problem—the company would have been bet-ter off without the slowdown in payouts.
PAGE 241................. 15869$ $CH7 05-19-06 09:23:41 PS
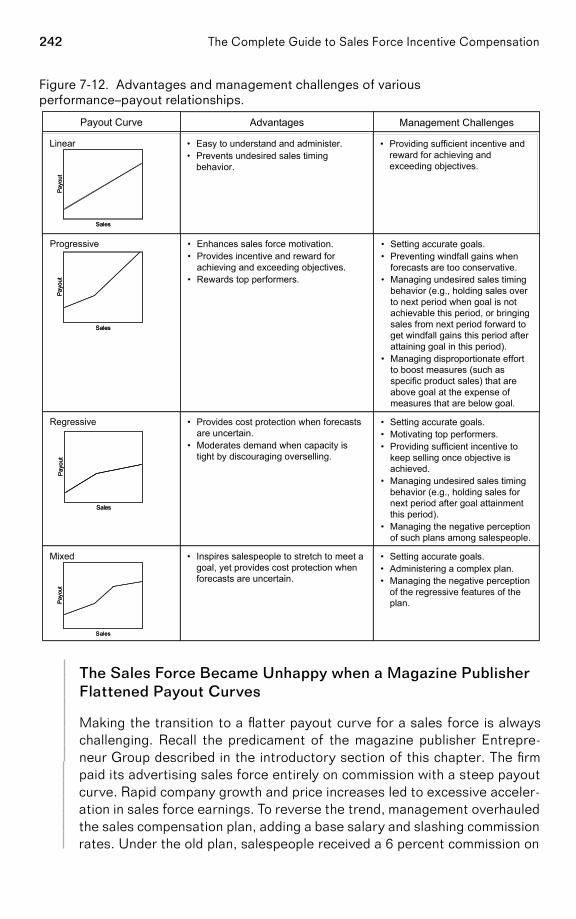
242 The Complete Guide to Sales Force Incentive Compensation
Figure 7-12. Advantages and management challenges of variousperformance–payout relationships.
• Providing sufficient incentive andreward for achieving andexceeding objectives.
• Easy to understand and administer.• Prevents undesired sales timing
behavior.
Linear
• Setting accurate goals.• Administering a complex plan.• Managing the negative perception
of the regressive features of theplan.
• Inspires salespeople to stretch to meet agoal, yet provides cost protection whenforecasts are uncertain.
Mixed
• Setting accurate goals.• Motivating top performers.• Providing sufficient incentive to
keep selling once objective isachieved.
• Managing undesired sales timingbehavior (e.g., holding sales fornext period after goal attainmentthis period).
• Managing the negative perceptionof such plans among salespeople.
• Provides cost protection when forecastsare uncertain.
• Moderates demand when capacity istight by discouraging overselling.
Regressive
• Setting accurate goals.• Preventing windfall gains when
forecasts are too conservative.• Managing undesired sales timing
behavior (e.g., holding sales overto next period when goal is notachievable this period, or bringingsales from next period forward toget windfall gains this period afterattaining goal in this period).
• Managing disproportionate effortto boost measures (such asspecific product sales) that areabove goal at the expense ofmeasures that are below goal.
• Enhances sales force motivation.• Provides incentive and reward for
achieving and exceeding objectives.• Rewards top performers.
Progressive
Management ChallengesAdvantagesPayout Curve
Sales
Payo
ut
Sales
Payo
ut
Sales
Payo
ut
Sales
Payo
ut
Sales
Pay
out
Sales
Pay
out
Sales
Payo
ut
Sales
Payo
ut
The Sales Force Became Unhappy when a Magazine PublisherFlattened Payout Curves
Making the transition to a flatter payout curve for a sales force is alwayschallenging. Recall the predicament of the magazine publisher Entrepre-neur Group described in the introductory section of this chapter. The firmpaid its advertising sales force entirely on commission with a steep payoutcurve. Rapid company growth and price increases led to excessive acceler-ation in sales force earnings. To reverse the trend, management overhauledthe sales compensation plan, adding a base salary and slashing commissionrates. Under the old plan, salespeople received a 6 percent commission on
PAGE 242................. 15869$ $CH7 05-19-06 09:23:42 PS
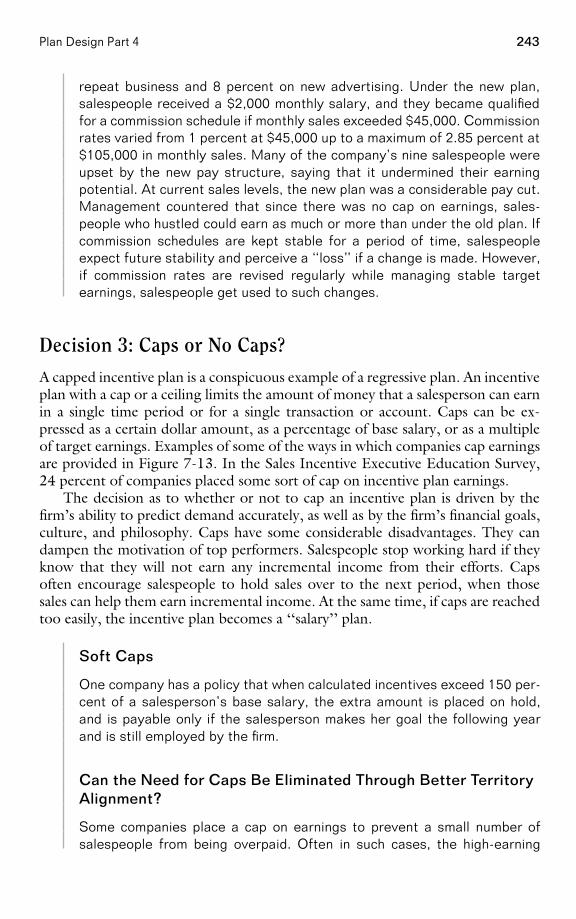
243Plan Design Part 4
repeat business and 8 percent on new advertising. Under the new plan,salespeople received a $2,000 monthly salary, and they became qualifiedfor a commission schedule if monthly sales exceeded $45,000. Commissionrates varied from 1 percent at $45,000 up to a maximum of 2.85 percent at$105,000 in monthly sales. Many of the company’s nine salespeople wereupset by the new pay structure, saying that it undermined their earningpotential. At current sales levels, the new plan was a considerable pay cut.Management countered that since there was no cap on earnings, sales-people who hustled could earn as much or more than under the old plan. Ifcommission schedules are kept stable for a period of time, salespeopleexpect future stability and perceive a ‘‘loss’’ if a change is made. However,if commission rates are revised regularly while managing stable targetearnings, salespeople get used to such changes.
Decision 3: Caps or No Caps?
A capped incentive plan is a conspicuous example of a regressive plan. An incentiveplan with a cap or a ceiling limits the amount of money that a salesperson can earnin a single time period or for a single transaction or account. Caps can be ex-pressed as a certain dollar amount, as a percentage of base salary, or as a multipleof target earnings. Examples of some of the ways in which companies cap earningsare provided in Figure 7-13. In the Sales Incentive Executive Education Survey,24 percent of companies placed some sort of cap on incentive plan earnings.
The decision as to whether or not to cap an incentive plan is driven by thefirm’s ability to predict demand accurately, as well as by the firm’s financial goals,culture, and philosophy. Caps have some considerable disadvantages. They candampen the motivation of top performers. Salespeople stop working hard if theyknow that they will not earn any incremental income from their efforts. Capsoften encourage salespeople to hold sales over to the next period, when thosesales can help them earn incremental income. At the same time, if caps are reachedtoo easily, the incentive plan becomes a ‘‘salary’’ plan.
Soft Caps
One company has a policy that when calculated incentives exceed 150 per-cent of a salesperson’s base salary, the extra amount is placed on hold,and is payable only if the salesperson makes her goal the following yearand is still employed by the firm.
Can the Need for Caps Be Eliminated Through Better TerritoryAlignment?
Some companies place a cap on earnings to prevent a small number ofsalespeople from being overpaid. Often in such cases, the high-earning
PAGE 243................. 15869$ $CH7 05-19-06 09:23:42 PS
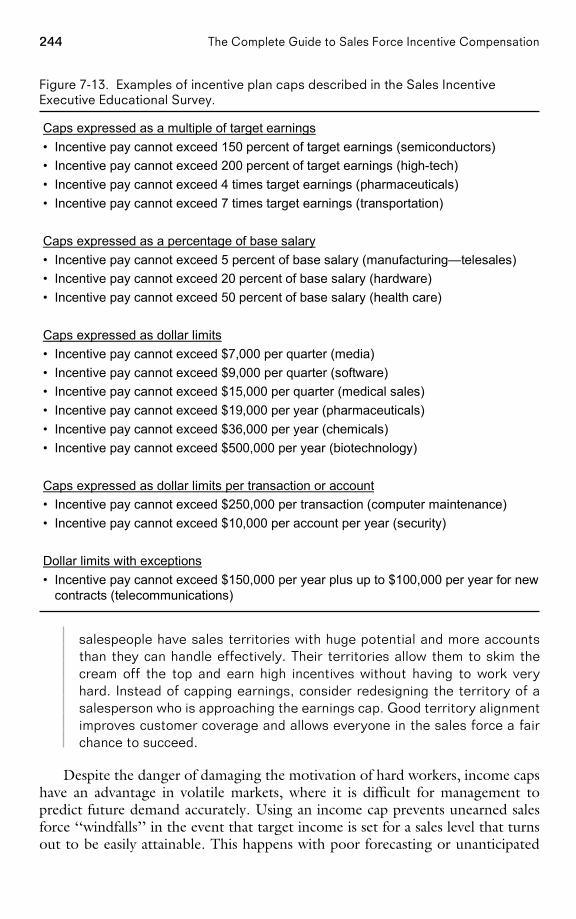
244 The Complete Guide to Sales Force Incentive Compensation
Figure 7-13. Examples of incentive plan caps described in the Sales IncentiveExecutive Educational Survey.
Caps expressed as a multiple of target earnings• Incentive pay cannot exceed 150 percent of target earnings (semiconductors)• Incentive pay cannot exceed 200 percent of target earnings (high-tech)• Incentive pay cannot exceed 4 times target earnings (pharmaceuticals)• Incentive pay cannot exceed 7 times target earnings (transportation)
Caps expressed as a percentage of base salary• Incentive pay cannot exceed 5 percent of base salary (manufacturing—telesales)• Incentive pay cannot exceed 20 percent of base salary (hardware)• Incentive pay cannot exceed 50 percent of base salary (health care)
Caps expressed as dollar limits• Incentive pay cannot exceed $7,000 per quarter (media)• Incentive pay cannot exceed $9,000 per quarter (software)• Incentive pay cannot exceed $15,000 per quarter (medical sales)• Incentive pay cannot exceed $19,000 per year (pharmaceuticals)• Incentive pay cannot exceed $36,000 per year (chemicals)• Incentive pay cannot exceed $500,000 per year (biotechnology)
Caps expressed as dollar limits per transaction or account• Incentive pay cannot exceed $250,000 per transaction (computer maintenance)• Incentive pay cannot exceed $10,000 per account per year (security)
Dollar limits with exceptions• Incentive pay cannot exceed $150,000 per year plus up to $100,000 per year for new
contracts (telecommunications)
salespeople have sales territories with huge potential and more accountsthan they can handle effectively. Their territories allow them to skim thecream off the top and earn high incentives without having to work veryhard. Instead of capping earnings, consider redesigning the territory of asalesperson who is approaching the earnings cap. Good territory alignmentimproves customer coverage and allows everyone in the sales force a fairchance to succeed.
Despite the danger of damaging the motivation of hard workers, income capshave an advantage in volatile markets, where it is difficult for management topredict future demand accurately. Using an income cap prevents unearned salesforce ‘‘windfalls’’ in the event that target income is set for a sales level that turnsout to be easily attainable. This happens with poor forecasting or unanticipated
PAGE 244................. 15869$ $CH7 05-19-06 09:23:44 PS
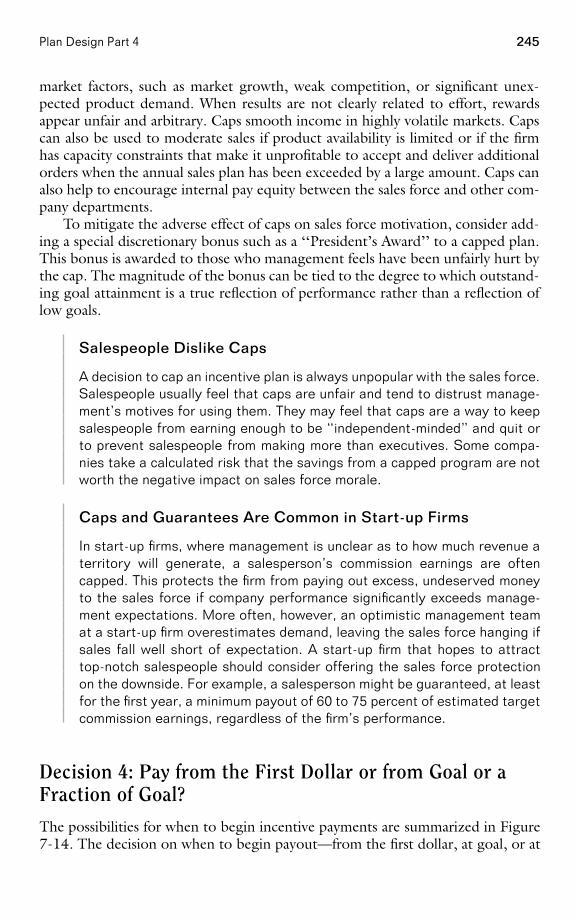
245Plan Design Part 4
market factors, such as market growth, weak competition, or significant unex-pected product demand. When results are not clearly related to effort, rewardsappear unfair and arbitrary. Caps smooth income in highly volatile markets. Capscan also be used to moderate sales if product availability is limited or if the firmhas capacity constraints that make it unprofitable to accept and deliver additionalorders when the annual sales plan has been exceeded by a large amount. Caps canalso help to encourage internal pay equity between the sales force and other com-pany departments.
To mitigate the adverse effect of caps on sales force motivation, consider add-ing a special discretionary bonus such as a ‘‘President’s Award’’ to a capped plan.This bonus is awarded to those who management feels have been unfairly hurt bythe cap. The magnitude of the bonus can be tied to the degree to which outstand-ing goal attainment is a true reflection of performance rather than a reflection oflow goals.
Salespeople Dislike Caps
A decision to cap an incentive plan is always unpopular with the sales force.Salespeople usually feel that caps are unfair and tend to distrust manage-ment’s motives for using them. They may feel that caps are a way to keepsalespeople from earning enough to be ‘‘independent-minded’’ and quit orto prevent salespeople from making more than executives. Some compa-nies take a calculated risk that the savings from a capped program are notworth the negative impact on sales force morale.
Caps and Guarantees Are Common in Start-up Firms
In start-up firms, where management is unclear as to how much revenue aterritory will generate, a salesperson’s commission earnings are oftencapped. This protects the firm from paying out excess, undeserved moneyto the sales force if company performance significantly exceeds manage-ment expectations. More often, however, an optimistic management teamat a start-up firm overestimates demand, leaving the sales force hanging ifsales fall well short of expectation. A start-up firm that hopes to attracttop-notch salespeople should consider offering the sales force protectionon the downside. For example, a salesperson might be guaranteed, at leastfor the first year, a minimum payout of 60 to 75 percent of estimated targetcommission earnings, regardless of the firm’s performance.
Decision 4: Pay from the First Dollar or from Goal or aFraction of Goal?
The possibilities for when to begin incentive payments are summarized in Figure7-14. The decision on when to begin payout—from the first dollar, at goal, or at
PAGE 245................. 15869$ $CH7 05-19-06 09:23:44 PS
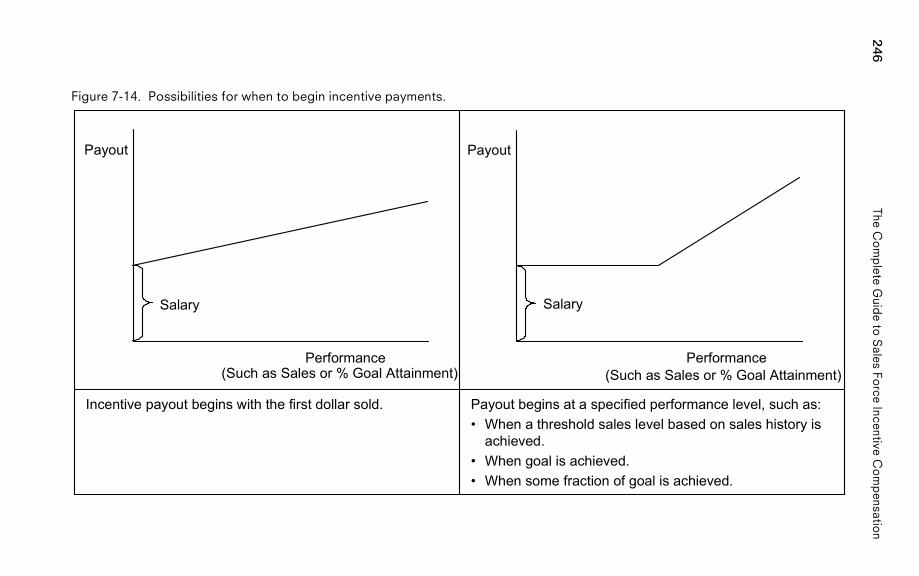
246The
Co
mp
leteG
uide
toS
alesFo
rceIncentive
Co
mp
ensation
Figure 7-14. Possibilities for when to begin incentive payments.
Payout begins at a specified performance level, such as:• When a threshold sales level based on sales history is
achieved.• When goal is achieved.• When some fraction of goal is achieved.
Incentive payout begins with the first dollar sold.
Payout
Salary
Performance (Such as Sales or % Goal Attainment)
Performance (Such as Sales or % Goal Attainment)
Payout
Salary
PA
GE
246.................15869$
$CH
705-19-06
09:23:45P
S
247Plan Design Part 4
some fraction of goal—is influenced by the importance of the sales force in creat-ing short-term sales (short-term causality), the firm’s ability to predict demandaccurately, and the sales management culture and philosophy.
Paying from the First Dollar
Typically, incentive plans that begin with the first dollar are commission-based,with variable pay (as opposed to salary) being a large proportion of total pay.This type of plan ties a monetary incentive to each sales transaction and is mostappropriate in certain selling environments and sales management cultures (seeFigure 7-9). Commission plans that pay from the first dollar are common in in-dustries such as insurance, stockbrokerage, real estate, and office supplies. Theseare commodity industries that rely on the skills of salespeople to differentiate aparticular company. The millions of salespeople who sell products direct to con-sumers for companies such as Avon and Amway are also paid on commission fromthe first dollar sold.
Caution: Paying from the First Dollar Rewards Salespeople forFree Sales
Commission plans that pay salespeople from the first dollar sold reward allsales, including free sales (sales that the salesperson did not have to workfor). Free sales may be the result of past years’ sales efforts (carryoversales) or can be attributed to a strong brand identity or superior products(franchise sales). Commissions on free sales are actually a ‘‘hidden sal-ary’’—they will be paid regardless of what the salesperson does. In sellingenvironments with high free sales, paying commissions from the first dollarhas multiple consequences. Salespeople become very motivated and fo-cused on building a solid book of business. However, experienced sales-people who have built a book of business can earn substantial commissionson free sales, and thus may not be motivated to work hard to develop newcustomers and drive sales growth. At the same time, new salespeople whohave not yet developed strong customer relationships may have troubleearning sufficient money, making it difficult for the firm to attract and retainnew sales staff. This problem of sales force complacency combined withhigh new salesperson turnover is very common at firms that reward sales-people with commissions from the first dollar sold when a substantial por-tion of sales are free sales. And, with the customer control that salespeopledevelop in such environments, it can be difficult to change or restructurethe incentive model to fix the problem. When initiating a commission planthat pays from the first dollar sold, one has to look ahead several years andanticipate the future needs of the firm and the salespeople. A forward-looking approach helps to ensure that the incentive structure provides the
PAGE 247................. 15869$ $CH7 05-19-06 09:23:45 PS
248 The Complete Guide to Sales Force Incentive Compensation
appropriate balance of flexibility and cost control for the firm, and also pro-vides sufficient motivation for the sales force, both today and in the future.
Paying from Goal or a Fraction of Goal
For goal-centric compensation plans, the decision on whether to begin paying atgoal or at some fraction of goal is complex. Insight can be gained by examiningthe following perspectives to reach a decision: a company perspective, a sales forceperspective, and a marketplace perspective.
A Company Perspective. Sometimes we hear senior management in companiessaying, ‘‘The goal is the goal—we are not successful unless we make our goal. So,why should we ever pay incentives if the goal has not been achieved?’’ This all-or-nothing view is rarely shared by sales managers and compensation experts. Thecompany has to realize that the purpose of incentives is to engage and motivate alarge proportion of the sales force, and so payouts should logically begin at a pointsuch that a large proportion of salespeople can increase their earnings by workingharder. This is the engagement concept introduced in Chapter 2.
A Sales Force Perspective. The sales force perspective argues that incentive payoutsshould begin at some fraction of goal. Since salespeople usually work alone, thereare few opportunities for management to acknowledge their success. Receiving abonus and reaching a higher commission gate are two visible and vital ways inwhich salespeople are recognized and rewarded. If the gates are set too high andonly a few people achieve them, the message to the salespeople is that they havefailed. If their failure is the result of unattainable goals, they feel like victims. Evenif the company meets its overall goal, the salespeople who do not make theirindividual goal will feel like failures. Figure 7-15 shows a typical distribution ofperformance to goal on top, and the percent of salespeople who make goal as afunction of company performance on the bottom. Notice that when the companyachieves exactly 100 percent of goal, only 46 percent of the sales force makes goal.Company goal attainment needs to be between 115 and 120 percent in order for80 percent of the sales force to make goal.
People do not like to fail, and excessive unwarranted failure leads to a moralecrisis. Consider starting incentive payouts at a fraction of goal that ensures that inmoderate-incentive environments (20 to 35 percent of total cash compensationat risk), at least 70 percent of the sales force receives some sort of incentive payout.This should help keep the sales force engaged. If 70 percent of the sales forcedoes not deserve an incentive payout, the problem is larger than the incentiveplan. It is likely that there are problems with hiring, training, or management.The percentage of salespeople receiving some incentive compensation needs to beclose to 100 percent when incentives are over 50 percent of total cash compensa-tion.
PAGE 248................. 15869$ $CH7 05-19-06 09:23:46 PS
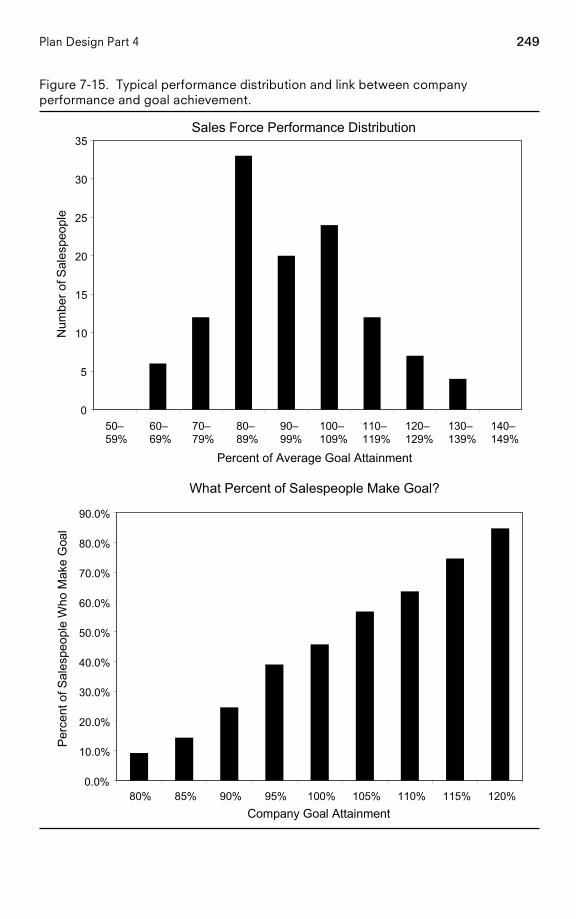
249Plan Design Part 4
Figure 7-15. Typical performance distribution and link between companyperformance and goal achievement.
Sales Force Performance Distribution
0
5
10
15
20
25
30
35
50–59%
60–69%
70–79%
80–89%
90–99%
100–109%
110–119%
120–129%
130–139%
140–149%
Percent of Average Goal Attainment
Num
ber o
f Sal
espe
ople
What Percent of Salespeople Make Goal?
0.0%
10.0%
20.0%
30.0%
40.0%
50.0%
60.0%
70.0%
80.0%
90.0%
80% 85% 90% 95% 100% 105% 110% 115% 120%Company Goal Attainment
Per
cent
of S
ales
peop
le W
ho M
ake
Goa
l
PAGE 249................. 15869$ $CH7 05-19-06 09:23:47 PS
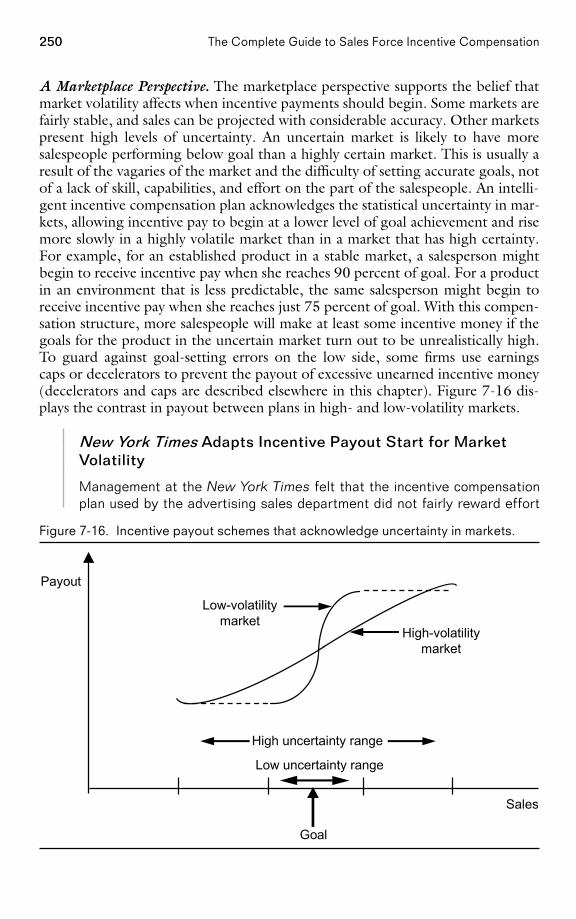
250 The Complete Guide to Sales Force Incentive Compensation
A Marketplace Perspective. The marketplace perspective supports the belief thatmarket volatility affects when incentive payments should begin. Some markets arefairly stable, and sales can be projected with considerable accuracy. Other marketspresent high levels of uncertainty. An uncertain market is likely to have moresalespeople performing below goal than a highly certain market. This is usually aresult of the vagaries of the market and the difficulty of setting accurate goals, notof a lack of skill, capabilities, and effort on the part of the salespeople. An intelli-gent incentive compensation plan acknowledges the statistical uncertainty in mar-kets, allowing incentive pay to begin at a lower level of goal achievement and risemore slowly in a highly volatile market than in a market that has high certainty.For example, for an established product in a stable market, a salesperson mightbegin to receive incentive pay when she reaches 90 percent of goal. For a productin an environment that is less predictable, the same salesperson might begin toreceive incentive pay when she reaches just 75 percent of goal. With this compen-sation structure, more salespeople will make at least some incentive money if thegoals for the product in the uncertain market turn out to be unrealistically high.To guard against goal-setting errors on the low side, some firms use earningscaps or decelerators to prevent the payout of excessive unearned incentive money(decelerators and caps are described elsewhere in this chapter). Figure 7-16 dis-plays the contrast in payout between plans in high- and low-volatility markets.
New York Times Adapts Incentive Payout Start for MarketVolatility
Management at the New York Times felt that the incentive compensationplan used by the advertising sales department did not fairly reward effort
Figure 7-16. Incentive payout schemes that acknowledge uncertainty in markets.
Low uncertainty range
Payout
Sales
High uncertainty range
High-volatilitymarket
Low-volatilitymarket
Goal
PAGE 250................. 15869$ $CH7 05-19-06 09:23:49 PS
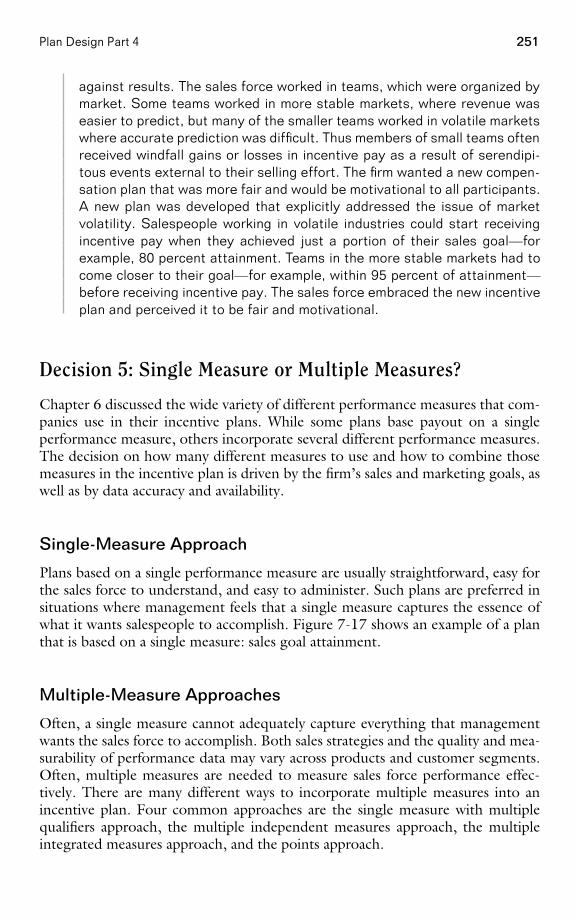
251Plan Design Part 4
against results. The sales force worked in teams, which were organized bymarket. Some teams worked in more stable markets, where revenue waseasier to predict, but many of the smaller teams worked in volatile marketswhere accurate prediction was difficult. Thus members of small teams oftenreceived windfall gains or losses in incentive pay as a result of serendipi-tous events external to their selling effort. The firm wanted a new compen-sation plan that was more fair and would be motivational to all participants.A new plan was developed that explicitly addressed the issue of marketvolatility. Salespeople working in volatile industries could start receivingincentive pay when they achieved just a portion of their sales goal—forexample, 80 percent attainment. Teams in the more stable markets had tocome closer to their goal—for example, within 95 percent of attainment—before receiving incentive pay. The sales force embraced the new incentiveplan and perceived it to be fair and motivational.
Decision 5: Single Measure or Multiple Measures?
Chapter 6 discussed the wide variety of different performance measures that com-panies use in their incentive plans. While some plans base payout on a singleperformance measure, others incorporate several different performance measures.The decision on how many different measures to use and how to combine thosemeasures in the incentive plan is driven by the firm’s sales and marketing goals, aswell as by data accuracy and availability.
Single-Measure Approach
Plans based on a single performance measure are usually straightforward, easy forthe sales force to understand, and easy to administer. Such plans are preferred insituations where management feels that a single measure captures the essence ofwhat it wants salespeople to accomplish. Figure 7-17 shows an example of a planthat is based on a single measure: sales goal attainment.
Multiple-Measure Approaches
Often, a single measure cannot adequately capture everything that managementwants the sales force to accomplish. Both sales strategies and the quality and mea-surability of performance data may vary across products and customer segments.Often, multiple measures are needed to measure sales force performance effec-tively. There are many different ways to incorporate multiple measures into anincentive plan. Four common approaches are the single measure with multiplequalifiers approach, the multiple independent measures approach, the multipleintegrated measures approach, and the points approach.
PAGE 251................. 15869$ $CH7 05-19-06 09:23:49 PS
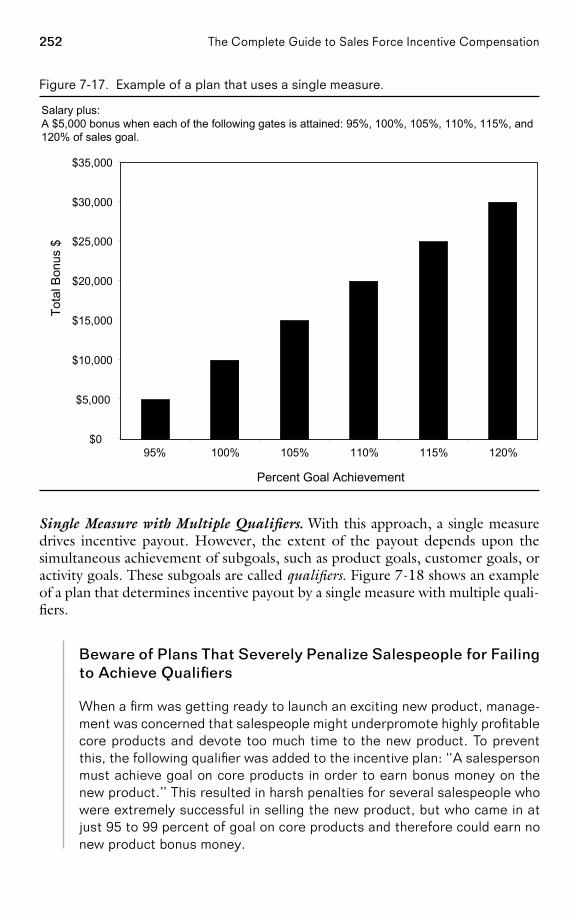
252 The Complete Guide to Sales Force Incentive Compensation
Figure 7-17. Example of a plan that uses a single measure.
Salary plus:A $5,000 bonus when each of the following gates is attained: 95%, 100%, 105%, 110%, 115%, and120% of sales goal.
$0
$5,000
$10,000
$15,000
$20,000
$25,000
$30,000
$35,000
95% 100% 105% 110% 115% 120%
Percent Goal Achievement
Tota
l Bon
us $
Single Measure with Multiple Qualifiers. With this approach, a single measuredrives incentive payout. However, the extent of the payout depends upon thesimultaneous achievement of subgoals, such as product goals, customer goals, oractivity goals. These subgoals are called qualifiers. Figure 7-18 shows an exampleof a plan that determines incentive payout by a single measure with multiple quali-fiers.
Beware of Plans That Severely Penalize Salespeople for Failingto Achieve Qualifiers
When a firm was getting ready to launch an exciting new product, manage-ment was concerned that salespeople might underpromote highly profitablecore products and devote too much time to the new product. To preventthis, the following qualifier was added to the incentive plan: ‘‘A salespersonmust achieve goal on core products in order to earn bonus money on thenew product.’’ This resulted in harsh penalties for several salespeople whowere extremely successful in selling the new product, but who came in atjust 95 to 99 percent of goal on core products and therefore could earn nonew product bonus money.
PAGE 252................. 15869$ $CH7 05-19-06 09:23:50 PS
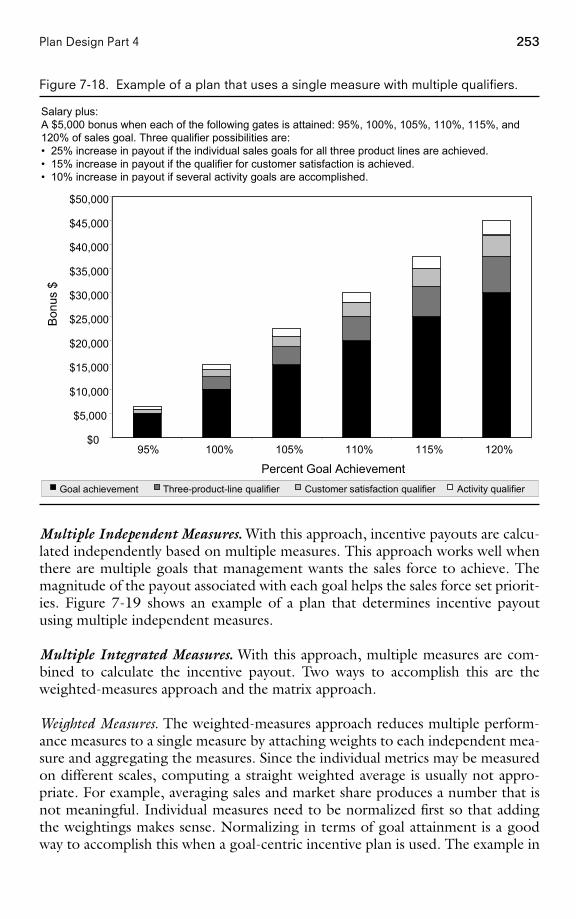
253Plan Design Part 4
Figure 7-18. Example of a plan that uses a single measure with multiple qualifiers.
Salary plus:A $5,000 bonus when each of the following gates is attained: 95%, 100%, 105%, 110%, 115%, and120% of sales goal. Three qualifier possibilities are:• 25% increase in payout if the individual sales goals for all three product lines are achieved.• 15% increase in payout if the qualifier for customer satisfaction is achieved.• 10% increase in payout if several activity goals are accomplished.
$0
$5,000
$10,000
$15,000
$20,000
$25,000
$30,000
$35,000
$40,000
$45,000
$50,000
95% 100% 105% 110% 115% 120%
Percent Goal Achievement
Bonu
s $
Goal achievement Three-product-line qualifier Customer satisfaction qualifier Activity qualifier
Multiple Independent Measures. With this approach, incentive payouts are calcu-lated independently based on multiple measures. This approach works well whenthere are multiple goals that management wants the sales force to achieve. Themagnitude of the payout associated with each goal helps the sales force set priorit-ies. Figure 7-19 shows an example of a plan that determines incentive payoutusing multiple independent measures.
Multiple Integrated Measures. With this approach, multiple measures are com-bined to calculate the incentive payout. Two ways to accomplish this are theweighted-measures approach and the matrix approach.
Weighted Measures. The weighted-measures approach reduces multiple perform-ance measures to a single measure by attaching weights to each independent mea-sure and aggregating the measures. Since the individual metrics may be measuredon different scales, computing a straight weighted average is usually not appro-priate. For example, averaging sales and market share produces a number that isnot meaningful. Individual measures need to be normalized first so that addingthe weightings makes sense. Normalizing in terms of goal attainment is a goodway to accomplish this when a goal-centric incentive plan is used. The example in
PAGE 253................. 15869$ $CH7 05-19-06 09:23:51 PS
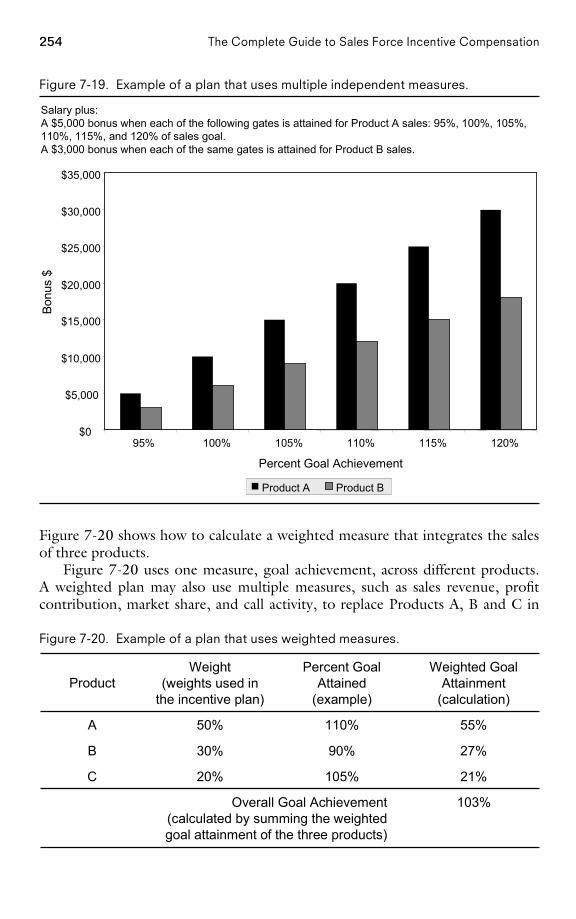
254 The Complete Guide to Sales Force Incentive Compensation
Figure 7-19. Example of a plan that uses multiple independent measures.
Salary plus:A $5,000 bonus when each of the following gates is attained for Product A sales: 95%, 100%, 105%,110%, 115%, and 120% of sales goal.A $3,000 bonus when each of the same gates is attained for Product B sales.
$0
$5,000
$10,000
$15,000
$20,000
$25,000
$30,000
$35,000
95% 100% 105% 110% 115% 120%
Percent Goal Achievement
Bonu
s $
Product A Product B
Figure 7-20 shows how to calculate a weighted measure that integrates the salesof three products.
Figure 7-20 uses one measure, goal achievement, across different products.A weighted plan may also use multiple measures, such as sales revenue, profitcontribution, market share, and call activity, to replace Products A, B and C in
Figure 7-20. Example of a plan that uses weighted measures.
103%Overall Goal Achievement(calculated by summing the weightedgoal attainment of the three products)
21%105%20%C
27%90%30%B
55%110%50%A
Weighted GoalAttainment
(calculation)
Percent GoalAttained
(example)
Weight(weights used in
the incentive plan)Product
PAGE 254................. 15869$ $CH7 05-19-06 09:23:54 PS
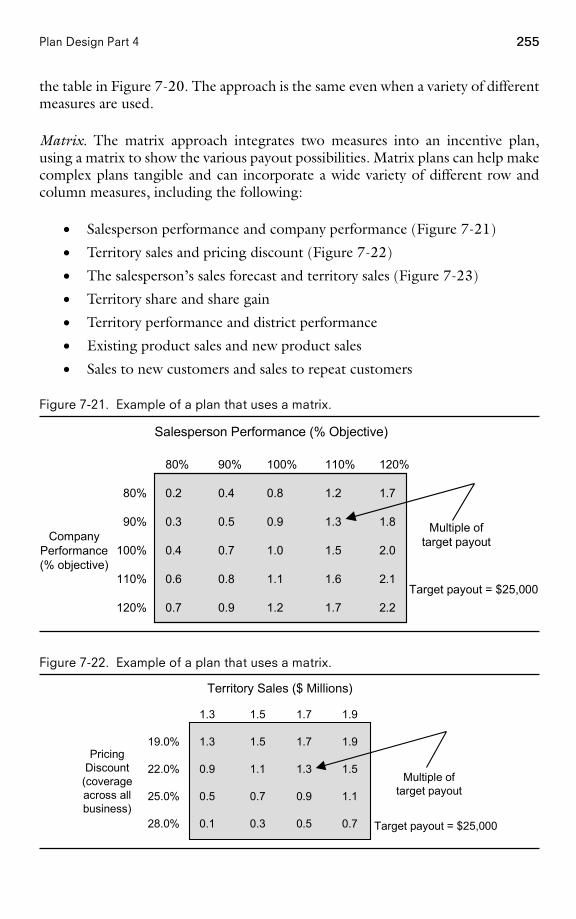
255Plan Design Part 4
the table in Figure 7-20. The approach is the same even when a variety of differentmeasures are used.
Matrix. The matrix approach integrates two measures into an incentive plan,using a matrix to show the various payout possibilities. Matrix plans can help makecomplex plans tangible and can incorporate a wide variety of different row andcolumn measures, including the following:
• Salesperson performance and company performance (Figure 7-21)
• Territory sales and pricing discount (Figure 7-22)
• The salesperson’s sales forecast and territory sales (Figure 7-23)
• Territory share and share gain
• Territory performance and district performance
• Existing product sales and new product sales
• Sales to new customers and sales to repeat customers
Figure 7-21. Example of a plan that uses a matrix.
Salesperson Performance (% Objective)
CompanyPerformance(% objective)
Target payout = $25,000
80% 90% 100% 110% 120%
80% 0.2 0.4 0.8 1.2 1.7
90% 0.3 0.5 0.9 1.3 1.8
100% 0.4 0.7 1.0 1.5 2.0
110% 0.6 0.8 1.1 1.6 2.1
120% 0.7 0.9 1.2 1.7 2.2
Multiple oftarget payout
Figure 7-22. Example of a plan that uses a matrix.
Territory Sales ($ Millions)
PricingDiscount(coverageacross allbusiness)
1.3 1.5 1.7 1.9
19.0% 1.3 1.5 1.7 1.9
22.0% 0.9 1.1 1.3 1.5
25.0% 0.5 0.7 0.9 1.1
28.0% 0.1 0.3 0.5 0.7 Target payout = $25,000
Multiple oftarget payout
PAGE 255................. 15869$ $CH7 05-19-06 09:23:55 PS
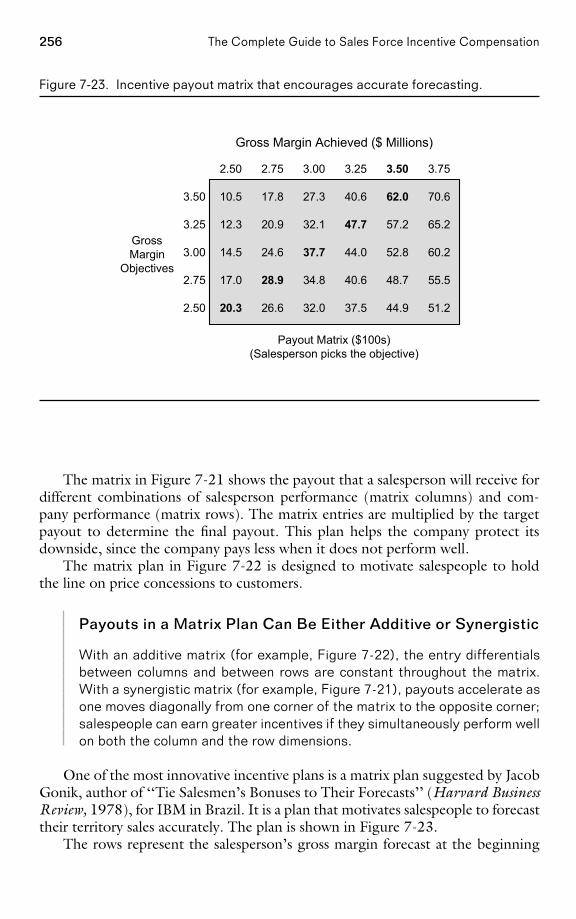
256 The Complete Guide to Sales Force Incentive Compensation
Figure 7-23. Incentive payout matrix that encourages accurate forecasting.
GrossMargin
Objectives
Gross Margin Achieved ($ Millions)
Payout Matrix ($100s)(Salesperson picks the objective)
2.50 2.75 3.00 3.25 3.50 3.75
3.50 10.5 17.8 27.3 40.6 62.0 70.6
3.25 12.3 20.9 32.1 47.7 57.2 65.2
3.00 14.5 24.6 37.7 44.0 52.8 60.2
2.75 17.0 28.9 34.8 40.6 48.7 55.5
2.50 20.3 26.6 32.0 37.5 44.9 51.2
The matrix in Figure 7-21 shows the payout that a salesperson will receive fordifferent combinations of salesperson performance (matrix columns) and com-pany performance (matrix rows). The matrix entries are multiplied by the targetpayout to determine the final payout. This plan helps the company protect itsdownside, since the company pays less when it does not perform well.
The matrix plan in Figure 7-22 is designed to motivate salespeople to holdthe line on price concessions to customers.
Payouts in a Matrix Plan Can Be Either Additive or Synergistic
With an additive matrix (for example, Figure 7-22), the entry differentialsbetween columns and between rows are constant throughout the matrix.With a synergistic matrix (for example, Figure 7-21), payouts accelerate asone moves diagonally from one corner of the matrix to the opposite corner;salespeople can earn greater incentives if they simultaneously perform wellon both the column and the row dimensions.
One of the most innovative incentive plans is a matrix plan suggested by JacobGonik, author of ‘‘Tie Salesmen’s Bonuses to Their Forecasts’’ (Harvard BusinessReview, 1978), for IBM in Brazil. It is a plan that motivates salespeople to forecasttheir territory sales accurately. The plan is shown in Figure 7-23.
The rows represent the salesperson’s gross margin forecast at the beginning
PAGE 256................. 15869$ $CH7 05-19-06 09:23:57 PS
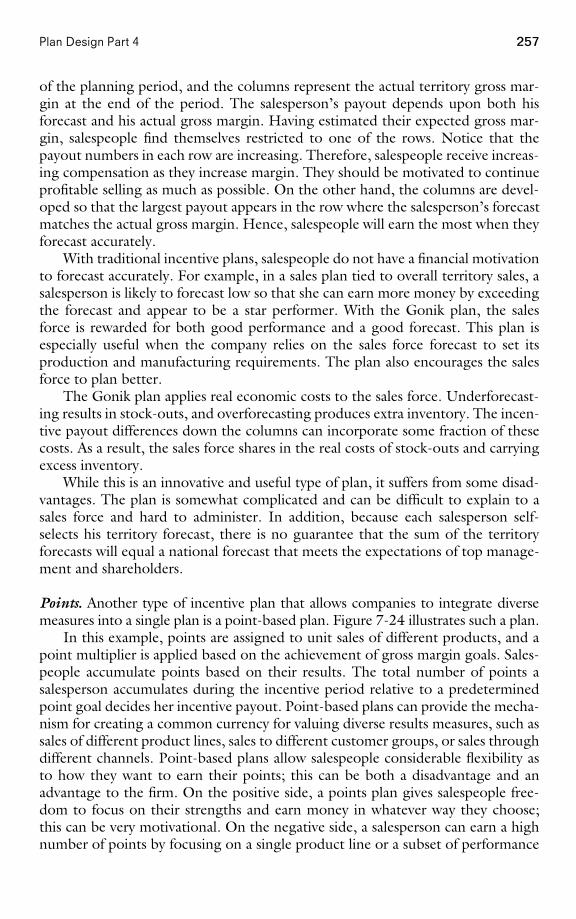
257Plan Design Part 4
of the planning period, and the columns represent the actual territory gross mar-gin at the end of the period. The salesperson’s payout depends upon both hisforecast and his actual gross margin. Having estimated their expected gross mar-gin, salespeople find themselves restricted to one of the rows. Notice that thepayout numbers in each row are increasing. Therefore, salespeople receive increas-ing compensation as they increase margin. They should be motivated to continueprofitable selling as much as possible. On the other hand, the columns are devel-oped so that the largest payout appears in the row where the salesperson’s forecastmatches the actual gross margin. Hence, salespeople will earn the most when theyforecast accurately.
With traditional incentive plans, salespeople do not have a financial motivationto forecast accurately. For example, in a sales plan tied to overall territory sales, asalesperson is likely to forecast low so that she can earn more money by exceedingthe forecast and appear to be a star performer. With the Gonik plan, the salesforce is rewarded for both good performance and a good forecast. This plan isespecially useful when the company relies on the sales force forecast to set itsproduction and manufacturing requirements. The plan also encourages the salesforce to plan better.
The Gonik plan applies real economic costs to the sales force. Underforecast-ing results in stock-outs, and overforecasting produces extra inventory. The incen-tive payout differences down the columns can incorporate some fraction of thesecosts. As a result, the sales force shares in the real costs of stock-outs and carryingexcess inventory.
While this is an innovative and useful type of plan, it suffers from some disad-vantages. The plan is somewhat complicated and can be difficult to explain to asales force and hard to administer. In addition, because each salesperson self-selects his territory forecast, there is no guarantee that the sum of the territoryforecasts will equal a national forecast that meets the expectations of top manage-ment and shareholders.
Points. Another type of incentive plan that allows companies to integrate diversemeasures into a single plan is a point-based plan. Figure 7-24 illustrates such a plan.
In this example, points are assigned to unit sales of different products, and apoint multiplier is applied based on the achievement of gross margin goals. Sales-people accumulate points based on their results. The total number of points asalesperson accumulates during the incentive period relative to a predeterminedpoint goal decides her incentive payout. Point-based plans can provide the mecha-nism for creating a common currency for valuing diverse results measures, such assales of different product lines, sales to different customer groups, or sales throughdifferent channels. Point-based plans allow salespeople considerable flexibility asto how they want to earn their points; this can be both a disadvantage and anadvantage to the firm. On the positive side, a points plan gives salespeople free-dom to focus on their strengths and earn money in whatever way they choose;this can be very motivational. On the negative side, a salesperson can earn a highnumber of points by focusing on a single product line or a subset of performance
PAGE 257................. 15869$ $CH7 05-19-06 09:23:57 PS
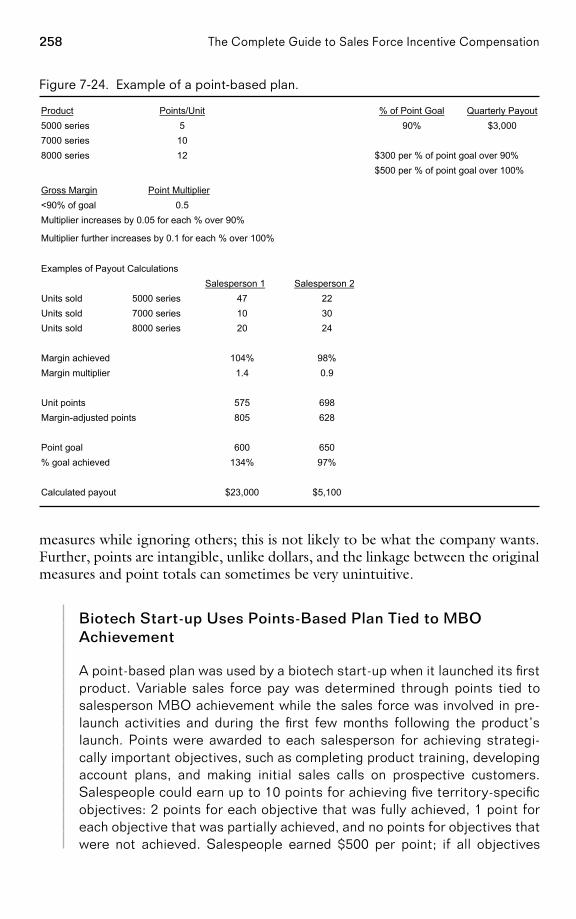
258 The Complete Guide to Sales Force Incentive Compensation
Figure 7-24. Example of a point-based plan.
$5,100$23,000Calculated payout
97%134%% goal achieved650600Point goal
628805Margin-adjusted points698575Unit points
0.91.4Margin multiplier98%104%Margin achieved
24208000 seriesUnits sold30107000 seriesUnits sold22475000 seriesUnits sold
Salesperson 2Salesperson 1Examples of Payout Calculations
Multiplier further increases by 0.1 for each % over 100%
Multiplier increases by 0.05 for each % over 90%0.5<90% of goal
Point MultiplierGross Margin
$500 per % of point goal over 100%$300 per % of point goal over 90%128000 series
107000 series$3,00090%55000 series
Quarterly Payout% of Point GoalPoints/UnitProduct
measures while ignoring others; this is not likely to be what the company wants.Further, points are intangible, unlike dollars, and the linkage between the originalmeasures and point totals can sometimes be very unintuitive.
Biotech Start-up Uses Points-Based Plan Tied to MBOAchievement
A point-based plan was used by a biotech start-up when it launched its firstproduct. Variable sales force pay was determined through points tied tosalesperson MBO achievement while the sales force was involved in pre-launch activities and during the first few months following the product’slaunch. Points were awarded to each salesperson for achieving strategi-cally important objectives, such as completing product training, developingaccount plans, and making initial sales calls on prospective customers.Salespeople could earn up to 10 points for achieving five territory-specificobjectives: 2 points for each objective that was fully achieved, 1 point foreach objective that was partially achieved, and no points for objectives thatwere not achieved. Salespeople earned $500 per point; if all objectives
PAGE 258................. 15869$ $CH7 05-19-06 09:23:58 PS
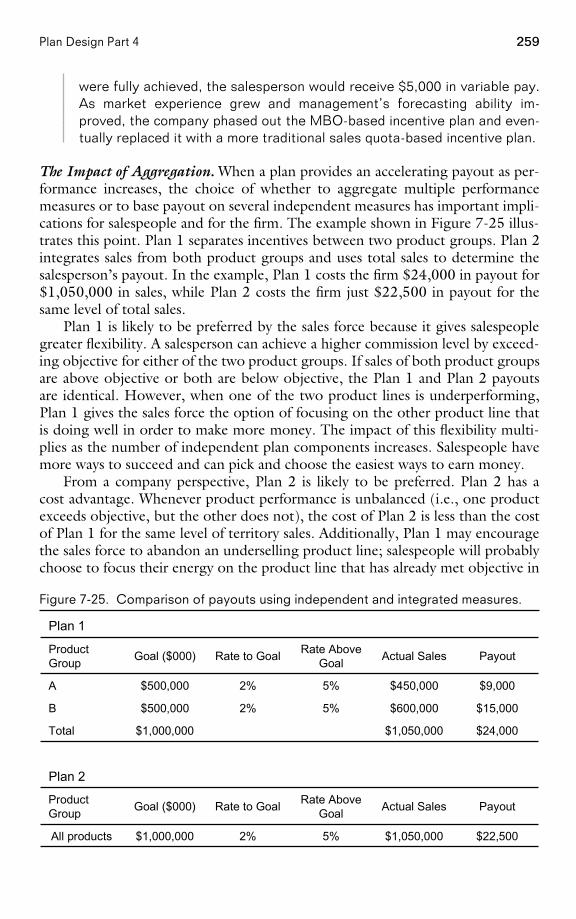
259Plan Design Part 4
were fully achieved, the salesperson would receive $5,000 in variable pay.As market experience grew and management’s forecasting ability im-proved, the company phased out the MBO-based incentive plan and even-tually replaced it with a more traditional sales quota-based incentive plan.
The Impact of Aggregation. When a plan provides an accelerating payout as per-formance increases, the choice of whether to aggregate multiple performancemeasures or to base payout on several independent measures has important impli-cations for salespeople and for the firm. The example shown in Figure 7-25 illus-trates this point. Plan 1 separates incentives between two product groups. Plan 2integrates sales from both product groups and uses total sales to determine thesalesperson’s payout. In the example, Plan 1 costs the firm $24,000 in payout for$1,050,000 in sales, while Plan 2 costs the firm just $22,500 in payout for thesame level of total sales.
Plan 1 is likely to be preferred by the sales force because it gives salespeoplegreater flexibility. A salesperson can achieve a higher commission level by exceed-ing objective for either of the two product groups. If sales of both product groupsare above objective or both are below objective, the Plan 1 and Plan 2 payoutsare identical. However, when one of the two product lines is underperforming,Plan 1 gives the sales force the option of focusing on the other product line thatis doing well in order to make more money. The impact of this flexibility multi-plies as the number of independent plan components increases. Salespeople havemore ways to succeed and can pick and choose the easiest ways to earn money.
From a company perspective, Plan 2 is likely to be preferred. Plan 2 has acost advantage. Whenever product performance is unbalanced (i.e., one productexceeds objective, but the other does not), the cost of Plan 2 is less than the costof Plan 1 for the same level of territory sales. Additionally, Plan 1 may encouragethe sales force to abandon an underselling product line; salespeople will probablychoose to focus their energy on the product line that has already met objective in
Figure 7-25. Comparison of payouts using independent and integrated measures.
PayoutActual SalesRate AboveGoalRate to GoalGoal ($000)Product
Group
$9,000$450,0005%2%$500,000A
Plan 1
$22,500$1,050,0005%2%$1,000,000All products
PayoutActual SalesRate AboveGoalRate to GoalGoal ($000)Product
Group
Plan 2
$24,000$1,050,000$1,000,000Total
$15,000$600,0005%2%$500,000B
PAGE 259................. 15869$ $CH7 05-19-06 09:24:00 PS
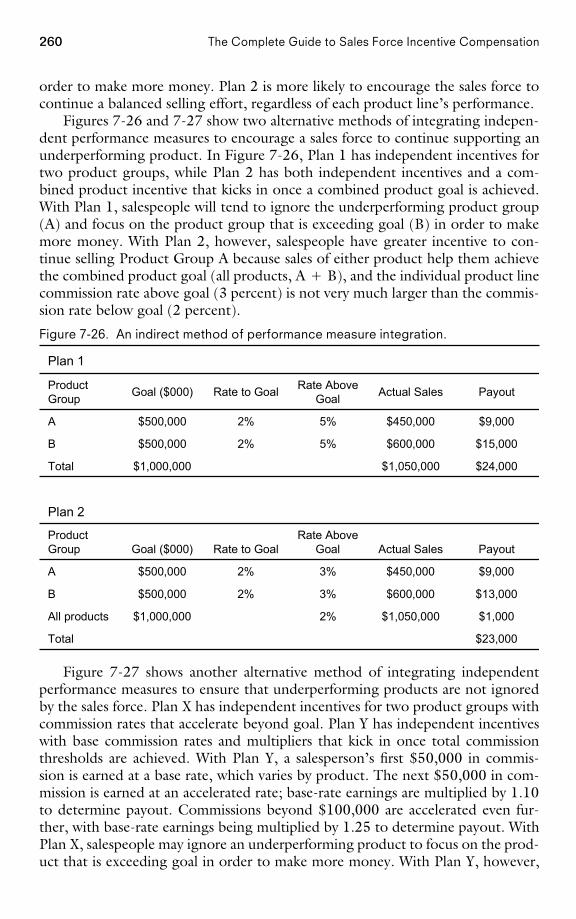
260 The Complete Guide to Sales Force Incentive Compensation
order to make more money. Plan 2 is more likely to encourage the sales force tocontinue a balanced selling effort, regardless of each product line’s performance.
Figures 7-26 and 7-27 show two alternative methods of integrating indepen-dent performance measures to encourage a sales force to continue supporting anunderperforming product. In Figure 7-26, Plan 1 has independent incentives fortwo product groups, while Plan 2 has both independent incentives and a com-bined product incentive that kicks in once a combined product goal is achieved.With Plan 1, salespeople will tend to ignore the underperforming product group(A) and focus on the product group that is exceeding goal (B) in order to makemore money. With Plan 2, however, salespeople have greater incentive to con-tinue selling Product Group A because sales of either product help them achievethe combined product goal (all products, A � B), and the individual product linecommission rate above goal (3 percent) is not very much larger than the commis-sion rate below goal (2 percent).
Figure 7-26. An indirect method of performance measure integration.
$1,000$1,050,0002%$1,000,000All products
$13,000$600,0003%2%$500,000B
$9,000$450,0003%2%$500,000A
PayoutActual SalesRate Above
GoalRate to GoalGoal ($000)ProductGroup
$23,000Total
PayoutActual SalesRate AboveGoalRate to GoalGoal ($000)Product
Group
Plan 2
$24,000$1,050,000$1,000,000Total
$15,000$600,0005%2%$500,000B
$9,000$450,0005%2%$500,000A
Plan 1
Figure 7-27 shows another alternative method of integrating independentperformance measures to ensure that underperforming products are not ignoredby the sales force. Plan X has independent incentives for two product groups withcommission rates that accelerate beyond goal. Plan Y has independent incentiveswith base commission rates and multipliers that kick in once total commissionthresholds are achieved. With Plan Y, a salesperson’s first $50,000 in commis-sion is earned at a base rate, which varies by product. The next $50,000 in com-mission is earned at an accelerated rate; base-rate earnings are multiplied by 1.10to determine payout. Commissions beyond $100,000 are accelerated even fur-ther, with base-rate earnings being multiplied by 1.25 to determine payout. WithPlan X, salespeople may ignore an underperforming product to focus on the prod-uct that is exceeding goal in order to make more money. With Plan Y, however,
PAGE 260
................. 15869$ $CH7 05-19-06 09:24:01 PS
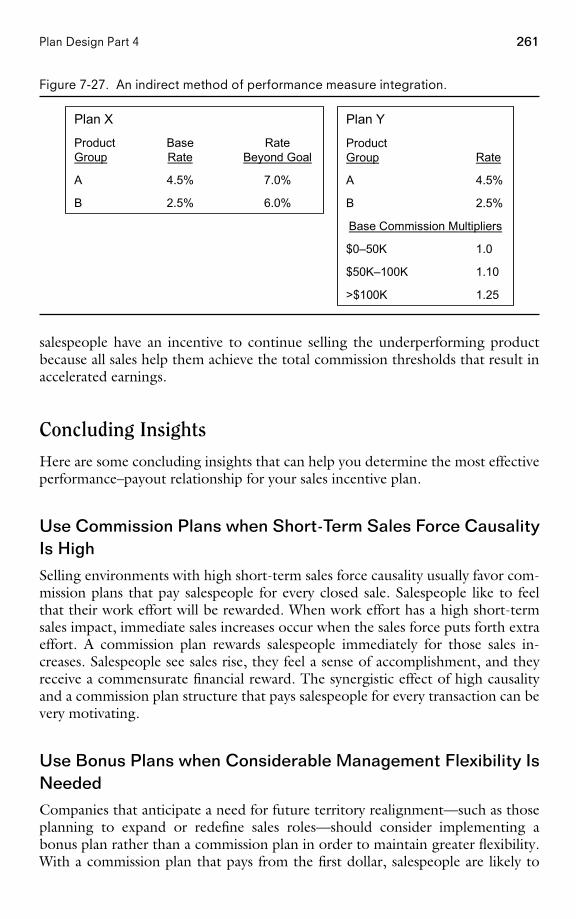
261Plan Design Part 4
Figure 7-27. An indirect method of performance measure integration.
Plan X
6.0%2.5%B
7.0%4.5%A
RateBeyond Goal
BaseRate
ProductGroup
1.25>$100K
1.10$50K–100K
1.0$0–50K
Base Commission Multipliers
2.5%B
4.5%A
RateProductGroup
Plan Y
salespeople have an incentive to continue selling the underperforming productbecause all sales help them achieve the total commission thresholds that result inaccelerated earnings.
Concluding Insights
Here are some concluding insights that can help you determine the most effectiveperformance–payout relationship for your sales incentive plan.
Use Commission Plans when Short-Term Sales Force CausalityIs High
Selling environments with high short-term sales force causality usually favor com-mission plans that pay salespeople for every closed sale. Salespeople like to feelthat their work effort will be rewarded. When work effort has a high short-termsales impact, immediate sales increases occur when the sales force puts forth extraeffort. A commission plan rewards salespeople immediately for those sales in-creases. Salespeople see sales rise, they feel a sense of accomplishment, and theyreceive a commensurate financial reward. The synergistic effect of high causalityand a commission plan structure that pays salespeople for every transaction can bevery motivating.
Use Bonus Plans when Considerable Management Flexibility IsNeededCompanies that anticipate a need for future territory realignment—such as thoseplanning to expand or redefine sales roles—should consider implementing abonus plan rather than a commission plan in order to maintain greater flexibility.With a commission plan that pays from the first dollar, salespeople are likely to
PAGE 261
................. 15869$ $CH7 05-19-06 09:24:02 PS
262 The Complete Guide to Sales Force Incentive Compensation
vehemently fight giving up any of their accounts, since the change directly affectstheir ability to earn money. With a bonus plan, however, territory quotas canchange whenever territories are realigned. If a salesperson with a high-potentialterritory has accounts taken away, his quota is adjusted downward appropriately.This makes it possible for management to implement territory alignment changeswithout excessive resistance from the sales force.
Tie Payout to Territory Goal Attainment when Sales TerritoriesHave Unequal PotentialThe success of a commission plan that pays from the first dollar hinges on anequitable and balanced sales territory alignment. If territories are not comparable,salespeople can be rewarded for having a good sales territory and not for theirperformance. A bonus plan allows management to assign each salesperson an ap-propriate goal based on territory potential, so that earnings are driven by salesper-son performance and not territory assignments. Thus, if sales territories haveunequal potential, a goal-based incentive plan is preferred.
Aggregate Plan Measures Whenever PossibleWhen multiple divisions within a company share the same sales force, the salesincentive plan often consists of many disaggregated measures; each division gets a‘‘line item’’ in the incentive plan. While appealing from an organizational perspec-tive, this type of plan can create disastrous results for the firm. Disaggregatedplans give salespeople many ways to succeed. A salesperson is sure to choose theeasiest ways to earn money and is likely to ignore some line items that are ofstrategic importance to the firm. Incentive plans that aggregate across measuresare more likely to encourage a balanced selling effort and are usually less costly tothe firm as well.
Invest in Goal-Setting Methodologies if High Plan ExcitementIs DesiredAn effective performance–payout relationship creates considerable sales force ex-citement in the performance range where capable salespeople operate. For exam-ple, increasing the payout rate, and therefore the Excitement Index (see Chapter2), as sales approach a territory goal is likely to inspire salespeople to work harderand stretch to meet that goal. Effective goal setting makes it possible to createconsiderable excitement; the steepest payouts can be concentrated across a narrowrange of likely ‘‘stretch’’ performance. However, when accurate territory-levelgoal setting is difficult, the range of likely performance for each salesperson be-comes greater. Incentive payouts must be spread across that wider performancerange in order to ensure sufficient sales force engagement. Accurate territory-levelgoals allow steeper payout curves and larger payout rates over a tighter range of
PAGE 262................. 15869$ $CH7 05-19-06 09:24:02 PS
263Plan Design Part 4
performance, while inaccurate goals favor flatter payout curves and smaller payoutrates over a greater performance range. Improvements in goal-setting processesoften allow steeper payout curves that create greater sales force excitement.
Adapt Performance–Payout Strategies for Volatile MarketsIn highly volatile settings, accurate forecasting at the territory level can be ex-tremely difficult. Some strategies for creating an effective performance–payoutrelationship include the following:
• Do not tie payout to territory goal attainment; for example, use a commis-sion plan that pays from the first dollar;
• If a goal-based plan is desired:• Set goals with short time frames; that way, if a goal is unrealistic, the
sales force is affected for only a limited period of time, and the impactof the error is minimized.
• Begin incentive payout at a lower level of goal achievement and havethe payout rise more slowly than in a market that has high certainty;that way, more salespeople will make at least some incentive money,even if the goals turn out to be unrealistically high.
• Consider the use of earnings caps or decelerators to ensure that thecompany will not have to pay out excessive unearned incentive moneyin the event that goals are set too low.
Create Simple and Memorable Plans for High ImpactDesign creep happens frequently in sales incentive compensation plan design. Amain incentive plan is laid out, and then everyone wants to add just a little bithere and a little bit there. Pretty soon, the plan is so complex that the sales forcedoesn’t understand it.
• ‘‘Our plans are too hard to understand; there are too many inconsistentvariables,’’ complains a high-technology salesperson.
• ‘‘Don’t worry about the compensation plan—it’s so complex that it’s nearlyimpossible to understand it. Just do your job,’’ advises a sales manager dur-ing new salesperson training.
A plan that is too complex will be either ignored or misinterpreted by the salesforce. When designing your incentive plan, keep in mind that:
� many great ideas � one terrible idea
A well-designed plan is simple and memorable; a plan summary should fit ona card small enough to be carried around in the salesperson’s wallet. Anothergood rule of thumb is that whenever a new feature is added to the incentive plan,an existing feature should be taken out.
PAGE 263................. 15869$ $CH7 05-19-06 09:24:03 PS
C H A P T E R 8
Evaluating Proposed SalesIncentive Compensation PlanAlternatives and Selecting aNew Plan
How This Chapter Is Organized
Introduction 265An Overview of Candidate Sales Compensation Plan Assessment 267Quantitative Assessment of a Candidate Sales Compensation Plan 271
Introduction to the MRG Company Case Study 271A Quantitative Assessment Framework 273
Step A: Create a Performance Database 274Step B: Superimpose the Candidate Plan 276Step C: Quantitative Analysis 276
Test 1: Plan Cost, Payout Distribution, and Engagementand Excitement Analytics 276Test 2: Risk Assessment 281Test 3: ‘‘Who Gets Helped’’ and ‘‘Who Gets Hurt’’Analysis 288Test 4: A ‘‘Pay-for-Performance’’ Check 290Test 5: Sensitivity Analysis of Plan Features 291
Step D: Test Plan Design Changes 291Qualitative Assessment of a Candidate Sales Compensation Plan 295
Qualitative Assessment of Consequences 295Consequences for Salespeople 295
PAGE 264
264
................. 15869$ $CH8 05-19-06 09:23:38 PS
265Evaluating Proposed Sales Incentive Compensation Plan Alternatives
Test 6: Qualitative Questions for Assessing SalespeopleConsequences 295Test 7: Sales Force Input 295
Consequences for Sales Force Activities 301Test 8: Qualitative Questions for Assessing Sales ForceActivity Consequences 301Test 9: Adverse Sales Force Behaviors Check 301
Consequences for Customer Results 301Test 10: Qualitative Questions for Assessing CustomerResults Consequences 301
Consequences for Company Results 301Test 11: Qualitative Questions for Assessing CompanyResults Consequences 301
Qualitative Assessment of Consistency 304Test 12: Consistency Check with Sales Force Definers 304
Qualitative Assessment of Compatibility 305Test 13: Compatibility Check with Other Sales ForceEffectiveness Drivers 305
Future-Proofing Assessment of a Candidate Sales Compensation Plan 306Test 14: Compatibility Check with Future CompanyNeeds 308
Conclusion: From Objectives to Reality 308
Introduction
It is important to test a sales incentive plan before it is implemented. Numerousstories illustrate possible consequences of failing to thoroughly evaluate and assessthe potential impact of a new compensation plan.
An Untested Incentive Plan Becomes a Runaway
A start-up firm introduced a new computer networking technology in theearly 1990s. The company offered its sales force an incentive compensa-tion plan that paid a 3 percent commission on all sales. For the first fewyears, salespeople had to work hard to earn their pay, as customers hadto be educated and convinced to try the new technology and customerrelationships needed to be established. But by the mid-1990s, the natureof the sales job was changing. Internet usage was growing at an astoundingrate, fueling the demand for networking solutions, and company sales were
PAGE 265................. 15869$ $CH8 05-19-06 09:23:38 PS
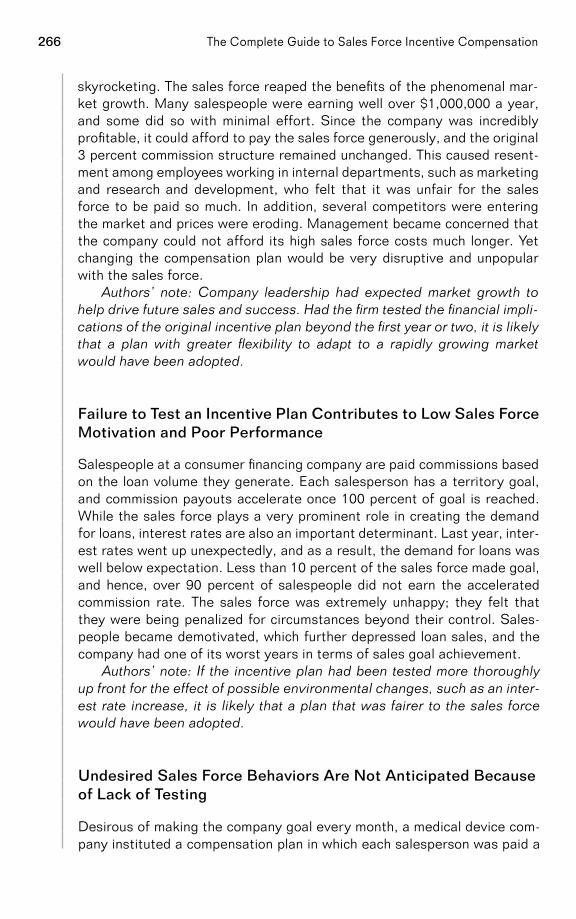
266 The Complete Guide to Sales Force Incentive Compensation
skyrocketing. The sales force reaped the benefits of the phenomenal mar-ket growth. Many salespeople were earning well over $1,000,000 a year,and some did so with minimal effort. Since the company was incrediblyprofitable, it could afford to pay the sales force generously, and the original3 percent commission structure remained unchanged. This caused resent-ment among employees working in internal departments, such as marketingand research and development, who felt that it was unfair for the salesforce to be paid so much. In addition, several competitors were enteringthe market and prices were eroding. Management became concerned thatthe company could not afford its high sales force costs much longer. Yetchanging the compensation plan would be very disruptive and unpopularwith the sales force.
Authors’ note: Company leadership had expected market growth tohelp drive future sales and success. Had the firm tested the financial impli-cations of the original incentive plan beyond the first year or two, it is likelythat a plan with greater flexibility to adapt to a rapidly growing marketwould have been adopted.
Failure to Test an Incentive Plan Contributes to Low Sales ForceMotivation and Poor Performance
Salespeople at a consumer financing company are paid commissions basedon the loan volume they generate. Each salesperson has a territory goal,and commission payouts accelerate once 100 percent of goal is reached.While the sales force plays a very prominent role in creating the demandfor loans, interest rates are also an important determinant. Last year, inter-est rates went up unexpectedly, and as a result, the demand for loans waswell below expectation. Less than 10 percent of the sales force made goal,and hence, over 90 percent of salespeople did not earn the acceleratedcommission rate. The sales force was extremely unhappy; they felt thatthey were being penalized for circumstances beyond their control. Sales-people became demotivated, which further depressed loan sales, and thecompany had one of its worst years in terms of sales goal achievement.
Authors’ note: If the incentive plan had been tested more thoroughlyup front for the effect of possible environmental changes, such as an inter-est rate increase, it is likely that a plan that was fairer to the sales forcewould have been adopted.
Undesired Sales Force Behaviors Are Not Anticipated Becauseof Lack of Testing
Desirous of making the company goal every month, a medical device com-pany instituted a compensation plan in which each salesperson was paid a
PAGE 266................. 15869$ $CH8 05-19-06 09:23:39 PS
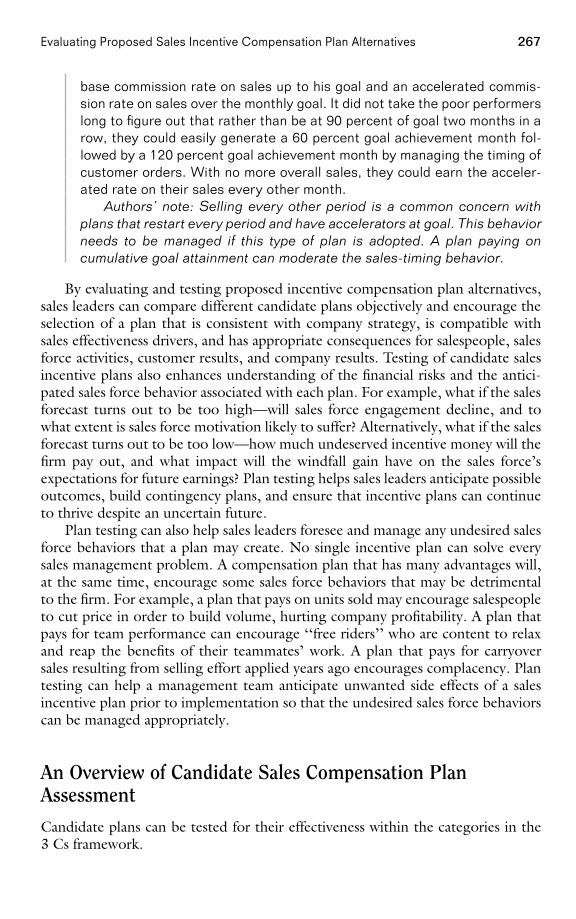
267Evaluating Proposed Sales Incentive Compensation Plan Alternatives
base commission rate on sales up to his goal and an accelerated commis-sion rate on sales over the monthly goal. It did not take the poor performerslong to figure out that rather than be at 90 percent of goal two months in arow, they could easily generate a 60 percent goal achievement month fol-lowed by a 120 percent goal achievement month by managing the timing ofcustomer orders. With no more overall sales, they could earn the acceler-ated rate on their sales every other month.
Authors’ note: Selling every other period is a common concern withplans that restart every period and have accelerators at goal. This behaviorneeds to be managed if this type of plan is adopted. A plan paying oncumulative goal attainment can moderate the sales-timing behavior.
By evaluating and testing proposed incentive compensation plan alternatives,sales leaders can compare different candidate plans objectively and encourage theselection of a plan that is consistent with company strategy, is compatible withsales effectiveness drivers, and has appropriate consequences for salespeople, salesforce activities, customer results, and company results. Testing of candidate salesincentive plans also enhances understanding of the financial risks and the antici-pated sales force behavior associated with each plan. For example, what if the salesforecast turns out to be too high—will sales force engagement decline, and towhat extent is sales force motivation likely to suffer? Alternatively, what if the salesforecast turns out to be too low—how much undeserved incentive money will thefirm pay out, and what impact will the windfall gain have on the sales force’sexpectations for future earnings? Plan testing helps sales leaders anticipate possibleoutcomes, build contingency plans, and ensure that incentive plans can continueto thrive despite an uncertain future.
Plan testing can also help sales leaders foresee and manage any undesired salesforce behaviors that a plan may create. No single incentive plan can solve everysales management problem. A compensation plan that has many advantages will,at the same time, encourage some sales force behaviors that may be detrimentalto the firm. For example, a plan that pays on units sold may encourage salespeopleto cut price in order to build volume, hurting company profitability. A plan thatpays for team performance can encourage ‘‘free riders’’ who are content to relaxand reap the benefits of their teammates’ work. A plan that pays for carryoversales resulting from selling effort applied years ago encourages complacency. Plantesting can help a management team anticipate unwanted side effects of a salesincentive plan prior to implementation so that the undesired sales force behaviorscan be managed appropriately.
An Overview of Candidate Sales Compensation PlanAssessment
Candidate plans can be tested for their effectiveness within the categories in the3 Cs framework.
PAGE 267................. 15869$ $CH8 05-19-06 09:23:40 PS
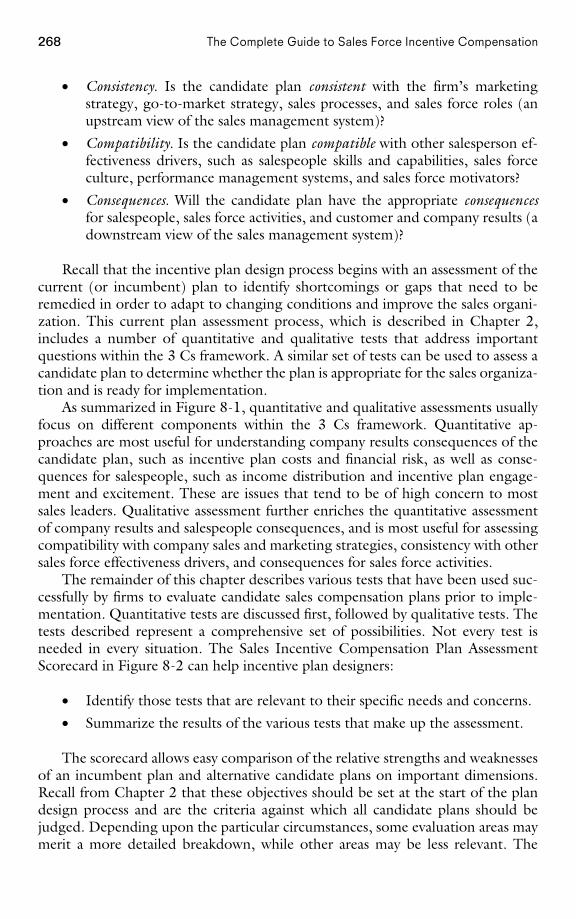
268 The Complete Guide to Sales Force Incentive Compensation
• Consistency. Is the candidate plan consistent with the firm’s marketingstrategy, go-to-market strategy, sales processes, and sales force roles (anupstream view of the sales management system)?
• Compatibility. Is the candidate plan compatible with other salesperson ef-fectiveness drivers, such as salespeople skills and capabilities, sales forceculture, performance management systems, and sales force motivators?
• Consequences. Will the candidate plan have the appropriate consequencesfor salespeople, sales force activities, and customer and company results (adownstream view of the sales management system)?
Recall that the incentive plan design process begins with an assessment of thecurrent (or incumbent) plan to identify shortcomings or gaps that need to beremedied in order to adapt to changing conditions and improve the sales organi-zation. This current plan assessment process, which is described in Chapter 2,includes a number of quantitative and qualitative tests that address importantquestions within the 3 Cs framework. A similar set of tests can be used to assess acandidate plan to determine whether the plan is appropriate for the sales organiza-tion and is ready for implementation.
As summarized in Figure 8-1, quantitative and qualitative assessments usuallyfocus on different components within the 3 Cs framework. Quantitative ap-proaches are most useful for understanding company results consequences of thecandidate plan, such as incentive plan costs and financial risk, as well as conse-quences for salespeople, such as income distribution and incentive plan engage-ment and excitement. These are issues that tend to be of high concern to mostsales leaders. Qualitative assessment further enriches the quantitative assessmentof company results and salespeople consequences, and is most useful for assessingcompatibility with company sales and marketing strategies, consistency with othersales force effectiveness drivers, and consequences for sales force activities.
The remainder of this chapter describes various tests that have been used suc-cessfully by firms to evaluate candidate sales compensation plans prior to imple-mentation. Quantitative tests are discussed first, followed by qualitative tests. Thetests described represent a comprehensive set of possibilities. Not every test isneeded in every situation. The Sales Incentive Compensation Plan AssessmentScorecard in Figure 8-2 can help incentive plan designers:
• Identify those tests that are relevant to their specific needs and concerns.
• Summarize the results of the various tests that make up the assessment.
The scorecard allows easy comparison of the relative strengths and weaknessesof an incumbent plan and alternative candidate plans on important dimensions.Recall from Chapter 2 that these objectives should be set at the start of the plandesign process and are the criteria against which all candidate plans should bejudged. Depending upon the particular circumstances, some evaluation areas maymerit a more detailed breakdown, while other areas may be less relevant. The
PAGE 268................. 15869$ $CH8 05-19-06 09:23:40 PS
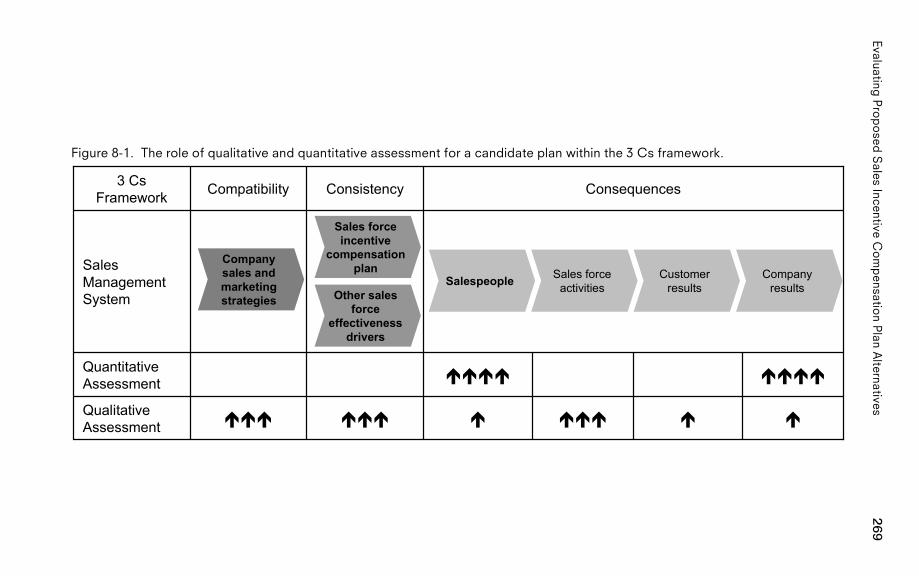
269Evaluating
Pro
po
sedS
alesIncentive
Co
mp
ensation
Plan
Alternatives
Figure 8-1. The role of qualitative and quantitative assessment for a candidate plan within the 3 Cs framework.
ConsequencesConsistencyCompatibility3 CsFramework
SalesManagementSystem
QualitativeAssessment
QuantitativeAssessment
������������
��������
Salespeople Sales forceactivities
Customerresults
Companyresults
Sales forceincentive
compensationplan
Other salesforce
effectivenessdrivers
Companysales andmarketingstrategies
PA
GE
269.................15869$
$CH
805-19-06
09:23:41P
S
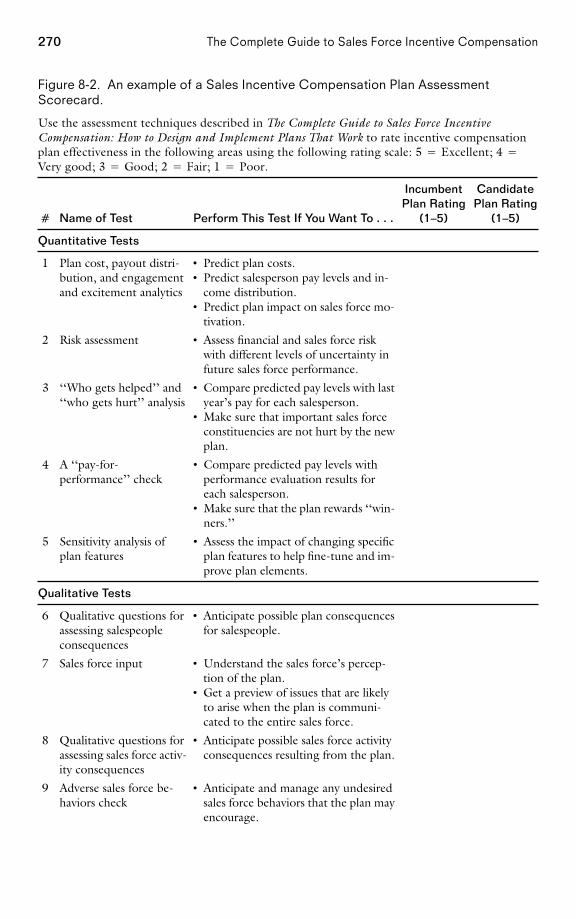
270 The Complete Guide to Sales Force Incentive Compensation
Figure 8-2. An example of a Sales Incentive Compensation Plan AssessmentScorecard.
Use the assessment techniques described in The Complete Guide to Sales Force IncentiveCompensation: How to Design and Implement Plans That Work to rate incentive compensationplan effectiveness in the following areas using the following rating scale: 5 � Excellent; 4 �Very good; 3 � Good; 2 � Fair; 1 � Poor.
Incumbent CandidatePlan Rating Plan Rating
� Name of Test Perform This Test If You Want To . . . (1–5) (1–5)
Quantitative Tests
1 Plan cost, payout distri- • Predict plan costs.bution, and engagement • Predict salesperson pay levels and in-and excitement analytics come distribution.
• Predict plan impact on sales force mo-tivation.
2 Risk assessment • Assess financial and sales force riskwith different levels of uncertainty infuture sales force performance.
3 ‘‘Who gets helped’’ and • Compare predicted pay levels with last‘‘who gets hurt’’ analysis year’s pay for each salesperson.
• Make sure that important sales forceconstituencies are not hurt by the newplan.
4 A ‘‘pay-for- • Compare predicted pay levels withperformance’’ check performance evaluation results for
each salesperson.• Make sure that the plan rewards ‘‘win-
ners.’’
5 Sensitivity analysis of • Assess the impact of changing specificplan features plan features to help fine-tune and im-
prove plan elements.
Qualitative Tests
6 Qualitative questions for • Anticipate possible plan consequencesassessing salespeople for salespeople.consequences
7 Sales force input • Understand the sales force’s percep-tion of the plan.
• Get a preview of issues that are likelyto arise when the plan is communi-cated to the entire sales force.
8 Qualitative questions for • Anticipate possible sales force activityassessing sales force activ- consequences resulting from the plan.ity consequences
9 Adverse sales force be- • Anticipate and manage any undesiredhaviors check sales force behaviors that the plan may
encourage.
PAGE 270................. 15869$ $CH8 05-19-06 09:23:42 PS
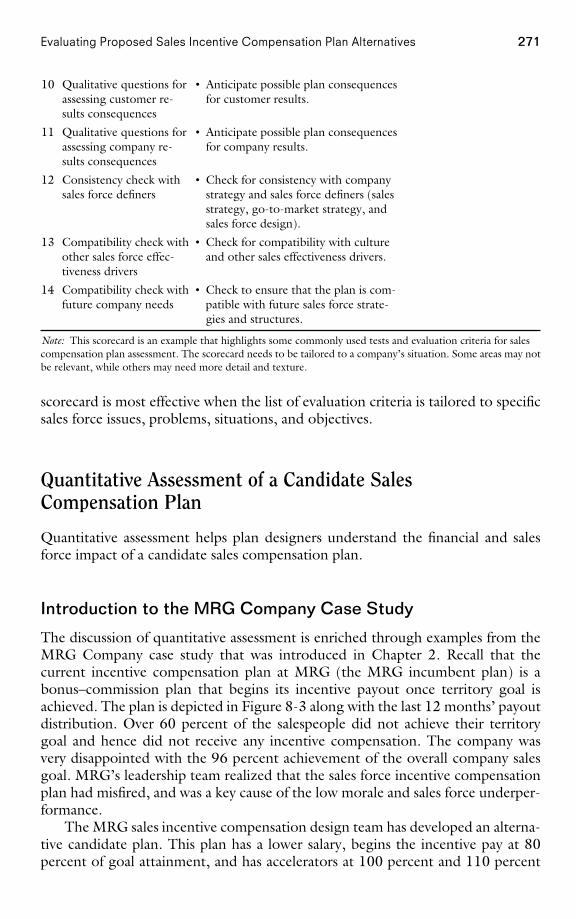
271Evaluating Proposed Sales Incentive Compensation Plan Alternatives
10 Qualitative questions for • Anticipate possible plan consequencesassessing customer re- for customer results.sults consequences
11 Qualitative questions for • Anticipate possible plan consequencesassessing company re- for company results.sults consequences
12 Consistency check with • Check for consistency with companysales force definers strategy and sales force definers (sales
strategy, go-to-market strategy, andsales force design).
13 Compatibility check with • Check for compatibility with cultureother sales force effec- and other sales effectiveness drivers.tiveness drivers
14 Compatibility check with • Check to ensure that the plan is com-future company needs patible with future sales force strate-
gies and structures.
Note: This scorecard is an example that highlights some commonly used tests and evaluation criteria for salescompensation plan assessment. The scorecard needs to be tailored to a company’s situation. Some areas may notbe relevant, while others may need more detail and texture.
scorecard is most effective when the list of evaluation criteria is tailored to specificsales force issues, problems, situations, and objectives.
Quantitative Assessment of a Candidate SalesCompensation Plan
Quantitative assessment helps plan designers understand the financial and salesforce impact of a candidate sales compensation plan.
Introduction to the MRG Company Case Study
The discussion of quantitative assessment is enriched through examples from theMRG Company case study that was introduced in Chapter 2. Recall that thecurrent incentive compensation plan at MRG (the MRG incumbent plan) is abonus–commission plan that begins its incentive payout once territory goal isachieved. The plan is depicted in Figure 8-3 along with the last 12 months’ payoutdistribution. Over 60 percent of the salespeople did not achieve their territorygoal and hence did not receive any incentive compensation. The company wasvery disappointed with the 96 percent achievement of the overall company salesgoal. MRG’s leadership team realized that the sales force incentive compensationplan had misfired, and was a key cause of the low morale and sales force underper-formance.
The MRG sales incentive compensation design team has developed an alterna-tive candidate plan. This plan has a lower salary, begins the incentive pay at 80percent of goal attainment, and has accelerators at 100 percent and 110 percent
PAGE 271
................. 15869$ $CH8 05-19-06 09:23:42 PS
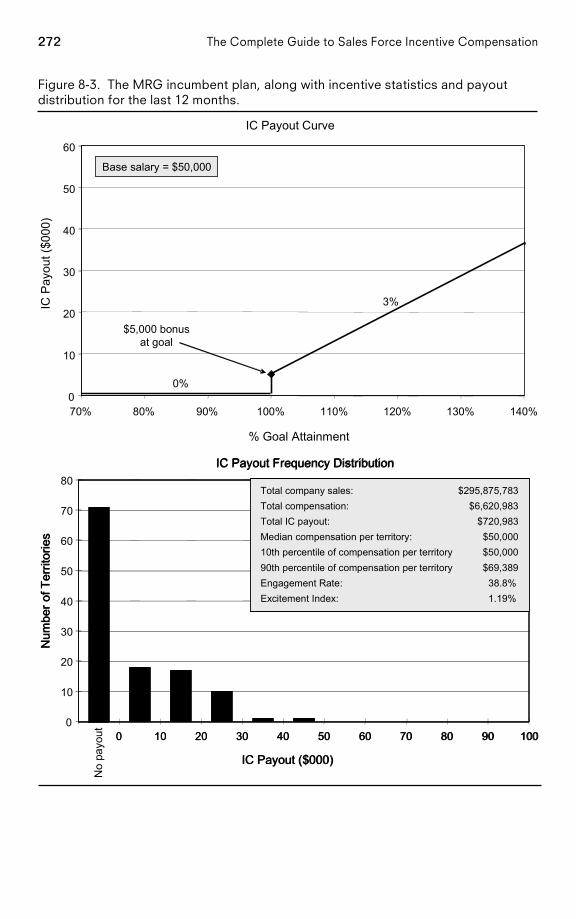
272 The Complete Guide to Sales Force Incentive Compensation
Figure 8-3. The MRG incumbent plan, along with incentive statistics and payoutdistribution for the last 12 months.
IC Payout Curve
0
10
20
30
40
50
60
70% 80% 90% 100% 110% 120% 130% 140%
% Goal Attainment
IC P
ayou
t ($0
00)
3%
$5,000 Bonus at Goal
0%
Base Salary = $50,000
3%
$5,000 bonusat goal
0%
Base salary = $50,000
IC Payout Frequency Distribution
0
10
20
30
40
50
60
70
80
0 10 20 30 40 50 60 70 80 90 100
IC Payout ($000)
Num
ber o
f Ter
ritor
ies
IC Payout Frequency Distribution
0 10 20 30 40 50 60 70 80 90 100
IC Payout ($000)
Num
ber o
f Ter
ritor
ies
Total company sales: $295,875,783Total compensation: $6,620,983Total IC payout: $720,983Median compensation per territory: $50,00010th percentile of compensation per territory $50,00090th percentile of compensation per territory $69,389Engagement Rate: 38.8%Excitement Index: 1.19%
No
payo
ut
PAGE 272................. 15869$ $CH8 05-19-06 09:23:45 PS
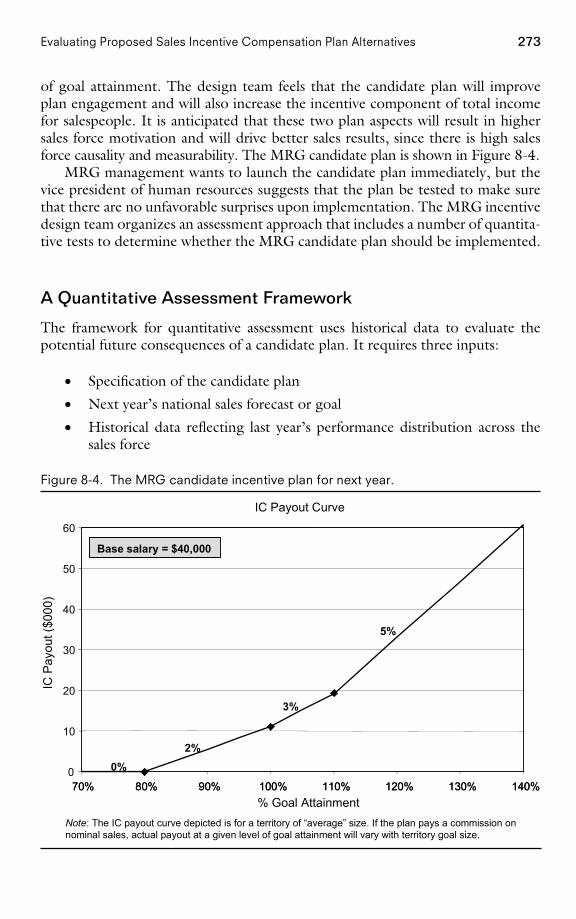
273Evaluating Proposed Sales Incentive Compensation Plan Alternatives
of goal attainment. The design team feels that the candidate plan will improveplan engagement and will also increase the incentive component of total incomefor salespeople. It is anticipated that these two plan aspects will result in highersales force motivation and will drive better sales results, since there is high salesforce causality and measurability. The MRG candidate plan is shown in Figure 8-4.
MRG management wants to launch the candidate plan immediately, but thevice president of human resources suggests that the plan be tested to make surethat there are no unfavorable surprises upon implementation. The MRG incentivedesign team organizes an assessment approach that includes a number of quantita-tive tests to determine whether the MRG candidate plan should be implemented.
A Quantitative Assessment Framework
The framework for quantitative assessment uses historical data to evaluate thepotential future consequences of a candidate plan. It requires three inputs:
• Specification of the candidate plan
• Next year’s national sales forecast or goal
• Historical data reflecting last year’s performance distribution across thesales force
Figure 8-4. The MRG candidate incentive plan for next year.
IC Payout Curve
0
10
20
30
40
50
60
70% 80% 90% 100% 110% 120% 130% 140%% Goal Attainment
IC P
ayou
t ($0
00)
2%
3%
5%
0%
Base Salary = $40,000
70% 80% 90% 100% 110% 120% 130% 140%
2%
3%
5%
0%
Base Salary = $40,000Base salary = $40,000
Note: The IC payout curve depicted is for a territory of “average” size. If the plan pays a commission onnominal sales, actual payout at a given level of goal attainment will vary with territory goal size.
PAGE 273................. 15869$ $CH8 05-19-06 09:23:46 PS
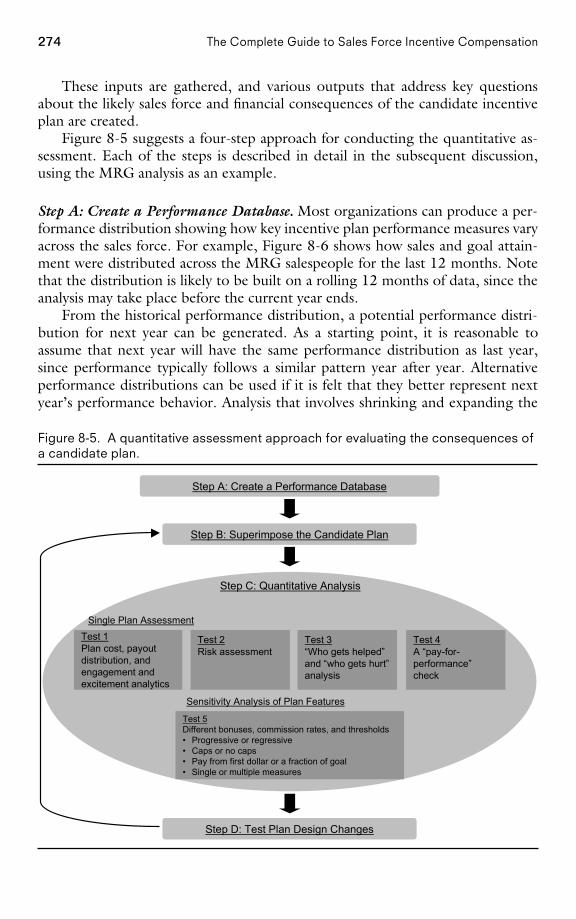
274 The Complete Guide to Sales Force Incentive Compensation
These inputs are gathered, and various outputs that address key questionsabout the likely sales force and financial consequences of the candidate incentiveplan are created.
Figure 8-5 suggests a four-step approach for conducting the quantitative as-sessment. Each of the steps is described in detail in the subsequent discussion,using the MRG analysis as an example.
Step A: Create a Performance Database. Most organizations can produce a per-formance distribution showing how key incentive plan performance measures varyacross the sales force. For example, Figure 8-6 shows how sales and goal attain-ment were distributed across the MRG salespeople for the last 12 months. Notethat the distribution is likely to be built on a rolling 12 months of data, since theanalysis may take place before the current year ends.
From the historical performance distribution, a potential performance distri-bution for next year can be generated. As a starting point, it is reasonable toassume that next year will have the same performance distribution as last year,since performance typically follows a similar pattern year after year. Alternativeperformance distributions can be used if it is felt that they better represent nextyear’s performance behavior. Analysis that involves shrinking and expanding the
Figure 8-5. A quantitative assessment approach for evaluating the consequences ofa candidate plan.
Step B: Superimpose the Candidate Plan
Step D: Test Plan Design Changes
Step A: Create a Performance Database
Step C: Quantitative Analysis
Sensitivity Analysis of Plan Features
Test 5Different bonuses, commission rates, and thresholds• Progressive or regressive• Caps or no caps• Pay from first dollar or a fraction of goal• Single or multiple measures
Test 1Plan cost, payoutdistribution, andengagement andexcitement analytics
Test 2Risk assessment
Test 3“Who gets helped”and “who gets hurt”analysis
Single Plan Assessment
Test 4A “pay-for-performance”check
PAGE 274................. 15869$ $CH8 05-19-06 09:23:47 PS
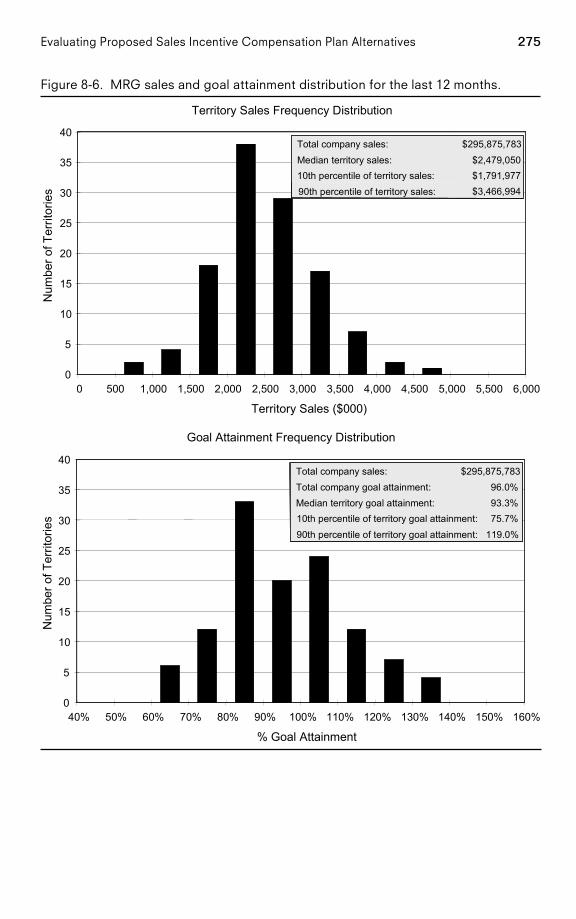
275Evaluating Proposed Sales Incentive Compensation Plan Alternatives
Figure 8-6. MRG sales and goal attainment distribution for the last 12 months.
Territory Sales Frequency Distribution
0
5
10
15
20
25
30
35
40
0 500 1,000 1,500 2,000 2,500 3,000 3,500 4,000 4,500 5,000 5,500 6,000
Territory Sales ($000)
Num
ber o
f Ter
ritor
ies $3,466,99490th percentile of territory sales:
$1,791,97710th Percentile of Territory Sales:$2,479,050Median Territory Sales:
$295,875,783Total Company Sales:
$3,466,994$1,791,97710th percentile of territory sales:$2,479,050Median territory sales:
$295,875,783Total company sales:
Goal Attainment Frequency Distribution
0
5
10
15
20
25
30
35
40
40% 50% 60% 70% 80% 90% 100% 110% 120% 130% 140% 150% 160%
% Goal Attainment
Num
ber o
f Ter
ritor
ies 75.7%10th Percentile of Terr Goal Attainment:
96.0%Total Company Goal Attainment:
119.0%90th Percentile of Terr Goal Attainment:
93.3%Median Territory Goal Attainment:
$295,875,783Total Company Sales:
75.7%10th percentile of territory goal attainment:
96.0%Total company goal attainment:
119.0%90th percentile of territory goal attainment:
93.3%Median territory goal attainment:
$295,875,783Total company sales:
PAGE 275................. 15869$ $CH8 05-19-06 09:23:49 PS
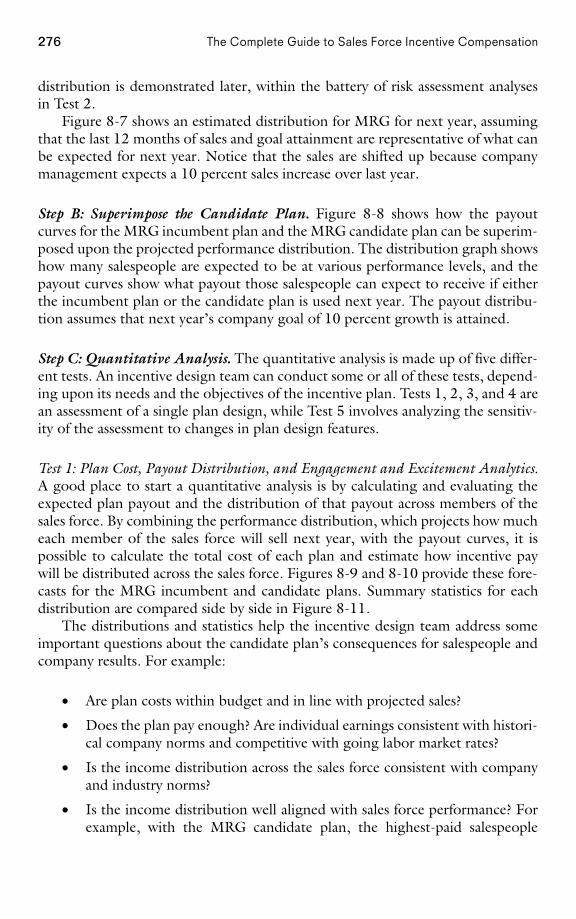
276 The Complete Guide to Sales Force Incentive Compensation
distribution is demonstrated later, within the battery of risk assessment analysesin Test 2.
Figure 8-7 shows an estimated distribution for MRG for next year, assumingthat the last 12 months of sales and goal attainment are representative of what canbe expected for next year. Notice that the sales are shifted up because companymanagement expects a 10 percent sales increase over last year.
Step B: Superimpose the Candidate Plan. Figure 8-8 shows how the payoutcurves for the MRG incumbent plan and the MRG candidate plan can be superim-posed upon the projected performance distribution. The distribution graph showshow many salespeople are expected to be at various performance levels, and thepayout curves show what payout those salespeople can expect to receive if eitherthe incumbent plan or the candidate plan is used next year. The payout distribu-tion assumes that next year’s company goal of 10 percent growth is attained.
Step C: Quantitative Analysis. The quantitative analysis is made up of five differ-ent tests. An incentive design team can conduct some or all of these tests, depend-ing upon its needs and the objectives of the incentive plan. Tests 1, 2, 3, and 4 arean assessment of a single plan design, while Test 5 involves analyzing the sensitiv-ity of the assessment to changes in plan design features.
Test 1: Plan Cost, Payout Distribution, and Engagement and Excitement Analytics.A good place to start a quantitative analysis is by calculating and evaluating theexpected plan payout and the distribution of that payout across members of thesales force. By combining the performance distribution, which projects how mucheach member of the sales force will sell next year, with the payout curves, it ispossible to calculate the total cost of each plan and estimate how incentive paywill be distributed across the sales force. Figures 8-9 and 8-10 provide these fore-casts for the MRG incumbent and candidate plans. Summary statistics for eachdistribution are compared side by side in Figure 8-11.
The distributions and statistics help the incentive design team address someimportant questions about the candidate plan’s consequences for salespeople andcompany results. For example:
• Are plan costs within budget and in line with projected sales?
• Does the plan pay enough? Are individual earnings consistent with histori-cal company norms and competitive with going labor market rates?
• Is the income distribution across the sales force consistent with companyand industry norms?
• Is the income distribution well aligned with sales force performance? Forexample, with the MRG candidate plan, the highest-paid salespeople
PAGE 276................. 15869$ $CH8 05-19-06 09:23:50 PS
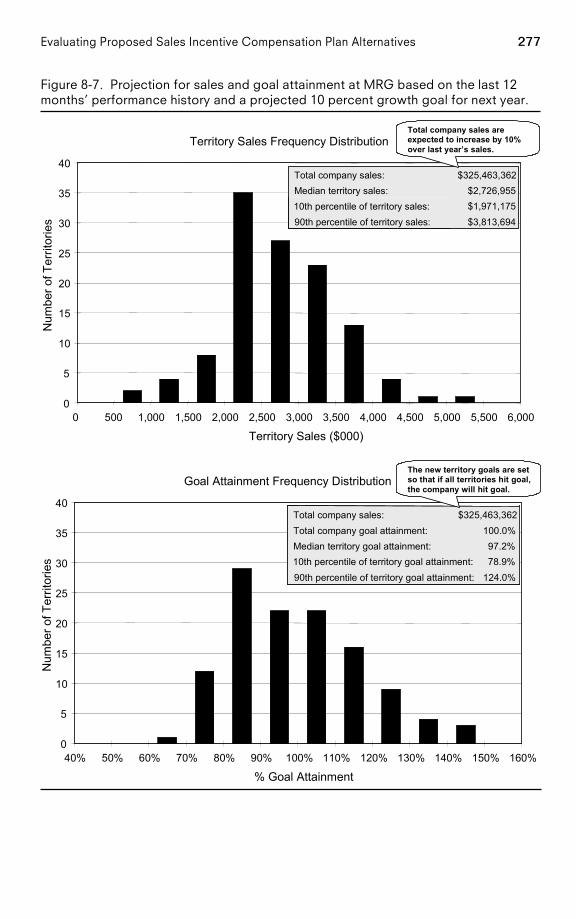
277Evaluating Proposed Sales Incentive Compensation Plan Alternatives
Figure 8-7. Projection for sales and goal attainment at MRG based on the last 12months’ performance history and a projected 10 percent growth goal for next year.
Territory Sales Frequency Distribution
0
5
10
15
20
25
30
35
40
0 500 1,000 1,500 2,000 2,500 3,000 3,500 4,000 4,500 5,000 5,500 6,000
Territory Sales ($000)
Num
ber o
f Ter
ritor
ies $3,813,69490th percentile of territory sales:
$1,971,17510th percentile of territory sales:$2,726,955Median Territory Sales:
$325,463,362Total Company Sales:
$3,813,694$1,971,175$2,726,955Median territory sales:
$325,463,362Total company sales:
Total company sales are expected to increase by 10% over last year’s sales.
Goal Attainment Frequency Distribution
0
5
10
15
20
25
30
35
40
40% 50% 60% 70% 80% 90% 100% 110% 120% 130% 140% 150% 160%
% Goal Attainment
Num
ber o
f Ter
ritor
ies 78.9%10th Percentile of Terr Goal Attainment:
100.0%Total Company Goal Attainment:
124.0%90th Percentile of Terr Goal Attainment:
97.2%Median Territory Goal Attainment:
$325,463,362Total Company Sales:
78.9%10th percentile of territory goal attainment:
100.0%Total company goal attainment:
124.0%90th percentile of territory goal attainment:
97.2%Median territory goal attainment:
$325,463,362Total company sales:
The new territory goals are set so that if all territories hit goal, the company will hit goal.
PAGE 277................. 15869$ $CH8 05-19-06 09:23:52 PS
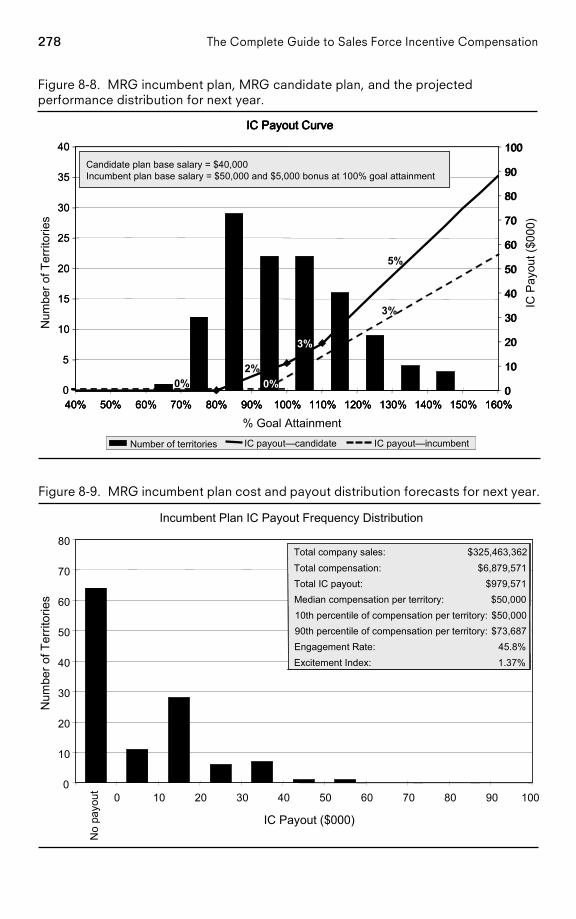
278 The Complete Guide to Sales Force Incentive Compensation
Figure 8-8. MRG incumbent plan, MRG candidate plan, and the projectedperformance distribution for next year.
IC Payout Curve
% Goal Attainment
Num
ber o
f Ter
ritor
ies
0
10
20
30
40
50
60
70
80
90
100
IC P
ayou
t ($0
00)
2%
3%
5%
0% 0%
3%
$5,000 Bonus at Goal
Candidate Plan Base Salary = $40,000
Incumbent Plan Base Salary = $50,000
IC Payout Curve
0
5
10
15
20
25
30
35
40
0
5
10
15
20
25
30
35
40
0
10
20
30
40
50
60
70
80
90
100
2%
3%
5%
0% 0%
3%
$5,000 Bonus at Goal
IC Payout Curve
40% 50% 60% 70% 80% 90% 100% 110% 120% 130% 140% 150% 160%40% 50% 60% 70% 80% 90% 100% 110% 120% 130% 140% 150% 160%40% 50% 60% 70% 80% 90% 100% 110% 120% 130% 140% 150% 160%0
10
20
30
40
50
60
70
80
90
100
2%
5%
0%
3%
Candidate plan base salary = $40,000Incumbent plan base salary = $50,000 and $5,000 bonus at 100% goal attainment
3%
0%
Number of Territories IC Payout - Candidate IC Payout - Incumbent Number of Territories IC Payout - Candidate IC Payout - Incumbent Number of territories IC payout—candidate IC payout—incumbent
Figure 8-9. MRG incumbent plan cost and payout distribution forecasts for next year.
Incumbent Plan IC Payout Frequency Distribution
0
10
20
30
40
50
60
70
80
0 10 20 30 40 50 60 70 80 90 100
IC Payout ($000)
Num
ber o
f Ter
ritor
ies
$50,00010th Percentile of Compensation per Terr:$73,68790th Percentile of Compensation per Terr:
45.8%Engagement Rate:
$50,000Median Compensation per Territory:$979,571Total IC Payout:
1.37%Excitement Index:
$6,879,571Total Compensation:$325,463,362Total Company Sales:
$50,00010th percentile of compensation per territory:$73,68790th percentile of compensation per territory:
45.8%Engagement Rate:
$50,000Median compensation per territory:$979,571Total IC payout:
1.37%Excitement Index:
$6,879,571Total compensation:$325,463,362Total company sales:
No
payo
ut
PAGE 278................. 15869$ $CH8 05-19-06 09:23:53 PS
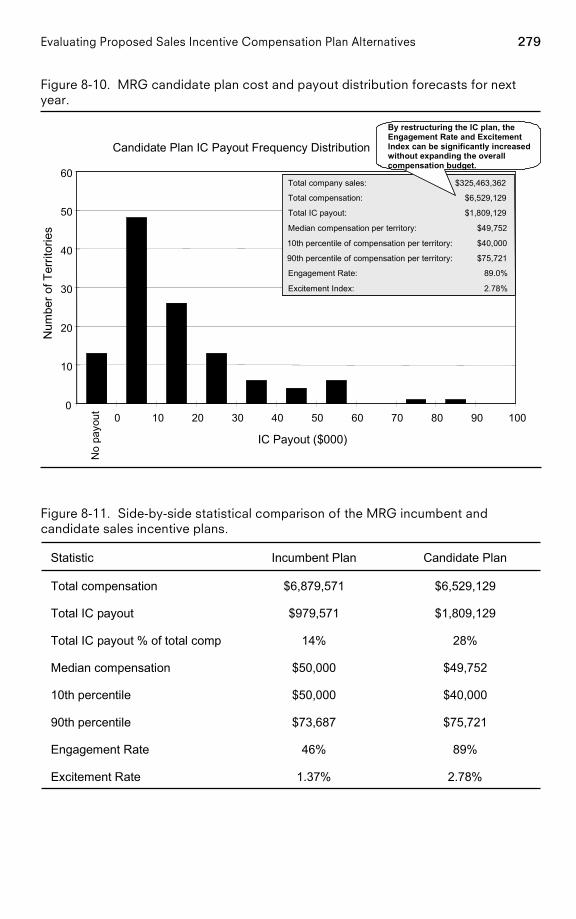
279Evaluating Proposed Sales Incentive Compensation Plan Alternatives
Figure 8-10. MRG candidate plan cost and payout distribution forecasts for nextyear.
Candidate Plan IC Payout Frequency Distribution
0
10
20
30
40
50
60
0 10 20 30 40 50 60 70 80 90 100
IC Payout ($000)
Num
ber o
f Ter
ritor
ies
$40,00010th Percentile of Compensation per Terr:
$75,72190th Percentile of Compensation per Terr:
89.0%Engagement Rate:
$49,752Median Compensation per Territory:
$1,809,129Total IC Payout:
2.78%Excitement Index:
$6,529,129Total Compensation:
$325,463,362Total Company Sales:
$40,00010th percentile of compensation per territory:
$75,72190th percentile of compensation per territory:
89.0%Engagement Rate:
$49,752Median compensation per territory:
$1,809,129Total IC payout:
2.78%Excitement Index:
$6,529,129Total compensation:
$325,463,362Total company sales:
By restructuring the IC plan, the Engagement Rate and Excitement Index can be significantly increased without expanding the overall compensation budget.
No
payo
ut
Figure 8-11. Side-by-side statistical comparison of the MRG incumbent andcandidate sales incentive plans.
2.78%1.37%Excitement Rate
89%46%Engagement Rate
$75,721$73,68790th percentile
$40,000$50,00010th percentile
$49,752$50,000Median compensation
28%14%Total IC payout % of total comp
$1,809,129$979,571Total IC payout
$6,529,129$6,879,571Total compensation
Candidate PlanIncumbent PlanStatistic
PAGE 279................. 15869$ $CH8 05-19-06 09:23:55 PS
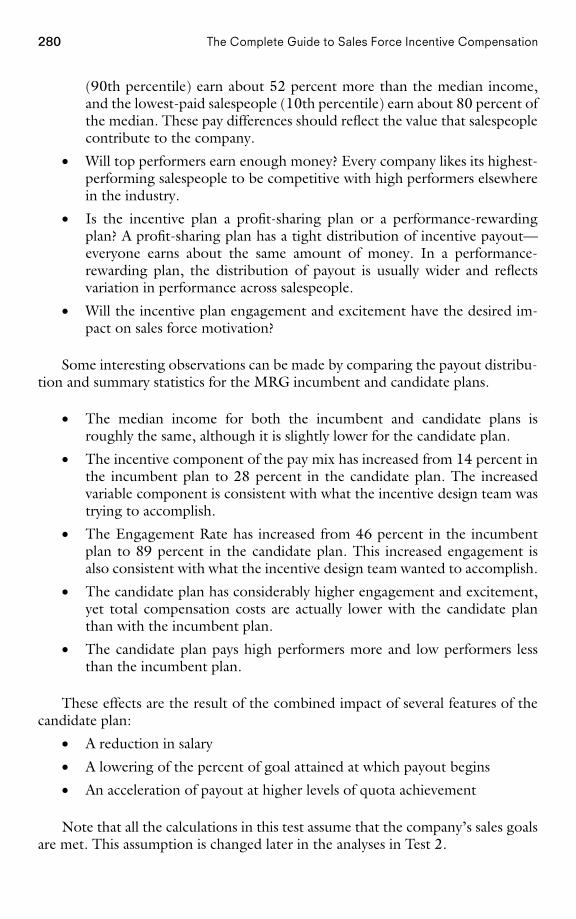
280 The Complete Guide to Sales Force Incentive Compensation
(90th percentile) earn about 52 percent more than the median income,and the lowest-paid salespeople (10th percentile) earn about 80 percent ofthe median. These pay differences should reflect the value that salespeoplecontribute to the company.
• Will top performers earn enough money? Every company likes its highest-performing salespeople to be competitive with high performers elsewherein the industry.
• Is the incentive plan a profit-sharing plan or a performance-rewardingplan? A profit-sharing plan has a tight distribution of incentive payout—everyone earns about the same amount of money. In a performance-rewarding plan, the distribution of payout is usually wider and reflectsvariation in performance across salespeople.
• Will the incentive plan engagement and excitement have the desired im-pact on sales force motivation?
Some interesting observations can be made by comparing the payout distribu-tion and summary statistics for the MRG incumbent and candidate plans.
• The median income for both the incumbent and candidate plans isroughly the same, although it is slightly lower for the candidate plan.
• The incentive component of the pay mix has increased from 14 percent inthe incumbent plan to 28 percent in the candidate plan. The increasedvariable component is consistent with what the incentive design team wastrying to accomplish.
• The Engagement Rate has increased from 46 percent in the incumbentplan to 89 percent in the candidate plan. This increased engagement isalso consistent with what the incentive design team wanted to accomplish.
• The candidate plan has considerably higher engagement and excitement,yet total compensation costs are actually lower with the candidate planthan with the incumbent plan.
• The candidate plan pays high performers more and low performers lessthan the incumbent plan.
These effects are the result of the combined impact of several features of thecandidate plan:
• A reduction in salary
• A lowering of the percent of goal attained at which payout begins
• An acceleration of payout at higher levels of quota achievement
Note that all the calculations in this test assume that the company’s sales goalsare met. This assumption is changed later in the analyses in Test 2.
PAGE 280................. 15869$ $CH8 05-19-06 09:23:56 PS
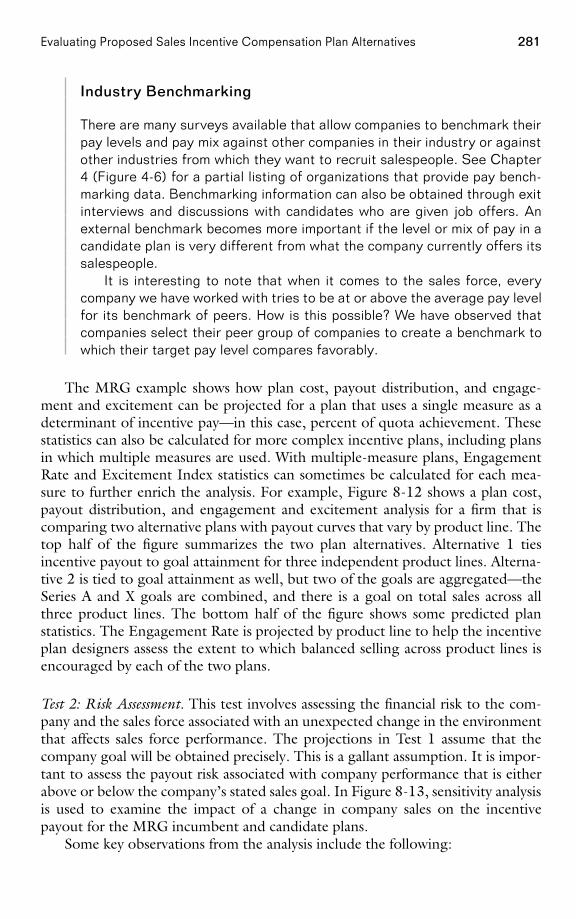
281Evaluating Proposed Sales Incentive Compensation Plan Alternatives
Industry Benchmarking
There are many surveys available that allow companies to benchmark theirpay levels and pay mix against other companies in their industry or againstother industries from which they want to recruit salespeople. See Chapter4 (Figure 4-6) for a partial listing of organizations that provide pay bench-marking data. Benchmarking information can also be obtained through exitinterviews and discussions with candidates who are given job offers. Anexternal benchmark becomes more important if the level or mix of pay in acandidate plan is very different from what the company currently offers itssalespeople.
It is interesting to note that when it comes to the sales force, everycompany we have worked with tries to be at or above the average pay levelfor its benchmark of peers. How is this possible? We have observed thatcompanies select their peer group of companies to create a benchmark towhich their target pay level compares favorably.
The MRG example shows how plan cost, payout distribution, and engage-ment and excitement can be projected for a plan that uses a single measure as adeterminant of incentive pay—in this case, percent of quota achievement. Thesestatistics can also be calculated for more complex incentive plans, including plansin which multiple measures are used. With multiple-measure plans, EngagementRate and Excitement Index statistics can sometimes be calculated for each mea-sure to further enrich the analysis. For example, Figure 8-12 shows a plan cost,payout distribution, and engagement and excitement analysis for a firm that iscomparing two alternative plans with payout curves that vary by product line. Thetop half of the figure summarizes the two plan alternatives. Alternative 1 tiesincentive payout to goal attainment for three independent product lines. Alterna-tive 2 is tied to goal attainment as well, but two of the goals are aggregated—theSeries A and X goals are combined, and there is a goal on total sales across allthree product lines. The bottom half of the figure shows some predicted planstatistics. The Engagement Rate is projected by product line to help the incentiveplan designers assess the extent to which balanced selling across product lines isencouraged by each of the two plans.
Test 2: Risk Assessment. This test involves assessing the financial risk to the com-pany and the sales force associated with an unexpected change in the environmentthat affects sales force performance. The projections in Test 1 assume that thecompany goal will be obtained precisely. This is a gallant assumption. It is impor-tant to assess the payout risk associated with company performance that is eitherabove or below the company’s stated sales goal. In Figure 8-13, sensitivity analysisis used to examine the impact of a change in company sales on the incentivepayout for the MRG incumbent and candidate plans.
Some key observations from the analysis include the following:
PAGE 281................. 15869$ $CH8 05-19-06 09:23:56 PS
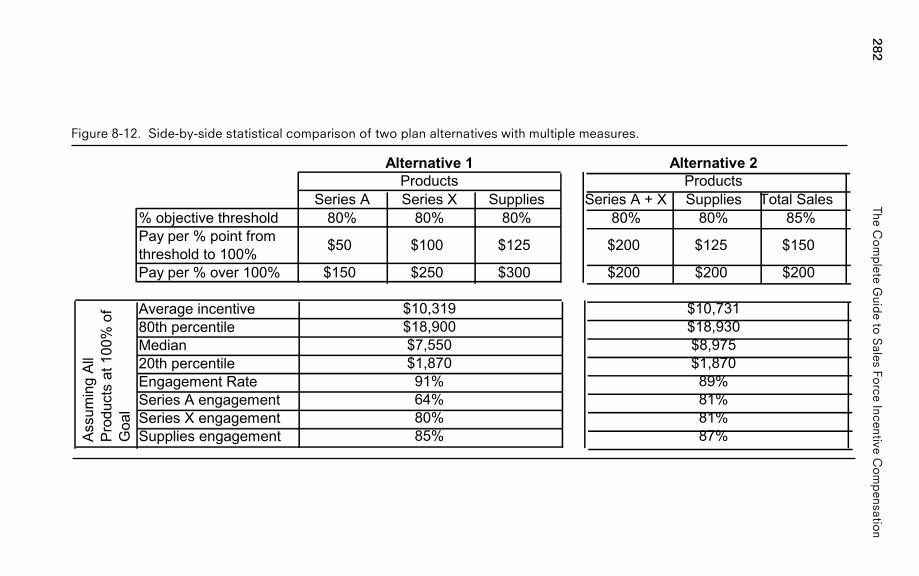
282The
Co
mp
leteG
uide
toS
alesFo
rceIncentive
Co
mp
ensation
Figure 8-12. Side-by-side statistical comparison of two plan alternatives with multiple measures.
Series A Series X Supplies Series A + X Supplies Total Sales% objective threshold 80% 80% 80% 80% 80% 85%Pay per % point from threshold to 100% $50 $100 $125 $200 $125 $150
Pay per % over 100% $150 $250 $300 $200 $200 $200
Average incentive80th percentileMedian20th percentileEngagement RateSeries A engagementSeries X engagementSupplies engagement
Products ProductsAlternative 1 Alternative 2
$10,319$18,900$7,550$1,87091%64%80%85%
$10,731$18,930$8,975$1,87089%81%81%87%As
sum
ing
All
Prod
ucts
at 1
00%
of
Goa
l
PA
GE
282.................15869$
$CH
805-19-06
09:23:58P
S
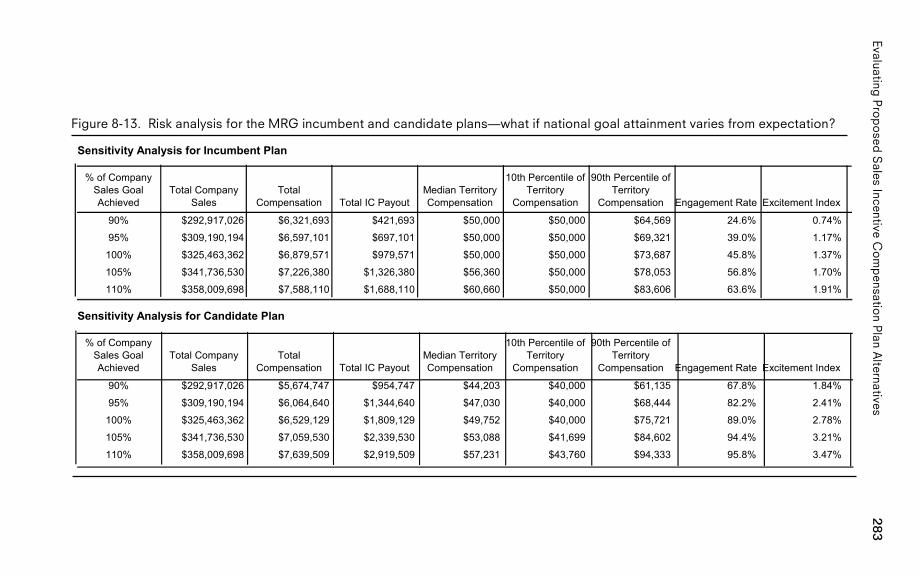
283Evaluating
Pro
po
sedS
alesIncentive
Co
mp
ensation
Plan
Alternatives
Figure 8-13. Risk analysis for the MRG incumbent and candidate plans—what if national goal attainment varies from expectation?
Sensitivity Analysis for Incumbent Plan
% of Company Sales Goal Achieved
Total Company Sales
Total Compensation Total IC Payout
Median Territory Compensation
10th Percentile of Territory
Compensation
90th Percentile of Territory
Compensation Engagement Rate Excitement Index
90% $292,917,026 $6,321,693 $421,693 $50,000 $50,000 $64,569 24.6% 0.74%
95% $309,190,194 $6,597,101 $697,101 $50,000 $50,000 $69,321 39.0% 1.17%
100% $325,463,362 $6,879,571 $979,571 $50,000 $50,000 $73,687 45.8% 1.37%
105% $341,736,530 $7,226,380 $1,326,380 $56,360 $50,000 $78,053 56.8% 1.70%
110% $358,009,698 $7,588,110 $1,688,110 $60,660 $50,000 $83,606 63.6% 1.91%
Sensitivity Analysis for Candidate Plan
% of Company Sales Goal Achieved
Total Company Sales
Total Compensation Total IC Payout
Median Territory Compensation
10th Percentile of Territory
Compensation
90th Percentile of Territory
Compensation Engagement Rate Excitement Index
90% $292,917,026 $5,674,747 $954,747 $44,203 $40,000 $61,135 67.8% 1.84%
95% $309,190,194 $6,064,640 $1,344,640 $47,030 $40,000 $68,444 82.2% 2.41%
100% $325,463,362 $6,529,129 $1,809,129 $49,752 $40,000 $75,721 89.0% 2.78%
105% $341,736,530 $7,059,530 $2,339,530 $53,088 $41,699 $84,602 94.4% 3.21%
110% $358,009,698 $7,639,509 $2,919,509 $57,231 $43,760 $94,333 95.8% 3.47%
PA
GE
283.................15869$
$CH
805-19-06
09:23:59P
S
284 The Complete Guide to Sales Force Incentive Compensation
• The candidate plan pays high performers more than the incumbent planwhen the company makes or exceeds goal. However, when company goalattainment is poor, high performers make less with the candidate planthan with the incumbent plan. This is due to the reduction in salary. Lowperformers make less with the candidate plan and more with the incum-bent plan at all levels of company goal attainment.
• The Engagement Rate and Excitement Index of the candidate plan ismuch higher than those of the incumbent plan at all levels of companyperformance.
• Both total compensation and total IC payout are more sensitive tochanges in total company sales with the candidate plan than with the in-cumbent plan. Much of the stability of the incumbent plan is due to thehigh percentage of salary.
• Total compensation is higher with the candidate plan only at high levelsof company goal achievement.
Figure 8-14 illustrates an analogous sensitivity analysis for a plan with multiplemeasures.
The projections in Test 1 also assume that the performance distribution acrossthe sales force will be the same this year as it was last year. This is not always anaccurate assumption. It is important to assess the payout risk associated with asales force performance distribution that is different from last year’s distribution.In Figure 8-15, sensitivity analysis is used to examine the impact on the incentivepayout for the MRG incumbent and candidate plans if the performance distribu-tion is either tighter or more spread out than last year’s distribution. The scenariosvary the standard deviation of performance variability; the 50 and 75 percentscenarios have less variability and therefore a tighter performance distributionthan last year, while the 125 and 150 percent scenarios have greater variabilityand therefore a wider performance distribution than last year.
Some key observations from the analysis include the following:
• The impact of a 25 percent shift in the standard deviation of performancevariability (Figure 8-15) is relatively minor compared to the impact of a10 percent shift in overall company performance (Figure 8-13).
• Increased variability in performance causes the range in payout betweenhigh performers and low performers to widen—the low performers getpaid even less, and the high performers get paid even more. The gap isgreater with the candidate plan than it is with the incumbent plan.
• The Engagement Rate and Excitement Index of the candidate plan aremuch higher than those of the incumbent plan at all levels of performancevariation.
By evaluating different scenarios for sales force performance, the incentivedesign team gains a better understanding of possible incentive plan consequences
PAGE 284................. 15869$ $CH8 05-19-06 09:23:59 PS
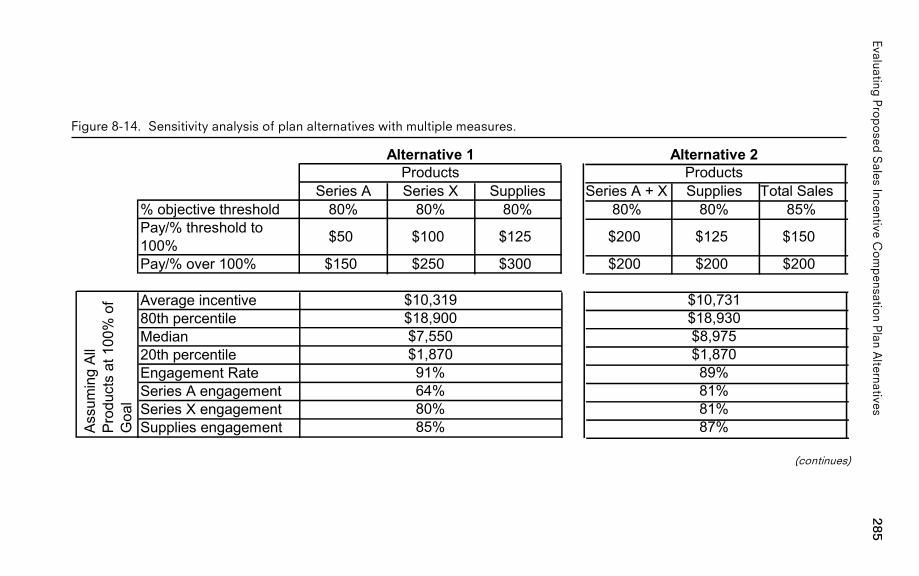
285Evaluating
Pro
po
sedS
alesIncentive
Co
mp
ensation
Plan
Alternatives
Figure 8-14. Sensitivity analysis of plan alternatives with multiple measures.
Series A Series X Supplies Series A + X Supplies Total Sales% objective threshold 80% 80% 80% 80% 80% 85%Pay/% threshold to 100% $50 $100 $125 $200 $125 $150
Pay/% over 100% $150 $250 $300 $200 $200 $200
Average incentive80th percentileMedian20th percentileEngagement RateSeries A engagementSeries X engagementSupplies engagement
Alternative 1 Alternative 2Products Products
Assu
min
g Al
l Pr
oduc
ts a
t 100
% o
f G
oal
$10,319 $10,731$18,900 $18,930$7,550 $8,975$1,870 $1,87091% 89%64% 81%80% 81%85% 87%
(continues)
PA
GE
285.................15869$
$CH
805-19-06
09:24:00P
S
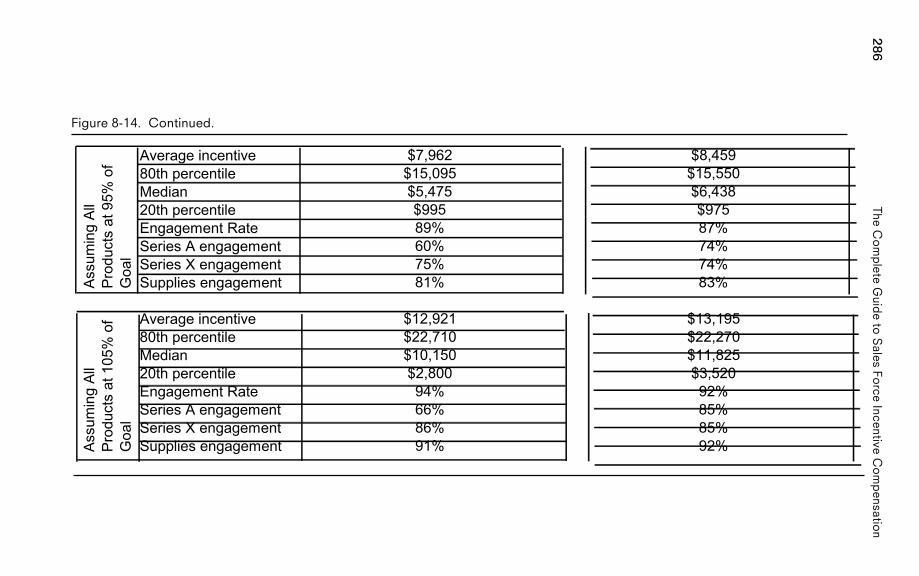
286The
Co
mp
leteG
uide
toS
alesFo
rceIncentive
Co
mp
ensation
Figure 8-14. Continued.
Average incentive80th percentileMedian20th percentileEngagement RateSeries A engagementSeries X engagementSupplies engagement
Average incentive80th percentileMedian20th percentileEngagement RateSeries A engagementSeries X engagementSupplies engagement
Assu
min
g Al
l Pr
oduc
ts a
t 95%
of
Goa
l
$7,962 $8,459$15,095 $15,550$5,475 $6,438$995 $97589% 87%60% 74%75% 74%81% 83%
Assu
min
g Al
l Pr
oduc
ts a
t 105
% o
f G
oal
$12,921 $13,195$22,710 $22,270$10,150 $11,825$2,800 $3,52094% 92%66% 85%86% 85%91% 92%
PA
GE
286.................15869$
$CH
805-19-06
09:24:01P
S
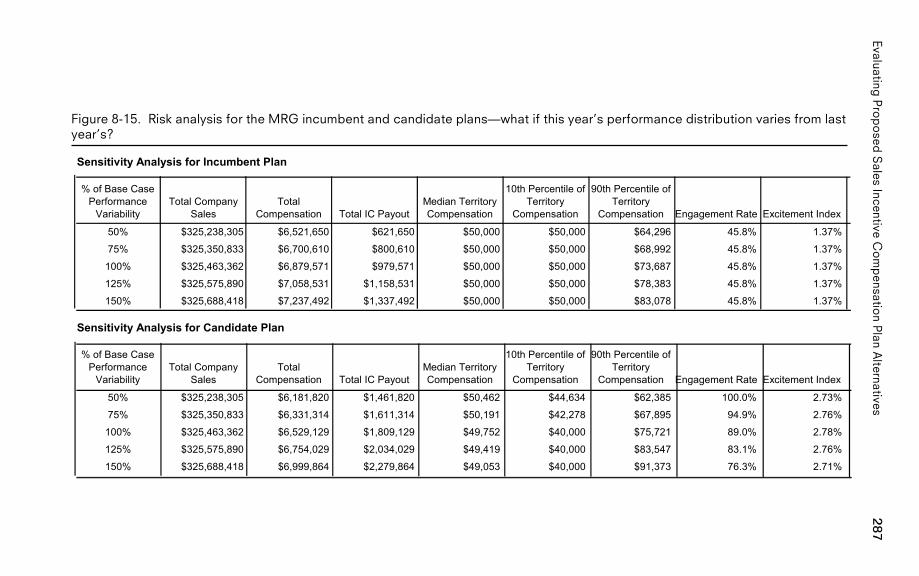
287Evaluating
Pro
po
sedS
alesIncentive
Co
mp
ensation
Plan
Alternatives
Figure 8-15. Risk analysis for the MRG incumbent and candidate plans—what if this year’s performance distribution varies from lastyear’s?
Sensitivity Analysis for Incumbent Plan
% of Base Case Performance
VariabilityTotal Company
SalesTotal
Compensation Total IC PayoutMedian Territory Compensation
10th Percentile of Territory
Compensation
90th Percentile of Territory
Compensation Engagement Rate Excitement Index
50% $325,238,305 $6,521,650 $621,650 $50,000 $50,000 $64,296 45.8% 1.37%
75% $325,350,833 $6,700,610 $800,610 $50,000 $50,000 $68,992 45.8% 1.37%
100% $325,463,362 $6,879,571 $979,571 $50,000 $50,000 $73,687 45.8% 1.37%
125% $325,575,890 $7,058,531 $1,158,531 $50,000 $50,000 $78,383 45.8% 1.37%
150% $325,688,418 $7,237,492 $1,337,492 $50,000 $50,000 $83,078 45.8% 1.37%
Sensitivity Analysis for Candidate Plan
% of Base Case Performance
VariabilityTotal Company
SalesTotal
Compensation Total IC PayoutMedian Territory Compensation
10th Percentile of Territory
Compensation
90th Percentile of Territory
Compensation Engagement Rate Excitement Index
50% $325,238,305 $6,181,820 $1,461,820 $50,462 $44,634 $62,385 100.0% 2.73%
75% $325,350,833 $6,331,314 $1,611,314 $50,191 $42,278 $67,895 94.9% 2.76%
100% $325,463,362 $6,529,129 $1,809,129 $49,752 $40,000 $75,721 89.0% 2.78%
125% $325,575,890 $6,754,029 $2,034,029 $49,419 $40,000 $83,547 83.1% 2.76%
150% $325,688,418 $6,999,864 $2,279,864 $49,053 $40,000 $91,373 76.3% 2.71%
PA
GE
287.................15869$
$CH
805-19-06
09:24:01P
S
288 The Complete Guide to Sales Force Incentive Compensation
and can therefore build the needed flexibility into the plan. A thorough risk analy-sis helps to ensure that a plan will motivate the sales force and reward salespeoplefairly under a range of different future performance outcomes.
Test 3: ‘‘Who Gets Helped’’ and ‘‘Who Gets Hurt’’ Analysis. A person-by-personanalysis of the impact of a candidate incentive plan shows which salespeople willbe helped and which will be hurt by a new plan. This helps the design team assessthe attractiveness of the plan to various constituencies within the sales force andthe ease of sales force acceptance, as well as the fairness of the plan and the extentto which the plan pays for performance. It is useful to compare the amount of paythat each salesperson received last year with the incumbent plan to the projectedamount that that salesperson will receive next year if the candidate plan is imple-mented. This analysis of ‘‘who gets helped’’ and ‘‘who gets hurt’’ by a candidateplan provides insight about how challenging the new plan will be to implement.Selling organizations like to either keep salespeople ‘‘whole’’ or ensure that theredistribution of income resulting from a plan change matches income to per-formance. ‘‘Salespeople should not lose income because we change our incentivecompensation plan,’’ says one national sales manager. The vice president of salesadds, ‘‘Certainly, high performers should make as much or more under the newplan.’’
Figure 8-16 shows how total income might change for individual salespeopleif the candidate plan is implemented at MRG. The graph plots last year’s incomewith the incumbent plan versus the projected income for next year if the candidateplan is adopted for each salesperson. There is a cluster of salespeople who earnedin the $60,000 range last year with the incumbent plan whose income is likely tobe less if the candidate plan is adopted. Even though the salespeople in this groupare average or slightly below average performers, it is a sufficiently large group forMRG sales leaders not to want to alienate it. The design team is also concernedthat the median income with the candidate plan is somewhat lower than with theincumbent plan.
Figure 8-17 illustrates another way to display who gets helped/who gets hurtinformation. It shows the projected income difference between next year’s incomewith a candidate plan and last year’s income with the incumbent plan for a con-sumer packaged goods company.
Who gets helped/who gets hurt analysis is particularly important during planstructure changes. For example, when switching from a commission plan that paysfrom the first dollar sold to a goal-based plan that pays from a threshold percent-age of goal attainment, territories with high sales but low goal attainment will loseearnings to territories with low sales but high goal attainment. In such cases, it isuseful to identify the individual salespeople who are likely to be affected so that atransition strategy can be developed.
Good candidate compensation plans are not inadvertently biased against im-portant constituencies within the sales force. Whenever there is a significant corre-lation between incentive payout and an independent territory variable that doesnot reflect a salesperson’s effort or skill, there is a possible incentive plan (or goal-
PAGE 288................. 15869$ $CH8 05-19-06 09:24:02 PS

289Evaluating Proposed Sales Incentive Compensation Plan Alternatives
Figure 8-16. Who gets helped and who gets hurt analysis for MRG.
40,000
60,000
80,000
100,000
120,000
140,000
40,000 60,000 80,000 100,000 120,000 140,000
The candidate plan, as currently defined, may have a small negative impact on “average” or “slightly below average” reps; to address this, the candidate plan could be modified to include a slightly higher base salary
Total Compensation ($)—Incumbent PlanLast Year
40,000
60,000
80,000
100,000
120,000
140,000
40,000 60,000 80,000 100,000 120,000 140,000
The candidate plan, as currently defined, may have a small negative impact on “average” or “slightly below average” reps; to address this, the candidate plan could be modified to include a slightly higher base salary40,000
60,000
80,000
100,000
120,000
140,000
40,000 60,000 80,000 100,000 120,000 140,000
The candidate plan, as currently defined, may have a small negative impact on average or slightly below average reps; to address this, the candidate plan could be modified to include a slightly higher base salary.
Est
imat
ed T
otal
Com
pens
atio
n ($
)—C
andi
date
Pla
nN
ext Y
ear
Who Gets Helped/Who Gets Hurt Analysis(Based on the Coming Year’s Projected Performance Distribution)
Figure 8-17. An individual impact analysis for a consumer packaged goods company.
-6,000
-4,000
-2,000
0
2,000
4,000
6,000
8,000
10,000
Ranked Change in Incentive Pay by Salesperson
Exp
ecte
d C
hang
e in
Pay
with
the
Can
dida
te P
lan
There are a few more losers than winners with the candidate plan.
Each bar represents a salesperson.
Whether a salesperson’s incentiveincreases or decreases does not
depend on the current level ofincentive pay.
Relationship Between Current Incentive and Change Under New Plan
-6,000-4,000-2,000
02,0004,0006,0008,000
10,000
5,000 10,000 15,000 20,000 25,000
Incentive ($)
Cha
nge
in In
cent
ive
Relationship Between Current Incentive
-6,000-4,000-2,000
02,0004,0006,0008,000
10,000
5,000 10,000 15,000 20,000 25,000
Incentive ($)
Cha
nge
in In
cent
ive
Relationship Between Current Incentive andExpected Change with Candidate Plan
5,000 10,000 15,000 20,000 25,000
Current Incentive ($)
Exp
ecte
d C
hang
e in
Ince
ntiv
e
-6,000-4,000-2,000
02,0004,0006,0008,000
10,000
PAGE 289................. 15869$ $CH8 05-19-06 09:24:05 PS
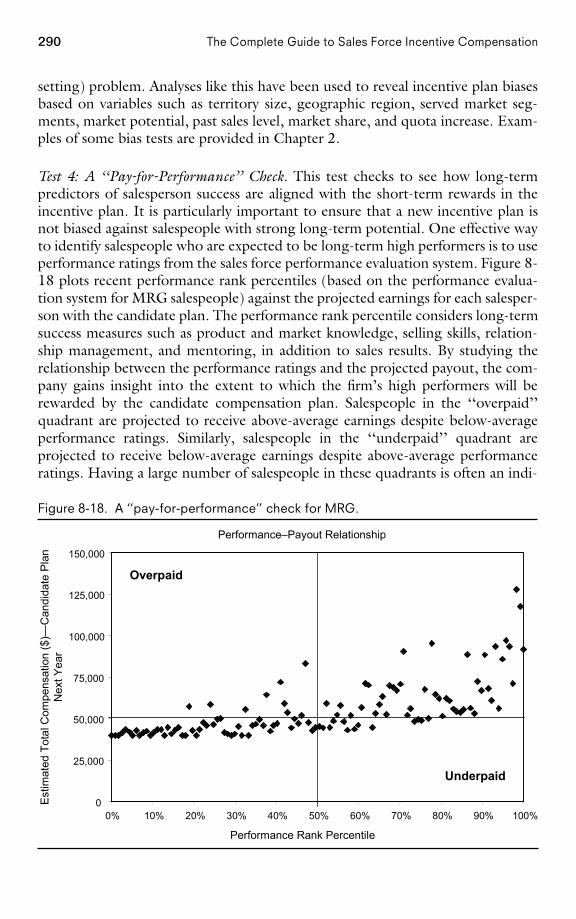
290 The Complete Guide to Sales Force Incentive Compensation
setting) problem. Analyses like this have been used to reveal incentive plan biasesbased on variables such as territory size, geographic region, served market seg-ments, market potential, past sales level, market share, and quota increase. Exam-ples of some bias tests are provided in Chapter 2.
Test 4: A ‘‘Pay-for-Performance’’ Check. This test checks to see how long-termpredictors of salesperson success are aligned with the short-term rewards in theincentive plan. It is particularly important to ensure that a new incentive plan isnot biased against salespeople with strong long-term potential. One effective wayto identify salespeople who are expected to be long-term high performers is to useperformance ratings from the sales force performance evaluation system. Figure 8-18 plots recent performance rank percentiles (based on the performance evalua-tion system for MRG salespeople) against the projected earnings for each salesper-son with the candidate plan. The performance rank percentile considers long-termsuccess measures such as product and market knowledge, selling skills, relation-ship management, and mentoring, in addition to sales results. By studying therelationship between the performance ratings and the projected payout, the com-pany gains insight into the extent to which the firm’s high performers will berewarded by the candidate compensation plan. Salespeople in the ‘‘overpaid’’quadrant are projected to receive above-average earnings despite below-averageperformance ratings. Similarly, salespeople in the ‘‘underpaid’’ quadrant areprojected to receive below-average earnings despite above-average performanceratings. Having a large number of salespeople in these quadrants is often an indi-
Figure 8-18. A ‘‘pay-for-performance’’ check for MRG.
Overpaid
Underpaid
Performance–Payout Relationship
0
25,000
50,000
75,000
100,000
125,000
150,000
0% 10% 20% 30% 40% 50% 60% 70% 80% 90% 100%
Performance Rank Percentile
Est
imat
ed T
otal
Com
pens
atio
n ($
)—C
andi
date
Pla
nN
ext Y
ear
PAGE 290................. 15869$ $CH8 05-19-06 09:24:06 PS
291Evaluating Proposed Sales Incentive Compensation Plan Alternatives
cation that there is a problem with a candidate plan, since the plan is not consis-tently rewarding the salespeople that the firm hopes to keep.
Test 5: Sensitivity Analysis of Plan Features. Incentive compensation designers usu-ally lock on to a plan structure early in the design process. Through testing, theyfine-tune the specific plan elements. By doing a sensitivity analysis of plan featuressuch as the specific measures used, the percent of goal at which payouts begin,bonuses and commission rates, and caps, plan elements can be improved. Sensitiv-ity analysis can be used to examine the impact of specific changes in plan designon expected plan costs, payout distribution, and sales force engagement and ex-citement.
Figures 8-19 and 8-20 show how sensitive various plan performance statisticsare to changes in plan design parameters for MRG.
Step D: Test Plan Design Changes. The quantitative assessment process some-times reveals problems with a candidate incentive plan that can be addressed byrevising the plan design. When this happens, a revised candidate plan is proposed,and the quantitative testing process begins again.
The incentive design team at MRG concludes that 80 percent is a good placeto begin the incentive payout and that the steepness of the payout curve in theoriginal candidate plan is appropriate. However, the design team is concernedbecause the person-by-person analysis of the candidate plan reveals that a largenumber of average or slightly below average performers will receive less incomewith the candidate plan. The design team does not want to create a morale crisisby angering this large and important group of salespeople. (In some instances,plan changes are designed to reduce the income of this very group.) Hence, theteam develops a revised candidate plan that includes a salary increase from$40,000 to $42,500. Then it repeats several of the quantitative analyses describedin Step C for the revised candidate plan. Figure 8-21 shows the results of Test 1(payout distribution and statistics) for the MRG revised candidate plan. Summarystatistics are compared side by side with statistics for the incumbent plan and theoriginal candidate plan in Figure 8-22. Figure 8-23 shows the results of Test 3(who gets helped and who gets hurt) for the revised candidate plan.
Some key observations from the analysis include the following:
• The revised candidate plan raises the median income above that of theincumbent plan.
• The revised candidate plan protects the large group of average to slightlybelow average salespeople, thus enhancing the new plan in the eyes of thesales force.
• The total cost of the revised candidate plan is slightly more than that ofthe original candidate plan, but still less than that of the incumbent plan.The incentive design team feels that this cost increase in the revised plan
PAGE 291................. 15869$ $CH8 05-19-06 09:24:06 PS
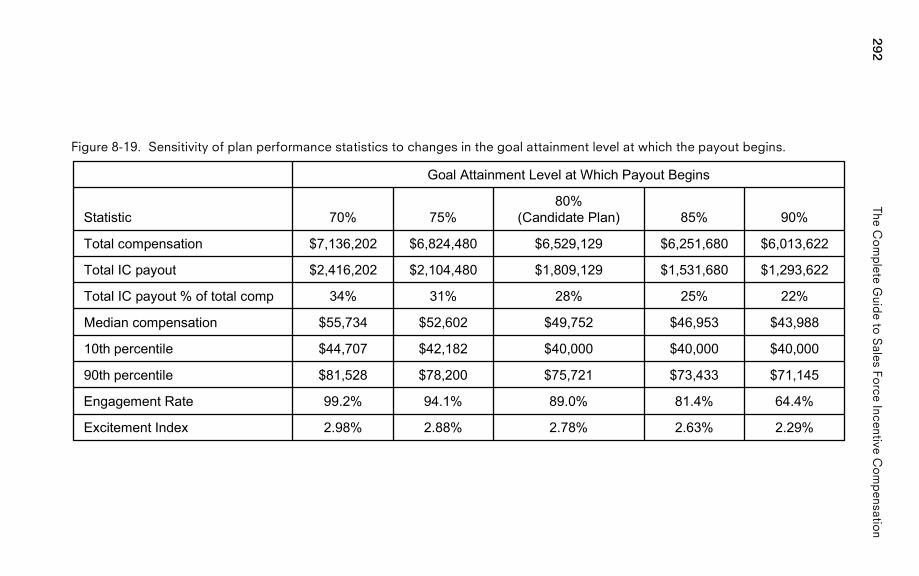
292The
Co
mp
leteG
uide
toS
alesFo
rceIncentive
Co
mp
ensation
Figure 8-19. Sensitivity of plan performance statistics to changes in the goal attainment level at which the payout begins.
2.29%2.63%2.78%2.88%2.98%Excitement Index
64.4%81.4%89.0%94.1%99.2%Engagement Rate
$71,145$73,433$75,721$78,200$81,52890th percentile
$40,000$40,000$40,000$42,182$44,70710th percentile
$43,988$46,953$49,752$52,602$55,734Median compensation
22%25%28%31%34%Total IC payout % of total comp
$1,293,622$1,531,680$1,809,129$2,104,480$2,416,202Total IC payout
$6,013,622$6,251,680$6,529,129$6,824,480$7,136,202Total compensation
90%85%80%
(Candidate Plan)75%70%Statistic
Goal Attainment Level at Which Payout Begins
PA
GE
292.................15869$
$CH
805-19-06
09:24:07P
S
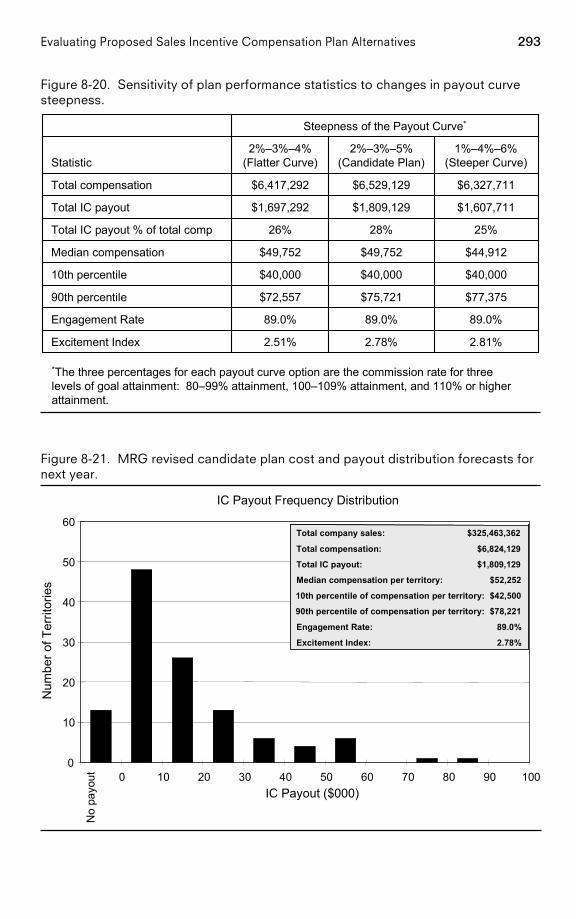
293Evaluating Proposed Sales Incentive Compensation Plan Alternatives
Figure 8-20. Sensitivity of plan performance statistics to changes in payout curvesteepness.
2.81%2.78%2.51%Excitement Index
89.0%89.0%89.0%Engagement Rate
$77,375$75,721$72,55790th percentile
$40,000$40,000$40,00010th percentile
$44,912$49,752$49,752Median compensation
25%28%26%Total IC payout % of total comp
$1,607,711$1,809,129$1,697,292Total IC payout
$6,327,711$6,529,129$6,417,292Total compensation
1%–4%–6%(Steeper Curve)
2%–3%–5%(Candidate Plan)
2%–3%–4%(Flatter Curve)Statistic
Steepness of the Payout Curve*
*The three percentages for each payout curve option are the commission rate for threelevels of goal attainment: 80–99% attainment, 100–109% attainment, and 110% or higherattainment.
Figure 8-21. MRG revised candidate plan cost and payout distribution forecasts fornext year.
IC Payout Frequency Distribution
0
10
20
30
40
50
60
0 10 20 30 40 50 60 70 80 90 100IC Payout ($000)
Num
ber o
f Ter
ritor
ies
$42,50010th Percentile of Compensation per Terr:
$78,22190th Percentile of Compensation per Terr:
89.0%Engagement Rate:
$52,252Median Compensation per Territory:
$1,809,129Total IC Payout:
2.78%Excitement Index:
$6,824,129Total Compensation:
$325,463,362Total Company Sales:
$42,50010th percentile of compensation per territory:
$78,22190th percentile of compensation per territory:
89.0%Engagement Rate:
$52,252Median compensation per territory:
$1,809,129Total IC payout:
2.78%Excitement Index:
$6,824,129Total compensation:
$325,463,362Total company sales:
No
payo
ut
PAGE 293................. 15869$ $CH8 05-19-06 09:24:09 PS
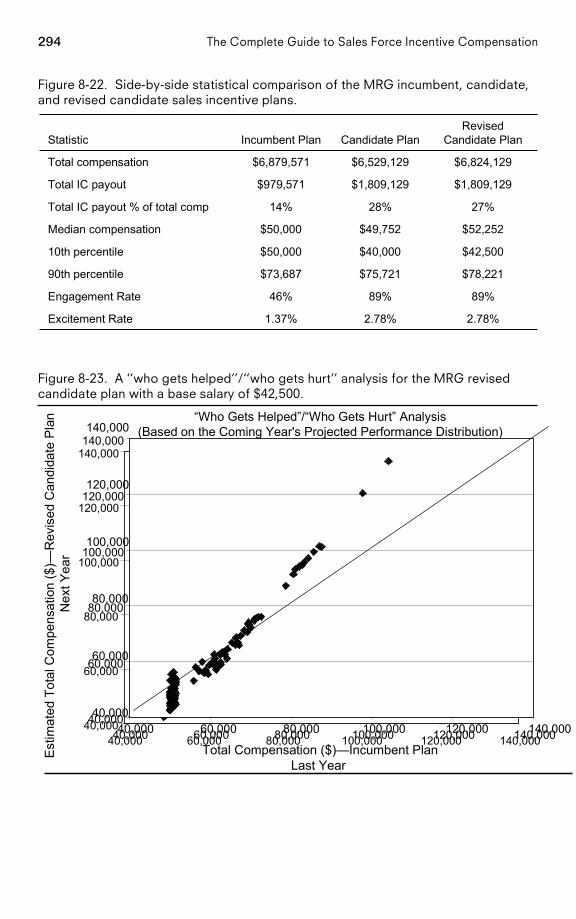
294 The Complete Guide to Sales Force Incentive Compensation
Figure 8-22. Side-by-side statistical comparison of the MRG incumbent, candidate,and revised candidate sales incentive plans.
2.78%2.78%1.37%Excitement Rate
89%89%46%Engagement Rate
$78,221$75,721$73,68790th percentile
$42,500$40,000$50,00010th percentile
$52,252$49,752$50,000Median compensation
27%28%14%Total IC payout % of total comp
$1,809,129$1,809,129$979,571Total IC payout
$6,824,129$6,529,129$6,879,571Total compensation
RevisedCandidate PlanCandidate PlanIncumbent PlanStatistic
Figure 8-23. A ‘‘who gets helped’’/‘‘who gets hurt’’ analysis for the MRG revisedcandidate plan with a base salary of $42,500.
40,000
60,000
80,000
100,000
120,000
140,000
40,000 60,000 80,000 100,000 120,000 140,000
“Who Gets Helped”/“Who Gets Hurt” Analysis(Based on the Coming Year's Projected Performance Distribution)
40,000
60,000
80,000
100,000
120,000
140,000
40,000 60,000 80,000 100,000 120,000 140,000Total Compensation ($)—Incumbent Plan
Last Year
Est
imat
ed T
otal
Com
pens
atio
n ($
)—R
evis
ed C
andi
date
Pla
n N
ext Y
ear
40,000
60,000
80,000
100,000
120,000
140,000
40,000 60,000 80,000 100,000 120,000 140,000
PAGE 294................. 15869$ $CH8 05-19-06 09:24:12 PS
295Evaluating Proposed Sales Incentive Compensation Plan Alternatives
is likely to be self-funding through higher sales force morale and increasedmotivation.
The incentive design team presents the revised candidate plan to the salesleadership team. The vice president of sales is concerned that the plan involves asalary reduction averaging $7,500 per salesperson and feels that this reductionwill be difficult for the sales force to accept. He asks to see what the costs of thenew plan would be if the current salary level of $50,000 were maintained. Theincentive design team runs some additional scenarios with a $50,000 salary andthree different incentive payout curve options. The results of the analysis appearin Figure 8-24. The CFO and the vice president of sales are scheduled to meetthe next day to decide on a plan. What do you think they will decide?
Qualitative Assessment of a Candidate SalesCompensation Plan
Qualitative assessment of a candidate compensation plan adds texture to the rigorof quantitative approaches. Qualitative assessment helps plan designers evaluate acandidate plan across all the components of the 3 Cs framework: consequencesfor salespeople, sales force activities, customer results, and company results; con-sistency with company sales and marketing strategies; and compatibility with othersales force effectiveness drivers.
Qualitative Assessment of Consequences
Qualitative assessment helps sales leaders understand the consequences of a candi-date sales compensation plan for salespeople, sales force activities, customer re-sults, and company results.
Consequences for Salespeople. Test 6: Qualitative Questions for Assessing SalespeopleConsequences. By debating a number of qualitative questions, sales leaders cangain perspective on how salespeople will react to a candidate sales compensationplan. Figure 8-25 provides some examples of the types of questions that can beasked.
Test 7: Sales Force Input. It is often useful to engage the sales force in the incentiveplan design process. As described in Chapter 2, asking the sales force what it likesand dislikes about the current sales compensation plan can provide valuable inputfor the design of a new plan. In addition, salespeople’s opinion of candidate planscan shed light on issues that may easily be overlooked by an incentive design team,which relies primarily on graphs and numbers in its decision process. Sales forceinput often helps sales leaders anticipate important issues that may arise when the
PAGE 295................. 15869$ $CH8 05-19-06 09:24:12 PS
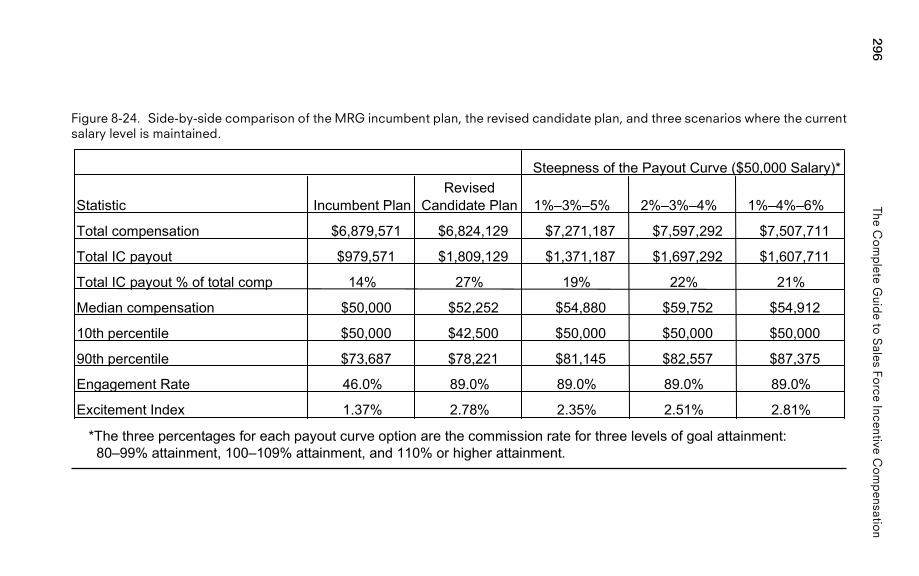
296The
Co
mp
leteG
uide
toS
alesFo
rceIncentive
Co
mp
ensation
Figure 8-24. Side-by-side comparison of the MRG incumbent plan, the revised candidate plan, and three scenarios where the currentsalary level is maintained.
*The three percentages for each payout curve option are the commission rate for three levels of goal attainment: 80–99% attainment, 100–109% attainment, and 110% or higher attainment.
Statistic Incumbent PlanRevised
Candidate Plan 1%–3%–5% 2%–3%–4% 1%–4%–6%
Total compensation $6,879,571 $6,824,129 $7,271,187 $7,597,292 $7,507,711
Total IC payout $979,571 $1,809,129 $1,371,187 $1,697,292 $1,607,711
Total IC payout % of total comp 14% 27% 19% 22% 21%
Median compensation $50,000 $52,252 $54,880 $59,752 $54,912
10th percentile $50,000 $42,500 $50,000 $50,000 $50,000
90th percentile $73,687 $78,221 $81,145 $82,557 $87,375
Engagement Rate 46.0% 89.0% 89.0% 89.0% 89.0%
Excitement Index 1.37% 2.78% 2.35% 2.51% 2.81%
Steepness of the Payout Curve ($50,000 Salary)*
PA
GE
296.................15869$
$CH
805-19-06
09:24:13P
S
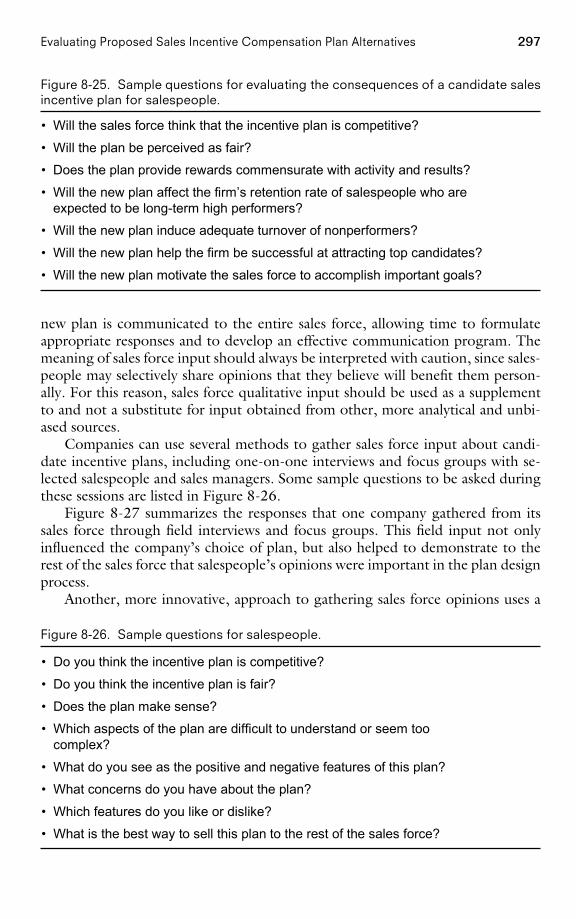
297Evaluating Proposed Sales Incentive Compensation Plan Alternatives
Figure 8-25. Sample questions for evaluating the consequences of a candidate salesincentive plan for salespeople.
• Will the sales force think that the incentive plan is competitive?
• Will the plan be perceived as fair?
• Does the plan provide rewards commensurate with activity and results?
• Will the new plan affect the firm’s retention rate of salespeople who areexpected to be long-term high performers?
• Will the new plan induce adequate turnover of nonperformers?
• Will the new plan help the firm be successful at attracting top candidates?
• Will the new plan motivate the sales force to accomplish important goals?
new plan is communicated to the entire sales force, allowing time to formulateappropriate responses and to develop an effective communication program. Themeaning of sales force input should always be interpreted with caution, since sales-people may selectively share opinions that they believe will benefit them person-ally. For this reason, sales force qualitative input should be used as a supplementto and not a substitute for input obtained from other, more analytical and unbi-ased sources.
Companies can use several methods to gather sales force input about candi-date incentive plans, including one-on-one interviews and focus groups with se-lected salespeople and sales managers. Some sample questions to be asked duringthese sessions are listed in Figure 8-26.
Figure 8-27 summarizes the responses that one company gathered from itssales force through field interviews and focus groups. This field input not onlyinfluenced the company’s choice of plan, but also helped to demonstrate to therest of the sales force that salespeople’s opinions were important in the plan designprocess.
Another, more innovative, approach to gathering sales force opinions uses a
Figure 8-26. Sample questions for salespeople.
• Do you think the incentive plan is competitive?
• Do you think the incentive plan is fair?
• Does the plan make sense?
• Which aspects of the plan are difficult to understand or seem toocomplex?
• What do you see as the positive and negative features of this plan?
• What concerns do you have about the plan?
• Which features do you like or dislike?
• What is the best way to sell this plan to the rest of the sales force?
PAGE 297................. 15869$ $CH8 05-19-06 09:24:15 PS
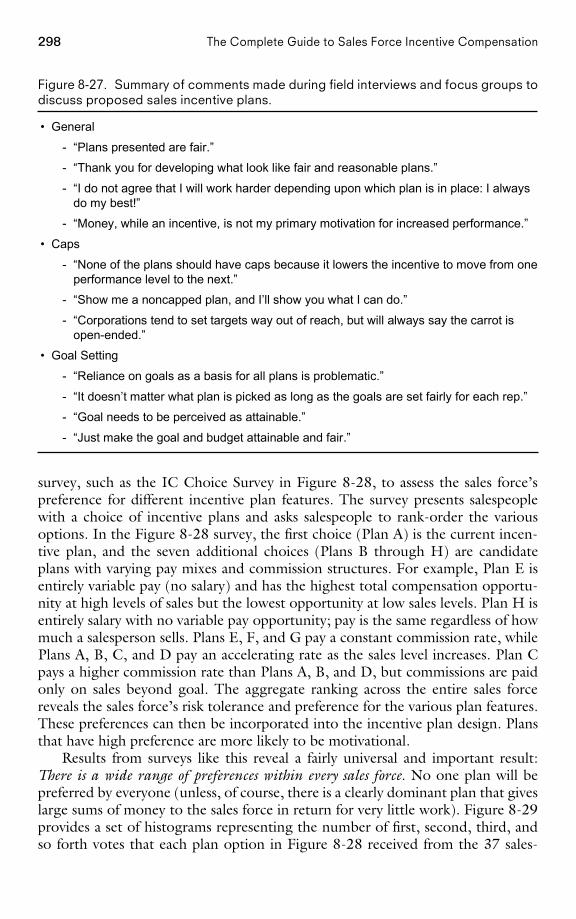
298 The Complete Guide to Sales Force Incentive Compensation
Figure 8-27. Summary of comments made during field interviews and focus groups todiscuss proposed sales incentive plans.
• General
- “Plans presented are fair.”
- “Thank you for developing what look like fair and reasonable plans.”
- “I do not agree that I will work harder depending upon which plan is in place: I alwaysdo my best!”
- “Money, while an incentive, is not my primary motivation for increased performance.”
• Caps
- “None of the plans should have caps because it lowers the incentive to move from oneperformance level to the next.”
- “Show me a noncapped plan, and I’ll show you what I can do.”
- “Corporations tend to set targets way out of reach, but will always say the carrot isopen-ended.”
• Goal Setting
- “Reliance on goals as a basis for all plans is problematic.”
- “It doesn’t matter what plan is picked as long as the goals are set fairly for each rep.”
- “Goal needs to be perceived as attainable.”
- “Just make the goal and budget attainable and fair.”
survey, such as the IC Choice Survey in Figure 8-28, to assess the sales force’spreference for different incentive plan features. The survey presents salespeoplewith a choice of incentive plans and asks salespeople to rank-order the variousoptions. In the Figure 8-28 survey, the first choice (Plan A) is the current incen-tive plan, and the seven additional choices (Plans B through H) are candidateplans with varying pay mixes and commission structures. For example, Plan E isentirely variable pay (no salary) and has the highest total compensation opportu-nity at high levels of sales but the lowest opportunity at low sales levels. Plan H isentirely salary with no variable pay opportunity; pay is the same regardless of howmuch a salesperson sells. Plans E, F, and G pay a constant commission rate, whilePlans A, B, C, and D pay an accelerating rate as the sales level increases. Plan Cpays a higher commission rate than Plans A, B, and D, but commissions are paidonly on sales beyond goal. The aggregate ranking across the entire sales forcereveals the sales force’s risk tolerance and preference for the various plan features.These preferences can then be incorporated into the incentive plan design. Plansthat have high preference are more likely to be motivational.
Results from surveys like this reveal a fairly universal and important result:There is a wide range of preferences within every sales force. No one plan will bepreferred by everyone (unless, of course, there is a clearly dominant plan that giveslarge sums of money to the sales force in return for very little work). Figure 8-29provides a set of histograms representing the number of first, second, third, andso forth votes that each plan option in Figure 8-28 received from the 37 sales-
PAGE 298................. 15869$ $CH8 05-19-06 09:24:16 PS
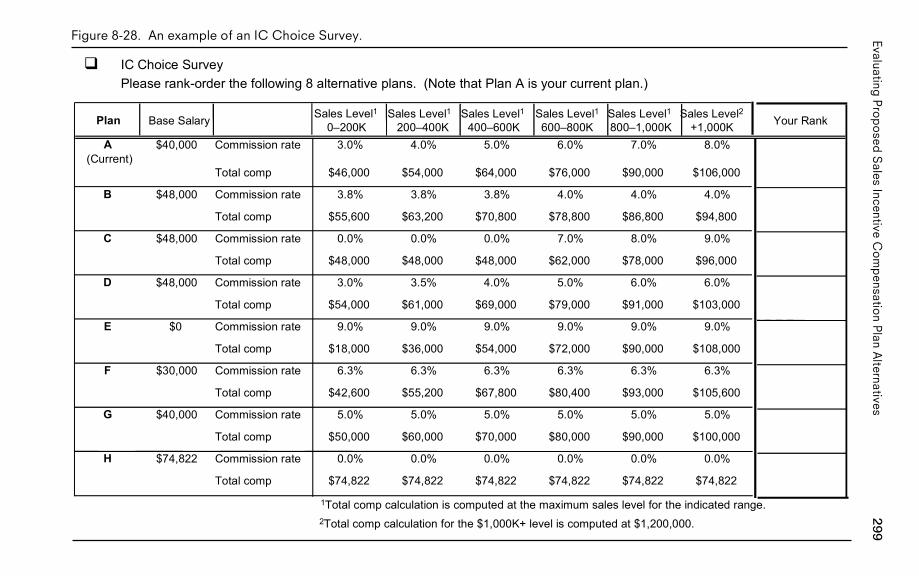
299Evaluating
Pro
po
sedS
alesIncentive
Co
mp
ensation
Plan
Alternatives
Figure 8-28. An example of an IC Choice Survey.
� IC Choice SurveyPlease rank-order the following 8 alternative plans. (Note that Plan A is your current plan.)
Plan Base Salary Sales Level10–200K
Sales Level1200–400K
Sales Level1400–600K
Sales Level1600–800K
Sales Level1800–1,000K
Sales Level2+1,000K Your Rank
A $40,000 Commission rate 3.0% 4.0% 5.0% 6.0% 7.0% 8.0%(Current)
Total comp $46,000 $54,000 $64,000 $76,000 $90,000 $106,000
B $48,000 Commission rate 3.8% 3.8% 3.8% 4.0% 4.0% 4.0%
Total comp $55,600 $63,200 $70,800 $78,800 $86,800 $94,800
C $48,000 Commission rate 0.0% 0.0% 0.0% 7.0% 8.0% 9.0%
Total comp $48,000 $48,000 $48,000 $62,000 $78,000 $96,000
D $48,000 Commission rate 3.0% 3.5% 4.0% 5.0% 6.0% 6.0%
Total comp $54,000 $61,000 $69,000 $79,000 $91,000 $103,000
E $0 Commission rate 9.0% 9.0% 9.0% 9.0% 9.0% 9.0%
Total comp $18,000 $36,000 $54,000 $72,000 $90,000 $108,000
F $30,000 Commission rate 6.3% 6.3% 6.3% 6.3% 6.3% 6.3%
Total comp $42,600 $55,200 $67,800 $80,400 $93,000 $105,600
G $40,000 Commission rate 5.0% 5.0% 5.0% 5.0% 5.0% 5.0%
Total comp $50,000 $60,000 $70,000 $80,000 $90,000 $100,000
H $74,822 Commission rate 0.0% 0.0% 0.0% 0.0% 0.0% 0.0%
Total comp $74,822 $74,822 $74,822 $74,822 $74,822 $74,822
1Total comp calculation is computed at the maximum sales level for the indicated range. 2Total comp calculation for the $1,000K+ level is computed at $1,200,000.
PA
GE
299.................15869$
$CH
805-19-06
09:24:16P
S
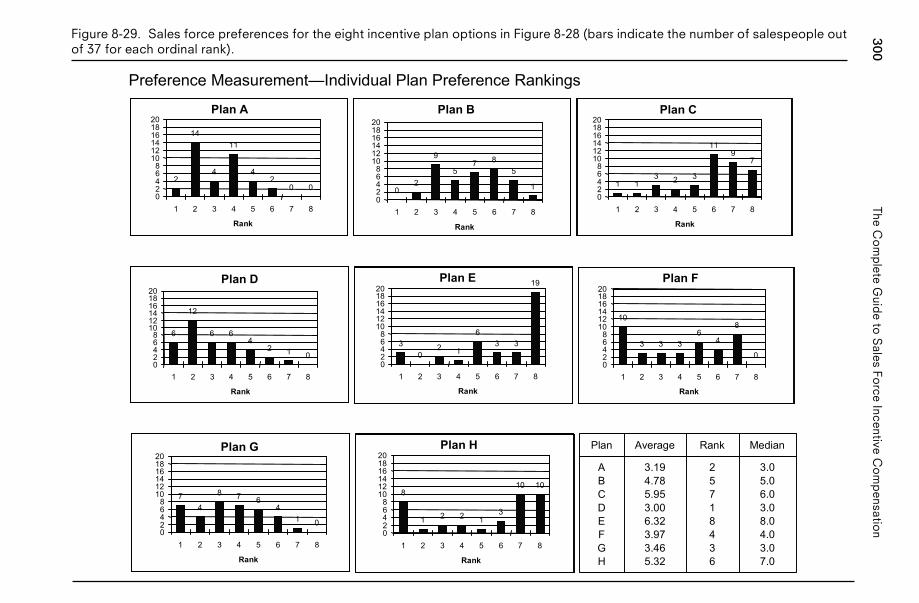
300The
Co
mp
leteG
uide
toS
alesFo
rceIncentive
Co
mp
ensation
Figure 8-29. Sales force preferences for the eight incentive plan options in Figure 8-28 (bars indicate the number of salespeople outof 37 for each ordinal rank).
Plan A
2
14
4
11
42
0 002468
101214161820
1 2 3 4 5 6 7 8
Rank
Plan B
02
9
57 8
5
102468
101214161820
1 2 3 4 5 6 7 8
Rank
Plan C
1 13 2 3
119
7
02468
101214161820
1 2 3 4 5 6 7 8
Rank
6
12
6 64
2 1 002468
101214161820
1 2 3 4 5 6 7 8
Rank
Plan D Plan E
30
2 1
63 3
19
02468
101214161820
1 2 3 4 5 6 7 8
Rank
Plan F
10
3 3 36
4
8
002468
101214161820
1 2 3 4 5 6 7 8
Rank
74
8 7 64
1 002468
101214161820
1 2 3 4 5 6 7 8
Rank
Plan G Plan H
8
1 2 2 13
10 10
02468
101214161820
1 2 3 4 5 6 7 8
Rank
3.05.06.03.08.04.03.07.0
25718436
3.194.785.953.006.323.973.465.32
ABCDEFGH
MedianRankAveragePlan
Preference Measurement—Individual Plan Preference Rankings
PA
GE
300.................15869$
$CH
805-19-06
09:24:18P
S
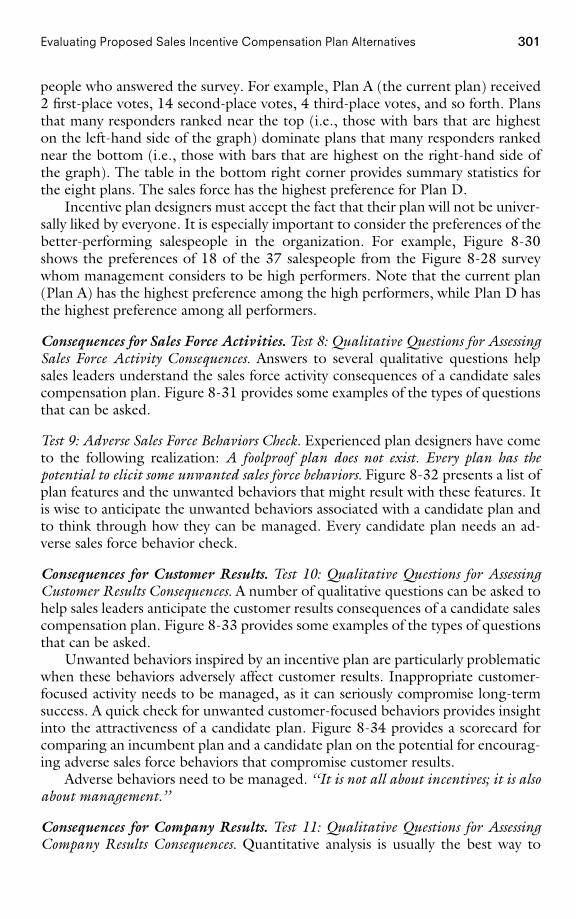
301Evaluating Proposed Sales Incentive Compensation Plan Alternatives
people who answered the survey. For example, Plan A (the current plan) received2 first-place votes, 14 second-place votes, 4 third-place votes, and so forth. Plansthat many responders ranked near the top (i.e., those with bars that are higheston the left-hand side of the graph) dominate plans that many responders rankednear the bottom (i.e., those with bars that are highest on the right-hand side ofthe graph). The table in the bottom right corner provides summary statistics forthe eight plans. The sales force has the highest preference for Plan D.
Incentive plan designers must accept the fact that their plan will not be univer-sally liked by everyone. It is especially important to consider the preferences of thebetter-performing salespeople in the organization. For example, Figure 8-30shows the preferences of 18 of the 37 salespeople from the Figure 8-28 surveywhom management considers to be high performers. Note that the current plan(Plan A) has the highest preference among the high performers, while Plan D hasthe highest preference among all performers.
Consequences for Sales Force Activities. Test 8: Qualitative Questions for AssessingSales Force Activity Consequences. Answers to several qualitative questions helpsales leaders understand the sales force activity consequences of a candidate salescompensation plan. Figure 8-31 provides some examples of the types of questionsthat can be asked.
Test 9: Adverse Sales Force Behaviors Check. Experienced plan designers have cometo the following realization: A foolproof plan does not exist. Every plan has thepotential to elicit some unwanted sales force behaviors. Figure 8-32 presents a list ofplan features and the unwanted behaviors that might result with these features. Itis wise to anticipate the unwanted behaviors associated with a candidate plan andto think through how they can be managed. Every candidate plan needs an ad-verse sales force behavior check.
Consequences for Customer Results. Test 10: Qualitative Questions for AssessingCustomer Results Consequences. A number of qualitative questions can be asked tohelp sales leaders anticipate the customer results consequences of a candidate salescompensation plan. Figure 8-33 provides some examples of the types of questionsthat can be asked.
Unwanted behaviors inspired by an incentive plan are particularly problematicwhen these behaviors adversely affect customer results. Inappropriate customer-focused activity needs to be managed, as it can seriously compromise long-termsuccess. A quick check for unwanted customer-focused behaviors provides insightinto the attractiveness of a candidate plan. Figure 8-34 provides a scorecard forcomparing an incumbent plan and a candidate plan on the potential for encourag-ing adverse sales force behaviors that compromise customer results.
Adverse behaviors need to be managed. ‘‘It is not all about incentives; it is alsoabout management.’’
Consequences for Company Results. Test 11: Qualitative Questions for AssessingCompany Results Consequences. Quantitative analysis is usually the best way to
PAGE 301................. 15869$ $CH8 05-19-06 09:24:18 PS
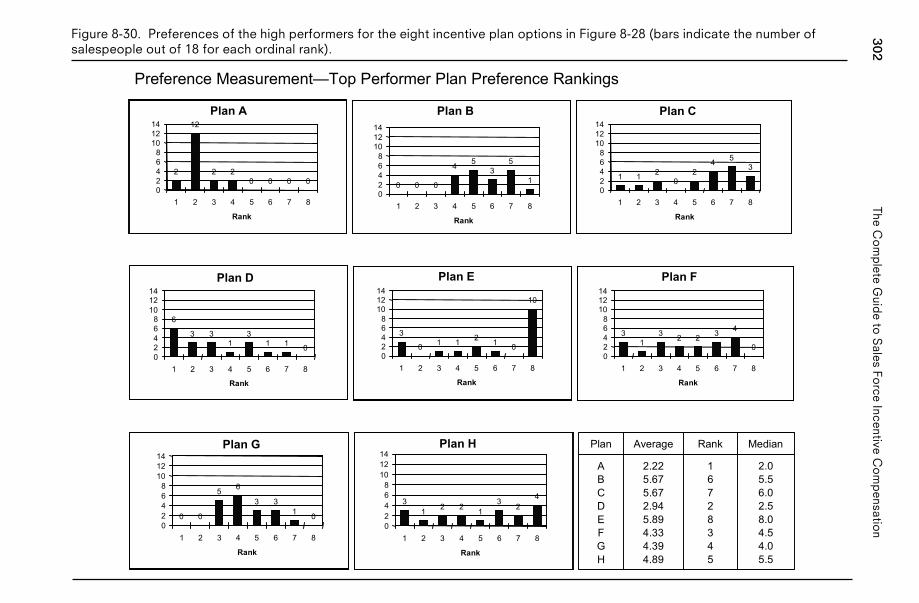
302The
Co
mp
leteG
uide
toS
alesFo
rceIncentive
Co
mp
ensation
Figure 8-30. Preferences of the high performers for the eight incentive plan options in Figure 8-28 (bars indicate the number ofsalespeople out of 18 for each ordinal rank).
Plan A
2
12
2 20 0 0 0
02468
101214
1 2 3 4 5 6 7 8
Rank
Plan B
0 0 0
4 53
5
1
02468
101214
1 2 3 4 5 6 7 8
Rank
Plan C
1 1 20
24 5
3
02468
101214
1 2 3 4 5 6 7 8
Rank
6
3 31
31 1 0
02468
101214
1 2 3 4 5 6 7 8
Rank
Plan D Plan E
3
0 1 1 2 1 0
10
02468
101214
1 2 3 4 5 6 7 8
Rank
Plan F
31
3 2 2 3 4
002468
101214
1 2 3 4 5 6 7 8
Rank
0 0
5 6
3 31 0
02468
101214
1 2 3 4 5 6 7 8
Rank
Plan G
Preference Measurement—Top Performer Plan Preference Rankings
Plan H
31 2 2 1
3 24
02468
101214
1 2 3 4 5 6 7 8
Rank
2.05.56.02.58.04.54.05.5
16728345
2.225.675.672.945.894.334.394.89
ABCDEFGH
MedianRankAveragePlan
PA
GE
302.................15869$
$CH
805-19-06
09:24:20P
S
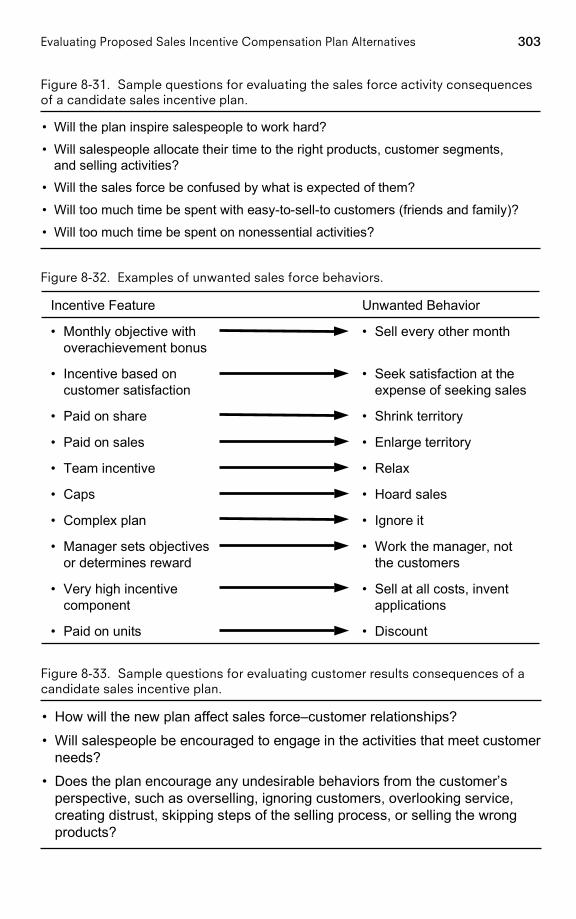
303Evaluating Proposed Sales Incentive Compensation Plan Alternatives
Figure 8-31. Sample questions for evaluating the sales force activity consequencesof a candidate sales incentive plan.
• Will the plan inspire salespeople to work hard?
• Will salespeople allocate their time to the right products, customer segments,and selling activities?
• Will the sales force be confused by what is expected of them?
• Will too much time be spent with easy-to-sell-to customers (friends and family)?
• Will too much time be spent on nonessential activities?
Figure 8-32. Examples of unwanted sales force behaviors.
• Discount• Paid on units
• Sell at all costs, inventapplications
• Very high incentivecomponent
• Work the manager, notthe customers
• Manager sets objectivesor determines reward
• Ignore it• Complex plan
• Hoard sales• Caps
• Relax• Team incentive
• Enlarge territory• Paid on sales
• Shrink territory• Paid on share
• Seek satisfaction at theexpense of seeking sales
• Incentive based oncustomer satisfaction
• Sell every other month• Monthly objective withoverachievement bonus
Unwanted BehaviorIncentive Feature
Figure 8-33. Sample questions for evaluating customer results consequences of acandidate sales incentive plan.
• How will the new plan affect sales force–customer relationships?
• Will salespeople be encouraged to engage in the activities that meet customerneeds?
• Does the plan encourage any undesirable behaviors from the customer’sperspective, such as overselling, ignoring customers, overlooking service,creating distrust, skipping steps of the selling process, or selling the wrongproducts?
PAGE 303................. 15869$ $CH8 05-19-06 09:24:22 PS
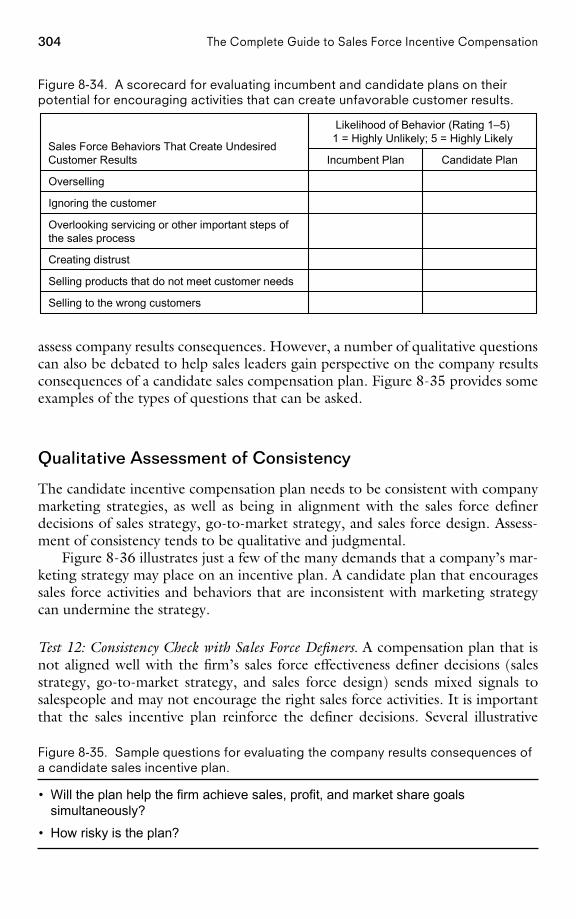
304 The Complete Guide to Sales Force Incentive Compensation
Figure 8-34. A scorecard for evaluating incumbent and candidate plans on theirpotential for encouraging activities that can create unfavorable customer results.
Selling to the wrong customers
Selling products that do not meet customer needs
Creating distrust
Overlooking servicing or other important steps ofthe sales process
Ignoring the customer
Overselling
Candidate PlanIncumbent Plan
Likelihood of Behavior (Rating 1–5)1 = Highly Unlikely; 5 = Highly Likely
Sales Force Behaviors That Create UndesiredCustomer Results
assess company results consequences. However, a number of qualitative questionscan also be debated to help sales leaders gain perspective on the company resultsconsequences of a candidate sales compensation plan. Figure 8-35 provides someexamples of the types of questions that can be asked.
Qualitative Assessment of Consistency
The candidate incentive compensation plan needs to be consistent with companymarketing strategies, as well as being in alignment with the sales force definerdecisions of sales strategy, go-to-market strategy, and sales force design. Assess-ment of consistency tends to be qualitative and judgmental.
Figure 8-36 illustrates just a few of the many demands that a company’s mar-keting strategy may place on an incentive plan. A candidate plan that encouragessales force activities and behaviors that are inconsistent with marketing strategycan undermine the strategy.
Test 12: Consistency Check with Sales Force Definers. A compensation plan that isnot aligned well with the firm’s sales force effectiveness definer decisions (salesstrategy, go-to-market strategy, and sales force design) sends mixed signals tosalespeople and may not encourage the right sales force activities. It is importantthat the sales incentive plan reinforce the definer decisions. Several illustrative
Figure 8-35. Sample questions for evaluating the company results consequences ofa candidate sales incentive plan.
• Will the plan help the firm achieve sales, profit, and market share goalssimultaneously?
• How risky is the plan?
PAGE 304................. 15869$ $CH8 05-19-06 09:24:24 PS
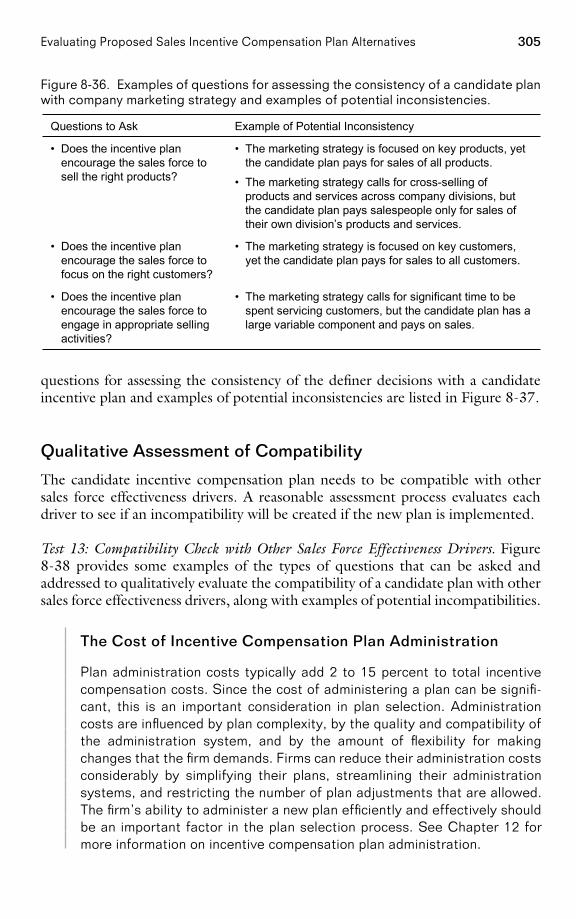
305Evaluating Proposed Sales Incentive Compensation Plan Alternatives
Figure 8-36. Examples of questions for assessing the consistency of a candidate planwith company marketing strategy and examples of potential inconsistencies.
• The marketing strategy calls for significant time to bespent servicing customers, but the candidate plan has alarge variable component and pays on sales.
• Does the incentive planencourage the sales force toengage in appropriate sellingactivities?
• The marketing strategy is focused on key customers,yet the candidate plan pays for sales to all customers.
• Does the incentive planencourage the sales force tofocus on the right customers?
• The marketing strategy is focused on key products, yetthe candidate plan pays for sales of all products.
• The marketing strategy calls for cross-selling ofproducts and services across company divisions, butthe candidate plan pays salespeople only for sales oftheir own division’s products and services.
• Does the incentive planencourage the sales force tosell the right products?
Example of Potential InconsistencyQuestions to Ask
questions for assessing the consistency of the definer decisions with a candidateincentive plan and examples of potential inconsistencies are listed in Figure 8-37.
Qualitative Assessment of Compatibility
The candidate incentive compensation plan needs to be compatible with othersales force effectiveness drivers. A reasonable assessment process evaluates eachdriver to see if an incompatibility will be created if the new plan is implemented.
Test 13: Compatibility Check with Other Sales Force Effectiveness Drivers. Figure8-38 provides some examples of the types of questions that can be asked andaddressed to qualitatively evaluate the compatibility of a candidate plan with othersales force effectiveness drivers, along with examples of potential incompatibilities.
The Cost of Incentive Compensation Plan Administration
Plan administration costs typically add 2 to 15 percent to total incentivecompensation costs. Since the cost of administering a plan can be signifi-cant, this is an important consideration in plan selection. Administrationcosts are influenced by plan complexity, by the quality and compatibility ofthe administration system, and by the amount of flexibility for makingchanges that the firm demands. Firms can reduce their administration costsconsiderably by simplifying their plans, streamlining their administrationsystems, and restricting the number of plan adjustments that are allowed.The firm’s ability to administer a new plan efficiently and effectively shouldbe an important factor in the plan selection process. See Chapter 12 formore information on incentive compensation plan administration.
PAGE 305................. 15869$ $CH8 05-19-06 09:24:26 PS
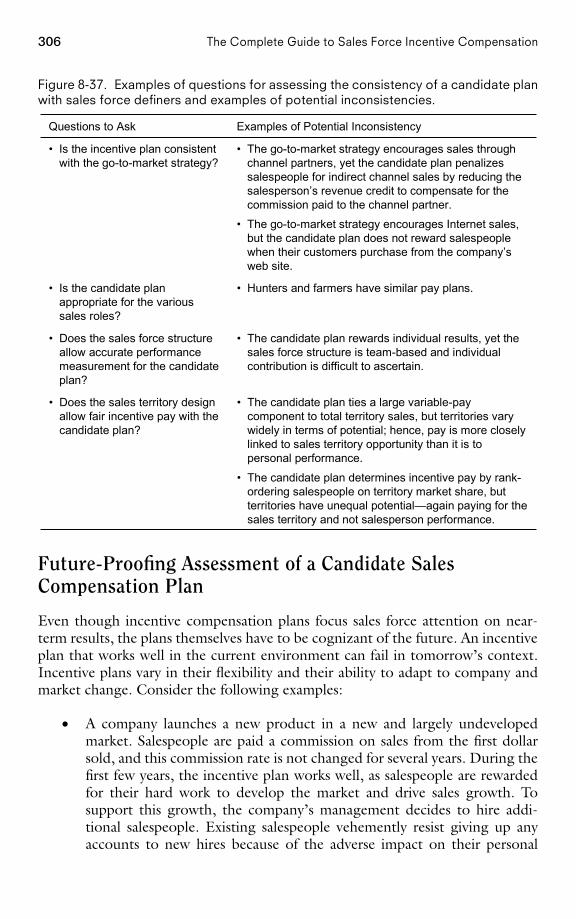
306 The Complete Guide to Sales Force Incentive Compensation
Figure 8-37. Examples of questions for assessing the consistency of a candidate planwith sales force definers and examples of potential inconsistencies.
• The candidate plan ties a large variable-paycomponent to total territory sales, but territories varywidely in terms of potential; hence, pay is more closelylinked to sales territory opportunity than it is topersonal performance.
• The candidate plan determines incentive pay by rank-ordering salespeople on territory market share, butterritories have unequal potential—again paying for thesales territory and not salesperson performance.
• Does the sales territory designallow fair incentive pay with thecandidate plan?
• The candidate plan rewards individual results, yet thesales force structure is team-based and individualcontribution is difficult to ascertain.
• Does the sales force structureallow accurate performancemeasurement for the candidateplan?
• Hunters and farmers have similar pay plans.• Is the candidate planappropriate for the varioussales roles?
• The go-to-market strategy encourages sales throughchannel partners, yet the candidate plan penalizessalespeople for indirect channel sales by reducing thesalesperson’s revenue credit to compensate for thecommission paid to the channel partner.
• The go-to-market strategy encourages Internet sales,but the candidate plan does not reward salespeoplewhen their customers purchase from the company’sweb site.
• Is the incentive plan consistentwith the go-to-market strategy?
Examples of Potential InconsistencyQuestions to Ask
Future-Proofing Assessment of a Candidate SalesCompensation Plan
Even though incentive compensation plans focus sales force attention on near-term results, the plans themselves have to be cognizant of the future. An incentiveplan that works well in the current environment can fail in tomorrow’s context.Incentive plans vary in their flexibility and their ability to adapt to company andmarket change. Consider the following examples:
• A company launches a new product in a new and largely undevelopedmarket. Salespeople are paid a commission on sales from the first dollarsold, and this commission rate is not changed for several years. During thefirst few years, the incentive plan works well, as salespeople are rewardedfor their hard work to develop the market and drive sales growth. Tosupport this growth, the company’s management decides to hire addi-tional salespeople. Existing salespeople vehemently resist giving up anyaccounts to new hires because of the adverse impact on their personal
PAGE 306................. 15869$ $CH8 05-19-06 09:24:27 PS
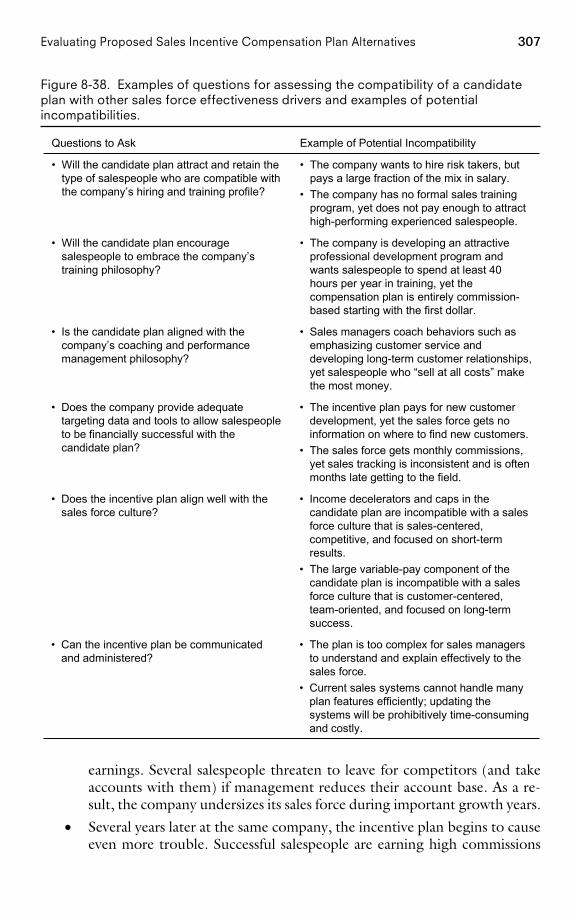
307Evaluating Proposed Sales Incentive Compensation Plan Alternatives
Figure 8-38. Examples of questions for assessing the compatibility of a candidateplan with other sales force effectiveness drivers and examples of potentialincompatibilities.
• The plan is too complex for sales managersto understand and explain effectively to thesales force.
• Current sales systems cannot handle manyplan features efficiently; updating thesystems will be prohibitively time-consumingand costly.
• Can the incentive plan be communicatedand administered?
• Income decelerators and caps in thecandidate plan are incompatible with a salesforce culture that is sales-centered,competitive, and focused on short-termresults.
• The large variable-pay component of thecandidate plan is incompatible with a salesforce culture that is customer-centered,team-oriented, and focused on long-termsuccess.
• Does the incentive plan align well with thesales force culture?
• The incentive plan pays for new customerdevelopment, yet the sales force gets noinformation on where to find new customers.
• The sales force gets monthly commissions,yet sales tracking is inconsistent and is oftenmonths late getting to the field.
• Does the company provide adequatetargeting data and tools to allow salespeopleto be financially successful with thecandidate plan?
• Sales managers coach behaviors such asemphasizing customer service anddeveloping long-term customer relationships,yet salespeople who “sell at all costs” makethe most money.
• Is the candidate plan aligned with thecompany’s coaching and performancemanagement philosophy?
• The company is developing an attractiveprofessional development program andwants salespeople to spend at least 40hours per year in training, yet thecompensation plan is entirely commission-based starting with the first dollar.
• Will the candidate plan encouragesalespeople to embrace the company’straining philosophy?
• The company wants to hire risk takers, butpays a large fraction of the mix in salary.
• The company has no formal sales trainingprogram, yet does not pay enough to attracthigh-performing experienced salespeople.
• Will the candidate plan attract and retain thetype of salespeople who are compatible withthe company’s hiring and training profile?
Example of Potential IncompatibilityQuestions to Ask
earnings. Several salespeople threaten to leave for competitors (and takeaccounts with them) if management reduces their account base. As a re-sult, the company undersizes its sales force during important growth years.
• Several years later at the same company, the incentive plan begins to causeeven more trouble. Successful salespeople are earning high commissions
PAGE 307................. 15869$ $CH8 05-19-06 09:24:28 PS
308 The Complete Guide to Sales Force Incentive Compensation
on repeat sales to existing accounts that require only minimal sales effort.The sales force has become complacent, and pay has escalated beyond thevalue that many salespeople bring to the job. Variation in pay across thesales force is linked less to the quality of the salespeople and their workthan to the book of business they have built or inherited. Since the salesforce controls many important customer relationships, the company isheld hostage by the sales force’s power. Sales leadership is concerned thatif it reduces sales force earning potential by lowering commission rates,salespeople will leave for competitors.
• Another company pays its salespeople a commission on sales growth.When sales were growing rapidly, the plan successfully focused salespeopleon the desired result of growing the business. But as sales have flattenedout, and more and more sales force energy is spent on protecting existingaccounts, salespeople are no longer earning enough incentive money, andthe growth-focused plan has become a demotivator.
• At still another company, salespeople have traditionally worked largelyalone. Over time, however, as the portfolio of products and customers hasincreased, the company has evolved to a team-based structure in whichaccount managers and product specialists work together to meet customerneeds. The sales process now requires teamwork, yet the pay plan stillrewards individualistic behaviors.
Unfortunately, at all of these companies, the incentive compensation plan wasnot ‘‘future-proofed.’’ Plans that have limited ability to change as markets andcompany strategies evolve create considerable risk for companies. For example,plans that pay a fixed commission on all sales often severely limit future manage-ment flexibility. If commission rates are fixed for a few years, salespeople begin tofeel that they are entitled to those rates. Generally, incentive plans that link payoutto goal achievement (rather than paying for all sales) have much greater flexibility,as territory goals can be adjusted appropriately as circumstances change.
An important part of any compensation plan review is anticipating likely mar-ket and company strategy changes and ensuring that the incentive plan either cancontinue to thrive or can be changed appropriately as needed. While some degreeof stability in the incentive plan is usually desired, periodic plan changes in dy-namic environments create an expectation of change among salespeople and allowfuture plan changes to be accepted more readily by the sales force.
Test 14: Compatibility Check with Future Company Needs. To test whether a planis compatible with the future, sales leaders and incentive compensation plan de-signers should ask questions such as the ones in Figure 8-39.
Conclusion: From Objectives to RealityThe various tests described in this chapter help sales leaders select an incentivecompensation plan that encourages sales force success. At this point, it is useful to
PAGE 308................. 15869$ $CH8 05-19-06 09:24:29 PS
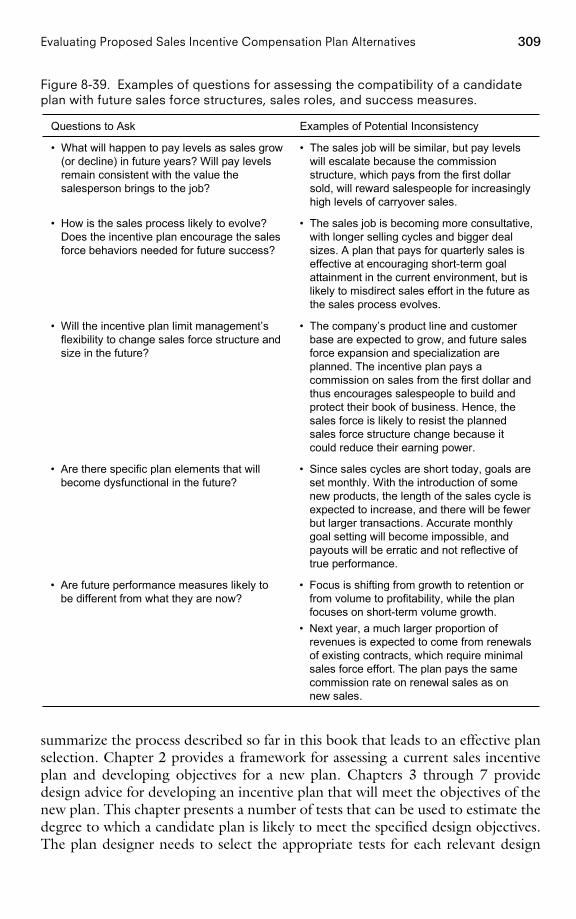
309Evaluating Proposed Sales Incentive Compensation Plan Alternatives
Figure 8-39. Examples of questions for assessing the compatibility of a candidateplan with future sales force structures, sales roles, and success measures.
• Focus is shifting from growth to retention orfrom volume to profitability, while the planfocuses on short-term volume growth.
• Next year, a much larger proportion ofrevenues is expected to come from renewalsof existing contracts, which require minimalsales force effort. The plan pays the samecommission rate on renewal sales as onnew sales.
• Are future performance measures likely tobe different from what they are now?
• Since sales cycles are short today, goals areset monthly. With the introduction of somenew products, the length of the sales cycle isexpected to increase, and there will be fewerbut larger transactions. Accurate monthlygoal setting will become impossible, andpayouts will be erratic and not reflective oftrue performance.
• Are there specific plan elements that willbecome dysfunctional in the future?
• The company’s product line and customerbase are expected to grow, and future salesforce expansion and specialization areplanned. The incentive plan pays acommission on sales from the first dollar andthus encourages salespeople to build andprotect their book of business. Hence, thesales force is likely to resist the plannedsales force structure change because itcould reduce their earning power.
• Will the incentive plan limit management’sflexibility to change sales force structure andsize in the future?
• The sales job is becoming more consultative,with longer selling cycles and bigger dealsizes. A plan that pays for quarterly sales iseffective at encouraging short-term goalattainment in the current environment, but islikely to misdirect sales effort in the future asthe sales process evolves.
• How is the sales process likely to evolve?Does the incentive plan encourage the salesforce behaviors needed for future success?
• The sales job will be similar, but pay levelswill escalate because the commissionstructure, which pays from the first dollarsold, will reward salespeople for increasinglyhigh levels of carryover sales.
• What will happen to pay levels as sales grow(or decline) in future years? Will pay levelsremain consistent with the value thesalesperson brings to the job?
Examples of Potential InconsistencyQuestions to Ask
summarize the process described so far in this book that leads to an effective planselection. Chapter 2 provides a framework for assessing a current sales incentiveplan and developing objectives for a new plan. Chapters 3 through 7 providedesign advice for developing an incentive plan that will meet the objectives of thenew plan. This chapter presents a number of tests that can be used to estimate thedegree to which a candidate plan is likely to meet the specified design objectives.The plan designer needs to select the appropriate tests for each relevant design
PAGE 309................. 15869$ $CH8 05-19-06 09:24:30 PS
310 The Complete Guide to Sales Force Incentive Compensation
objective. Both the design objectives and the plan tests are organized in terms ofthe 3 Cs framework. A candidate plan is ready for implementation once it hasbeen tested and the test results indicate that the plan is consistent with companystrategies, is compatible with sales effectiveness drivers, and has appropriate conse-quences for salespeople, sales force activities, customer results, and company re-sults.
The remaining chapters of this book focus on designing some of the supple-mental details of a sales incentive plan (including goal setting, SPIFFs, salescontests, and recognition programs) and effective compensation plan implemen-tation. In many situations, implementing a new sales incentive compensation plansuccessfully is even more challenging than designing and selecting the plan.
PAGE 310................. 15869$ $CH8 05-19-06 09:24:31 PS
C H A P T E R 9
Setting Effective Goals andObjectives
How This Chapter Is Organized
Introduction 313Are Your Sales Force Goals Appropriate? 314
Are There Errors in Aggregate Forecasting? 314Are Company and Territory Goals Too High? 314Are Company and Territory Goals Too Low? 318What Percent of the Sales Force Should Make Goal? 320
Are Goals Allocated Appropriately Across Salespeople? 321Financial Cost of Goal-Allocation Errors 321Who Is Reaching Goal and Who Is Not? 323
Types of Goals 327Goals That Are Primarily Controlled by Performance Management:Salesperson and Activities Goals 328Goals That Are Primarily Controlled by Incentives: Customer andCompany Results Goals 330
How to Set Effective Sales Force Goals: A Five-Step Process 330Step 1: Understand Product and Market Expectations and SetNational Goals 331Step 2: Understand Territory Expectations and Behavior 334
Product Sales in Any Given Year Are Highly Correlated withProduct Sales for the Prior Year. 335
PAGE 311
311
................. 15869$ $CH9 05-19-06 09:24:05 PS
312 The Complete Guide to Sales Force Incentive Compensation
Product Sales in Any Given Year Are Positively Correlated withMarket Sales in the Prior Year. 336Product Sales in Any Given Year Are Positively Correlated withSurrogates for Market Potential. 336Product Sales in Any Given Year Are Positively Correlated witha Competitor’s Sales in the Prior Year. 337The Market Share Change Expected for Any Given Year IsRelated to the Starting Market Share in That Year. 337Measuring Territory Market Potential 338
Step 3: Develop Alternative Territory Goal-Setting Formulas orProcesses 343
Formula-Based Territory Goal-Setting Approaches Based onHistorical Sales 344
Maintenance Plus Standard Growth Method 344Territory Forecast Method 346
Formula-Based Territory Goal-Setting Methods Based onHistorical Sales and Market Potential 348
Maintenance Plus Adjusted Growth Method 348Weighted Index Method 351Regression Method 352Performance Frontier Method 353Share Growth Method 355Percent of Remaining Share Method 356
Formula-Based Territory Goal-Setting Method Based onHistorical Sales, Market Potential, and Sales Effort 357
Sales Response Method 357Sales Force Input–Based Territory Goal-Setting Method 359
Bottom-Up Method 359Goal-Setting Approaches for New Products 361
Market Potential Method 362Constant Allocation Method 362
Summary of Methods 362Step 4: Evaluate the Consequences of Each Alternative and Select theBest Approach 363Step 5: Review and Finalize Goals with Field Sales Managers 365
Tracking Performance Against Goals 369Systems for Providing Feedback on Goal Attainment 369Handling Midyear Goal Corrections 370
PAGE 312................. 15869$ $CH9 05-19-06 09:24:05 PS
313Setting Effective Goals and Objectives
Goal-Setting Recommendations 372In Volatile Business Environments, Goals with Short Time Frames,Broad Payout Ranges, and Earnings Caps Are Appropriate 372Stretch Goals Can Be Effective, Provided They Are Attainable 373Rank Ordering of Salespeople Is an Alternative to Goal Setting, butShould Be Used with Caution 374The Number of Goals Should Be Limited to Three 375
Concluding Insights 375Poor Goal Setting Leads to Increased Costs and Lower Sales 375The Most Suitable Goals Depend on Business Objectives and theBusiness Environment 375The Process of Setting Goals Can Be as Beneficial as the GoalsThemselves 376
Introduction
A vacationer traveling in Vermont to see the fall colors was surprised to see dozensof targets painted on one of the traditional red barns. He stopped the car and gotout to take a closer look. The vacationer was astonished to see a bullet hole in thecenter of each target. When the farmer came out of his barn holding his rifle, thevacationer asked, ‘‘I’ve never seen shooting this good! How did you do it?’’ Thefarmer replied, ‘‘I shot first.’’
Unfortunately, we have to draw the target first when setting goals, objectives,or quotas for salespeople. Goal setting, like much of sales management, is partscience and part art. Setting territory-level goals that are fair, realistic, and motiva-tional is a significant sales management challenge. Salespeople want easy goalsthat allow them to earn a good income. Shareholders want aggressive goals thathelp the firm achieve and exceed its financial objectives. Customers want goalsthat encourage the firm to meet their needs. Finding the right balance betweenthese competing objectives when setting goals can be difficult, yet having theright goals is extremely important to sales success.
Motivational research shows that people who are given specific, challenginggoals consistently outperform those who are not given any goals or who are givenvague goals such as ‘‘do your best.’’ As a result, organizations and individuals thatare goal-focused are typically more successful in the long run than those that donot set goals. Most sales incentive plans are goal-based. When we surveyed themanagers of 110 sales forces of varying sizes and in various industries who at-tended our sales compensation executive education programs at NorthwesternUniversity between 2000 and 2004 (the Sales Incentive Executive Education Sur-vey), 82 percent reported that goals are used as part of their incentive compensa-tion plans.
Effective goals can energize salespeople and organizations. Goals that are suf-
PAGE 313................. 15869$ $CH9 05-19-06 09:24:05 PS
314 The Complete Guide to Sales Force Incentive Compensation
ficiently challenging, yet attainable, drive sales force behavior and increase salesforce motivation. Goals also communicate what is important and suggest an allo-cation of effort that reflects management’s priorities and the desired level of cus-tomer focus. In addition, goals help management evaluate sales performance.They provide a benchmark against which sales force activity and results can bemeasured and controlled. Goals provide a convenient way for management torecognize personal and territory differences when evaluating salespeople. Eachsalesperson can be given a different goal, taking into account such factors as thesalesperson’s skills and experience along with territory characteristics such asgrowth potential and competitive intensity.
Are Your Sales Force Goals Appropriate?Goal setting is a problem area that is often overlooked by sales organizations. Thecompensation plan structure is frequently blamed for goal-setting inadequacies,and companies often abandon good compensation plans simply because they arenot supported by sound goal-setting practices. Poor goal setting can seriouslyundermine the success of a sales force. The diagnosis of goal-setting problemsbegins by examining the three views within the sales management system frame-work:
• The downstream consequences of sales force goals for salespeople, salesforce activities, and customer and company results
• The upstream consistency of sales force goals with marketing and go-to-market strategies, sales processes, and sales force roles
• The compatibility of sales force goals with other sales force effectivenessdrivers, such as salespeople’s skills and capabilities, sales force culture, per-formance management systems, and nonmonetary sales force motivators
Figure 9-1 provides a template for diagnosing whether appropriate sales forcegoals are being used in the sales incentive plan and illustrates some possible signsof trouble.
Goals that are too difficult, too easy, or not assigned fairly across the salesforce have an adverse impact on sales force motivation and morale, costs, andexpectations. Most companies risk two major goal-setting errors: (1) The com-pany forecast is either too high or too low, resulting in territory goals that areeither uniformly too high or uniformly too low, and (2) the company goal is notallocated appropriately across the sales force.
Are There Errors in Aggregate Forecasting?Are Company and Territory Goals Too High?
Goals That Are Too High Discourage a Beverage Sales Force
A beverage bottler in Mexico paid its sales force a base salary plus com-missions on all sales over last year’s sales. With the economy weakening
PAGE 314
................. 15869$ $CH9 05-19-06 09:24:06 PS
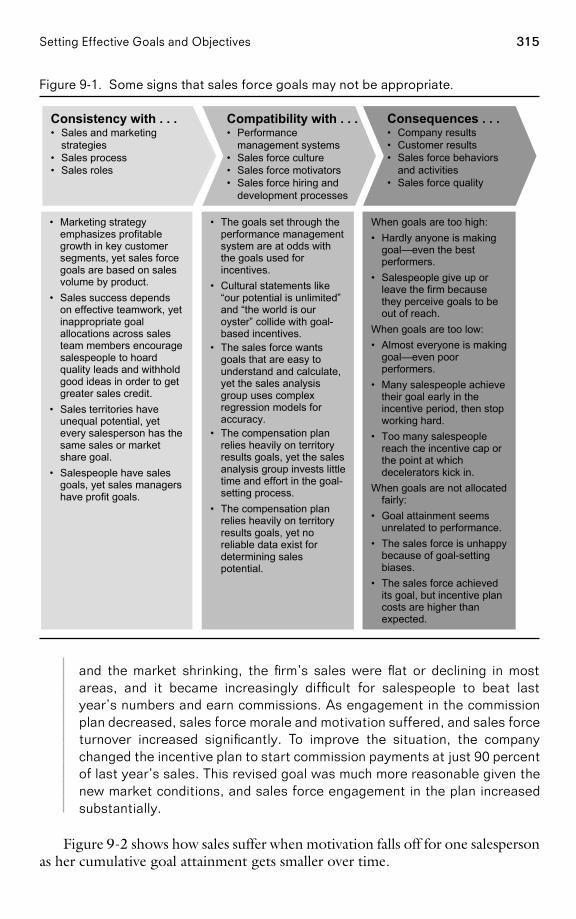
315Setting Effective Goals and Objectives
Figure 9-1. Some signs that sales force goals may not be appropriate.
• The goals set through theperformance managementsystem are at odds withthe goals used forincentives.
• Cultural statements like“our potential is unlimited”and “the world is ouroyster” collide with goal-based incentives.
• The sales force wantsgoals that are easy tounderstand and calculate,yet the sales analysisgroup uses complexregression models foraccuracy.
• The compensation planrelies heavily on territoryresults goals, yet the salesanalysis group invests littletime and effort in the goal-setting process.
• The compensation planrelies heavily on territoryresults goals, yet noreliable data exist fordetermining salespotential.
When goals are too high:• Hardly anyone is making
goal—even the bestperformers.
• Salespeople give up orleave the firm becausethey perceive goals to beout of reach.
When goals are too low:• Almost everyone is making
goal—even poorperformers.
• Many salespeople achievetheir goal early in theincentive period, then stopworking hard.
• Too many salespeoplereach the incentive cap orthe point at whichdecelerators kick in.
When goals are not allocatedfairly:
• Goal attainment seemsunrelated to performance.
• The sales force is unhappybecause of goal-settingbiases.
• The sales force achievedits goal, but incentive plancosts are higher thanexpected.
• Marketing strategyemphasizes profitablegrowth in key customersegments, yet sales forcegoals are based on salesvolume by product.
• Sales success dependson effective teamwork, yetinappropriate goalallocations across salesteam members encouragesalespeople to hoardquality leads and withholdgood ideas in order to getgreater sales credit.
• Sales territories haveunequal potential, yetevery salesperson has thesame sales or marketshare goal.
• Salespeople have salesgoals, yet sales managershave profit goals.
Compatibility with . . .• Performance
management systems• Sales force culture• Sales force motivators• Sales force hiring and
development processes
Consequences . . .• Company results• Customer results• Sales force behaviors
and activities• Sales force quality
Consistency with . . .• Sales and marketing
strategies• Sales process• Sales roles
and the market shrinking, the firm’s sales were flat or declining in mostareas, and it became increasingly difficult for salespeople to beat lastyear’s numbers and earn commissions. As engagement in the commissionplan decreased, sales force morale and motivation suffered, and sales forceturnover increased significantly. To improve the situation, the companychanged the incentive plan to start commission payments at just 90 percentof last year’s sales. This revised goal was much more reasonable given thenew market conditions, and sales force engagement in the plan increasedsubstantially.
Figure 9-2 shows how sales suffer when motivation falls off for one salespersonas her cumulative goal attainment gets smaller over time.
PAGE 315
................. 15869$ $CH9 05-19-06 09:24:07 PS
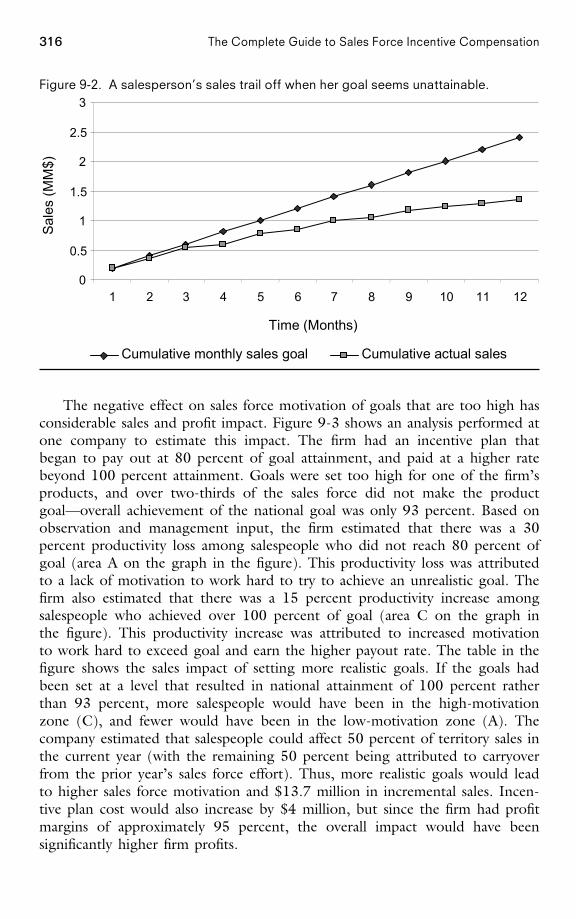
316 The Complete Guide to Sales Force Incentive Compensation
Figure 9-2. A salesperson’s sales trail off when her goal seems unattainable.
0
0.5
1
1.5
2
2.5
3
1 2 3 4 5 6 7 8 9 10 11 12
Time (Months)
Sale
s (M
M$)
Cumulative monthly sales goal Cumulative actual sales
The negative effect on sales force motivation of goals that are too high hasconsiderable sales and profit impact. Figure 9-3 shows an analysis performed atone company to estimate this impact. The firm had an incentive plan thatbegan to pay out at 80 percent of goal attainment, and paid at a higher ratebeyond 100 percent attainment. Goals were set too high for one of the firm’sproducts, and over two-thirds of the sales force did not make the productgoal—overall achievement of the national goal was only 93 percent. Based onobservation and management input, the firm estimated that there was a 30percent productivity loss among salespeople who did not reach 80 percent ofgoal (area A on the graph in the figure). This productivity loss was attributedto a lack of motivation to work hard to try to achieve an unrealistic goal. Thefirm also estimated that there was a 15 percent productivity increase amongsalespeople who achieved over 100 percent of goal (area C on the graph inthe figure). This productivity increase was attributed to increased motivationto work hard to exceed goal and earn the higher payout rate. The table in thefigure shows the sales impact of setting more realistic goals. If the goals hadbeen set at a level that resulted in national attainment of 100 percent ratherthan 93 percent, more salespeople would have been in the high-motivationzone (C), and fewer would have been in the low-motivation zone (A). Thecompany estimated that salespeople could affect 50 percent of territory sales inthe current year (with the remaining 50 percent being attributed to carryoverfrom the prior year’s sales force effort). Thus, more realistic goals would leadto higher sales force motivation and $13.7 million in incremental sales. Incen-tive plan cost would also increase by $4 million, but since the firm had profitmargins of approximately 95 percent, the overall impact would have beensignificantly higher firm profits.
PAGE 316................. 15869$ $CH9 05-19-06 09:24:08 PS
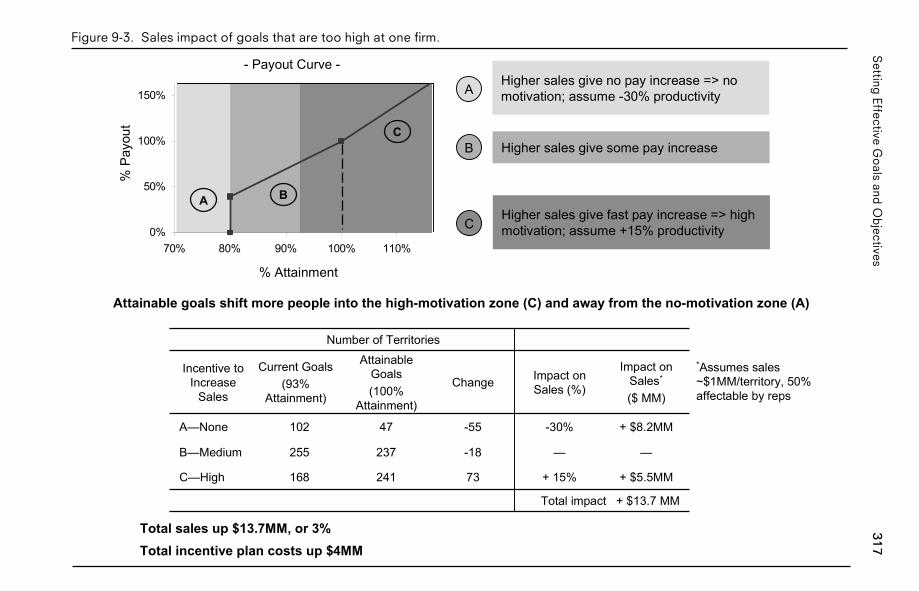
317S
ettingEffective
Go
alsand
Ob
jectivesFigure 9-3. Sales impact of goals that are too high at one firm.
- Payout Curve -
A B
C
AHigher sales give no pay increase => nomotivation; assume -30% productivity
B Higher sales give some pay increase
CHigher sales give fast pay increase => highmotivation; assume +15% productivity
Attainable goals shift more people into the high-motivation zone (C) and away from the no-motivation zone (A)
% Attainment
% P
ayou
t
0%
50%
100%
150%
70% 80% 90% 100% 110%
Total impact + $13.7 MM
+ $5.5MM+ 15%73241168C—High
——-18237255B—Medium
+ $8.2MM-30%-5547102A—None
Impact onSales*
($ MM)
Impact onSales (%)Change
AttainableGoals(100%
Attainment)
Current Goals(93%
Attainment)
Incentive toIncrease
Sales
Total sales up $13.7MM, or 3%Total incentive plan costs up $4MM
*Assumes sales~$1MM/territory, 50%affectable by reps
Number of Territories
PA
GE
317.................15869$
$CH
905-19-06
09:24:09P
S
318 The Complete Guide to Sales Force Incentive Compensation
Unrealistic Sales Goals Lead to Excessive Sales ForceTurnover
At a large service firm, systematic padding of sales forecasts from the topdown resulted in unrealistic goals for the sales force. The firm would startwith a reasonable sales budget, but then behind closed doors the CEOwould add 5 percent to the budget before passing it down to the next exec-utive, who tacked on another 5 percent, and so on. By the time the salesforce received the budget, the forecast was so inflated that some sales-people had goals that were 200 percent above the previous year’s sales—aforecast that the salespeople knew was completely unrealistic. The combi-nation of the out-of-reach goals and a high-pressure atmosphere took itstoll on the sales force. Many top performers left the firm to join rival compa-nies. One manager joked that the company had become a training campfor competitors. And as many top performers left, marginal performancebecame the cultural norm. The sales force received the counterproductivemessage that failing to make quota was okay.
In response to its troubles, the company set out to transform itself. Asa first step, management began providing more realistic, well-defined goalsto the sales force. As a result, the caliber of people attracted to the salesorganization improved significantly.
Authors’ note: When a small percentage of the sales force misses itsgoals, the problem can be with the salespeople. When the majority ofsalespeople miss their goal, the problem is with those at the top settingthe overall goal in the first place.
Are Company and Territory Goals Too Low?
Goals That Are Too Easy Can Encourage Undesirable SalesForce Behaviors
A large industrial firm found that its best performers were reaching theirsales goal by midyear and then basically quit working hard. As the year endapproached, the sales force delayed closing additional deals in order tocount those deals toward meeting next year’s goal.
‘‘We underestimated the success of our products and set territoryrevenue goals too low. Everyone made their goal easily, and the entiresales force was walking around with smiles on their faces.’’
CEO at a start-up medical device firm
The financial cost to the firm of a sales goal that is too low can be substantial,especially when plans have accelerators. For example, consider a company usingthe sales incentive compensation plan illustrated in Figure 9-4. The plan pays asalary plus 2.5 percent commission on every dollar in sales up to a territory goal
PAGE 318................. 15869$ $CH9 05-19-06 09:24:10 PS
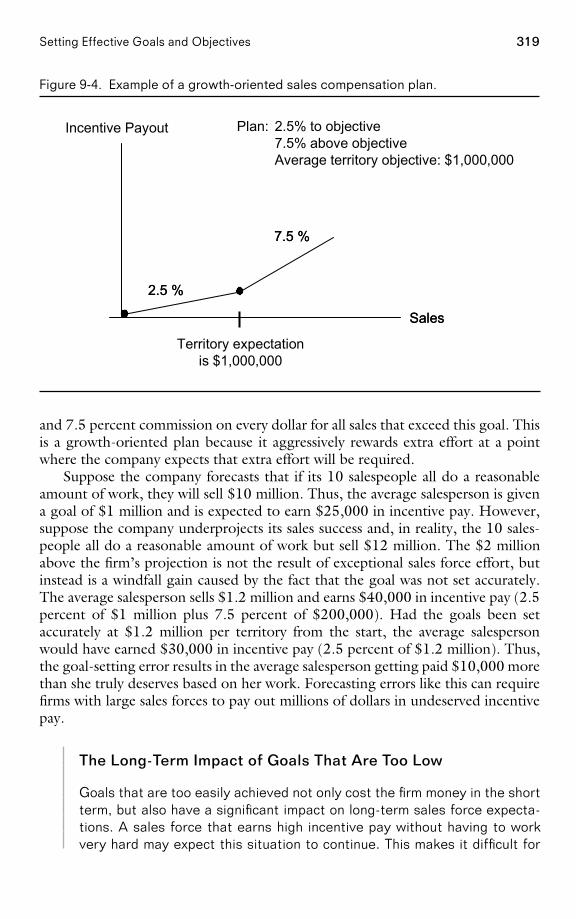
319Setting Effective Goals and Objectives
Figure 9-4. Example of a growth-oriented sales compensation plan.
Sales
2.5 %
7.5 %
Incentive Payout
Sales
Territory expectationis $1,000,000
2.5 %
7.5 %
Plan: 2.5% to objective7.5% above objectiveAverage territory objective: $1,000,000
and 7.5 percent commission on every dollar for all sales that exceed this goal. Thisis a growth-oriented plan because it aggressively rewards extra effort at a pointwhere the company expects that extra effort will be required.
Suppose the company forecasts that if its 10 salespeople all do a reasonableamount of work, they will sell $10 million. Thus, the average salesperson is givena goal of $1 million and is expected to earn $25,000 in incentive pay. However,suppose the company underprojects its sales success and, in reality, the 10 sales-people all do a reasonable amount of work but sell $12 million. The $2 millionabove the firm’s projection is not the result of exceptional sales force effort, butinstead is a windfall gain caused by the fact that the goal was not set accurately.The average salesperson sells $1.2 million and earns $40,000 in incentive pay (2.5percent of $1 million plus 7.5 percent of $200,000). Had the goals been setaccurately at $1.2 million per territory from the start, the average salespersonwould have earned $30,000 in incentive pay (2.5 percent of $1.2 million). Thus,the goal-setting error results in the average salesperson getting paid $10,000 morethan she truly deserves based on her work. Forecasting errors like this can requirefirms with large sales forces to pay out millions of dollars in undeserved incentivepay.
The Long-Term Impact of Goals That Are Too Low
Goals that are too easily achieved not only cost the firm money in the shortterm, but also have a significant impact on long-term sales force expecta-tions. A sales force that earns high incentive pay without having to workvery hard may expect this situation to continue. This makes it difficult for
PAGE 319................. 15869$ $CH9 05-19-06 09:24:11 PS
320 The Complete Guide to Sales Force Incentive Compensation
the firm to set more challenging goals in the future without adversely af-fecting sales force morale.
What Percent of the Sales Force Should Make Goal? There is much debate aboutwhat proportion of a sales force should make goal. Many companies follow thelogic that in order to be motivational, goals must be attainable by average per-formers in the sales force. Goal attainment is an important signal of a salesperson’ssuccess, in addition to being a determinant of financial reward. If average perform-ers cannot achieve goals, they may not feel successful, and sales force morale maysuffer.
‘‘At IBM, there was an aura around 100 percent goal attainment. Therewas a 100% Club, and everyone in the club got to go on a trip. If you didn’tmake it into the club, you felt like dog meat.’’
A former IBM marketing representative
When we asked members of our Incentive Compensation Advisory Board(ICAB), ‘‘What percent of the sales force do you think should make goal?’’ re-sponses were evenly spread across a range from 50 to 80 percent. The reasonsgiven to justify responses across this range are summarized in Figure 9-5.
The targeted percentage of salespeople expected to make goal should be in-fluenced by the message that management wants to send to the sales force. Forexample, a new sales force that has just hired a team of superstars may want allsalespeople to feel like winners. In this situation, goals should be set at a level such
Figure 9-5. ICAB member rationale for responses to the question, ‘‘What percent ofthe sales force do you think should make goal?’’
“Making goal is your target—the quest to make goal is what makes yourbusiness run. Anyone who doesn’t make goal will not feel successful. In astrong sales force, the vast majority of salespeople should make goal sothat the sales force feels successful.”
70–80%
“When about 2/3 of the sales force achieves goal, the majority ofsalespeople feel successful, yet those in the bottom 1/3 feel like they’ll needto hustle more to make it at the company. Limiting goal attainment to the top2/3 of the sales force prevents complacency among mediocre performers. Inaddition, a 2/3 level of goal attainment is consistent with our financialprojections; the 1/3 of the sales force that misses goal funds the additionalincentive money paid to those who overachieve.”
60–70%
“If the national goal is accurate, national attainment will be right around 100percent. This means that approximately half of the sales force will makegoal and half will not. Payout should start at some fraction of goal so that themajority of the sales force is engaged in the incentive plan, but a sufficientlychallenging national goal implies that many individuals will not make theirindividual goal.”
50–60%
RationaleResponse
PAGE 320................. 15869$ $CH9 05-19-06 09:24:12 PS
321Setting Effective Goals and Objectives
that almost everyone who does a reasonable amount of work can attain them. Onthe other hand, if a more mature sales force has become complacent and manage-ment wants to shake things up, a more challenging goal that fewer salespeoplewill achieve is appropriate. For example, management might set goals such that ifall salespeople continue to work at their current level, only the top 60 percent ofthe sales force will achieve them. Those in the bottom 40 percent are challengedto work harder in order to be successful. Those who are unwilling to do this maybe asked to leave the company.
When assessing your current goal-setting process, consider what percent ofthe sales force has achieved goal in the last several incentive periods. Is the attain-ment level consistent with the message you want the sales force to receive?
Reconciling Financial Goals and Sales Force Motivation
Unfortunately, sales leaders frequently do not have much control over howchallenging their sales goals will be. National sales forecasts are oftendriven by Wall Street expectations and are handed down to the sales forcefrom the executive suite. In the words of one sales director, ‘‘We are pas-sive victims in the process.’’ The goal level that the sales leaders feel isrealistic and appropriate from a sales force motivation perspective is fre-quently less than the goal that top management insists is necessary froma financial perspective. Managing the gap between what the sales forcefeels it can achieve and what top management demands requires consider-able management energy and focus. Effective sales leadership involvesconvincing the sales force that specific programs, activities, and behaviorscan enable the sales force to close this gap.
Are Goals Allocated Appropriately Across Salespeople?
Goal-setting problems can also arise when the company goal is set accurately, butthe goal is not allocated appropriately across salespeople.
Financial Cost of Goal-Allocation Errors. Errors in goal allocation can be costly.For instance, consider again the company with the growth-oriented sales incentivecompensation plan illustrated in Figure 9-4. This time, the company’s projectionof $1 million average sales per territory turns out to be accurate—if the firm’s 10salespeople all put in a reasonable amount of work, they will end up selling a totalof $10 million. The amount of money the company pays out in incentives dependsupon how accurately the $10 million goal is allocated to the individual sales-people. For example, suppose that, for simplicity, the company assigns every sales-person the same goal—$1 million. Figure 9-6 compares the firm’s total incentivepayout for varying degrees of accuracy in this goal allocation. In the ‘‘perfectaccuracy’’ scenario, Scenario A, each salesperson performs a reasonable amount ofwork and achieves his goal of $1 million exactly. Thus, the company pays out a
PAGE 321................. 15869$ $CH9 05-19-06 09:24:12 PS
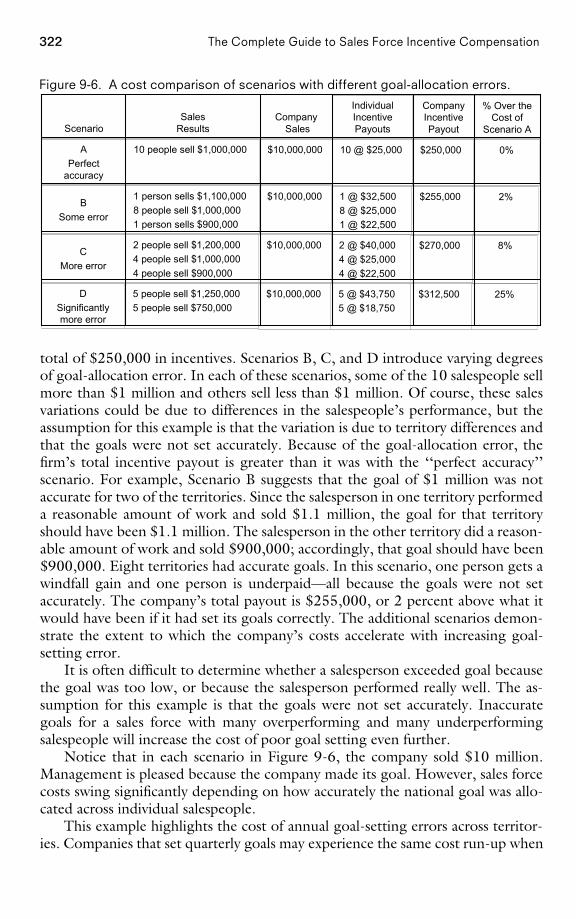
322 The Complete Guide to Sales Force Incentive Compensation
Figure 9-6. A cost comparison of scenarios with different goal-allocation errors.
25%$312,5005 @ $43,7505 @ $18,750
$10,000,0005 people sell $1,250,0005 people sell $750,000
DSignificantlymore error
8%$270,0002 @ $40,0004 @ $25,0004 @ $22,500
$10,000,0002 people sell $1,200,0004 people sell $1,000,0004 people sell $900,000
CMore error
2%$255,0001 @ $32,5008 @ $25,0001 @ $22,500
$10,000,0001 person sells $1,100,0008 people sell $1,000,0001 person sells $900,000
BSome error
0%$250,00010 @ $25,000$10,000,00010 people sell $1,000,000APerfect
accuracy
% Over theCost of
Scenario A
CompanyIncentivePayout
IndividualIncentivePayouts
Company Sales
SalesResultsScenario
total of $250,000 in incentives. Scenarios B, C, and D introduce varying degreesof goal-allocation error. In each of these scenarios, some of the 10 salespeople sellmore than $1 million and others sell less than $1 million. Of course, these salesvariations could be due to differences in the salespeople’s performance, but theassumption for this example is that the variation is due to territory differences andthat the goals were not set accurately. Because of the goal-allocation error, thefirm’s total incentive payout is greater than it was with the ‘‘perfect accuracy’’scenario. For example, Scenario B suggests that the goal of $1 million was notaccurate for two of the territories. Since the salesperson in one territory performeda reasonable amount of work and sold $1.1 million, the goal for that territoryshould have been $1.1 million. The salesperson in the other territory did a reason-able amount of work and sold $900,000; accordingly, that goal should have been$900,000. Eight territories had accurate goals. In this scenario, one person gets awindfall gain and one person is underpaid—all because the goals were not setaccurately. The company’s total payout is $255,000, or 2 percent above what itwould have been if it had set its goals correctly. The additional scenarios demon-strate the extent to which the company’s costs accelerate with increasing goal-setting error.
It is often difficult to determine whether a salesperson exceeded goal becausethe goal was too low, or because the salesperson performed really well. The as-sumption for this example is that the goals were not set accurately. Inaccurategoals for a sales force with many overperforming and many underperformingsalespeople will increase the cost of poor goal setting even further.
Notice that in each scenario in Figure 9-6, the company sold $10 million.Management is pleased because the company made its goal. However, sales forcecosts swing significantly depending on how accurately the national goal was allo-cated across individual salespeople.
This example highlights the cost of annual goal-setting errors across territor-ies. Companies that set quarterly goals may experience the same cost run-up when
PAGE 322................. 15869$ $CH9 05-19-06 09:24:13 PS
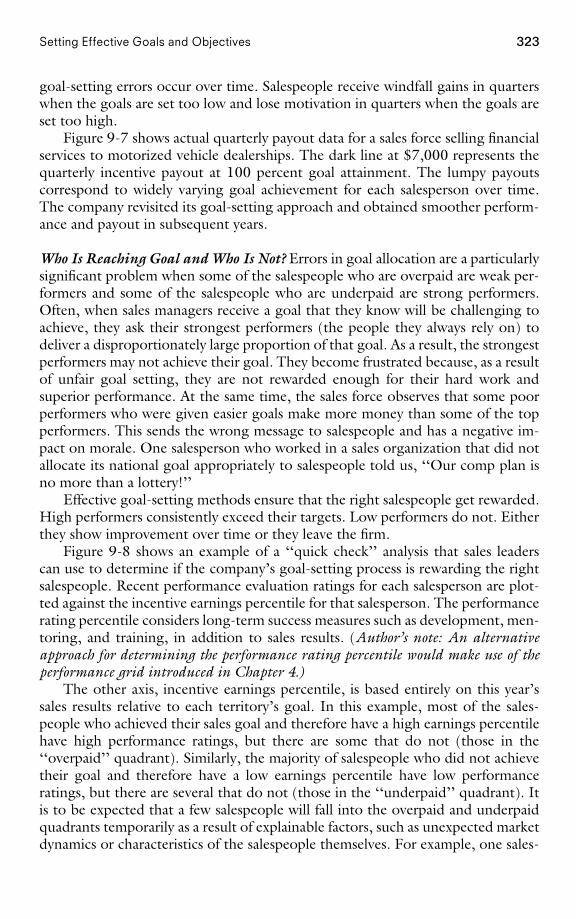
323Setting Effective Goals and Objectives
goal-setting errors occur over time. Salespeople receive windfall gains in quarterswhen the goals are set too low and lose motivation in quarters when the goals areset too high.
Figure 9-7 shows actual quarterly payout data for a sales force selling financialservices to motorized vehicle dealerships. The dark line at $7,000 represents thequarterly incentive payout at 100 percent goal attainment. The lumpy payoutscorrespond to widely varying goal achievement for each salesperson over time.The company revisited its goal-setting approach and obtained smoother perform-ance and payout in subsequent years.
Who Is Reaching Goal and Who Is Not? Errors in goal allocation are a particularlysignificant problem when some of the salespeople who are overpaid are weak per-formers and some of the salespeople who are underpaid are strong performers.Often, when sales managers receive a goal that they know will be challenging toachieve, they ask their strongest performers (the people they always rely on) todeliver a disproportionately large proportion of that goal. As a result, the strongestperformers may not achieve their goal. They become frustrated because, as a resultof unfair goal setting, they are not rewarded enough for their hard work andsuperior performance. At the same time, the sales force observes that some poorperformers who were given easier goals make more money than some of the topperformers. This sends the wrong message to salespeople and has a negative im-pact on morale. One salesperson who worked in a sales organization that did notallocate its national goal appropriately to salespeople told us, ‘‘Our comp plan isno more than a lottery!’’
Effective goal-setting methods ensure that the right salespeople get rewarded.High performers consistently exceed their targets. Low performers do not. Eitherthey show improvement over time or they leave the firm.
Figure 9-8 shows an example of a ‘‘quick check’’ analysis that sales leaderscan use to determine if the company’s goal-setting process is rewarding the rightsalespeople. Recent performance evaluation ratings for each salesperson are plot-ted against the incentive earnings percentile for that salesperson. The performancerating percentile considers long-term success measures such as development, men-toring, and training, in addition to sales results. (Author’s note: An alternativeapproach for determining the performance rating percentile would make use of theperformance grid introduced in Chapter 4.)
The other axis, incentive earnings percentile, is based entirely on this year’ssales results relative to each territory’s goal. In this example, most of the sales-people who achieved their sales goal and therefore have a high earnings percentilehave high performance ratings, but there are some that do not (those in the‘‘overpaid’’ quadrant). Similarly, the majority of salespeople who did not achievetheir goal and therefore have a low earnings percentile have low performanceratings, but there are several that do not (those in the ‘‘underpaid’’ quadrant). Itis to be expected that a few salespeople will fall into the overpaid and underpaidquadrants temporarily as a result of explainable factors, such as unexpected marketdynamics or characteristics of the salespeople themselves. For example, one sales-
PAGE 323................. 15869$ $CH9 05-19-06 09:24:14 PS
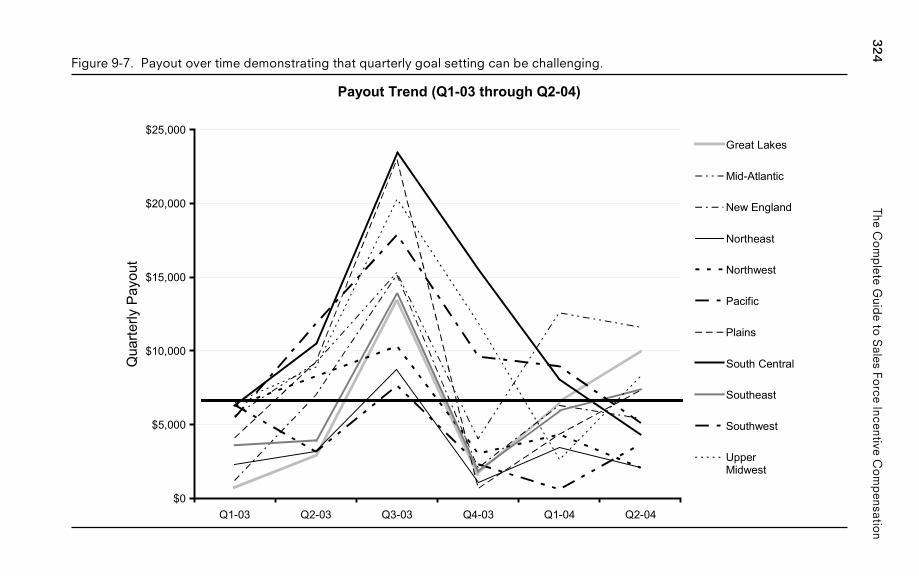
324The
Co
mp
leteG
uide
toS
alesFo
rceIncentive
Co
mp
ensation
Figure 9-7. Payout over time demonstrating that quarterly goal setting can be challenging.
Payout Trend (Q1-03 through Q2-04)
$0
$5,000
$10,000
$15,000
$20,000
$25,000
Q1-03 Q2-03 Q3-03 Q4-03 Q1-04 Q2-04
Qua
rterly
Pay
out
Great Lakes
Mid-Atlantic
New England
Northeast
Northwest
Pacific
Plains
South Central
Southeast
Southwest
UpperMidwest
PA
GE
324.................15869$
$CH
905-19-06
09:24:15P
S
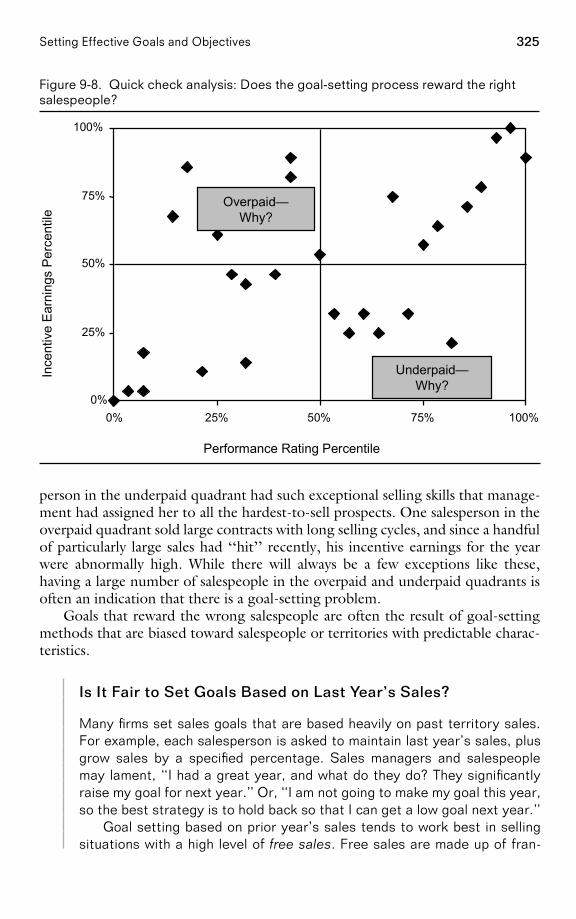
325Setting Effective Goals and Objectives
Figure 9-8. Quick check analysis: Does the goal-setting process reward the rightsalespeople?
0%
25%
50%
75%
100%
0% 25% 50% 75% 100%
Performance Rating Percentile
Ince
ntiv
e Ea
rnin
gs P
erce
ntile
Underpaid—Why?
Overpaid—Why?
person in the underpaid quadrant had such exceptional selling skills that manage-ment had assigned her to all the hardest-to-sell prospects. One salesperson in theoverpaid quadrant sold large contracts with long selling cycles, and since a handfulof particularly large sales had ‘‘hit’’ recently, his incentive earnings for the yearwere abnormally high. While there will always be a few exceptions like these,having a large number of salespeople in the overpaid and underpaid quadrants isoften an indication that there is a goal-setting problem.
Goals that reward the wrong salespeople are often the result of goal-settingmethods that are biased toward salespeople or territories with predictable charac-teristics.
Is It Fair to Set Goals Based on Last Year’s Sales?
Many firms set sales goals that are based heavily on past territory sales.For example, each salesperson is asked to maintain last year’s sales, plusgrow sales by a specified percentage. Sales managers and salespeoplemay lament, ‘‘I had a great year, and what do they do? They significantlyraise my goal for next year.’’ Or, ‘‘I am not going to make my goal this year,so the best strategy is to hold back so that I can get a low goal next year.’’
Goal setting based on prior year’s sales tends to work best in sellingsituations with a high level of free sales. Free sales are made up of fran-
PAGE 325................. 15869$ $CH9 05-19-06 09:24:16 PS
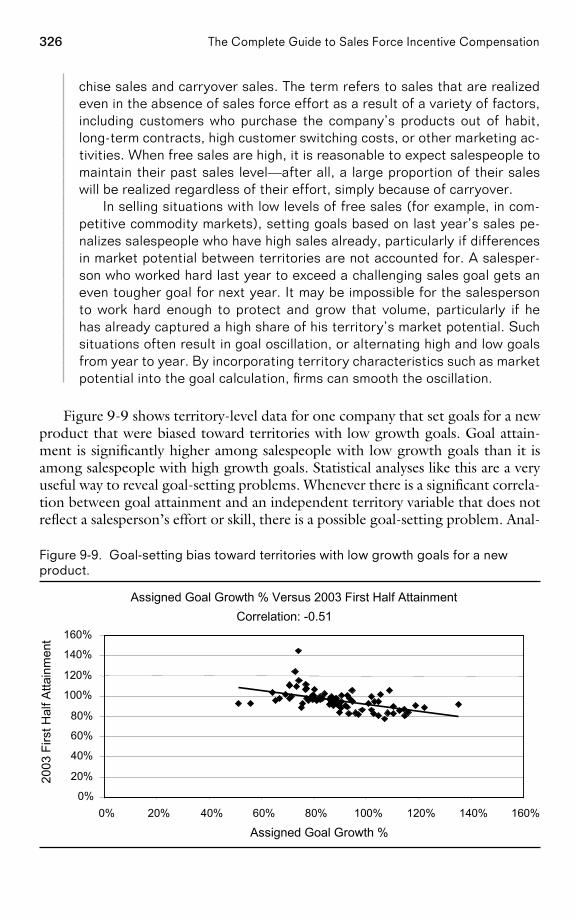
326 The Complete Guide to Sales Force Incentive Compensation
chise sales and carryover sales. The term refers to sales that are realizedeven in the absence of sales force effort as a result of a variety of factors,including customers who purchase the company’s products out of habit,long-term contracts, high customer switching costs, or other marketing ac-tivities. When free sales are high, it is reasonable to expect salespeople tomaintain their past sales level—after all, a large proportion of their saleswill be realized regardless of their effort, simply because of carryover.
In selling situations with low levels of free sales (for example, in com-petitive commodity markets), setting goals based on last year’s sales pe-nalizes salespeople who have high sales already, particularly if differencesin market potential between territories are not accounted for. A salesper-son who worked hard last year to exceed a challenging sales goal gets aneven tougher goal for next year. It may be impossible for the salespersonto work hard enough to protect and grow that volume, particularly if hehas already captured a high share of his territory’s market potential. Suchsituations often result in goal oscillation, or alternating high and low goalsfrom year to year. By incorporating territory characteristics such as marketpotential into the goal calculation, firms can smooth the oscillation.
Figure 9-9 shows territory-level data for one company that set goals for a newproduct that were biased toward territories with low growth goals. Goal attain-ment is significantly higher among salespeople with low growth goals than it isamong salespeople with high growth goals. Statistical analyses like this are a veryuseful way to reveal goal-setting problems. Whenever there is a significant correla-tion between goal attainment and an independent territory variable that does notreflect a salesperson’s effort or skill, there is a possible goal-setting problem. Anal-
Figure 9-9. Goal-setting bias toward territories with low growth goals for a newproduct.
Assigned Goal Growth % Versus 2003 First Half AttainmentCorrelation: -0.51
0%
20%
40%
60%
80%
100%
120%
140%
160%
0% 20% 40% 60% 80% 100% 120% 140% 160%
Assigned Goal Growth %
2003
Firs
t Hal
f Atta
inm
ent
PAGE 326................. 15869$ $CH9 05-19-06 09:24:18 PS
327Setting Effective Goals and Objectives
yses like this have been used to reveal goal-setting biases based on variables suchas territory size, geographic region, served market segments, market potential,past sales level, market share, and quota increase.
Assigning Equal Growth Goals to Every Territory Can Be Unfairas Well
One firm set quotas by assigning an equal percentage growth over last yearto every territory. The field complained loudly that as a result, territorieswith high past sales were being punished with quotas that were not achiev-able. Sure enough, an analysis (similar to the one in Figure 9-9) found ahigh negative correlation (R2 of �.39) between the previous year’s terri-tory sales and quota attainment. The goal-setting methodology was biasedagainst territories with high past sales.
Types of Goals
Sales forces have many different types of goals. This chapter focuses on goals thatare set by management and disseminated to the sales force, but salespeople andsales teams can also set personal goals for themselves. Figure 9-10 provides someexamples of sales force goals. The examples are organized by the four componentsthat make up the sales management system framework. Most firms set goals forall components, but the type of goal that has the most salience depends upon anindividual’s position within the selling organization, the firm’s selling environ-ment, the sales force culture, and the availability and accuracy of performancemeasures (see Chapter 6 for more information on performance measures).
Goals play an important role as a controller within the sales management sys-tem. Goals help to define success, set expectations, and encourage sales forcebehaviors that are aligned with the firm’s objectives. Sales leaders employ twoimportant and complementary sales force effectiveness drivers to manage goalachievement: sales incentives and sales performance management. Sales incentivestie goal achievement to a salesperson’s pay. Performance management involvesmanagers working with salespeople to develop plans for achieving goals and pro-viding coaching and guidance as each salesperson takes action to carry out thoseplans. In a performance management system, ongoing performance relative togoals is measured, feedback is provided, and appropriate consequences forachievement or nonachievement are implemented.
As shown in Figure 9-11, the importance of the two control vehicles (incen-tives and performance management) varies across the different goal types.Achievement of salesperson and sales force activities goals (the two left-hand col-umns of Figure 9-11) are typically controlled primarily through performancemanagement processes. Achievement of customer and company results goals (the
PAGE 327................. 15869$ $CH9 05-19-06 09:24:18 PS
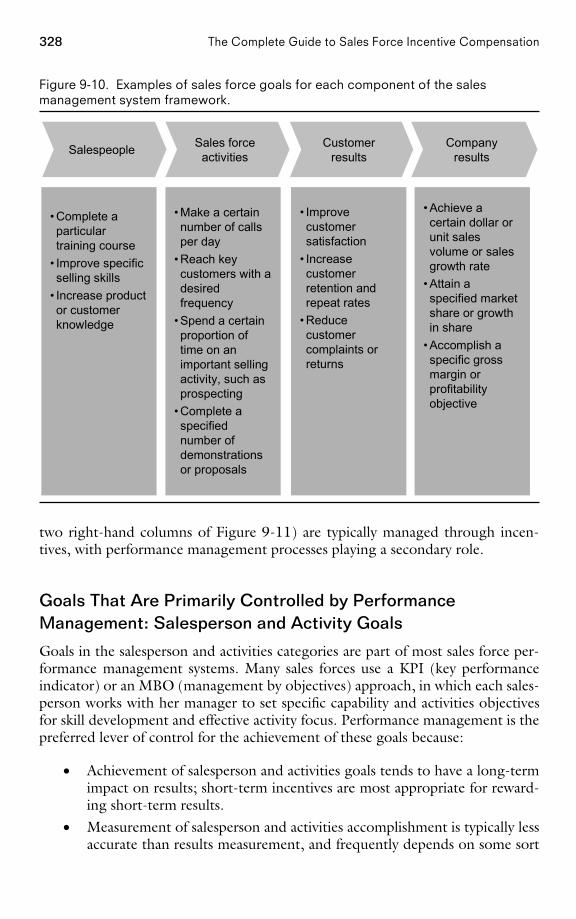
328 The Complete Guide to Sales Force Incentive Compensation
Figure 9-10. Examples of sales force goals for each component of the salesmanagement system framework.
Salespeople Sales forceactivities
Customerresults
Companyresults
• Complete aparticulartraining course
• Improve specificselling skills
• Increase productor customerknowledge
• Make a certainnumber of callsper day
• Reach keycustomers with adesiredfrequency
• Spend a certainproportion oftime on animportant sellingactivity, such asprospecting
• Complete aspecifiednumber ofdemonstrationsor proposals
• Improvecustomersatisfaction
• Increasecustomerretention andrepeat rates
• Reducecustomercomplaints orreturns
• Achieve acertain dollar orunit salesvolume or salesgrowth rate
• Attain aspecified marketshare or growthin share
• Accomplish aspecific grossmargin orprofitabilityobjective
two right-hand columns of Figure 9-11) are typically managed through incen-tives, with performance management processes playing a secondary role.
Goals That Are Primarily Controlled by PerformanceManagement: Salesperson and Activity Goals
Goals in the salesperson and activities categories are part of most sales force per-formance management systems. Many sales forces use a KPI (key performanceindicator) or an MBO (management by objectives) approach, in which each sales-person works with her manager to set specific capability and activities objectivesfor skill development and effective activity focus. Performance management is thepreferred lever of control for the achievement of these goals because:
• Achievement of salesperson and activities goals tends to have a long-termimpact on results; short-term incentives are most appropriate for reward-ing short-term results.
• Measurement of salesperson and activities accomplishment is typically lessaccurate than results measurement, and frequently depends on some sort
PAGE 328................. 15869$ $CH9 05-19-06 09:24:19 PS
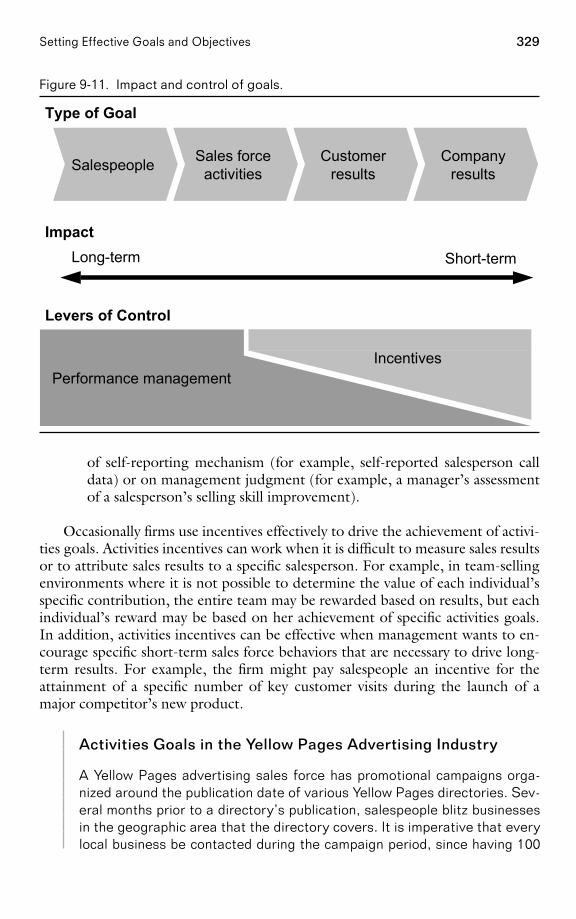
329Setting Effective Goals and Objectives
Figure 9-11. Impact and control of goals.
Type of Goal
Levers of Control
Performance managementIncentives
Salespeople Sales forceactivities
Customerresults
Companyresults
Long-term Short-term
Impact
of self-reporting mechanism (for example, self-reported salesperson calldata) or on management judgment (for example, a manager’s assessmentof a salesperson’s selling skill improvement).
Occasionally firms use incentives effectively to drive the achievement of activi-ties goals. Activities incentives can work when it is difficult to measure sales resultsor to attribute sales results to a specific salesperson. For example, in team-sellingenvironments where it is not possible to determine the value of each individual’sspecific contribution, the entire team may be rewarded based on results, but eachindividual’s reward may be based on her achievement of specific activities goals.In addition, activities incentives can be effective when management wants to en-courage specific short-term sales force behaviors that are necessary to drive long-term results. For example, the firm might pay salespeople an incentive for theattainment of a specific number of key customer visits during the launch of amajor competitor’s new product.
Activities Goals in the Yellow Pages Advertising Industry
A Yellow Pages advertising sales force has promotional campaigns orga-nized around the publication date of various Yellow Pages directories. Sev-eral months prior to a directory’s publication, salespeople blitz businessesin the geographic area that the directory covers. It is imperative that everylocal business be contacted during the campaign period, since having 100
PAGE 329................. 15869$ $CH9 05-19-06 09:24:21 PS
330 The Complete Guide to Sales Force Incentive Compensation
percent coverage makes the Yellow Pages directory significantly more valu-able to consumers. Salespeople are given daily routes and are paid an in-centive if they contact every business on their assigned route. Salespeoplealso receive incentives based on the advertising revenues they generate.
There is an important caution for a management team contemplating the useof activities goals in the incentive plan: When activities goals are tied directly tomonetary rewards, they often motivate an increase in the quantity of the desiredactivities but a decrease in the quality of those activities.
Goals That Are Primarily Controlled by Incentives: Customerand Company Results Goals
Almost all goal-based incentive programs tie the majority of sales force incentivemoney to the accomplishment of results goals. Company results goals (for exam-ple, sales, gross margin, and market share goals) are used almost all the time, whilecustomer results goals (for example, repeat rate or customer satisfaction goals) areused by about 10 percent of all companies. Incentives are an effective means ofcontrolling the achievement of results goals because:
• Results goals tend to be short term (for example, a quarterly sales goal).Most sales forces have significant short-term pressure to drive results, andincentives are very good at influencing short-term behavior and activitythat drives results.
• Results measures are typically accurately and objectively measurable.
• Results goals encourage incentive plan fiscal responsibility, as incentivecosts are incurred only when results are generated to pay for those costs.
Since most companies use company results goals as the primary basis for theirincentive programs, the remainder of this chapter focuses on how to effectivelyset company results–oriented goals that will be used as a basis for determiningsales force incentive pay.
How to Set Effective Sales Force Goals: A Five-Step Process
Many companies spend a considerable amount of time, energy, and money ondetermining goals. Despite this effort, goal-based incentive plans are a frequentsource of dissatisfaction for salespeople. The process by which goals are set at afirm significantly influences both the quality of the goals and the degree to whichthe sales force will be committed to those goals. A goal-setting process that is verycentralized and does not incorporate significant input from the sales force may
PAGE 330................. 15869$ $CH9 05-19-06 09:24:21 PS
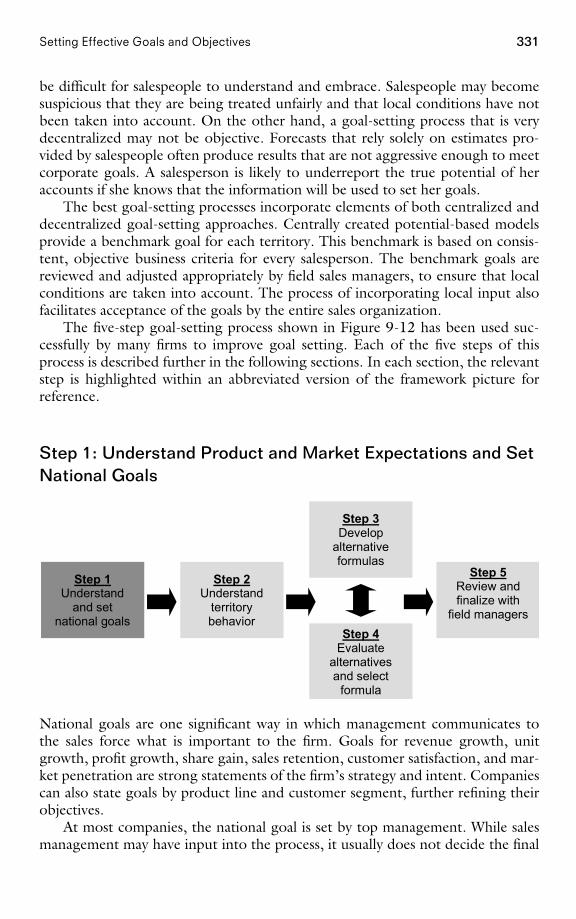
331Setting Effective Goals and Objectives
be difficult for salespeople to understand and embrace. Salespeople may becomesuspicious that they are being treated unfairly and that local conditions have notbeen taken into account. On the other hand, a goal-setting process that is verydecentralized may not be objective. Forecasts that rely solely on estimates pro-vided by salespeople often produce results that are not aggressive enough to meetcorporate goals. A salesperson is likely to underreport the true potential of heraccounts if she knows that the information will be used to set her goals.
The best goal-setting processes incorporate elements of both centralized anddecentralized goal-setting approaches. Centrally created potential-based modelsprovide a benchmark goal for each territory. This benchmark is based on consis-tent, objective business criteria for every salesperson. The benchmark goals arereviewed and adjusted appropriately by field sales managers, to ensure that localconditions are taken into account. The process of incorporating local input alsofacilitates acceptance of the goals by the entire sales organization.
The five-step goal-setting process shown in Figure 9-12 has been used suc-cessfully by many firms to improve goal setting. Each of the five steps of thisprocess is described further in the following sections. In each section, the relevantstep is highlighted within an abbreviated version of the framework picture forreference.
Step 1: Understand Product and Market Expectations and SetNational Goals
Step 1Understand
and setnational goals
Step 2Understand
territorybehavior
Step 3Develop
alternativeformulas
Step 5Review andfinalize with
field managersStep 4
Evaluatealternativesand select
formula
National goals are one significant way in which management communicates tothe sales force what is important to the firm. Goals for revenue growth, unitgrowth, profit growth, share gain, sales retention, customer satisfaction, and mar-ket penetration are strong statements of the firm’s strategy and intent. Companiescan also state goals by product line and customer segment, further refining theirobjectives.
At most companies, the national goal is set by top management. While salesmanagement may have input into the process, it usually does not decide the final
PAGE 331................. 15869$ $CH9 05-19-06 09:24:22 PS
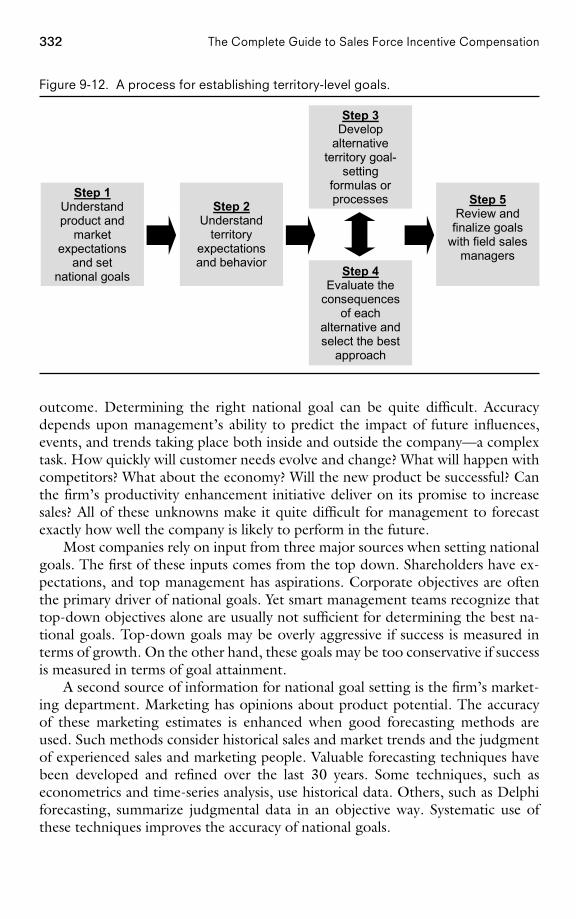
332 The Complete Guide to Sales Force Incentive Compensation
Figure 9-12. A process for establishing territory-level goals.
Step 1Understandproduct and
marketexpectations
and setnational goals
Step 2Understand
territoryexpectationsand behavior
Step 3Develop
alternativeterritory goal-
settingformulas orprocesses Step 5
Review andfinalize goals
with field salesmanagers
Step 4Evaluate the
consequencesof each
alternative andselect the best
approach
outcome. Determining the right national goal can be quite difficult. Accuracydepends upon management’s ability to predict the impact of future influences,events, and trends taking place both inside and outside the company—a complextask. How quickly will customer needs evolve and change? What will happen withcompetitors? What about the economy? Will the new product be successful? Canthe firm’s productivity enhancement initiative deliver on its promise to increasesales? All of these unknowns make it quite difficult for management to forecastexactly how well the company is likely to perform in the future.
Most companies rely on input from three major sources when setting nationalgoals. The first of these inputs comes from the top down. Shareholders have ex-pectations, and top management has aspirations. Corporate objectives are oftenthe primary driver of national goals. Yet smart management teams recognize thattop-down objectives alone are usually not sufficient for determining the best na-tional goals. Top-down goals may be overly aggressive if success is measured interms of growth. On the other hand, these goals may be too conservative if successis measured in terms of goal attainment.
A second source of information for national goal setting is the firm’s market-ing department. Marketing has opinions about product potential. The accuracyof these marketing estimates is enhanced when good forecasting methods areused. Such methods consider historical sales and market trends and the judgmentof experienced sales and marketing people. Valuable forecasting techniques havebeen developed and refined over the last 30 years. Some techniques, such aseconometrics and time-series analysis, use historical data. Others, such as Delphiforecasting, summarize judgmental data in an objective way. Systematic use ofthese techniques improves the accuracy of national goals.
PAGE 332................. 15869$ $CH9 05-19-06 09:24:24 PS
333Setting Effective Goals and Objectives
Example of a Structured Approach to National Goal Setting
One firm’s marketing department improved its ability to set national goalssignificantly when it began using a structured analytical approach. First,the historical sales trend for each key product is examined, and sales areprojected assuming that the historical trend continues. Next, anticipatedevents that will affect next year’s sales are accounted for. For example, anexpected competitive launch may have a negative impact on sales, whiledevelopment of new markets, a new promotional campaign, and increasedsales force effort will have a positive impact. Both quantitative and judg-mental inputs are considered in the analysis that estimates the sales im-pact of these events. Contingencies for events that are not part of the coreforecast are also examined. For example, the possibility of price erosion, aprice increase, or a second competitive launch is considered, and the likelyimpact on sales is determined. This structured approach to national goalsetting increased product forecasting accuracy, and thus made it possiblefor the sales force to set more realistic territory-level goals.
Third, input for national goal setting can be obtained from the sales force.Often, this involves summing together forecasts developed for individual salesterritories, districts, or regions to derive a total business goal. Some firms have asales analysis group that examines historical sales, market potential, and/or calldata at the territory level to project future performance. Additionally, salespeopleand sales managers may be asked for their opinions. Asking the sales force forinput for national goal setting allows local conditions to be taken into accountand encourages sales force acceptance of the national goal. The sales force is likelyto provide the best estimate in environments involving complex, high-pricedproducts, those where there are many participants in the buying process, andthose with long selling cycles. However, bottom-up goals based exclusively onsales force input may be understated, since salespeople have an incentive to pro-vide conservative forecasts, so that they will appear successful when they exceedthose forecasts. Clever design of the process for gathering bottom-up forecastsfrom the sales force can discourage underforecasting (see the bottom-up methodof goal setting described later in this chapter).
Analytical Approaches Enhance Forecasting Accuracy
Historically, a $40 million software company with a 30-person sales forcehad set its national sales goals based on guesstimates developed by topmanagement. These guesstimates took into account factors such as whatinvestors wanted the firm to do, the previous year’s numbers, and howmanagement thought the firm’s competitors were doing. When the firmsubstantially missed its sales goal two years in a row and had to lay offsalespeople, the traditional goal-setting process was replaced by a more
PAGE 333................. 15869$ $CH9 05-19-06 09:24:24 PS
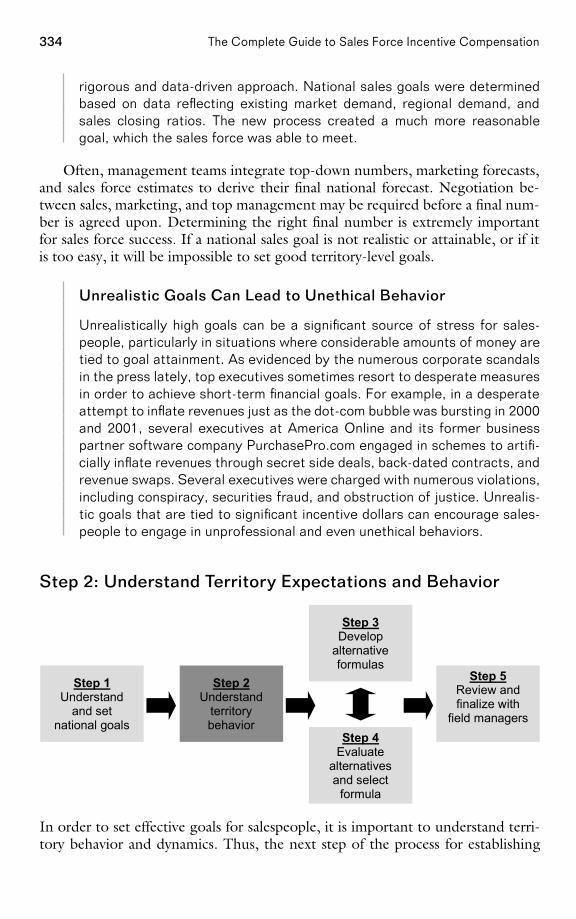
334 The Complete Guide to Sales Force Incentive Compensation
rigorous and data-driven approach. National sales goals were determinedbased on data reflecting existing market demand, regional demand, andsales closing ratios. The new process created a much more reasonablegoal, which the sales force was able to meet.
Often, management teams integrate top-down numbers, marketing forecasts,and sales force estimates to derive their final national forecast. Negotiation be-tween sales, marketing, and top management may be required before a final num-ber is agreed upon. Determining the right final number is extremely importantfor sales force success. If a national sales goal is not realistic or attainable, or if itis too easy, it will be impossible to set good territory-level goals.
Unrealistic Goals Can Lead to Unethical Behavior
Unrealistically high goals can be a significant source of stress for sales-people, particularly in situations where considerable amounts of money aretied to goal attainment. As evidenced by the numerous corporate scandalsin the press lately, top executives sometimes resort to desperate measuresin order to achieve short-term financial goals. For example, in a desperateattempt to inflate revenues just as the dot-com bubble was bursting in 2000and 2001, several executives at America Online and its former businesspartner software company PurchasePro.com engaged in schemes to artifi-cially inflate revenues through secret side deals, back-dated contracts, andrevenue swaps. Several executives were charged with numerous violations,including conspiracy, securities fraud, and obstruction of justice. Unrealis-tic goals that are tied to significant incentive dollars can encourage sales-people to engage in unprofessional and even unethical behaviors.
Step 2: Understand Territory Expectations and Behavior
Step 1Understand
and setnational goals
Step 2Understand
territorybehavior
Step 3Develop
alternativeformulas
Step 5Review andfinalize with
field managersStep 4
Evaluatealternativesand select
formula
In order to set effective goals for salespeople, it is important to understand terri-tory behavior and dynamics. Thus, the next step of the process for establishing
PAGE 334................. 15869$ $CH9 05-19-06 09:24:25 PS
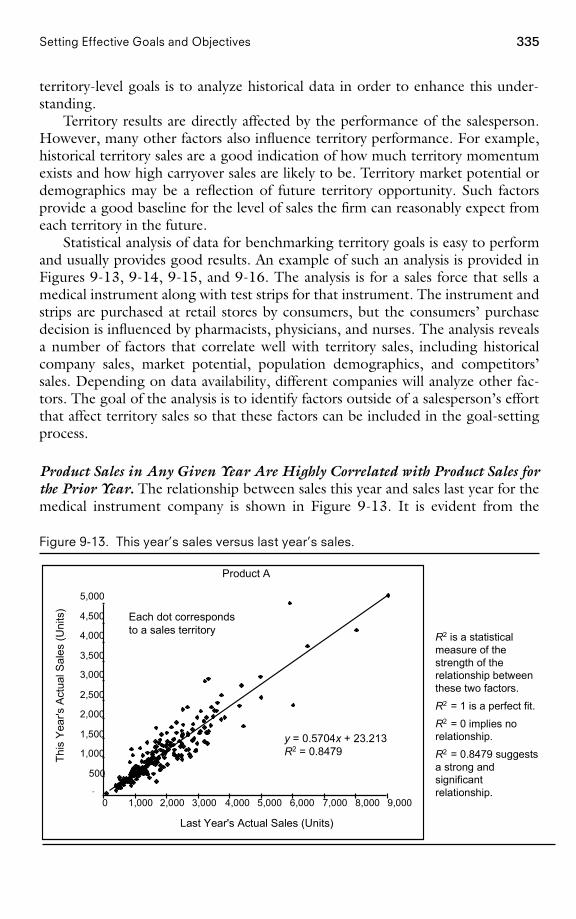
335Setting Effective Goals and Objectives
territory-level goals is to analyze historical data in order to enhance this under-standing.
Territory results are directly affected by the performance of the salesperson.However, many other factors also influence territory performance. For example,historical territory sales are a good indication of how much territory momentumexists and how high carryover sales are likely to be. Territory market potential ordemographics may be a reflection of future territory opportunity. Such factorsprovide a good baseline for the level of sales the firm can reasonably expect fromeach territory in the future.
Statistical analysis of data for benchmarking territory goals is easy to performand usually provides good results. An example of such an analysis is provided inFigures 9-13, 9-14, 9-15, and 9-16. The analysis is for a sales force that sells amedical instrument along with test strips for that instrument. The instrument andstrips are purchased at retail stores by consumers, but the consumers’ purchasedecision is influenced by pharmacists, physicians, and nurses. The analysis revealsa number of factors that correlate well with territory sales, including historicalcompany sales, market potential, population demographics, and competitors’sales. Depending on data availability, different companies will analyze other fac-tors. The goal of the analysis is to identify factors outside of a salesperson’s effortthat affect territory sales so that these factors can be included in the goal-settingprocess.
Product Sales in Any Given Year Are Highly Correlated with Product Sales forthe Prior Year. The relationship between sales this year and sales last year for themedical instrument company is shown in Figure 9-13. It is evident from the
Figure 9-13. This year’s sales versus last year’s sales.
R2 is a statisticalmeasure of thestrength of therelationship betweenthese two factors.
R2 = 1 is a perfect fit.
R2 = 0 implies norelationship.
R2 = 0.8479 suggestsa strong andsignificantrelationship.
Product A
-
500
1,000
1,500
2,000
2,500
3,000
3,500
4,000
4,500
5,000
0 1,000 2,000 3,000 4,000 5,000 6,000 7,000 8,000 9,000
Last Year's Actual Sales (Units)
This
Yea
r's A
ctua
l Sal
es (U
nits
)
Each dot correspondsto a sales territory
y = 0.5704x + 23.213R2 = 0.8479
PAGE 335................. 15869$ $CH9 05-19-06 09:24:27 PS
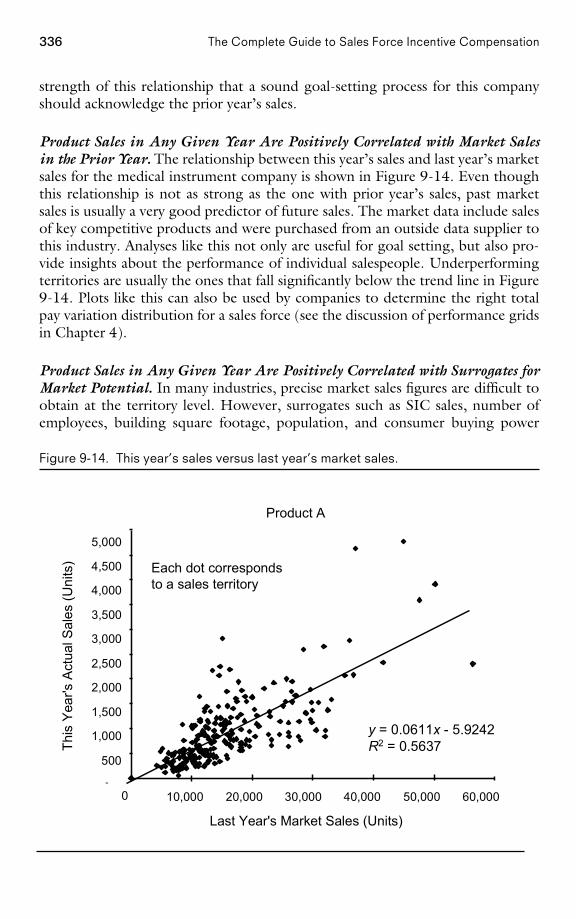
336 The Complete Guide to Sales Force Incentive Compensation
strength of this relationship that a sound goal-setting process for this companyshould acknowledge the prior year’s sales.
Product Sales in Any Given Year Are Positively Correlated with Market Salesin the Prior Year. The relationship between this year’s sales and last year’s marketsales for the medical instrument company is shown in Figure 9-14. Even thoughthis relationship is not as strong as the one with prior year’s sales, past marketsales is usually a very good predictor of future sales. The market data include salesof key competitive products and were purchased from an outside data supplier tothis industry. Analyses like this not only are useful for goal setting, but also pro-vide insights about the performance of individual salespeople. Underperformingterritories are usually the ones that fall significantly below the trend line in Figure9-14. Plots like this can also be used by companies to determine the right totalpay variation distribution for a sales force (see the discussion of performance gridsin Chapter 4).
Product Sales in Any Given Year Are Positively Correlated with Surrogates forMarket Potential. In many industries, precise market sales figures are difficult toobtain at the territory level. However, surrogates such as SIC sales, number ofemployees, building square footage, population, and consumer buying power
Figure 9-14. This year’s sales versus last year’s market sales.
y = 0.0611x - 5.9242R2 = 0.5637
Product A
-
500
1,000
1,500
2,000
2,500
3,000
3,500
4,000
4,500
5,000
0 10,000 20,000 30,000 40,000 50,000 60,000
Last Year's Market Sales (Units)
This
Yea
r's A
ctua
l Sal
es (U
nits
) Each dot correspondsto a sales territory
PAGE 336................. 15869$ $CH9 05-19-06 09:24:28 PS
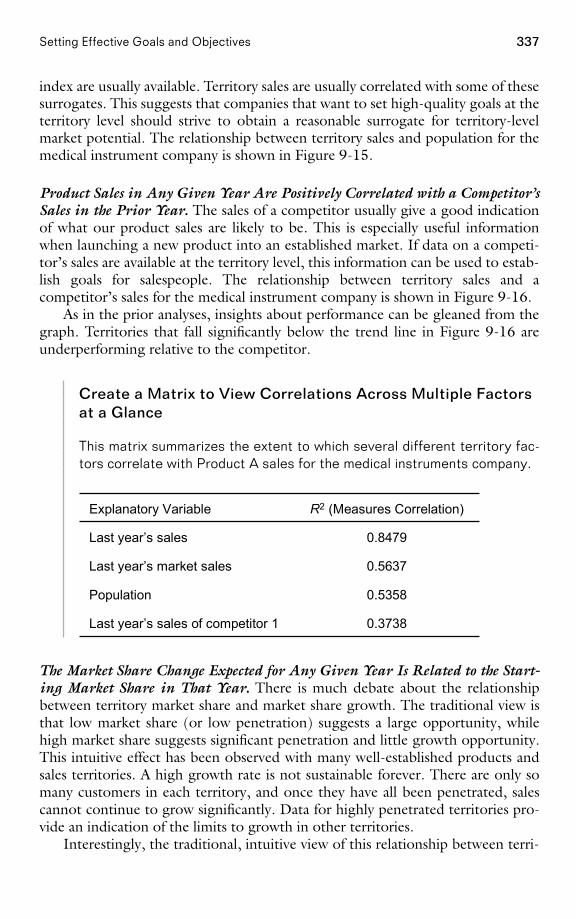
337Setting Effective Goals and Objectives
index are usually available. Territory sales are usually correlated with some of thesesurrogates. This suggests that companies that want to set high-quality goals at theterritory level should strive to obtain a reasonable surrogate for territory-levelmarket potential. The relationship between territory sales and population for themedical instrument company is shown in Figure 9-15.
Product Sales in Any Given Year Are Positively Correlated with a Competitor’sSales in the Prior Year. The sales of a competitor usually give a good indicationof what our product sales are likely to be. This is especially useful informationwhen launching a new product into an established market. If data on a competi-tor’s sales are available at the territory level, this information can be used to estab-lish goals for salespeople. The relationship between territory sales and acompetitor’s sales for the medical instrument company is shown in Figure 9-16.
As in the prior analyses, insights about performance can be gleaned from thegraph. Territories that fall significantly below the trend line in Figure 9-16 areunderperforming relative to the competitor.
Create a Matrix to View Correlations Across Multiple Factorsat a Glance
This matrix summarizes the extent to which several different territory fac-tors correlate with Product A sales for the medical instruments company.
0.3738Last year’s sales of competitor 1
0.5358Population
0.5637Last year’s market sales
0.8479Last year’s sales
R2 (Measures Correlation)Explanatory Variable
The Market Share Change Expected for Any Given Year Is Related to the Start-ing Market Share in That Year. There is much debate about the relationshipbetween territory market share and market share growth. The traditional view isthat low market share (or low penetration) suggests a large opportunity, whilehigh market share suggests significant penetration and little growth opportunity.This intuitive effect has been observed with many well-established products andsales territories. A high growth rate is not sustainable forever. There are only somany customers in each territory, and once they have all been penetrated, salescannot continue to grow significantly. Data for highly penetrated territories pro-vide an indication of the limits to growth in other territories.
Interestingly, the traditional, intuitive view of this relationship between terri-
PAGE 337................. 15869$ $CH9 05-19-06 09:24:30 PS
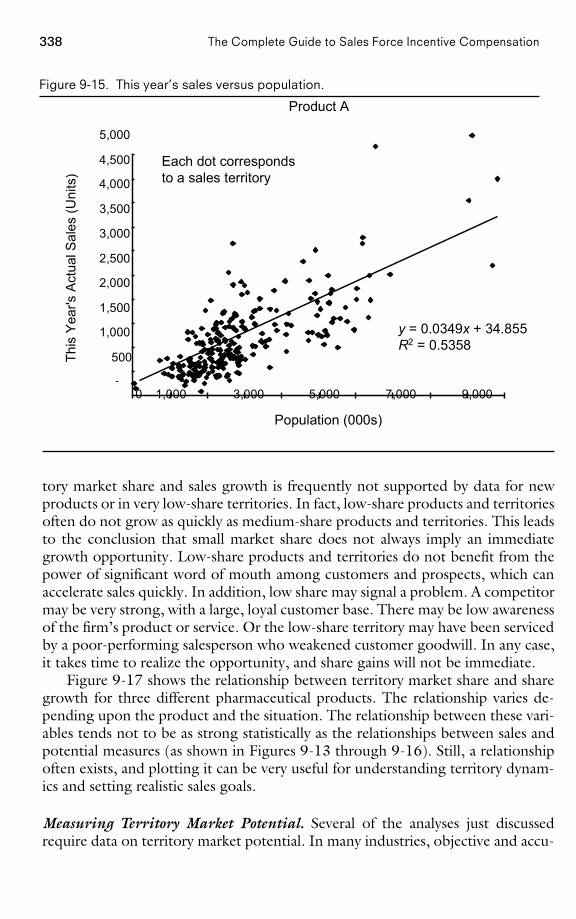
338 The Complete Guide to Sales Force Incentive Compensation
Figure 9-15. This year’s sales versus population.Th
is Y
ear's
Act
ual S
ales
(Uni
ts)
Product A
-
500
1,000
1,500
2,000
2,500
3,000
3,500
4,000
4,500
5,000
0 1,000 3,000 5,000 7,000 9,000
Population (000s)
y = 0.0349x + 34.855R2 = 0.5358
Each dot correspondsto a sales territory
tory market share and sales growth is frequently not supported by data for newproducts or in very low-share territories. In fact, low-share products and territoriesoften do not grow as quickly as medium-share products and territories. This leadsto the conclusion that small market share does not always imply an immediategrowth opportunity. Low-share products and territories do not benefit from thepower of significant word of mouth among customers and prospects, which canaccelerate sales quickly. In addition, low share may signal a problem. A competitormay be very strong, with a large, loyal customer base. There may be low awarenessof the firm’s product or service. Or the low-share territory may have been servicedby a poor-performing salesperson who weakened customer goodwill. In any case,it takes time to realize the opportunity, and share gains will not be immediate.
Figure 9-17 shows the relationship between territory market share and sharegrowth for three different pharmaceutical products. The relationship varies de-pending upon the product and the situation. The relationship between these vari-ables tends not to be as strong statistically as the relationships between sales andpotential measures (as shown in Figures 9-13 through 9-16). Still, a relationshipoften exists, and plotting it can be very useful for understanding territory dynam-ics and setting realistic sales goals.
Measuring Territory Market Potential. Several of the analyses just discussedrequire data on territory market potential. In many industries, objective and accu-
PAGE 338................. 15869$ $CH9 05-19-06 09:24:31 PS
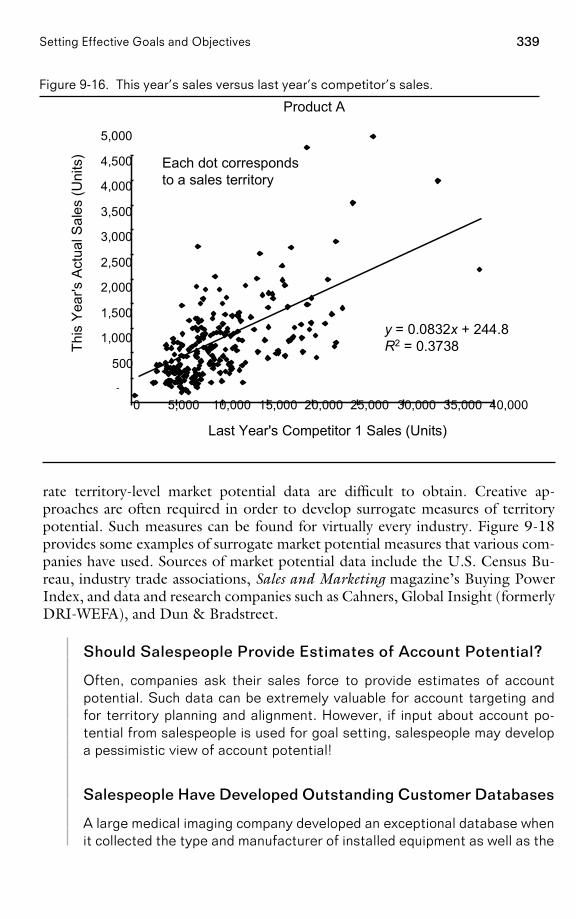
339Setting Effective Goals and Objectives
Figure 9-16. This year’s sales versus last year’s competitor’s sales.
Product A
y = 0.0832x + 244.8R2 = 0.3738
-
500
1,000
1,500
2,000
2,500
3,000
3,500
4,000
4,500
5,000
0 5,000 10,000 15,000 20,000 25,000 30,000 35,000 40,000
Last Year's Competitor 1 Sales (Units)
This
Yea
r's A
ctua
l Sal
es (U
nits
) Each dot correspondsto a sales territory
rate territory-level market potential data are difficult to obtain. Creative ap-proaches are often required in order to develop surrogate measures of territorypotential. Such measures can be found for virtually every industry. Figure 9-18provides some examples of surrogate market potential measures that various com-panies have used. Sources of market potential data include the U.S. Census Bu-reau, industry trade associations, Sales and Marketing magazine’s Buying PowerIndex, and data and research companies such as Cahners, Global Insight (formerlyDRI-WEFA), and Dun & Bradstreet.
Should Salespeople Provide Estimates of Account Potential?
Often, companies ask their sales force to provide estimates of accountpotential. Such data can be extremely valuable for account targeting andfor territory planning and alignment. However, if input about account po-tential from salespeople is used for goal setting, salespeople may developa pessimistic view of account potential!
Salespeople Have Developed Outstanding Customer Databases
A large medical imaging company developed an exceptional database whenit collected the type and manufacturer of installed equipment as well as the
PAGE 339................. 15869$ $CH9 05-19-06 09:24:33 PS
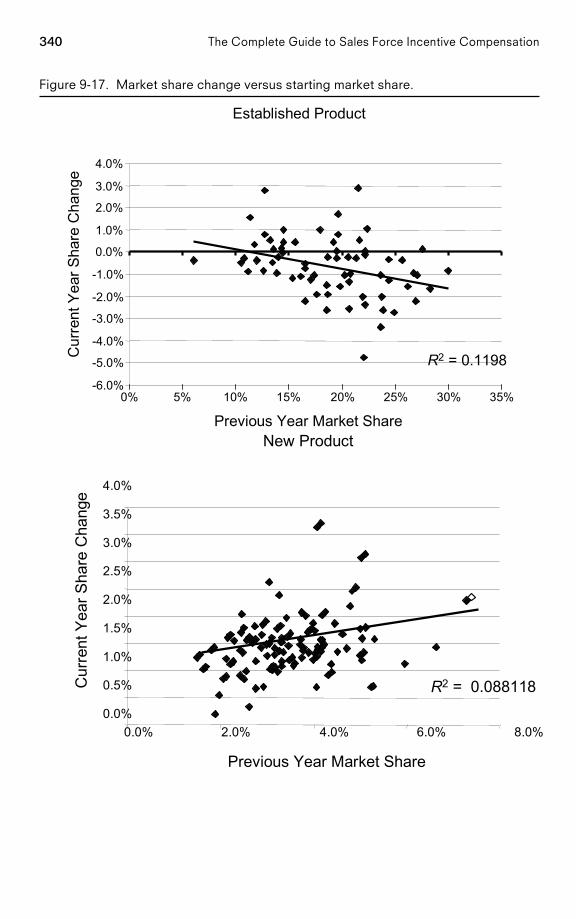
340 The Complete Guide to Sales Force Incentive Compensation
Figure 9-17. Market share change versus starting market share.
Established Product
Previous Year Market Share
-6.0%
-5.0%
-4.0%
-3.0%
-2.0%
-1.0%
0.0%
1.0%
2.0%
3.0%
4.0%
Cur
rent
Yea
r Sha
re C
hang
e
0% 5% 10% 15% 20% 25% 30% 35%
R2 = 0.1198
New Product
R2 = 0.088118 0.0%
0.5%
1.0%
1.5%
2.0%
2.5%
3.0%
3.5%
4.0%
0.0% 2.0% 4.0% 6.0% 8.0%
Previous Year Market Share
Cur
rent
Yea
r Sha
re C
hang
e
PAGE 340................. 15869$ $CH9 05-19-06 09:24:36 PS
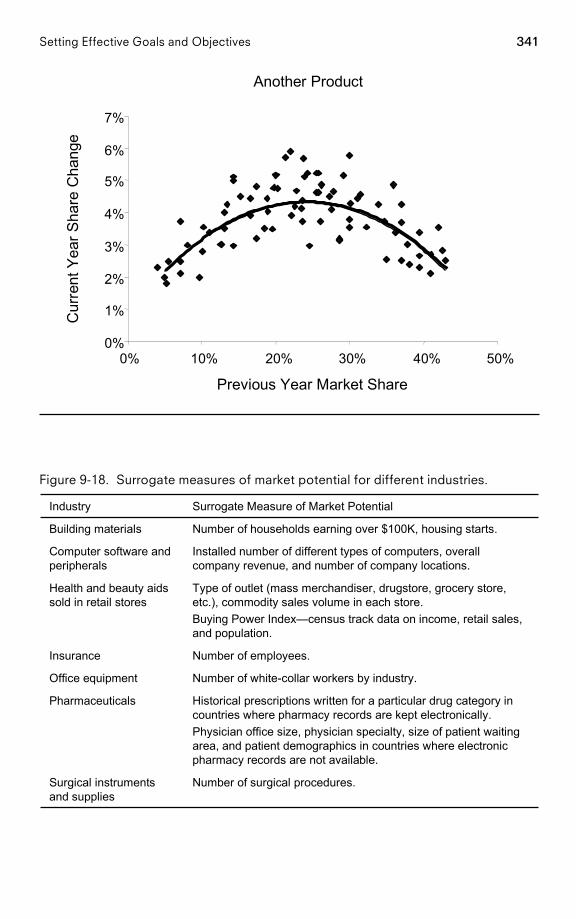
341Setting Effective Goals and Objectives
Another Product
0%
1%
2%
3%
4%
5%
6%
7%
0% 10% 20% 30% 40% 50%
Previous Year Market Share
Cur
rent
Yea
r Sha
re C
hang
e
Figure 9-18. Surrogate measures of market potential for different industries.
Number of surgical procedures.Surgical instrumentsand supplies
Historical prescriptions written for a particular drug category incountries where pharmacy records are kept electronically.Physician office size, physician specialty, size of patient waitingarea, and patient demographics in countries where electronicpharmacy records are not available.
Pharmaceuticals
Number of white-collar workers by industry.Office equipment
Number of employees.Insurance
Type of outlet (mass merchandiser, drugstore, grocery store,etc.), commodity sales volume in each store.Buying Power Index—census track data on income, retail sales,and population.
Health and beauty aidssold in retail stores
Installed number of different types of computers, overallcompany revenue, and number of company locations.
Computer software andperipherals
Number of households earning over $100K, housing starts.Building materials
Surrogate Measure of Market PotentialIndustry
PAGE 341................. 15869$ $CH9 05-19-06 09:24:38 PS
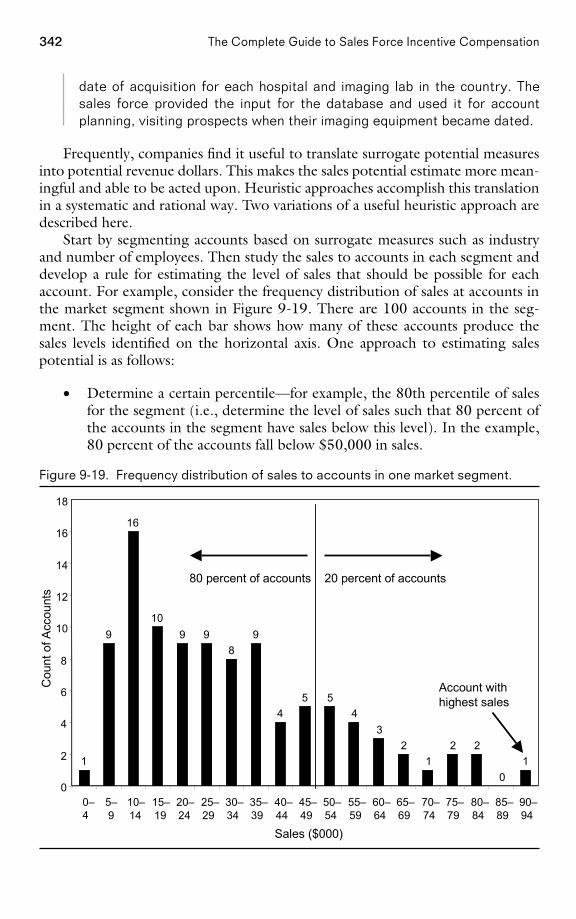
342 The Complete Guide to Sales Force Incentive Compensation
date of acquisition for each hospital and imaging lab in the country. Thesales force provided the input for the database and used it for accountplanning, visiting prospects when their imaging equipment became dated.
Frequently, companies find it useful to translate surrogate potential measuresinto potential revenue dollars. This makes the sales potential estimate more mean-ingful and able to be acted upon. Heuristic approaches accomplish this translationin a systematic and rational way. Two variations of a useful heuristic approach aredescribed here.
Start by segmenting accounts based on surrogate measures such as industryand number of employees. Then study the sales to accounts in each segment anddevelop a rule for estimating the level of sales that should be possible for eachaccount. For example, consider the frequency distribution of sales at accounts inthe market segment shown in Figure 9-19. There are 100 accounts in the seg-ment. The height of each bar shows how many of these accounts produce thesales levels identified on the horizontal axis. One approach to estimating salespotential is as follows:
• Determine a certain percentile—for example, the 80th percentile of salesfor the segment (i.e., determine the level of sales such that 80 percent ofthe accounts in the segment have sales below this level). In the example,80 percent of the accounts fall below $50,000 in sales.
Figure 9-19. Frequency distribution of sales to accounts in one market segment.
1
9
16
109 9
89
45 5
43
21
2 2
01
0
2
4
6
8
10
12
14
16
18
0–4
5–9
10–14
15–19
20–24
25–29
30–34
35–39
40–44
45–49
50–54
55–59
60–64
65–69
70–74
75–79
80–84
85–89
90–94
Sales ($000)
Cou
nt o
f Acc
ount
s
20 percent of accounts80 percent of accounts
Account with highest sales
PAGE 342................. 15869$ $CH9 05-19-06 09:24:39 PS
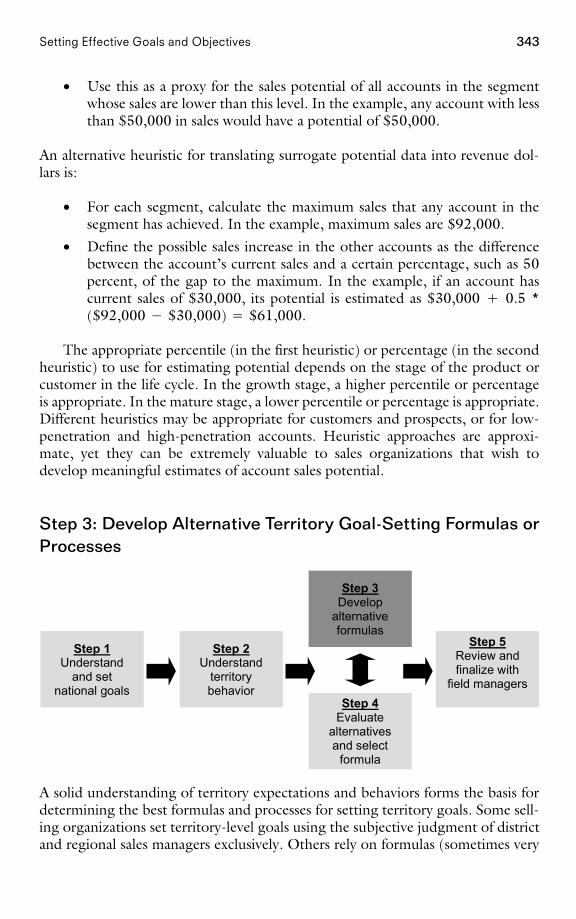
343Setting Effective Goals and Objectives
• Use this as a proxy for the sales potential of all accounts in the segmentwhose sales are lower than this level. In the example, any account with lessthan $50,000 in sales would have a potential of $50,000.
An alternative heuristic for translating surrogate potential data into revenue dol-lars is:
• For each segment, calculate the maximum sales that any account in thesegment has achieved. In the example, maximum sales are $92,000.
• Define the possible sales increase in the other accounts as the differencebetween the account’s current sales and a certain percentage, such as 50percent, of the gap to the maximum. In the example, if an account hascurrent sales of $30,000, its potential is estimated as $30,000 � 0.5 *($92,000 � $30,000) � $61,000.
The appropriate percentile (in the first heuristic) or percentage (in the secondheuristic) to use for estimating potential depends on the stage of the product orcustomer in the life cycle. In the growth stage, a higher percentile or percentageis appropriate. In the mature stage, a lower percentile or percentage is appropriate.Different heuristics may be appropriate for customers and prospects, or for low-penetration and high-penetration accounts. Heuristic approaches are approxi-mate, yet they can be extremely valuable to sales organizations that wish todevelop meaningful estimates of account sales potential.
Step 3: Develop Alternative Territory Goal-Setting Formulas orProcesses
Step 1Understand
and setnational goals
Step 2Understand
territorybehavior
Step 3Develop
alternativeformulas
Step 5Review andfinalize with
field managersStep 4
Evaluatealternativesand select
formula
A solid understanding of territory expectations and behaviors forms the basis fordetermining the best formulas and processes for setting territory goals. Some sell-ing organizations set territory-level goals using the subjective judgment of districtand regional sales managers exclusively. Others rely on formulas (sometimes very
PAGE 343................. 15869$ $CH9 05-19-06 09:24:40 PS
344 The Complete Guide to Sales Force Incentive Compensation
complex formulas) to set territory goals. The best goal-setting processes typicallyrely on a combination of both data analysis and sales force input, with the relativeimportance of each being determined by the firm’s selling situation and analyticalcapabilities, as well as the availability and accuracy of territory-level data.
Goal-setting formulas can be used successfully with most sales forces. Formu-las help to make the process objective, explicit, and fair. Salespeople are less likelyto feel that their goals are arbitrary. Sales managers are liberated from the hassleof developing and justifying territory goals. Even companies that rely completelyon the first-line sales manager’s discretion to set territory goals typically providesome guidelines. For example, managers may be told that each territory’s goalcannot be less than last year’s sales.
Goal-setting formulas are most effective when the sales force has many cus-tomers and transactions, and when history has a big impact on future sales. Inaddition, formulas require the company to have or acquire accurate and reliableterritory-level data. Sales forces that do not meet these criteria will need to relymore extensively on sales force input in their goal-setting processes.
Various goal-setting formulas and processes have been developed and arebeing used by companies. Several recommended approaches are presented here.These approaches are organized into four categories. The first three categoriescontain formula-based approaches, which are organized according to their datarequirements and complexity. The first category includes some basic methodsthat require only accurate historical territory-level sales data, the second categoryincludes some more sophisticated formulas that also require territory-level poten-tial data, and the third category includes the most complex approach, which alsorequires territory-level sales force effort or call data. The final category includes abottom-up method of goal setting that is appropriate for situations where histori-cal data are not a good predictor of future performance. The description of eachapproach includes an example that shows how to perform the necessary calcula-tions.
The Simplicity Versus Fairness Trade-Off in Goal Setting
With formula-based goal-setting approaches, there is an inherent trade-offbetween fairness and simplicity. Simpler methods are easier to implementand to explain to salespeople, but they tend to be less fair to the salesforce. More complex methods tend to be fairer, but often are data inten-sive, involve complex calculations, and are hard to explain to salespeople.Each selling organization needs to find its own appropriate balance.
Formula-Based Territory Goal-Setting Approaches Based on Historical Sales.Two methods of territory goal setting require only historical territory sales data:the maintenance plus standard growth method and the territory forecast method.
Maintenance Plus Standard Growth Method. The maintenance plus standardgrowth method is a commonly used goal-allocation formula. As illustrated in Fig-
PAGE 344................. 15869$ $CH9 05-19-06 09:24:40 PS
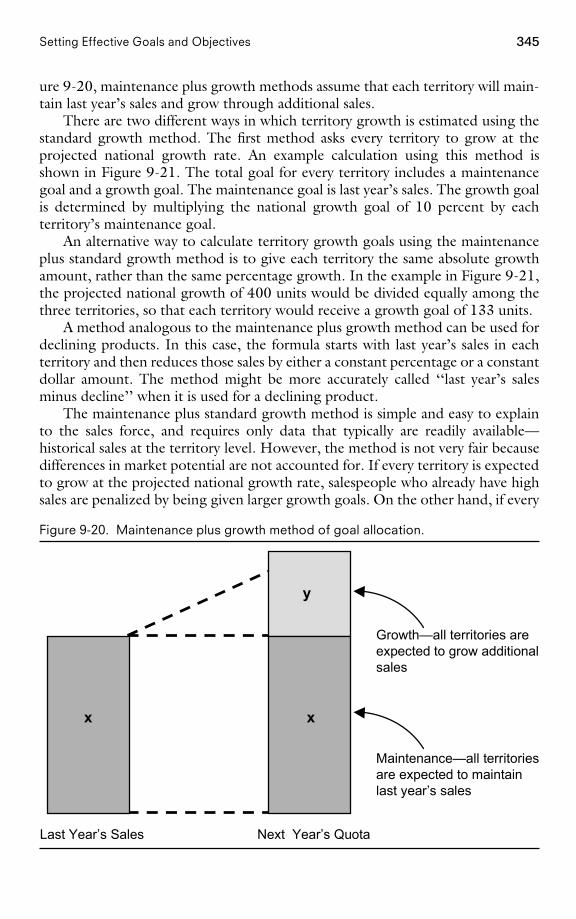
345Setting Effective Goals and Objectives
ure 9-20, maintenance plus growth methods assume that each territory will main-tain last year’s sales and grow through additional sales.
There are two different ways in which territory growth is estimated using thestandard growth method. The first method asks every territory to grow at theprojected national growth rate. An example calculation using this method isshown in Figure 9-21. The total goal for every territory includes a maintenancegoal and a growth goal. The maintenance goal is last year’s sales. The growth goalis determined by multiplying the national growth goal of 10 percent by eachterritory’s maintenance goal.
An alternative way to calculate territory growth goals using the maintenanceplus standard growth method is to give each territory the same absolute growthamount, rather than the same percentage growth. In the example in Figure 9-21,the projected national growth of 400 units would be divided equally among thethree territories, so that each territory would receive a growth goal of 133 units.
A method analogous to the maintenance plus growth method can be used fordeclining products. In this case, the formula starts with last year’s sales in eachterritory and then reduces those sales by either a constant percentage or a constantdollar amount. The method might be more accurately called ‘‘last year’s salesminus decline’’ when it is used for a declining product.
The maintenance plus standard growth method is simple and easy to explainto the sales force, and requires only data that typically are readily available—historical sales at the territory level. However, the method is not very fair becausedifferences in market potential are not accounted for. If every territory is expectedto grow at the projected national growth rate, salespeople who already have highsales are penalized by being given larger growth goals. On the other hand, if every
Figure 9-20. Maintenance plus growth method of goal allocation.
x
y
x
Last Year’s Sales Next Year’s Quota
Growth—all territories areexpected to grow additionalsales
Maintenance—all territoriesare expected to maintainlast year’s sales
PAGE 345................. 15869$ $CH9 05-19-06 09:24:41 PS
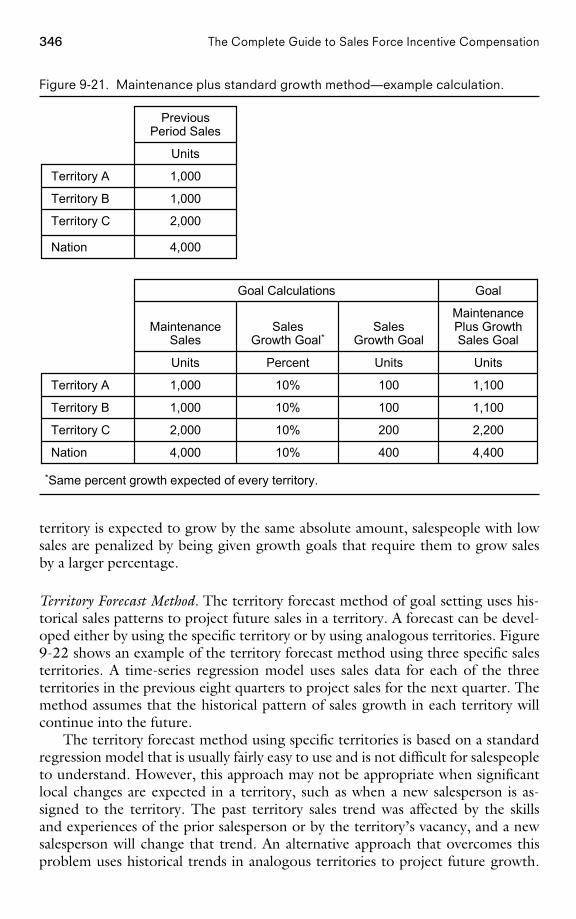
346 The Complete Guide to Sales Force Incentive Compensation
Figure 9-21. Maintenance plus standard growth method—example calculation.
4,000Nation
2,000Territory C
1,000Territory B
1,000Territory A
Units
PreviousPeriod Sales
4,40040010%4,000Nation
2,20020010%2,000Territory C
1,10010010%1,000Territory B
1,10010010%1,000Territory A
UnitsUnitsPercentUnits
MaintenancePlus GrowthSales Goal
SalesGrowth Goal
SalesGrowth Goal*
MaintenanceSales
GoalGoal Calculations
*Same percent growth expected of every territory.
territory is expected to grow by the same absolute amount, salespeople with lowsales are penalized by being given growth goals that require them to grow salesby a larger percentage.
Territory Forecast Method. The territory forecast method of goal setting uses his-torical sales patterns to project future sales in a territory. A forecast can be devel-oped either by using the specific territory or by using analogous territories. Figure9-22 shows an example of the territory forecast method using three specific salesterritories. A time-series regression model uses sales data for each of the threeterritories in the previous eight quarters to project sales for the next quarter. Themethod assumes that the historical pattern of sales growth in each territory willcontinue into the future.
The territory forecast method using specific territories is based on a standardregression model that is usually fairly easy to use and is not difficult for salespeopleto understand. However, this approach may not be appropriate when significantlocal changes are expected in a territory, such as when a new salesperson is as-signed to the territory. The past territory sales trend was affected by the skillsand experiences of the prior salesperson or by the territory’s vacancy, and a newsalesperson will change that trend. An alternative approach that overcomes thisproblem uses historical trends in analogous territories to project future growth.
PAGE 346
................. 15869$ $CH9 05-19-06 09:24:42 PS
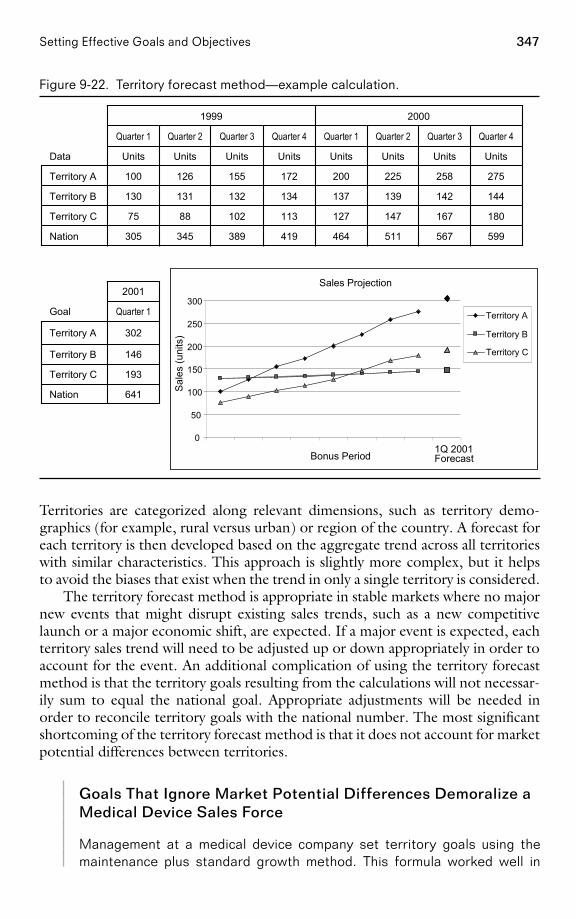
347Setting Effective Goals and Objectives
Figure 9-22. Territory forecast method—example calculation.
599567511464419389345305Nation
1801671471271131028875Territory C
144142139137134132131130Territory B
275258225200172155126100Territory A
UnitsUnitsUnitsUnitsUnitsUnitsUnitsUnitsData
Quarter 4Quarter 3Quarter 2Quarter 1Quarter 4Quarter 3Quarter 2Quarter 1
20001999
641Nation
193Territory C
146Territory B
302Territory A
Quarter 1Goal
2001Sales Projection
0
50
100
150
200
250
300
Bonus Period
Sal
es (u
nits
)
Territory A
Territory B
Territory C
1Q 2001 Forecast
Territories are categorized along relevant dimensions, such as territory demo-graphics (for example, rural versus urban) or region of the country. A forecast foreach territory is then developed based on the aggregate trend across all territorieswith similar characteristics. This approach is slightly more complex, but it helpsto avoid the biases that exist when the trend in only a single territory is considered.
The territory forecast method is appropriate in stable markets where no majornew events that might disrupt existing sales trends, such as a new competitivelaunch or a major economic shift, are expected. If a major event is expected, eachterritory sales trend will need to be adjusted up or down appropriately in order toaccount for the event. An additional complication of using the territory forecastmethod is that the territory goals resulting from the calculations will not necessar-ily sum to equal the national goal. Appropriate adjustments will be needed inorder to reconcile territory goals with the national number. The most significantshortcoming of the territory forecast method is that it does not account for marketpotential differences between territories.
Goals That Ignore Market Potential Differences Demoralize aMedical Device Sales Force
Management at a medical device company set territory goals using themaintenance plus standard growth method. This formula worked well in
PAGE 347
................. 15869$ $CH9 05-19-06 09:24:43 PS
348 The Complete Guide to Sales Force Incentive Compensation
the firm’s early years, when markets were growing and there was limitedcompetition. However, as market growth slowed and competition intensi-fied, salespeople in low-potential territories began to feel that their goalswere unfair, since market potential differences across territories were notaccounted for. To make things worse, management underestimated the im-pact of increased competition and set a national goal that was approxi-mately 10 percent too high. About 75 percent of salespeople did not makegoal that year, and the sales force was extremely frustrated and demoral-ized. One salesperson complained, ‘‘Management set goals simply accord-ing to their desired growth . . . those goals did not reflect the reality ofmarket conditions.’’
Formula-Based Territory Goal-Setting Methods Based on Historical Sales andMarket Potential. Territory goal-setting methods can be improved if data measur-ing territory market potential are available. Ideas on how to obtain measures ofpotential to project demand at the individual sales territory level are discussedearlier in this chapter.
Several methods for territory goal setting analyze data on historical sales andmarket potential to develop more realistic territory goals. These methods includethe maintenance plus adjusted growth method, the weighted index method, theregression method, the performance frontier method, the share growth method,and the percent of remaining share method.
Maintenance Plus Adjusted Growth Method. The maintenance plus adjustedgrowth method is a more sophisticated implementation of the maintenance plusstandard growth method illustrated in Figure 9-20. In the standard growth ap-proach described in the prior section, every territory gets the same percentagegrowth or sales or unit growth goal. With the adjusted growth method, everyterritory gets a unique growth goal that is based on the amount of market poten-tial in the territory that has not yet been penetrated. Thus, the territories with thelowest market share receive the largest growth goals, while those that have alreadybeen highly penetrated receive smaller growth goals. This method improves uponthe standard growth method because it accounts for differences in territory oppor-tunity. However, as described earlier in this chapter, empirical data do not alwayssupport the assertion that it is easier to grow sales in very-low-share territories.
An example of how goals are calculated using the maintenance plus adjustedgrowth method is shown in Figure 9-23. In this example, a national growth goalof 10 percent is allocated across the territories. The maintenance goal for eachterritory replicates last year’s sales. The growth goal for each territory is allocatedbased on each territory’s percentage of national unpenetrated market (unpene-trated market equals previous period market sales minus previous period productsales). An alternative and slightly simpler approach to this method allocates thegrowth goal for each territory based on each territory’s percentage of nationalmarket potential.
PAGE 348................. 15869$ $CH9 05-19-06 09:24:44 PS
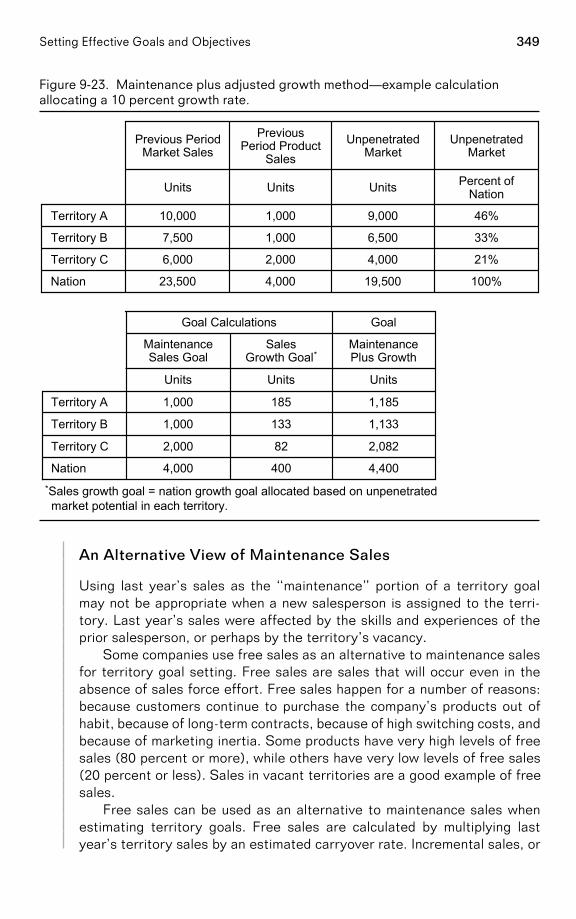
349Setting Effective Goals and Objectives
Figure 9-23. Maintenance plus adjusted growth method—example calculationallocating a 10 percent growth rate.
GoalGoal Calculations
4,4004004,000Nation
2,082822,000Territory C
1,1331331,000Territory B
1,1851851,000Territory A
UnitsUnitsUnits
MaintenancePlus Growth
SalesGrowth Goal*
MaintenanceSales Goal
100%19,5004,00023,500Nation
21%4,0002,0006,000Territory C
33%6,5001,0007,500Territory B
46%9,0001,00010,000Territory A
Percent ofNationUnitsUnitsUnits
UnpenetratedMarket
UnpenetratedMarket
PreviousPeriod Product
SalesPrevious Period
Market Sales
*Sales growth goal = nation growth goal allocated based on unpenetratedmarket potential in each territory.
An Alternative View of Maintenance Sales
Using last year’s sales as the ‘‘maintenance’’ portion of a territory goalmay not be appropriate when a new salesperson is assigned to the terri-tory. Last year’s sales were affected by the skills and experiences of theprior salesperson, or perhaps by the territory’s vacancy.
Some companies use free sales as an alternative to maintenance salesfor territory goal setting. Free sales are sales that will occur even in theabsence of sales force effort. Free sales happen for a number of reasons:because customers continue to purchase the company’s products out ofhabit, because of long-term contracts, because of high switching costs, andbecause of marketing inertia. Some products have very high levels of freesales (80 percent or more), while others have very low levels of free sales(20 percent or less). Sales in vacant territories are a good example of freesales.
Free sales can be used as an alternative to maintenance sales whenestimating territory goals. Free sales are calculated by multiplying lastyear’s territory sales by an estimated carryover rate. Incremental sales, or
PAGE 349................. 15869$ $CH9 05-19-06 09:24:45 PS
350 The Complete Guide to Sales Force Incentive Compensation
salesperson sales, are those sales that require sales force effort, and theyare allocated to each territory based on potential or other relevant territoryand salesperson factors.
Free sales are an especially good estimate of maintenance sales indeclining markets. They provide a baseline, and the incremental goal abovebaseline can be allocated based on territory market potential.
Pharmaceutical Sales Force Uses Carryover Rates to ImproveTerritory Goal Setting
Management at a pharmaceutical firm recognized that its products had highfree sales and that many sales would be realized regardless of current salesforce effort. The firm devised a territory goal-setting formula that ac-counted for this carryover. Through data analysis and management input,product-specific carryover rates were established. Drugs that treat acuteconditions and are generally taken by patients for a short period, such asantibiotics and antihistamines, had lower carryover rates. Drugs that treatchronic conditions and are generally taken by patients for a longer period,such as high-blood-pressure medications and treatments for Alzheimer’sdisease, had higher carryover rates. To set territory goals, first, carryoversales were calculated for each product in each territory by multiplying lastyear’s territory sales times the estimated carryover rate. Next, incrementalsales, or those sales that require sales force effort to obtain (equal to thisyear’s forecast minus last year’s sales times the carryover rate), were allo-cated to each territory based on potential or other relevant territory andsalesperson factors.
At first, the new goal-setting plan was quite effective. Territory goalswere more fair and equitable across the sales force. However, over time,as salespeople began to understand the nuances of the allocation formula,some of the firm’s best salespeople devised a way to use the formula totheir advantage. The salespeople with the largest-volume territories andhigh market share recognized that they would benefit if carryover rateswere reduced. With a lower carryover rate, each high-volume, high-market-share territory would get a proportionately smaller goal, while historicallylow-volume territories with low market share would get proportionatelyhigher goals. Thus, salespeople in high-volume territories, who had signifi-cant power with management as a result of the large volume of businessthey controlled, negotiated with management for lower carryover rates.Eventually, they were successful at negotiating carryover rates down tounrealistic levels, which resulted in goals that were too easy for sales-people in high-volume territories and too challenging for salespeople in low-volume territories. After several years, the carryover-based goal-settingscheme was scrapped and replaced.
Authors’ note: Rather than scrapping the plan, the firm could have tried
PAGE 350................. 15869$ $CH9 05-19-06 09:24:45 PS
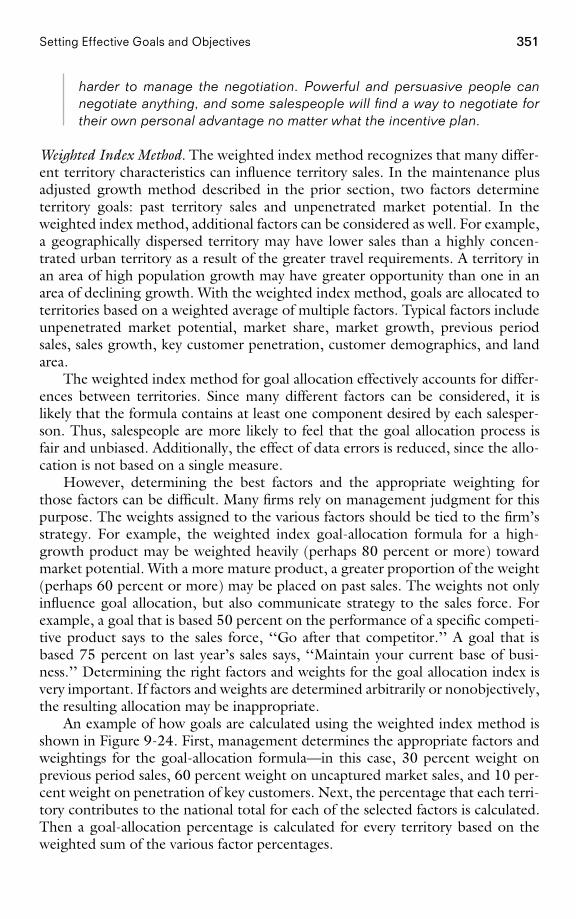
351Setting Effective Goals and Objectives
harder to manage the negotiation. Powerful and persuasive people cannegotiate anything, and some salespeople will find a way to negotiate fortheir own personal advantage no matter what the incentive plan.
Weighted Index Method. The weighted index method recognizes that many differ-ent territory characteristics can influence territory sales. In the maintenance plusadjusted growth method described in the prior section, two factors determineterritory goals: past territory sales and unpenetrated market potential. In theweighted index method, additional factors can be considered as well. For example,a geographically dispersed territory may have lower sales than a highly concen-trated urban territory as a result of the greater travel requirements. A territory inan area of high population growth may have greater opportunity than one in anarea of declining growth. With the weighted index method, goals are allocated toterritories based on a weighted average of multiple factors. Typical factors includeunpenetrated market potential, market share, market growth, previous periodsales, sales growth, key customer penetration, customer demographics, and landarea.
The weighted index method for goal allocation effectively accounts for differ-ences between territories. Since many different factors can be considered, it islikely that the formula contains at least one component desired by each salesper-son. Thus, salespeople are more likely to feel that the goal allocation process isfair and unbiased. Additionally, the effect of data errors is reduced, since the allo-cation is not based on a single measure.
However, determining the best factors and the appropriate weighting forthose factors can be difficult. Many firms rely on management judgment for thispurpose. The weights assigned to the various factors should be tied to the firm’sstrategy. For example, the weighted index goal-allocation formula for a high-growth product may be weighted heavily (perhaps 80 percent or more) towardmarket potential. With a more mature product, a greater proportion of the weight(perhaps 60 percent or more) may be placed on past sales. The weights not onlyinfluence goal allocation, but also communicate strategy to the sales force. Forexample, a goal that is based 50 percent on the performance of a specific competi-tive product says to the sales force, ‘‘Go after that competitor.’’ A goal that isbased 75 percent on last year’s sales says, ‘‘Maintain your current base of busi-ness.’’ Determining the right factors and weights for the goal allocation index isvery important. If factors and weights are determined arbitrarily or nonobjectively,the resulting allocation may be inappropriate.
An example of how goals are calculated using the weighted index method isshown in Figure 9-24. First, management determines the appropriate factors andweightings for the goal-allocation formula—in this case, 30 percent weight onprevious period sales, 60 percent weight on uncaptured market sales, and 10 per-cent weight on penetration of key customers. Next, the percentage that each terri-tory contributes to the national total for each of the selected factors is calculated.Then a goal-allocation percentage is calculated for every territory based on theweighted sum of the various factor percentages.
PAGE 351................. 15869$ $CH9 05-19-06 09:24:46 PS
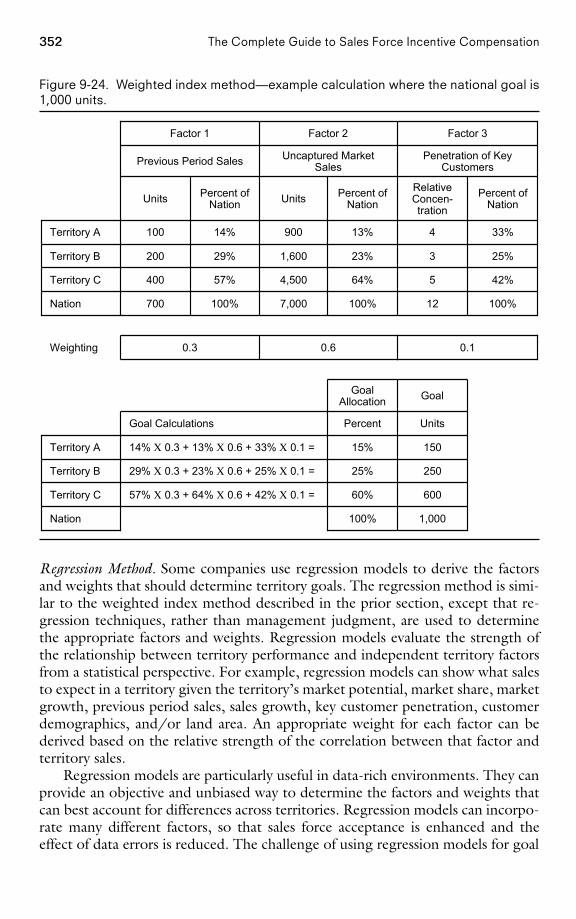
352 The Complete Guide to Sales Force Incentive Compensation
Figure 9-24. Weighted index method—example calculation where the national goal is1,000 units.
1,000100%Nation
60060%57% Χ 0.3 + 64% Χ 0.6 + 42% Χ 0.1 =Territory C
25025%29% Χ 0.3 + 23% Χ 0.6 + 25% Χ 0.1 =Territory B
15015%14% Χ 0.3 + 13% Χ 0.6 + 33% Χ 0.1 =Territory A
UnitsPercentGoal Calculations
GoalGoalAllocation
0.10.60.3Weighting
100%12100%7,000100%700Nation
42%564%4,50057%400Territory C
25%323%1,60029%200Territory B
33%413%90014%100Territory A
Percent ofNation
RelativeConcen-tration
Percent ofNationUnitsPercent of
NationUnits
Penetration of KeyCustomers
Uncaptured MarketSalesPrevious Period Sales
Factor 3Factor 2Factor 1
Regression Method. Some companies use regression models to derive the factorsand weights that should determine territory goals. The regression method is simi-lar to the weighted index method described in the prior section, except that re-gression techniques, rather than management judgment, are used to determinethe appropriate factors and weights. Regression models evaluate the strength ofthe relationship between territory performance and independent territory factorsfrom a statistical perspective. For example, regression models can show what salesto expect in a territory given the territory’s market potential, market share, marketgrowth, previous period sales, sales growth, key customer penetration, customerdemographics, and/or land area. An appropriate weight for each factor can bederived based on the relative strength of the correlation between that factor andterritory sales.
Regression models are particularly useful in data-rich environments. They canprovide an objective and unbiased way to determine the factors and weights thatcan best account for differences across territories. Regression models can incorpo-rate many different factors, so that sales force acceptance is enhanced and theeffect of data errors is reduced. The challenge of using regression models for goal
PAGE 352................. 15869$ $CH9 05-19-06 09:24:47 PS
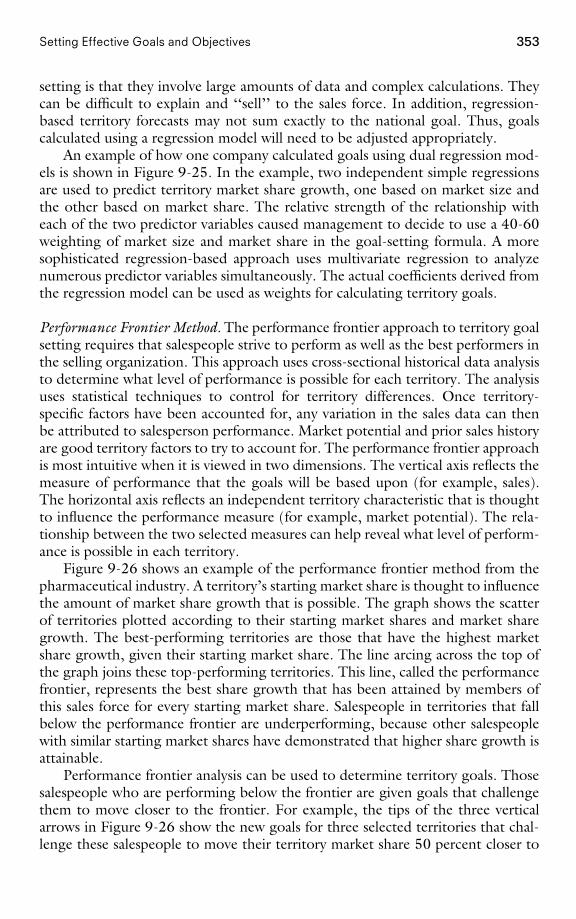
353Setting Effective Goals and Objectives
setting is that they involve large amounts of data and complex calculations. Theycan be difficult to explain and ‘‘sell’’ to the sales force. In addition, regression-based territory forecasts may not sum exactly to the national goal. Thus, goalscalculated using a regression model will need to be adjusted appropriately.
An example of how one company calculated goals using dual regression mod-els is shown in Figure 9-25. In the example, two independent simple regressionsare used to predict territory market share growth, one based on market size andthe other based on market share. The relative strength of the relationship witheach of the two predictor variables caused management to decide to use a 40-60weighting of market size and market share in the goal-setting formula. A moresophisticated regression-based approach uses multivariate regression to analyzenumerous predictor variables simultaneously. The actual coefficients derived fromthe regression model can be used as weights for calculating territory goals.
Performance Frontier Method. The performance frontier approach to territory goalsetting requires that salespeople strive to perform as well as the best performers inthe selling organization. This approach uses cross-sectional historical data analysisto determine what level of performance is possible for each territory. The analysisuses statistical techniques to control for territory differences. Once territory-specific factors have been accounted for, any variation in the sales data can thenbe attributed to salesperson performance. Market potential and prior sales historyare good territory factors to try to account for. The performance frontier approachis most intuitive when it is viewed in two dimensions. The vertical axis reflects themeasure of performance that the goals will be based upon (for example, sales).The horizontal axis reflects an independent territory characteristic that is thoughtto influence the performance measure (for example, market potential). The rela-tionship between the two selected measures can help reveal what level of perform-ance is possible in each territory.
Figure 9-26 shows an example of the performance frontier method from thepharmaceutical industry. A territory’s starting market share is thought to influencethe amount of market share growth that is possible. The graph shows the scatterof territories plotted according to their starting market shares and market sharegrowth. The best-performing territories are those that have the highest marketshare growth, given their starting market share. The line arcing across the top ofthe graph joins these top-performing territories. This line, called the performancefrontier, represents the best share growth that has been attained by members ofthis sales force for every starting market share. Salespeople in territories that fallbelow the performance frontier are underperforming, because other salespeoplewith similar starting market shares have demonstrated that higher share growth isattainable.
Performance frontier analysis can be used to determine territory goals. Thosesalespeople who are performing below the frontier are given goals that challengethem to move closer to the frontier. For example, the tips of the three verticalarrows in Figure 9-26 show the new goals for three selected territories that chal-lenge these salespeople to move their territory market share 50 percent closer to
PAGE 353................. 15869$ $CH9 05-19-06 09:24:48 PS
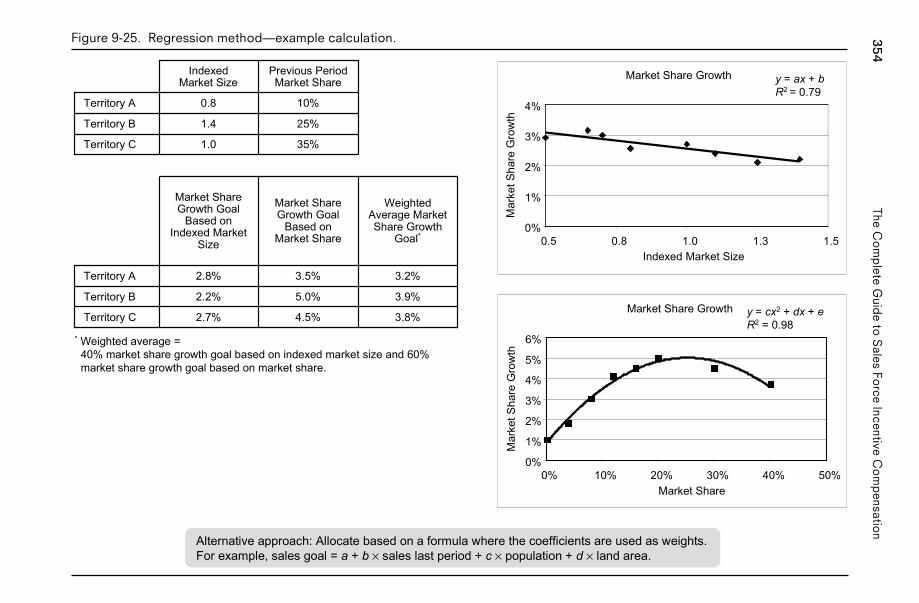
354The
Co
mp
leteG
uide
toS
alesFo
rceIncentive
Co
mp
ensation
Figure 9-25. Regression method—example calculation.
* Weighted average =40% market share growth goal based on indexed market size and 60%market share growth goal based on market share.
Market Share Growth y = ax + bR2 = 0.79
0%
1%
2%
3%
4%
0.5 0.8 1.0 1.3 1.5Indexed Market Size
Mar
ket S
hare
Gro
wth
3.8%4.5%2.7%Territory C
3.9%5.0%2.2%Territory B
3.2%3.5%2.8%Territory A
WeightedAverage MarketShare Growth
Goal*
Market ShareGrowth Goal
Based onMarket Share
Market ShareGrowth Goal
Based onIndexed Market
Size
35%1.0Territory C
25%1.4Territory B
10%0.8Territory A
Previous PeriodMarket Share
IndexedMarket Size
Market Share Growth
0%
1%
2%
3%
4%
5%
6%
0% 10% 20% 30% 40% 50%Market Share
Mar
ket S
hare
Gro
wth
y = cx2 + dx + eR2 = 0.98
Alternative approach: Allocate based on a formula where the coefficients are used as weights.For example, sales goal = a + b × sales last period + c × population + d × land area.
PA
GE
354.................15869$
$CH
905-19-06
09:24:49P
S
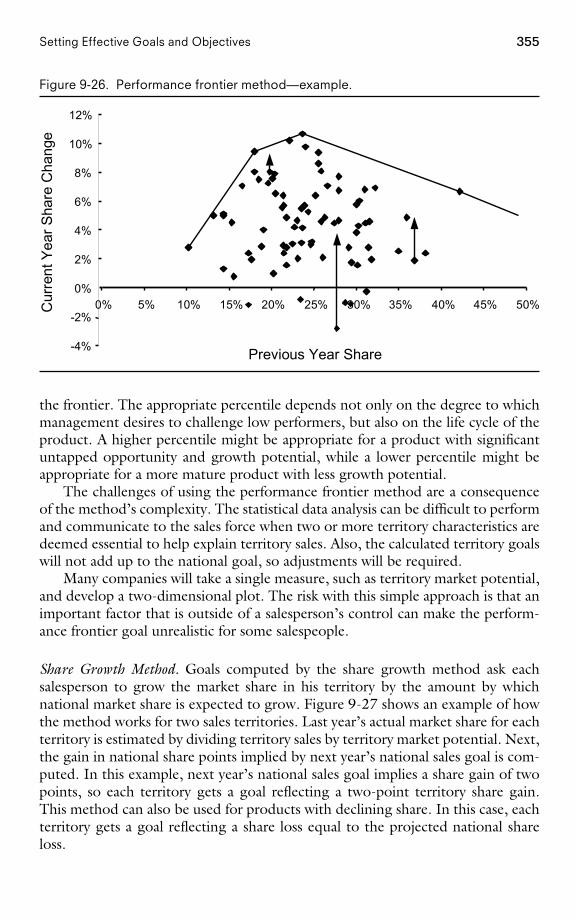
355Setting Effective Goals and Objectives
Figure 9-26. Performance frontier method—example.
-4%
-2%
0%
2%
4%
6%
8%
10%
12%
0% 5% 10% 15% 20% 25% 30% 35% 40% 45% 50%
Previous Year Share
Cur
rent
Yea
r Sha
re C
hang
e
the frontier. The appropriate percentile depends not only on the degree to whichmanagement desires to challenge low performers, but also on the life cycle of theproduct. A higher percentile might be appropriate for a product with significantuntapped opportunity and growth potential, while a lower percentile might beappropriate for a more mature product with less growth potential.
The challenges of using the performance frontier method are a consequenceof the method’s complexity. The statistical data analysis can be difficult to performand communicate to the sales force when two or more territory characteristics aredeemed essential to help explain territory sales. Also, the calculated territory goalswill not add up to the national goal, so adjustments will be required.
Many companies will take a single measure, such as territory market potential,and develop a two-dimensional plot. The risk with this simple approach is that animportant factor that is outside of a salesperson’s control can make the perform-ance frontier goal unrealistic for some salespeople.
Share Growth Method. Goals computed by the share growth method ask eachsalesperson to grow the market share in his territory by the amount by whichnational market share is expected to grow. Figure 9-27 shows an example of howthe method works for two sales territories. Last year’s actual market share for eachterritory is estimated by dividing territory sales by territory market potential. Next,the gain in national share points implied by next year’s national sales goal is com-puted. In this example, next year’s national sales goal implies a share gain of twopoints, so each territory gets a goal reflecting a two-point territory share gain.This method can also be used for products with declining share. In this case, eachterritory gets a goal reflecting a share loss equal to the projected national shareloss.
PAGE 355................. 15869$ $CH9 05-19-06 09:24:50 PS
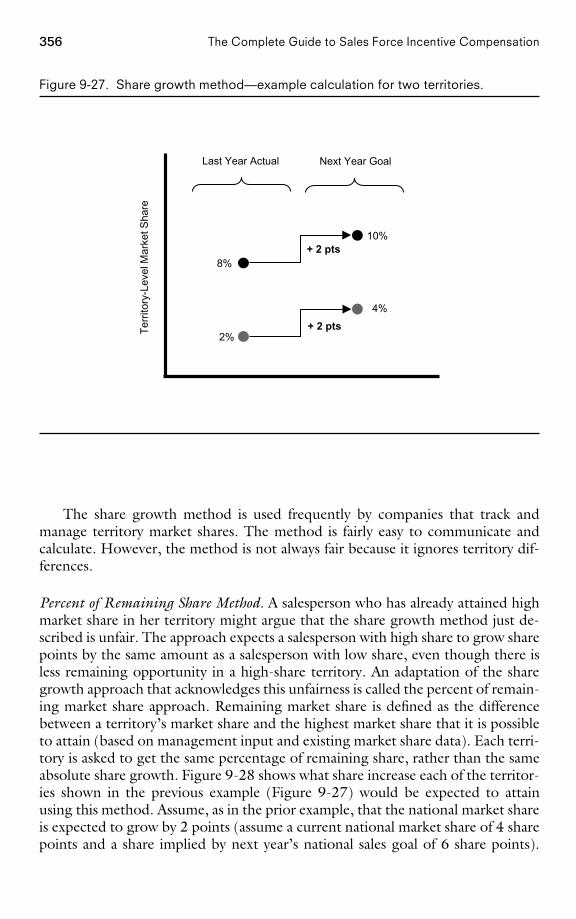
356 The Complete Guide to Sales Force Incentive Compensation
Figure 9-27. Share growth method—example calculation for two territories.
Terr
itory
-Lev
el M
arke
t Sha
re
Last Year Actual Next Year Goal
8%
2%
10%
4%
+ 2 pts
+ 2 pts
The share growth method is used frequently by companies that track andmanage territory market shares. The method is fairly easy to communicate andcalculate. However, the method is not always fair because it ignores territory dif-ferences.
Percent of Remaining Share Method. A salesperson who has already attained highmarket share in her territory might argue that the share growth method just de-scribed is unfair. The approach expects a salesperson with high share to grow sharepoints by the same amount as a salesperson with low share, even though there isless remaining opportunity in a high-share territory. An adaptation of the sharegrowth approach that acknowledges this unfairness is called the percent of remain-ing market share approach. Remaining market share is defined as the differencebetween a territory’s market share and the highest market share that it is possibleto attain (based on management input and existing market share data). Each terri-tory is asked to get the same percentage of remaining share, rather than the sameabsolute share growth. Figure 9-28 shows what share increase each of the territor-ies shown in the previous example (Figure 9-27) would be expected to attainusing this method. Assume, as in the prior example, that the national market shareis expected to grow by 2 points (assume a current national market share of 4 sharepoints and a share implied by next year’s national sales goal of 6 share points).
PAGE 356................. 15869$ $CH9 05-19-06 09:24:52 PS
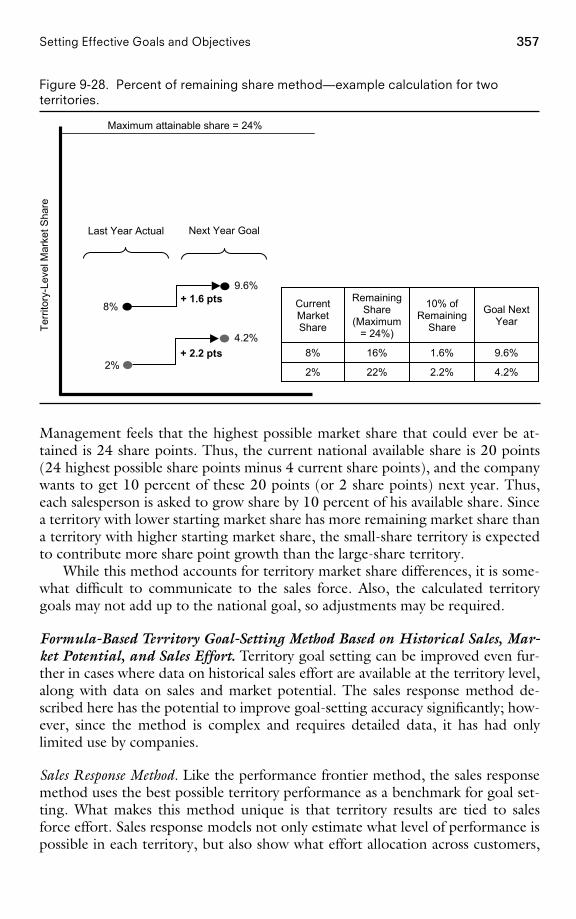
357Setting Effective Goals and Objectives
Figure 9-28. Percent of remaining share method—example calculation for twoterritories.
Terr
itory
-Lev
el M
arke
t Sha
re
Last Year Actual Next Year Goal
8%
2%
9.6%
4.2%+ 2.2 pts
+ 1.6 pts
Maximum attainable share = 24%
4.2%2.2%22%2%
9.6%1.6%16%8%
Goal NextYear
10% ofRemaining
Share
RemainingShare
(Maximum= 24%)
CurrentMarketShare
Management feels that the highest possible market share that could ever be at-tained is 24 share points. Thus, the current national available share is 20 points(24 highest possible share points minus 4 current share points), and the companywants to get 10 percent of these 20 points (or 2 share points) next year. Thus,each salesperson is asked to grow share by 10 percent of his available share. Sincea territory with lower starting market share has more remaining market share thana territory with higher starting market share, the small-share territory is expectedto contribute more share point growth than the large-share territory.
While this method accounts for territory market share differences, it is some-what difficult to communicate to the sales force. Also, the calculated territorygoals may not add up to the national goal, so adjustments may be required.
Formula-Based Territory Goal-Setting Method Based on Historical Sales, Mar-ket Potential, and Sales Effort. Territory goal setting can be improved even fur-ther in cases where data on historical sales effort are available at the territory level,along with data on sales and market potential. The sales response method de-scribed here has the potential to improve goal-setting accuracy significantly; how-ever, since the method is complex and requires detailed data, it has had onlylimited use by companies.
Sales Response Method. Like the performance frontier method, the sales responsemethod uses the best possible territory performance as a benchmark for goal set-ting. What makes this method unique is that territory results are tied to salesforce effort. Sales response models not only estimate what level of performance ispossible in each territory, but also show what effort allocation across customers,
PAGE 357................. 15869$ $CH9 05-19-06 09:24:54 PS
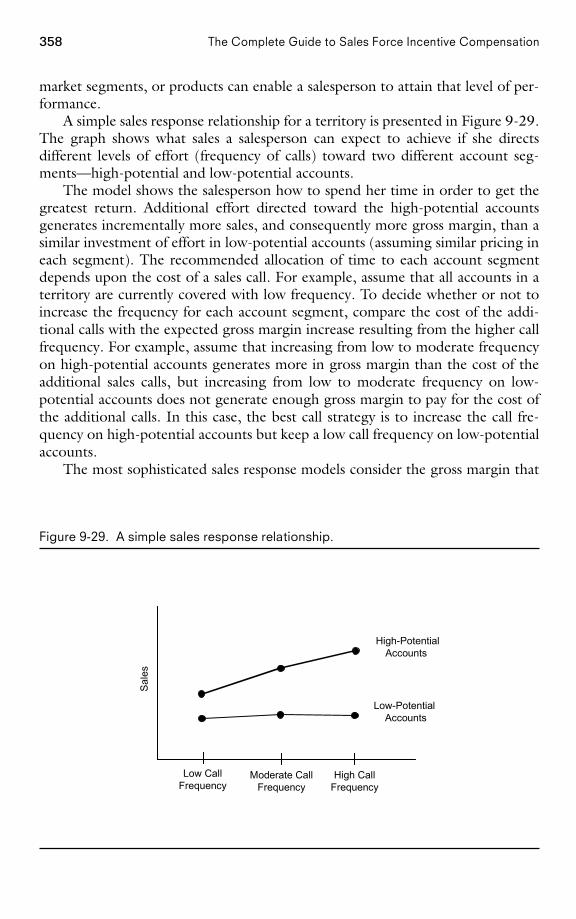
358 The Complete Guide to Sales Force Incentive Compensation
market segments, or products can enable a salesperson to attain that level of per-formance.
A simple sales response relationship for a territory is presented in Figure 9-29.The graph shows what sales a salesperson can expect to achieve if she directsdifferent levels of effort (frequency of calls) toward two different account seg-ments—high-potential and low-potential accounts.
The model shows the salesperson how to spend her time in order to get thegreatest return. Additional effort directed toward the high-potential accountsgenerates incrementally more sales, and consequently more gross margin, than asimilar investment of effort in low-potential accounts (assuming similar pricing ineach segment). The recommended allocation of time to each account segmentdepends upon the cost of a sales call. For example, assume that all accounts in aterritory are currently covered with low frequency. To decide whether or not toincrease the frequency for each account segment, compare the cost of the addi-tional calls with the expected gross margin increase resulting from the higher callfrequency. For example, assume that increasing from low to moderate frequencyon high-potential accounts generates more in gross margin than the cost of theadditional sales calls, but increasing from low to moderate frequency on low-potential accounts does not generate enough gross margin to pay for the cost ofthe additional calls. In this case, the best call strategy is to increase the call fre-quency on high-potential accounts but keep a low call frequency on low-potentialaccounts.
The most sophisticated sales response models consider the gross margin that
Figure 9-29. A simple sales response relationship.
Sale
s
Low CallFrequency
Moderate CallFrequency
High CallFrequency
Low-Potential Accounts
High-PotentialAccounts
PAGE 358................. 15869$ $CH9 05-19-06 09:24:55 PS
359Setting Effective Goals and Objectives
sales calls generate not only this year, but also in future years. Many selling situa-tions have significant carryover—some sales generated this year will be retained infuture years, without additional sales force effort. Considering the long-term im-pact of sales calls makes it attractive to call on more customers with greater fre-quency than when only the current-year impact is considered.
Sales response models predict what sales are achievable if a salesperson spendshis time in the smartest possible way. The goals that result from the analysis aretruly stretch goals—they challenge salespeople to make the best use of their timein order to attain the highest possible level of performance.
Despite the theoretical attractiveness of the sales response method of goalsetting, this method is rarely used in practice. It requires detailed sales and activitydata. These data do not exist at many companies, and investment is required todevelop them. Even with good data, this method is usually difficult and expensiveto implement, as it requires statistics and complex modeling at the individualterritory level. In addition, this method is difficult to explain to the sales force.
While sales response modeling is very difficult to implement successfully at theterritory level, many firms have used it effectively as an important input for settingnational goals. National models can be built using data at a more aggregate leveland thus are more manageable and more likely to produce reliable results thanterritory-level models. The process of developing the national model can identifyhigh and low performers, insights that can be used in the territory goal-settingprocess.
Sales Force Input–Based Territory Goal-Setting Method. Formula-based goal-setting methods do not work in situations where historical data are not availableor are not good predictors of future performance. In such situations, sales forceinput can contribute to the goal-setting process. Sales force input can be collectedin an organized way using the bottom-up method.
Bottom-Up Method. The bottom-up method of forecasting requires that eachsalesperson set the goal for her own territory, with management guidance. Thisencourages sales force commitment to territory goals. The method works espe-cially well in situations where each salesperson has a better understanding of thefuture potential in her territory than the company does. Situations with complex,high-priced products, many participants in the buying process, many steps in theselling funnel, a limited number of accounts, and long selling cycles provide con-ditions in which bottom-up forecasting may be appropriate. A good key accountmanager understands the needs of his customers intimately, and is thus uniquelyqualified to provide the best estimate of how much each customer will buy in thefuture. Others at the company do not have the knowledge, data, or depth ofunderstanding required to make such an estimate accurately.
Forecasting with Sales Force Input Is Sometimes the OnlyOption
Territory goal setting is particularly challenging in environments with longselling cycles, where salespeople make just a few major sales every year.
PAGE 359................. 15869$ $CH9 05-19-06 09:24:56 PS
360 The Complete Guide to Sales Force Incentive Compensation
In such situations, sales can be difficult to predict. There are so few trans-actions that the statistical law of large numbers cannot help to balanceout prediction errors. In these situations, the account plans developed byindividual salespeople often contain the only reliable information aboutwhat sales are in the pipeline and how likely they are to close. Thus, reli-ance on sales force input is the only feasible way for management to deter-mine reasonable goals. In situations like this, where results are difficult topredict, it is common for salespeople to be given other types of objectives,such as customer service or activity objectives, in addition to companyresults goals.
The biggest problem with the bottom-up method of forecasting is that unlessit is managed carefully, salespeople do not have an incentive to forecast accurately.If salespeople know that they will be judged on goal attainment, they may be veryconservative in estimating potential. That way, they can easily attain goal, earnmore money, and appear to be high performers.
Bottom-Up Goals Contribute to Slow Growth for a Printing InkMaker
A seller of printing inks asked the sales force to provide estimates of pro-jected sales by account to be included in the annual business plan. Withonly minor adjustments, this information was also used to establish terri-tory goals. The process resulted in goals that were very conservative andeasily reachable within the current customer base. Almost every salesper-son made goal three years in a row, despite the fact that company salesgrowth lagged significantly behind industry growth.
Clever design of the goal-setting process can guard against the problem ofunderforecasting. For example, Jacob Gonik, author of ‘‘Tie Salesmen’s Bonusesto Their Forecasts’’ (Harvard Business Review, 1978), developed an innovativegoal-setting plan for IBM in Brazil. Each salesperson was asked to select her ownterritory goal from a territory-specific matrix of choices, as shown in Figure 9-30.
The rows of the matrix represent the salesperson’s forecast at the start of theplanning period, and the columns represent the actual territory sales at the end ofthe period. The salesperson’s payout depends both on her forecast and on actualsales. Once the salesperson decides upon her forecast, the payout possibilities arerestricted to the corresponding row of the matrix. Notice that the numbers in eachrow are increasing. Therefore, the salesperson receives increasing compensation asshe increases sales. Thus, the salesperson is always motivated to continue sellingas much as possible. On the other hand, the columns are developed so that thelargest payout appears in the row where the salesperson’s forecast matches actualsales. Hence, salespeople earn the most money when they forecast accurately.
The Gonik plan rewards the sales force for performance, and also for goodforecasting. This plan is especially useful when the company relies on the sales
PAGE 360................. 15869$ $CH9 05-19-06 09:24:56 PS
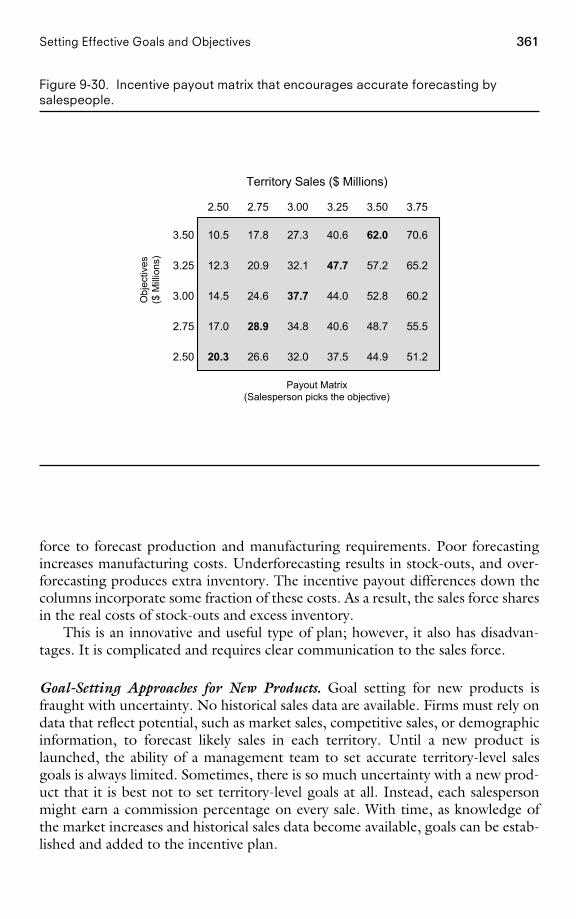
361Setting Effective Goals and Objectives
Figure 9-30. Incentive payout matrix that encourages accurate forecasting bysalespeople.
Obj
ectiv
es($
Mill
ions
)
Territory Sales ($ Millions)
Payout Matrix(Salesperson picks the objective)
2.50 2.75 3.00 3.25 3.50 3.75
3.50 10.5 17.8 27.3 40.6 62.0 70.6
3.25 12.3 20.9 32.1 47.7 57.2 65.2
3.00 14.5 24.6 37.7 44.0 52.8 60.2
2.75 17.0 28.9 34.8 40.6 48.7 55.5
2.50 20.3 26.6 32.0 37.5 44.9 51.2
force to forecast production and manufacturing requirements. Poor forecastingincreases manufacturing costs. Underforecasting results in stock-outs, and over-forecasting produces extra inventory. The incentive payout differences down thecolumns incorporate some fraction of these costs. As a result, the sales force sharesin the real costs of stock-outs and excess inventory.
This is an innovative and useful type of plan; however, it also has disadvan-tages. It is complicated and requires clear communication to the sales force.
Goal-Setting Approaches for New Products. Goal setting for new products isfraught with uncertainty. No historical sales data are available. Firms must rely ondata that reflect potential, such as market sales, competitive sales, or demographicinformation, to forecast likely sales in each territory. Until a new product islaunched, the ability of a management team to set accurate territory-level salesgoals is always limited. Sometimes, there is so much uncertainty with a new prod-uct that it is best not to set territory-level goals at all. Instead, each salespersonmight earn a commission percentage on every sale. With time, as knowledge ofthe market increases and historical sales data become available, goals can be estab-lished and added to the incentive plan.
PAGE 361................. 15869$ $CH9 05-19-06 09:24:57 PS
362 The Complete Guide to Sales Force Incentive Compensation
Two goal-setting approaches that can be used with new products are the mar-ket potential method and the constant allocation method.
Market Potential Method. With the market potential method, sales are allocatedto territories based on market potential. For example, a territory that has 2 percentof national market potential is assigned 2 percent of the national goal. Marketpotential can be captured in a single measure or in a combination of weightedmeasures (see the weighted index and regression methods described earlier).
Constant Allocation Method. The constant allocation method for goal setting isalso used frequently with new products. This method assumes that each salesper-son has to sell a constant amount and that this amount is tied to the quantity ofactivity that each salesperson has time to perform. For example, suppose the firmestimates that, on average, it will take 10 hours of selling effort to close each$10,000 deal. If each salesperson has 1,500 hours of selling time available in ayear, a realistic goal is for each person to sell ($10,000/10 hours per deal) �1,500 hours available � $1,500,000. The constant allocation method works par-ticularly well for new products with significant potential, where the amount ofavailable sales force time limits how much of that potential can be captured in agiven time frame. The constant allocation method can also be combined withother goal-setting methods. For example, each salesperson might be asked to sella constant allocation amount, plus additional sales to be allocated according toanother method, such as the market potential, regression, or weighted indexmethod.
Summary of Methods. As stated earlier, a firm’s selling situation and analyticalsophistication, along with the availability and accuracy of territory-level data, de-termine what goal-setting method is most reasonable. In many situations, thesefactors limit the possible choices. For example, if historical data are not availableor are not accurate predictors of what is likely to happen in the future, the bottom-up approach or one of the new product approaches to goal setting makes the mostsense. Similarly, if a formula-based approach is desired, but market potential dataor reasonable surrogates are not available at the territory level, the firm is limitedto using a method that requires only data that are available, such as territory-levelsales. Also, firms with limited analytical capabilities will be better off choosing oneof the less complex goal-setting methods.
Firms that have territory-level market potential data, along with strong analyt-ical capabilities, have many more goal-setting options. To determine the best ap-proach, management at these firms must assess the trade-off between simplicityand accuracy of the goal-setting process. A complex goal-setting formula or proc-ess may create a more accurate result, but it will probably be more difficult andcostly to implement and to explain to the sales force. Sometimes a simpler process,though less exact, creates a better result because the goals will be more readilyunderstood and embraced by salespeople and sales managers. Often, companiesthat are unsure about which goal-setting method is best use several of the meth-
PAGE 362................. 15869$ $CH9 05-19-06 09:24:58 PS
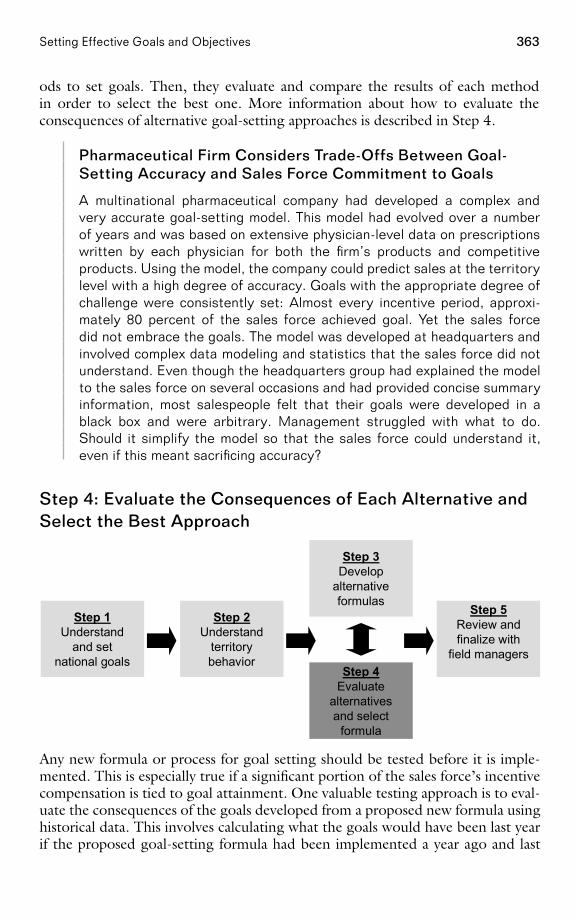
363Setting Effective Goals and Objectives
ods to set goals. Then, they evaluate and compare the results of each methodin order to select the best one. More information about how to evaluate theconsequences of alternative goal-setting approaches is described in Step 4.
Pharmaceutical Firm Considers Trade-Offs Between Goal-Setting Accuracy and Sales Force Commitment to Goals
A multinational pharmaceutical company had developed a complex andvery accurate goal-setting model. This model had evolved over a numberof years and was based on extensive physician-level data on prescriptionswritten by each physician for both the firm’s products and competitiveproducts. Using the model, the company could predict sales at the territorylevel with a high degree of accuracy. Goals with the appropriate degree ofchallenge were consistently set: Almost every incentive period, approxi-mately 80 percent of the sales force achieved goal. Yet the sales forcedid not embrace the goals. The model was developed at headquarters andinvolved complex data modeling and statistics that the sales force did notunderstand. Even though the headquarters group had explained the modelto the sales force on several occasions and had provided concise summaryinformation, most salespeople felt that their goals were developed in ablack box and were arbitrary. Management struggled with what to do.Should it simplify the model so that the sales force could understand it,even if this meant sacrificing accuracy?
Step 4: Evaluate the Consequences of Each Alternative andSelect the Best Approach
Step 1Understand
and setnational goals
Step 2Understand
territorybehavior
Step 3Develop
alternativeformulas
Step 5Review andfinalize with
field managersStep 4
Evaluatealternativesand select
formula
Any new formula or process for goal setting should be tested before it is imple-mented. This is especially true if a significant portion of the sales force’s incentivecompensation is tied to goal attainment. One valuable testing approach is to eval-uate the consequences of the goals developed from a proposed new formula usinghistorical data. This involves calculating what the goals would have been last yearif the proposed goal-setting formula had been implemented a year ago and last
PAGE 363................. 15869$ $CH9 05-19-06 09:24:59 PS
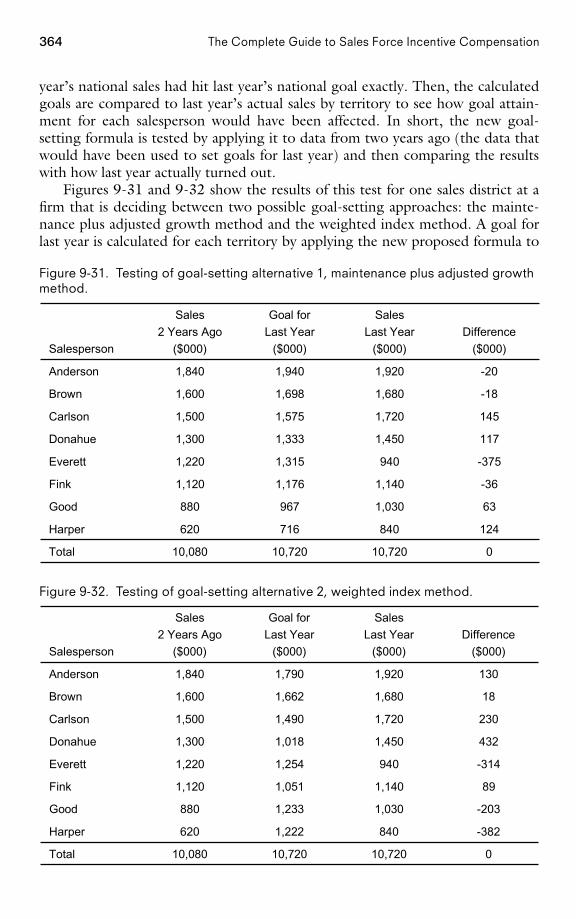
364 The Complete Guide to Sales Force Incentive Compensation
year’s national sales had hit last year’s national goal exactly. Then, the calculatedgoals are compared to last year’s actual sales by territory to see how goal attain-ment for each salesperson would have been affected. In short, the new goal-setting formula is tested by applying it to data from two years ago (the data thatwould have been used to set goals for last year) and then comparing the resultswith how last year actually turned out.
Figures 9-31 and 9-32 show the results of this test for one sales district at afirm that is deciding between two possible goal-setting approaches: the mainte-nance plus adjusted growth method and the weighted index method. A goal forlast year is calculated for each territory by applying the new proposed formula to
Figure 9-31. Testing of goal-setting alternative 1, maintenance plus adjusted growthmethod.
010,72010,72010,080Total
124840716620Harper
631,030967880Good
-361,1401,1761,120Fink
-3759401,3151,220Everett
1171,4501,3331,300Donahue
1451,7201,5751,500Carlson
-181,6801,6981,600Brown
-201,9201,9401,840Anderson
Difference($000)
SalesLast Year
($000)
Goal forLast Year
($000)
Sales2 Years Ago
($000)Salesperson
Figure 9-32. Testing of goal-setting alternative 2, weighted index method.
010,72010,72010,080Total
-3828401,222620Harper
-2031,0301,233880Good
891,1401,0511,120Fink
-3149401,2541,220Everett
4321,4501,0181,300Donahue
2301,7201,4901,500Carlson
181,6801,6621,600Brown
1301,9201,7901,840Anderson
Difference($000)
SalesLast Year
($000)
Goal forLast Year
($000)
Sales2 Years Ago
($000)Salesperson
PAGE 364
................. 15869$ $CH9 05-19-06 09:25:01 PS
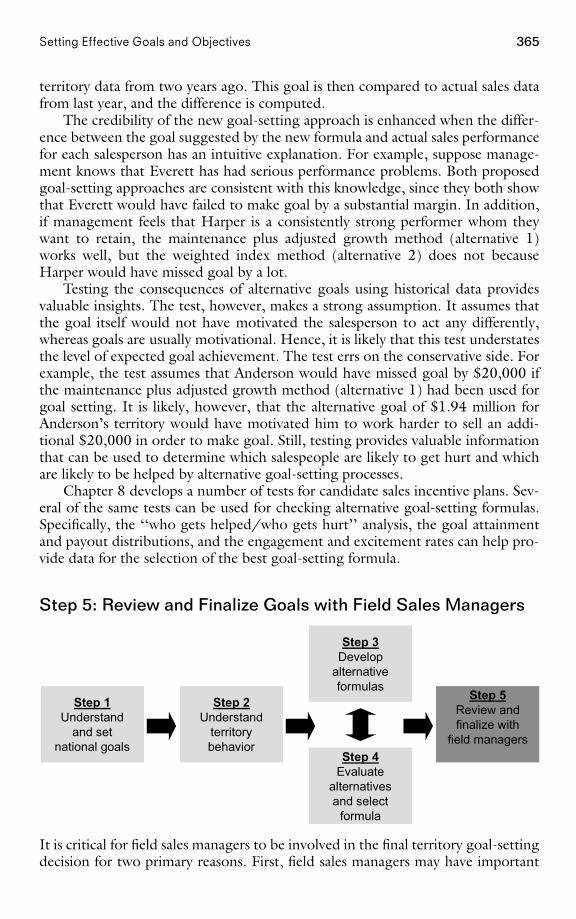
365Setting Effective Goals and Objectives
territory data from two years ago. This goal is then compared to actual sales datafrom last year, and the difference is computed.
The credibility of the new goal-setting approach is enhanced when the differ-ence between the goal suggested by the new formula and actual sales performancefor each salesperson has an intuitive explanation. For example, suppose manage-ment knows that Everett has had serious performance problems. Both proposedgoal-setting approaches are consistent with this knowledge, since they both showthat Everett would have failed to make goal by a substantial margin. In addition,if management feels that Harper is a consistently strong performer whom theywant to retain, the maintenance plus adjusted growth method (alternative 1)works well, but the weighted index method (alternative 2) does not becauseHarper would have missed goal by a lot.
Testing the consequences of alternative goals using historical data providesvaluable insights. The test, however, makes a strong assumption. It assumes thatthe goal itself would not have motivated the salesperson to act any differently,whereas goals are usually motivational. Hence, it is likely that this test understatesthe level of expected goal achievement. The test errs on the conservative side. Forexample, the test assumes that Anderson would have missed goal by $20,000 ifthe maintenance plus adjusted growth method (alternative 1) had been used forgoal setting. It is likely, however, that the alternative goal of $1.94 million forAnderson’s territory would have motivated him to work harder to sell an addi-tional $20,000 in order to make goal. Still, testing provides valuable informationthat can be used to determine which salespeople are likely to get hurt and whichare likely to be helped by alternative goal-setting processes.
Chapter 8 develops a number of tests for candidate sales incentive plans. Sev-eral of the same tests can be used for checking alternative goal-setting formulas.Specifically, the ‘‘who gets helped/who gets hurt’’ analysis, the goal attainmentand payout distributions, and the engagement and excitement rates can help pro-vide data for the selection of the best goal-setting formula.
Step 5: Review and Finalize Goals with Field Sales Managers
Step 1Understand
and setnational goals
Step 2Understand
territorybehavior
Step 3Develop
alternativeformulas
Step 5Review andfinalize with
field managersStep 4
Evaluatealternativesand select
formula
It is critical for field sales managers to be involved in the final territory goal-settingdecision for two primary reasons. First, field sales managers may have important
PAGE 365
................. 15869$ $CH9 05-19-06 09:25:02 PS
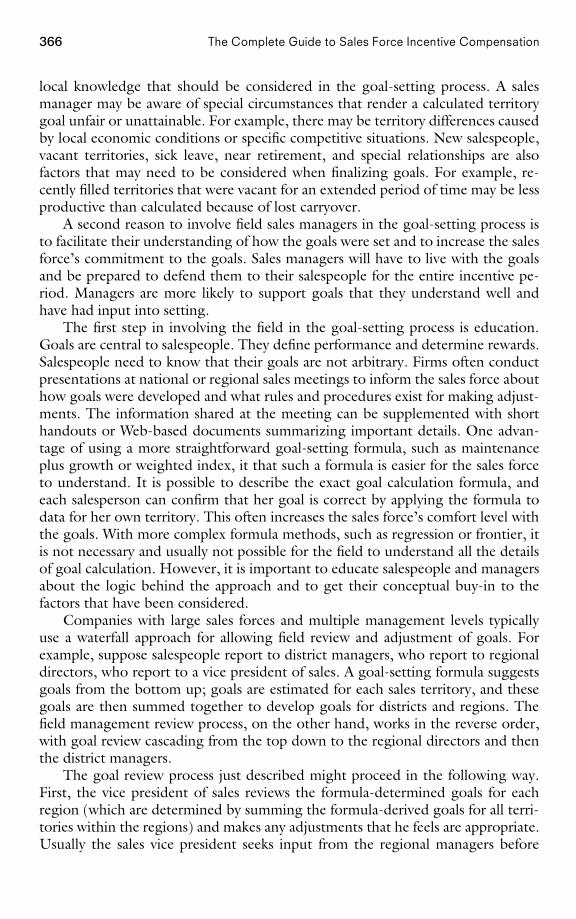
366 The Complete Guide to Sales Force Incentive Compensation
local knowledge that should be considered in the goal-setting process. A salesmanager may be aware of special circumstances that render a calculated territorygoal unfair or unattainable. For example, there may be territory differences causedby local economic conditions or specific competitive situations. New salespeople,vacant territories, sick leave, near retirement, and special relationships are alsofactors that may need to be considered when finalizing goals. For example, re-cently filled territories that were vacant for an extended period of time may be lessproductive than calculated because of lost carryover.
A second reason to involve field sales managers in the goal-setting process isto facilitate their understanding of how the goals were set and to increase the salesforce’s commitment to the goals. Sales managers will have to live with the goalsand be prepared to defend them to their salespeople for the entire incentive pe-riod. Managers are more likely to support goals that they understand well andhave had input into setting.
The first step in involving the field in the goal-setting process is education.Goals are central to salespeople. They define performance and determine rewards.Salespeople need to know that their goals are not arbitrary. Firms often conductpresentations at national or regional sales meetings to inform the sales force abouthow goals were developed and what rules and procedures exist for making adjust-ments. The information shared at the meeting can be supplemented with shorthandouts or Web-based documents summarizing important details. One advan-tage of using a more straightforward goal-setting formula, such as maintenanceplus growth or weighted index, it that such a formula is easier for the sales forceto understand. It is possible to describe the exact goal calculation formula, andeach salesperson can confirm that her goal is correct by applying the formula todata for her own territory. This often increases the sales force’s comfort level withthe goals. With more complex formula methods, such as regression or frontier, itis not necessary and usually not possible for the field to understand all the detailsof goal calculation. However, it is important to educate salespeople and managersabout the logic behind the approach and to get their conceptual buy-in to thefactors that have been considered.
Companies with large sales forces and multiple management levels typicallyuse a waterfall approach for allowing field review and adjustment of goals. Forexample, suppose salespeople report to district managers, who report to regionaldirectors, who report to a vice president of sales. A goal-setting formula suggestsgoals from the bottom up; goals are estimated for each sales territory, and thesegoals are then summed together to develop goals for districts and regions. Thefield management review process, on the other hand, works in the reverse order,with goal review cascading from the top down to the regional directors and thenthe district managers.
The goal review process just described might proceed in the following way.First, the vice president of sales reviews the formula-determined goals for eachregion (which are determined by summing the formula-derived goals for all terri-tories within the regions) and makes any adjustments that he feels are appropriate.Usually the sales vice president seeks input from the regional managers before
PAGE 366................. 15869$ $CH9 05-19-06 09:25:02 PS
367Setting Effective Goals and Objectives
finalizing their goals. If any goal changes are made, then the goals for territorieswithin the affected regions are adjusted appropriately. This is typically done usinga formula that redistributes the additional goal (or the reduction in goal) logicallyacross all the territories in the region. Different redistribution formulas can beused, including proportional allocation of the change across territories and alloca-tions based on historical territory sales, untapped potential, or constant growth.Next, the cascade continues as the regional directors review the formula-determined goals for each of the districts within their region (which are the sumof the adjusted goals for all territories within the districts). The regional directorsmake any adjustments they feel are appropriate, and again, if adjustments aremade, the goals for territories within the affected districts are adjusted appropri-ately. Finally, district managers are given a chance to adjust the territory-levelgoals within their district. Changes at all levels must sum to zero. For example, ifa district manager reduces the goal for one sales territory, she must increase thegoal for another territory by the same amount (or alternatively, the amount of thegoal reduction can be spread as a goal increase across several territories).
Establishing House Accounts
Some firms allow sales managers to allocate a portion of their goal to ahouse account at the district, region, or national level. For example, if adistrict sales manager is responsible for selling to a large key account thatinfluences business throughout the entire district, the goal for that accountcan be given to a district house account, rather than being allocated toindividual salespeople. This allows the district to get credit for sales to theaccount while protecting salespeople from being evaluated on sales thatthey do not control.
Web-based systems are used by many companies to facilitate field managerreview of territory goals. Using these systems, managers in the field can proposechanges to territory goals based on local knowledge. Field sales managers access asecure web site that provides historical performance data about their territoriesand the proposed goals for each territory. The managers then review these dataand submit suggested adjustments to territory goals for approval by headquarters.Once approved, the changes are applied immediately. A Web-based system allowsfaster turnaround between goal creation and rollout. It also ensures greater accu-racy, since the system enforces zero-sum changes and allocates revisions to subor-dinate territories fairly. The Web-based system also provides an audit trail ofchanges, so that all adjustments are properly documented and can be trackedeasily.
Goal-Setting Adjustments and Legal Issues
One advantage of using formula-based goal-setting processes is that theyare more legally defensible than subjective processes. A salesperson who
PAGE 367................. 15869$ $CH9 05-19-06 09:25:03 PS
368 The Complete Guide to Sales Force Incentive Compensation
is fired for consistent failure to achieve goals will have difficulty claiming ina lawsuit that her goals were unfair if the same goal-setting formula is usedfor everyone in the sales force. For this reason, many firms require anymanagement adjustments to formula-derived goals to be documented care-fully. Some firms set rules about how much adjustment is allowed—for ex-ample, a manager may adjust a goal by no more than 10 percent fromthe formula-suggested goal. Rules and documentation requirements can beeasily enforced through the use of Web-based systems.
By studying the adjustments that field sales managers make during the goalreview process, companies sometimes discover ways to improve their goal-settingformulas. Systematic adjustments to goals across the sales force can signal that thegoal-setting formula is biased. For example, if goals in territories with high marketshare are consistently reduced during field review, then perhaps the goal-settingformula needs to change so that territories with high market share get smallergoal allocations. In another example, if the field consistently reduces goals in ruralterritories and increases them in urban territories, then perhaps travel time needsto be considered explicitly in the goal-setting formula.
Does Allowing Field Sales Managers to Adjust Formula-BasedGoals Improve Goal-Setting Accuracy?
One sales force did a study to find out the answer to this question. Accu-racy was measured by examining how close actual territory results came toboth the formula-derived goals and the field-adjusted goals. This is a sim-plistic view of goal accuracy, as it assumes that all territory results are theconsequence of reasonable workload and not exceptional effort on the partof salespeople. Nevertheless, the analysis provides interesting insight re-garding the value of goal adjustment by the field sales managers in thissales force. Sales managers were allowed to adjust formula-based goalsby up to 12 percent; adjustments were made to approximately one-quarterof the goals. Field-adjusted goals were found to be more accurate thanformula-derived goals in cases where the goals had been adjusted down-ward, suggesting that managers were good at identifying territory prob-lems. However, the field-adjusted goals were less accurate than the formula-derived goals in cases where the goals had been adjusted upward, suggest-ing that managers were not as good at identifying territory opportunities.Overall, field adjustments resulted in only a slight improvement in the accu-racy of the goals. Despite this fact, the company decided to continue allow-ing field managers to adjust goals because the process significantlyenhanced sales force understanding of and commitment to goals, and theadjustments did not significantly increase the overall incentive budget.
PAGE 368................. 15869$ $CH9 05-19-06 09:25:03 PS
369Setting Effective Goals and Objectives
Tracking Performance Against Goals
Effective goals energize a sales force. When implemented well, they are great mo-tivators for salespeople. However, in order for goals to motivate, feedback is nec-essary. Salespeople need to know how they are doing relative to a goal, if that goalis to affect their behavior.
Systems for Providing Feedback on Goal AttainmentMost sales forces provide performance feedback to salespeople at regular intervals,such as monthly or quarterly. This feedback usually includes reports that trackterritory performance against goals and can be distributed in many differentforms, including Web-based, e-mail, and hard copy. In addition, many sales forceautomation systems include performance tracking features that allow salespeopleto sort, graph, and manipulate performance tracking data on a laptop computer.
Managing all the data for tracking performance relative to goals can be asignificant challenge. Many smaller sales forces use internally developed Excelspreadsheets for this purpose. Larger sales forces with multiple incentive plansoften use more powerful incentive compensation management systems to facilitateefficient and error-free incentive compensation administration. These systems givesales managers and salespeople the ability to measure their performance againstgoals in real time. Leading firms in this field include Callidus, Centive, Siebel,Synygy, and ZS Associates. See Chapter 12 for more information about incentivecompensation plan administration.
Incentive Compensation Administration System ProvidesSales Force with Timely Goal Attainment Feedback
Features of an incentive compensation administration system can be verymotivational for a sales force. For example, at one company, salespeoplecan visit a secure web site that contains the latest ‘‘scorecard’’ of perform-ance for their territory. The scorecard provides immediate access to goaland attainment information, based on the latest available data. On the website, salespeople can use a ‘‘payout calculator’’ to compute their incentivepayout for different goal achievement scenarios. For example, they cancalculate how much incentive pay they will receive if they continue sellingat the same pace. Alternatively, salespeople can calculate how much morethey would need to sell to make a desired higher bonus.
Web-based goal attainment tracking systems have many advantages. First, theyallow salespeople access to the latest data as soon as those data are available. Next,they reduce the cost of plan administration, since hard copy reports do not needto be produced and shipped to the field. Third, they provide a single place forsalespeople to access performance data provided by different vendors. Fourth,
PAGE 369................. 15869$ $CH9 05-19-06 09:25:04 PS
370 The Complete Guide to Sales Force Incentive Compensation
they allow errors to be caught early. Finally, their interactive ‘‘what-if ’’ featureshelp focus salespeople on the right activities and motivate them to get results.
Handling Midyear Goal Corrections
Occasionally, it becomes evident partway into an incentive period that a com-pany’s initial forecast was inaccurate. If this happens, should the company reviseits forecast and reset goals accordingly? Management needs to balance its desireto have commitment to goals and integrity in the goal-setting process with fair-ness to the sales force.
Theoretically, decisions concerning midyear goal adjustments should be sym-metric; if a management team raises goals when overachievement is evident, itshould be willing to lower goals when they cannot be achieved. However, thepractical answer to handing midyear goal corrections is often asymmetric. Firmsare usually more likely to reduce goals that are unachievable than they are toincrease goals that are too easy because of circumstances outside the sales force’scontrol. Often, management teams reason that if goals are too easy, it’s best toride it out; the negative impact on morale of increasing a goal is greater than thecost of paying the sales force a windfall gain.
‘‘Loan volume is driven largely by interest rates. Last year interest rateswent down unexpectedly, so we raised our loan volume goals in midstream.The takeoff was not as we expected, and the sales force was irate. ‘Thecompany is ripping us off,’ was the prevailing sentiment throughout thefield.’’
Sales VP at a consumer finance company
Many sales organizations that allow midyear changes to goals limit the num-ber and scope of changes by having policies and approval processes that limitchanges to the most compelling situations. These might include significant eventsoutside the control of the sales force, such as major economic changes, currencyand pricing changes, or acts of nature. Having restrictions on goal changes helpsto protect the integrity of the goal-setting process and minimizes the number oftrivial requests for goal adjustment.
The Goal Adjustment Dilemma of 2001
With the economy booming, many sales organizations set aggressive salesgoals for 2001. But when the economy slowed significantly during the firstpart of the year, it became abundantly clear to many companies that salesgoals based on the pattern of the previous year would never be achieved.Management at these companies faced a dilemma: Should they scrap theirold sales goals and establish more realistic, reduced goals that would be
PAGE 370................. 15869$ $CH9 05-19-06 09:25:04 PS
371Setting Effective Goals and Objectives
motivational to the sales force, giving the salespeople a reasonable chanceto maintain their income level? Or would it be better to stay committed tothe original goals, expecting the sales force to share in the pain of theeconomic downturn by taking significant reductions in incentive pay?
A management team that is known for trying to set the most realistic, fact-based goals, and that is willing to consider midyear corrections in appropriatesituations, will receive the support of the sales force.
Contest Generates Sales Force Excitement When Goal Is Outof Reach
Management at a financial company overestimated national demand for thefirm’s services and set sales force goals much too high. By the end ofAugust, less than 10 percent of salespeople were on track to make goal.This meant that over 90 percent of the sales force would most likely notearn the accelerated commission rate for sales above goal. Managementdid not want to establish a precedent of reducing a national goal that wastoo challenging. However, it feared that many salespeople would ‘‘checkout’’ for the rest of the year, saving their efforts for the following year,when goals might be more attainable. Management needed to generatesome short-term excitement. So, it established a special contest for thesales force based on the last trimester sales. In addition, the incentive planwas revised for the following year, so that modest commission accelerationkicked in at 80 percent of goal attainment, with additional accelerationonce goal was achieved. This helped to protect the sales force in the eventthat goals were once again set too high. For example, if the new plan hadbeen in place in the current year, over 75 percent of the sales force wouldhave earned some accelerated commissions (versus less than 10 percentwith the current plan).
Payout Curve Design Can Compensate for National Goal-Setting Errors
Some sales incentive plans have a mechanism for rescuing the sales forceand protecting the company in the event that national goals are unrealistic.Cleverly designed payout curves can help to ensure that sales force moti-vation stays high in the event that goals are too high and that the companydoes not pay out too much in undeserved incentive if goals are too low.In these shifting performance achievement plans, an individual’s incentivepayout is a function of two comparisons: his own territory performancerelative to goal and his goal attainment relative to the rest of the salesforce. A salesperson who achieves 100 percent of goal earns a target in-centive amount if the average goal attainment across the sales force is also
PAGE 371................. 15869$ $CH9 05-19-06 09:25:05 PS
372 The Complete Guide to Sales Force Incentive Compensation
100 percent. However, if the average goal attainment across the salesforce is only 90 percent, an individual at 100 percent attainment earns morethan the target incentive. If the average goal attainment across the salesforce is 110 percent, an individual at 100 percent attainment earns lessthan the target incentive. Such plans help manage sales force motivation inunpredictable environments and also improve forecasting of sales incentivecompensation costs.
Authors’ note: A plan like this requires management to admit to thesales force that missing goal is a realistic possibility. This may not be ac-ceptable in some sales force cultures or in some selling environments. Forexample, in very-high-causality environments—where the salesperson’sefforts have a very direct impact on short-term results—most sales leaderswill be unwilling to state up front that failing to reach goal is acceptable. Aplan like this is more likely to succeed in a moderate-causality environ-ment, where random sales are significant or where many factors in additionto the sales force influence short-term results.
Goal-Setting Recommendations
In Volatile Business Environments, Goals with Short TimeFrames, Broad Payout Ranges, and Earnings Caps AreAppropriate
The business environment can present high levels of uncertainty. In highly volatilesettings, accurate forecasting of national sales goals is difficult enough; the uncer-tainty is only amplified when territory-level goals need to be established. Onegoal-setting strategy for unpredictable selling environments is to set goals withshort time frames. That way, if a goal is unrealistic, the sales force is affected onlyfor a limited period of time, and the impact of the error is minimized.
Another strategy for goal setting in unpredictable environments is to use goalsthat define a broader realistic range of performance. For example, suppose a sales-person begins to receive incentive pay when he reaches 90 percent of goal for anestablished product in a fairly stable market. The salesperson might begin to re-ceive incentive pay when he reaches just 75 percent of goal for a product in anenvironment that is less predictable. That way, more salespeople will make at leastsome incentive money, even if the goals turn out to be unrealistically high. Toguard against goal-setting errors on the low side, some firms in uncertain environ-ments use earnings caps or decelerators to ensure that they will not have to payout excessive unearned incentive money. For example, a salesperson’s earningsmight be limited to a certain dollar amount, to a multiple or fraction of salary, orto a multiple of target earnings. More information on how to adapt an incentiveplan for a volatile market is included in Chapter 7.
PAGE 372................. 15869$ $CH9 05-19-06 09:25:06 PS
373Setting Effective Goals and Objectives
Goal-Setting Strategies for New Products
There is often considerable forecasting uncertainty with new products.Hence, goal-setting approaches that work in volatile business situations,such as short time frames, broad payout ranges, and earnings caps, aretypically also appropriate with new products.
Stretch Goals Can Be Effective, Provided They AreAttainable
Sometimes, companies add stretch to their goals in order to challenge and moti-vate the sales force. For example, if a firm uses a blend of top-down, data-modeling, and bottom-up inputs to derive a best-guess forecast of $100 millionfor next year, an aggressive management team may intentionally set the sales forcegoal at $110 million. Stretch goals can be effective so long as they are attainable.They are more likely to work well in selling environments with high sales forceprominence, where increases in sales force effort translate directly into short-termsales. For example, in competitive commodity markets such as office supplies orinsurance, sales force effort has a high short-term impact. Stretch goals can bemotivational to the sales force, or at least not demotivational, because salespeopleknow that their increased effort can create higher sales in the current incentiveperiod. On the other hand, in environments that involve a lot of customer serviceand maintenance, salespeople have less ability to affect short-term sales. Stretchgoals in such situations often fail because additional sales force effort may notyield significant results until future incentive periods. Stretch goals that are unreal-istic or perceived by the sales force to be unattainable will only frustrate sales-people, reducing sales force motivation and morale.
Companies should be willing to pay out more incentive money for attainmentof the stretch goal than they would for attainment of the realistic goal. The payoutcurve should be steep in the range between the realistic goal and the stretch goalbecause the realistic goal can be attained through reasonable sales force effort, butattainment of the stretch goal requires exceptional effort.
Example Implementation of Stretch Goals
An Italian company wanted to challenge its sales force to stretch and ex-ceed the company’s sales goal. If the company achieved 100 percent of itsgoal, the sales force earned a trip to a nice resort in Italy. If the sales forceachieved 105 percent of goal, the trip would be to an even fancier resortelsewhere in Europe. If the sales force achieved 110 percent of goal, thetrip would be to an even more elegant, first-class resort in the UnitedStates.
PAGE 373................. 15869$ $CH9 05-19-06 09:25:07 PS
374 The Complete Guide to Sales Force Incentive Compensation
Companies that use stretch goals need to be aware that the practice can berisky, particularly in situations where a significant portion of sales force pay is tiedto goal attainment. Goal attainment hinges on the likelihood that the stretchgoals can be achieved. If they can, and if a desirable incentive is attached to thatachievement, then motivation will rise and the company will sell more. If thestretch goal is unachievable, then a large number of salespeople will not maketheir stretch goal, engagement will be low, and motivation will suffer significantly.Sales leaders need to assess the likelihood of goal achievement and the two inher-ent risks before deciding to use stretch goals. (Authors’ note: Unachievable occursmore often than achievable.)
Rank Ordering of Salespeople Is an Alternative to Goal Setting,but Should Be Used with Caution
Some companies find goal setting inaccurate, contentious, or frustrating. Yet, theyneed a mechanism for evaluating and rewarding their salespeople. Rank orderingof salespeople on one or more measures is an alternative to goal setting for evalu-ating and rewarding. Salespeople who are ranked high are viewed as top perform-ers, and those who are ranked low are regarded as low performers. The greatestincentive pay is awarded to the top performers. Systems based on a forced rankordering can work, but their success hinges on an equitable and balanced salesterritory alignment. If territories are not comparable, salespeople can be rewardedfor having a good sales territory and not for their performance. Sometimes, inorder to improve the fairness of ranking salespeople with dissimilar territories,companies try to incorporate multiple factors into the ranking. For example, theymight rank on sales growth within tiers or groups of salespeople based on theirterritory size. As additional factors are incorporated, the ranking process becomesincreasingly complex until it is almost as difficult as the original quota-settingprocess that it was designed to replace.
Ranking systems have some additional significant disadvantages. Managementcompromises the power of its leadership by not providing meaningful perform-ance goals. Remember, you can’t achieve goals if you don’t have them. In addi-tion, salespeople may not have a good idea of how well they are performing untilafter the ranking is complete. Ranking systems also create internal competitionamong salespeople, since by design there will be winners and losers. Any organiza-tion that decides to abandon goals should have compelling reasons for doing so,and must be prepared to deal with the problems that can arise when rankingsalespeople.
Knoll Pharmaceuticals Eliminates Territory Goals
The sales force at Knoll Pharmaceuticals was unhappy with the company’squota-based incentive compensation system. The vast majority of sales-people felt that the quota system was unfair. Sales management spent
PAGE 374................. 15869$ $CH9 05-19-06 09:25:08 PS
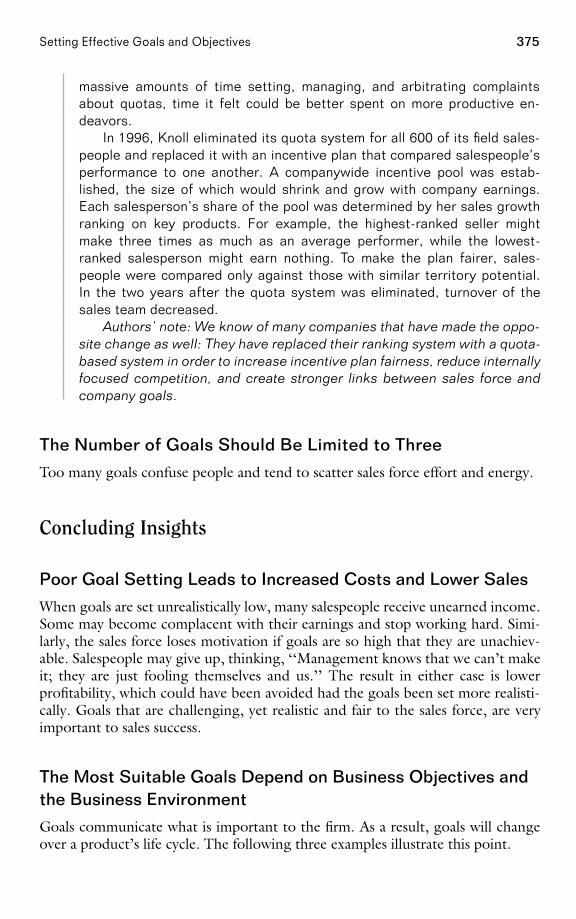
375Setting Effective Goals and Objectives
massive amounts of time setting, managing, and arbitrating complaintsabout quotas, time it felt could be better spent on more productive en-deavors.
In 1996, Knoll eliminated its quota system for all 600 of its field sales-people and replaced it with an incentive plan that compared salespeople’sperformance to one another. A companywide incentive pool was estab-lished, the size of which would shrink and grow with company earnings.Each salesperson’s share of the pool was determined by her sales growthranking on key products. For example, the highest-ranked seller mightmake three times as much as an average performer, while the lowest-ranked salesperson might earn nothing. To make the plan fairer, sales-people were compared only against those with similar territory potential.In the two years after the quota system was eliminated, turnover of thesales team decreased.
Authors’ note: We know of many companies that have made the oppo-site change as well: They have replaced their ranking system with a quota-based system in order to increase incentive plan fairness, reduce internallyfocused competition, and create stronger links between sales force andcompany goals.
The Number of Goals Should Be Limited to Three
Too many goals confuse people and tend to scatter sales force effort and energy.
Concluding Insights
Poor Goal Setting Leads to Increased Costs and Lower Sales
When goals are set unrealistically low, many salespeople receive unearned income.Some may become complacent with their earnings and stop working hard. Simi-larly, the sales force loses motivation if goals are so high that they are unachiev-able. Salespeople may give up, thinking, ‘‘Management knows that we can’t makeit; they are just fooling themselves and us.’’ The result in either case is lowerprofitability, which could have been avoided had the goals been set more realisti-cally. Goals that are challenging, yet realistic and fair to the sales force, are veryimportant to sales success.
The Most Suitable Goals Depend on Business Objectives andthe Business Environment
Goals communicate what is important to the firm. As a result, goals will changeover a product’s life cycle. The following three examples illustrate this point.
PAGE 375................. 15869$ $CH9 05-19-06 09:25:08 PS
376 The Complete Guide to Sales Force Incentive Compensation
1. For products in the high-growth stage of their development, growth insales or market share is a good measure for goal setting.
2. For companies that are attempting to maintain and penetrate existing cus-tomers, goals stated in terms of customer service, customer satisfaction,and revenue growth are appropriate.
3. In mature markets with limited growth opportunity, profitability must bewatched carefully. A company sacrifices profits if it generates too manysales at a reduced price. Territory goals focused on profitability work well.
The Process of Setting Goals Can Be as Beneficialas the Goals Themselves
Setting goals allows the company to communicate its strategy in a tangible way.The company tells its salespeople what they can do to help the company make itscorporate goal. Also, a well-administered process of quota setting allows the com-pany to show its salespeople that they are being treated fairly. It also enables themanagement team to see who is performing well and who is performing poorly.Web-based systems can streamline the process of incorporating field input anddisseminating key information to salespeople.
PAGE 376................. 15869$ $CH9 05-19-06 09:25:08 PS
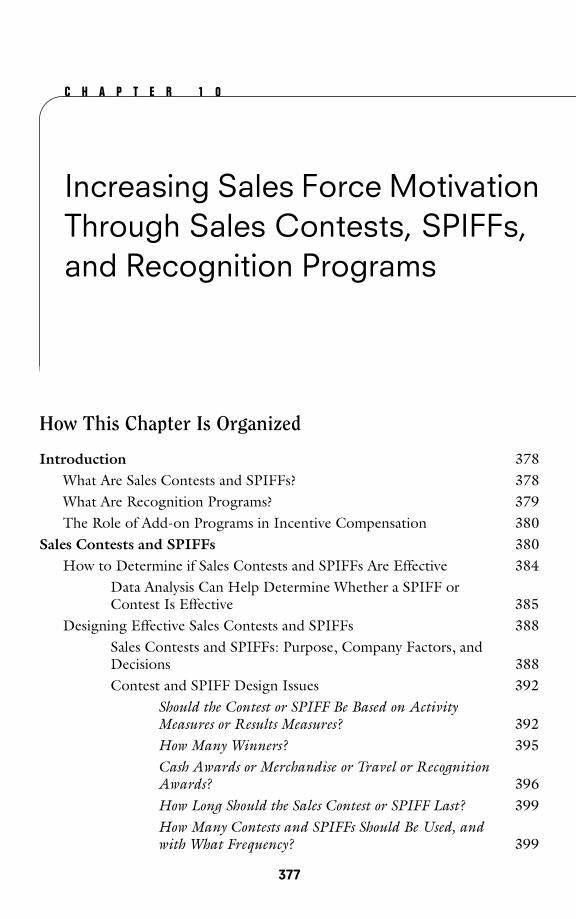
C H A P T E R 1 0
Increasing Sales Force MotivationThrough Sales Contests, SPIFFs,and Recognition Programs
How This Chapter Is Organized
Introduction 378What Are Sales Contests and SPIFFs? 378What Are Recognition Programs? 379The Role of Add-on Programs in Incentive Compensation 380
Sales Contests and SPIFFs 380How to Determine if Sales Contests and SPIFFs Are Effective 384
Data Analysis Can Help Determine Whether a SPIFF orContest Is Effective 385
Designing Effective Sales Contests and SPIFFs 388Sales Contests and SPIFFs: Purpose, Company Factors, andDecisions 388Contest and SPIFF Design Issues 392
Should the Contest or SPIFF Be Based on ActivityMeasures or Results Measures? 392How Many Winners? 395Cash Awards or Merchandise or Travel or RecognitionAwards? 396How Long Should the Sales Contest or SPIFF Last? 399How Many Contests and SPIFFs Should Be Used, andwith What Frequency? 399
PAGE 377
377
................. 15869$ CH10 05-19-06 09:24:17 PS
378 The Complete Guide to Sales Force Incentive Compensation
Companies That Help Manage Noncash Incentive Programs 402Recognition Programs 403Insights 407
Ensure Consistency with Strategy and Sales Roles 407Ensure Compatibility with Other Sales Force Effectiveness Drivers 408Ensure Appropriate Consequences for Salespeople and CompanyResults 408
Introduction
Sales contests, SPIFFs (Special Performance Incentives for Field Force), and rec-ognition programs are powerful and relatively inexpensive ways to enhance afirm’s sales force incentive program. When used appropriately, such add-on in-centives can effectively focus sales force attention on specific short-term goals,improve morale and team effort, or recognize the extraordinary efforts of top-performing salespeople. Yet contests, SPIFFs, and recognition programs harborsome dangers. Too many additional incentives can confuse salespeople or divertsales force attention from strategically important products, customers, or activi-ties. This chapter provides advice on how to create and manage effective salescontests, SPIFFs, and recognition programs that are aligned with the firm’s strate-gic goals.
What Are Sales Contests and SPIFFs?
Sales Contest Creates Sales Force Energy at Canvas Systems
Management at Canvas Systems, a provider of IT servers and equipment,wanted to boost quarterly sales of some specific, highly profitable productlines. The company held a Texas Hold ’Em poker tournament in which sales-people were awarded a poker card for every sale of a targeted product line.The player with the winning hand at the end of the contest won a weekendgetaway to Las Vegas. Other quarterly contests at Canvas Systems havebeen inspired by popular reality television shows, such as Survivor andFear Factor.
A SPIFF Jump-Starts First-Quarter Sales at NexawebTechnologies
Management at Internet software company Nexaweb Technologies knewthat it was imperative to inspire the sales team in the first quarter of the
PAGE 378................. 15869$ CH10 05-19-06 09:24:17 PS
379Increasing Sales Force Motivation
year in order to drive exceptionally strong annual performance. A SPIFFhelped motivate the sales force and set the right tone for the rest of theyear. During the first quarter only, the firm offered salespeople $500 foreach new account brought in that was worth over $75,000, with a minimumof three acquired accounts.
Sales contests and SPIFFs are nonrecurring sales incentive programs designed tomotivate sales force behavior and reward short-term results. A typical sales contestor SPIFF lasts not more than a few months and focuses on specific products,customer types, or sales activities. Prizes can include cash, merchandise, and/ortravel awards.
The terms sales contest and SPIFF are sometimes used interchangeably. In thisbook, we use the term SPIFF to refer to programs with a high participation rate,where a considerable proportion (at least 60 percent) of salespeople earn moneyand/or prizes. We use the term sales contest to describe programs with a lowerparticipation rate, where salespeople compete with one another to earn a limitednumber of prizes or cash awards. Although the actual percentage of salespeoplewho are winners in a sales contest may be small, a large proportion of salespeoplemust feel that they have a reasonable chance of winning so that they are motivatedto participate.
What Does SPIFF Stand For?
There is little consistency across firms and across the sales literature as towhat the acronym SPIFF (or SPIF) stands for. Some possibilities includespecial program incentive funds, sales promotion incentive fund, salesper-son incentive funds, sales performance incentive fund, and special perform-ance incentive for field force. Some firms also use the lowercase spif orspiff when referring to such programs.
What Are Recognition Programs?
Global Recognition Program at NCR Dates Back Almost aCentury
In 1907, John Patterson, the founder of National Cash Register (nowknown as NCR), created the Century Point Club, the firm’s first formalsales recognition program. In that year, 50 top sellers of the company’smechanical cash register were taken to the company’s first national con-vention in Chicago, an extravagant trip at a time when very few people(even traveling salesmen) ever traveled more than a few hundred milesfrom their hometown. Almost a century later, the Century Point Club wasstill going strong at NCR as part of a larger Global Recognition Program
PAGE 379................. 15869$ CH10 05-19-06 09:24:18 PS
380 The Complete Guide to Sales Force Incentive Compensation
that was highly coveted by employees. In 1999, the sales force’s CenturyPoint Club members, along with recognized peers from research and devel-opment, consulting, and administration, went to Singapore to celebratetheir success.
Recognition programs reaffirm that the company values the consistently effectivebehaviors and strong results of its best personnel by highlighting their achieve-ment before their peers, management, and/or customers. Recognition programstypically reward performance over a longer period of time than a sales contest orSPIFF—usually one year or more. Winners of recognition programs are oftenentitled to a trip and/or to membership in a select group, such as the President’sClub. Public recognition is an important aspect of recognition programs, as man-agement uses these programs to signal to the rest of the company, ‘‘These are ourwinners and role models.’’
The Role of Add-on Programs in Incentive Compensation
Figure 10-1 shows the typical participation rate and time frame for sales contests,SPIFFs, and recognition programs. This chart also positions these add-on pro-grams relative to the variable pay and salary components of the main incentivecompensation plan.
This chapter focuses first on SPIFFs and sales contests and includes discussionof when to use them, how to determine their effectiveness, and how to designand manage successful programs. Following this is a brief discussion of sales rec-ognition programs.
Sales Contests and SPIFFs
Sales contests and SPIFFs are designed to motivate immediate sales force behaviorand reward short-term results. Hence, such programs are most effective in sales
Figure 10-1. Participation rate and time frame of performance evaluation for salaryand various types of sales incentives.
Recognition
Stock optionsContestsLimited (less than 15%)
SalaryVariable paySPIFFsHigh (greater than 60%)
Long-Term(A Year or More)Medium-TermShort-Term
(A Quarter or Less)Participation Rate
Time Frame of Performance Evaluation and Reward
PAGE 380................. 15869$ CH10 05-19-06 09:24:19 PS
381Increasing Sales Force Motivation
environments with high short-term causality—those where sales are driven pri-marily by the current skills, motivation, and efforts of salespeople. In these envi-ronments, the extra effort put forth by salespeople in response to a SPIFF hasimmediate sales impact. Salespeople see sales rise and feel a sense of accomplish-ment. The SPIFF provides them with commensurate financial rewards. SPIFFsand sales contests are much less effective in environments that have high freesales—that is, in environments with high carryover sales or long selling cycles, orwhere other factors besides current sales force effort, such as brand name andnon-sales force marketing instruments, have a large impact on sales. In these envi-ronments, a good portion of short-term sales may be driven by past sales effortsor by factors outside a salesperson’s control. SPIFFs and sales contests are mosteffective when they reward true accomplishment. They lose their emotional im-pact when a salesperson feels that her actions do not have a large effect on theoutcome.
When used appropriately, sales contests and SPIFFs have many advantages:
• They are generally well liked by salespeople, and they can create consider-able sales force excitement.
• They are an effective way to focus sales force attention on specific near-term tactical events that might otherwise get insufficient attention—forexample, launching a new product, combating a competitive entry, or pro-viding a midyear boost to lagging sales.
• They are usually relatively low cost and have relatively low risk for thefirm.
More advantages of sales contests and SPIFFs from a sales force, customer, andfirm perspective are enumerated in the top half of Figure 10-2.
Although SPIFFs and sales contests usually represent less than 10 percent ofthe total incentive compensation budget, their impact has the potential to doserious harm to a firm if the programs are not centrally coordinated and strategi-cally aligned with company priorities. SPIFFs and sales contests can redirect salesforce effort from core products, diluting the impact of the main incentive com-pensation plan. Some additional challenges when using sales contests and SPIFFseffectively from a sales force, customer, and firm perspective are enumerated inthe bottom half of Figure 10-2.
Product Manager–Controlled SPIFFs Can Create Sales ForceEffort Allocation Problems
Aligning sales contests and SPIFFs with strategic priorities is particularlydifficult in organizations with decentralized marketing departments, whereproduct managers have budgets to spend on sales force SPIFFs withoutany central marketing or sales force control. In such environments, productmanagers may compete for sales force time by trying to outdo one another
PAGE 381................. 15869$ CH10 05-19-06 09:24:19 PS
382The
Co
mp
leteG
uide
toS
alesFo
rceIncentive
Co
mp
ensation
Figure 10-2. Advantages and challenges of sales contests and SPIFFs.
• Effective at creating sales atrelatively low cost.
• Not a significant financial risk;typically only a short-termcommitment.
• Effective way to focusattention on specific near-termtactical events that mightotherwise get insufficientattention (for example, sellingoverstocks, combating acompetitive entry, or providinga midyear boost to laggingsales).
• Allow management tocontinuously reinforce what isimportant to the company.
• May introduce customersto products and/or servicesthat are not typicallydiscussed.
• Sales force’s increasedenergy, motivation, andfocus may improvecustomer relationship.
• Liked by salespeople, aremotivating and fun, andprovide variety andexcitement.
• Provide extracompensation; “freemoney.”
• Often provide morefrequent payment than themain IC plan.
• Provide recognition amongpeers and managementand pride in the job,particularly for salespeoplewho work alone andunsupervised and facefrequent rejection.
Advantages
Impact on FirmImpact on CustomersImpact on Salespeople
PA
GE
382.................15869$
CH
1005-19-06
09:24:20P
S
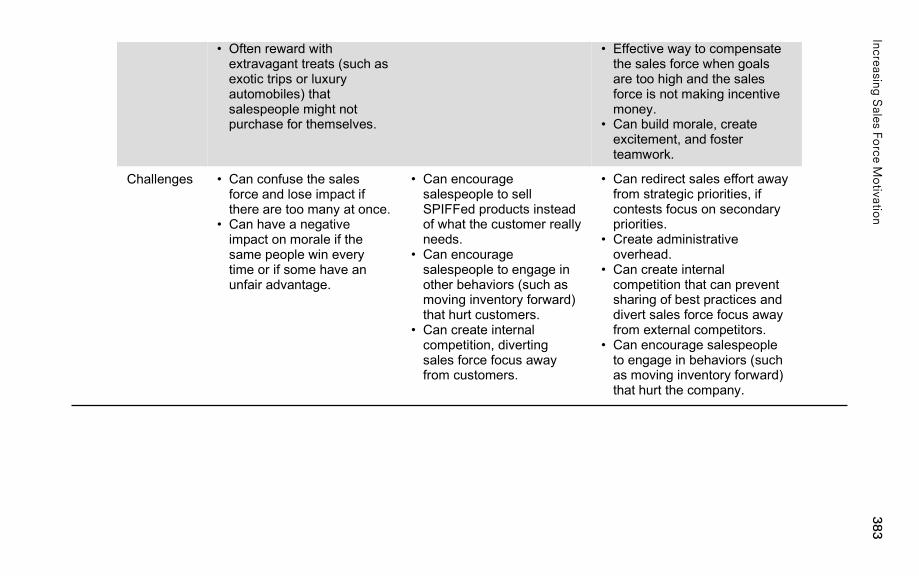
383Increasing
Sales
Force
Mo
tivation
• Can redirect sales effort awayfrom strategic priorities, ifcontests focus on secondarypriorities.
• Create administrativeoverhead.
• Can create internalcompetition that can preventsharing of best practices anddivert sales force focus awayfrom external competitors.
• Can encourage salespeopleto engage in behaviors (suchas moving inventory forward)that hurt the company.
• Can encouragesalespeople to sellSPIFFed products insteadof what the customer reallyneeds.
• Can encouragesalespeople to engage inother behaviors (such asmoving inventory forward)that hurt customers.
• Can create internalcompetition, divertingsales force focus awayfrom customers.
• Can confuse the salesforce and lose impact ifthere are too many at once.
• Can have a negativeimpact on morale if thesame people win everytime or if some have anunfair advantage.
Challenges
• Effective way to compensatethe sales force when goalsare too high and the salesforce is not making incentivemoney.
• Can build morale, createexcitement, and fosterteamwork.
• Often reward withextravagant treats (such asexotic trips or luxuryautomobiles) thatsalespeople might notpurchase for themselves.
PA
GE
383.................15869$
CH
1005-19-06
09:24:21P
S
384 The Complete Guide to Sales Force Incentive Compensation
with more creative and extravagant SPIFFs. The result is a SPIFFs armsrace, in which overall sales effort does not increase, but is just redirectedto the product with the best current SPIFF. The company ends up spendinga lot of money on prizes and awards, but gets very few incremental salesin return. In addition, since sales contests and SPIFFs can focus attentionon products and customers that are not part of the main incentive plan,sales in areas with the greatest strategic importance often suffer.
How to Determine if Sales Contests and SPIFFs Are Effective
Was IBM Addicted to Sales Contests?
During the 1980s and 1990s, the IBM sales force was well known for run-ning many sales contests and SPIFFs. Some IBM executives referred tothis as ‘‘incentive plan obesity,’’ or the tendency to overload the incentiveplan by ‘‘throwing money at every problem.’’ An ex-director of sales com-pensation for IBM confessed, ‘‘IBM gave bonuses and awards for everyimaginable action by the sales force. The more complex it got, the moredifficult it was to administer, and the results were not convincing. Whenwe began to ask ourselves why DEC had salespeople, who were toughcompetitors, on straight salary, we decided perhaps we’d gone overboarda bit.’’
Too Many SPIFFs Distract a Pharmaceutical Sales Force
Sales leaders at a large pharmaceutical company were concerned that thesales force was being distracted by the large number of sales contestsand SPIFFs initiated by the firm’s marketing department. Individual productmanagers had budgets and authority to introduce contests and SPIFFs tothe sales force, and there was no coordinated central control to ensure thatthese programs were aligned with strategic sales force objectives. At onepoint, there were 48 different contests and SPIFFs running at the sametime. When sales management asked salespeople to recall these variousprograms, most salespeople were not able to even name more than a hand-ful of them, let alone explain their purpose or specific rules. The companywas spending a lot of money on SPIFFs and contest prizes and was gettingvery little extra effort from the sales force in return.
Sales Force Desire to Win a Contest EncouragesUnethical Behavior
Several weeks into a three-month contest on sales for a specific product,the vice president of sales began to get unconfirmed reports of behaviors
PAGE 384................. 15869$ CH10 05-19-06 09:24:21 PS
385Increasing Sales Force Motivation
that were not in the company’s or customers’ interests. Several sales-people who ordinarily operated with considerable integrity were aggres-sively manipulating customer product selection and the timing of orders inan effort to maximize sales during the contest period, at the expense ofsales in future periods. It appeared that customers were being asked toorder contest products, with the full intention of changing the order oncethe contest was over. Some salespeople seemed to have the attitude, ‘‘It’sjust a contest, so it’s okay to push the rules a little, just like in any game.’’
Mismatch Between Award Value and Effort Required to EarnBank Teller SPIFF
Recall from Chapter 1 the story of a bank that established a SPIFF fortellers to encourage them to upsell customers when they came into thebank to deposit money. Tellers were offered $10 for every customer whoopened an account with the bank’s investment division as a result of tellerreferral. The SPIFF had almost no impact on teller behavior; the vast major-ity of tellers felt that the prospect of earning a measly $10 reward wassimply not worth the effort and the possible humiliation of appearing to be‘‘pushy.’’
There can be many signs that the current sales contests and SPIFFs are not work-ing well. Figure 10-3 lists some common symptoms of problems with these pro-grams. The symptoms fall into clear categories within the sales managementsystem framework introduced in Chapter 1.
Data Analysis Can Help Determine Whether a SPIFF or Contest Is Effective. A2005 survey by Inventive Federation, Inc., discovered that 74 percent of respon-dents are placing a strong emphasis on the ROI of sales contests and SPIFFs.Experimentation and time-series analysis are two approaches that can provide anassessment of these incentive programs.
In an experiment, two groups are formed. The experimental group is giventhe sales contest or SPIFF. The control group operates in a status quo mode.Differences in group performance on a metric such as sales, contribution, or mar-ket share are recorded. These differences enable an ROI calculation. While thisROI calculation is quite reliable, experiments tend not to be used very often.Sales contests and SPIFFs usually have a specific purpose and are time-critical.Establishing and controlling random experimental and control groups is disrup-tive and counter to the company’s business purpose.
Time-series analysis provides a noninvasive approach to determining the im-pact of a sales contest or SPIFF. To illustrate, Figure 10-4 provides the monthlysales for a product over a three-year period. There are two interventions duringthis time frame. The first is a SPIFF for Product A. The second is a sales contestfor Product B, another product that the sales force sells. The ROI analysis begins
PAGE 385................. 15869$ CH10 05-19-06 09:24:22 PS
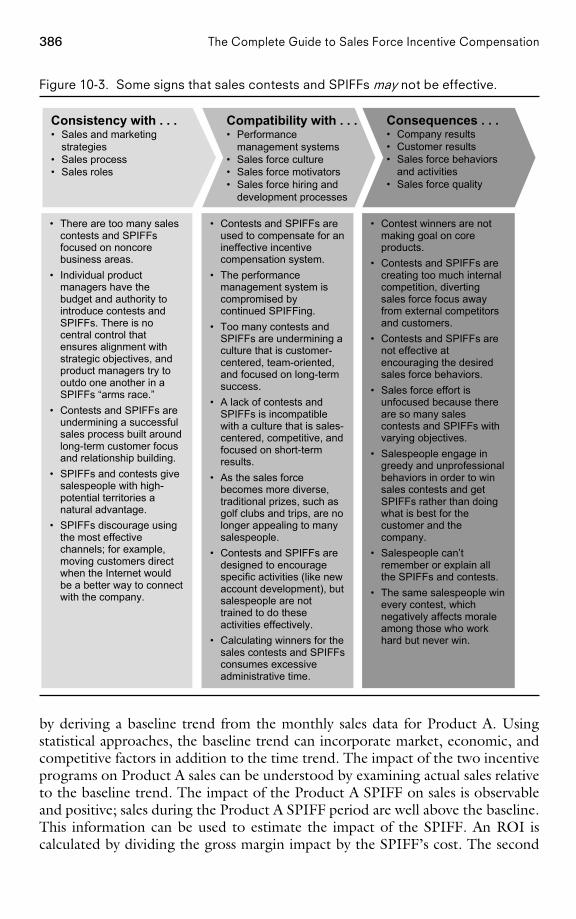
386 The Complete Guide to Sales Force Incentive Compensation
Figure 10-3. Some signs that sales contests and SPIFFs may not be effective.
• Contests and SPIFFs areused to compensate for anineffective incentivecompensation system.
• The performancemanagement system iscompromised bycontinued SPIFFing.
• Too many contests andSPIFFs are undermining aculture that is customer-centered, team-oriented,and focused on long-termsuccess.
• A lack of contests andSPIFFs is incompatiblewith a culture that is sales-centered, competitive, andfocused on short-termresults.
• As the sales forcebecomes more diverse,traditional prizes, such asgolf clubs and trips, are nolonger appealing to manysalespeople.
• Contests and SPIFFs aredesigned to encouragespecific activities (like newaccount development), butsalespeople are nottrained to do theseactivities effectively.
• Calculating winners for thesales contests and SPIFFsconsumes excessiveadministrative time.
• Contest winners are notmaking goal on coreproducts.
• Contests and SPIFFs arecreating too much internalcompetition, divertingsales force focus awayfrom external competitorsand customers.
• Contests and SPIFFs arenot effective atencouraging the desiredsales force behaviors.
• Sales force effort isunfocused because thereare so many salescontests and SPIFFs withvarying objectives.
• Salespeople engage ingreedy and unprofessionalbehaviors in order to winsales contests and getSPIFFs rather than doingwhat is best for thecustomer and thecompany.
• Salespeople can’tremember or explain allthe SPIFFs and contests.
• The same salespeople winevery contest, whichnegatively affects moraleamong those who workhard but never win.
• There are too many salescontests and SPIFFsfocused on noncorebusiness areas.
• Individual productmanagers have thebudget and authority tointroduce contests andSPIFFs. There is nocentral control thatensures alignment withstrategic objectives, andproduct managers try tooutdo one another in aSPIFFs “arms race.”
• Contests and SPIFFs areundermining a successfulsales process built aroundlong-term customer focusand relationship building.
• SPIFFs and contests givesalespeople with high-potential territories anatural advantage.
• SPIFFs discourage usingthe most effectivechannels; for example,moving customers directwhen the Internet wouldbe a better way to connectwith the company.
Compatibility with . . .• Performance
management systems• Sales force culture• Sales force motivators• Sales force hiring and
development processes
Consequences . . .• Company results• Customer results• Sales force behaviors
and activities• Sales force quality
Consistency with . . .• Sales and marketing
strategies• Sales process• Sales roles
by deriving a baseline trend from the monthly sales data for Product A. Usingstatistical approaches, the baseline trend can incorporate market, economic, andcompetitive factors in addition to the time trend. The impact of the two incentiveprograms on Product A sales can be understood by examining actual sales relativeto the baseline trend. The impact of the Product A SPIFF on sales is observableand positive; sales during the Product A SPIFF period are well above the baseline.This information can be used to estimate the impact of the SPIFF. An ROI iscalculated by dividing the gross margin impact by the SPIFF’s cost. The second
PAGE 386................. 15869$ CH10 05-19-06 09:24:23 PS
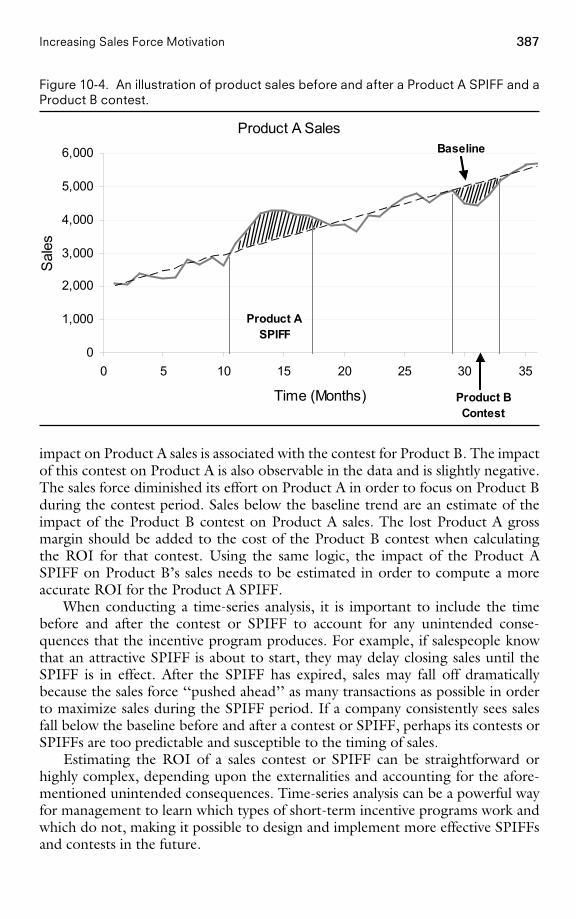
387Increasing Sales Force Motivation
Figure 10-4. An illustration of product sales before and after a Product A SPIFF and aProduct B contest.
Product A Sales
0
1,000
2,000
3,000
4,000
5,000
6,000
0 5 10 15 20 25 30 35
Time (Months)
Sal
es
Product A SPIFF
Product B Contest
Baseline
impact on Product A sales is associated with the contest for Product B. The impactof this contest on Product A is also observable in the data and is slightly negative.The sales force diminished its effort on Product A in order to focus on Product Bduring the contest period. Sales below the baseline trend are an estimate of theimpact of the Product B contest on Product A sales. The lost Product A grossmargin should be added to the cost of the Product B contest when calculatingthe ROI for that contest. Using the same logic, the impact of the Product ASPIFF on Product B’s sales needs to be estimated in order to compute a moreaccurate ROI for the Product A SPIFF.
When conducting a time-series analysis, it is important to include the timebefore and after the contest or SPIFF to account for any unintended conse-quences that the incentive program produces. For example, if salespeople knowthat an attractive SPIFF is about to start, they may delay closing sales until theSPIFF is in effect. After the SPIFF has expired, sales may fall off dramaticallybecause the sales force ‘‘pushed ahead’’ as many transactions as possible in orderto maximize sales during the SPIFF period. If a company consistently sees salesfall below the baseline before and after a contest or SPIFF, perhaps its contests orSPIFFs are too predictable and susceptible to the timing of sales.
Estimating the ROI of a sales contest or SPIFF can be straightforward orhighly complex, depending upon the externalities and accounting for the afore-mentioned unintended consequences. Time-series analysis can be a powerful wayfor management to learn which types of short-term incentive programs work andwhich do not, making it possible to design and implement more effective SPIFFsand contests in the future.
PAGE 387................. 15869$ CH10 05-19-06 09:24:24 PS
388 The Complete Guide to Sales Force Incentive Compensation
Time-Series Analysis Provides Insights for a PharmaceuticalFirm
A pharmaceutical firm conducted a time-series analysis to determine whatimpact SPIFFs have on sales force activity, sales, and profits. Data forfive SPIFFs on four different products were examined. Each SPIFF lastedbetween three and six months. The analysis was particularly difficult be-cause the ability of a pharmaceutical salesperson to affect short-term salesis quite low and because numerous external factors (such as negative pressabout one of the firm’s drugs) and other marketing influences in addition tothe sales force had a large impact on sales. Despite these difficulties, sev-eral interesting conclusions emerged from the analysis in this particularcase, including the following:
• The SPIFFs led to an increase in both the quantity and quality of callactivity (salespeople made more calls to more high-potential accountsduring the SPIFF periods).
• These behavior changes drove small sales improvements.
• Profit outcomes were mixed; one of the SPIFFs had a positive ROI, butthe others did not.
• In most cases, the SPIFFs helped the firm achieve the market shareoutcome it desired.
• Sales force effort on the other products in the portfolio was sustainedduring the SPIFF periods.
Designing Effective Sales Contests and SPIFFs
Sales Contests and SPIFFs: Purpose, Company Factors, and Decisions. There area number of SPIFF and contest decisions that need to be made. They are listed inthe middle column of Figure 10-5 and described in detail in the subsequent sec-tion. These decisions depend upon the purpose of the SPIFF or contest and sev-eral company factors.
An Incentive Designed to Encourage Support forUnderemphasized Sales Priorities
The vice president of sales at Concerto Software needed a new, creative,and fun way to motivate sales force goal attainment. Traditionally, the com-pany’s national sales goals were achieved not because every region consis-tently met its numbers, but because one region would make up for the slackof another. The vice president challenged the sales force by offering toshave his head if all four worldwide regions of the sales team hit theirfourth-quarter quotas. Every sales team made its numbers, and overall rev-
PAGE 388................. 15869$ CH10 05-19-06 09:24:24 PS
389Increasing Sales Force Motivation
Figure 10-5. Sales contests and SPIFFs: purpose, company factors, and decisions.
Company FactorsPurpose
• What type?
• How many?
• For whatproducts orcustomers?
• Reward forresults oractivities?
• What prizes?
• How manywinners?
Encourage support forunderemphasized
sales prioritiesExamples:• Emphasize newproducts
• Combat competitivelaunch
• Reward more profitablesales
Create sales forceexcitement
Examples:• Create short-termenergy boost
• Attain year-end goals• Jump-start first-quartersales in an annual plan
Compensatesalespeople fairly
Examples:• Correct for a poorlydesigned IC plan
• Offset pay impact ofgoals that are too high
Decisions
Culture andmotivationphilosophy
Ability tomeasure andadminister
Companybudget
enue increased by 4 percent for the quarter and 8 percent for the year. Thestunt also raised $4,000 for charity, as salespeople were allowed to bid fora chance to shear off a strip of the boss’s hair with an electric razor onstage at the annual sales kickoff meeting.
A Contest Designed to Create Sales Force Excitement
A leading digital printing manufacturer wanted to create some sales forceexcitement in anticipation of a large industry conference. The event wasexpected to generate many potential sales leads, and management felt thata unique sales contest was needed to energize the sales force for thisimportant event. The firm developed an online incentive program that al-lowed participants to accumulate credits for sales and redeem themthrough an online catalog of unique gifts. The program allowed participantsto select the prizes they valued most (for example, electronics, sportsequipment, travel, or luxury items), and also saved sales management the
PAGE 389................. 15869$ CH10 05-19-06 09:24:26 PS
390 The Complete Guide to Sales Force Incentive Compensation
hassle of guessing which prizes people might want and how many to preor-der. The program is credited with helping the sales force exceed its salesgoals for the conference.
A Contest Designed to Supplement the Main Incentive Plan
Management at a financial company overestimated national demand for thefirm’s services and set sales force goals much too high. By the end ofAugust, less than 10 percent of the salespeople were on track to makegoal. This meant that over 90 percent of the sales force would not earn theaccelerated commission rate for sales above goal. Management did notwant to establish a precedent of reducing a national goal that proved toochallenging. However, it feared that many salespeople would ‘‘check out’’for the rest of the year, saving their efforts for the following year, whengoals might be more attainable. In order to generate some short-term ex-citement, management established a special contest for the sales forcebased on the last trimester sales. This also helped to ensure that the salesforce, which had worked hard, was compensated fairly and was not undulypenalized for the firm’s goal-setting error.
Figure 10-5 lists three primary reasons that a management team might decideto use sales contests and SPIFFs to motivate and reward the sales force. Thereasons are:
1. To encourage support for underemphasized sales priorities. A new productneeds to be launched hard. Market segments that are threatened by com-petitors need to be defended. Products that are not on track to make goalneed an extra boost. The sales force may not exert the requisite energy toaccomplish these objectives within the existing incentive compensationscheme. A SPIFF or contest can provide the necessary impetus to focussales force effort.
2. To create ongoing sales force excitement. Sometimes sales forces slow down.SPIFFS and contests can help provide a short-term energy boost whenquarterly sales are lagging, when important messages need to be rein-forced, or when the efforts of top performers deserve greater recognition.
3. To compensate salespeople fairly. Too frequently, the corporate revenuegoal is set unrealistically high. Incentive compensation plans are geared tothe high goal. When achievement becomes unattainable, the variable-paycomponent for the sales force dwindles. Sales force motivation and moralebegin to suffer, and the sales shortfall can grow. Sales leadership can useSPIFFs and contests to supplement the incentive plan and revitalize thesales force.
PAGE 390................. 15869$ CH10 05-19-06 09:24:26 PS
391Increasing Sales Force Motivation
Not only does the purpose of the SPIFF or contest drive its design, but com-pany factors such as the following also contribute:
1. Firm culture and motivation philosophy. Sales leaders’ philosophy abouthow to best motivate the sales team influences a firm’s SPIFF and conteststrategy. Some sales leaders like to rely heavily on such programs to en-hance short-term sales force motivation. Others prefer to use the firm’smain incentive program or performance management processes, such ascoaching and feedback, as primary sales force motivators. Contests andSPIFFs are most compatible with a sales force culture that is sales-centered, competitive, and focused on short-term results. Excessive use ofSPIFFs and contests can undermine a culture that is customer-centered,team-oriented, and focused on long-term success.
2. Ability to measure results and administer the program. Successful contestsand SPIFFs require accurate and timely results measurement. If the com-pany is unable to measure attainment correctly and quickly, the programwill not have meaning to the sales force. Contests and SPIFFs create ad-ministrative overhead. Many firms that run sales contests and SPIFFs reg-ularly report that the cost and complexity of administering such programsis a significant concern.
3. Firm budget. Contests and SPIFFs are generally considered to be a fairlyinexpensive way to generate extra sales effort. Award values tend to besmall, and, in the case of sales contests, there tend to be a limited numberof winners. Nevertheless, both the cost of awards and the cost of adminis-tration can accumulate. The firm’s sales force budget influences how manySPIFFs and contests and how many and what type of awards the firm canoffer.
SPIFFs and Contests with a Limited Budget
SPIFFs and sales contests do not have to cost the firm a lot of money tohave a large impact. In fact, often the recognition and trophy value associ-ated with a sales contest or SPIFF are more valuable than the tangibleprize that a winner receives. Be sure to leverage this value by:
• Making a big deal out of the award presentation. Present even inexpen-sive awards (such as gift cards or sports event tickets) personally andoffer sincere congratulations.
• Making it humorous and symbolic. For example, top sellers at a com-modities firm get the Beaver Award (a stuffed beaver with an engravedplaque), because the beaver is the hardest-working creature in the ani-mal kingdom.
• Making it fun. For example, a telemarketing firm gives its telephonesales reps pennies for closing sales, and these are dropped into a gum-
PAGE 391................. 15869$ CH10 05-19-06 09:24:27 PS
392 The Complete Guide to Sales Force Incentive Compensation
ball machine. Small cash awards are given, depending on the color ofthe gumball that comes out.
• Announcing winners to the entire staff. For example, a bank publishesarticles in an employee newsletter highlighting the accomplishments oftop performers.
• Providing a lasting memory. Cash awards can be used to pay the billsand are soon forgotten. Merchandise awards, even inexpensive ones,are a visible reminder that the salesperson is valued by the company.Abbott Laboratories puts a star on the business cards of its top salesperformers.
Contest and SPIFF Design Issues. Some of the most frequently asked questionsabout how to design effective sales contests and SPIFFs are listed and discussedhere.
Should the Contest or SPIFF Be Based on Activity Measures or Results Measures?Sales contests and SPIFFs can be tied to numerous different performance mea-sures. The most commonly used measures are results measures, such as sales,growth, quota attainment, and market share. Since the ultimate purpose of mostSPIFFs and contests is to produce sales results, it is logical to tie awards directlyto measures that directly reflect those results.
In general, the advice provided in Chapter 6 on how to select performancemeasures for an incentive plan applies to the selection of measures for sales con-tests and SPIFFs as well. The best performance measures for sales contests andSPIFFs are:
• Consistent with business strategy. Measures are an effective way to tell thesales force what is important and what the company hopes to accomplishthrough a sales contest or SPIFF. For example, a contest that is designedto energize the sales team to achieve a national goal becomes more power-ful if it rewards for territory goal attainment. A SPIFF that is intended tothwart a competitor sends a more potent message if it awards for sharegain or competitive wins. On the other hand, a SPIFF on sales gains fora secondary product can distract salespeople from the more importantcorporate product priorities.
• Objectively and accurately measurable. If salespeople perceive performancemeasurement to be unfair, the desired motivational impact of the contestor SPIFF is lost, and the program may backfire. For this reason, results-based measures (such as sales and market share) are usually preferred overmore subjective measures, such as activity measures, which often rely onmanagement judgment or salesperson self-reporting.
• Directly affected by the sales force. Salespeople should be able to directlyaffect the measure that will be used to determine sales contest and SPIFFawards. If other factors besides current sales force skills, capabilities, and
PAGE 392................. 15869$ CH10 05-19-06 09:24:27 PS
393Increasing Sales Force Motivation
effort have a large impact on the measure, then the motivational impactof the program is weakened. For this reason, sales contests and SPIFFs areusually most effective in selling environments with considerable sales forceprominence and high short-term sales force causality.
• Fair. Measures should not favor territories or salespeople with specificcharacteristics that are outside of the salesperson’s control. For example,when a travel company ran a contest to promote sales of internationalbusiness travel, many salespeople did not have enough corporate custom-ers with international travel needs to compete effectively. As a result, themajority of the salespeople became disengaged quickly. The short-termnature of a SPIFF or contest sometimes makes fairness less important thanthe other criteria mentioned here. For example, if there is a contest thatrewards the highest sales gain in a month for a new product, there arelikely to be biases in opportunity, but most sales forces are able to moveon after the apparent unfairness has played out.
Many companies have used activity-based contests and SPIFFs successfully toencourage a specific sales force behavior in order to drive long-term results. Someexamples of situations in which activity-based measures can work successfully in-clude the following:
• Activity awards are useful when territory results cannot be measured. Aseller of hair care products awards gift certificates to the two salespeopleeach month who ‘‘touch the most customers’’ (including customer classestaught, cold calls, appointments, and visits). The danger in running anactivity-based contest like this is that the contest will motivate an increasein the quantity of the desired activity, but it may also trigger a decrease inthe quality. Such contests are typically most effective when they are usedonly for short periods of time to energize the sales team to accomplish aspecific short-term goal.
• Activity awards can energize a service organization. Mercury InteractiveCorp, a software company, had a sales force plus a service group thatperformed onsite maintenance and troubleshooting for customers’ com-puter systems. The company wanted to encourage the service techniciansto look for sales opportunities while working with clients and to pass thoseleads on to the sales force. At first the company asked the technicians todo this voluntarily, but the program was only moderately successful. Toprovide greater incentive, the company implemented an online rewardsprogram. Technicians could earn points redeemable for merchandise byproviding leads and even more points by providing leads that generatedbusiness. The program cost the company just $7,000 and is credited withgenerating over $600,000 in new business.
• Activity awards can spark new product sales. When IBM launched its OS/2 operating system, it encouraged all employees to help generate demand
PAGE 393................. 15869$ CH10 05-19-06 09:24:28 PS
394 The Complete Guide to Sales Force Incentive Compensation
by referring potential customers to an IBM dealership for a demonstra-tion. Employees who made 15 referrals earned bronze medals; those whomade more referrals earned silver and goal medals.
• Sales force assistance in recruiting is a best practice. Every selling organiza-tion tries to attract and retain the best salespeople. It is widely recognizedthat sales force referrals provide a very good group of candidates. Compa-nies often offer prizes or cash awards to salespeople who provide candi-dates that join the organization and stay for a predetermined period oftime, usually at least six months.
Shell Oil Creates Special Incentives for Wholesalers to Focuson Customers
Only 20 percent of the 14,000 Shell gas stations across the United Statesare fully serviced and operated by Shell Oil Company; the majority areowned or franchised and supplied by approximately 700 independent gaso-line wholesalers. A special Go Further incentive program for the wholesal-ers helps the firm ensure that customers get a uniformly good experienceat every Shell station, regardless of ownership. Wholesalers can win tripsto exotic locations, such as Sydney, Venice, and Prague, if their stationsare compliant with a 10-point customer value proposition (CVP) that in-cludes standards for competitive pricing, cleanliness, lighting at night,working equipment, landscaping, and other services. The stations are ratedtwice a year by mystery shoppers. Stations with high CVP scores attractgreater brand loyalty and sell 5 percent more gasoline than noncompliantstations.
Should Sales Contests and SPIFFs Reward Individualor Team Performance?
In selling environments where causality at the individual salesperson levelis high and results can be measured accurately, individual rewards are gen-erally preferred over team rewards. Individual rewards allow salespeopleto feel that they have greater control over the performance outcome andare therefore usually more motivational. However, in selling situationswhere salespeople must work together as a true team to create results,where team selling is part of the culture, and where measurability at theindividual salesperson level is poor, team-based contests can be an effec-tive way to motivate a team to work together to accomplish a goal. Awardsin team settings not only reward team members for their efforts, but alsocan have a side benefit of encouraging socialization among team membersto encourage stronger teamwork in the future. Examples of team rewardsinclude closing down the office for an afternoon to attend a group outing,
PAGE 394................. 15869$ CH10 05-19-06 09:24:28 PS
395Increasing Sales Force Motivation
an all-expense-paid trip for the team, a group lunch or dinner, or a victoryparty to celebrate the achievement of an important goal.
How Many Winners? This question relates more to sales contests than to SPIFFs.A SPIFF (as we define it in this book) has a large Engagement Rate. Almosteveryone in the sales force will earn money and/or prizes if it is successful. Asuccessful sales contest, on the other hand, has a limited number of winners andis designed to appeal to the competitive nature of salespeople. Deciding on theright number of winners for a sales contest involves a delicate balance that can beillustrated through an example. Suppose a sales manager has a $10,000 budget tobe used as prize money in a quarterly sales contest for 20 salespeople. Which ofthe following sales contest designs is likely to produce the best results?
• Contest A: The top 10 performers get $1,000 each.• Contest B: The single top performer gets $10,000.
The answer to this question is not straightforward. A successful sales contestrequires high levels of sales force traction. Traction is a function of both thechance of winning and the award desirability. Contest A has a relatively largenumber of winners, so more salespeople will feel that they have a reasonablechance of winning. This helps traction. On the other hand, some salespeople maydecide that a prize of just $1,000 and the distinction of ‘‘being in the top half ’’ isnot attractive enough to justify the extra effort required to win. The small per-ceived prize value discourages participation. Contest B, on the other hand, hasjust one winner. There is a risk that many salespeople will believe that they cannotwin and give up too soon. A low chance of winning lowers traction. On the otherhand, the award has 10 times the dollar value and the greater prestige associatedwith being the top seller. High award desirability enhances traction. As a generalrule, sales contests with a mid range of winners are most effective, as they achievethe right balance between the chance of winning and award desirability.
Some additional suggestions for managing the number of winners throughsales contest design include the following:
• Rather than specifying the number of contest winners up front, considertying the contest to goal achievement and then managing the number ofwinners through the difficulty of the goal. For example, a contest thatpromises a trip to every salesperson who makes 105 percent of a sales goalwill have more winners than one that awards the trip only to those whoachieve 110 percent. Goal-based contests are appealing because sales-people know up front what they need to do to win, and everyone who iswilling to work hard enough can be a winner. There is less internally fo-cused competition than is likely when the number of winners is limitedand winners are based on a forced ranking of salespeople. However, sales-people are a competitive group, and some level of internal competitioncan spark greater interest in a contest. In addition, when the number of
PAGE 395................. 15869$ CH10 05-19-06 09:24:29 PS
396 The Complete Guide to Sales Force Incentive Compensation
available prizes is limited (for example, when there are only 10 hotelrooms available), it is impractical to run a contest in which the number ofwinners is not specified up front.
• Consider balancing the number of winners across sales divisions or re-gions. For example, specify that winners will include the top 10 percentof the sales force plus any salesperson who comes in first or second in hisregion (even if he is not in the top 10 percent nationally). This helps tocompensate for any regional biases that may exist and ensures that eachregion or division is engaged.
• When the number of available prizes is limited, consider a lottery format.For example, when a salesperson reaches a contest goal, her name is en-tered into a lottery for a chance to win a luxury automobile. Salespeoplewho pass higher performance hurdles get additional entries, thereby in-creasing their chance of winning. With a lottery format, everyone feelsthat she has a shot at winning (even historically poor performers), andeveryone is likely to be inspired to participate. In addition, there is evi-dence that some randomness in a sales contest can be very motivating tosalespeople, as the element of luck makes the contest more fun and createsadditional excitement. A significant risk in such schemes is that the highestperformer is unlikely to be the winner, even though he has the highestchance of winning.
Cash Awards or Merchandise or Travel or Recognition Awards? Selecting the rightaward is important to the success of any sales contest or SPIFF. If an award is verydesirable to the sales force, salespeople are more likely to put forth extra effort inhopes of attaining it, and incremental sales will be higher.
A challenge for incentive plan designers is that most sales forces are made upof a diverse set of salespeople with varied award preferences. A cash reward appealsto salespeople who are motivated by money; however, many salespeople are moti-vated by other factors besides money. Research has identified five universal moti-vators that explain what drives salespeople: the need for achievement, socialaffiliation, power, ego gratification, and survival. Of these needs, only three—achievement, ego gratification, and survival—can be satisfied directly with money.Noncash awards will be much more effective for salespeople who are motivatedprimarily by a desire for power and/or social affiliation. Noncash awards (in addi-tion to money) can fulfill the need for achievement and ego gratification as well.Several examples of noncash awards that appeal to each of these motivators arelisted in Figure 10-6. A portfolio of cash and noncash awards should meet themotivation needs for the entire sales force.
Consider Awards That Appeal to Top Performers
When selecting awards for a sales contest or SPIFF, consider what awardsare most likely to appeal to the group of salespeople at which the contest
PAGE 396................. 15869$ CH10 05-19-06 09:24:29 PS
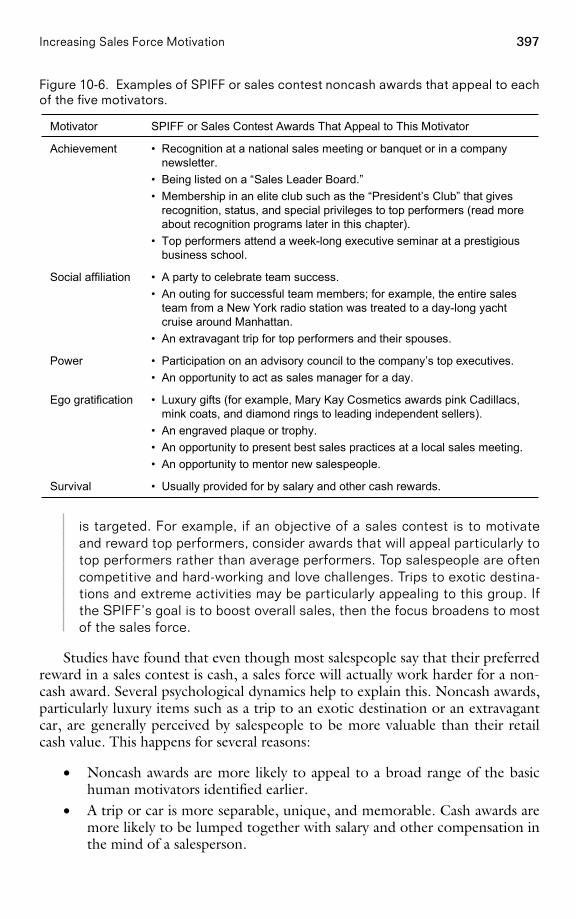
397Increasing Sales Force Motivation
Figure 10-6. Examples of SPIFF or sales contest noncash awards that appeal to eachof the five motivators.
• Usually provided for by salary and other cash rewards.Survival
• Luxury gifts (for example, Mary Kay Cosmetics awards pink Cadillacs,mink coats, and diamond rings to leading independent sellers).
• An engraved plaque or trophy.• An opportunity to present best sales practices at a local sales meeting.• An opportunity to mentor new salespeople.
Ego gratification
• Participation on an advisory council to the company’s top executives.• An opportunity to act as sales manager for a day.
Power
• A party to celebrate team success.• An outing for successful team members; for example, the entire sales
team from a New York radio station was treated to a day-long yachtcruise around Manhattan.
• An extravagant trip for top performers and their spouses.
Social affiliation
• Recognition at a national sales meeting or banquet or in a companynewsletter.
• Being listed on a “Sales Leader Board.”• Membership in an elite club such as the “President’s Club” that gives
recognition, status, and special privileges to top performers (read moreabout recognition programs later in this chapter).
• Top performers attend a week-long executive seminar at a prestigiousbusiness school.
Achievement
SPIFF or Sales Contest Awards That Appeal to This MotivatorMotivator
is targeted. For example, if an objective of a sales contest is to motivateand reward top performers, consider awards that will appeal particularly totop performers rather than average performers. Top salespeople are oftencompetitive and hard-working and love challenges. Trips to exotic destina-tions and extreme activities may be particularly appealing to this group. Ifthe SPIFF’s goal is to boost overall sales, then the focus broadens to mostof the sales force.
Studies have found that even though most salespeople say that their preferredreward in a sales contest is cash, a sales force will actually work harder for a non-cash award. Several psychological dynamics help to explain this. Noncash awards,particularly luxury items such as a trip to an exotic destination or an extravagantcar, are generally perceived by salespeople to be more valuable than their retailcash value. This happens for several reasons:
• Noncash awards are more likely to appeal to a broad range of the basichuman motivators identified earlier.
• A trip or car is more separable, unique, and memorable. Cash awards aremore likely to be lumped together with salary and other compensation inthe mind of a salesperson.
PAGE 397................. 15869$ CH10 05-19-06 09:24:30 PS
398 The Complete Guide to Sales Force Incentive Compensation
• Salespeople may not be able to justify spending a monetary award on afrivolous trip or a fancy luxury car. Instead, they may spend it on morepractical things, like paying bills. But if they earn the trip or car throughhard work and must ‘‘use it or lose it,’’ there is no need to justify theexpense.
• A trip or car is more visible to peers, has trophy value, and provides avisible link between the award and the company.
• Cash awards have a short ‘‘half-life’’: Salespeople who get the award relishit, but forget it quickly, too. A prominent noncash award is rememberedfor a long time. Long after an award is given, you hear winners reminisc-ing, ‘‘Do you remember the time two years ago when . . . ?’’
At the same time, there are some advantages to using cash awards for SPIFFsand contests. Cash can be used by everyone; almost all salespeople say they likegetting cash, whereas noncash awards do not suit all winners. Cash awards areusually easier to administer: There is no need to select the awards, plan the trip,or handle the logistics of award distribution.
Gift card credits redeemable through online catalogs are used by many com-panies as awards for sales contests and SPIFFs. Such awards allow companies torealize many of the benefits of both noncash and cash awards simultaneously. Likecash, gift cards and online catalogs allow salespeople to select items that they trulywant. They also free companies from having to select and distribute awards. Yetunlike cash, gift cards and catalog items can be branded, personalized, or custo-mized, and are more targeted and memorable than cash awards.
Clintar’s Incentive Program Offers Choice Throughan Online Catalog
Prior to 2000, Canadian groundskeeping company Clintar occasionally ransales incentive programs, although most of them were not very memorableto franchise owners. Owners would compete for a single prize (such as aset of golf clubs or a television set), which someone at the home officewould select and distribute to winners. Invariably there were complaintsabout prizes; winners would want to trade a prize in for something else orwould discover product defects. Distributing and replacing prizes becamea logistical nightmare for the company. In order to improve this situation,Clintar decided to change its awards. Today, franchise owners who growmonthly sales earn credits redeemable though an online catalog for a vari-ety of products, including electronics, housewares, sports equipment,travel, and luxury items. Franchise owners can select the prizes they reallywant. Since an outside vendor handles all the data gathering, communica-tions, and prize distribution, the home office is freed of these time-consumingresponsibilities. Sales have increased by at least 10 percent each year
PAGE 398................. 15869$ CH10 05-19-06 09:24:31 PS
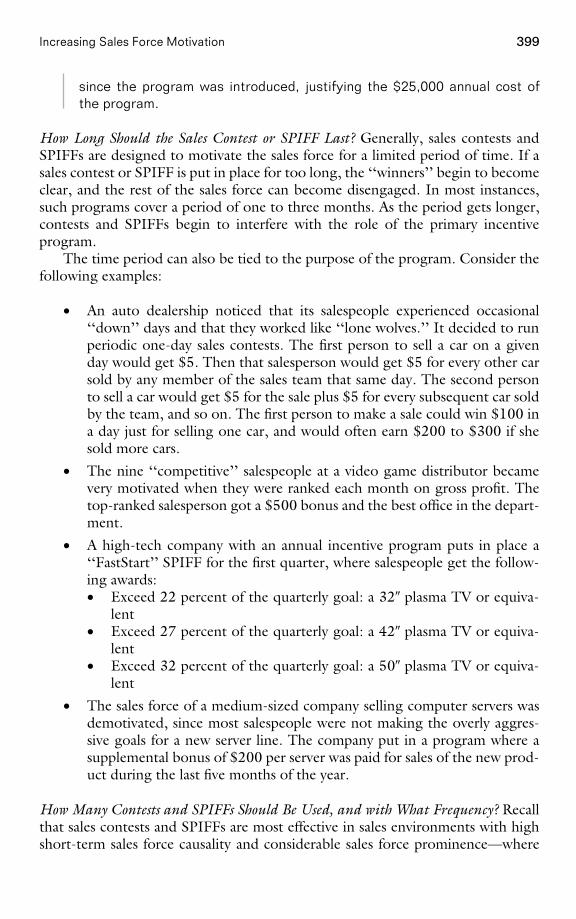
399Increasing Sales Force Motivation
since the program was introduced, justifying the $25,000 annual cost ofthe program.
How Long Should the Sales Contest or SPIFF Last? Generally, sales contests andSPIFFs are designed to motivate the sales force for a limited period of time. If asales contest or SPIFF is put in place for too long, the ‘‘winners’’ begin to becomeclear, and the rest of the sales force can become disengaged. In most instances,such programs cover a period of one to three months. As the period gets longer,contests and SPIFFs begin to interfere with the role of the primary incentiveprogram.
The time period can also be tied to the purpose of the program. Consider thefollowing examples:
• An auto dealership noticed that its salespeople experienced occasional‘‘down’’ days and that they worked like ‘‘lone wolves.’’ It decided to runperiodic one-day sales contests. The first person to sell a car on a givenday would get $5. Then that salesperson would get $5 for every other carsold by any member of the sales team that same day. The second personto sell a car would get $5 for the sale plus $5 for every subsequent car soldby the team, and so on. The first person to make a sale could win $100 ina day just for selling one car, and would often earn $200 to $300 if shesold more cars.
• The nine ‘‘competitive’’ salespeople at a video game distributor becamevery motivated when they were ranked each month on gross profit. Thetop-ranked salesperson got a $500 bonus and the best office in the depart-ment.
• A high-tech company with an annual incentive program puts in place a‘‘FastStart’’ SPIFF for the first quarter, where salespeople get the follow-ing awards:• Exceed 22 percent of the quarterly goal: a 32� plasma TV or equiva-
lent• Exceed 27 percent of the quarterly goal: a 42� plasma TV or equiva-
lent• Exceed 32 percent of the quarterly goal: a 50� plasma TV or equiva-
lent
• The sales force of a medium-sized company selling computer servers wasdemotivated, since most salespeople were not making the overly aggres-sive goals for a new server line. The company put in a program where asupplemental bonus of $200 per server was paid for sales of the new prod-uct during the last five months of the year.
How Many Contests and SPIFFs Should Be Used, and with What Frequency? Recallthat sales contests and SPIFFs are most effective in sales environments with highshort-term sales force causality and considerable sales force prominence—where
PAGE 399................. 15869$ CH10 05-19-06 09:24:33 PS
400 The Complete Guide to Sales Force Incentive Compensation
the extra effort put forth by salespeople in response to a SPIFF or contest hasimmediate sales impact. In environments with very long selling cycles, or whereother factors besides current sales force effort have a large impact on sales, salescontests and SPIFFs should be used rarely, if ever, to motivate effort.
The Effectiveness of SPIFFs Changes as a Sales ProcessEvolves
Computer hardware vendors once used SPIFFs to encourage their distribu-tion partners to sell specific products. This type of SPIFF has lost its effec-tiveness as the sales approach for these distributors has evolved over thelast several years. Partners once engaged in transactional selling of prod-ucts. Today, successful partners must consultatively sell complex multiven-dor solutions. Customers look to these partners as trusted advisers thatsolve complex business and technology problems. SPIFFs on specific prod-ucts are at odds with the new sales approach, since they enable salesper-son behavior to be influenced by an agenda other than doing what is bestfor the customer. In 2004, Cisco adapted its incentive program for partnersto align it more closely with this new reality. Distribution partners receiverebates for sales only when specified levels of customer satisfaction arereached.
Given an appropriate selling environment, several internal factors determinehow many and how often sales contests and SPIFFs should be used. These factorsinclude the following:
• Culture. Some companies have very ‘‘contest-friendly’’ cultures. They runSPIFFs and sales contests all the time. Salespeople come to expect theseprograms to be an ordinary occurrence. This happens particularly at com-panies with many products and those where add-on incentive programsare controlled and paid for by product managers. Some of these compa-nies run dozens of contests simultaneously, many of them lasting only amonth or even a week. Salespeople eagerly await the announcement ofthe latest and greatest program, standing ready to change their sales focusin order to maximize their earnings. Other companies have cultures thatare incompatible with this approach. Too many SPIFFs and sales contestsrun counter to a culture that is focused more on long-term success thanon short-term results, emphasizes teamwork, and has a strong customerorientation.
• Ability and willingness to administer them. Contests and SPIFFs can bevery difficult, time-consuming, and costly to administer effectively. Fre-quent and accurate tracking and communication of progress to the salesforce is needed to keep salespeople focused on their goals and engaged inthe program. A common pitfall is to communicate program guidelines
PAGE 400................. 15869$ CH10 05-19-06 09:24:33 PS
401Increasing Sales Force Motivation
only at the beginning of the program and to offer progress reports only atthe end; in the meantime, the sales force loses focus, and motivationwanes. Particularly at companies that run multiple SPIFFs and sales con-tests simultaneously, sales administration departments often report thatone of their greatest challenges is administering all the add-on incentiveprograms. A company that wants to run many sales contests and SPIFFsmust be willing to invest in the administration systems and processes re-quired to do so successfully.
MCI Telecommunications Runs First Internet-Based SalesContest
The Internet provides an ideal mechanism for administering a sales con-test or SPIFF because the program can be updated and accessed in realtime. MCI Telecommunications ran what may have been the first Internet-administered sales contest in the fall of 1995. Salespeople gained pointsfor revenue increases that could be redeemed for more than three hundredprizes in an online catalog. Since salespeople could connect to the MCInetwork through their laptop, they could find out at any time where theystood and what prizes were available. A significant side benefit of the con-test was that in order to track their progress and obtain prizes, the sales-people had to learn how to use the firm’s new Internet product, internetMCI,just as they were getting ready to go out and sell the product to customers.
Online Incentive Administration Enhances Productivity atCitigroup
In 2001, a push to cut costs at Citigroup led the international financialservices firm to replace its paper-based employee incentive program. Asthe company grew, it had become prohibitively expensive to print anddistribute prize catalogs to 270,000 employees in more than a hundredcountries. In addition, administration of the program had become unman-ageable. The company’s human resources staff, as well as each managerresponsible for department-level awards, could easily dedicate up to oneday per week to administering the program. This was a considerable drainon productivity.
Citigroup worked with an incentive company to replace the paper-based program with a branded Citigroup employee intranet site, where par-ticipants could log on and convert their award to a gift certificate fromone of thousands of worldwide retailers. The ‘‘self-service’’ aspect of theprogram reduced administration headaches for HR and department manag-ers, and significantly decreased production and lost-time expenses.
• Goal-setting certainty and degree of stretch in goals. Firms sometimes runcontests and SPIFFs to remedy unfairness in the main compensation plan.
PAGE 401................. 15869$ CH10 05-19-06 09:24:34 PS
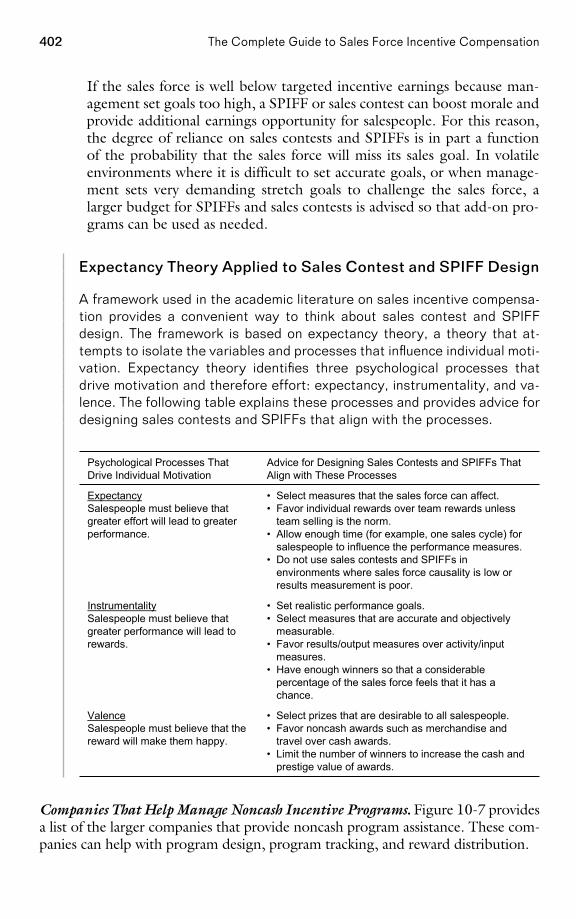
402 The Complete Guide to Sales Force Incentive Compensation
If the sales force is well below targeted incentive earnings because man-agement set goals too high, a SPIFF or sales contest can boost morale andprovide additional earnings opportunity for salespeople. For this reason,the degree of reliance on sales contests and SPIFFs is in part a functionof the probability that the sales force will miss its sales goal. In volatileenvironments where it is difficult to set accurate goals, or when manage-ment sets very demanding stretch goals to challenge the sales force, alarger budget for SPIFFs and sales contests is advised so that add-on pro-grams can be used as needed.
Expectancy Theory Applied to Sales Contest and SPIFF Design
A framework used in the academic literature on sales incentive compensa-tion provides a convenient way to think about sales contest and SPIFFdesign. The framework is based on expectancy theory, a theory that at-tempts to isolate the variables and processes that influence individual moti-vation. Expectancy theory identifies three psychological processes thatdrive motivation and therefore effort: expectancy, instrumentality, and va-lence. The following table explains these processes and provides advice fordesigning sales contests and SPIFFs that align with the processes.
• Select prizes that are desirable to all salespeople.• Favor noncash awards such as merchandise and
travel over cash awards.• Limit the number of winners to increase the cash and
prestige value of awards.
ValenceSalespeople must believe that thereward will make them happy.
• Set realistic performance goals.• Select measures that are accurate and objectively
measurable.• Favor results/output measures over activity/input
measures.• Have enough winners so that a considerable
percentage of the sales force feels that it has achance.
InstrumentalitySalespeople must believe thatgreater performance will lead torewards.
• Select measures that the sales force can affect.• Favor individual rewards over team rewards unless
team selling is the norm.• Allow enough time (for example, one sales cycle) for
salespeople to influence the performance measures.• Do not use sales contests and SPIFFs in
environments where sales force causality is low orresults measurement is poor.
ExpectancySalespeople must believe thatgreater effort will lead to greaterperformance.
Advice for Designing Sales Contests and SPIFFs ThatAlign with These Processes
Psychological Processes ThatDrive Individual Motivation
Companies That Help Manage Noncash Incentive Programs. Figure 10-7 providesa list of the larger companies that provide noncash program assistance. These com-panies can help with program design, program tracking, and reward distribution.
PAGE 402................. 15869$ CH10 05-19-06 09:24:34 PS
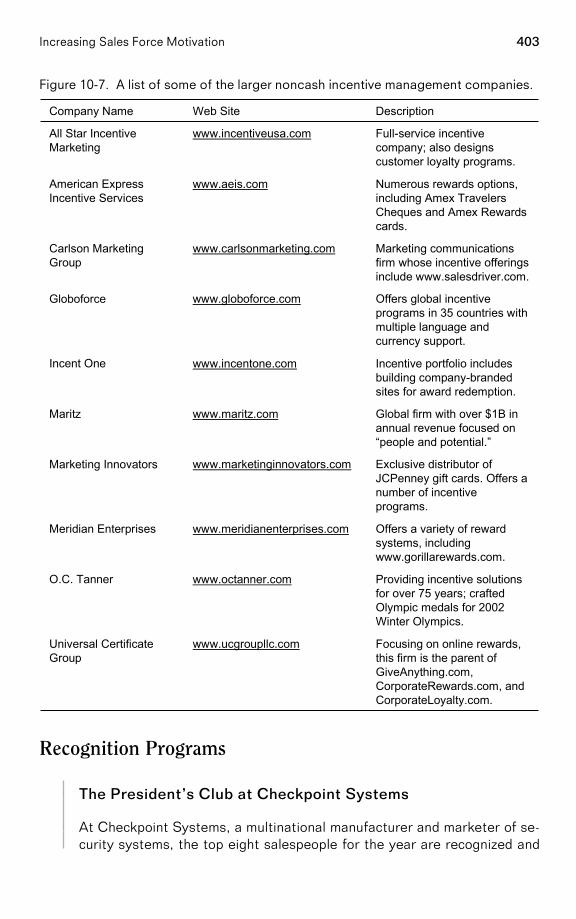
403Increasing Sales Force Motivation
Figure 10-7. A list of some of the larger noncash incentive management companies.
Focusing on online rewards,this firm is the parent ofGiveAnything.com,CorporateRewards.com, andCorporateLoyalty.com.
www.ucgroupllc.comUniversal CertificateGroup
Providing incentive solutionsfor over 75 years; craftedOlympic medals for 2002Winter Olympics.
www.octanner.comO.C. Tanner
Offers a variety of rewardsystems, includingwww.gorillarewards.com.
www.meridianenterprises.comMeridian Enterprises
Exclusive distributor ofJCPenney gift cards. Offers anumber of incentiveprograms.
www.marketinginnovators.comMarketing Innovators
Global firm with over $1B inannual revenue focused on“people and potential.”
www.maritz.comMaritz
Incentive portfolio includesbuilding company-brandedsites for award redemption.
www.incentone.comIncent One
Offers global incentiveprograms in 35 countries withmultiple language andcurrency support.
www.globoforce.comGloboforce
Marketing communicationsfirm whose incentive offeringsinclude www.salesdriver.com.
www.carlsonmarketing.comCarlson MarketingGroup
Numerous rewards options,including Amex TravelersCheques and Amex Rewardscards.
www.aeis.comAmerican ExpressIncentive Services
Full-service incentivecompany; also designscustomer loyalty programs.
www.incentiveusa.comAll Star IncentiveMarketing
DescriptionWeb SiteCompany Name
Recognition Programs
The President’s Club at Checkpoint Systems
At Checkpoint Systems, a multinational manufacturer and marketer of se-curity systems, the top eight salespeople for the year are recognized and
PAGE 403................. 15869$ CH10 05-19-06 09:24:35 PS
404 The Complete Guide to Sales Force Incentive Compensation
invited to join the President’s Club. Club members get a five-day group tripto an exotic location. But the greatest honor given to the group is that itgets to act as an advisory council to the company’s top executives.
Many firms have formal sales force recognition programs to showcase and rewardthe medium- and long-term efforts of high-performing salespeople. Recognitionis usually based on performance over a longer period than sales contests andSPIFFs—typically one year or more. Salespeople who are selected for recognitionprograms may receive cash, merchandise, or travel awards, but the most importantpart of the recognition program is typically the highlighting of their achievementsbefore their peers, management, and/or customers. Often, recognition programsinclude an invitation to be part of a select group, which might be called the Presi-dent’s Club, the Inner Circle, or Million Dollar Roundtable. Recognition pro-grams not only reward top performers, but are also a way for management tosignal to the rest of the sales force what it takes to be successful. In many compa-nies, recognition programs may have greater impact on morale and motivation fora much lower cost than sales contests or SPIFFs.
‘‘We work for money, but we strive for plaques.’’
Andy Anderson, former vice president of sales, Searle
Recognition programs are generally well liked by salespeople. Such programsare much respected and considered to be almost sacred by the sales force at manycompanies. Some observations about successful sales recognition programs areprovided here.
• What should the reward be? The most important aspect of a recognitionprogram is the publicity for those being recognized. Being called on stageat a national sales meeting, being written up in the company newsletter,or being honored at a banquet in front of peers, management, and/orcustomers can have considerable impact, not only on those being recog-nized, but also on the rest of the sales force, which sees those selected asrole models of success. Usually, some type of tangible award accompaniesthe recognition, such as a trip, a plaque, a ring, or other merchandise.Award receivers can also be rewarded with a promotion or a special assign-ment. Often companies have special provisions for recognizing multiyearparticipants or salespeople who reach significant career milestones. Forexample, a payroll services company awards gold rings to salespeople whosign a career total of 300 new clients; salespeople receive additional dia-monds when they reach 500, 1,000, and 2,000 new clients.
What About Stock Options?
As an enhancement to a recognition program, some companies give stockoptions to salespeople who have performed consistently well over a period
PAGE 404................. 15869$ CH10 05-19-06 09:24:36 PS
405Increasing Sales Force Motivation
of time. This practice was especially popular a few years ago (betweenapproximately 1998 and 2001) and was used as a strategy for preventinggood salespeople from leaving their jobs to join Internet start-ups. Al-though the popularity of the practice has declined considerably in recentyears, stock options are still used in some sales forces as a retention strat-egy for top performers. The number of stock options a salesperson receivesis usually based on a combination of the salesperson’s performance and hertenure. For example, a grid might determine the number of stock options asalesperson receives based on years with over 100 percent goal attainmentand total years with the company; more options are offered to those rank-ing high in both categories.
• What criteria for selection? Criteria for selection in a recognition programare usually a combination of annual results metrics and behaviors that thefirm considers important for long-term success. Results metrics, such asquota achievement, gross margin growth, or achievement of multiyearsales goals, are typically consistent with those used in the firm’s main salesincentive plan. Other criteria can include manager-rated characteristicssuch as teamwork, leadership, citizenship, and customer service. There areusually some qualifiers designed to ensure that those who are selected aregood role models for the rest of the sales force. Qualifiers might includeprovisions such as, the salesperson must not be on probation, must haveachieved certain MBOs, or must have been in his position for at least oneyear. It is a fine balance to combine objective metrics such as results withsubjective criteria that may be biased as a result of management favoritism.Some programs also have provisions to make certain that recognition isgiven to a cross section of the sales force. For example, a stipulation thatthe top salespeople in each region are recognized, even if they are notamong the highest nationally, helps to ensure that there will be role mod-els that the entire sales force can relate to and that all regions are engagedin the recognition program.
• How many should be recognized? In large sales forces, recognition is usuallylimited to the top 5 to 10 percent of the salespeople. In smaller salesforces, the percentage is slightly higher, usually 15 to 20 percent. Thenumber of salespeople recognized should be consistent with a messagethat the group is exclusive (‘‘These are our real winners and role mod-els’’), yet at the same time the number should be large enough for manysalespeople to believe that they have a reasonable shot at being recog-nized.
Does the Number Recognized Need to Be Limited?
Some recognition programs do not limit the number of salespeople who arerecognized; instead, they acknowledge everyone who achieves a specified
PAGE 405................. 15869$ CH10 05-19-06 09:24:36 PS
406 The Complete Guide to Sales Force Incentive Compensation
goal. For example, a ‘‘100 Percent Club’’ in one company recognizes every-one who achieves her sales goal two years in a row. There are some advan-tages to not limiting participation in a recognition program to a specificnumber: Salespeople know up front what they need to do to be recognized,and everyone who is willing to work hard enough can be recognized. Thiseliminates internally focused competition for ‘‘spots’’; salespeople will bemore likely to focus on beating competitors rather than on beating peers.However, since salespeople are generally quite competitive by nature,being recognized based on competition with peers may be considered agreater honor and therefore may be preferred by the sales force. In addi-tion, accurate goal setting is absolutely critical to the success of any pro-gram that does not limit the number of salespeople recognized. If the goalsare achieved too easily, everyone is recognized, and the group is no longerexclusive. If the goals are too challenging, no one is recognized, and thesales force feels demoralized. There may be practical reasons for limitingthe number of salespeople recognized as well. For instance, it is difficult toplan a reward trip (which must be arranged many months in advance) with-out knowing how large the group will be.
Recognition Programs Can Be Highly Political and ThereforeDifficult to Change
At many companies, recognition programs have been around for years, arepart of the sales force culture, and are considered to be almost sacred.Anyone who proposes a change in the program faces considerable politicalchallenge. For example, following a major corporate merger, we worked tocreate a single merged sales force from the two formerly independent salesorganizations. The project was very demanding, as we were working withthe two merger partners to successfully blend their diverse cultures andretain the best salespeople, all under intense time pressure. Surprisingly,one of the greatest challenges was to create a sales recognition programon which both merger partners could agree. Before the merger, one partnerhad had a program that recognized the top 6 percent of the sales force andincluded a cash bonus. The other partner’s program had been very similar,except that the top 8 percent of the sales force was recognized and thecash bonus was smaller. In addition, the second partner allowed some in-ternal marketing people who interacted with the sales force to be eligiblefor the program. Despite the seemingly small differences between the tworecognition programs, creating a single merged program proved to be chal-lenging, as each partner had considerable emotional and political historyinvested in its program.
Recognition Programs for Distribution Partners
Firms that sell to customers indirectly through business partners oftenhave formal recognition programs for top-performing partners. For exam-
PAGE 406................. 15869$ CH10 05-19-06 09:24:37 PS
407Increasing Sales Force Motivation
ple, at Microsoft Business Solutions (MBS), a select group of MBS part-ners that achieve outstanding business performance and customersatisfaction is invited to join the President’s Club each year. An even moreexclusive recognition for MBS business partners is membership in the MBSInner Circle, reserved for a very few top partners that achieved exemplaryaccomplishments during the past sales year and exhibited outstandingcommitment to the Microsoft mission. The most prestigious award given toany MBS partner is Microsoft’s Global Partner of the Year Award. It honorsthe MBS partner with the most outstanding business performance, includ-ing high levels of sales achievement and superior customer satisfaction.The winner of the award for 2004 was ePartners, a leading MBS providerand information technology services organization. According to a Microsoftspokesperson, ePartners was selected for the esteemed award because ofits ‘‘deep understanding of technology, proven expertise in the MicrosoftBusiness Solutions industry, and a passion for building solutions that solveits customers’ business problems in an innovative way.’’ ePartners ac-cepted the award at Microsoft’s Worldwide Partner Conference in July2004 in Toronto, Canada.
Insights
Sales force incentive plans are designed to motivate and direct the selling organi-zation. Sales contests and SPIFFs accentuate short-term needs. Recognition pro-grams enhance and acknowledge the consistently high-performing salespeople.Some concluding insights and guidelines for running successful add-on incentiveprograms are provided here. The insights are organized around the 3 C’s frame-work.
Ensure Consistency with Strategy and Sales Roles
• Limit the number of contests and SPIFFs, keeping salespeople focused onwhat is most important. Don’t let product marketing teams dilute thesales force’s strategic focus.
• Tailor contests and recognition programs to the sales role. Contests andSPIFFs work best for sales roles with high short-term causality. Sales-people who work primarily alone and without day-to-day social interac-tion with peers and managers may need formal recognition programs tohelp them feel appreciated and connected to the company. On the otherhand, less formal recognition and simple pats on the back may be appro-priate for salespeople in roles that involve frequent interaction with man-agers and team members.
PAGE 407................. 15869$ CH10 05-19-06 09:24:37 PS
408 The Complete Guide to Sales Force Incentive Compensation
Ensure Compatibility with Other Sales ForceEffectiveness Drivers
• Measure accurately and provide constant feedback. The best sales contestsand SPIFFs are easy to track and quick to reward.
• Make sure that the programs meet the needs of the sales force. If salesforce needs and interests are diverse, consider offering different programsand prizes to engage as many people as possible.
• Encourage management involvement. Make sure that awards are publicand are given by important people in the organization.
• Set fair and challenging goals.
• Make sure that the programs are consistent with the sales force culture.Invent fun themes, and keep prizes consistent with those themes. Deliveron promises. Spread success around.
Ensure Appropriate Consequences for Salespeople andCompany Results
• Set a time frame that is long enough that salespeople can influence theresults and avoid randomness, yet short enough to keep the sales forcefocused.
• Give more than money.
• Invest in recognition programs; they may be more effective than contestsand SPIFFs.
• When salespeople are not making enough money through the main incen-tive plan as a result of circumstances beyond their control (for example,when national goals are too challenging), consider using contests andSPIFFs to compensate the sales force fairly and keep salespeople engaged.
PAGE 408................. 15869$ CH10 05-19-06 09:24:38 PS
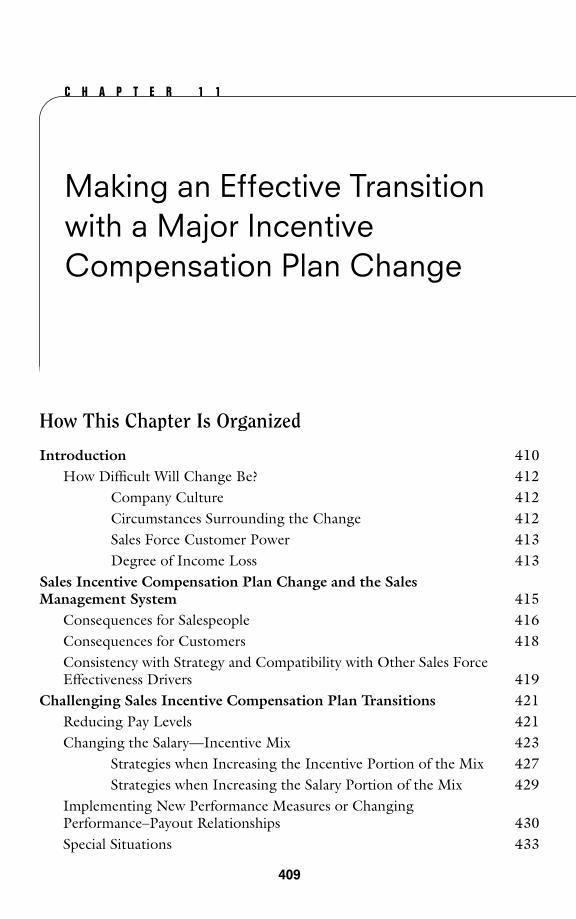
C H A P T E R 1 1
Making an Effective Transitionwith a Major IncentiveCompensation Plan Change
How This Chapter Is Organized
Introduction 410How Difficult Will Change Be? 412
Company Culture 412Circumstances Surrounding the Change 412Sales Force Customer Power 413Degree of Income Loss 413
Sales Incentive Compensation Plan Change and the SalesManagement System 415
Consequences for Salespeople 416Consequences for Customers 418Consistency with Strategy and Compatibility with Other Sales ForceEffectiveness Drivers 419
Challenging Sales Incentive Compensation Plan Transitions 421Reducing Pay Levels 421Changing the Salary—Incentive Mix 423
Strategies when Increasing the Incentive Portion of the Mix 427Strategies when Increasing the Salary Portion of the Mix 429
Implementing New Performance Measures or ChangingPerformance–Payout Relationships 430Special Situations 433
PAGE 409
409
................. 15869$ CH11 05-19-06 09:24:47 PS
410 The Complete Guide to Sales Force Incentive Compensation
Territory Realignment 433
New Salespeople 435
A Sales Force Change Process Framework 435
Guiding Principles 437
Activities: Design–Mobilize–Implement 437
Design Activities 437
Mobilization Activities 438
Implementation Activities 442
Communicating Plan Features and Benefits to the Field 443
Developing the Plan Administration Systems andProcesses 449
Setting Goals 450
Timing of Implementation with Design andMobilization Activities 450
Change Outlook 451
Introduction
Companies have different philosophies regarding how much and how often tochange their sales incentive compensation plan. Some firms make changes to theircompensation plan every year. Management reasons that as markets and companystrategies evolve, the sales incentive compensation plan should also be adjusted oreven revamped to ensure that sales force energy stays aligned appropriately.Changes in the sales leadership team or in relationships with different compensa-tion consulting firms can also lead to plan changes. For example, Figure 11-1shows how one firm changed its sales compensation plan over a five-year periodas market conditions and company strategies evolved, management philosophieschanged, and the firm developed relationships with different consulting firms. Thechallenge for this firm was to implement each change with as little disruption tothe sales force as possible.
At other firms, the compensation plan has not changed in years. Managementfeels that compensation plan changes disrupt the sales force and divert sales-people’s attention from their primary mission of creating sales through providingcustomer value. Compensation structures are maintained even as products, mar-kets, and company priorities evolve. The challenge at such firms is to encouragethe sales force to successfully adapt to changing customer and company needsusing means other than incentives.
PAGE 410................. 15869$ CH11 05-19-06 09:24:47 PS
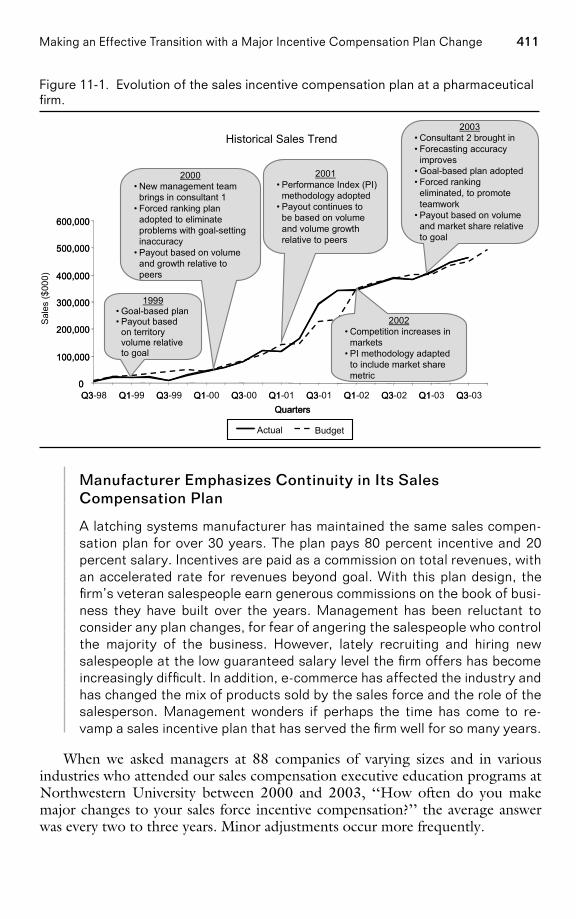
411Making an Effective Transition with a Major Incentive Compensation Plan Change
Figure 11-1. Evolution of the sales incentive compensation plan at a pharmaceuticalfirm.
Historical Sales Trend
0
100,000
200,000
300,000
400,000
500,000
600,000
Q3 Q1 Q3 Q1 Q3 Q1 Q3 Q1 Q3 Q1 Q3Quarters
Sal
es ($
000)
Actual Budget
0
100,000
200,000
300,000
400,000
500,000
600,000
Q3-98 Q1-99 Q3-99 Q1-00 Q3-00 Q1-01 Q3-01 Q1-02 Q3-02 Q1-03 Q3-03Quarters
Actual Actual
1999• Goal-based plan• Payout based
on territoryvolume relativeto goal
2000• New management team
brings in consultant 1• Forced ranking plan
adopted to eliminateproblems with goal-settinginaccuracy
• Payout based on volumeand growth relative topeers
2001• Performance Index (PI)
methodology adopted• Payout continues to
be based on volumeand volume growthrelative to peers
2002• Competition increases in
markets• PI methodology adapted
to include market sharemetric
2003• Consultant 2 brought in• Forecasting accuracy
improves• Goal-based plan adopted• Forced ranking
eliminated, to promoteteamwork
• Payout based on volumeand market share relativeto goal
Manufacturer Emphasizes Continuity in Its SalesCompensation Plan
A latching systems manufacturer has maintained the same sales compen-sation plan for over 30 years. The plan pays 80 percent incentive and 20percent salary. Incentives are paid as a commission on total revenues, withan accelerated rate for revenues beyond goal. With this plan design, thefirm’s veteran salespeople earn generous commissions on the book of busi-ness they have built over the years. Management has been reluctant toconsider any plan changes, for fear of angering the salespeople who controlthe majority of the business. However, lately recruiting and hiring newsalespeople at the low guaranteed salary level the firm offers has becomeincreasingly difficult. In addition, e-commerce has affected the industry andhas changed the mix of products sold by the sales force and the role of thesalesperson. Management wonders if perhaps the time has come to re-vamp a sales incentive plan that has served the firm well for so many years.
When we asked managers at 88 companies of varying sizes and in variousindustries who attended our sales compensation executive education programs atNorthwestern University between 2000 and 2003, ‘‘How often do you makemajor changes to your sales force incentive compensation?’’ the average answerwas every two to three years. Minor adjustments occur more frequently.
PAGE 411................. 15869$ CH11 05-19-06 09:24:48 PS
412 The Complete Guide to Sales Force Incentive Compensation
How Difficult Will Change Be?
The difficulty of implementing a successful incentive plan change is influenced by:
• Company culture
• The circumstances surrounding the change
• Sales force customer power
• The degree of income loss
Company Culture. A company that changes its sales force incentive plan fre-quently is likely to face less sales force resistance to any change than a companythat rarely alters its plan.
Circumstances Surrounding the Change. The circumstances surrounding a salesincentive compensation plan change influence the difficulty of implementing thechange. Some incentive plan changes are in response to a major event, such as:
• A merger or acquisition
• A considerable change in the firm’s go-to-market strategy
• The creation of a new sales force
• A significant sales force restructuring
• The launch of a new product
Such events require significant and immediate management attention. Thesales force is likely to anticipate and expect that changes to the sales incentivecompensation plan will be necessary. These events will trigger other sales forcechanges as well; for example:
• New sales roles may be created.
• Customer assignments may change.
• Management expectations may rise.
Perhaps the biggest sales management challenge when implementing incen-tive plan changes in conjunction with a major event is to help the sales forceunderstand, integrate, and assimilate in a short period of time all of the variouschanges that are going to be required.
Not all sales incentive compensation plan changes are event-driven. Often,sales leadership’s desire for constant improvement precipitates change. The salesleadership team may feel that there are problems with the current incentive com-pensation plan, such as:
PAGE 412................. 15869$ CH11 05-19-06 09:24:49 PS
413Making an Effective Transition with a Major Incentive Compensation Plan Change
• Not paying for performance
• Not attracting and retaining the right people
• Costing the firm too much money
In addition, sales leadership may feel that evolutionary changes in the firm’ssituation and environment are affecting the sales force, such as:
• Maturing product lines
• Intensifying competition
• A consolidating customer base
Adapting the compensation plan is one way to respond to these changes.Implementing significant compensation plan changes in non-event-driven situa-tions can be difficult because the need to change a plan may not be immediatelyevident to the sales force. The sales management challenge is to sell the sales forceon the need for and the benefits of making the change.
Sales Force Customer Power. Sales force customer power reflects the degree ofinfluence or control each salesperson has over his accounts. Salespeople with highcustomer power have the ability to leave the firm and take their accounts withthem. This happens frequently in industries such as financial services, insurance,and office supplies, where products are mostly nondifferentiated commodities, thesalesperson is the major link between the firm and each customer, and sales arestrongly relationship-driven. The more customer power a sales force has, the moredifficult it will be to implement incentive plan change successfully.
Degree of Income Loss. Plan changes that produce a risk of income loss for asignificant number of salespeople can be difficult to implement. Income loss willoccur when the total compensation payout is reduced across the entire sales forceor when the total variable pay gets redistributed among salespeople. The ‘‘whogets helped’’ and ‘‘who gets hurt’’ analysis from Chapter 8 provides insight intothe extent to which income loss will occur. Figure 11-2 provides an example ofthis type of analysis for a consumer packaged goods company. Bars above thehorizontal line represent salespeople who are expected to gain income when thenew plan is implemented, while those below the line represent salespeople whoare expected to lose income. Plan designers should look at the extent of incomeloss when assessing a candidate plan to determine whether the plan can be imple-mented successfully.
Income loss resulting from a plan change can occur in various ways. A consid-erable change in the salary–incentive mix, a change from paying on all sales to agoal-based plan, or adding incentive caps can trigger income loss. A successfultransition to a new incentive plan may not be possible in a situation where thereis income loss for a significant number of salespeople and the sales force has con-siderable customer power. A noticeable negative change in income may anger too
PAGE 413................. 15869$ CH11 05-19-06 09:24:49 PS
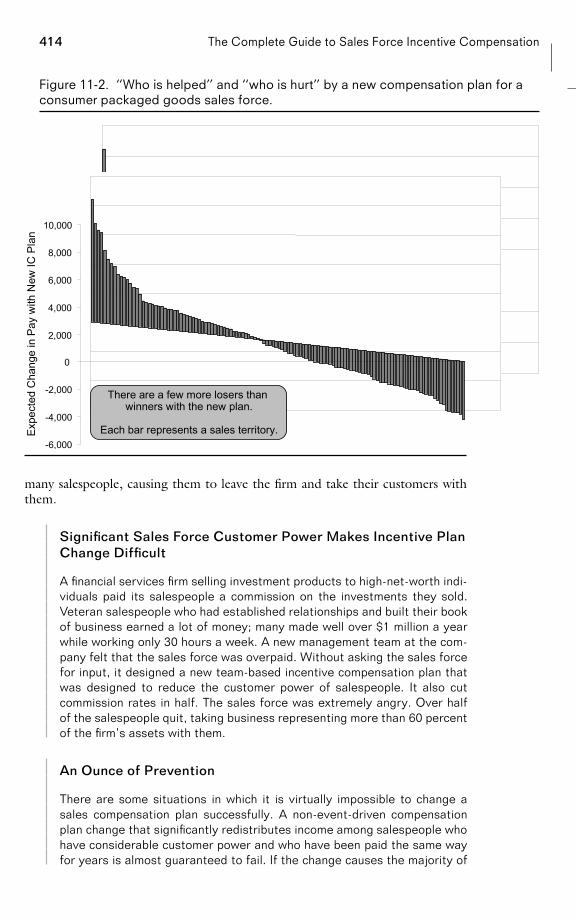
414 The Complete Guide to Sales Force Incentive Compensation
Figure 11-2. ‘‘Who is helped’’ and ‘‘who is hurt’’ by a new compensation plan for aconsumer packaged goods sales force.
-6,000
-4,000
-2,000
0
2,000
4,000
6,000
8,000
10,000
-6,000
-4,000
-2,000
0
2,000
4,000
6,000
8,000
10,000
There are a few more losers than winners with the new plan.
Each bar represents a sales territory.Expe
cted
Cha
nge
in P
ay w
ith N
ew IC
Pla
n
many salespeople, causing them to leave the firm and take their customers withthem.
Significant Sales Force Customer Power Makes Incentive PlanChange Difficult
A financial services firm selling investment products to high-net-worth indi-viduals paid its salespeople a commission on the investments they sold.Veteran salespeople who had established relationships and built their bookof business earned a lot of money; many made well over $1 million a yearwhile working only 30 hours a week. A new management team at the com-pany felt that the sales force was overpaid. Without asking the sales forcefor input, it designed a new team-based incentive compensation plan thatwas designed to reduce the customer power of salespeople. It also cutcommission rates in half. The sales force was extremely angry. Over halfof the salespeople quit, taking business representing more than 60 percentof the firm’s assets with them.
An Ounce of Prevention
There are some situations in which it is virtually impossible to change asales compensation plan successfully. A non-event-driven compensationplan change that significantly redistributes income among salespeople whohave considerable customer power and who have been paid the same wayfor years is almost guaranteed to fail. If the change causes the majority of
PAGE 414................. 15869$ CH11 05-19-06 09:24:50 PS
415Making an Effective Transition with a Major Incentive Compensation Plan Change
salespeople to leave the firm and take customers with them, it may takeyears for the firm to recover financially. In competitive markets, the firmmay not even survive. A management team facing this delicate situationmust tread carefully. Although a sudden, drastic change in the way thesales force is paid may not be possible, successful evolutionary change canusually be implemented. Management must think in terms of prevention,asking, ‘‘What steps can we take today to ensure that we are not in thispredicament five years from now?’’ An ounce of prevention goes a long waytoward ensuring long-term sales force success.
This chapter focuses on the successful implementation of major sales incentivecompensation plan changes. Insights are provided on the various challenges asso-ciated with making different types of incentive compensation plan modifications.The chapter concludes with a framework for understanding and implementingsales force change, along with specific suggestions for successfully implementinga new incentive compensation plan.
Sales Incentive Compensation Plan Change and the SalesManagement System
The decision to change the sales incentive compensation plan significantly shouldnever be taken lightly. Sales compensation decisions affect the salespeople whodrive sales force activities. These activities influence customer results, and cus-tomer results have an impact on company results. Recall the 3 Cs approach todiagnosing sales incentive compensation plan effectiveness, summarized in Figure11-3. Effective sales incentive compensation plan change has appropriate conse-quences for company and customer results, sales force behaviors and activities, andsales force quality. Effective compensation plan change is also consistent with salesand marketing strategies and sales processes and roles, and is compatible with othersales force effectiveness drivers, such as performance management systems andsales force culture, motivators, and hiring and development processes.
Companies that thoroughly assess their candidate plans before selecting thefinal plan will experience a smoother implementation than those that implement
Figure 11-3. The 3 Cs approach to diagnosing sales incentive compensation planeffectiveness.
Compatibility with . . .• Performance
management systems• Sales force culture• Sales force motivators• Sales force hiring and
development processes
Consequences . . .• Company results• Customer results• Sales force behaviors
and activities• Sales force quality
Consistency with . . .• Sales and marketing
strategies• Sales process• Sales roles
PAGE 415................. 15869$ CH11 05-19-06 09:24:52 PS
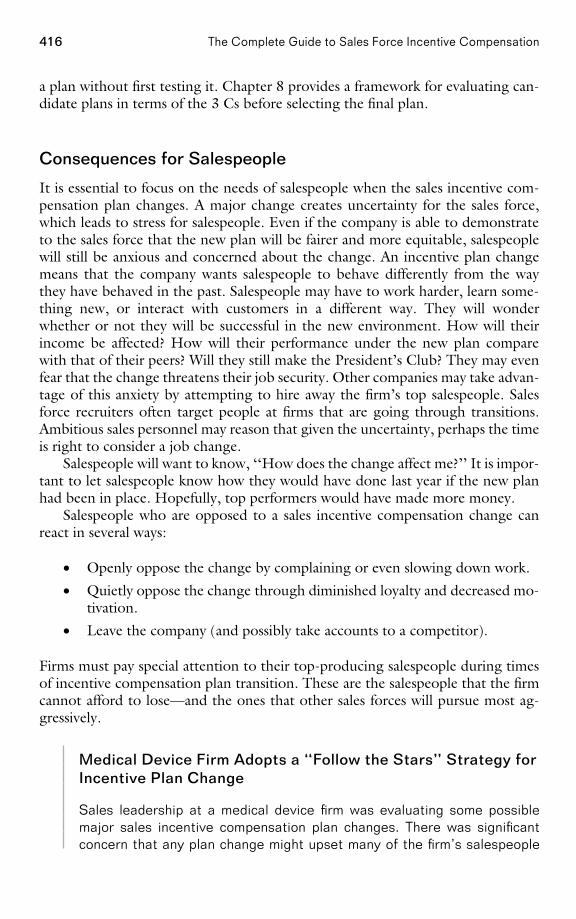
416 The Complete Guide to Sales Force Incentive Compensation
a plan without first testing it. Chapter 8 provides a framework for evaluating can-didate plans in terms of the 3 Cs before selecting the final plan.
Consequences for Salespeople
It is essential to focus on the needs of salespeople when the sales incentive com-pensation plan changes. A major change creates uncertainty for the sales force,which leads to stress for salespeople. Even if the company is able to demonstrateto the sales force that the new plan will be fairer and more equitable, salespeoplewill still be anxious and concerned about the change. An incentive plan changemeans that the company wants salespeople to behave differently from the waythey have behaved in the past. Salespeople may have to work harder, learn some-thing new, or interact with customers in a different way. They will wonderwhether or not they will be successful in the new environment. How will theirincome be affected? How will their performance under the new plan comparewith that of their peers? Will they still make the President’s Club? They may evenfear that the change threatens their job security. Other companies may take advan-tage of this anxiety by attempting to hire away the firm’s top salespeople. Salesforce recruiters often target people at firms that are going through transitions.Ambitious sales personnel may reason that given the uncertainty, perhaps the timeis right to consider a job change.
Salespeople will want to know, ‘‘How does the change affect me?’’ It is impor-tant to let salespeople know how they would have done last year if the new planhad been in place. Hopefully, top performers would have made more money.
Salespeople who are opposed to a sales incentive compensation change canreact in several ways:
• Openly oppose the change by complaining or even slowing down work.
• Quietly oppose the change through diminished loyalty and decreased mo-tivation.
• Leave the company (and possibly take accounts to a competitor).
Firms must pay special attention to their top-producing salespeople during timesof incentive compensation plan transition. These are the salespeople that the firmcannot afford to lose—and the ones that other sales forces will pursue most ag-gressively.
Medical Device Firm Adopts a ‘‘Follow the Stars’’ Strategy forIncentive Plan Change
Sales leadership at a medical device firm was evaluating some possiblemajor sales incentive compensation plan changes. There was significantconcern that any plan change might upset many of the firm’s salespeople
PAGE 416................. 15869$ CH11 05-19-06 09:24:52 PS
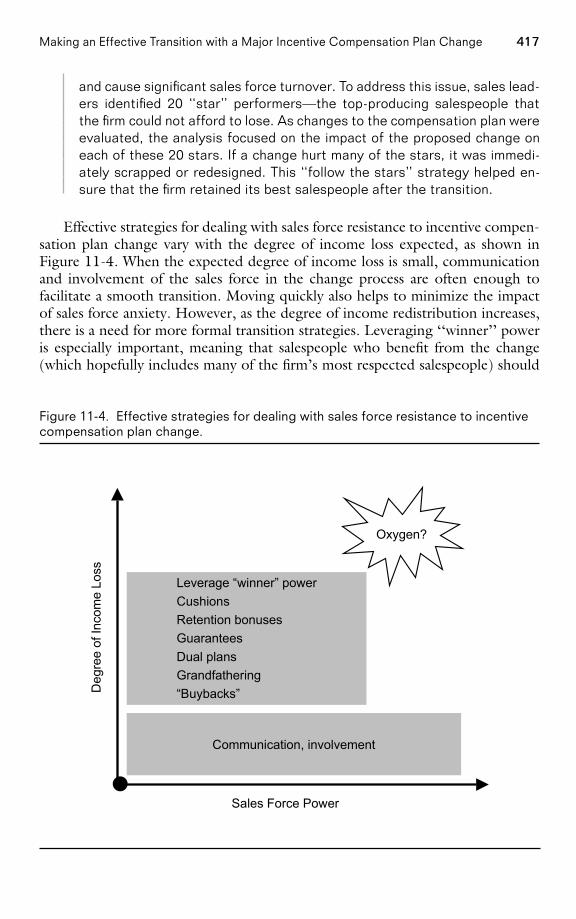
417Making an Effective Transition with a Major Incentive Compensation Plan Change
and cause significant sales force turnover. To address this issue, sales lead-ers identified 20 ‘‘star’’ performers—the top-producing salespeople thatthe firm could not afford to lose. As changes to the compensation plan wereevaluated, the analysis focused on the impact of the proposed change oneach of these 20 stars. If a change hurt many of the stars, it was immedi-ately scrapped or redesigned. This ‘‘follow the stars’’ strategy helped en-sure that the firm retained its best salespeople after the transition.
Effective strategies for dealing with sales force resistance to incentive compen-sation plan change vary with the degree of income loss expected, as shown inFigure 11-4. When the expected degree of income loss is small, communicationand involvement of the sales force in the change process are often enough tofacilitate a smooth transition. Moving quickly also helps to minimize the impactof sales force anxiety. However, as the degree of income redistribution increases,there is a need for more formal transition strategies. Leveraging ‘‘winner’’ poweris especially important, meaning that salespeople who benefit from the change(which hopefully includes many of the firm’s most respected salespeople) should
Figure 11-4. Effective strategies for dealing with sales force resistance to incentivecompensation plan change.
Communication, involvement
Leverage “winner” powerCushionsRetention bonuses GuaranteesDual plansGrandfathering “Buybacks”
Oxygen?
Deg
ree
of In
com
e Lo
ss
Sales Force Power
PAGE 417................. 15869$ CH11 05-19-06 09:24:53 PS
418 The Complete Guide to Sales Force Incentive Compensation
be vocal supporters of the change. In addition, intermediate or transition compen-sation plans can facilitate implementation. Transition plans include:
• Cushions and retention bonuses. Give people a bonus for staying with thefirm for a period following implementation. This should be used withcaution; paying salespeople to stay with the company conflicts with a‘‘loyal’’ sales force culture.
• Guarantees. Guarantee that salespeople will make at least a certain amountwith the new plan (for example, at least as much as last year). The guaran-teed amount declines over time and eventually is phased out.
• Dual plans. Calculate incentive payouts with both the old and new plansand pay the higher of the two for a period following implementation.
• Grandfathering. Exempt veteran salespeople from following all the rulesof the new plan. This should be used with caution; if too many salespeopleare grandfathered, the ability of the new plan to change sales force behav-ior and meet company objectives is significantly reduced.
• Buyback arrangements. Continue to pay salespeople for performance ataccounts that were reassigned to another salesperson (for example, as theresult of realignment) for a period following implementation.
A successful conversion to a new incentive plan may not be possible in a situa-tion where the degree of income loss is significant and the sales force has consider-able customer power. As Figure 11-4 shows, there may be no ‘‘oxygen’’ in thenortheast corner. A drastic change to the incentive plan may anger too manysalespeople, causing them to leave the firm and take their customers with them.Thus, a firm where the sales force has significant customer power has limitedopportunity to change its sales incentive compensation plan without considerablesales force disruption.
Consequences for Customers
It is also important to examine the impact of any sales force incentive compensa-tion plan change from a customer perspective. A change in the incentive plan willinfluence salespeople and their activities and behaviors. This has the potential toaffect customers, both positively and negatively.
Some incentive plan changes are designed specifically to enhance customerrelationships. For example, a firm might reduce the variable portion of its com-pensation plan and increase the salary portion, in order to reduce sales force focuson short-term results and increase its focus on long-term customer needs. In addi-tion, a firm might add measures such as repeat business rate or a customer satisfac-tion score to the incentive plan in an effort to encourage sales force behaviors thatmake customers happy and improve customer retention.
PAGE 418................. 15869$ CH11 05-19-06 09:24:54 PS
419Making an Effective Transition with a Major Incentive Compensation Plan Change
Best Buy Eliminates Commissioned Salespeople Based onCustomer Feedback
In 1989, consumer electronics retail chain Best Buy eliminated its commis-sioned sales force based on feedback from customers. The chain adopteda straight salary plan after conducting customer focus groups and discover-ing that customers just didn’t trust commissioned salespeople. The chainestablished ‘‘answer centers’’ in each store where customers could comewith questions if they needed help. Customers liked the new no-hassleapproach and felt much more comfortable shopping in the no-commissionenvironment. The sales force liked the changes as well because Best Buybecame a friendlier place to work and salespeople made a good salaryevery day, regardless of how busy the store was. Three years after thechange, salesperson turnover had decline by 50 percent.
Sometimes sales incentive compensation plan changes encourage unintendedsales force behaviors that make customers unhappy. Consider the following situa-tions:
• More aggressive commission accelerators encourage salespeople to over-sell and disregard customer needs.
• An increase in performance-based incentive opportunity coupled with acut in salary encourages salespeople to spend all their time selling, ignor-ing important customer service needs.
• An increase in commission rates on high-margin products encourages thesales force to sell these products, even when a low-margin product is bet-ter for the customer.
• Monthly objectives with an overachievement bonus encourage salespeopleto delay placement of customer orders at the end of every other month.
Whenever the sales incentive compensation plan changes, undesirable behav-iors such as these must be anticipated and addressed up front. Management mustrely on sales force effectiveness drivers other than the incentive compensation planto minimize these undesirable behaviors. For example, coaching by sales managersand the firm’s performance management systems might help to create a morecustomer-focused culture and reduce greedy sales force behaviors. However, it isimportant that the messages sent are reasonably consistent across all of the salesforce effectiveness drivers. A manager who tells her salespeople, ‘‘Do whatever ittakes to make the customer happy,’’ will lack credibility if the compensation plansends the message ‘‘sell at all costs.’’
Consistency with Strategy and Compatibility with Other SalesForce Effectiveness DriversSales leaders must also pay close attention to the impact of a new sales compensa-tion plan on all of the other sales force effectiveness drivers. The upstream driver
PAGE 419................. 15869$ CH11 05-19-06 09:24:54 PS
420 The Complete Guide to Sales Force Incentive Compensation
decisions (such as sales and marketing strategies and sales processes and roles)should be consistent with the overall corporate strategies and should always pre-cede decisions about the sales compensation plan. An effective sales compensationplan reinforces company strategies and is aligned with the sales force role. Theconsistency check of candidate incentive plans described in Chapter 8 screens forplans that will be consistent with sales and marketing strategies and sales processesand roles when implemented.
Compatibility with other sales force effectiveness drivers is also important.Whenever the sales compensation plan changes, many additional sales force effec-tiveness drivers typically require adjustment as well. For example, suppose a salesorganization changes its incentive compensation plan from a plan that pays mostlyvariable pay to a plan that pays mostly salary. Required adjustments to varioussales force effectiveness drivers may include the following:
• Hiring profiles for sales and sales management positions may need tochange, as the job will require salespeople who are less focused on short-term sales and more oriented toward problem solving and the develop-ment of long-term customer relationships.
• Performance management systems may need to be revised, as manage-ment will need to oversee sales force activities more closely, since compen-sation is no longer tied as directly to results.
• Sales information and support systems will certainly be affected as well,since the sales organization may need different information and resourcesto do the job effectively.
The compatibility check described in Chapter 8 tests candidate plans andeliminates those that do not align with sales force effectiveness drivers such asperformance management systems and sales force culture, motivators, and hiringand development processes.
Redesigning sales force systems, processes, and programs can be a major un-dertaking, and significant time and resources may be required to align these sys-tems effectively. Yet achieving complete alignment is critical to delivering aconsistent message to the sales force that reinforces company goals and culture.
Making Cross-Selling Work at Brenton Banks
Recall from Chapter 1 the story about Iowa-based Brenton Banks. Man-agement wanted to facilitate the cross-selling of banking and brokerageproducts. The two departments operated as ‘‘silos,’’ and bankers and bro-kers rarely referred customers to one another. Brenton’s management rec-ognized that incentives alone would not be enough to change this culture.To encourage sharing of leads, management redrew the organization chart,creating a single Brenton sales force. Bankers and brokers were given asingle net income goal that was not broken down according to the old bank-
PAGE 420................. 15869$ CH11 05-19-06 09:24:55 PS
421Making an Effective Transition with a Major Incentive Compensation Plan Change
ing and brokerage divisions. Bankers and brokers met twice a week to dis-cuss plans and share client names. Joint sales calls crossing the traditionalbanking and brokerage boundaries were encouraged. The entire sales forcewas trained on the full range of product offerings. The incentive plan wasrevamped so that bankers could receive commissions for broker productsales, and brokers could receive commissions for bank product sales. Thenew approach encouraged all bankers and brokers to be much more proac-tive cross-sellers.
Challenging Sales Incentive Compensation PlanTransitions
This section of the chapter focuses on some particularly challenging incentivecompensation plan transition situations, some success strategies for dealing withthese situations, and some cautions about what to avoid. Much of the discussionis organized around the four key incentive plan design choices introduced earlierin this book: pay level, mix, performance measures, and performance–payout rela-tionship. In addition, implementation challenges that arise in several special transi-tion circumstances—incentive plan adjustments following a territory realignmentand initial plans for new salespeople—are discussed.
Reducing Pay Levels
Increases in sales force pay levels are easy to implement, but decreases are not.Factors that might lead a firm to cut sales force pay can originate either outside ofthe sales force or within the sales force. Several examples are:
• The sales force is paid well above the industry norm; turnover (particularlyof mediocre performers) is almost nonexistent because people cannotmake this much money anywhere else.
• There is an abundant supply of qualified salespeople; good salespeople arewilling to come to work for the firm for substantially less money than theexisting sales force is paid.
• The company is under severe pressure to cut costs; across-the-board paycuts are necessary to ensure long-term viability.
• The sales force is overpaid relative to people in comparable positions inother departments, and the extreme envy of the sales force is hurting over-all company productivity.
• The role of the salesperson is changing from one that adds significantcustomer value to one that adds only modest value as product lines andselling processes evolve.
PAGE 421................. 15869$ CH11 05-19-06 09:24:55 PS
422 The Complete Guide to Sales Force Incentive Compensation
Communication with the sales force during a sales force pay cut is critical.Salespeople need to understand why the change is being made. Salespeople aretypically more willing to accept pay cuts that are event-driven—for example, whenthe firm has missed its numbers several years in a row, when a competitive launchhas eroded the firm’s market share, or when a major sales force restructuring hasdiminished the role of the salesperson. Pay cuts that are driven solely by the needto ‘‘trim fat’’ or to bring costs in line with industry norms are very difficult toimplement without a significant negative impact on sales force morale.
When cutting sales force pay, be prepared to lose some salespeople, particu-larly if the pay cut makes the firm’s sales force pay scale less favorable than that ofother firms in the industry. If there are salespeople that the firm cannot afford tolose, consider the following strategies:
• Give top performers additional responsibilities that allow them to enhanceor at least maintain their current pay level.
• Freeze pay levels rather than cutting them, and phase in the pay cut overtime.
• Instead of cutting pay levels, cut sales force size and eliminate the jobs ofpoor performers.
• Offer a severance package that encourages the highest-paid veteran sales-people to take early retirement.
• Make improvements to other sales force effectiveness drivers to compen-sate for the lower pay. For example, eliminate some sales force paperworkor improve nonmonetary motivational programs. Salespeople may be will-ing to work for less pay if the sales force culture is more favorable.
• Most importantly, sales leadership should be prepared to take a pay cut aswell. News of the pay cut will be more readily accepted by salespeople ifthey know that management, too, is sacrificing.
Telecommunications Firms Pay Big Executive Bonuses whileLaying Off Workers
When the telecommunications industry took a dramatic downturn begin-ning in mid-2000, firms in the industry were forced to implement massivedownsizing and cost-cutting measures. Yet despite the substantial cuts,several firms paid top executives generous retention bonuses. For example,at WorldCom, the CFO and CEO received $10 million each in 2000 to staywith the firm for two years, while thousands of other workers were beingshown the door. Similarly, in 2002, Lucent Technologies paid $16.2 millionto entice four senior executives to stay with the firm for a year, with addi-tional bonuses promised in the future. At the same time, Lucent’s chairmanwas urging workers to ‘‘share in the pain.’’ Salaries had been frozen sinceDecember of 2000, performance bonuses for nonexecutive managers were
PAGE 422................. 15869$ CH11 05-19-06 09:24:56 PS
423Making an Effective Transition with a Major Incentive Compensation Plan Change
suspended indefinitely, and more than half of the firm’s employees had beenlet go.
When a company is going through a merger or a difficult time, retentionbonuses for top executives often make good economic sense, since thecost of replacing a top executive is typically much greater than the cost of aretention bonus. However, employees will undoubtedly challenge generouspayments to top executives during tough times, and the negative impact onemployee morale cannot be ignored. In the case of Lucent and WorldCom,experts outside the two firms questioned whether the awards were neces-sary, given the scarcity of jobs at all levels, including the most senior levels,within the industry.
There are also some effective long-term strategies that a firm can use to avoidthe need to implement a drastic sales force pay cut. Prudent use of resourcesduring good times reduces the likelihood that sales force pay must be cut duringbad times. Strategies include the following:
• Save money during successful years rather than spending extravagantly;this puts the firm in a strong position to survive lean years without makingdrastic cuts.
• Evaluate the long-term consequences of any candidate incentive plan (seeChapter 8). For example, check to see if sales force pay will get out ofhand if company sales grow precipitously.
• When structuring the sales force pay plan, keep in mind that some ele-ments of compensation are easier to reduce than others. For example, it iseasier to cut incentive pay than it is to cut salary. A company that pays itssales force 100 percent salary will have a more difficult time implementinga pay cut than one that has the option of reducing costs by cutting incen-tives while maintaining salaries.
• Include special short-term features in the incentive plan during goodyears, such as special sales contents, SPIFFs, or incentive trips. Make itclear to the sales force that these ‘‘perks’’ will not be offered in the lesssuccessful years.
Changing the Salary–Incentive Mix
Significant changes in the salary–incentive mix are particularly challenging to im-plement, since mix decisions have considerable impact on sales force culture andvalues. Salary-oriented sales forces tend to be customer-centered. They emphasizethe achievement of long-term results through cooperation of sales team members,control of sales force activity, and professional development of the sales staff. In-centive-oriented sales forces, on the other hand, tend to have many of the oppo-site characteristics. They emphasize the achievement of short-term results through
PAGE 423................. 15869$ CH11 05-19-06 09:24:56 PS
424 The Complete Guide to Sales Force Incentive Compensation
competition between salespeople, empowerment of the sales force, and a sales-focused culture. Because of these considerable differences, a significant changein the salary–incentive mix can lead to substantial sales force turnover. It is notuncommon for more than 50 percent of salespeople to leave a company withinthree years after a significant mix change is implemented.
Significant mix changes are usually driven by changes in sales force causality,or the ability of the firm to attribute results to an individual salesperson’s efforts.Increases in sales force causality frequently lead companies to shift to greater in-centives and less salary. This happens in a number of situations, including:
• When a company that formerly used distributors begins to sell direct
• When a company’s offerings become commodities and the selling processchanges from selling solutions to selling products
• When the sales force focus shifts from retaining and servicing customersto driving new sales and growth
• When industry deregulation creates a need for the firm to compete forcustomers for the first time
Decreases in sales force causality frequently lead to shifts toward more salaryand less incentive. Examples of situations where this occurs include:
• When the focus of the sales force shifts from pressure and relationshipselling of products to partnering and consultative selling of solutions
• When sales roles change from individual ‘‘lone rangers’’ to team sellingwith more specialized and loosely defined roles
• When a new product is launched and sales are very difficult to forecast
• When market volatility increases, creating an increase in sales force wind-fall gains or losses
Mix changes are also driven occasionally by a sales leadership change. A newsales management team may feel that an existing culture is either too aggressiveor too passive. In either of these cases, a move to modify the culture can coincidewith a mix change. An aggressive sales force may be moderated by moving towarda plan with a higher salary component, and a passive sales culture may be movedtoward a more aggressive posture by increasing the variable-pay component.
A Newspaper Changes Its Incentive Plan Based on a BetterUnderstanding of the Market’s Response to Its Selling Effort
A number of years ago, a small newspaper company in Indiana began asales force incentive design project for its advertising sales force. Likemost newspapers across the United States, this firm was using a mostlysalary plan. Small bonuses were awarded to the sales force if the newspa-
PAGE 424................. 15869$ CH11 05-19-06 09:24:57 PS
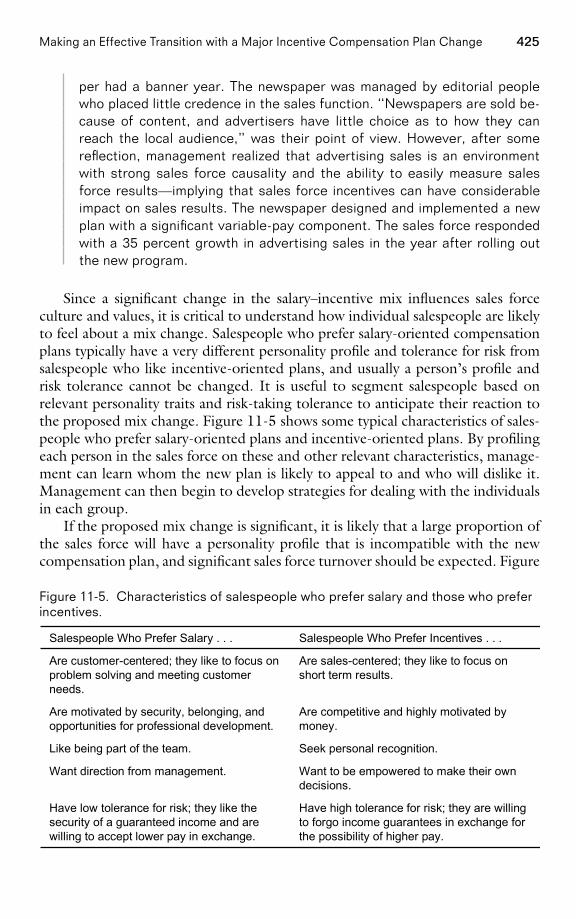
425Making an Effective Transition with a Major Incentive Compensation Plan Change
per had a banner year. The newspaper was managed by editorial peoplewho placed little credence in the sales function. ‘‘Newspapers are sold be-cause of content, and advertisers have little choice as to how they canreach the local audience,’’ was their point of view. However, after somereflection, management realized that advertising sales is an environmentwith strong sales force causality and the ability to easily measure salesforce results—implying that sales force incentives can have considerableimpact on sales results. The newspaper designed and implemented a newplan with a significant variable-pay component. The sales force respondedwith a 35 percent growth in advertising sales in the year after rolling outthe new program.
Since a significant change in the salary–incentive mix influences sales forceculture and values, it is critical to understand how individual salespeople are likelyto feel about a mix change. Salespeople who prefer salary-oriented compensationplans typically have a very different personality profile and tolerance for risk fromsalespeople who like incentive-oriented plans, and usually a person’s profile andrisk tolerance cannot be changed. It is useful to segment salespeople based onrelevant personality traits and risk-taking tolerance to anticipate their reaction tothe proposed mix change. Figure 11-5 shows some typical characteristics of sales-people who prefer salary-oriented plans and incentive-oriented plans. By profilingeach person in the sales force on these and other relevant characteristics, manage-ment can learn whom the new plan is likely to appeal to and who will dislike it.Management can then begin to develop strategies for dealing with the individualsin each group.
If the proposed mix change is significant, it is likely that a large proportion ofthe sales force will have a personality profile that is incompatible with the newcompensation plan, and significant sales force turnover should be expected. Figure
Figure 11-5. Characteristics of salespeople who prefer salary and those who preferincentives.
Have high tolerance for risk; they are willingto forgo income guarantees in exchange forthe possibility of higher pay.
Have low tolerance for risk; they like thesecurity of a guaranteed income and arewilling to accept lower pay in exchange.
Want to be empowered to make their owndecisions.
Want direction from management.
Seek personal recognition.Like being part of the team.
Are competitive and highly motivated bymoney.
Are motivated by security, belonging, andopportunities for professional development.
Are sales-centered; they like to focus onshort term results.
Are customer-centered; they like to focus onproblem solving and meeting customerneeds.
Salespeople Who Prefer Incentives . . .Salespeople Who Prefer Salary . . .
PAGE 425................. 15869$ CH11 05-19-06 09:24:58 PS
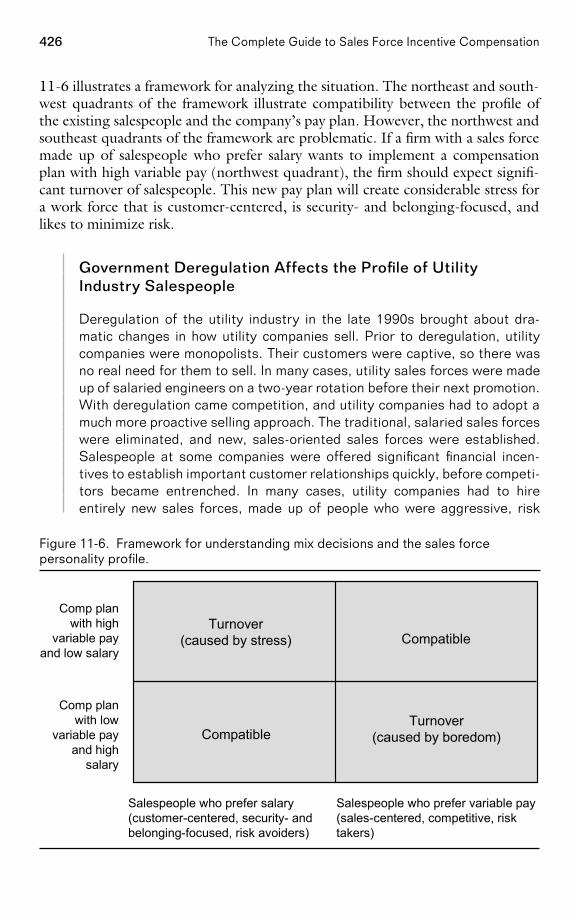
426 The Complete Guide to Sales Force Incentive Compensation
11-6 illustrates a framework for analyzing the situation. The northeast and south-west quadrants of the framework illustrate compatibility between the profile ofthe existing salespeople and the company’s pay plan. However, the northwest andsoutheast quadrants of the framework are problematic. If a firm with a sales forcemade up of salespeople who prefer salary wants to implement a compensationplan with high variable pay (northwest quadrant), the firm should expect signifi-cant turnover of salespeople. This new pay plan will create considerable stress fora work force that is customer-centered, is security- and belonging-focused, andlikes to minimize risk.
Government Deregulation Affects the Profile of UtilityIndustry Salespeople
Deregulation of the utility industry in the late 1990s brought about dra-matic changes in how utility companies sell. Prior to deregulation, utilitycompanies were monopolists. Their customers were captive, so there wasno real need for them to sell. In many cases, utility sales forces were madeup of salaried engineers on a two-year rotation before their next promotion.With deregulation came competition, and utility companies had to adopt amuch more proactive selling approach. The traditional, salaried sales forceswere eliminated, and new, sales-oriented sales forces were established.Salespeople at some companies were offered significant financial incen-tives to establish important customer relationships quickly, before competi-tors became entrenched. In many cases, utility companies had to hireentirely new sales forces, made up of people who were aggressive, risk
Figure 11-6. Framework for understanding mix decisions and the sales forcepersonality profile.
Turnover(caused by stress) Compatible
Turnover(caused by boredom)Compatible
Salespeople who prefer salary(customer-centered, security- andbelonging-focused, risk avoiders)
Salespeople who prefer variable pay(sales-centered, competitive, risktakers)
Comp planwith high
variable payand low salary
Comp planwith low
variable payand high
salary
PAGE 426................. 15869$ CH11 05-19-06 09:24:59 PS
427Making an Effective Transition with a Major Incentive Compensation Plan Change
taking, and flexible—a completely different profile from that of their prede-regulation salespeople.
Similarly, if a sales force made up of salespeople who prefer variable pay wantsto implement a compensation plan with high salary (southeast quadrant), thefirm should expect considerable turnover of salespeople. Salespeople will miss theexcitement of competition, the drive for short-term results, and the opportunityfor significant incentive pay tied to performance, and may leave the firm out ofboredom and frustration.
Personality Traits Linked to Sales Success in Automobile Sales
A study revealed that successful automobile salespeople are of two differ-ent personality profiles:
• Profile 1. Assertive and aggressive self-starters who are ego-driven,outgoing, and confident. Profile 1 types are usually successful in theshort term, but are unlikely to stay in the job for very long.
• Profile 2. Thorough, cautious, accommodating, and sociable veteranswho start out slowly, but who blossom into excellent salespeople overthe years as they build a substantial clientele and win repeat and refer-ral business.
Unfortunately, the highly commission-based sales pay plans offered bymost automobile dealerships are attractive primarily to Profile 1 sales-people, who tend to view the job as short term. Profile 2 salespeople areapt to get discouraged in their early years, because they have not yet es-tablished enough customer relationships to make sufficient money and tofeel successful. As a result, turnover of salespeople at many dealerships isvery high. Some dealers have successfully reduced this turnover by offer-ing newcomers a different compensation plan from veterans. Rookies re-ceive more salary and less commission during a training period. Over time,as they learn the job and establish a customer base, their compensationplan switches to the traditional commission-based plan.
Strategies when Increasing the Incentive Portion of the Mix. There are two situa-tions in which an increase to the incentive portion of the mix is particularly chal-lenging.
1. When a straight salary sales force receives incentives for the first time, evenif the incentive portion of pay is not large (15 percent or less), the moveis an important signal that things are changing, which may be disturbingto many salespeople.
2. When a sales force with low to moderate incentives (25 percent or less)receives a substantial increase in the incentive component of compen-sation, so that the majority of sales force earnings now come through
PAGE 427................. 15869$ CH11 05-19-06 09:25:00 PS
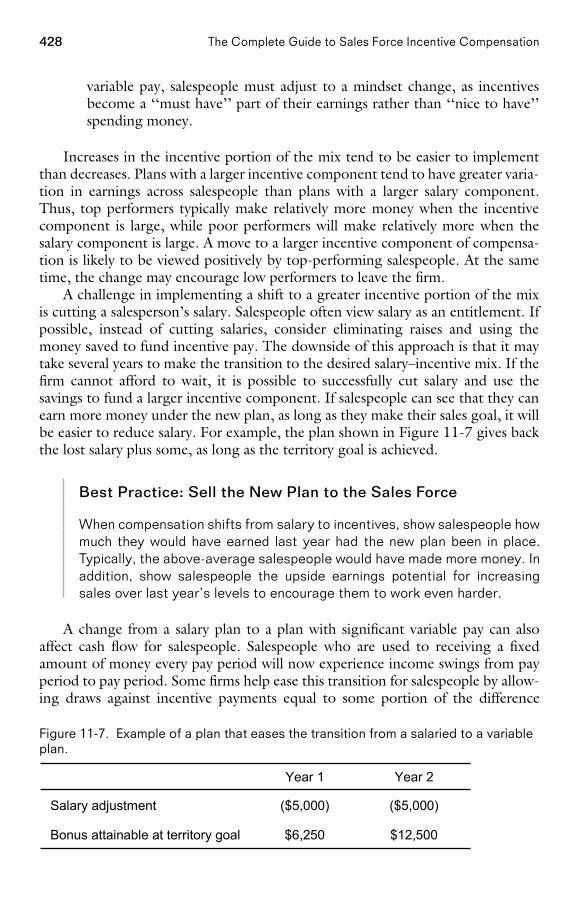
428 The Complete Guide to Sales Force Incentive Compensation
variable pay, salespeople must adjust to a mindset change, as incentivesbecome a ‘‘must have’’ part of their earnings rather than ‘‘nice to have’’spending money.
Increases in the incentive portion of the mix tend to be easier to implementthan decreases. Plans with a larger incentive component tend to have greater varia-tion in earnings across salespeople than plans with a larger salary component.Thus, top performers typically make relatively more money when the incentivecomponent is large, while poor performers will make relatively more when thesalary component is large. A move to a larger incentive component of compensa-tion is likely to be viewed positively by top-performing salespeople. At the sametime, the change may encourage low performers to leave the firm.
A challenge in implementing a shift to a greater incentive portion of the mixis cutting a salesperson’s salary. Salespeople often view salary as an entitlement. Ifpossible, instead of cutting salaries, consider eliminating raises and using themoney saved to fund incentive pay. The downside of this approach is that it maytake several years to make the transition to the desired salary–incentive mix. If thefirm cannot afford to wait, it is possible to successfully cut salary and use thesavings to fund a larger incentive component. If salespeople can see that they canearn more money under the new plan, as long as they make their sales goal, it willbe easier to reduce salary. For example, the plan shown in Figure 11-7 gives backthe lost salary plus some, as long as the territory goal is achieved.
Best Practice: Sell the New Plan to the Sales Force
When compensation shifts from salary to incentives, show salespeople howmuch they would have earned last year had the new plan been in place.Typically, the above-average salespeople would have made more money. Inaddition, show salespeople the upside earnings potential for increasingsales over last year’s levels to encourage them to work even harder.
A change from a salary plan to a plan with significant variable pay can alsoaffect cash flow for salespeople. Salespeople who are used to receiving a fixedamount of money every pay period will now experience income swings from payperiod to pay period. Some firms help ease this transition for salespeople by allow-ing draws against incentive payments equal to some portion of the difference
Figure 11-7. Example of a plan that eases the transition from a salaried to a variableplan.
$12,500$6,250Bonus attainable at territory goal
($5,000)($5,000)Salary adjustment
Year 2Year 1
PAGE 428................. 15869$ CH11 05-19-06 09:25:01 PS
429Making an Effective Transition with a Major Incentive Compensation Plan Change
between the new and old base salaries. There are some downsides to offeringdraws:
• A salesperson may end up owing the company money if her performancedoes not meet expectations.
• Draws can be costly and difficult to administer.
• Draws can dilute the motivational power of incentives.
Strategies when Increasing the Salary Portion of the Mix. Increases in the salaryproportion of the mix tend to be more difficult to implement than increases inthe incentive proportion, because such changes often have a negative impact onthe earnings of top-performing salespeople. Plans with a large salary componenttend to have smaller variation in earnings across salespeople than plans with alarge incentive component. Thus, top performers typically make relatively lessmoney when the salary component is large and relatively more when the incentivecomponent is large. As a result, a move to a larger salary component runs therisk of disappointing top-performing salespeople and causing undesired sales forceturnover. For this reason, sudden and drastic reductions in the incentive portionof sales force pay are very hard to implement successfully.
Sudden Change to All-Salary Sales Compensation Plan HurtsShort-Term Results
Recall from Chapter 1 the story about a maker of preprinted businessforms. The firm was in an intensely competitive and fragmented industrythat had been driven historically by an aggressive sales culture. Duringthe late 1990s, the industry changed dramatically as electronic forms thatcustomers could design and modify themselves began to dominate the mar-ket. A new, more customer-focused sales approach was needed to be suc-cessful in the new environment. As a first step toward implementing thisnew approach, the company eliminated its highly leveraged sales force in-centive plan and began to pay salespeople salary exclusively. The salesforce was not happy about this change. Most of the firm’s salespeoplewere aggressive risk takers who had thrived in the high-risk, high-returnenvironment. The firm’s entire culture was incompatible with a salariedsales environment. While the move to a salaried sales force was right inthe long term, the dramatic change in pay structure was too sudden, and itsincompatibility with the firm’s people and culture hurt short-term financialresults.
Many companies have been successful in reducing the incentive portion of pay(while increasing the salary portion) by phasing in the change over time. A frac-tion of incentive pay is moved into salary each year, and after several years the firmattains the desired salary–incentive mix. When a more rapid change is desired,
PAGE 429................. 15869$ CH11 05-19-06 09:25:01 PS
430 The Complete Guide to Sales Force Incentive Compensation
transition compensation strategies can help keep top performers ‘‘whole’’ after amove to a plan with more salary and less incentive. For example, the firm mightconsider guaranteeing that top-performing salespeople will make at least a certainamount with the new plan (for example, at least as much as last year).
Increasing the salary component of the mix is easier if there is already lowvariation in incentive payout across the sales force. Incentive payout variationcomes from two sources: performance differences and territory differences. Forexample, in a sales force that earns a commission on sales, if salespeople havecomparable performance and have territories with roughly equal potential, incen-tive earnings across the sales force will be fairly equal. On the other hand, if thereis significant performance variation across salespeople and/or if sales territoriesvary greatly in potential, there may be substantial differences in incentive earningsacross salespeople. In such a case, implementing a move to more salary will lead tosignificant income redistribution, making the change more difficult to implementsuccessfully.
Implementing New Performance Measures or ChangingPerformance–Payout Relationships
A change in the performance measures that drive the sales incentive compensationplan or in the plan performance–payout relationship can be fairly easy or verychallenging to implement, depending upon the degree of income loss that resultsfrom the change. Changes in performance measures include:
• New metrics (for example, paying on territory market share instead ofsales)
• Different data views (for example, paying on performance relative to agoal rather than on absolute performance)
• New focuses (for example, paying for team results rather than individualresults)
• Different timing of payments (for example, paying for quarterly resultsinstead of monthly results)
Changes in the plan performance–payout relationship include:
• Changing from a bonus plan to a commission plan or vice versa• Changing rates, accelerators, or decelerators in a commission plan• Tying the point at which payout begins to a more or less challenging result
(for example, raising or lowering the threshold where incentives kick in)• Placing a cap on a plan
Incentive plan measures and plan performance–payout relationships some-times change in response to new company marketing strategies. For example:
PAGE 430................. 15869$ CH11 05-19-06 09:25:02 PS
431Making an Effective Transition with a Major Incentive Compensation Plan Change
• A product line matures, and marketing strategy shifts from a growthfocus (measured by territory sales growth) to a sales maintenance focus(measured in terms of territory sales goal attainment percentage) to aprofitability focus (measured by territory gross margin goal attainmentpercentage).
• A competitor becomes more aggressive, and a market share change metricis added to the incentive program.
• A new product is introduced, and commission rates are adjusted to reflectnew product priorities.
• The sales force structure becomes more team-oriented, and a portion ofincentives is tied to team performance in addition to individual perform-ance.
• Market volatility increases, weakening the firm’s ability to predict futuresales. The incentive plan is capped to prevent the payment of undeservedincentives because of poor forecasting.
Other times, incentive plan measures or plan performance–payout relation-ships change simply because new and better data become available. For example:
• A distributor starts to provide the firm with data detailing sales to endusers, making it possible to evaluate results for salespeople who focus onthe end-user market.
• The firm’s accounting systems are updated, so that results can be trackedmore immediately at the territory level.
• The firm acquires market potential data, making it possible to set moreaccurate territory goals. The commission plan is replaced with a bonusplan tied to goal attainment.
At some firms, changes in incentive plan measures and plan performance–payout relationships occur quite frequently. Over time, salespeople become accus-tomed to these changes; they expect change with some regularity, and they acceptchange with little resistance. This culture of flexibility allows the firm to adapt theincentive plan easily as company priorities, markets, and performance data evolve.
When incentive plan measures or performance–payout relationships change,some salespeople will be helped by the change, and others will be hurt by it. The‘‘who is helped’’ and ‘‘who is hurt’’ analysis described in Chapter 8 (also see theexample in Figure 11-2) shows how last year’s data can be used to assess howeach salesperson is affected by the plan change and to make sure that top perform-ers will not be hurt. Formal transition plans such as cushions, guarantees, and dualplans can help strong performers who are hurt by plan changes maintain theirincome level in the short term. Sales leadership needs to develop ways to ensurethat positive banter about the change dominates negative banter. Salespeople who
PAGE 431................. 15869$ CH11 05-19-06 09:25:02 PS
432 The Complete Guide to Sales Force Incentive Compensation
benefit from the change (which hopefully include many of the firm’s most re-spected salespeople) are likely to be vocal supporters of it.
When changing the performance measures in an incentive plan, incorporatethe new measures into sales reports and performance management systems threeto twelve months before the measures are incorporated into the incentive com-pensation plan. This provides the sales force with time to get used to the newmeasures and the sales support group time to adjust. Inevitably, some exceptionsand needed clarifications to new measures will not be discovered until the mea-sures are rolled out to the field. For example, an added incentive on sales to newaccounts may create controversy about exactly which accounts qualify as ‘‘new.’’These issues can typically be resolved much more easily when an individual’s in-centive pay is not at stake.
Changes in performance measures and performance–payout relationshipssometimes affect the timing of incentive payouts and thus the cash flow for sales-people. For example, a change from a monthly commission plan to a quarterlybonus plan might be met with resistance by salespeople who like receiving morefrequent incentive payments. Some firms in this situation allow salespeople tomake draws against future incentive payments for a period of time following thetransition, while the sales force is adjusting to the new plan.
Firm Makes the Transition from Dollar-Based to Goal-BasedPerformance Measurement and Incentive Payment
A start-up medical device firm paid salespeople a commission on sales,with commission rates accelerating as sales increased beyond establishedthresholds. This plan worked well when the firm’s product line was rela-tively new, as it motivated salespeople to work hard to generate producttrial and rewarded their early success. Over time, as management gainedmarket knowledge and improved its ability to accurately predict futuresales, interest in developing a goal-based plan for the sales force grew.Management felt that goals would motivate salespeople to continue towork hard to grow the business and would help to tie individual achieve-ment to the attainment of corporate goals. In addition, as the productsmatured and competition intensified, management felt that differences inpotential across sales territories were becoming more apparent. Havingthe same commission thresholds for every salesperson was no longer fairbecause territories varied considerably in potential.
As a first step, a unique territory goal was established for each sales-person, based on territory and salesperson characteristics. These goalswere disseminated to the sales force. Performance against goal wastracked for each salesperson and became an important element in the salesforce performance management system. Salespeople adjusted to the newgoal-based performance tracking method and worked with managementto improve the accuracy of the goals and to address specific exceptionconditions.
PAGE 432................. 15869$ CH11 05-19-06 09:25:03 PS
433Making an Effective Transition with a Major Incentive Compensation Plan Change
After a year of experience using the goals with the sales force, manage-ment felt that the majority of the kinks had been ironed out of the system,and that sales force acceptance of the goals was high. At that point, thegoals were incorporated into the incentive plan. Commission rates weretied to goal attainment, with payout accelerating as salespeople met andexceeded territory goals.
Despite the sales force’s positive experience with territory goals in theperformance management system, the change to a goal-based incentiveplan was a major adjustment. The new plan resulted in a considerable redis-tribution of income among salespeople. The former plan had favored sales-people in territories with large potential, who were able to achieve thestandard sales thresholds more easily than those with less territory oppor-tunity. With the new plan, salespeople in high-potential territories weregiven higher goals, and achieving the new goal-based thresholds was muchmore challenging. To ease the transition for the sales force, the firm guaran-teed each salesperson that his earnings would be at least as much as lastyear’s during the first year following implementation of the new plan. Theguarantee declined and eventually was phased out after three years.
Special Situations
Territory Realignment. Changes in sales force size and structure often requireterritory realignment, with many accounts being reassigned from one salespersonto another. In industries where salespeople need in-depth customer knowledge tobe effective, this disruption in salesperson–customer relationships can be costly.Customer knowledge and relationships may be lost in the transition, causing cus-tomers to consider competitive offerings or to just take their business elsewhere.Sales incentive compensation can play an important role in easing this transitionfollowing realignment.
There is significant evidence suggesting that a well-thought-out, comprehen-sive relationship transition program reduces lost sales resulting from account dis-ruption during realignment. An industrial products distribution sales force foundthat following realignment, sales to disrupted major accounts were maintainedwhen a formal relationship transition program was implemented, but fell by 20percent when no such program was put in place. The transition program involvedhaving the exiting salesperson introduce each customer being transferred to thenew salesperson. Together, the two salespeople coordinated the transition.
Monetary incentives can play an important role in encouraging effective ac-count transitions. Incentives that encourage teamwork between the new and theexiting salespeople can help maintain important customer–company relationships.For example, the plan shown in Figure 11-8 pays a salesperson based on salesperformance at both her old accounts and her new accounts for a period followingrealignment.
Transition compensation programs are particularly important at companies
PAGE 433................. 15869$ CH11 05-19-06 09:25:03 PS
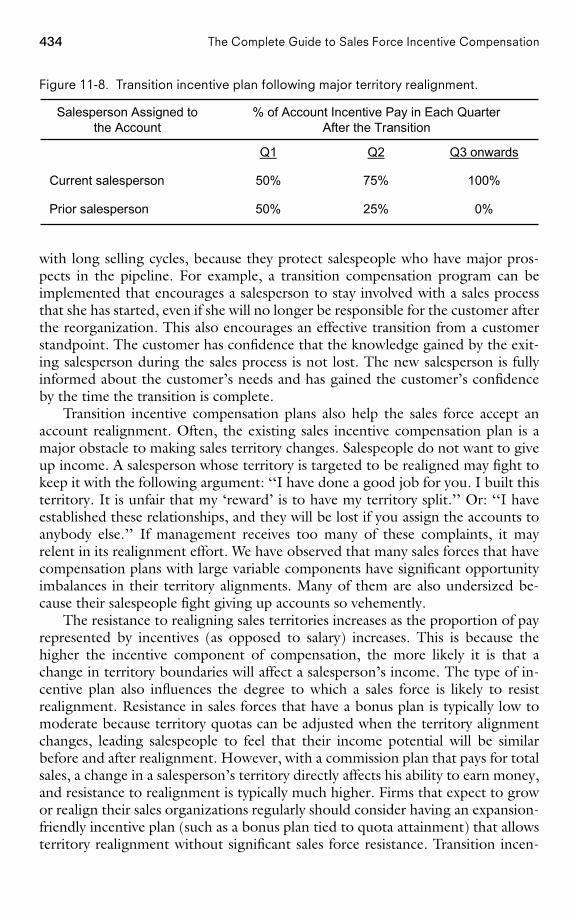
434 The Complete Guide to Sales Force Incentive Compensation
Figure 11-8. Transition incentive plan following major territory realignment.
Q3 onwardsQ2Q1
25%
75%
0%50%Prior salesperson
100%50%Current salesperson
% of Account Incentive Pay in Each QuarterAfter the Transition
Salesperson Assigned tothe Account
with long selling cycles, because they protect salespeople who have major pros-pects in the pipeline. For example, a transition compensation program can beimplemented that encourages a salesperson to stay involved with a sales processthat she has started, even if she will no longer be responsible for the customer afterthe reorganization. This also encourages an effective transition from a customerstandpoint. The customer has confidence that the knowledge gained by the exit-ing salesperson during the sales process is not lost. The new salesperson is fullyinformed about the customer’s needs and has gained the customer’s confidenceby the time the transition is complete.
Transition incentive compensation plans also help the sales force accept anaccount realignment. Often, the existing sales incentive compensation plan is amajor obstacle to making sales territory changes. Salespeople do not want to giveup income. A salesperson whose territory is targeted to be realigned may fight tokeep it with the following argument: ‘‘I have done a good job for you. I built thisterritory. It is unfair that my ‘reward’ is to have my territory split.’’ Or: ‘‘I haveestablished these relationships, and they will be lost if you assign the accounts toanybody else.’’ If management receives too many of these complaints, it mayrelent in its realignment effort. We have observed that many sales forces that havecompensation plans with large variable components have significant opportunityimbalances in their territory alignments. Many of them are also undersized be-cause their salespeople fight giving up accounts so vehemently.
The resistance to realigning sales territories increases as the proportion of payrepresented by incentives (as opposed to salary) increases. This is because thehigher the incentive component of compensation, the more likely it is that achange in territory boundaries will affect a salesperson’s income. The type of in-centive plan also influences the degree to which a sales force is likely to resistrealignment. Resistance in sales forces that have a bonus plan is typically low tomoderate because territory quotas can be adjusted when the territory alignmentchanges, leading salespeople to feel that their income potential will be similarbefore and after realignment. However, with a commission plan that pays for totalsales, a change in a salesperson’s territory directly affects his ability to earn money,and resistance to realignment is typically much higher. Firms that expect to growor realign their sales organizations regularly should consider having an expansion-friendly incentive plan (such as a bonus plan tied to quota attainment) that allowsterritory realignment without significant sales force resistance. Transition incen-
PAGE 434................. 15869$ CH11 05-19-06 09:25:04 PS
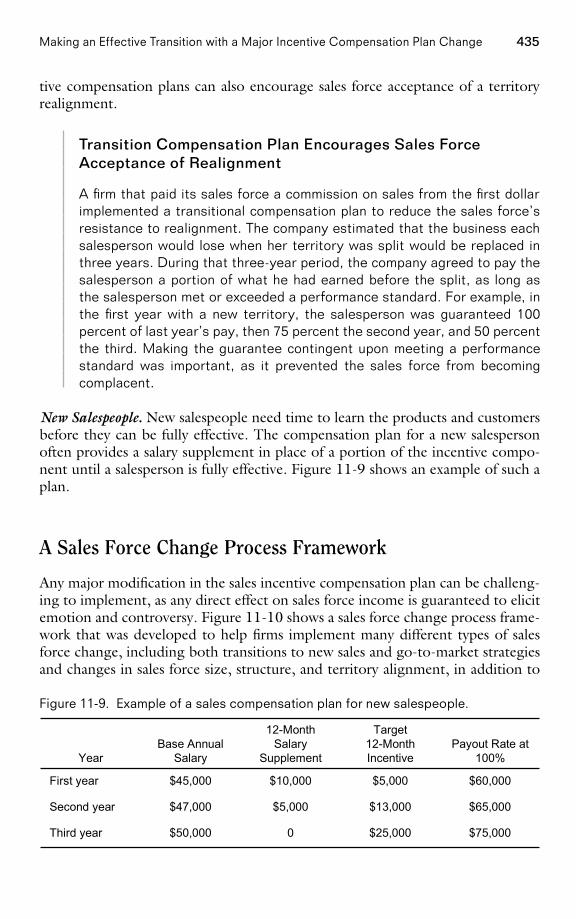
435Making an Effective Transition with a Major Incentive Compensation Plan Change
tive compensation plans can also encourage sales force acceptance of a territoryrealignment.
Transition Compensation Plan Encourages Sales ForceAcceptance of Realignment
A firm that paid its sales force a commission on sales from the first dollarimplemented a transitional compensation plan to reduce the sales force’sresistance to realignment. The company estimated that the business eachsalesperson would lose when her territory was split would be replaced inthree years. During that three-year period, the company agreed to pay thesalesperson a portion of what he had earned before the split, as long asthe salesperson met or exceeded a performance standard. For example, inthe first year with a new territory, the salesperson was guaranteed 100percent of last year’s pay, then 75 percent the second year, and 50 percentthe third. Making the guarantee contingent upon meeting a performancestandard was important, as it prevented the sales force from becomingcomplacent.
New Salespeople. New salespeople need time to learn the products and customersbefore they can be fully effective. The compensation plan for a new salespersonoften provides a salary supplement in place of a portion of the incentive compo-nent until a salesperson is fully effective. Figure 11-9 shows an example of such aplan.
A Sales Force Change Process Framework
Any major modification in the sales incentive compensation plan can be challeng-ing to implement, as any direct effect on sales force income is guaranteed to elicitemotion and controversy. Figure 11-10 shows a sales force change process frame-work that was developed to help firms implement many different types of salesforce change, including both transitions to new sales and go-to-market strategiesand changes in sales force size, structure, and territory alignment, in addition to
Figure 11-9. Example of a sales compensation plan for new salespeople.
$75,000$25,0000$50,000Third year
$65,000$13,000$5,000$47,000Second year
$60,000$5,000$10,000$45,000First year
Payout Rate at100%
Target12-MonthIncentive
12-MonthSalary
SupplementBase Annual
SalaryYear
PAGE 435................. 15869$ CH11 05-19-06 09:25:06 PS
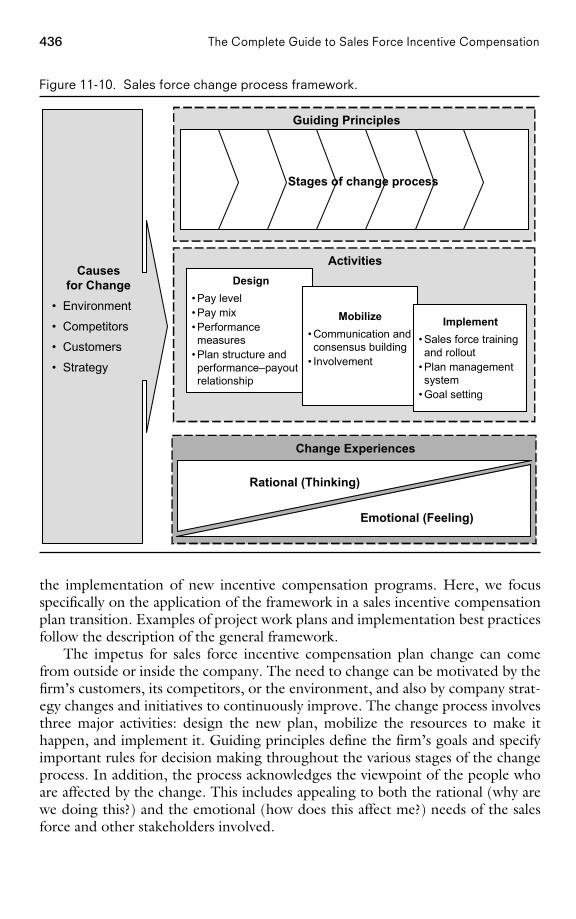
436 The Complete Guide to Sales Force Incentive Compensation
Figure 11-10. Sales force change process framework.
Activities
Stages of change process
Guiding Principles
Change Experiences
Rational (Thinking)
Emotional (Feeling)
Causesfor Change
• Environment
• Competitors
• Customers
• Strategy
Design• Pay level• Pay mix• Performancemeasures
• Plan structure andperformance–payoutrelationship
Mobilize• Communication andconsensus building
• Involvement
Implement• Sales force trainingand rollout
• Plan managementsystem
• Goal setting
the implementation of new incentive compensation programs. Here, we focusspecifically on the application of the framework in a sales incentive compensationplan transition. Examples of project work plans and implementation best practicesfollow the description of the general framework.
The impetus for sales force incentive compensation plan change can comefrom outside or inside the company. The need to change can be motivated by thefirm’s customers, its competitors, or the environment, and also by company strat-egy changes and initiatives to continuously improve. The change process involvesthree major activities: design the new plan, mobilize the resources to make ithappen, and implement it. Guiding principles define the firm’s goals and specifyimportant rules for decision making throughout the various stages of the changeprocess. In addition, the process acknowledges the viewpoint of the people whoare affected by the change. This includes appealing to both the rational (why arewe doing this?) and the emotional (how does this affect me?) needs of the salesforce and other stakeholders involved.
PAGE 436................. 15869$ CH11 05-19-06 09:25:07 PS
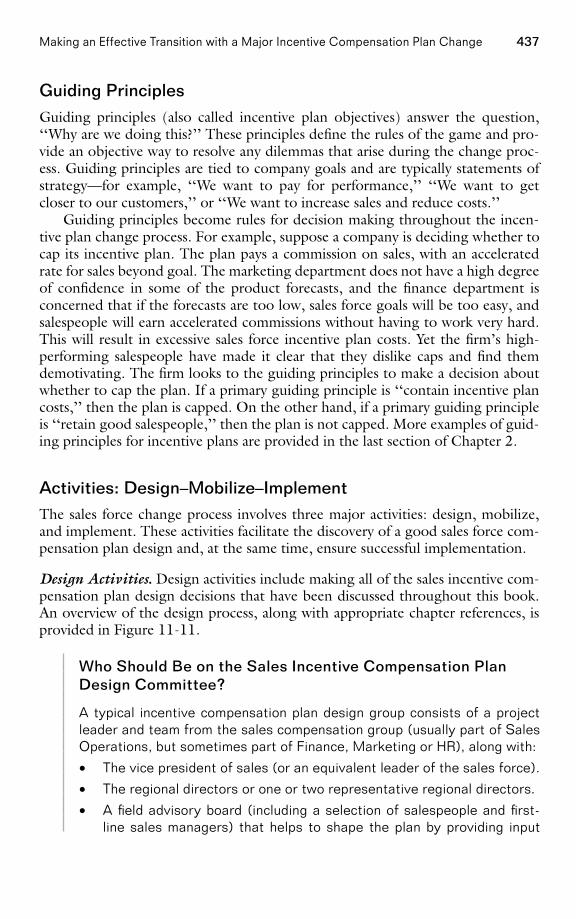
437Making an Effective Transition with a Major Incentive Compensation Plan Change
Guiding PrinciplesGuiding principles (also called incentive plan objectives) answer the question,‘‘Why are we doing this?’’ These principles define the rules of the game and pro-vide an objective way to resolve any dilemmas that arise during the change proc-ess. Guiding principles are tied to company goals and are typically statements ofstrategy—for example, ‘‘We want to pay for performance,’’ ‘‘We want to getcloser to our customers,’’ or ‘‘We want to increase sales and reduce costs.’’
Guiding principles become rules for decision making throughout the incen-tive plan change process. For example, suppose a company is deciding whether tocap its incentive plan. The plan pays a commission on sales, with an acceleratedrate for sales beyond goal. The marketing department does not have a high degreeof confidence in some of the product forecasts, and the finance department isconcerned that if the forecasts are too low, sales force goals will be too easy, andsalespeople will earn accelerated commissions without having to work very hard.This will result in excessive sales force incentive plan costs. Yet the firm’s high-performing salespeople have made it clear that they dislike caps and find themdemotivating. The firm looks to the guiding principles to make a decision aboutwhether to cap the plan. If a primary guiding principle is ‘‘contain incentive plancosts,’’ then the plan is capped. On the other hand, if a primary guiding principleis ‘‘retain good salespeople,’’ then the plan is not capped. More examples of guid-ing principles for incentive plans are provided in the last section of Chapter 2.
Activities: Design–Mobilize–ImplementThe sales force change process involves three major activities: design, mobilize,and implement. These activities facilitate the discovery of a good sales force com-pensation plan design and, at the same time, ensure successful implementation.
Design Activities. Design activities include making all of the sales incentive com-pensation plan design decisions that have been discussed throughout this book.An overview of the design process, along with appropriate chapter references, isprovided in Figure 11-11.
Who Should Be on the Sales Incentive Compensation PlanDesign Committee?
A typical incentive compensation plan design group consists of a projectleader and team from the sales compensation group (usually part of SalesOperations, but sometimes part of Finance, Marketing or HR), along with:
• The vice president of sales (or an equivalent leader of the sales force).
• The regional directors or one or two representative regional directors.
• A field advisory board (including a selection of salespeople and first-line sales managers) that helps to shape the plan by providing input
PAGE 437................. 15869$ CH11 05-19-06 09:25:08 PS
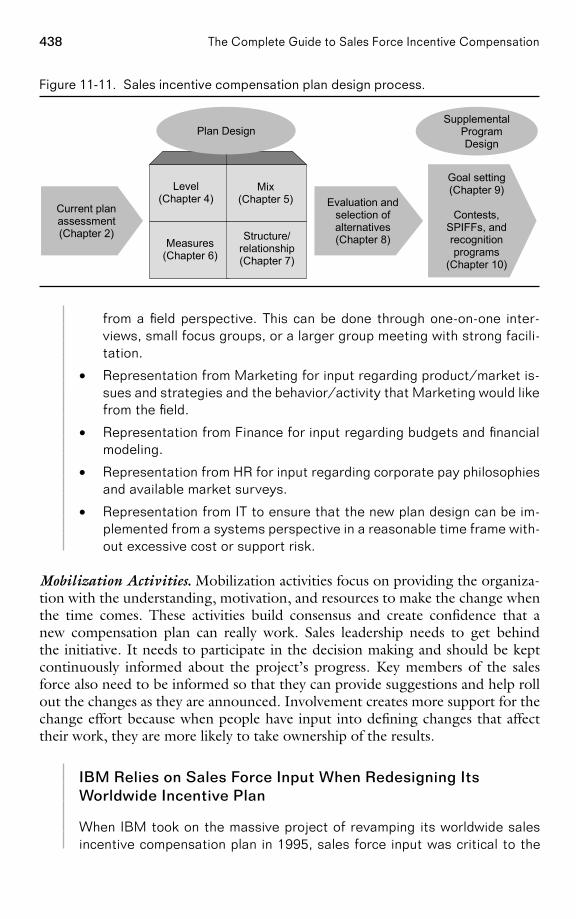
438 The Complete Guide to Sales Force Incentive Compensation
Figure 11-11. Sales incentive compensation plan design process.
Current planassessment(Chapter 2)
Evaluation andselection ofalternatives(Chapter 8)
Goal setting(Chapter 9)
Contests,SPIFFs, andrecognitionprograms
(Chapter 10)
SupplementalProgramDesign
Level(Chapter 4)
Mix(Chapter 5)
Measures(Chapter 6)
Structure/relationship(Chapter 7)
Plan Design
from a field perspective. This can be done through one-on-one inter-views, small focus groups, or a larger group meeting with strong facili-tation.
• Representation from Marketing for input regarding product/market is-sues and strategies and the behavior/activity that Marketing would likefrom the field.
• Representation from Finance for input regarding budgets and financialmodeling.
• Representation from HR for input regarding corporate pay philosophiesand available market surveys.
• Representation from IT to ensure that the new plan design can be im-plemented from a systems perspective in a reasonable time frame with-out excessive cost or support risk.
Mobilization Activities. Mobilization activities focus on providing the organiza-tion with the understanding, motivation, and resources to make the change whenthe time comes. These activities build consensus and create confidence that anew compensation plan can really work. Sales leadership needs to get behindthe initiative. It needs to participate in the decision making and should be keptcontinuously informed about the project’s progress. Key members of the salesforce also need to be informed so that they can provide suggestions and help rollout the changes as they are announced. Involvement creates more support for thechange effort because when people have input into defining changes that affecttheir work, they are more likely to take ownership of the results.
IBM Relies on Sales Force Input When Redesigning ItsWorldwide Incentive Plan
When IBM took on the massive project of revamping its worldwide salesincentive compensation plan in 1995, sales force input was critical to the
PAGE 438................. 15869$ CH11 05-19-06 09:25:09 PS
439Making an Effective Transition with a Major Incentive Compensation Plan Change
project’s success. The project leader and four sales managers spent a fullyear collecting over four thousand pieces of anecdotal information aboutthe existing incentive plan from the sales force. Electronic messages weresent to IBM salespeople all over the world, asking for descriptions of spe-cific incentive plan problems they had encountered. The team also met withIBM incentive managers from North America, Latin America, Europe, andAsia Pacific to discuss the various challenges faced in each region and toidentify similarities and differences across the various countries. The finalplan design was developed during a week of intensive all-day meetingsattended by 10 IBM compensation managers from all over the world.
In addition to the sales force, there are many other people and departmentswithin the company that should be involved in the planning of a major salescompensation plan redesign. Figure 11-12 summarizes the different viewpointsand varying objectives for the sales compensation plan that different companystakeholders have. Sales management needs to work together with representativesfrom top management, Finance, Human Resources, Marketing, Systems, and anyother relevant departments to ensure that all these varying and sometimes com-peting objectives are balanced appropriately.
Who Owns the Sales Compensation Plan?
At the majority of companies, ultimate authority for sales compensationresides within the sales department, often within the Sales Operationsgroup. However, it is also common for groups within HR, Finance, or Mar-keting to own the sales compensation plan. There is frequent debate amongprofessionals from these departments as to who should be the rightfulowner of the sales compensation plan.
• HR argues, ‘‘We are experts on pay, and we have a broad perspectiveon corporate pay philosophies. HR should own sales compensation be-cause we are experienced in designing incentive plans, good at inter-preting market survey data, and in the best position to ensure thatsales force pay is consistent with pay in other departments.’’
• Finance argues, ‘‘Sales compensation is one of the firm’s largest bud-get items. Finance should own sales compensation because we willensure fiscal responsibility and the financial viability of this very sig-nificant cost item.’’
• Marketing argues, ‘‘Sales is a critical component of the firm’s market-ing strategy. Marketing should own sales compensation because wewill ensure that the sales pay plan drives behavior that is consistentwith product and customer marketing strategies.’’
• Sales argues, ‘‘Sales compensation is one of many key sales force ef-fectiveness drivers that influence salespeople, their activities, and cus-
PAGE 439................. 15869$ CH11 05-19-06 09:25:10 PS
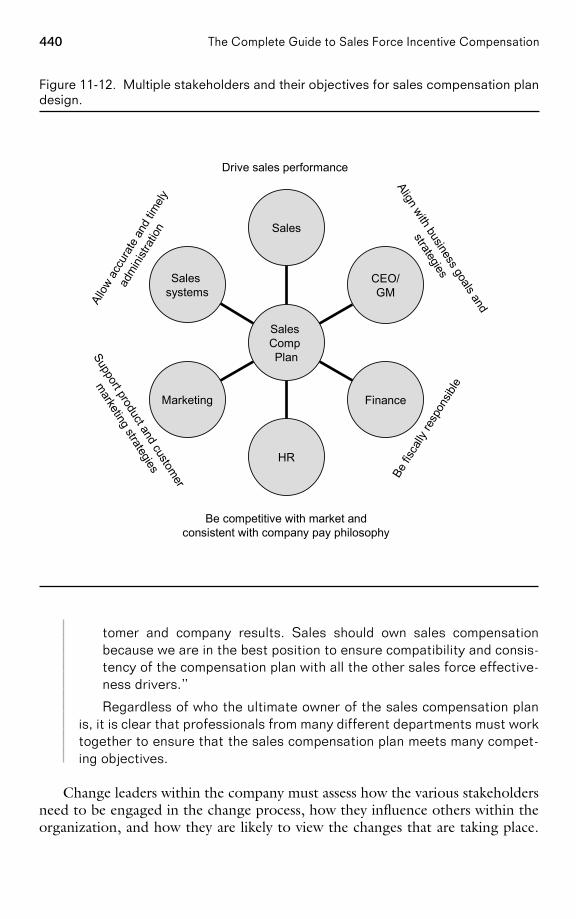
440 The Complete Guide to Sales Force Incentive Compensation
Figure 11-12. Multiple stakeholders and their objectives for sales compensation plandesign.
Sales systems
Marketing
HR
Finance
CEO/GM
Sales
Sales Comp Plan
Allow
acc
urat
e an
d tim
ely
adm
inistr
ation
Support product and customer
marketing strategies
Align with business goals and
strategies
Be fis
cally
resp
onsib
le
Be competitive with market andconsistent with company pay philosophy
Drive sales performance
tomer and company results. Sales should own sales compensationbecause we are in the best position to ensure compatibility and consis-tency of the compensation plan with all the other sales force effective-ness drivers.’’
Regardless of who the ultimate owner of the sales compensation planis, it is clear that professionals from many different departments must worktogether to ensure that the sales compensation plan meets many compet-ing objectives.
Change leaders within the company must assess how the various stakeholdersneed to be engaged in the change process, how they influence others within theorganization, and how they are likely to view the changes that are taking place.
PAGE 440................. 15869$ CH11 05-19-06 09:25:11 PS
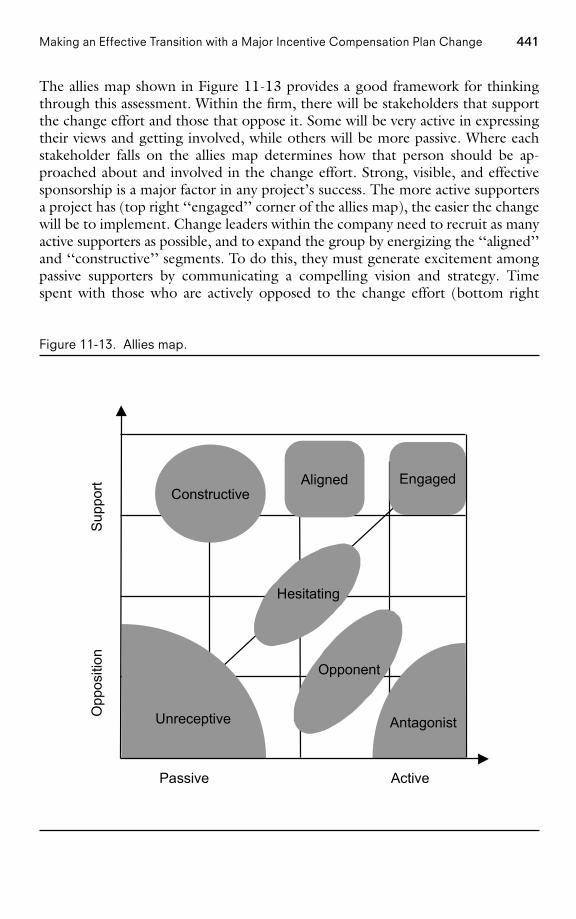
441Making an Effective Transition with a Major Incentive Compensation Plan Change
The allies map shown in Figure 11-13 provides a good framework for thinkingthrough this assessment. Within the firm, there will be stakeholders that supportthe change effort and those that oppose it. Some will be very active in expressingtheir views and getting involved, while others will be more passive. Where eachstakeholder falls on the allies map determines how that person should be ap-proached about and involved in the change effort. Strong, visible, and effectivesponsorship is a major factor in any project’s success. The more active supportersa project has (top right ‘‘engaged’’ corner of the allies map), the easier the changewill be to implement. Change leaders within the company need to recruit as manyactive supporters as possible, and to expand the group by energizing the ‘‘aligned’’and ‘‘constructive’’ segments. To do this, they must generate excitement amongpassive supporters by communicating a compelling vision and strategy. Timespent with those who are actively opposed to the change effort (bottom right
Figure 11-13. Allies map.
Opp
ositi
on
Su
ppor
t
Passive Active
Constructive
Opponent
Hesitating
Antagonist
Aligned
Unreceptive
Engaged
PAGE 441................. 15869$ CH11 05-19-06 09:25:12 PS
442 The Complete Guide to Sales Force Incentive Compensation
‘‘antagonist’’ corner of the allies map) is usually time wasted. The goal with thissegment is to diminish the negative impact that its active opposition to thechanges might have on the rest of the group.
The ‘‘who gets helped’’ and ‘‘who gets hurt’’ analysis developed in Chapter8 provides a means to classify the salespeople who might fall into the ‘‘support’’and ‘‘opposition’’ groupings. Managerial judgment can reflect on who would takea passive and who would take an active stance on the proposed incentive compen-sation change.
Fifth Third Bank Focuses on Implementation DuringIncentive Plan Redesign
In the early 2000s, Cincinnati’s Fifth Third Bank was a recognized industryleader, with consistently strong financial performance and a reputation forhaving excellent salespeople. Yet management felt that the bank’s short-term sales incentive plan was not driving sales force behaviors and resultsas effectively as possible. In 2001, new incentive plans for more than 30different sales roles were designed and implemented. A strong mobilizationfocus throughout the entire project contributed significantly to the newplan’s acceptance and success. Multiple cross-functional teams wereformed—a steering committee (leadership), a technology team, a designteam, and multiple implementation teams. Having these multiple teams al-lowed input from many experts within the company to be heard, and alsofacilitated buy-in and consensus of key stakeholders. A ‘‘change processowner’’ was appointed to lead the implementation effort on several fronts,including the following:
• Leadership. Stay informed about company leaders’ wishes and keepthem up-to-date on project progress.
• Involvement. Talk with employee stakeholders ‘‘offline’’ to learn whatthey are afraid of and what they are thinking is good.
• Communication. Write rollout documentation, Q&A documents, andexecutive presentations; develop earnings calculators; facilitate roadshows.
The bank estimated that incremental profits from the new incentiveplan were more than 10 times the incremental investment in incentive pay.
Implementation Activities. Implementation activities focus on making the newincentive compensation plan a reality. A transition plan is put into action. A salesforce communication plan is developed and executed, including compensationplan materials such as overview brochures, pocket cards, and commission calcula-tors. ‘‘Road show’’ presentations are orchestrated for rolling these materials outto the sales force. If the plan is goal-based, new territory goals are developedand disseminated. Meanwhile, the company’s sales systems and processes must be
PAGE 442................. 15869$ CH11 05-19-06 09:25:13 PS
443Making an Effective Transition with a Major Incentive Compensation Plan Change
realigned to allow ongoing performance reports to be produced and goals to beset and refined as needed.
Figure 11-14 shows two examples of project work plans for managing theimplementation of a new sales incentive compensation plan. These work plansshow summarized views; a more detailed breakdown of the activities, responsibili-ties, and deadlines within each of the major work steps is also needed. The firstcompany had a six-month time frame for implementation, and the second had athree-month time frame, plus three additional months of administrative supportfrom a consultant. The amount of time required for implementation varies de-pending upon the size, complexity, and capabilities of the organization as well asthe extent of the changes being implemented.
Some best practices for key implementation activities are described here.
Communicating Plan Features and Benefits to the Field. A well-thought-out andeffectively executed plan for communicating the benefits and features of a newincentive plan to the sales force is absolutely critical. If the field does not acceptand understand the plan, the plan will fail, no matter how clever its design. Goodplans usually fail when there is poor communication and when there is too littletraining of the sales force.
The communication plan for a new sales incentive plan includes two majoractivities:
1. Developing the plan documentation, communication materials, presenta-tions, and training aids
2. Executing the field rollout
Documentation and training materials for the new plan include several itemsfor each salesperson.
• A plan overview document explains why the change is happening, alongwith details about the new plan objectives, structure, and features. Thetypical length of this document is 20 to 30 presentation slides for a com-plex plan and less for a more straightforward plan. A sample table of con-tents for the plan overview document is provided in Figure 11-15.
• A list of frequently asked questions and answers (FAQs) addresses themajority of anticipated field concerns. A sample list of FAQs is provided inFigure 11-16.
• A pocket card summarizes key plan details. Salespeople should be encour-aged to keep the card in their wallet as a quick, handy reference. An exam-ple of a pocket card for a complex plan is shown in Figure 11-17.
• A customized monthly payout table or personal incentive calculator helpssalespeople understand how much incentive money they can make at dif-
PAGE 443................. 15869$ CH11 05-19-06 09:25:13 PS
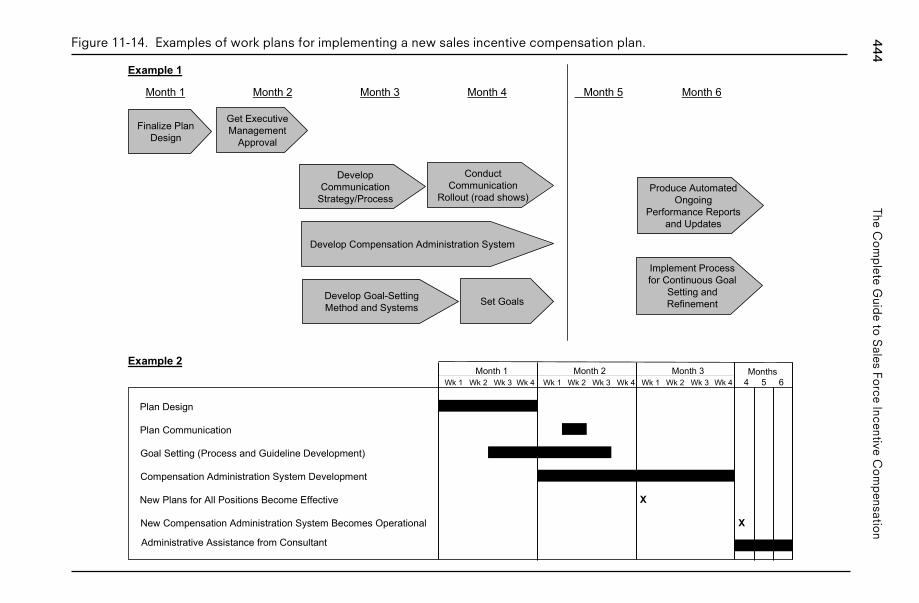
444The
Co
mp
leteG
uide
toS
alesFo
rceIncentive
Co
mp
ensation
Figure 11-14. Examples of work plans for implementing a new sales incentive compensation plan.
Chp11 figures v05 final.ppt
Wk 1 Wk 2 Wk 3 Wk 4 Wk 1 Wk 2 Wk 3 Wk 4 Wk 1 Wk 2 Wk 3 Wk 4
Plan Design
Plan Communication
Goal Setting (Process and Guideline Development)
Compensation Administration System Development
New Plans for All Positions Become Effective X
New Compensation Administration System Becomes Operational X
Administrative Assistance from Consultant
Months 4 5 6
Month 1 Month 2 Month 3
Month 1 Month 2 Month 3 Month 4 Month 5 Month 6
Finalize PlanDesign
Get ExecutiveManagement
Approval
DevelopCommunication
Strategy/Process
ConductCommunication
Rollout (road shows)
Develop Compensation Administration System
Develop Goal-SettingMethod and Systems Set Goals
Implement Processfor Continuous Goal
Setting andRefinement
Produce AutomatedOngoing
Performance Reportsand Updates
Example 1
Example 2
PA
GE
444.................15869$
CH
1105-19-06
09:25:14P
S
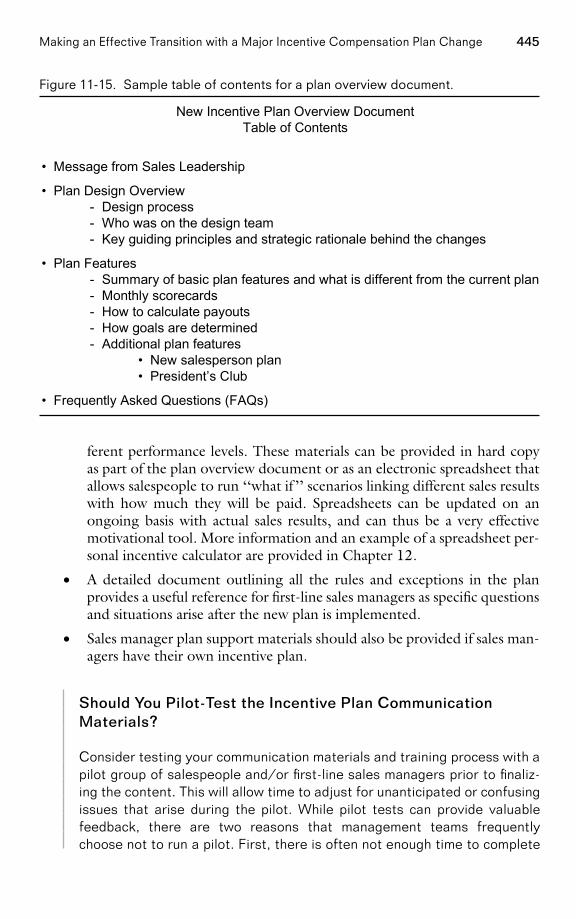
445Making an Effective Transition with a Major Incentive Compensation Plan Change
Figure 11-15. Sample table of contents for a plan overview document.
• Message from Sales Leadership
• Plan Design Overview- Design process- Who was on the design team- Key guiding principles and strategic rationale behind the changes
• Plan Features- Summary of basic plan features and what is different from the current plan- Monthly scorecards- How to calculate payouts- How goals are determined- Additional plan features
• New salesperson plan• President’s Club
• Frequently Asked Questions (FAQs)
New Incentive Plan Overview DocumentTable of Contents
ferent performance levels. These materials can be provided in hard copyas part of the plan overview document or as an electronic spreadsheet thatallows salespeople to run ‘‘what if ’’ scenarios linking different sales resultswith how much they will be paid. Spreadsheets can be updated on anongoing basis with actual sales results, and can thus be a very effectivemotivational tool. More information and an example of a spreadsheet per-sonal incentive calculator are provided in Chapter 12.
• A detailed document outlining all the rules and exceptions in the planprovides a useful reference for first-line sales managers as specific questionsand situations arise after the new plan is implemented.
• Sales manager plan support materials should also be provided if sales man-agers have their own incentive plan.
Should You Pilot-Test the Incentive Plan CommunicationMaterials?
Consider testing your communication materials and training process with apilot group of salespeople and/or first-line sales managers prior to finaliz-ing the content. This will allow time to adjust for unanticipated or confusingissues that arise during the pilot. While pilot tests can provide valuablefeedback, there are two reasons that management teams frequentlychoose not to run a pilot. First, there is often not enough time to complete
PAGE 445................. 15869$ CH11 05-19-06 09:25:15 PS
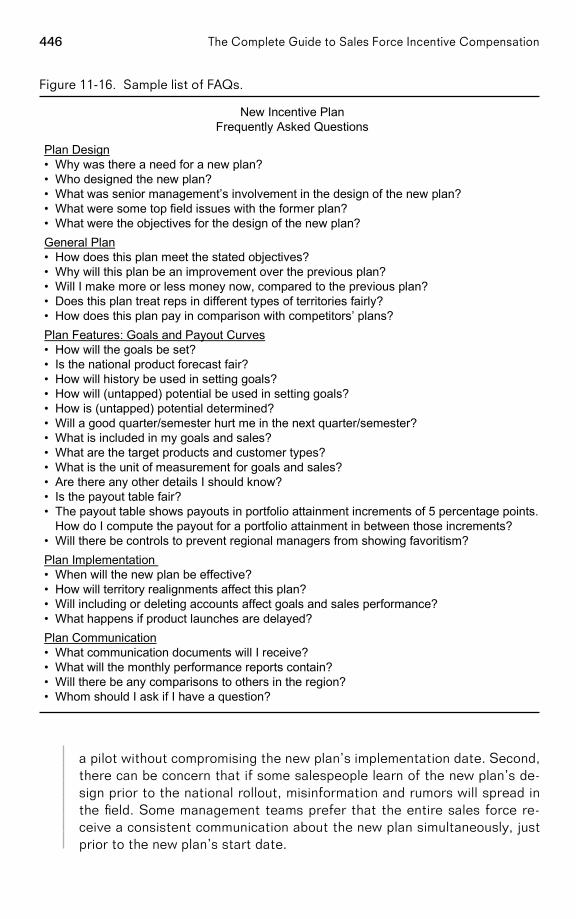
446 The Complete Guide to Sales Force Incentive Compensation
Figure 11-16. Sample list of FAQs.
Plan Design• Why was there a need for a new plan?• Who designed the new plan?• What was senior management’s involvement in the design of the new plan?• What were some top field issues with the former plan?• What were the objectives for the design of the new plan?General Plan• How does this plan meet the stated objectives?• Why will this plan be an improvement over the previous plan?• Will I make more or less money now, compared to the previous plan?• Does this plan treat reps in different types of territories fairly?• How does this plan pay in comparison with competitors’ plans?Plan Features: Goals and Payout Curves• How will the goals be set?• Is the national product forecast fair?• How will history be used in setting goals?• How will (untapped) potential be used in setting goals?• How is (untapped) potential determined?• Will a good quarter/semester hurt me in the next quarter/semester?• What is included in my goals and sales?• What are the target products and customer types?• What is the unit of measurement for goals and sales?• Are there any other details I should know?• Is the payout table fair?• The payout table shows payouts in portfolio attainment increments of 5 percentage points.
How do I compute the payout for a portfolio attainment in between those increments?• Will there be controls to prevent regional managers from showing favoritism?Plan Implementation • When will the new plan be effective?• How will territory realignments affect this plan?• Will including or deleting accounts affect goals and sales performance?• What happens if product launches are delayed?Plan Communication• What communication documents will I receive?• What will the monthly performance reports contain?• Will there be any comparisons to others in the region?• Whom should I ask if I have a question?
New Incentive PlanFrequently Asked Questions
a pilot without compromising the new plan’s implementation date. Second,there can be concern that if some salespeople learn of the new plan’s de-sign prior to the national rollout, misinformation and rumors will spread inthe field. Some management teams prefer that the entire sales force re-ceive a consistent communication about the new plan simultaneously, justprior to the new plan’s start date.
PAGE 446................. 15869$ CH11 05-19-06 09:25:16 PS
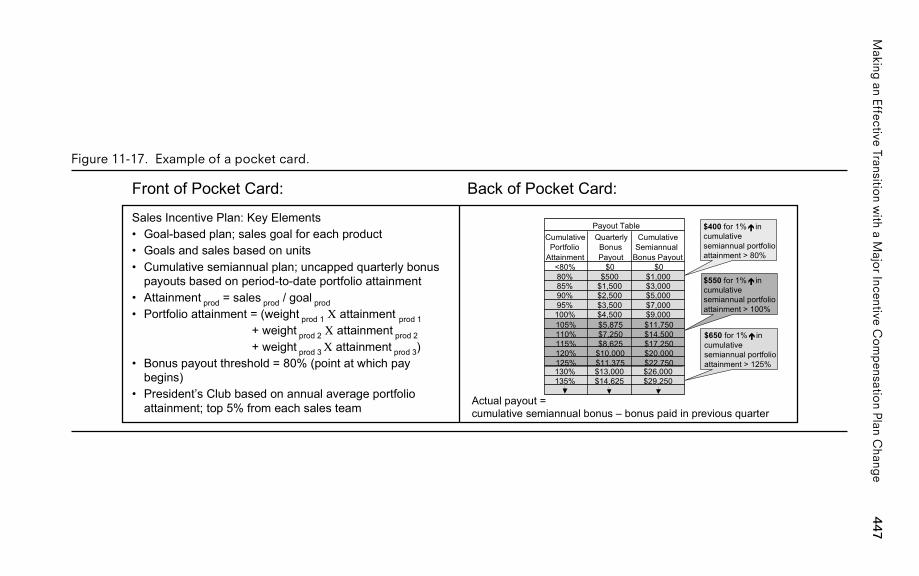
447M
akingan
EffectiveTransitio
nw
itha
Majo
rIncentive
Co
mp
ensation
Plan
Chang
e
Figure 11-17. Example of a pocket card.
Sales Incentive Plan: Key Elements• Goal-based plan; sales goal for each product• Goals and sales based on units• Cumulative semiannual plan; uncapped quarterly bonus
payouts based on period-to-date portfolio attainment• Attainment prod = sales prod / goal prod• Portfolio attainment = (weight prod 1 Χ attainment prod 1 + weight prod 2 Χ attainment prod 2 + weight prod 3 Χ attainment prod 3)• Bonus payout threshold = 80% (point at which pay
begins)• President’s Club based on annual average portfolio
attainment; top 5% from each sales team
Front of Pocket Card: Back of Pocket Card:
$400 for 1% incumulativesemiannual portfolioattainment > 80%
�
Actual payout =cumulative semiannual bonus – bonus paid in previous quarter
$550 for 1% incumulativesemiannual portfolioattainment > 100%
�
$650 for 1% incumulativesemiannual portfolioattainment > 125%
�
Cumulative Portfolio
Attainment
Quarterly Bonus Payout
Cumulative Semiannual
Bonus Payout<80% $0 $080% $500 $1,00085% $1,500 $3,00090% $2,500 $5,00095% $3,500 $7,000100% $4,500 $9,000
130% $13,000 $26,000135% $14,625 $29,250
Payout Table
105% $5,875 $11,750110% $7,250 $14,500115% $8,625 $17,250120% $10,000 $20,000125% $11,375 $22,750
PA
GE
447.................15869$
CH
1105-19-06
09:25:17P
S
448 The Complete Guide to Sales Force Incentive Compensation
Once all the communication materials have been developed, the new incentiveplan can be announced to the sales force, and the communication and trainingprocess begins. This effort involves:
• Selling the benefits of the new plan to the sales force
• Educating salespeople about how the new plan is different from the exist-ing plan
• Ensuring that the sales force understands how payouts will be determined
• Answering questions and providing resources for future help
The logistical difficulty of this effort varies greatly, depending upon the sizeand geographic dispersion of the sales force. With a large national or multinationalsales force, ‘‘road show’’ presentations at multiple locations are usually required.First-line sales managers typically play a key role in these presentations and act astrainers for the salespeople who report to them. Some success strategies for exe-cuting a successful field rollout include the following:
• Announce the new plan to the sales force shortly after a payout period inthe old incentive plan has ended; avoid distracting the sales force duringthe final weeks of the previous incentive period.
• Ask sales leadership to make the initial announcement. A carefully craftedmessage articulates the objectives of the new plan and inspires commit-ment from the sales force. A national sales meeting is an ideal forum foraccomplishing this, but if timing is tight, a live videoconference or Web-cast can also work.
• Train the entire sales management team on the new plan before trainingthe rest of the sales force. First-line sales managers who thoroughly under-stand and are sold on a plan significantly enhance acceptance of the planat the salesperson level; salespeople are much more likely to embrace aplan that they perceive as coming from their manager, rather than fromthe home office.
• Ask first-line sales managers to conduct the new plan training sessions fortheir salespeople. If some managers are reluctant to lead this session be-cause they feel that the new plan is complex or hard to explain, alleviatetheir discomfort by having easy-to-understand and well-organized train-ing materials. In addition, a conference call for all first-line sales managersjust prior to the national rollout can be an effective way to increase salesmanagers’ comfort level and get last-minute questions answered quickly.
• Plan a series of communications with the field over the first few monthsafter the plan is implemented. Include reminders and other plan reinforce-ments via the company’s intranet or sales force newsletter.
PAGE 448................. 15869$ CH11 05-19-06 09:25:17 PS
449Making an Effective Transition with a Major Incentive Compensation Plan Change
JCPenney Focuses on Implementation During a MajorCompensation Plan Redesign
The compensation team at JCPenney faced a major challenge when topmanagement asked it to completely overhaul the company’s 20-year-oldpay program in less than a year. The new compensation plan would supporta transformation of the company’s business model and work culture thatmanagement felt was necessary to restore profitable growth and help thefirm succeed in the highly competitive retail industry. The compensationteam worked with an outside consultant to determine market prices for thefirm’s various jobs, to group jobs according to their relative impact on thecompany, and to link jobs to established career paths. Successful imple-mentation of the changes required significant and meaningful communica-tion throughout the firm. With the support of top management, thecompensation team led all of the following implementation activities:
• Posted frequent project updates on the company HR home page.
• Distributed a newsletter to all sales managers outlining the changes.
• Held department meetings one week before the changes were imple-mented.
• Prepared meeting leader scripts to ensure message consistency.
• Created a video discussing the benefits of the new program.
• Developed and distributed Q&A materials.
• Wrote personal letters communicating associates’ job band and marketpay range.
Developing the Plan Administration Systems and Processes. Developing or adaptingthe administrative systems and processes to support a new incentive plan can be asignificant undertaking. The difficulty of this effort depends upon the size andcomplexity of the sales force, the intricacy of the incentive plan or plans, and theamount and types of changes being implemented. Implementation may be fairlystraightforward for a small sales force whose incentive compensation systems andprocesses are administrated by one individual using spreadsheet software. On theother hand, implementation may require considerable time, planning, and re-sources for a large sales force that is implementing considerable change in manycomplex incentive plans for multiple sales roles.
In large, complex sales forces, often the information technology (IT) group isinvolved in implementation. Strong communication between IT and the incentivecompensation (IC) group is critical. IT managers are technology experts; theymay not understand all the issues and intricacies of incentive compensation. ICmanagers know the needs of the sales force and the incentive program, but maynot understand all the technology implications of proposed changes. Tension be-tween the IC and IT groups is common, and is often the result of gaps between
PAGE 449................. 15869$ CH11 05-19-06 09:25:18 PS
450 The Complete Guide to Sales Force Incentive Compensation
the business rules that the IC team provides to the IT group and the level ofspecificity that IT requires. Some common areas of ambiguity include:
• Eligibility for the incentive plan
• Handling of employment changes (for example, new salespeople, transfersor promotions, and terminations)
• Handling of account changes and reassignments
• Policy on sales crediting, order returns or cancellations, and sharing creditamong multiple salespeople
• Goal adjustment policies and procedures
A successful implementation of new incentive plan systems and processes canbe encouraged by:
• Keeping rules across multiple sales teams and plans as consistent as pos-sible
• Documenting all business rules and exceptions
• Building the necessary flexibility into the system for managing exceptionsand changes
• Avoiding the resetting of objectives in the middle of the compensationperiod
• Having a process to deal with payout issues or errors
Because of the complexity and amount of detail in compensation plan admin-istration, expect errors to occur. Be proactive in communicating and fixing errors,and document all changes. Chapter 12 describes the various information process-ing and logistical elements required to support an effective incentive compensa-tion plan.
Setting Goals. For an incentive plan that is goal-based, setting territory-level goalsis the third main component of plan implementation. A goal-based plan will fail ifterritory goals are not both sufficiently challenging and perceived as realistic andfair by the sales force. Many companies spend a lot of time and money on salesincentive plan design, but treat the goal-setting process as an afterthought. Thisis a serious mistake. Successful goal setting requires a considerable investment oftime and effort. Effective processes for goal setting are discussed in detail in Chap-ter 9.
Timing of Implementation with Design and Mobilization Activities. Figure 11-18illustrates the timing of organizational energy across the three sales force changeactivities: design, mobilize, and implement. Companies that implement incentivecompensation plan change successfully typically do not wait until the design is
PAGE 450................. 15869$ CH11 05-19-06 09:25:18 PS
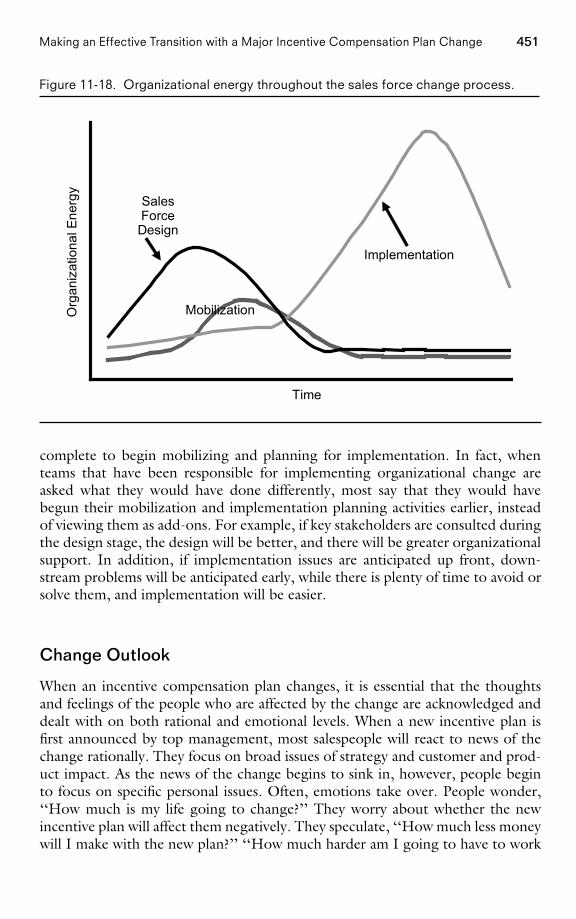
451Making an Effective Transition with a Major Incentive Compensation Plan Change
Figure 11-18. Organizational energy throughout the sales force change process.
Time
Org
aniz
atio
nal E
nerg
y
Mobilization
Implementation
Sales ForceDesign
complete to begin mobilizing and planning for implementation. In fact, whenteams that have been responsible for implementing organizational change areasked what they would have done differently, most say that they would havebegun their mobilization and implementation planning activities earlier, insteadof viewing them as add-ons. For example, if key stakeholders are consulted duringthe design stage, the design will be better, and there will be greater organizationalsupport. In addition, if implementation issues are anticipated up front, down-stream problems will be anticipated early, while there is plenty of time to avoid orsolve them, and implementation will be easier.
Change Outlook
When an incentive compensation plan changes, it is essential that the thoughtsand feelings of the people who are affected by the change are acknowledged anddealt with on both rational and emotional levels. When a new incentive plan isfirst announced by top management, most salespeople will react to news of thechange rationally. They focus on broad issues of strategy and customer and prod-uct impact. As the news of the change begins to sink in, however, people beginto focus on specific personal issues. Often, emotions take over. People wonder,‘‘How much is my life going to change?’’ They worry about whether the newincentive plan will affect them negatively. They speculate, ‘‘How much less moneywill I make with the new plan?’’ ‘‘How much harder am I going to have to work
PAGE 451................. 15869$ CH11 05-19-06 09:25:19 PS
452 The Complete Guide to Sales Force Incentive Compensation
to make the same amount of money?’’ Companies that deal with these emotionsdirectly can avoid trouble down the road.
Effective communication both from management and with peers can helppeople understand and accept change. Often, communications from the leader-ship team are most appropriate for helping people comprehend change on a ratio-nal level, while discussions with peers have the biggest impact on an emotionallevel. Both levels of communication are essential to symbiotically cover people’srational and emotional needs.
PAGE 452................. 15869$ CH11 05-19-06 09:25:19 PS
C H A P T E R 1 2
Incentive Compensation PlanAdministration
How This Chapter Is Organized
Introduction 454What Is Incentive Compensation Plan Administration? 454Why IC Plan Administration Is Important but Difficult 456
Is the Incentive Compensation Plan Administered Well? 458Characteristics of Well-Administered Incentive Compensation Systems 459Symptoms of Poorly Administered Incentive Compensation Systems:A 3 Cs Framework 460
IC Plan Administration Systems and Processes 461Systems of Varied Complexity 461
A Simple System 462A Moderately Complex System 462A Highly Complex System 462
An IC Plan Administration Flowchart 463Inputs 463
Sales Transactions and Account Assignments 463Sales Roster and Eligibility 464Other Data and Metrics 464IC Plan 464
Outputs 464
PAGE 453
453
................. 15869$ CH12 05-19-06 09:24:48 PS
454 The Complete Guide to Sales Force Incentive Compensation
Payroll Outputs 465Scorecards and Field Management Reports 465Plan Health Reports 465Compliance Reporting and Other Stakeholder Outputs 466
IC Administration System Requirements 469Data Management 469Reporting 470Quality Assurance and Control 475
How to Design an Effective IC Plan Administration System 476Design Elements 476
People 476Processes 477Tools 481
Design Influences 482Business Goals 482Situation Complexity 484
What Should Be the Role of External Partners in IC Administration? 485Should the Firm Make or Buy the IC Administration SystemTools? 486Should the Firm Outsource Ongoing IC Administration or DoIt In-House? 486
Summary 489
Introduction
A sales compensation program cannot succeed without a well-defined and effec-tively executed incentive plan administration system. Developing and maintainingthis system can be challenging, particularly when unplanned measurement andpayout adjustments are made, introducing opportunities for error and delay.
What Is Incentive Compensation Plan Administration?
Incentive compensation (IC) plan administration systems consist of the people,processes, and tools that enable an incentive plan to operate and adapt over time.Figure 12-1 shows the role of an IC plan administration system within the largerscope of sales incentive compensation program management. The activities shownin the top rectangle of the figure, incentive plan design and implementation, arediscussed in previous chapters of this book. The activities shown in the bottom
PAGE 454................. 15869$ CH12 05-19-06 09:24:48 PS
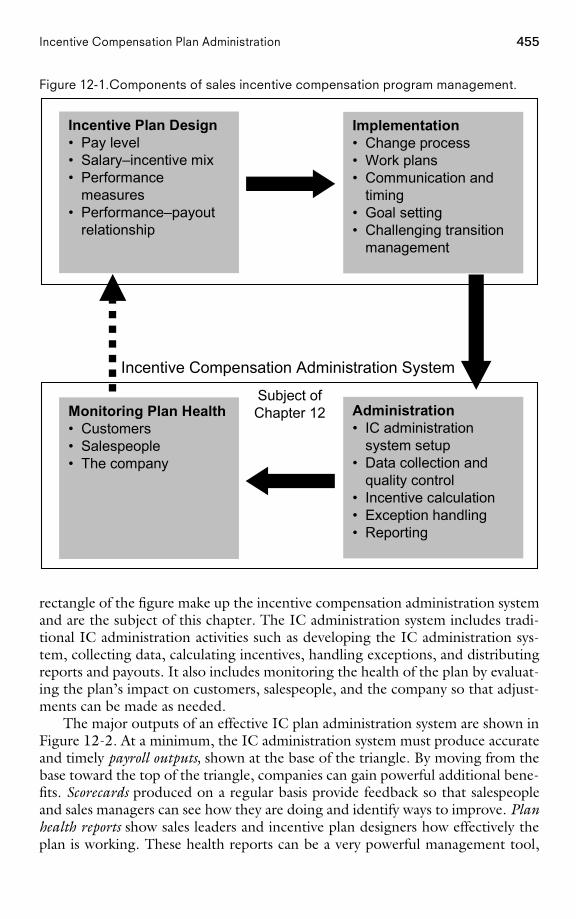
455Incentive Compensation Plan Administration
Figure 12-1.Components of sales incentive compensation program management.
Implementation• Change process• Work plans• Communication and
timing• Goal setting• Challenging transition
management
Incentive Plan Design• Pay level• Salary–incentive mix• Performance
measures• Performance–payout
relationship
Administration• IC administration
system setup• Data collection and
quality control• Incentive calculation• Exception handling• Reporting
Monitoring Plan Health• Customers• Salespeople• The company
Incentive Compensation Administration System
Subject ofChapter 12
rectangle of the figure make up the incentive compensation administration systemand are the subject of this chapter. The IC administration system includes tradi-tional IC administration activities such as developing the IC administration sys-tem, collecting data, calculating incentives, handling exceptions, and distributingreports and payouts. It also includes monitoring the health of the plan by evaluat-ing the plan’s impact on customers, salespeople, and the company so that adjust-ments can be made as needed.
The major outputs of an effective IC plan administration system are shown inFigure 12-2. At a minimum, the IC administration system must produce accurateand timely payroll outputs, shown at the base of the triangle. By moving from thebase toward the top of the triangle, companies can gain powerful additional bene-fits. Scorecards produced on a regular basis provide feedback so that salespeopleand sales managers can see how they are doing and identify ways to improve. Planhealth reports show sales leaders and incentive plan designers how effectively theplan is working. These health reports can be a very powerful management tool,
PAGE 455................. 15869$ CH12 05-19-06 09:24:49 PS
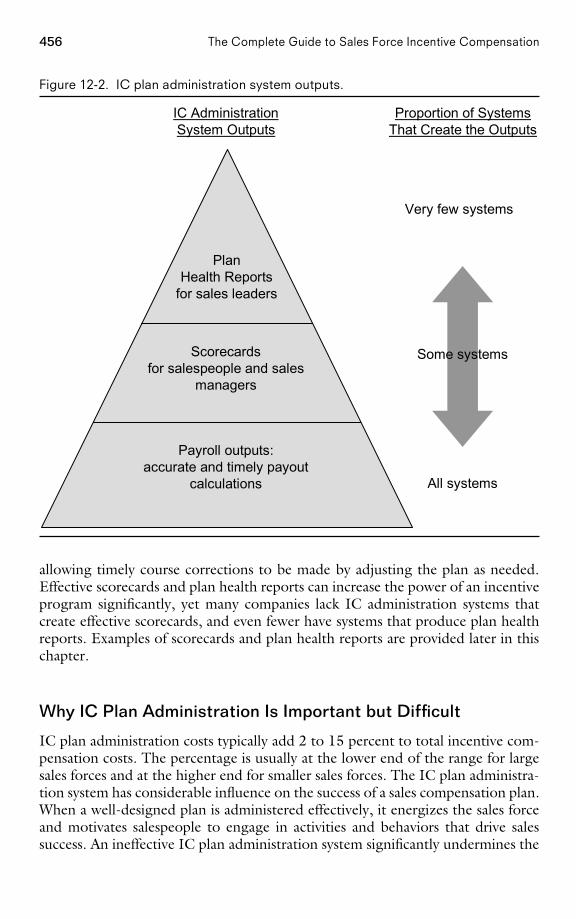
456 The Complete Guide to Sales Force Incentive Compensation
Figure 12-2. IC plan administration system outputs.
Payroll outputs:accurate and timely payout
calculations
PlanHealth Reports
for sales leaders
Scorecardsfor salespeople and sales
managers
IC AdministrationSystem Outputs
Proportion of SystemsThat Create the Outputs
All systems
Very few systems
Some systems
allowing timely course corrections to be made by adjusting the plan as needed.Effective scorecards and plan health reports can increase the power of an incentiveprogram significantly, yet many companies lack IC administration systems thatcreate effective scorecards, and even fewer have systems that produce plan healthreports. Examples of scorecards and plan health reports are provided later in thischapter.
Why IC Plan Administration Is Important but Difficult
IC plan administration costs typically add 2 to 15 percent to total incentive com-pensation costs. The percentage is usually at the lower end of the range for largesales forces and at the higher end for smaller sales forces. The IC plan administra-tion system has considerable influence on the success of a sales compensation plan.When a well-designed plan is administered effectively, it energizes the sales forceand motivates salespeople to engage in activities and behaviors that drive salessuccess. An ineffective IC plan administration system significantly undermines the
PAGE 456................. 15869$ CH12 05-19-06 09:24:50 PS
457Incentive Compensation Plan Administration
incentive plan’s power as a sales effectiveness driver. Since incentive money ishighly visible and personal for sales forces, errors in sales crediting or payment arediscovered quickly. As one vice president of sales put it, ‘‘The calculations aresimultaneously under 3,500 microscopes.’’ A sales force will quickly become frus-trated with an IC plan administration system that routinely produces inaccurateor late payments. As sales force distrust of the system grows, sales force motivationdeclines, and salespeople spend more and more time on ‘‘shadow accounting’’(chasing invoices, verifying pay calculations, and lobbying management for payoutcorrections) rather than spending time with customers.
Unfortunately, IC plan administration can be highly complex and error-prone. Complexity increases with sales force size, diversity of sales roles, the useof multiple performance metrics, the number of data sources, and the intricacy ofbusiness rules for eligibility and exception handling. In addition, sales leaders areacutely aware of the motivational power of incentives, and therefore they tend towant to adapt and make course corrections as new information emerges or asthe business situation changes, even within a single incentive cycle. Midstreamadjustments, such as changes in sales crediting, territory alignment, or plan eligi-bility, introduce new opportunities to make errors. This makes IC plan adminis-tration particularly challenging for companies in complex situations that wantboth accuracy and flexibility in their systems. It has been our experience thatmanagers of complex IC plan administration systems that also demand consider-able flexibility can expect small errors to occur frequently and big errors to occuras much as 10 to 20 percent of the time.
How to Handle an Incentive Overpayment?
A company made a change to one of the business rules in its incentive plan,but unfortunately that change was not implemented correctly in the planadministration system. As a result, five thousand people received overpay-ments of incentives totaling almost $5 million. The company was faced witha dilemma: Do we require employees to pay back the money that theyreceived but did not earn, or do we let them keep it in order to avoid salesforce dissonance? Incentive overpayments, including both those that arenever discovered and those that are caught but not corrected, can addsignificantly to incentive plan costs.
Complexity and Frequent Change
‘‘Fairness’’ is a primary guiding principle of one firm’s sales incentive plan.As a result, the firm’s sales leaders make many incentive plan decisionsbased on equity for the sales force, even when these decisions introduceconsiderable complexity into the IC plan administration system. For exam-ple, at a national district sales managers’ meeting, the vice president ofsales announced a sales force hiring freeze for the last quarter of the year.Several district managers who had current territory vacancies strongly ob-
PAGE 457................. 15869$ CH12 05-19-06 09:24:50 PS
458 The Complete Guide to Sales Force Incentive Compensation
jected, stating that this was unfair because a substantial portion of theirbonus was tied to total district performance. The vice president agreed,and promised that districts with territory vacancies would have their goaladjusted so that managers would not be held accountable for fourth-quarter performance in vacant territories. This change appeared simple tothe vice president, but it turned out to be an administrative nightmare.The change was impossible within the architecture of the current IC planadministration system. A completely new and separate computer programhad to be written just to handle this special situation.
Authors’ note: Tracking and accounting for exception conditions inorder to be fair to everyone is usually costly; it not only takes time and re-sources but also introduces considerable possibility for error. Sometimes,it is best to just acknowledge that the system cannot be completely fairand that inequities will even out across the sales force over time; this ac-ceptance can cut plan administration costs considerably. It is often advis-able to make desired managerial adjustments outside the formal ICadministration systems rather than burdening the systems with nuancesthat threaten accuracy and timeliness.
Is the Incentive Compensation Plan Administered Well?
Sales Force Grows Beyond an IC Plan Administration System’sCapabilities
Over the last three years, the sales force has grown from 50 to 150 sales-people. There are now two full-time people doing IC plan administration,handling 150 separate spreadsheets. Every month, they allocate the sales,update the eligibility, adjust for new hires and departures, deal with trans-fers and promotions, and produce the reports for each salesperson andmanager. This is not working very well, as it is very expensive and thereare many mistakes. The IC plan administration team is looking to move toa more systematic and stable solution.
IC Plan Administration System Can’t Deal with an ExpandingProduct Line
The software for a company’s IC plan administration system was developed12 years ago. At that time, the company had a narrow and relatively stableproduct line, and hence the products and product weights for the incentiveplan were hard-coded into the system. As the company’s product line hasgrown through a combination of new product development and acquisition,
PAGE 458................. 15869$ CH12 05-19-06 09:24:51 PS
459Incentive Compensation Plan Administration
sales leaders need to change products and product weights within the in-centive plan to align with continuously evolving company strategies. Thecurrent IC plan administration system has to be reprogrammed every timea change is made. A recent and relatively minor adjustment in product prio-ritization and weights required 73 different computer code changes. Thechanges introduced several errors into the system and delayed incentivepayments. This angered and frustrated the sales force.
IC Plan Administration Can’t Handle All the Sales Contestsand SPIFFs
To spark sales, a sportswear manufacturer gave product managers budgetsto spend on sales force contests and SPIFFs. As a result, the product man-agers are fiercely competing for the sales force’s time by trying to outdoone another with more creative and extravagant programs. Last week, aone-month sales contest on ladies’ running shoes was launched. This week,a SPIFF on certain high-margin soccer apparel items went into effect. Onaverage, a new SPIFF or sales contest is launched every two weeks. Thesales administration group is going crazy. Its automated system is not builtto handle a large number of ad hoc programs efficiently. Each program isbeing tracked separately on a spreadsheet, but the process involves manymanual steps and is highly error-prone. Some temporary people have beenhired to help compute payouts for all of these incentives, but there is con-siderable concern that adequate quality control procedures cannot bemaintained much longer.
Characteristics of Well-Administered IncentiveCompensation Systems
An effective IC plan administration system:
• Produces results that are accurate and timely.
• Provides insights to the sales force and to sales leaders about ways to im-prove.
• Maintains an appropriate balance between flexibility and cost effective-ness.
An effective IC plan administration system produces consistently accurate re-sults. Incentive payment errors frustrate salespeople, damage management’s credi-bility, and contribute to sales force turnover. If salespeople distrust the system,they spend their time on ‘‘shadow accounting’’ rather than on high-value-addedselling activities. One firm estimated that shadow accounting costs were approxi-
PAGE 459................. 15869$ CH12 05-19-06 09:24:51 PS
460 The Complete Guide to Sales Force Incentive Compensation
mately $1,500 per salesperson per year. Timeliness of results is also very impor-tant. If reports are late, the value of prompt feedback is lost, and the motivationalimpact of the incentive plan is diminished. Late payments cause the sales force toget upset, and morale suffers. Error-prone administration systems are frustratingand demotivating for IC administrators, who have to respond to the field’s oftenangry inquiries. A poor system can lead to high turnover among IC administra-tors.
An effective IC plan administration system provides insights to the sales forceand to sales leaders. If salespeople receive accurate and timely feedback on theirperformance, they will be motivated to continue what they are doing and workhard to reach a goal, or they will discover how to make suitable adjustments inorder to improve their performance. If sales managers receive appropriate feed-back on how their people are doing, they can coach them effectively to help themimprove their performance. If sales leaders receive accurate and timely feedbackon how the incentive plan is working, they can make needed changes quickly andkeep the organization on track to achieve important goals.
Finally, an effective IC plan administration system maintains an appropriatebalance between flexibility and cost. An inflexible system may be very cost-efficient, but if the system is unable to adapt effectively to business changes, thenthe incentive plan, and consequently sales force activity, soon becomes discon-nected from company needs and strategies. On the other hand, with a system thatallows unlimited changes, costs can quickly get out of control, and accuracy andtimeliness are compromised. Firms often maintain a balance between cost andflexibility by having documented guidelines for how to execute plan changes,including who is responsible for such changes and how often changes can occur.
Symptoms of Poorly Administered Incentive CompensationSystems: A 3 Cs Framework
An effective incentive compensation administration system operates harmoniouslywith the 3 Cs framework introduced in Chapter 1. The system:
• Is consistent with sales and marketing strategies, sales processes, and salesroles.
• Is compatible with other sales force effectiveness drivers, such as perform-ance management systems, culture, sales force motivators, and hiring anddevelopment processes.
• Acknowledges the consequences for company and customer results, salesforce activities, and sales force quality.
There can be many signs that the sales incentive compensation plan adminis-tration system is not working well. Figure 12-3 lists some common symptoms ofproblems.
PAGE 460................. 15869$ CH12 05-19-06 09:24:51 PS
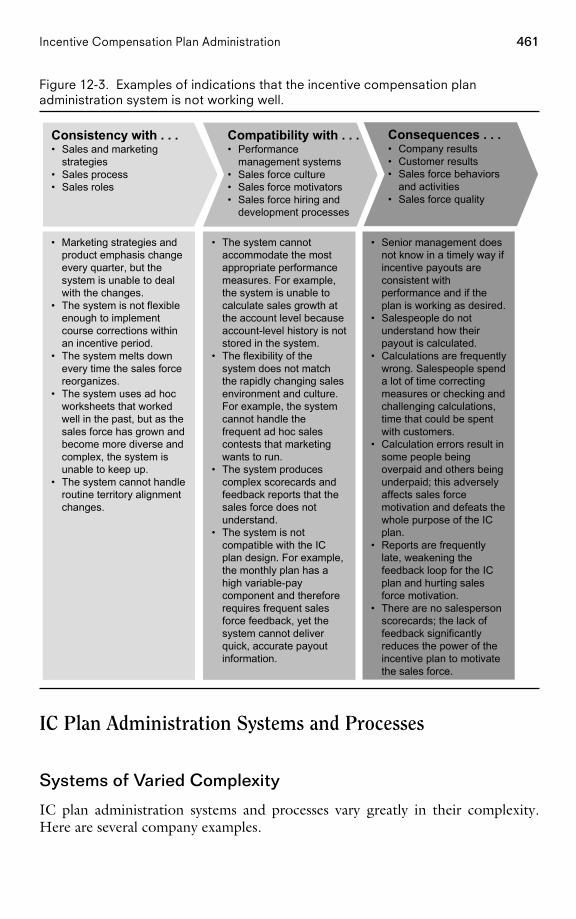
461Incentive Compensation Plan Administration
Figure 12-3. Examples of indications that the incentive compensation planadministration system is not working well.
• Marketing strategies andproduct emphasis changeevery quarter, but thesystem is unable to dealwith the changes.
• The system is not flexibleenough to implementcourse corrections withinan incentive period.
• The system melts downevery time the sales forcereorganizes.
• The system uses ad hocworksheets that workedwell in the past, but as thesales force has grown andbecome more diverse andcomplex, the system isunable to keep up.
• The system cannot handleroutine territory alignmentchanges.
• The system cannotaccommodate the mostappropriate performancemeasures. For example,the system is unable tocalculate sales growth atthe account level becauseaccount-level history is notstored in the system.
• The flexibility of thesystem does not matchthe rapidly changing salesenvironment and culture.For example, the systemcannot handle thefrequent ad hoc salescontests that marketingwants to run.
• The system producescomplex scorecards andfeedback reports that thesales force does notunderstand.
• The system is notcompatible with the ICplan design. For example,the monthly plan has ahigh variable-paycomponent and thereforerequires frequent salesforce feedback, yet thesystem cannot deliverquick, accurate payoutinformation.
• Senior management doesnot know in a timely way ifincentive payouts areconsistent withperformance and if theplan is working as desired.
• Salespeople do notunderstand how theirpayout is calculated.
• Calculations are frequentlywrong. Salespeople spenda lot of time correctingmeasures or checking andchallenging calculations,time that could be spentwith customers.
• Calculation errors result insome people beingoverpaid and others beingunderpaid; this adverselyaffects sales forcemotivation and defeats thewhole purpose of the ICplan.
• Reports are frequentlylate, weakening thefeedback loop for the ICplan and hurting salesforce motivation.
• There are no salespersonscorecards; the lack offeedback significantlyreduces the power of theincentive plan to motivatethe sales force.
Compatibility with . . .• Performance
management systems• Sales force culture• Sales force motivators• Sales force hiring and
development processes
Consequences . . .• Company results• Customer results• Sales force behaviors
and activities• Sales force quality
Consistency with . . .• Sales and marketing
strategies• Sales process• Sales roles
IC Plan Administration Systems and Processes
Systems of Varied Complexity
IC plan administration systems and processes vary greatly in their complexity.Here are several company examples.
PAGE 461................. 15869$ CH12 05-19-06 09:24:52 PS
462 The Complete Guide to Sales Force Incentive Compensation
A Simple System. A firm is getting ready to launch its first product and plans topay the sales force incentives based on sales growth. No money has been budgetedfor incentive plan administration, so management wants a system that can bedeveloped quickly and cheaply and that will ‘‘get us through the first year withoutany errors.’’ The firm hires a sales analyst, who spends three months developing aspreadsheet-based tool that can accommodate the firm’s territory sales and eligi-bility data, calculate quarterly incentive payouts, and create monthly sales reportsfor the firm’s 80 salespeople and sales managers. The analyst spends approximatelyone week per month maintaining the data in the system, handling a small numberof adjustments, generating the necessary outputs, and e-mailing the informationto the sales force. The analyst’s work involves following a series of detailed steps.Meticulousness is critically important to ensure that no errors are made. The com-pany expects to expand the sales force and launch a second product next year, andsince this will complicate the incentive plan considerably, management is con-cerned that a more robust IC plan administration system may be needed to ensurecontinued high-quality output.
A Moderately Complex System. A sales force has 1,200 salespeople, organized intofour different selling teams. The incentive plans are quite similar across the fourteams, and all are goal-based. There are a few special situations: A small numberof salespeople are paid incentives on MBO achievement, and a few products havespecial kicker bonuses. The firm has been managing its incentive plan in-house,but as the number of salespeople and plan complexity have grown, the in-housesystem has become overly cumbersome with the addition of new steps that applytemporary fixes to work around inherent system deficiencies. Thus, the firm’senterprise technology (ET) group has enlisted the help of a consulting firm toadminister the incentive compensation program. Every month, the ET groupprocesses the sales and account assignment data. The consulting firm manages theeligibility data, determines payouts, and creates monthly sales reports for the fieldforce. A suite of tools developed by the consulting firm is used to manage theprocess and ensure that no errors are made. The process takes approximately twoweeks to complete. The IC plan administration team consists of two employeesplus two full-time people at the consulting firm. The firm spends about $1 milliona year, or about 5 percent of sales incentive costs, to administer the sales forceincentive program.
A Highly Complex System. A sales force has 3,500 salespeople organized into 15different selling teams. The teams are divided into four regional business units,each with different customers, data, and incentive plans. Some of the plans aregoal-based, some are ranking-based, others are commission-based, and still othersare tied to MBO achievement. The firm’s IT group worked with a sales incentivecompensation management software provider to develop the systems required tohandle all of the firm’s diverse needs. Every month, the system processes millionsof data records, and, on average, hundreds of adjustments are required. The ICplan administration team consists of eleven employees plus two full-time outside
PAGE 462................. 15869$ CH12 05-19-06 09:24:53 PS
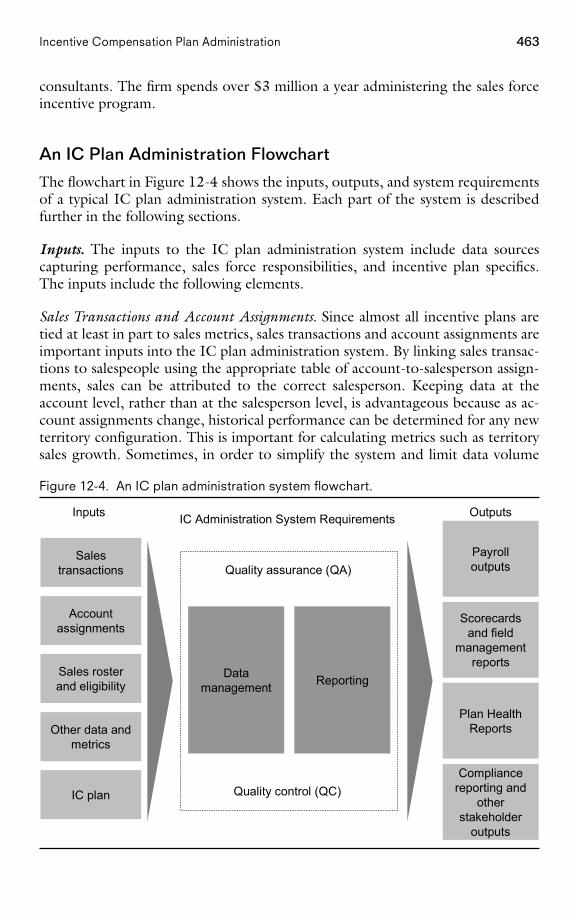
463Incentive Compensation Plan Administration
consultants. The firm spends over $3 million a year administering the sales forceincentive program.
An IC Plan Administration Flowchart
The flowchart in Figure 12-4 shows the inputs, outputs, and system requirementsof a typical IC plan administration system. Each part of the system is describedfurther in the following sections.
Inputs. The inputs to the IC plan administration system include data sourcescapturing performance, sales force responsibilities, and incentive plan specifics.The inputs include the following elements.
Sales Transactions and Account Assignments. Since almost all incentive plans aretied at least in part to sales metrics, sales transactions and account assignments areimportant inputs into the IC plan administration system. By linking sales transac-tions to salespeople using the appropriate table of account-to-salesperson assign-ments, sales can be attributed to the correct salesperson. Keeping data at theaccount level, rather than at the salesperson level, is advantageous because as ac-count assignments change, historical performance can be determined for any newterritory configuration. This is important for calculating metrics such as territorysales growth. Sometimes, in order to simplify the system and limit data volume
Figure 12-4. An IC plan administration system flowchart.
IC Administration System RequirementsInputs Outputs
Datamanagement Reporting
Quality control (QC)
Quality assurance (QA)Payrolloutputs
Scorecardsand field
managementreports
Plan HealthReports
Compliancereporting and
otherstakeholder
outputs
Salestransactions
Accountassignments
Sales rosterand eligibility
Other data andmetrics
IC plan
PAGE 463................. 15869$ CH12 05-19-06 09:24:54 PS
464 The Complete Guide to Sales Force Incentive Compensation
and complexity, companies use worksheet-based systems and keep sales historysummarized to the salesperson level rather than at the account or transaction level.This helps to minimize system complexity; however, if the company needs toimplement plan features that require account-level sales or historical sales for anew territory configuration, one has to go back to the original source of the salesdata.
A common incentive plan administration mistake is using the wrong table ofaccount assignments when processing the data. Checks and balances should beestablished to ensure that the appropriate alignment is used so that salespeopleget credit for the correct sales.
Sales Roster and Eligibility. The sales roster and eligibility information keeps trackof who is eligible for different plan elements. For example, participation in a quar-terly bonus program may require that a salesperson have worked the entire quarterin a particular territory. Eligibility for a recognition program may require that asalesperson has worked in a territory for the entire year. Companies usually havespecial rules for dealing with midplan changes in employment (for example, newhires, terminations, deaths, or retirements) and midplan changes in job responsi-bilities (for example, transfers or promotions, temporary assignments, leaves ofabsence, sickness or disability, or sales territory changes). A salesperson whoswitches jobs within the firm midplan might be treated differently for incentivepurposes from one who leaves to work for another company midplan. Eligibilityissues can be quite complex and are a frequent cause of plan administration errors.A well-defined process can assure quality by using verification steps to minimizeproblems.
Other Data and Metrics. The other data and metrics required as inputs to the ICplan administration system depend on the incentive plan design. Territory- oraccount-level goals are needed if the plan is goal-based. Relevant performancemetrics such as market share, customer satisfaction scores, or activity data areneeded if the plan is tied to these metrics.
IC Plan. The specific plan design parameters need to be input into the system.This includes payout curve data such as commission rates, bonus amounts, thresh-olds for accelerators or decelerators, appropriate groupings of product or cus-tomer types for incentive purposes, and eligibility, as well as other business rulesthat determine payouts. The best IC plan administration systems use tables orparameter files that are external to the software to keep track of the various payoutcurves, groupings, and business rules. If such data are hard-coded into the soft-ware, the system becomes highly inflexible and difficult to change.
Outputs. The outputs of the IC plan administration system include payroll out-puts, scorecards and reports for salespeople and sales managers, and plan healthreports for sales leaders.
PAGE 464................. 15869$ CH12 05-19-06 09:24:55 PS
465Incentive Compensation Plan Administration
Payroll Outputs. The most basic, and frequently the only, focus of IC plan admin-istration systems is to produce the information necessary to pay salespeople theirincentive earnings. Needless to say, these outputs will be subject to intense salesforce scrutiny.
Could There Be Errors in the Three Thousand E-Mailed ReportsEach Month?
‘‘One of the scariest things I do is to hit the ‘send’ key that triggers overthree thousand e-mails sending customized reports to the entire salesforce with performance and earning summaries. You wait with apprehen-sion for hundreds of e-mails back the next morning, and what a relief it iswhen most of the 20 or 30 e-mails back are seeking clarification and notpointing out errors. A spelling error in three thousand e-mails is embar-rassing; a calculation error is disastrous.’’
Stephen Redden, Manager, ZS Associates
Scorecards and Field Management Reports. Scorecards are the regular reports pro-vided to salespeople tracking their performance and payouts. In addition to track-ing historical performance, the most effective scorecards focus attention on howthe salesperson can enhance her performance and what the positive consequencesof a performance increase are likely to be. Scorecards share critical informationthat can motivate salespeople to improve. They can provide direction to sales-people on how they can best spend their time. On effective scorecards, informa-tion is presented clearly, so that sales force understanding of performance isenhanced. Figure 12-5 summarizes some key characteristics of effective score-cards.
Figures 12-6 through 12-9 show specific examples of scorecard features thatenhance understanding, clarity, direction, and motivation.
In addition to scorecards for individual salespeople, field management reportsprovide region and district sales managers with valuable information for coachingtheir salespeople to improve their performance. Figure 12-10 provides an exampleof a field management report generated by an IC plan administration system.
Plan Health Reports. The focus of plan health reports is to provide sales leadersand incentive plan designers with timely information for assessing whether theplan is doing what it was designed to do, and at the same time not producingundesirable side effects such as unfair payouts. Many of the analyses described inChapter 2 for assessing a current incentive compensation plan can be createdroutinely as outputs of the IC plan administration system. For example, the ICplan administration system has all the information necessary to create the analysisshown in Figure 12-11. The graph depicts the incentive plan structure and thedistribution of goal attainment across the sales force based on performance todate. The table shows some summary statistics (projected for the year based on
PAGE 465................. 15869$ CH12 05-19-06 09:24:55 PS
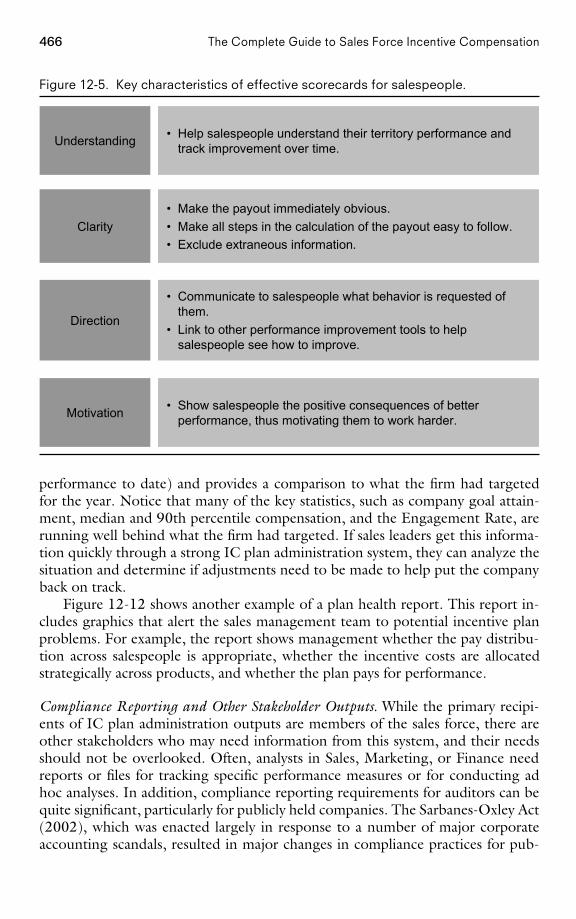
466 The Complete Guide to Sales Force Incentive Compensation
Figure 12-5. Key characteristics of effective scorecards for salespeople.
• Make the payout immediately obvious.• Make all steps in the calculation of the payout easy to follow.• Exclude extraneous information.
• Communicate to salespeople what behavior is requested ofthem.
• Link to other performance improvement tools to helpsalespeople see how to improve.
• Show salespeople the positive consequences of betterperformance, thus motivating them to work harder.
• Help salespeople understand their territory performance andtrack improvement over time.
Clarity
Direction
Motivation
Understanding
performance to date) and provides a comparison to what the firm had targetedfor the year. Notice that many of the key statistics, such as company goal attain-ment, median and 90th percentile compensation, and the Engagement Rate, arerunning well behind what the firm had targeted. If sales leaders get this informa-tion quickly through a strong IC plan administration system, they can analyze thesituation and determine if adjustments need to be made to help put the companyback on track.
Figure 12-12 shows another example of a plan health report. This report in-cludes graphics that alert the sales management team to potential incentive planproblems. For example, the report shows management whether the pay distribu-tion across salespeople is appropriate, whether the incentive costs are allocatedstrategically across products, and whether the plan pays for performance.
Compliance Reporting and Other Stakeholder Outputs. While the primary recipi-ents of IC plan administration outputs are members of the sales force, there areother stakeholders who may need information from this system, and their needsshould not be overlooked. Often, analysts in Sales, Marketing, or Finance needreports or files for tracking specific performance measures or for conducting adhoc analyses. In addition, compliance reporting requirements for auditors can bequite significant, particularly for publicly held companies. The Sarbanes-Oxley Act(2002), which was enacted largely in response to a number of major corporateaccounting scandals, resulted in major changes in compliance practices for pub-
PAGE 466................. 15869$ CH12 05-19-06 09:24:56 PS
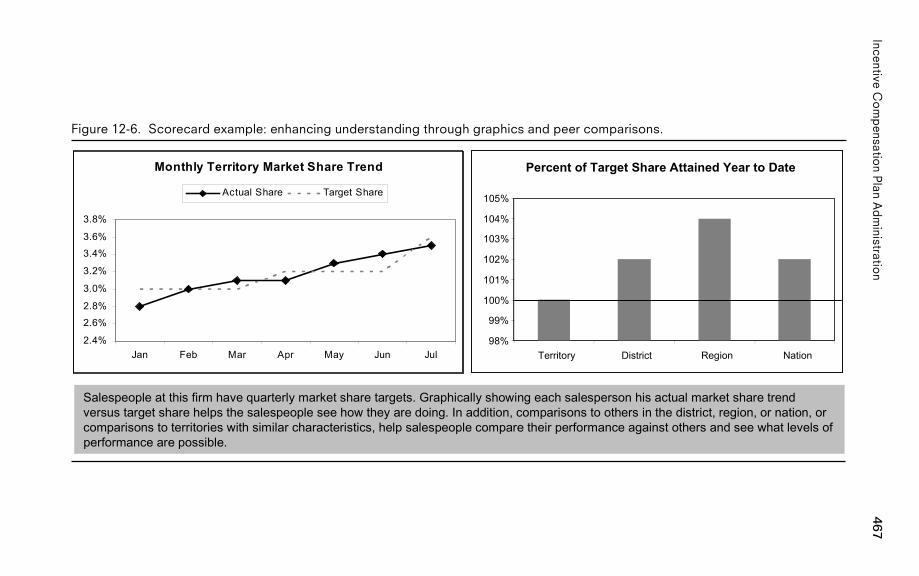
467Incentive
Co
mp
ensation
Plan
Ad
ministratio
n
Figure 12-6. Scorecard example: enhancing understanding through graphics and peer comparisons.
Salespeople at this firm have quarterly market share targets. Graphically showing each salesperson his actual market share trendversus target share helps the salespeople see how they are doing. In addition, comparisons to others in the district, region, or nation, orcomparisons to territories with similar characteristics, help salespeople compare their performance against others and see what levels ofperformance are possible.
Monthly Territory Market Share Trend
2.4%
2.6%
2.8%
3.0%
3.2%
3.4%
3.6%
3.8%
Jan Feb Mar Apr May Jun Jul
Actual Share Target Share
Percent of Target Share Attained Year to Date
98%
99%
100%
101%
102%
103%
104%
105%
Territory District Region Nation
PA
GE
467.................15869$
CH
1205-19-06
09:24:58P
S
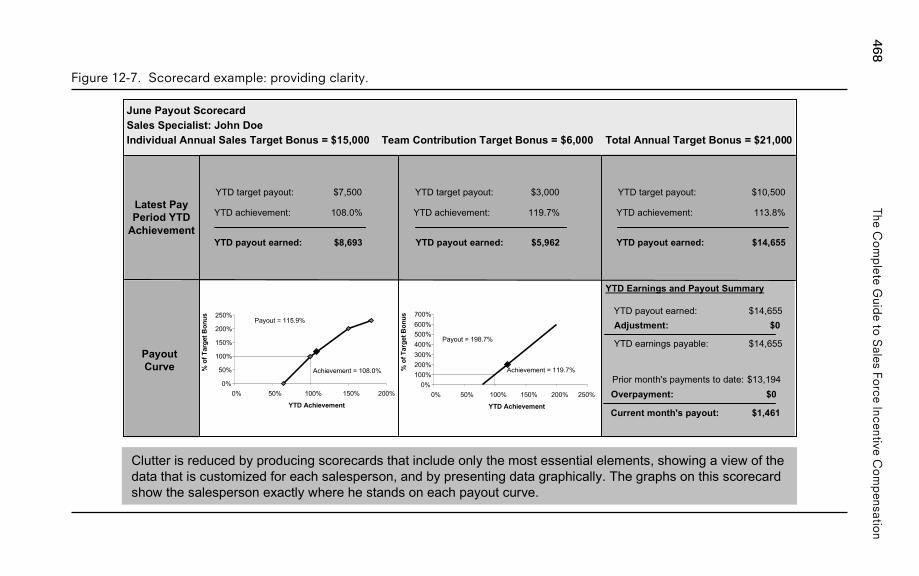
468The
Co
mp
leteG
uide
toS
alesFo
rceIncentive
Co
mp
ensation
Figure 12-7. Scorecard example: providing clarity.
June Payout ScorecardSales Specialist: John DoeIndividual Annual Sales Target Bonus = $15,000 Team Contribution Target Bonus = $6,000 Total Annual Target Bonus = $21,000
YTD Earnings and Payout Summary
PayoutCurve
0%
50%
100%
150%
200%
250%
0% 50% 100% 150% 200%
YTD Achievement
% o
f Tar
get B
onus
Achievement = 108.0%
Payout = 115.9%
0%100%200%300%400%500%600%700%
0% 50% 100% 150% 200% 250%
YTD Achievement%
of T
arge
t Bon
us
Payout = 198.7%
Achievement = 119.7%
Clutter is reduced by producing scorecards that include only the most essential elements, showing a view of thedata that is customized for each salesperson, and by presenting data graphically. The graphs on this scorecardshow the salesperson exactly where he stands on each payout curve.
Latest PayPeriod YTD
Achievement
YTD payout earned: $14,655Adjustment: $0
YTD earnings payable: $14,655
Prior month's payments to date: $13,194Overpayment: $0
Current month's payout: $1,461
YTD target payout: $7,500 YTD target payout: $3,000 YTD target payout: $10,500
YTD achievement: 108.0% YTD achievement: 119.7% YTD achievement: 113.8%
YTD payout earned: $8,693 YTD payout earned: $5,962 YTD payout earned: $14,655
PA
GE
468.................15869$
CH
1205-19-06
09:24:59P
S
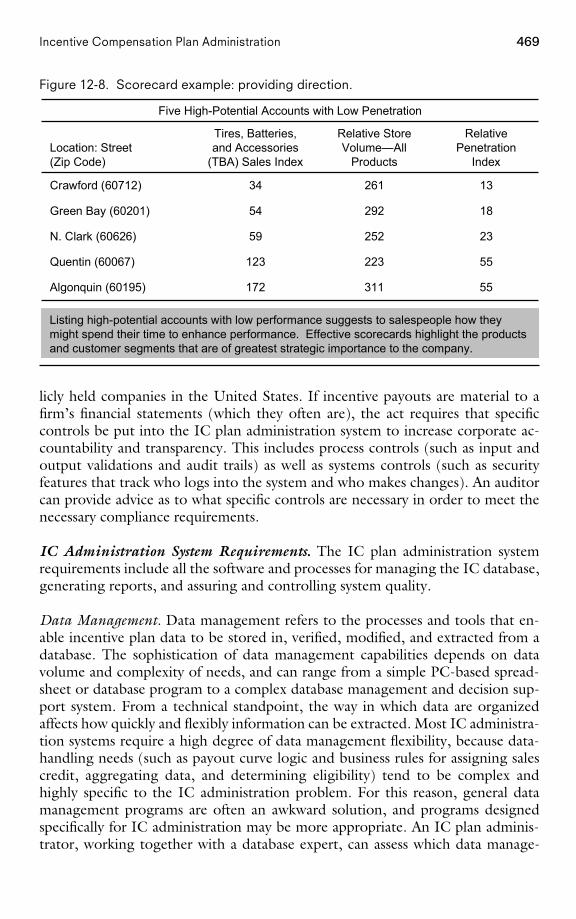
469Incentive Compensation Plan Administration
Figure 12-8. Scorecard example: providing direction.
Five High-Potential Accounts with Low Penetration
55311172Algonquin (60195)
55223123Quentin (60067)
2325259N. Clark (60626)
1829254Green Bay (60201)
1326134Crawford (60712)
RelativePenetration
Index
Relative StoreVolume—All
Products
Tires, Batteries,and Accessories
(TBA) Sales IndexLocation: Street(Zip Code)
Listing high-potential accounts with low performance suggests to salespeople how theymight spend their time to enhance performance. Effective scorecards highlight the productsand customer segments that are of greatest strategic importance to the company.
licly held companies in the United States. If incentive payouts are material to afirm’s financial statements (which they often are), the act requires that specificcontrols be put into the IC plan administration system to increase corporate ac-countability and transparency. This includes process controls (such as input andoutput validations and audit trails) as well as systems controls (such as securityfeatures that track who logs into the system and who makes changes). An auditorcan provide advice as to what specific controls are necessary in order to meet thenecessary compliance requirements.
IC Administration System Requirements. The IC plan administration systemrequirements include all the software and processes for managing the IC database,generating reports, and assuring and controlling system quality.
Data Management. Data management refers to the processes and tools that en-able incentive plan data to be stored in, verified, modified, and extracted from adatabase. The sophistication of data management capabilities depends on datavolume and complexity of needs, and can range from a simple PC-based spread-sheet or database program to a complex database management and decision sup-port system. From a technical standpoint, the way in which data are organizedaffects how quickly and flexibly information can be extracted. Most IC administra-tion systems require a high degree of data management flexibility, because data-handling needs (such as payout curve logic and business rules for assigning salescredit, aggregating data, and determining eligibility) tend to be complex andhighly specific to the IC administration problem. For this reason, general datamanagement programs are often an awkward solution, and programs designedspecifically for IC administration may be more appropriate. An IC plan adminis-trator, working together with a database expert, can assess which data manage-
PAGE 469................. 15869$ CH12 05-19-06 09:25:00 PS
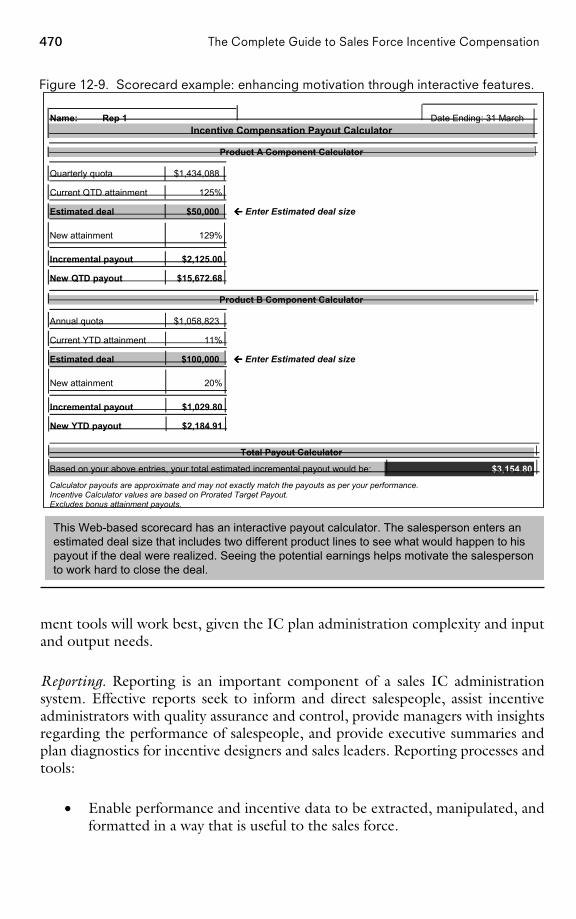
470 The Complete Guide to Sales Force Incentive Compensation
Figure 12-9. Scorecard example: enhancing motivation through interactive features.
���� Enter Estimated deal size
Product B Component Calculator
Incremental payout
Annual quota $1,058,823
Current YTD attainment
Estimated deal $100,000
11%
New QTD payout $15,672.68
New attainment 129%
$2,125.00
125%
$50,000
Incentive Compensation Payout Calculator
Product A Component Calculator
Estimated deal
Quarterly quota
���� Enter Estimated deal size
$1,434,088
Current QTD attainment
Incremental payout $1,029.80
New attainment 20%
Name:
New YTD payout $2,184.91
Excludes bonus attainment payouts.
Based on your above entries, your total estimated incremental payout would be:
Incentive Calculator values are based on Prorated Target Payout.Calculator payouts are approximate and may not exactly match the payouts as per your performance.
$3,154.80
Total Payout Calculator
Rep 1 Date Ending: 31 March
This Web-based scorecard has an interactive payout calculator. The salesperson enters anestimated deal size that includes two different product lines to see what would happen to hispayout if the deal were realized. Seeing the potential earnings helps motivate the salespersonto work hard to close the deal.
ment tools will work best, given the IC plan administration complexity and inputand output needs.
Reporting. Reporting is an important component of a sales IC administrationsystem. Effective reports seek to inform and direct salespeople, assist incentiveadministrators with quality assurance and control, provide managers with insightsregarding the performance of salespeople, and provide executive summaries andplan diagnostics for incentive designers and sales leaders. Reporting processes andtools:
• Enable performance and incentive data to be extracted, manipulated, andformatted in a way that is useful to the sales force.
PAGE 470................. 15869$ CH12 05-19-06 09:25:01 PS
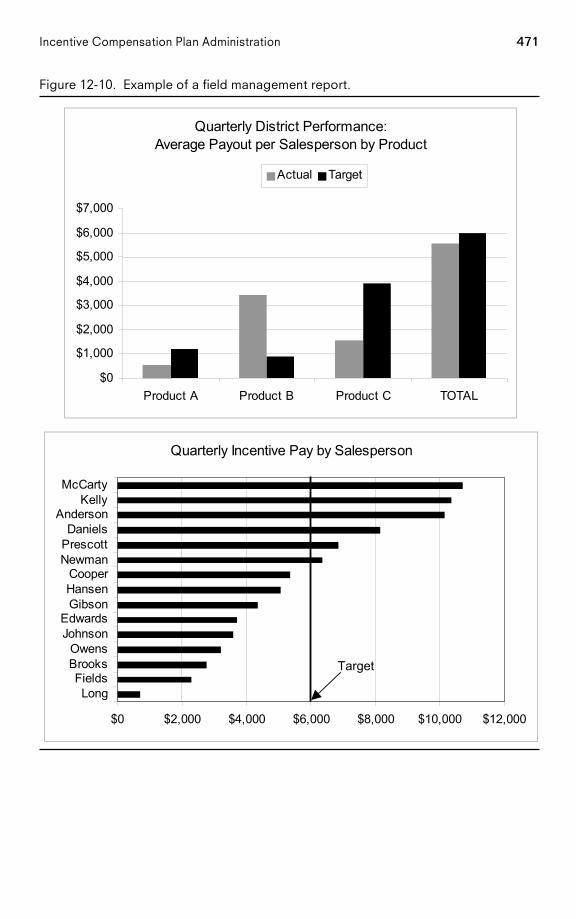
471Incentive Compensation Plan Administration
Figure 12-10. Example of a field management report.
Quarterly District Performance: Average Payout per Salesperson by Product
$0
$1,000
$2,000
$3,000
$4,000
$5,000
$6,000
$7,000
Product A Product B Product C TOTAL
Actual Target
Quarterly Incentive Pay by Salesperson
$0 $2,000 $4,000 $6,000 $8,000 $10,000 $12,000
LongFields
BrooksOwens
JohnsonEdwards
GibsonHansenCooper
NewmanPrescottDaniels
AndersonKelly
McCarty
Target
PAGE 471................. 15869$ CH12 05-19-06 09:25:03 PS
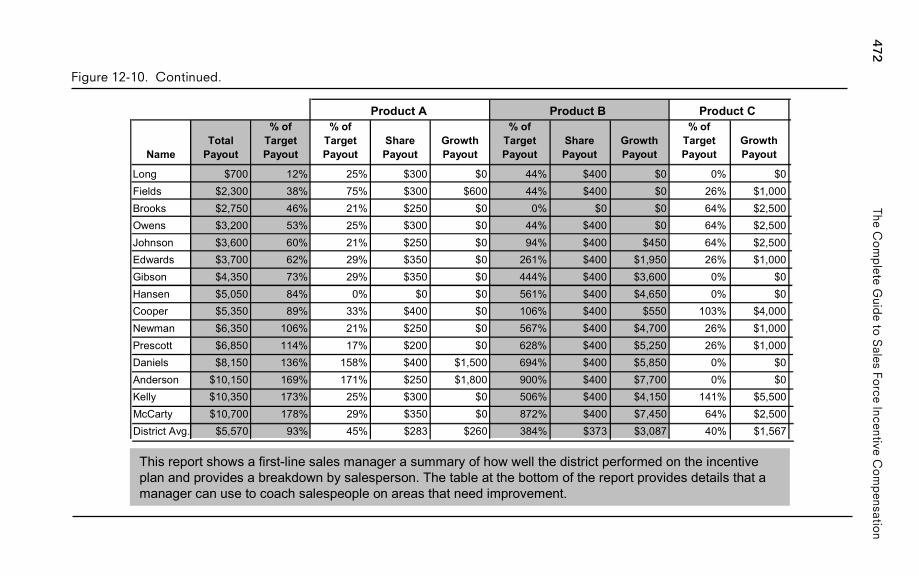
472The
Co
mp
leteG
uide
toS
alesFo
rceIncentive
Co
mp
ensation
Figure 12-10. Continued.
This report shows a first-line sales manager a summary of how well the district performed on the incentiveplan and provides a breakdown by salesperson. The table at the bottom of the report provides details that amanager can use to coach salespeople on areas that need improvement.
NameTotal
Payout
% of Target Payout
% of Target Payout
Share Payout
Growth Payout
% of Target Payout
Share Payout
Growth Payout
% of Target Payout
Growth Payout
Long $700 12% 25% $300 $0 44% $400 $0 0% $0Fields $2,300 38% 75% $300 $600 44% $400 $0 26% $1,000Brooks $2,750 46% 21% $250 $0 0% $0 $0 64% $2,500Owens $3,200 53% 25% $300 $0 44% $400 $0 64% $2,500Johnson $3,600 60% 21% $250 $0 94% $400 $450 64% $2,500Edwards $3,700 62% 29% $350 $0 261% $400 $1,950 26% $1,000Gibson $4,350 73% 29% $350 $0 444% $400 $3,600 0% $0Hansen $5,050 84% 0% $0 $0 561% $400 $4,650 0% $0Cooper $5,350 89% 33% $400 $0 106% $400 $550 103% $4,000Newman $6,350 106% 21% $250 $0 567% $400 $4,700 26% $1,000Prescott $6,850 114% 17% $200 $0 628% $400 $5,250 26% $1,000Daniels $8,150 136% 158% $400 $1,500 694% $400 $5,850 0% $0Anderson $10,150 169% 171% $250 $1,800 900% $400 $7,700 0% $0Kelly $10,350 173% 25% $300 $0 506% $400 $4,150 141% $5,500McCarty $10,700 178% 29% $350 $0 872% $400 $7,450 64% $2,500District Avg. $5,570 93% 45% $283 $260 384% $373 $3,087 40% $1,567
Product A Product B Product C
PA
GE
472.................15869$
CH
1205-19-06
09:25:04P
S
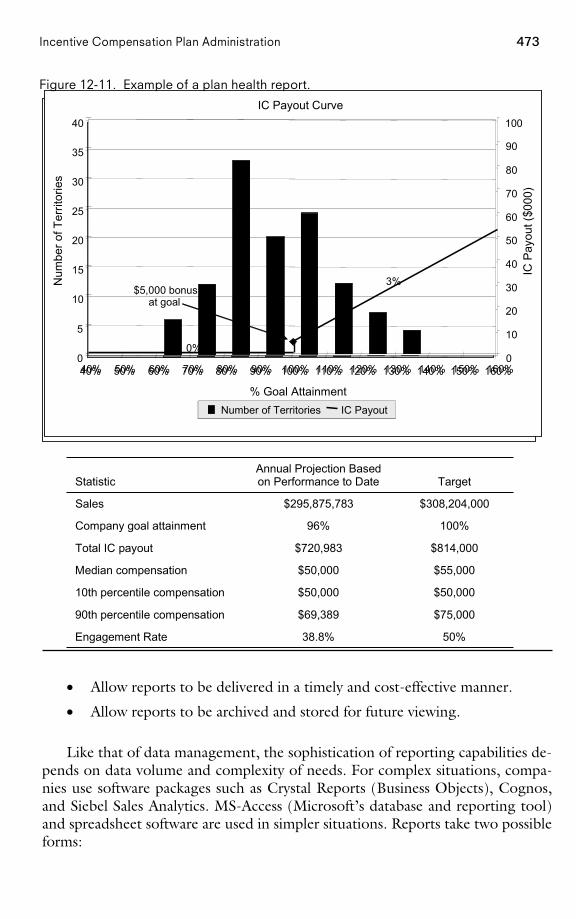
473Incentive Compensation Plan Administration
Figure 12-11. Example of a plan health report.
50%38.8%Engagement Rate
$75,000$69,38990th percentile compensation
$50,000$50,00010th percentile compensation
$55,000$50,000Median compensation
$814,000$720,983Total IC payout
100%96%Company goal attainment
$308,204,000$295,875,783Sales
TargetAnnual Projection Basedon Performance to DateStatistic
IC Payout Curve
0
5
10
15
20
25
30
35
40
40% 50% 60% 70% 80% 90% 100% 110% 120% 130% 140% 150% 160%
% Goal Attainment
Num
ber o
f Ter
ritor
ies
0
10
20
30
40
50
60
70
80
90
100
IC P
ayou
t ($0
00)
3%$5,000 Bonus
at Goal
0%
40% 50% 60% 70% 80% 90% 100% 110% 120% 130% 140% 150% 160%
3%$5,000 Bonus
at Goal
0%
Number of Territories IC PayoutNumber of Territories IC Payout
IC Payout Curve
0
5
10
15
20
25
30
35
40
40% 50% 60% 70% 80% 90% 100% 110% 120% 130% 140% 150% 160%
% Goal Attainment
Num
ber o
f Ter
ritor
ies
0
10
20
30
40
50
60
70
80
90
100
IC P
ayou
t ($0
00)
3%$5,000 Bonus
at Goal
0%
40% 50% 60% 70% 80% 90% 100% 110% 120% 130% 140% 150% 160%
3%$5,000 bonus
at goal
0%
Number of Territories IC PayoutNumber of Territories IC PayoutNumber of Territories IC PayoutNumber of Territories IC Payout
• Allow reports to be delivered in a timely and cost-effective manner.
• Allow reports to be archived and stored for future viewing.
Like that of data management, the sophistication of reporting capabilities de-pends on data volume and complexity of needs. For complex situations, compa-nies use software packages such as Crystal Reports (Business Objects), Cognos,and Siebel Sales Analytics. MS-Access (Microsoft’s database and reporting tool)and spreadsheet software are used in simpler situations. Reports take two possibleforms:
PAGE 473................. 15869$ CH12 05-19-06 09:25:06 PS
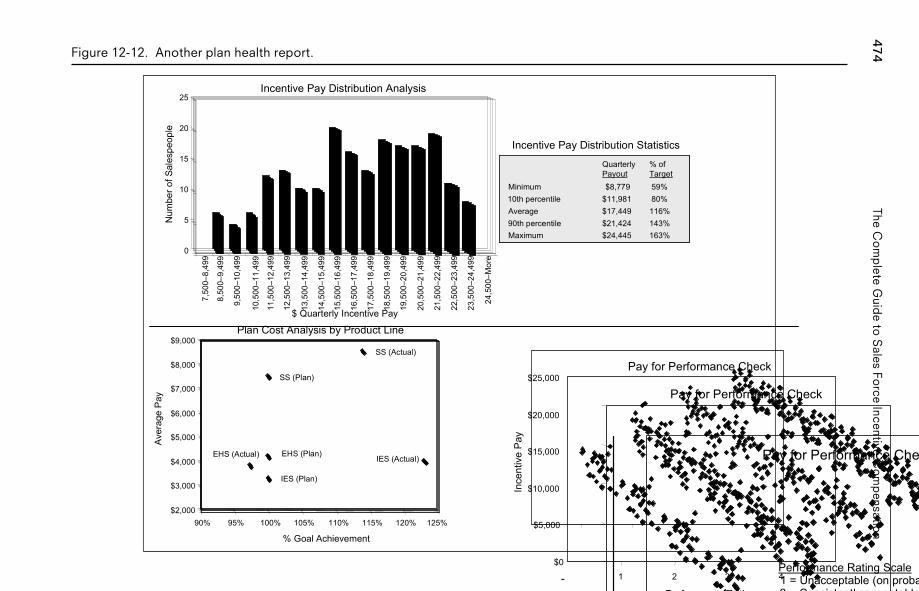
474The
Co
mp
leteG
uide
toS
alesFo
rceIncentive
Co
mp
ensation
Figure 12-12. Another plan health report.
IES (Actual)
SS (Actual)
EHS (Actual)
IES (Plan)
SS (Plan)
EHS (Plan)
$2,000
$3,000
$4,000
$5,000
$6,000
$7,000
$8,000
$9,000
90% 95% 100% 105% 110% 115% 120% 125%
% Goal Achievement
Ave
rage
Pay
Plan Cost Analysis by Product Line
Quarterly % ofPayout Target
Minimum $ 7,779 52%10th Percentile $10,981 73%Average $16,449 110%90th Percentile $21,424 143%Maximum $23,445 156%
Incentive Pay Distribution Statistics
Quarterly % ofPayout Target
Minimum $8,779 59%10th percentile $11,981 80%Average $17,449 116%90th percentile $21,424 143%Maximum $24,445 163%
0
5
10
15
20
25
Num
ber o
f Sal
espe
ople
$ Quarterly Incentive Pay
Incentive Pay Distribution Analysis
24,5
00–M
ore
7,50
0–8,
499
8,50
0–9,
499
9,50
0–10
,499
10,5
00–1
1,49
9
11,5
00–1
2,49
9
12,5
00–1
3,49
9
13,5
00–1
4,49
9
14,5
00–1
5,49
9
15,5
00–1
6,49
9
16,5
00–1
7,49
9
17,5
00–1
8,49
9
18,5
00–1
9,49
9
19,5
00–2
0,49
9
20,5
00–2
1,49
9
21,5
00–2
2,49
9
22,5
00–2
3,49
9
23,5
00–2
4,49
9
$0
$5,000
$10,000
$15,000
$20,000
$25,000
- 1 2 3 4
Performance Rating
Ince
ntiv
e P
ay
Pay for Performance Check
Pay for Performance Check
Performance Rating Scale1 = Unacceptable (on probation)2 = Consistently acceptable 3 = Consistently good 4 = Consistently outstanding
Pay for Performance Check
PA
GE
474.................15869$
CH
1205-19-06
09:25:08P
S
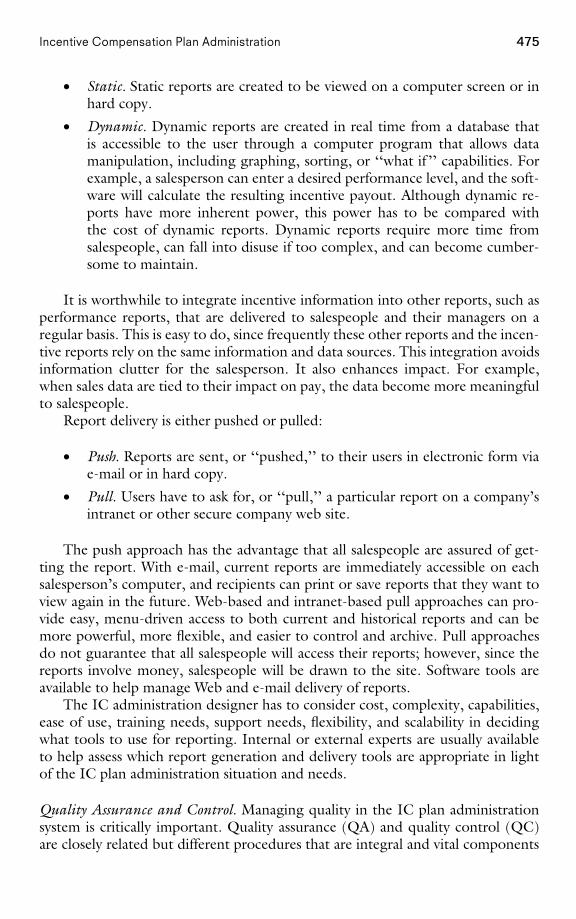
475Incentive Compensation Plan Administration
• Static. Static reports are created to be viewed on a computer screen or inhard copy.
• Dynamic. Dynamic reports are created in real time from a database thatis accessible to the user through a computer program that allows datamanipulation, including graphing, sorting, or ‘‘what if ’’ capabilities. Forexample, a salesperson can enter a desired performance level, and the soft-ware will calculate the resulting incentive payout. Although dynamic re-ports have more inherent power, this power has to be compared withthe cost of dynamic reports. Dynamic reports require more time fromsalespeople, can fall into disuse if too complex, and can become cumber-some to maintain.
It is worthwhile to integrate incentive information into other reports, such asperformance reports, that are delivered to salespeople and their managers on aregular basis. This is easy to do, since frequently these other reports and the incen-tive reports rely on the same information and data sources. This integration avoidsinformation clutter for the salesperson. It also enhances impact. For example,when sales data are tied to their impact on pay, the data become more meaningfulto salespeople.
Report delivery is either pushed or pulled:
• Push. Reports are sent, or ‘‘pushed,’’ to their users in electronic form viae-mail or in hard copy.
• Pull. Users have to ask for, or ‘‘pull,’’ a particular report on a company’sintranet or other secure company web site.
The push approach has the advantage that all salespeople are assured of get-ting the report. With e-mail, current reports are immediately accessible on eachsalesperson’s computer, and recipients can print or save reports that they want toview again in the future. Web-based and intranet-based pull approaches can pro-vide easy, menu-driven access to both current and historical reports and can bemore powerful, more flexible, and easier to control and archive. Pull approachesdo not guarantee that all salespeople will access their reports; however, since thereports involve money, salespeople will be drawn to the site. Software tools areavailable to help manage Web and e-mail delivery of reports.
The IC administration designer has to consider cost, complexity, capabilities,ease of use, training needs, support needs, flexibility, and scalability in decidingwhat tools to use for reporting. Internal or external experts are usually availableto help assess which report generation and delivery tools are appropriate in lightof the IC plan administration situation and needs.
Quality Assurance and Control. Managing quality in the IC plan administrationsystem is critically important. Quality assurance (QA) and quality control (QC)are closely related but different procedures that are integral and vital components
PAGE 475................. 15869$ CH12 05-19-06 09:25:09 PS
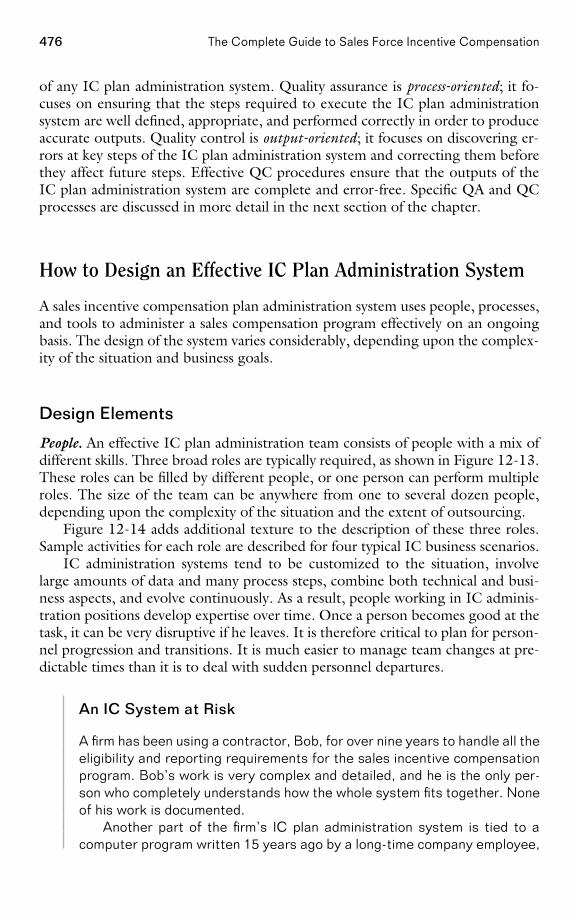
476 The Complete Guide to Sales Force Incentive Compensation
of any IC plan administration system. Quality assurance is process-oriented; it fo-cuses on ensuring that the steps required to execute the IC plan administrationsystem are well defined, appropriate, and performed correctly in order to produceaccurate outputs. Quality control is output-oriented; it focuses on discovering er-rors at key steps of the IC plan administration system and correcting them beforethey affect future steps. Effective QC procedures ensure that the outputs of theIC plan administration system are complete and error-free. Specific QA and QCprocesses are discussed in more detail in the next section of the chapter.
How to Design an Effective IC Plan Administration System
A sales incentive compensation plan administration system uses people, processes,and tools to administer a sales compensation program effectively on an ongoingbasis. The design of the system varies considerably, depending upon the complex-ity of the situation and business goals.
Design Elements
People. An effective IC plan administration team consists of people with a mix ofdifferent skills. Three broad roles are typically required, as shown in Figure 12-13.These roles can be filled by different people, or one person can perform multipleroles. The size of the team can be anywhere from one to several dozen people,depending upon the complexity of the situation and the extent of outsourcing.
Figure 12-14 adds additional texture to the description of these three roles.Sample activities for each role are described for four typical IC business scenarios.
IC administration systems tend to be customized to the situation, involvelarge amounts of data and many process steps, combine both technical and busi-ness aspects, and evolve continuously. As a result, people working in IC adminis-tration positions develop expertise over time. Once a person becomes good at thetask, it can be very disruptive if he leaves. It is therefore critical to plan for person-nel progression and transitions. It is much easier to manage team changes at pre-dictable times than it is to deal with sudden personnel departures.
An IC System at Risk
A firm has been using a contractor, Bob, for over nine years to handle all theeligibility and reporting requirements for the sales incentive compensationprogram. Bob’s work is very complex and detailed, and he is the only per-son who completely understands how the whole system fits together. Noneof his work is documented.
Another part of the firm’s IC plan administration system is tied to acomputer program written 15 years ago by a long-time company employee,
PAGE 476................. 15869$ CH12 05-19-06 09:25:10 PS
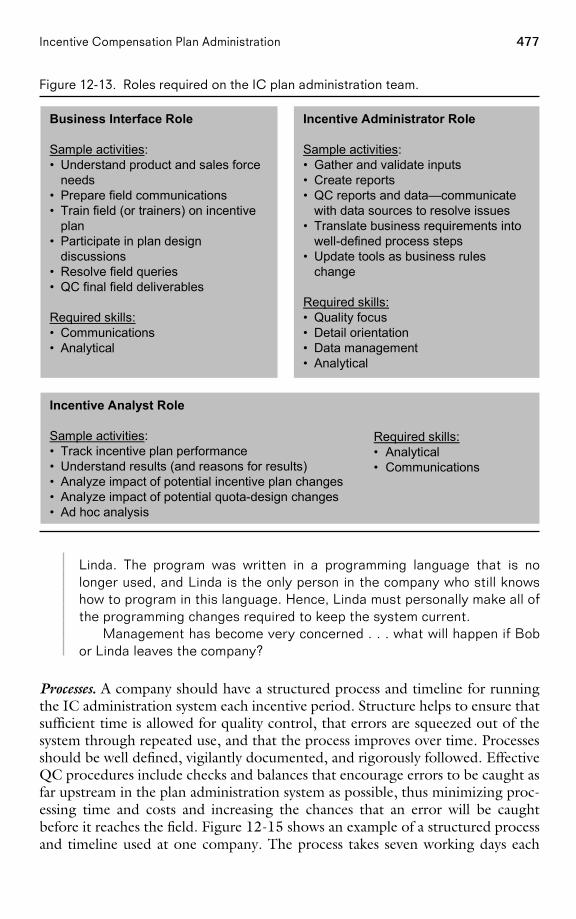
477Incentive Compensation Plan Administration
Figure 12-13. Roles required on the IC plan administration team.
Business Interface Role
Sample activities:• Understand product and sales force
needs• Prepare field communications• Train field (or trainers) on incentive
plan• Participate in plan design
discussions• Resolve field queries• QC final field deliverables
Required skills:• Communications• Analytical
Incentive Administrator Role
Sample activities:• Gather and validate inputs• Create reports• QC reports and data—communicate
with data sources to resolve issues• Translate business requirements into
well-defined process steps• Update tools as business rules
change
Required skills:• Quality focus• Detail orientation• Data management• Analytical
Incentive Analyst Role
Sample activities:• Track incentive plan performance• Understand results (and reasons for results)• Analyze impact of potential incentive plan changes• Analyze impact of potential quota-design changes• Ad hoc analysis
Required skills:• Analytical• Communications
Linda. The program was written in a programming language that is nolonger used, and Linda is the only person in the company who still knowshow to program in this language. Hence, Linda must personally make all ofthe programming changes required to keep the system current.
Management has become very concerned . . . what will happen if Bobor Linda leaves the company?
Processes. A company should have a structured process and timeline for runningthe IC administration system each incentive period. Structure helps to ensure thatsufficient time is allowed for quality control, that errors are squeezed out of thesystem through repeated use, and that the process improves over time. Processesshould be well defined, vigilantly documented, and rigorously followed. EffectiveQC procedures include checks and balances that encourage errors to be caught asfar upstream in the plan administration system as possible, thus minimizing proc-essing time and costs and increasing the chances that an error will be caughtbefore it reaches the field. Figure 12-15 shows an example of a structured processand timeline used at one company. The process takes seven working days each
PAGE 477................. 15869$ CH12 05-19-06 09:25:11 PS
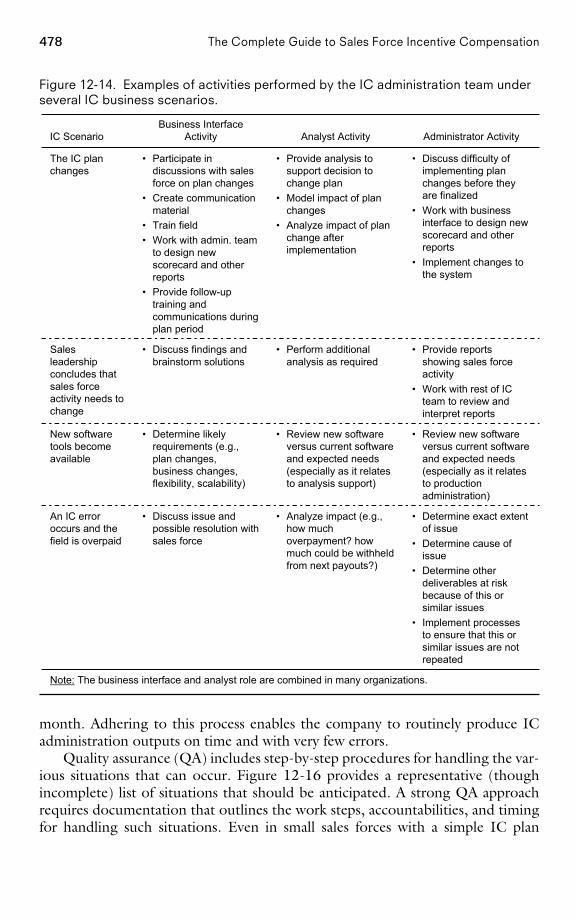
478 The Complete Guide to Sales Force Incentive Compensation
Figure 12-14. Examples of activities performed by the IC administration team underseveral IC business scenarios.
Note: The business interface and analyst role are combined in many organizations.
• Determine exact extentof issue
• Determine cause ofissue
• Determine otherdeliverables at riskbecause of this orsimilar issues
• Implement processesto ensure that this orsimilar issues are notrepeated
• Analyze impact (e.g.,how muchoverpayment? howmuch could be withheldfrom next payouts?)
• Discuss issue andpossible resolution withsales force
An IC erroroccurs and thefield is overpaid
• Review new softwareversus current softwareand expected needs(especially as it relatesto productionadministration)
• Review new softwareversus current softwareand expected needs(especially as it relatesto analysis support)
• Determine likelyrequirements (e.g.,plan changes,business changes,flexibility, scalability)
New softwaretools becomeavailable
• Provide reportsshowing sales forceactivity
• Work with rest of ICteam to review andinterpret reports
• Perform additionalanalysis as required
• Discuss findings andbrainstorm solutions
Salesleadershipconcludes thatsales forceactivity needs tochange
• Discuss difficulty ofimplementing planchanges before theyare finalized
• Work with businessinterface to design newscorecard and otherreports
• Implement changes tothe system
• Provide analysis tosupport decision tochange plan
• Model impact of planchanges
• Analyze impact of planchange afterimplementation
• Participate indiscussions with salesforce on plan changes
• Create communicationmaterial
• Train field• Work with admin. team
to design newscorecard and otherreports
• Provide follow-uptraining andcommunications duringplan period
The IC planchanges
Administrator ActivityAnalyst ActivityBusiness Interface
ActivityIC Scenario
month. Adhering to this process enables the company to routinely produce ICadministration outputs on time and with very few errors.
Quality assurance (QA) includes step-by-step procedures for handling the var-ious situations that can occur. Figure 12-16 provides a representative (thoughincomplete) list of situations that should be anticipated. A strong QA approachrequires documentation that outlines the work steps, accountabilities, and timingfor handling such situations. Even in small sales forces with a simple IC plan
PAGE 478................. 15869$ CH12 05-19-06 09:25:12 PS
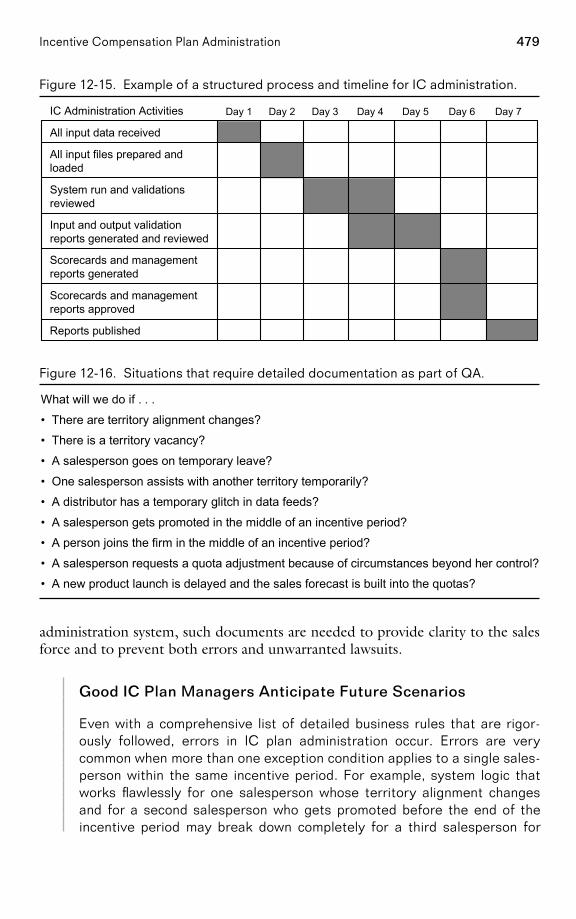
479Incentive Compensation Plan Administration
Figure 12-15. Example of a structured process and timeline for IC administration.
Reports published
Scorecards and managementreports approved
Scorecards and managementreports generated
Input and output validationreports generated and reviewed
System run and validationsreviewed
All input files prepared andloaded
All input data received
Day 7Day 6Day 5Day 4Day 3Day 2Day 1IC Administration Activities
Figure 12-16. Situations that require detailed documentation as part of QA.
What will we do if . . .
• There are territory alignment changes?
• There is a territory vacancy?
• A salesperson goes on temporary leave?
• One salesperson assists with another territory temporarily?
• A distributor has a temporary glitch in data feeds?
• A salesperson gets promoted in the middle of an incentive period?
• A person joins the firm in the middle of an incentive period?
• A salesperson requests a quota adjustment because of circumstances beyond her control?
• A new product launch is delayed and the sales forecast is built into the quotas?
administration system, such documents are needed to provide clarity to the salesforce and to prevent both errors and unwarranted lawsuits.
Good IC Plan Managers Anticipate Future Scenarios
Even with a comprehensive list of detailed business rules that are rigor-ously followed, errors in IC plan administration occur. Errors are verycommon when more than one exception condition applies to a single sales-person within the same incentive period. For example, system logic thatworks flawlessly for one salesperson whose territory alignment changesand for a second salesperson who gets promoted before the end of theincentive period may break down completely for a third salesperson for
PAGE 479................. 15869$ CH12 05-19-06 09:25:13 PS
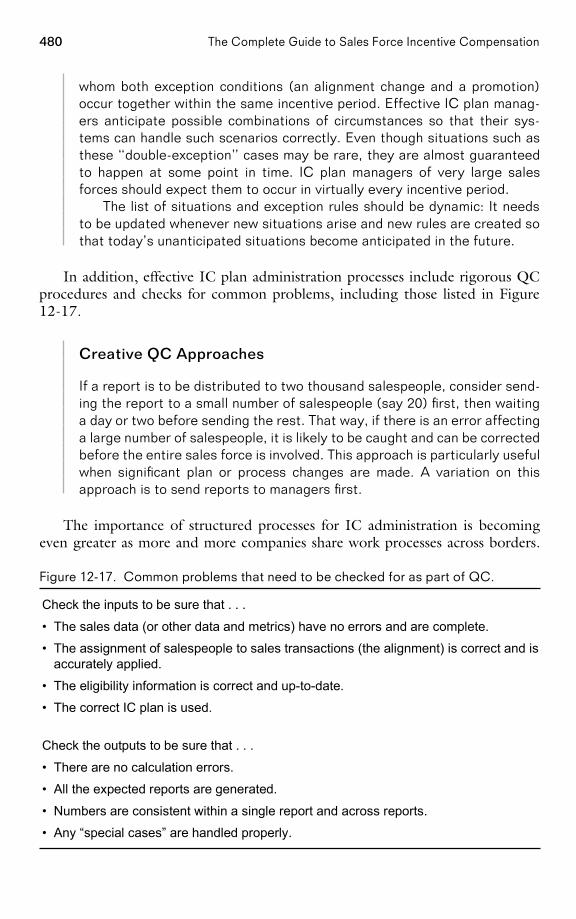
480 The Complete Guide to Sales Force Incentive Compensation
whom both exception conditions (an alignment change and a promotion)occur together within the same incentive period. Effective IC plan manag-ers anticipate possible combinations of circumstances so that their sys-tems can handle such scenarios correctly. Even though situations such asthese ‘‘double-exception’’ cases may be rare, they are almost guaranteedto happen at some point in time. IC plan managers of very large salesforces should expect them to occur in virtually every incentive period.
The list of situations and exception rules should be dynamic: It needsto be updated whenever new situations arise and new rules are created sothat today’s unanticipated situations become anticipated in the future.
In addition, effective IC plan administration processes include rigorous QCprocedures and checks for common problems, including those listed in Figure12-17.
Creative QC Approaches
If a report is to be distributed to two thousand salespeople, consider send-ing the report to a small number of salespeople (say 20) first, then waitinga day or two before sending the rest. That way, if there is an error affectinga large number of salespeople, it is likely to be caught and can be correctedbefore the entire sales force is involved. This approach is particularly usefulwhen significant plan or process changes are made. A variation on thisapproach is to send reports to managers first.
The importance of structured processes for IC administration is becomingeven greater as more and more companies share work processes across borders.
Figure 12-17. Common problems that need to be checked for as part of QC.
Check the inputs to be sure that . . .
• The sales data (or other data and metrics) have no errors and are complete.
• The assignment of salespeople to sales transactions (the alignment) is correct and isaccurately applied.
• The eligibility information is correct and up-to-date.
• The correct IC plan is used.
Check the outputs to be sure that . . .
• There are no calculation errors.
• All the expected reports are generated.
• Numbers are consistent within a single report and across reports.
• Any “special cases” are handled properly.
PAGE 480................. 15869$ CH12 05-19-06 09:25:15 PS
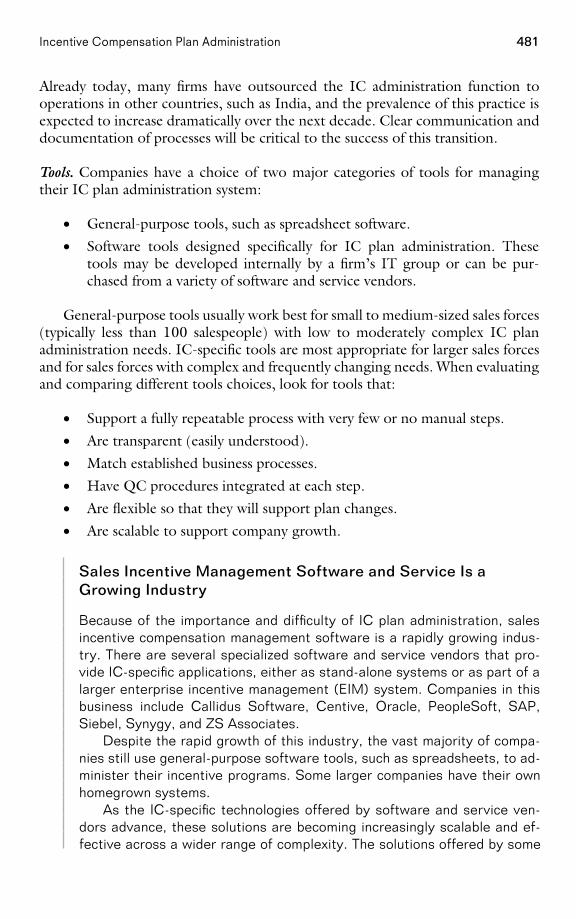
481Incentive Compensation Plan Administration
Already today, many firms have outsourced the IC administration function tooperations in other countries, such as India, and the prevalence of this practice isexpected to increase dramatically over the next decade. Clear communication anddocumentation of processes will be critical to the success of this transition.
Tools. Companies have a choice of two major categories of tools for managingtheir IC plan administration system:
• General-purpose tools, such as spreadsheet software.
• Software tools designed specifically for IC plan administration. Thesetools may be developed internally by a firm’s IT group or can be pur-chased from a variety of software and service vendors.
General-purpose tools usually work best for small to medium-sized sales forces(typically less than 100 salespeople) with low to moderately complex IC planadministration needs. IC-specific tools are most appropriate for larger sales forcesand for sales forces with complex and frequently changing needs. When evaluatingand comparing different tools choices, look for tools that:
• Support a fully repeatable process with very few or no manual steps.
• Are transparent (easily understood).
• Match established business processes.
• Have QC procedures integrated at each step.
• Are flexible so that they will support plan changes.
• Are scalable to support company growth.
Sales Incentive Management Software and Service Is aGrowing Industry
Because of the importance and difficulty of IC plan administration, salesincentive compensation management software is a rapidly growing indus-try. There are several specialized software and service vendors that pro-vide IC-specific applications, either as stand-alone systems or as part of alarger enterprise incentive management (EIM) system. Companies in thisbusiness include Callidus Software, Centive, Oracle, PeopleSoft, SAP,Siebel, Synygy, and ZS Associates.
Despite the rapid growth of this industry, the vast majority of compa-nies still use general-purpose software tools, such as spreadsheets, to ad-minister their incentive programs. Some larger companies have their ownhomegrown systems.
As the IC-specific technologies offered by software and service ven-dors advance, these solutions are becoming increasingly scalable and ef-fective across a wider range of complexity. The solutions offered by some
PAGE 481................. 15869$ CH12 05-19-06 09:25:15 PS
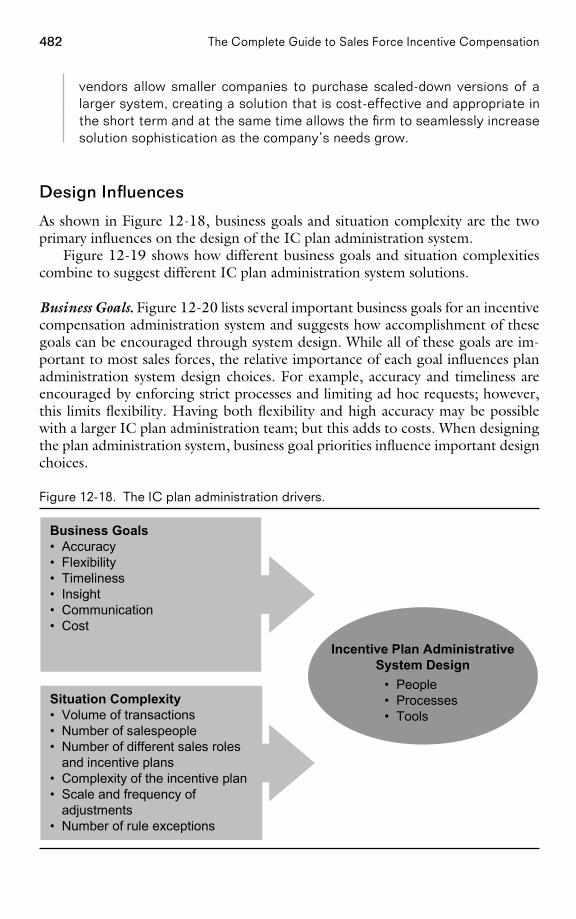
482 The Complete Guide to Sales Force Incentive Compensation
vendors allow smaller companies to purchase scaled-down versions of alarger system, creating a solution that is cost-effective and appropriate inthe short term and at the same time allows the firm to seamlessly increasesolution sophistication as the company’s needs grow.
Design Influences
As shown in Figure 12-18, business goals and situation complexity are the twoprimary influences on the design of the IC plan administration system.
Figure 12-19 shows how different business goals and situation complexitiescombine to suggest different IC plan administration system solutions.
Business Goals. Figure 12-20 lists several important business goals for an incentivecompensation administration system and suggests how accomplishment of thesegoals can be encouraged through system design. While all of these goals are im-portant to most sales forces, the relative importance of each goal influences planadministration system design choices. For example, accuracy and timeliness areencouraged by enforcing strict processes and limiting ad hoc requests; however,this limits flexibility. Having both flexibility and high accuracy may be possiblewith a larger IC plan administration team; but this adds to costs. When designingthe plan administration system, business goal priorities influence important designchoices.
Figure 12-18. The IC plan administration drivers.
• People• Processes• Tools
Incentive Plan AdministrativeSystem Design
Business Goals• Accuracy• Flexibility• Timeliness• Insight• Communication• Cost
Situation Complexity• Volume of transactions• Number of salespeople• Number of different sales roles
and incentive plans• Complexity of the incentive plan• Scale and frequency of
adjustments• Number of rule exceptions
PAGE 482................. 15869$ CH12 05-19-06 09:25:16 PS
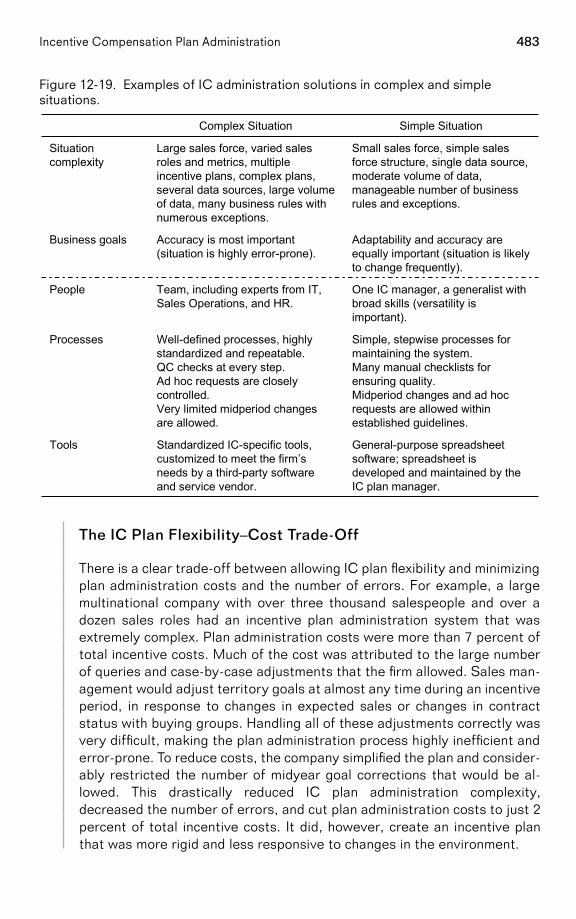
483Incentive Compensation Plan Administration
Figure 12-19. Examples of IC administration solutions in complex and simplesituations.
General-purpose spreadsheetsoftware; spreadsheet isdeveloped and maintained by theIC plan manager.
Standardized IC-specific tools,customized to meet the firm’sneeds by a third-party softwareand service vendor.
Tools
Simple, stepwise processes formaintaining the system.Many manual checklists forensuring quality.Midperiod changes and ad hocrequests are allowed withinestablished guidelines.
Well-defined processes, highlystandardized and repeatable.QC checks at every step.Ad hoc requests are closelycontrolled.Very limited midperiod changesare allowed.
Processes
One IC manager, a generalist withbroad skills (versatility isimportant).
Team, including experts from IT,Sales Operations, and HR.
People
Adaptability and accuracy areequally important (situation is likelyto change frequently).
Accuracy is most important(situation is highly error-prone).
Business goals
Small sales force, simple salesforce structure, single data source,moderate volume of data,manageable number of businessrules and exceptions.
Large sales force, varied salesroles and metrics, multipleincentive plans, complex plans,several data sources, large volumeof data, many business rules withnumerous exceptions.
Situationcomplexity
Simple SituationComplex Situation
The IC Plan Flexibility–Cost Trade-Off
There is a clear trade-off between allowing IC plan flexibility and minimizingplan administration costs and the number of errors. For example, a largemultinational company with over three thousand salespeople and over adozen sales roles had an incentive plan administration system that wasextremely complex. Plan administration costs were more than 7 percent oftotal incentive costs. Much of the cost was attributed to the large numberof queries and case-by-case adjustments that the firm allowed. Sales man-agement would adjust territory goals at almost any time during an incentiveperiod, in response to changes in expected sales or changes in contractstatus with buying groups. Handling all of these adjustments correctly wasvery difficult, making the plan administration process highly inefficient anderror-prone. To reduce costs, the company simplified the plan and consider-ably restricted the number of midyear goal corrections that would be al-lowed. This drastically reduced IC plan administration complexity,decreased the number of errors, and cut plan administration costs to just 2percent of total incentive costs. It did, however, create an incentive planthat was more rigid and less responsive to changes in the environment.
PAGE 483................. 15869$ CH12 05-19-06 09:25:17 PS
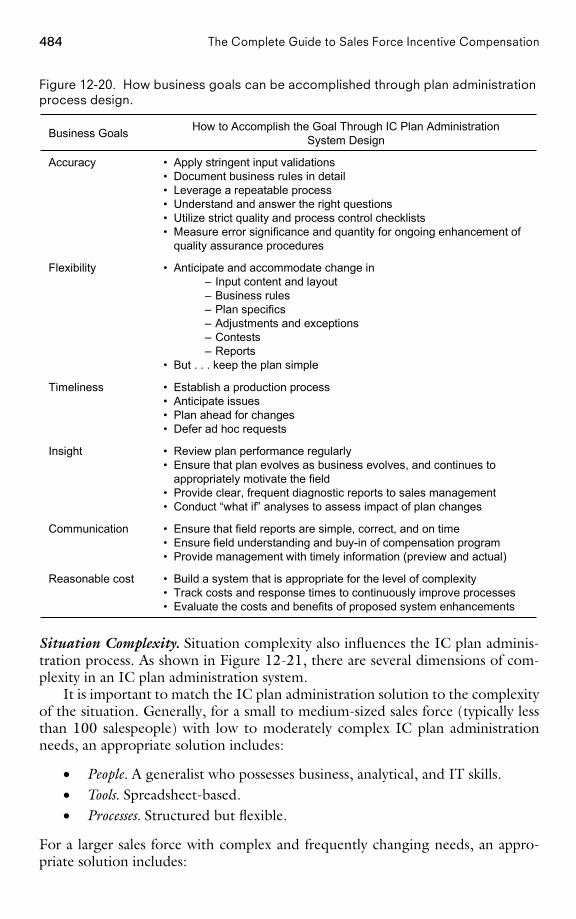
484 The Complete Guide to Sales Force Incentive Compensation
Figure 12-20. How business goals can be accomplished through plan administrationprocess design.
• Build a system that is appropriate for the level of complexity• Track costs and response times to continuously improve processes• Evaluate the costs and benefits of proposed system enhancements
Reasonable cost
• Ensure that field reports are simple, correct, and on time• Ensure field understanding and buy-in of compensation program• Provide management with timely information (preview and actual)
Communication
• Review plan performance regularly• Ensure that plan evolves as business evolves, and continues to
appropriately motivate the field• Provide clear, frequent diagnostic reports to sales management• Conduct “what if” analyses to assess impact of plan changes
Insight
• Establish a production process• Anticipate issues• Plan ahead for changes• Defer ad hoc requests
Timeliness
• Anticipate and accommodate change in– Input content and layout– Business rules– Plan specifics– Adjustments and exceptions– Contests– Reports
• But . . . keep the plan simple
Flexibility
• Apply stringent input validations• Document business rules in detail• Leverage a repeatable process• Understand and answer the right questions• Utilize strict quality and process control checklists• Measure error significance and quantity for ongoing enhancement of
quality assurance procedures
Accuracy
How to Accomplish the Goal Through IC Plan AdministrationSystem DesignBusiness Goals
Situation Complexity. Situation complexity also influences the IC plan adminis-tration process. As shown in Figure 12-21, there are several dimensions of com-plexity in an IC plan administration system.
It is important to match the IC plan administration solution to the complexityof the situation. Generally, for a small to medium-sized sales force (typically lessthan 100 salespeople) with low to moderately complex IC plan administrationneeds, an appropriate solution includes:
• People. A generalist who possesses business, analytical, and IT skills.• Tools. Spreadsheet-based.• Processes. Structured but flexible.
For a larger sales force with complex and frequently changing needs, an appro-priate solution includes:
PAGE 484
................. 15869$ CH12 05-19-06 09:25:19 PS
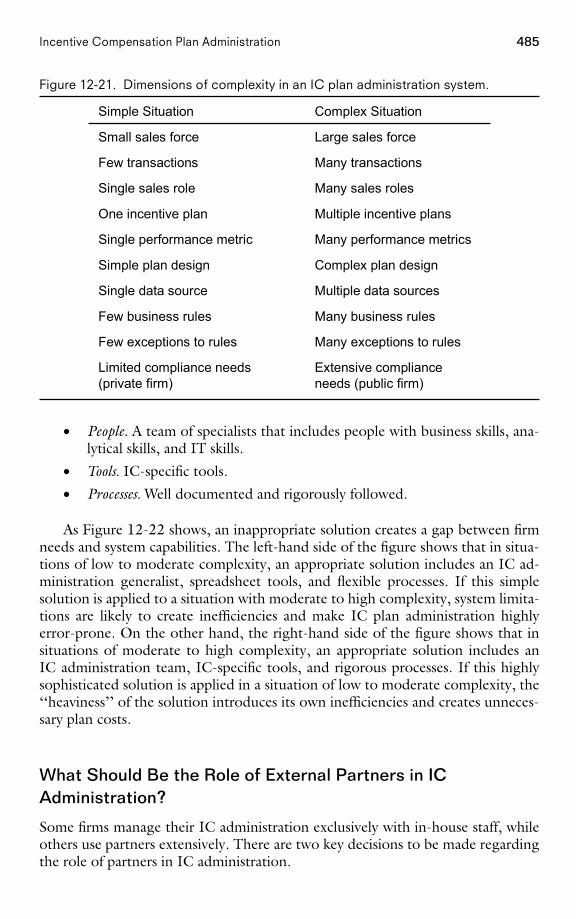
485Incentive Compensation Plan Administration
Figure 12-21. Dimensions of complexity in an IC plan administration system.
Extensive complianceneeds (public firm)
Limited compliance needs(private firm)
Many exceptions to rulesFew exceptions to rules
Many business rulesFew business rules
Multiple data sourcesSingle data source
Complex plan designSimple plan design
Many performance metricsSingle performance metric
Multiple incentive plansOne incentive plan
Many sales rolesSingle sales role
Many transactionsFew transactions
Large sales forceSmall sales force
Complex SituationSimple Situation
• People. A team of specialists that includes people with business skills, ana-lytical skills, and IT skills.
• Tools. IC-specific tools.
• Processes. Well documented and rigorously followed.
As Figure 12-22 shows, an inappropriate solution creates a gap between firmneeds and system capabilities. The left-hand side of the figure shows that in situa-tions of low to moderate complexity, an appropriate solution includes an IC ad-ministration generalist, spreadsheet tools, and flexible processes. If this simplesolution is applied to a situation with moderate to high complexity, system limita-tions are likely to create inefficiencies and make IC plan administration highlyerror-prone. On the other hand, the right-hand side of the figure shows that insituations of moderate to high complexity, an appropriate solution includes anIC administration team, IC-specific tools, and rigorous processes. If this highlysophisticated solution is applied in a situation of low to moderate complexity, the‘‘heaviness’’ of the solution introduces its own inefficiencies and creates unneces-sary plan costs.
What Should Be the Role of External Partners in ICAdministration?
Some firms manage their IC administration exclusively with in-house staff, whileothers use partners extensively. There are two key decisions to be made regardingthe role of partners in IC administration.
PAGE 485
................. 15869$ CH12 05-19-06 09:25:20 PS
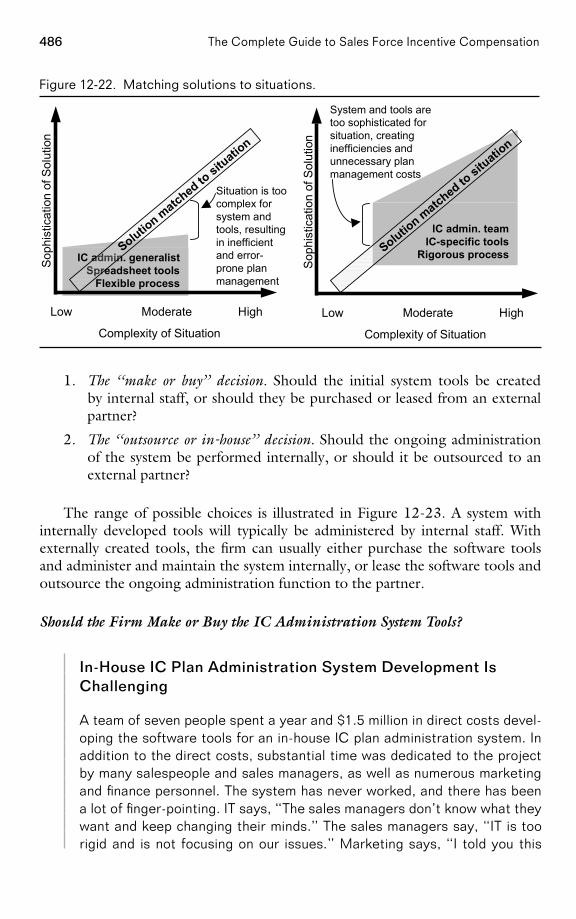
486 The Complete Guide to Sales Force Incentive Compensation
Figure 12-22. Matching solutions to situations.
Sop
hist
icat
ion
of S
olut
ion
Low Moderate High
Complexity of Situation
System and tools aretoo sophisticated forsituation, creatinginefficiencies andunnecessary planmanagement costs
IC admin. teamIC-specific tools
Rigorous processSolution m
atched to situ
ation
Situation is toocomplex forsystem andtools, resultingin inefficientand error-prone planmanagement
Low Moderate High
Complexity of Situation
Sop
hist
icat
ion
of S
olut
ion
IC admin. generalistSpreadsheet tools
Flexible process
Solution m
atched to situ
ation
1. The ‘‘make or buy’’ decision. Should the initial system tools be createdby internal staff, or should they be purchased or leased from an externalpartner?
2. The ‘‘outsource or in-house’’ decision. Should the ongoing administrationof the system be performed internally, or should it be outsourced to anexternal partner?
The range of possible choices is illustrated in Figure 12-23. A system withinternally developed tools will typically be administered by internal staff. Withexternally created tools, the firm can usually either purchase the software toolsand administer and maintain the system internally, or lease the software tools andoutsource the ongoing administration function to the partner.
Should the Firm Make or Buy the IC Administration System Tools?
In-House IC Plan Administration System Development IsChallenging
A team of seven people spent a year and $1.5 million in direct costs devel-oping the software tools for an in-house IC plan administration system. Inaddition to the direct costs, substantial time was dedicated to the projectby many salespeople and sales managers, as well as numerous marketingand finance personnel. The system has never worked, and there has beena lot of finger-pointing. IT says, ‘‘The sales managers don’t know what theywant and keep changing their minds.’’ The sales managers say, ‘‘IT is toorigid and is not focusing on our issues.’’ Marketing says, ‘‘I told you this
PAGE 486................. 15869$ CH12 05-19-06 09:25:21 PS
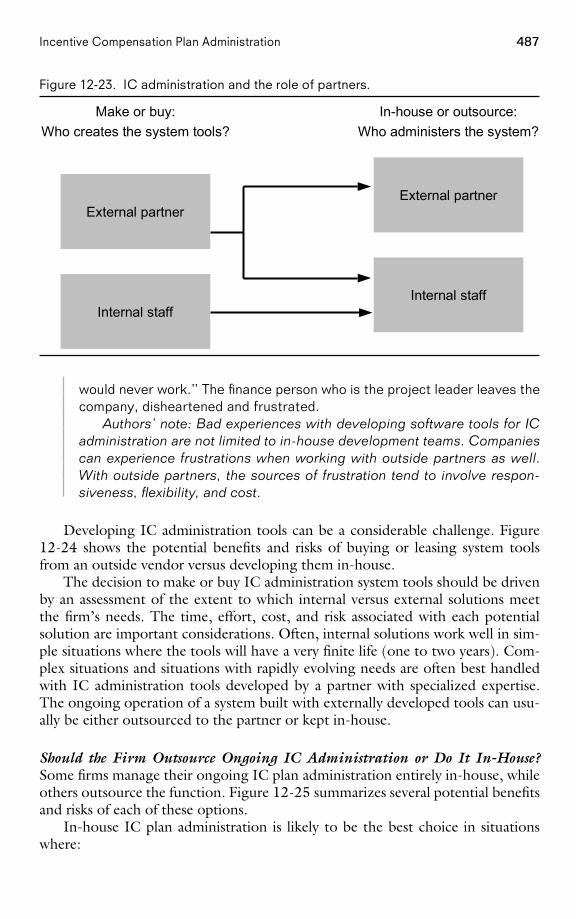
487Incentive Compensation Plan Administration
Figure 12-23. IC administration and the role of partners.
Make or buy:Who creates the system tools?
In-house or outsource:Who administers the system?
External partner
Internal staff
External partner
Internal staff
would never work.’’ The finance person who is the project leader leaves thecompany, disheartened and frustrated.
Authors’ note: Bad experiences with developing software tools for ICadministration are not limited to in-house development teams. Companiescan experience frustrations when working with outside partners as well.With outside partners, the sources of frustration tend to involve respon-siveness, flexibility, and cost.
Developing IC administration tools can be a considerable challenge. Figure12-24 shows the potential benefits and risks of buying or leasing system toolsfrom an outside vendor versus developing them in-house.
The decision to make or buy IC administration system tools should be drivenby an assessment of the extent to which internal versus external solutions meetthe firm’s needs. The time, effort, cost, and risk associated with each potentialsolution are important considerations. Often, internal solutions work well in sim-ple situations where the tools will have a very finite life (one to two years). Com-plex situations and situations with rapidly evolving needs are often best handledwith IC administration tools developed by a partner with specialized expertise.The ongoing operation of a system built with externally developed tools can usu-ally be either outsourced to the partner or kept in-house.
Should the Firm Outsource Ongoing IC Administration or Do It In-House?Some firms manage their ongoing IC plan administration entirely in-house, whileothers outsource the function. Figure 12-25 summarizes several potential benefitsand risks of each of these options.
In-house IC plan administration is likely to be the best choice in situationswhere:
PAGE 487................. 15869$ CH12 05-19-06 09:25:22 PS
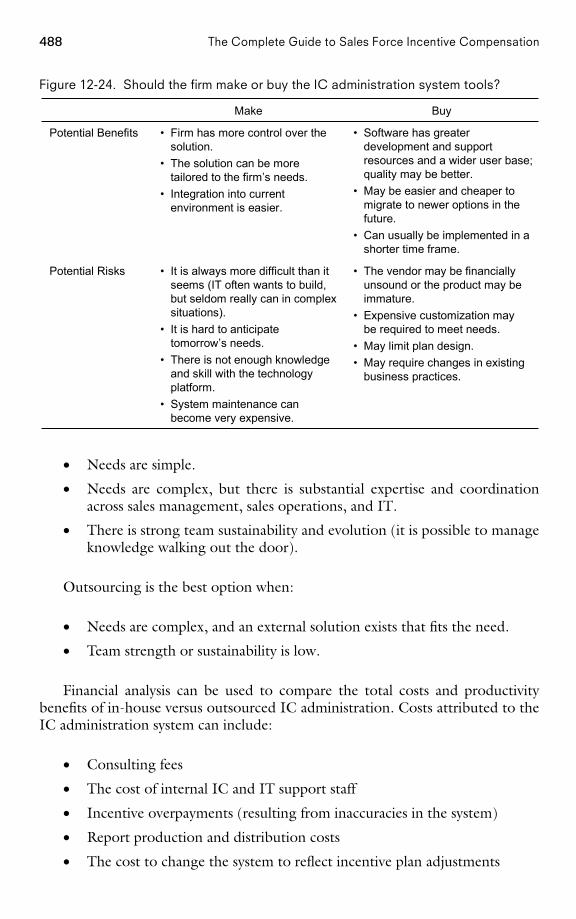
488 The Complete Guide to Sales Force Incentive Compensation
Figure 12-24. Should the firm make or buy the IC administration system tools?
• The vendor may be financiallyunsound or the product may beimmature.
• Expensive customization maybe required to meet needs.
• May limit plan design.• May require changes in existing
business practices.
• It is always more difficult than itseems (IT often wants to build,but seldom really can in complexsituations).
• It is hard to anticipatetomorrow’s needs.
• There is not enough knowledgeand skill with the technologyplatform.
• System maintenance canbecome very expensive.
Potential Risks
• Software has greaterdevelopment and supportresources and a wider user base;quality may be better.
• May be easier and cheaper tomigrate to newer options in thefuture.
• Can usually be implemented in ashorter time frame.
• Firm has more control over thesolution.
• The solution can be moretailored to the firm’s needs.
• Integration into currentenvironment is easier.
Potential Benefits
BuyMake
• Needs are simple.
• Needs are complex, but there is substantial expertise and coordinationacross sales management, sales operations, and IT.
• There is strong team sustainability and evolution (it is possible to manageknowledge walking out the door).
Outsourcing is the best option when:
• Needs are complex, and an external solution exists that fits the need.
• Team strength or sustainability is low.
Financial analysis can be used to compare the total costs and productivitybenefits of in-house versus outsourced IC administration. Costs attributed to theIC administration system can include:
• Consulting fees
• The cost of internal IC and IT support staff
• Incentive overpayments (resulting from inaccuracies in the system)
• Report production and distribution costs
• The cost to change the system to reflect incentive plan adjustments
PAGE 488
................. 15869$ CH12 05-19-06 09:25:23 PS
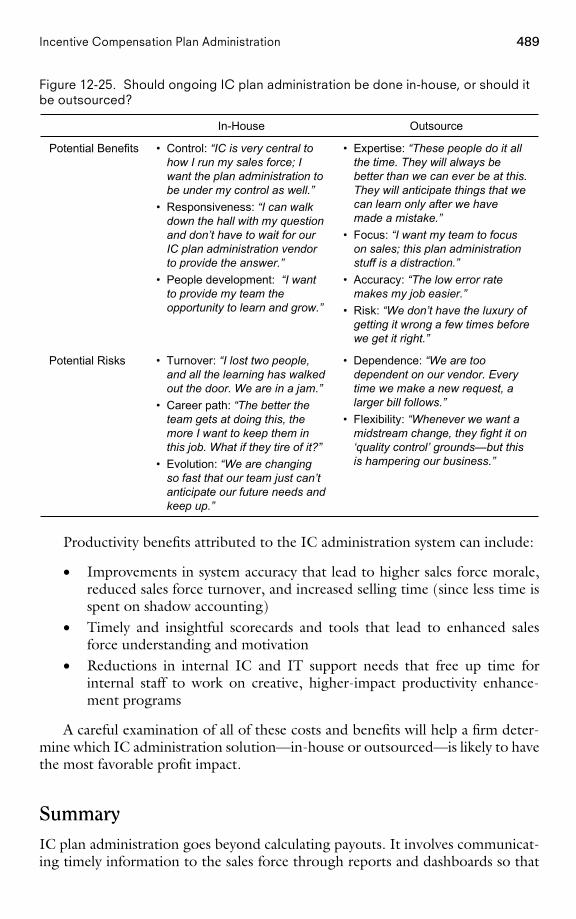
489Incentive Compensation Plan Administration
Figure 12-25. Should ongoing IC plan administration be done in-house, or should itbe outsourced?
• Dependence: “We are toodependent on our vendor. Everytime we make a new request, alarger bill follows.”
• Flexibility: “Whenever we want amidstream change, they fight it on‘quality control’ grounds—but thisis hampering our business.”
• Turnover: “I lost two people,and all the learning has walkedout the door. We are in a jam.”
• Career path: “The better theteam gets at doing this, themore I want to keep them inthis job. What if they tire of it?”
• Evolution: “We are changingso fast that our team just can’tanticipate our future needs andkeep up.”
Potential Risks
• Expertise: “These people do it allthe time. They will always bebetter than we can ever be at this.They will anticipate things that wecan learn only after we havemade a mistake.”
• Focus: “I want my team to focuson sales; this plan administrationstuff is a distraction.”
• Accuracy: “The low error ratemakes my job easier.”
• Risk: “We don’t have the luxury ofgetting it wrong a few times beforewe get it right.”
• Control: “IC is very central tohow I run my sales force; Iwant the plan administration tobe under my control as well.”
• Responsiveness: “I can walkdown the hall with my questionand don’t have to wait for ourIC plan administration vendorto provide the answer.”
• People development: “I wantto provide my team theopportunity to learn and grow.”
Potential Benefits
OutsourceIn-House
Productivity benefits attributed to the IC administration system can include:
• Improvements in system accuracy that lead to higher sales force morale,reduced sales force turnover, and increased selling time (since less time isspent on shadow accounting)
• Timely and insightful scorecards and tools that lead to enhanced salesforce understanding and motivation
• Reductions in internal IC and IT support needs that free up time forinternal staff to work on creative, higher-impact productivity enhance-ment programs
A careful examination of all of these costs and benefits will help a firm deter-mine which IC administration solution—in-house or outsourced—is likely to havethe most favorable profit impact.
SummaryIC plan administration goes beyond calculating payouts. It involves communicat-ing timely information to the sales force through reports and dashboards so that
PAGE 489
................. 15869$ CH12 05-19-06 09:25:24 PS
490 The Complete Guide to Sales Force Incentive Compensation
salespeople know how they are doing and where and how they can improve. Withthis vital information, salespeople can ‘‘work the IC plan’’ and accomplish impor-tant company objectives. In addition, IC plan administration involves creatingplan health checks that allow sales leaders to assess the quality of the plan and takemid-course corrective steps if needed.
IC plan administration is a very important job. The job can be frustrating attimes, since IC plan administrators often hear complaints when things go wrong,yet rarely get accolades when things go right. The most effective IC plan adminis-trators automate the routine aspects of IC administration so that they have consid-erable time to spend on higher-value-added activities, such as improving businessprocesses, evaluating new technologies, and designing creative reports that pro-vide sales leaders with strategic business insights. With a well-designed and effi-cient IC administration process, the job of an IC plan administrator can be bothchallenging and rewarding.
IC plan administration needs to be done well to make an incentive plan suc-cessful. IC plan administration that is both effective and efficient is very difficultto achieve, particularly in complex situations where constant unanticipated coursecorrections are needed. Ineffective plan administration can be detrimental to afirm. Having the right people, systems, and processes in place, along with a strongquality focus, enables the firm to minimize errors and optimize cost-effectiveness.Successful incentive plan administration significantly enhances the power of anincentive program as a key sales force effectiveness driver.
PAGE 490................. 15869$ CH12 05-19-06 09:25:24 PS
Indexabsolute-level metrics, 209–210accountability, 12, 190–191account assignment, 463–464acquisitions, see mergersactual pay mix, 94–95adaptation
need for, 12–15, 40–41of performance measures to business strategy change,
195–196additive matrix, 255, 256add-on programs, see recognition programs; sales con-
tests; SPIFFs (Special Performance Incentives forField Force)
administration, see incentive plan administrationaggregation of plan measures, 259–261, 262Alexander Group, Inc., 122Allen-Bradley, 75All Star Incentive Marketing, 403American Express Incentive Services, 403America Online, 334Anderson, Andy, 404assessment process, 34, 36
for candidate incentive plan, 264–310for incumbent incentive plan, 38–92
at-risk pay, 97, 147–148, see also salary-incentive mixattraction of sales force
consequences of incentive compensation for, 47,50–52
pay levels in, 111, 130performance-payout relationships and, 235–237
awards, see recognition programs; sales contests; SPIFFs(Special Performance Incentives for Field Force)
base salary, 94benchmarking
consequences for salespeople, 47, 52–53industry norms in, 52–53, 120–125, 173–174, 281of salary-incentive mix, 173–174of sales force pay levels, 120–125of sales goals, 11–12, 331of sales territory goals, 335
Best Buy, 13, 419bias check, 59–62, 126, 194bluebirds, 101–103, 169–170, 319–320Blue Cross Blue Shield (BCBS) of Massachusetts,
173–174bonuses
commissions versus, 231–237, 261–262executive, 422–423problems with goal-setting and, 64–65, 227–228,
239–240, 242–243retention, 418
bottom-up method of goal setting, 359–361brand name, sales force causality and, 166Brenton Banks, 5, 420–421business development activities, 29–30buyback arrangements, 418
Callidus Software, 369, 481Canvas Systems, 378capped incentive plans, 231, 243–245, 250career stage, pay levels in, 111–112Carlson Marketing Group, 403carryover sales, 100–101, 236, 349–351causality, sales force, see sales force causality/prominenceCentive, 369, 481
PAGE 491
491
changes in sales force compensation, 423–430communication of, 416–419, 443–449company culture and, 177–178compatibility with other effectiveness drivers,
419–421consequences of incentive compensation, 415,
416–419consistency and, 419–421impact of, 13, 25, 31, 242–243, 429need for, 6–7, 13, 237, 412–413, 419, 426–427plan administration and, 449–450plan design and, 25, 291–295, 419, 437–438problems with, 43, 412–415sales management system and, 415–421start-up firms and, 432–433testing, 291–295timing of, 451see also implementation process
channel strategyconsistency with incentive compensation, 81as focus of performance measurement, 216, 217
Checkpoint Systems, 403–404Circuit City, 13Cisco, 81, 400Citigroup, 401Clark/Bardes Consulting, 122Clintar, 398–399coaching, 21–23Cognos, 473commissions
bias check for, 62bonuses versus, 231–237, 261–262customer results and, 71–72ethics and, 71–72in high percent incentive pay plans, 142, 144, 155–
157, 227on new product sales, 5–7, 9, 329, 393–394payment from first dollar, 231, 247–248payment from goal or fraction of goal, 231, 248–251problems of, 9product life cycle and, 5–7, 9, 78–79, 164–165
communicationof changes in sales force compensation, 416–419,
443–449as Controller in sales force effectiveness, 21, 22
company budget, 127–129, 391–392company culture, 129–132, 235–237, 400, 412company history, salary-incentive mix in, 175–178company influences
on pay levels, 125–132, 138–139on pay variation, 132–137, 139
company resultsconsequences of incentive compensation for, 23, 28–
29, 47, 72–76, 108–109, 143–149, 301–304cost analysis in, 47, 72–74, 81evaluating measurability of, 170–173goal setting for, 328, 330improving gross margins, 15–16metrics for performance measurement, 188, 200–204,
208problems of, 45qualitative diagnosis in, 47, 74–76salary-incentive mix in, 170–173, 175–176sales contests and SPIFFs and, 392–395in sales management system, 19, 20, 23
Compaq, 13–14, 153Compass Bank, 31–32
................. 15869$ INDX 05-19-06 09:22:11 PS
492 Index
compatibility with other effectiveness drivers, 23, 24–25,81–83
of add-on incentive programs, 386, 408changes in sales force compensation and, 415,
419–421in incentive plan administration, 460, 461in incentive plan redesign, 85, 89, 92pay level and, 110–112, 113, 114performance measures and, 187, 192performance-payout relationship and, 228, 229plan assessment scorecards, 48, 89, 268–271problems of, 45qualitative tests of, 46, 48, 82–83, 305, 307, 308, 309quantitative tests of, 46, 48, 268–271salary-incentive mix, 143, 144, 145, 150–151sales force culture in, 48, 81–83, 150–151sales force goals and, 315
compensation, see also incentive compensationin sales force effectiveness, 21, 22
complexity of incentive plan, 7, 10, 484–485administrative costs and, 74minimizing, 263plan traction and, 47, 56–57sales force activities and, 47, 69–70tests of, 69
complexity of sales processsalary-incentive mix and, 159–160sales force causality and, 97–101, 117–119, 159–160,
165–170see also sales force causality/prominence
compliance reporting, 466–469consequences of incentive compensation
add-on incentive programs, 386, 408assessment of incentive plan, 45–76, 268–271, 274,
295–304changes in sales force compensation and, 415,
416–419for company results, 23, 28–29, 47, 72–76, 108–109,
143–149, 301–304for customer results, 23, 27–28, 47, 70–72, 108–109,
143–149, 301, 303, 418–419effectiveness drivers and, 22–23, 25–29in incentive plan administration, 460, 461in incentive plan redesign, 85, 88, 92pay level and, 108–109, 113, 114performance measures and, 187, 192performance-payout relationship and, 228, 229plan assessment scorecards, 47–48, 88–89, 268–271problems of, 45qualitative tests of, 46, 47, 48, 65, 69–72, 74–76,
295–304quantitative tests of, 46, 47, 50–65, 66–68, 72–74,
268–271salary-incentive mix, 143–149for sales force activities, 23, 26–27, 47, 65–70, 108–
109, 143–149, 301, 303sales force goals and, 315for salespeople, 26, 47, 48–65, 108–109, 143–149,
295–301, 416–418consistency, 23–24
of add-on incentive programs, 386, 407changes in sales force compensation and, 415,
419–421in incentive plan administration, 460, 461in incentive plan redesign, 85, 89, 92, 110of pay level, 110, 113, 114, 124–125of performance measures, 187, 192performance-payout relationship and, 228, 229plan assessment scorecards, 48, 89, 268–271problems of, 45qualitative tests of, 46, 48, 77–81, 304–305, 306quantitative tests of, 46, 48, 268–271of salary-incentive mix, 143, 144, 145, 149–150
PAGE 492
with sales and marketing strategy, 10–11, 23, 48,77–81
of sales force goals, 315constant allocation method of goal setting, 362consultants, compensation surveys of, 122contribution margin, metrics for performance measure-
ment, 201–203Controllers, 21, 22, 83, 148–149, 150–151coordination systems, as Controller in sales force effec-
tiveness, 21, 22cost analysis, see plan cost analysiscost-to-sales ratio, 128–129cross-selling, 4–5, 385, 420–421Crystal Reports, 473Culpepper and Associates, 122culture, see also sales force culture
company, 129–132, 235–237, 400, 412cushions, 418customer results
consequences of incentive compensation for, 23, 27–28, 47, 70–72, 108–109, 143–149, 301, 303,418–419
customer input and, 70–72evaluating measurability of, 170–173goal setting for, 328, 330metrics for performance measurement, 188, 204–206,
208problems of, 45salary-incentive mix in, 170–173sales contests and SPIFFs and, 392–395in sales management system, 19, 20, 23
customer satisfaction, metrics for performance measure-ment, 205–206
Cutler-Hammer division, Eaton Corporation, 74–76
data management, 469–470data views
nature of, 199, 209in performance measurement, 199, 200, 209–216types of, 209–216
Definers, 20–22, 77–81, 304–305degree of income loss, 413–415Delphi forecasting, 332demand
for labor, 119–120predictability of, in commission versus bonus plans,
236sales force role in creating, 115–119, 136
Digital Equipment Corporation (DEC), 13–14, 145–146, 152–153, 384
Disney Attractions, 178documentation, for changes in sales incentive compensa-
tion plan, 443–449Dodson, John D., 162–163drivers of sales force compensation, 12–17
desire for improvement, 15–17market drivers, 138, 139need to adapt, 12–15pay mix, 160–170reasons for reassessing incentive plan, 14–15, 16–17sales role drivers, 138, 139, 153–157, 160–170see also effectiveness drivers, of sales force; sales force
activitiesdual plans, 418Dun & Bradstreet, 174dynamic reports, 475
Eaton Corporation, 74–76eBay, 205econometrics, 332effectiveness drivers, of sales force, 19, 20–23, 42
assessment of, see assessment process
................. 15869$ INDX 05-19-06 09:22:11 PS
493Index
compatibility with compensation plan, 23, 24–25, 48,81–83, 110–112, 305, 307
consequences for downstream components, see conse-quences of incentive compensation
Controllers, 21, 22, 83, 148–149, 150–151Definers, 20–22, 77–81, 304–305Enlighteners, 21, 22, 83Exciters, 21, 22, 146–148, 150–151, 262–263goals and, 327, see also goal settingmetrics for performance measurement, 188, 198–209need to adapt all of, 40–41Shapers, 21, 22, 83, 143–146
effective pay mix, 147–148employment opportunities, 119–120Engagement Rate
described, 55incentive payment from goal or fraction of goal,
248–251in MRG Company case study, 55–56, 276–281, 284plan traction and, 47, 53–57sales contests and SPIFFs and, 395–396sales force activities and, 47, 67–68
Enlighteners, 21, 22, 83enterprise incentive management (EIM) system, 149–
150, 481–482enterprise technology (ET) group, 462Entrepreneur Group, 227, 228, 242–243ethics
commissions and, 71–72sales contests and, 384–385unrealistic goals and, 334
excellence incentive, 95Excitement Index
described, 55motivation and, 151in MRG Company case study, 55–56, 276–281, 284plan traction and, 53–57sales force activities and, 47, 67–68see also Exciters
Exciters, 21, 22, 146–149, 150–151, 262–263, see alsoExcitement Index
exit interviews, as information source, 51–52, 123expectancy theory, 402external events, sales force compensation change and,
13, 412–413, 419, 426–427
FedEx, 3–4feedback, on goal attainment, 367–368, 369–370field sales managers
communication of changes in sales force compensationand, 448
field management reports, 465, 471–472in goal setting process, 365–368
Fifth Third Bank, 442fixed pay/compensation, 141–142, see also salary-
incentive mixfocus, 199, 200, 216–221focused sales objectives (FSOs), 14forced ranking systems, 215–216Ford Motor Company, 10forecasting, for goal setting, 314–321
goals too high, 314–318goals too low, 318–321national goals, 333–334, 371–372territory forecast method, 346–348
formula-based goal setting, 344–359historical sales, marketing potential, and sales effort,
357–359historical sales and market potential, 348–357, 364historical standards, 344–348
franchise sales, 99–101free-rider problem, 221, 267
PAGE 493
free sales, 97–101, 117–119, 147–148, 165–170, 247–248, 325–326, 349–351
Fusion Sales Partners, 144–145
General Electric, 75, 110, 144–145geographic bias, 60, 61global strategy, 10–11, 168–169Globoforce, 403goals, see goal setting; sales goalsgoal setting, 43, 314–376
adjusting goals in, 366–368, 370–372appropriate sales force goals, 314–327benchmarking in, see benchmarkingfor changes in sales incentive compensation, 450goal allocation across salespeople, 321–327impact of, 313–314importance of, 313–314for incentive plan administration systems, 482–484midyear goal corrections, 370–372national, 331–334, 371–372for new products, 5–6, 7, 361–362, 373number of goals, 375phases of, 330–368problems of, 64–65, 227–228, 239–240, 242–243,
314–327, 334, 371–372, 375process of, 376recommendations for, 372–374for sales territories, 314–318, 326–327, 334–363stretch goals and, 373–374, 401–402tracking performance against goals, 369–372types of goals, 327–330Web-based tracking systems, 367–370
Gonik, Jacob, 256–257, 360–361go-to-market strategy, 20, 21, 23, 77–81, 412grandfathering, 418gross margins, 15–16, 201–203guarantees, 245, 418
Hay Group, 122, 125Hewitt Associates, 122Hewlett, William, 204Hewlett-Packard Company, 153, 204high-leverage plans, 96, 135, 142, 144, 155–157, 158,
164hiring profiles, 24–25, 420horizontal communication, as Controller in sales force
effectiveness, 21, 22house accounts, 367
IBM, 10–11, 94, 144–145, 152–153, 197–198, 256–257, 320, 360–361, 384, 393–394, 438–439
implementation process, 36–37, 409–452change outlook and, 451–452for changing performance-payout relationships,
430–435for changing salary-incentive mix, 43, 423–430for cross-selling initiatives, 4–5, 385, 420–421difficulty of change, 412–415evolution of, 411framework for, 435–452for new performance measures, 430–435for new salespeople, 435for pay reductions, 8–9, 421–423sales management system and, 415–421for territory realignment, 433–435timing of, 450–451
incentive compensationadministration of, see incentive plan administrationassessment of, see assessment process; consequences of
incentive compensationchanges in, see changes in sales force compensationcompatibility with other sales force effectiveness driv-
ers, see compatibility with other effectiveness drivers
................. 15869$ INDX 05-19-06 09:22:12 PS
494 Index
incentive compensation (continued)complexity of, see complexity of incentive planconsequences on sales force effectiveness drivers, see
consequences of incentive compensationconsistency of, see consistencycosts of, see plan cost analysisdesign of, see plan design; sales force designdesired results from, 7–8feedback on goal attainment, 367–368, 369–370impact of, 2–3, 9implementation of, see implementation processperformance measures for, see performance measuresreasons for using, 11–12role in sales management system, 23–29sales force pay reduction and, 8–9, 421–423successes and failures of, 3–11target pay in, 94–95, 112–114
Incentive Compensation Advisory Board (ICAB),320–321
incentive pay/compensation, see incentive compensa-tion; salary-incentive mix
incentive plan administration, 453–490challenges of, 458–459of changes in sales incentive compensation, 449–450characteristics of poorly-administered systems,
460–461characteristics of well-administered systems, 459–460components of, 455–456contractors of, 122, 369, 473, 476–477, 481,
485–489cost of, 74, 305difficulty of, 456–458, 461–463effectiveness of sales force and, 43errors in, 457–458, 465, 478–480external partners in, 122, 369, 473, 476–477, 481–
482, 485–489flowchart for, 463–476importance of, 456–458nature of, 454–456payout curves and, 239plan complexity and, see complexity of incentive planplan design and, 464, 476–485of sales contests and SPIFFs, 400–401, 402–403, 459scorecards in, 455–456, 465–470system requirements for, 469–476
incentive plan obesity, 7, 10, 384, see also complexity ofincentive plan
Incent One, 403income range, 113–114industry norms
for benchmarking pay statistics, 52–53, 120–125,173–174, 281
comparing salary-incentive mix, 173–174information sources for pay levels, 120–125, 281for sales force pay level, 52–53, 120–122surrogate measures of market potential, 341, 342–343
information sourcesexit interviews, 51–52, 123on pay levels, 120–125, 281
inputsin assessing candidate incentive plan, 273–274customer results and, 70–72defined, 125in goal setting process, 359–361for incentive plan administration, 463–464in job value assessment, 125–126
inside sales roles, defining, 24internal events, sales force compensation change and, 13,
412–413, 419International Data Corporation (IDC), 227–228,
239–240Internet
incentive plan administration via, 401
PAGE 494
Web-based tracking systems, 367–370Inventive Federation, Inc., 385
JCPenney, 449job value assessment, 125–126Johnson & Johnson, 110
Knoll Pharmaceuticals, 374–375KPI (key performance indicator), 328–330
labor market value, 119–125industry norms in, 120information sources for determining pay levels, 120–
125, 281labor supply and demand in, 119–120
leadershipchanges in salary-incentive mix and, 424–425as Exciter in sales force effectiveness, 21, 22
leverage multiple, 95–96, 135low-leverage plans, 96, 135, 142–143, 145, 154–155,
156, 158, 164Lucent Technologies, 422–423
maintenance plus adjusted growth method of goal set-ting, 348–351, 364
maintenance plus standard growth method of goal set-ting, 344–346
management by objectives (MBO), 212, 258–259, 328–330, 462–463
management philosophyperformance-payout relationships and, 235–237salary-incentive mix in, 178–179
Maritz, 403Marketing Innovators, 403marketing strategy, see sales and marketing strategymarket potential, see sales territoriesmarket potential method of goal setting, 362market segment, as focus of performance measurement,
216, 217market share
bias based on, 60, 61change related to starting market share, 337–338metrics for performance measurement, 203–204of sales territories, 25
market size bias, 60, 61market volatility, sales force causality and, 101–103,
169–170Marsh Inc., 71Marsh & McLennan Cos., 71MathWorks, 24matrix approach, 255–257MCI Telecommunications, 401McLagen Partners, Inc., 122meaningful work, as Exciter in sales force effectiveness,
21, 22Merck, 151Mercury Interactive Corp., 393mergers
changes in incentive compensation and, 412consistency of pay levels and, 13, 110executive bonuses and, 422–423
Meridian Enterprises, 403metrics
absolute-level, 209–210nature of, 198–199in performance measurement, 188, 198–209types of, 200–209
Microsoft Business Solutions (MBS), 406–407mixed bonus and commission plans
advantages and challenges of, 242nature of, 234–235payout curves for, 238
MNP Inc., 84–92
................. 15869$ INDX 05-19-06 09:22:12 PS
495Index
motivationcompatibility with incentive compensation, 12, 23,
243–245as Exciter in sales force effectiveness, 21, 22, 151expectancy theory and, 402payout curves and, 239pay variation in, 132–135plan traction in measuring, 47, 53–57problems of, 45in quantitative tests of consequences of incentive com-
pensation, 53–57, 66–68recognition programs and, see recognition programsresearch on, 313sales contests and, see sales contestssales force activities and, 66–68sales force causality and, 166–167sales force goals and, 315–318, 321sales force performance and, 266SPIFFs and, see SPIFFs (Special Performance Incen-
tives for Field Force)MRA-The Management Associates, Inc., 122MRG Company case study
assessment of candidate incentive plan, 268–306assessment of incumbent incentive plan, 49, 55–57,
72–73, 272, 276–281introduction, 48
MS-Access, 473multiple performance measures, 196–198, 231, 251,
253–261, 262–263impact of aggregation, 259–261, 262matrix approach, 255–257points approach, 257–259weighted-measures approach, 253–255
national accountsgoal setting and, 331–334team selling and, 168–169
National Cash Register (NCR), 379–380national goal setting, 371–372NCR, 379–380new account development, problems of, 43new businesses, see start-up firmsnew products
changes in incentive compensation and, 7future-proofing incentive plans for, 306–307incentive compensation and, 5–7, 9, 78–79, 329,
393–394performance measures for, 195sales goals for, 5–6, 7, 361–362, 373
new salespeople, sales incentive compensation plan for,435
New York Times, 250–251Nexaweb Technologies, 378–379non-capped incentive plans, 231, 243–245, 250non-sales force marketing instruments, sales force causal-
ity and, 166Northwestern University, 14–15, 16–17
Incentive Compensation Advisory Board (ICAB),320–321
Sales Incentive Executive Education Survey, 151–152,203, 206–208, 210, 211, 222, 243, 244
objectives of firmincentive compensation versus, 3sales goals and, 375–376
objectives of incentive plannature of, 84setting new, 84–92
O.C. Tanner, 403Olsen, Ken, 145–146, 152–153Oracle, 481output orientation, 476
PAGE 495
outputsdefined, 125for incentive plan administration, 464–469in job value assessment, 125–126
outside sales roles, defining, 24
Patterson, John, 379–380pay-for-performance, 135, 136, 290–291pay level, 106, 107–139
company influences on, 125–132, 138–139compatibility of, 110–112, 113, 114consequences of, 108–109, 113, 114consistency of, 110, 113, 114, 124–125determining correct, 108–112, 115–137historical, 126–127information sources for determining pay levels, 120–
125, 281labor market value for position, 117, 119–125nature of, 103–104, 108overpaid salespeople, 108, 109, 113, 227, 228, 242–
243, 323–327range of sales force, 112–115sales force role in demand creation, 115–119, 136underpaid salespeople, 108, 109, 114, 323–327
pay mix, see salary-incentive mixpayout distribution
achievement of sales force objectives and, 239–243in MRG Company case study, 49, 55–57, 272,
276–281in progressive versus regressive plans, 237–243
pay reductions, implementation process for, 8–9payroll outputs, in incentive plan administration,
455–456pay variation
company influences on, 132–137, 139individual performance and, 132–135, 139nature of, 114–115number of job levels in, 135–137sales force culture and, 137salesperson tenure in, 135–137, 165
PeopleSoft, 481percent of remaining share method of goal setting,
356–357performance database, 274–276performance distribution analysis, 47, 57–59, 89performance evaluation ratings, 62–65, 90, 323performance frontier method of goal setting, 353–355performance grids, 132–135, 323performance management
compatibility with incentive compensation, 23, 420as Controller in sales force effectiveness, 21, 22goals controlled by, 328–330, see also sales force activi-
ties; salespeoplepay levels in, 112problems of, 45
performance measures, 106, 183–224appropriate, determining, 184–187, 191–224bias avoidance with, 194comparing to a goal, 210–214comparing to past performance, 210compatibility with other effectiveness drivers, 187,
192consequences of incentive compensation for, 187, 192consistency of, 187, 192data views in, 199, 200, 209–216focus of, 199, 200, 216–221implementation process for, 430–435measurability of, 192–193metrics in, 188, 198–209multiple types of, 196–198nature of, 104–105sales force activities and, 192, 193simplicity of, 196–198
................. 15869$ INDX 05-19-06 09:22:13 PS
496 Index
performance measures (continued)timing of, 199, 200, 221–224types of, 187–191
performance pay, 97–101, 117–119, 147–148, 165–170performance-payout relationships, 105, 106, 225–263
advantages and challenges of, 242appropriate, determining, 227–228, 239–240changing, 430–435criteria for evaluating, 241decision 1: bonus versus commission plans, 231–237,
261–262decision 3: capped versus non-capped plans, 231,
243–245, 250decision 4: pay from first dollar versus from goal or
fraction of goal, 231, 245–251decision 2: progressive versus regressive plans, 231,
237–243, 262decision 5: single versus multiple measures, 196–198,
231, 251–261, 262–263diagnosis of, 228, 229in mixed plans, 234–235representing, 228–231role of, 226–227
Phoenix Technologies, 69–70plan cost analysis
administrative costs of incentive plan, 74, 305breakdowns by product, 73–74, 91for candidate incentive plan, 276–281company results and, 47, 72–74, 81pay level in, 127–129
plan design, 34–36, 225–263add-on programs in, see recognition programs; sales
contests; SPIFFs (Special Performance Incentivesfor Field Force)
assessment in, see assessment processchallenge of, 17–19for change implementation, 437–438compatibility of, see compatibility with other effective-
ness driversconsequences of, see consequences of incentive com-
pensationconsistency of, see consistencyframework for, 18fundamentals of, 93–106goal setting in, see goal settingholistic view of, 106incentive plan administration and, 122, 369, 464,
473, 476–489input of sales force in, 295–301key decisions in, 103–106leverage in, 95–96, 135new plan objectives and, 83–92pay level in, see pay levelperformance measures in, see performance measuresperformance-payout relationships in, see performance-
payout relationshipsrecognition programs in, see recognition programsredesign principles, 84risk in, 96–97salary-incentive mix in, see salary-incentive mixsales contests in, see sales contestsSPIFFS in, see SPIFFs (Special Performance Incentives
for Field Force)terminology of, 93–106testing candidate plans, 291–295total pay components in, 94–96total sales components in, 97–103
plan health reports, 455–456, 465, 473, 474plan traction, 47, 53–57PNCBank, 131–132pocket cards, 447pods, 75–76point-based goals, 214
PAGE 496
points approach, 257–259PPG, 122process orientation, 476Procter & Gamble, 111product, as focus of performance measurement, 216,
217product assignment, fairness of, 59product life cycle
growth phase, 195, 196incentive pay plan and, 5–7, 9, 78–79, 164–165launch phase, 5–7, 9, 195, see also new productsmaturity phase, 195, 196performance measures and, 195–196salary-incentive mix and, 164–165
product salescorrelation with competitor’s sales, 337correlation with market sales for prior year, 336correlation with product sales for prior year, 335–336correlation with surrogate for market potential,
336–337profitability, pay levels and, 127–129profit metrics, for performance measurement, 201–203progressive plans, 231, 237–243, 262
advantages and challenges of, 242payout curves for, 238, 239–240
prominence, sales force, see sales force causality/prominence
Prosoft, 126pull reports, 475PurchasePro.com, 334push reports, 475
qualitative testsof candidate incentive plan, 268, 270–271, 295–306of incumbent incentive plan, 46–48, 65, 69–72, 74–
76, 82–83, 295–305, 307–309quality
of incentive plan administration, 475–476, 478–480of sales force, problems of, 45
quality assurance (QA), 475–476, 478–480quality control (QC), 475–476, 480–481quantitative tests
of candidate incentive plan, 268–295of incumbent incentive plan, 46–48, 50–68, 72–74,
268–271quick check analysis, 323, 325quotas, bias check for, 60–62
Radford Division, Aon Consulting, 122random sales, 101–103, 169–170ranking relative to peers, 215–216recognition programs, 403–407
design of, 404–407nature of, 379–380, 403–404
recruitingcompatibility with incentive compensation, 23pay levels in, 111, 112, 132problems of, 45sales contests and SPIFFs and, 394as Shaper of sales force effectiveness, 21, 22
recruiting interviews, as information source, 123Redden, Stephen, 465referrals, in cross-selling, 4–5, 385, 421–421regression method of goal setting, 352–353, 354regressive plans, 231, 237–243, 262
advantages and challenges of, 242payout curves for, 238, 240–243
reportscompliance, 466–469field management, 465, 471–472incentive plan administration, 465, 470–475plan health, 455–456, 465, 473–474
................. 15869$ INDX 05-19-06 09:22:14 PS
497Index
push versus pull, 475static versus dynamic, 475
results, see company results; customer resultsretention bonuses, 418retention of sales force
consequences of incentive compensation for, 43, 47,50–52
performance-payout relationships and, 235–237return on investment (ROI) analysis, 385–388rewards
as focus of performance measurement, 216–221individual versus team, 219
risk assessmentfor the company, 281–288for the salesperson, 96–97
RR Donnelley, 174
salary-incentive mix, 140–182actual pay mix, 94–95changes in, 424compatibility of, 143, 144, 145, 150–151consequences of, 143–149consistency of, 143, 144, 145, 149–150determining correct, 143–151, 160–170as driver of sales force compensation, 160–170effective pay mix, 147–148high percent incentive pay plans, 96, 135, 142, 144,
155–157, 158, 164implementation process for, 43, 423–430industry norms for, 173–174low percent incentive pay plans, 96, 135, 142–143,
145, 154–155, 156, 158, 164moderate percent incentive pay plans, 157, 158nature of, 104, 141–143pay for performance and, 135, 136, 290–291pros and cons of, 141range of, 151–160sales force causality and, 159–160, 165–170, 171–173sales force roles and, 153–157, 160–170scorecard for, 179–18270/30, 142–143, 159–160target pay mix, 94–95, 106
sales and marketing strategyconsistency of incentive compensation with, 10–11,
23, 48, 77–81as Definer of sales force effectiveness, 20, 21, 77–81problems of, 45salary-incentive mix and, 152–153
sales contestsad hoc, 43administration of, 400–401, 402–403, 459advantages and challenges of, 381–384design of, 380–384, 388–403determining effectiveness of, 384–388motivation and, 397nature of, 378–379sales goals and, 6, 43, 371
sales force activitiesbusiness development, 29–30consequences of incentive compensation for, 23, 26–
27, 47, 65–70, 108–109, 143–149, 301, 303engagement and excitement decomposition, 47,
67–68goal setting for, 328–330metrics for performance measurement, 188, 192, 193,
206–208motivation and, 66–68plan complexity and, 47, 69–70problems of, 45sales contests and SPIFFs and, 392–395in sales management system, 19, 20sales tracking analysis, 47, 66time allocation analysis, 47, 67
PAGE 497
sales force causality/prominencechanges in salary-incentive mix and, 424complexity of sales process and, 97–101, 117–119,
159–160, 165–170as driver of pay level and variation, 117–119nature of, 97–101performance measures and, 192, 193salary-incentive mix and, 159–160, 165–170,
171–173sales force culture
change in, 31–32in commission versus bonus plans, 236compatibility with incentive compensation, 23compatibility with other effectiveness drivers, 48, 81–
83, 150–151pay variation and, 137problems of, 45retention problems and, 43, 47, 50–52salary-incentive mix and, 144–146, 150–151, 152–
153, 158–160, 175–178sales contests and SPIFFs in, 400as Shaper of sales force effectiveness, 21, 22, 143–146
sales force customer power, 413sales force design
consistency of incentive compensation with, 23,77–81
defined, 22as Definer of sales force effectiveness, 21, 22, 77–81sales force compensation change and, 13, 25, 419
sales force hiring profile, 24–25, 420sales force prominence, see sales force causality/
prominencesales force roles
outside versus inside, 24pay alignment with, 118–119, 138, 139problems of, 45salary-incentive mix and, 153–157, 160–170Yerkes-Dodson law and, 162–163
sales goalsbenchmarking, 11–12, 331comparing performance to, 210–214consequences of incentive compensation for sales-
people and, 51, 227–228, 239–240, 242–243fairness of, 60incentive payment relative to, 231, 245–251multiproduct incentive plans and, 212–214for new products, 5–6, 7, 361–362, 373payment from first dollar, 231, 247–248sales contests and, 6, 43, 371setting, see goal settingSPIFFs and, 6for volatile markets, 263, 372–373
sales information and support systems, 420sales management system, 19–32
changes in incentive compensation and, 415–421company results, 19, 20, 23, see also company resultscomponents of, overview, 19–23customer results, 19, 20, 23, see also customer resultsdiagnosing sales force issues in, 29–32role of incentive compensation in, 23–29sales force activities, 19, 20, see also sales force activitiessales force effectiveness drivers, 19, 20–23, 42, see also
effectiveness drivers, of sales forcesalespeople, 19, 20, see also salespeople
salespeopleattitudes toward compensation plan, 65, 245, 295–
301, 425attraction and retention of, 50–52bias check for, 47, 59–62changes in sales force compensation and, 416–418consequences of incentive compensation for, 26, 47,
48–65, 108–109, 143–149, 295–301, 416–418goal allocation across, 321–327
................. 15869$ INDX 05-19-06 09:22:14 PS
498 Index
salespeople (continued)goal setting for, 328–330, see also goal settingincentive plan problems and, 265–267metrics for performance measurement, 188, 208–209motivation of, see motivationnew, implementation process for, 435overpaid, 108, 109, 113, 227, 228, 242–243,
323–327performance distribution analysis and, 47, 57–59, 89performance evaluation ratings, 62–65, 90, 323personality traits in automobile sales, 427rank ordering of, 374–375risks of incentive plan for, 96–97in sales management system, 19, 20underpaid, 108, 109, 114, 323–327see also effectiveness drivers, of sales force; sales force
activities; sales force causality/prominencesalesperson sales, 97–101, 117–119, 147–148, 165–170sales response method of goal setting, 357–359sales roster, 464sales territories
bias check for, 59–62goal setting for, 314–318, 326–327, 334–363in incentive plan administration, 464market potential of, 25, 30–31, 59, 227, 237, 262,
336–337, 338–343, 348–359, 362market share of, 25pay alignment with, 30–31, 41–43, 59, 149–150,
243–244realignment of, 433–435
sales tracking analysis, 47, 66SAP, 481scorecards
in incentive plan administration, 455–456, 465–470plan assessment, 47–48, 88–89, 268–271salary-incentive mix, 179–182
Searle, 404Sears Auto Center, 71–72selling process, in commission versus bonus plans, 236sensitivity analysis, of candidate incentive plan, 284–288,
291, 292, 293severance packages, 422shadow accounting, 459–460Shapers, 21, 22, 83, 143–146share growth method of goal setting, 355–356Shell Oil Company, 394Siebel Sales Analytics, 369, 473, 481single performance measures, 196–198, 231, 251, 252–
253, 262–263Slater Industrial Supply, 207–208Southern California Edison, 205–206SPIFFs (Special Performance Incentives for Field Force)
ad hoc, 43administration of, 400–401, 402–403, 459advantages and challenges of, 381–384design of, 380–384, 388–403determining effectiveness of, 384–388motivation and, 397nature of, 378–379sales goals and, 6, 43
Square D, 75start-up firms
changes in salary-incentive mix, 432–433incentive plan problems of, 265–266sales goals of, 212
static reports, 475stock options, in recognition programs, 404–405stretch goals, 373–374, 401–402synergistic matrix, 255, 256
PAGE 498
Synygy, 369, 481
Tandem Computers, 13–14target pay/incentive, 94–95, 112–114, see also incentive
compensation; salary-incentive mixtarget pay mix, 94–95, 106team selling
company results and, 75–76as focus of performance measurement, 216–221incentive plan administration and, 462salary-incentive mix and, 149–150, 174sales contests and SPIFFs and, 394sales force causality and, 166, 167–169
territory forecast method of goal setting, 346–348throughputs, 125–126time allocation analysis, 47, 67time-series analysis, 332, 385–388timing
of changes in sales incentive compensation, 450–451frequency of incentive payment, 221–223of incentive payment relative to order, 223–224nature of, 199in performance measurement, 199, 200, 221–224
Top Five Data Services, Inc., 122total pay, 94–96total sales, 97–103Towers Perrin, 122training
for changes in sales incentive compensation plan,443–449
compatibility with incentive compensation, 23misdirection problems and, 43pay levels in, 112, 132as Shaper of sales force effectiveness, 21, 22
TruStar Solutions, 151turnover of sales force
changes in compensation plan and, 13, 25, 31, 429consequences of incentive compensation for, 50–52exit interviews in analyzing, 51–52, 123pay level and, 108, 131pay variation and, 137sales force culture and, 43sales goals and, 318
Universal Certificate Group, 403US West, 19
variable pay/compensation, 141–142, 144, see also in-centive compensation; salary-incentive mix
vertical communication, as Controller in sales force effec-tiveness, 21, 22
W. L. Gore, 82–83Wal-Mart, 169Watson Wyatt Data Services, 122weighted index method of goal setting, 351–352, 364weighted-measures approach, 253–255Western Management Group, Inc., 122Westinghouse, 75–76who gets helped/who gets hurt analysis, 288–290, 294,
414, 431windfalls, 101–103, 169–170, 319–320Wm. H. Mercer Inc., 122WorldCom, 422–423
Yellow Pages advertising, activities goals for, 329–330Yerkes, Robert M., 162–163Yerkes-Dodson law, 162–163
ZS Associates, 369, 465, 481
................. 15869$ INDX 05-19-06 09:22:15 PS