THE COMPETITIVENESS OF RED ONION …web.stanford.edu/group/FRI/indonesia/research/onion.pdfTHE...
20
THE COMPETITIVENESS OF RED ONION PRODUCTION IN BREBES, CENTRAL JAVA by Joko Sutrisno Sugihardjo Boedi R. Kaliman Faculty of Agriculture Sebelas Maret University November, 2003
-
Upload
truongkien -
Category
Documents
-
view
215 -
download
0
Transcript of THE COMPETITIVENESS OF RED ONION …web.stanford.edu/group/FRI/indonesia/research/onion.pdfTHE...
THE COMPETITIVENESS OF RED ONION PRODUCTION IN BREBES, CENTRAL JAVA
by
Joko Sutrisno Sugihardjo
Boedi R. Kaliman
Faculty of Agriculture Sebelas Maret University
November, 2003

Table of Contents SUMMARY .................................................. ................................................................... 3 1. INTRODUCTION....................................
1.1. Background................................
1.2. Objective ....................................
2. RESEARCH METHOD ..........................
3. RESEARCH RESULTS AND ANALYS
3.1. Description of Research Sites ...
3.2. The Policy Analysis Matrix .......3.2.1. Assumptions...........3.2.2 Input-Output Relatio3.2.3. Private Prices........3.2.4. Private Budget........3.2.5. Parity Prices for Ou3.2.6. Social Prices ...........3.2.7. Social Budget .........3.2.8. PAM Results .........
4. CONCLUSION AND POLICY IMPLIC
4.1. Conclusion ................................
4.2. Policy Implications ...................
2
..
..................................................................... 4
..................................................................... 4
..................................................................... 4
..................................................................... 4 IS ................................................................ 5 ..................................................................... 5 ..................................................................... 6 ............................................................... 6 nships ................................................... 7
............................................................... 9
............................................................. 11 tputs and Inputs ................................... 12 ............................................................. 14 ............................................................. 16 ............................................................. 18 ATIONS .................................................. 19
................................................................... 19
................................................................... 20
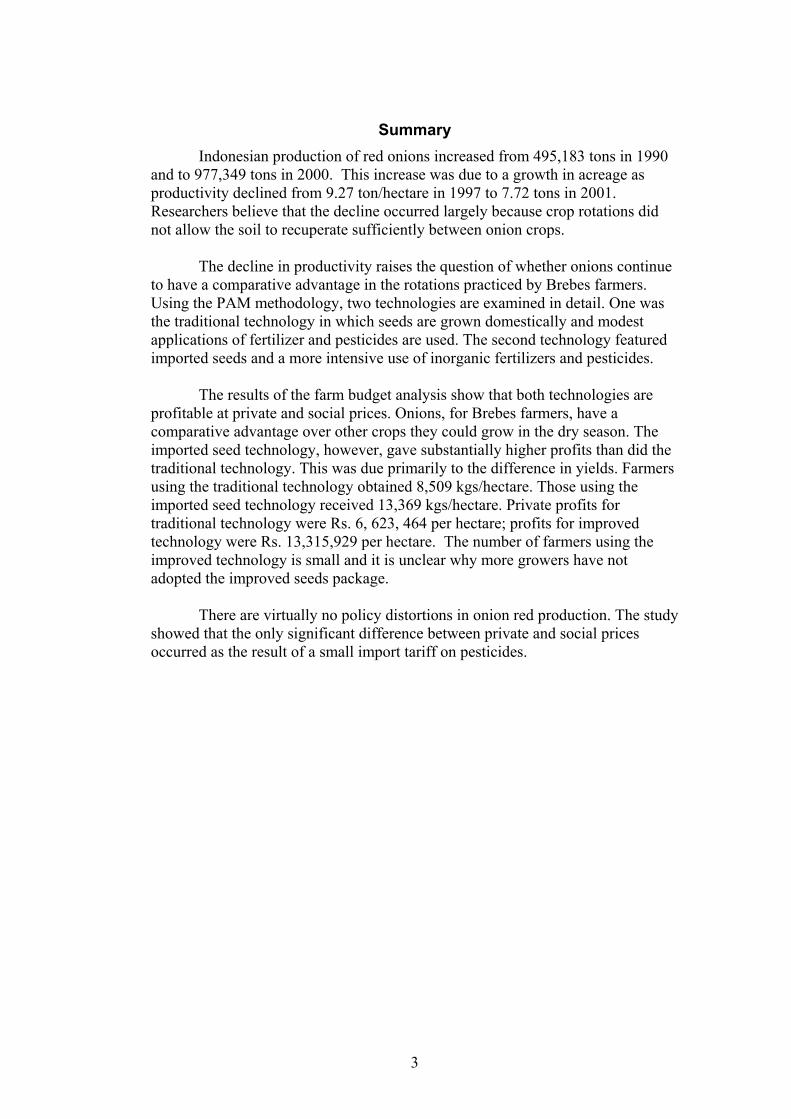
Summary Indonesian production of red onions increased from 495,183 tons in 1990
and to 977,349 tons in 2000. This increase was due to a growth in acreage as productivity declined from 9.27 ton/hectare in 1997 to 7.72 tons in 2001. Researchers believe that the decline occurred largely because crop rotations did not allow the soil to recuperate sufficiently between onion crops.
The decline in productivity raises the question of whether onions continue
to have a comparative advantage in the rotations practiced by Brebes farmers. Using the PAM methodology, two technologies are examined in detail. One was the traditional technology in which seeds are grown domestically and modest applications of fertilizer and pesticides are used. The second technology featured imported seeds and a more intensive use of inorganic fertilizers and pesticides.
The results of the farm budget analysis show that both technologies are
profitable at private and social prices. Onions, for Brebes farmers, have a comparative advantage over other crops they could grow in the dry season. The imported seed technology, however, gave substantially higher profits than did the traditional technology. This was due primarily to the difference in yields. Farmers using the traditional technology obtained 8,509 kgs/hectare. Those using the imported seed technology received 13,369 kgs/hectare. Private profits for traditional technology were Rs. 6, 623, 464 per hectare; profits for improved technology were Rs. 13,315,929 per hectare. The number of farmers using the improved technology is small and it is unclear why more growers have not adopted the improved seeds package.
There are virtually no policy distortions in onion red production. The study
showed that the only significant difference between private and social prices occurred as the result of a small import tariff on pesticides.
3
1. Introduction
1.1. Background
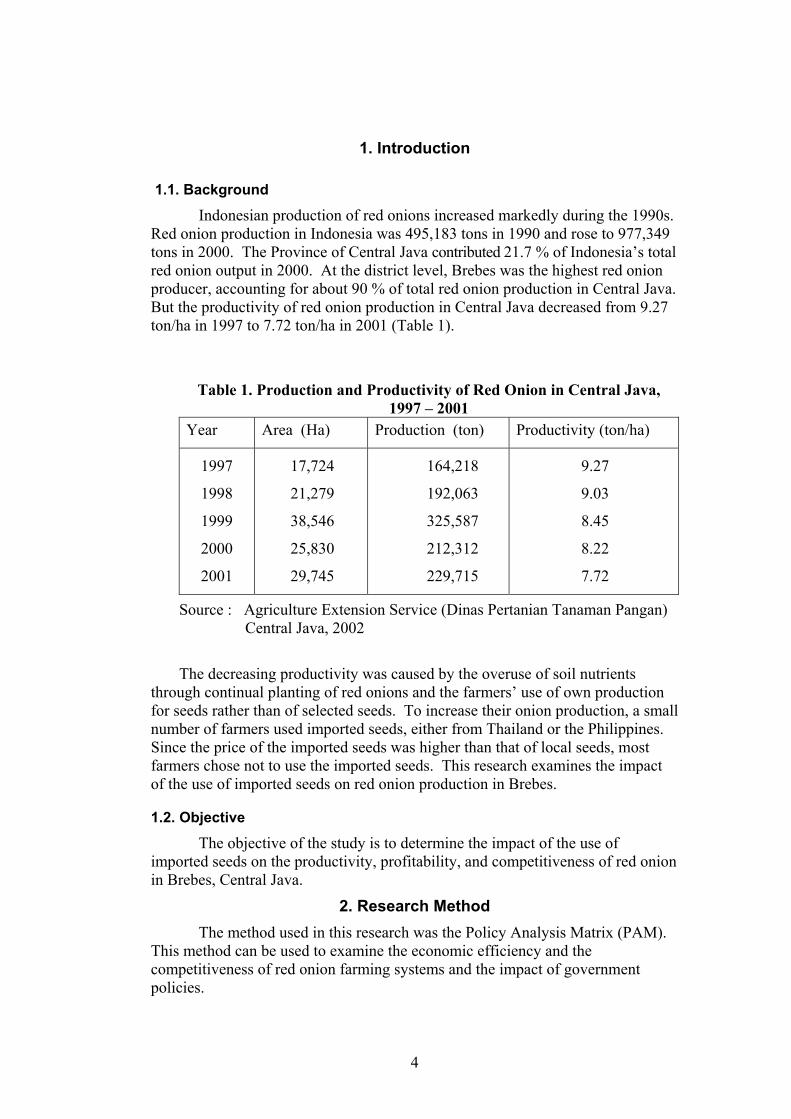
Indonesian production of red onions increased markedly during the 1990s. Red onion production in Indonesia was 495,183 tons in 1990 and rose to 977,349 tons in 2000. The Province of Central Java contributed 21.7 % of Indonesia’s total red onion output in 2000. At the district level, Brebes was the highest red onion producer, accounting for about 90 % of total red onion production in Central Java. But the productivity of red onion production in Central Java decreased from 9.27 ton/ha in 1997 to 7.72 ton/ha in 2001 (Table 1).
Table 1. Production and Productivity of Red Onion in Central Java, 1997 – 2001
Year Area (Ha) Production (ton) Productivity (ton/ha)
1997
1998
1999
2000
2001
17,724
21,279
38,546
25,830
29,745
164,218
192,063
325,587
212,312
229,715
9.27
9.03
8.45
8.22
7.72
Source : Agriculture Extension Service (Dinas Pertanian Tanaman Pangan) Central Java, 2002
The decreasing productivity was caused by the overuse of soil nutrients through continual planting of red onions and the farmers’ use of own production for seeds rather than of selected seeds. To increase their onion production, a small number of farmers used imported seeds, either from Thailand or the Philippines. Since the price of the imported seeds was higher than that of local seeds, most farmers chose not to use the imported seeds. This research examines the impact of the use of imported seeds on red onion production in Brebes.
1.2. Objective
The objective of the study is to determine the impact of the use of imported seeds on the productivity, profitability, and competitiveness of red onion in Brebes, Central Java.
2. Research Method The method used in this research was the Policy Analysis Matrix (PAM).
This method can be used to examine the economic efficiency and the competitiveness of red onion farming systems and the impact of government policies.
4
The data used to construct the red onion PAMs were costs and revenues at the farm level, measured in both private and social prices. This information was obtained through face-to-face interviews with farmers.
The sample of farmers to interview was drawn from two sub-districts of Brebes District. Complete budget data were obtained from a sample of 40 farmers. The sample included 20 farmers who planted local red onion seeds and another 20 farmers who used imported seeds.
The inputs used in red onion production were divided into tradable and nontradable categories. Supporting data included the import price of red onions, the regional inflation rate, and the national exchange rate. That secondary information was obtained from official publications of government and donor agencies, including the BPS (Central Bureau of Statistics), FAO, World Bank, and the Bank of Indonesia.
With inputs from primary and secondary data, the full PAMs for red onion production were derived. To facilitate the compilation of the PAMs, the data were arranged into a nested series of tables: (1) Assumptions, (2) Input-output, (3) Private prices, (4) Private budget, (4) Import parity prices, (5) Social prices, (6) Social budget, (7) PAMs and, (8) Ratios that indicate policy distortions and degrees of efficiency.
3. Research Results and Analysis
3.1. Description of Research Sites
The district of Brebes lies in the northern part of the western side of Central Java Province, between 108o41’37,7” – 109o11’28,92” Eastern Longitude and 6o44’56,5” – 7o20’51,48” Southern Latitude. To the north is the Java Sea, to the east lie the District of Tegal and Tegal City, to the south is the sub-province of Banyumas, and to the west is the sub-province of Cirebon
Based on the Schimdt-Fergusson classification, the climate of Brebes District
is categorized as a wet (or C) climate. This type of climate is suitable for red onion farming, because red onions require little moisture during the planting season but a lot of water during the growing period. The average temperature in Brebes District is 26,22 0C, an ideal temperature for red onion production.
The total area of Brebes District is 166,117 hectares. Land allocation
includes 63,353 hectares of lowland rice (paddy area), 18,492 hectares of gardens/buildings, 17,757 hectares of dry land/plantation, 7,984 hectares of fish-pond/swampy area, 4,400 hectares of community forest/woody plants, 49,050 hectares of national forest, 774 hectares of state/private estate, and 4,307 hectares of others. Red onions are cultivated in the lowland (paddy) area. The typical seasonal cropping patterns during one year are paddy–red onion–red onion, paddy–red onion–vegetables, and red onion–red onion–red onion. For this
5

research, observations were taken only in one planting season, the second planting season, because imported seeds could be planted only during that period.
In recent years, the production of red onions in Brebes fluctuated because of wide swings in harvested area. But the productivity of red onions has steadily declined. The productivity (yield) decreased from 97.91 quintals/hectare (9.791 tons/hectare) in 1998 to 81.06 quintals/hectare in 2001. The production, harvested area, and productivity of red onions in Brebes between 1998 and 2001 are shown in Table 2.
Table 2. Harvested Area, Production, and Productivity of Red
Onions in Brebes District, 1998 – 2001
Year Harvested Area (hectare)
Production (quintal)
Productivity (quintal/hectare)
1998 1999 2000 2001
15,242 26,578 16,993 21,333
1,492,410 2,444,562 1,529,241 1,729,246
97.91 91.98 89.99 81.06
Source : Central Statistic Bureau District of Brebes, 2001 Most of the red onion seeds planted by farmers in Brebes are local varieties.
Only a small number of farmers planted imported seeds. The farmers interviewed had an average productivity of 13.37 tons/hectare if they planted imported red onion seeds, 57 percent above the average yield of farmers planting local seeds (8.51 tons/hectare). But the imported seeds can be cultivated only in fertile land and planted only in the dry season (around July). Attempts to plant imported red onion seeds in the first or third seasons generally fail because of excessive rainfall.
3.2. The Policy Analysis Matrix
3.2.1. Assumptions
The real private interest rate per annum was 20%, the nominal interest rate observed in the villages adjusted for inflation. Working capital for many farmers was obtained from the People’s Credit Bank (Bank Perkreditan Rakyat/BPR) or the Ministry of Cooperatives (Koperasi) in the villages. The nominal interest rate of loans was 30 % per year, and the inflation rate was 10 % per year. Hence, the real private interest rate was 20 % per year or 6.7 % per season. The real social interest rate per annum was estimated to be 13 % (adjusted for inflation), so that the real social interest rate per season was 4.3 %. The official exchange rate was observed to be Rp 9,000/US$. An average tax rate of 10% was levied on pesticide inputs.
6
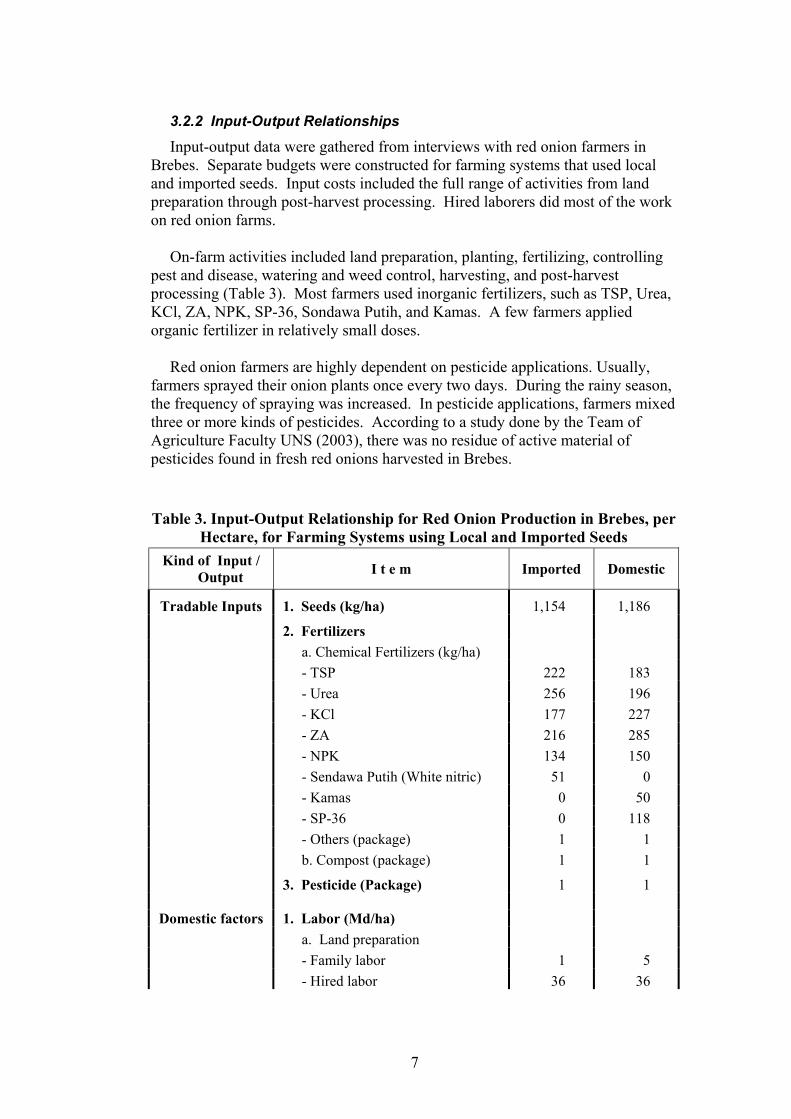
3.2.2 Input-Output Relationships
Input-output data were gathered from interviews with red onion farmers in Brebes. Separate budgets were constructed for farming systems that used local and imported seeds. Input costs included the full range of activities from land preparation through post-harvest processing. Hired laborers did most of the work on red onion farms.
On-farm activities included land preparation, planting, fertilizing, controlling
pest and disease, watering and weed control, harvesting, and post-harvest processing (Table 3). Most farmers used inorganic fertilizers, such as TSP, Urea, KCl, ZA, NPK, SP-36, Sondawa Putih, and Kamas. A few farmers applied organic fertilizer in relatively small doses.
Red onion farmers are highly dependent on pesticide applications. Usually,
farmers sprayed their onion plants once every two days. During the rainy season, the frequency of spraying was increased. In pesticide applications, farmers mixed three or more kinds of pesticides. According to a study done by the Team of Agriculture Faculty UNS (2003), there was no residue of active material of pesticides found in fresh red onions harvested in Brebes.
Table 3. Input-Output Relationship for Red Onion Production in Brebes, per
Hectare, for Farming Systems using Local and Imported Seeds Kind of Input /
Output I t e m Imported Domestic
Tradable Inputs 1. Seeds (kg/ha) 1,154 1,186
2. Fertilizers a. Chemical Fertilizers (kg/ha) - TSP 222 183 - Urea 256 196 - KCl 177 227 - ZA 216 285 - NPK 134 150 - Sendawa Putih (White nitric) 51 0 - Kamas 0 50 - SP-36 0 118 - Others (package) 1 1 b. Compost (package) 1 1 3. Pesticide (Package) 1 1
Domestic factors 1. Labor (Md/ha) a. Land preparation - Family labor 1 5 - Hired labor 36 36
7
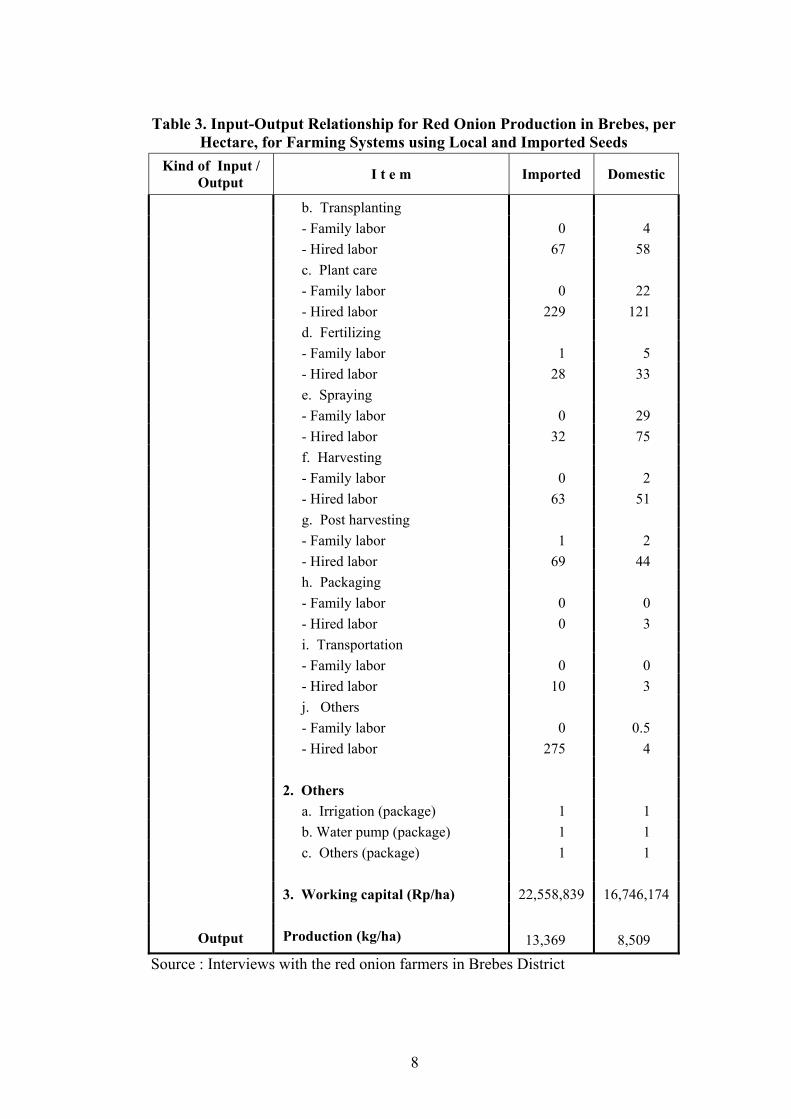
Table 3. Input-Output Relationship for Red Onion Production in Brebes, per Hectare, for Farming Systems using Local and Imported Seeds
Kind of Input / Output I t e m Imported Domestic
b. Transplanting - Family labor 0 4 - Hired labor 67 58 c. Plant care - Family labor 0 22 - Hired labor 229 121 d. Fertilizing - Family labor 1 5 - Hired labor 28 33 e. Spraying - Family labor 0 29 - Hired labor 32 75 f. Harvesting - Family labor 0 2 - Hired labor 63 51 g. Post harvesting - Family labor 1 2 - Hired labor 69 44 h. Packaging - Family labor 0 0 - Hired labor 0 3 i. Transportation - Family labor 0 0 - Hired labor 10 3 j. Others - Family labor 0 0.5 - Hired labor 275 4 2. Others a. Irrigation (package) 1 1 b. Water pump (package) 1 1 c. Others (package) 1 1 3. Working capital (Rp/ha) 22,558,839 16,746,174
Output Production (kg/ha) 13,369 8,509
Source : Interviews with the red onion farmers in Brebes District
8
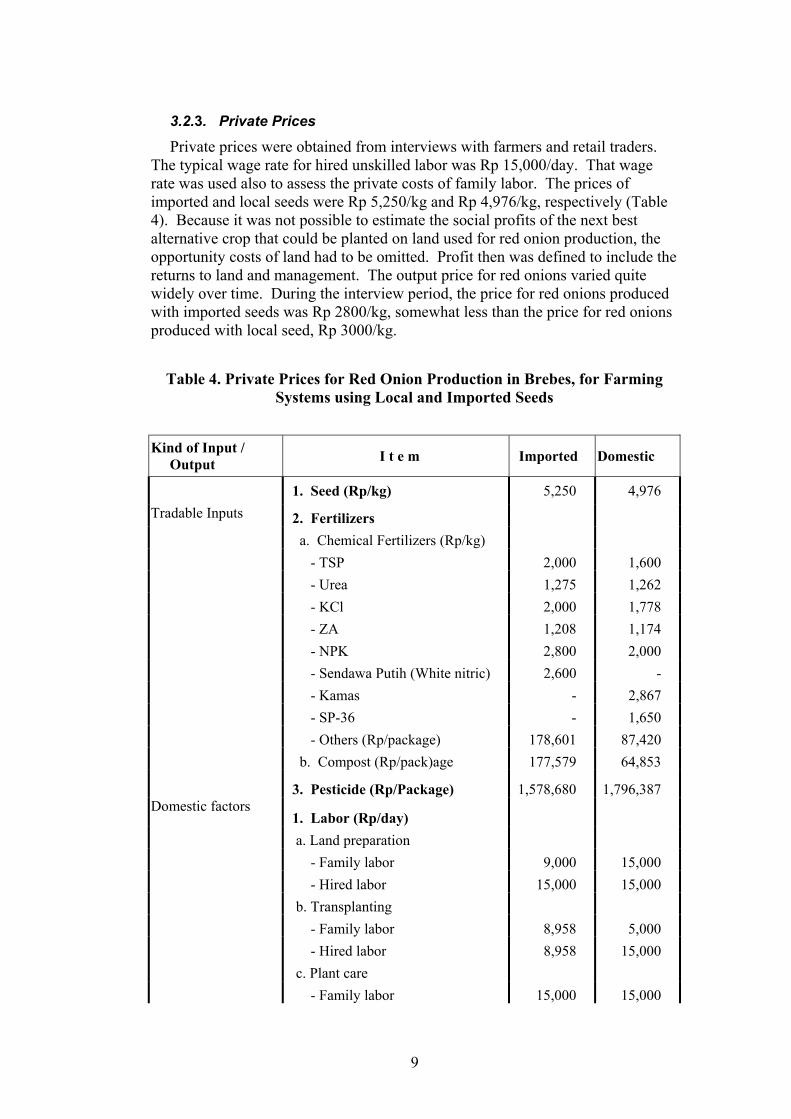
3.2.3. Private Prices
Private prices were obtained from interviews with farmers and retail traders. The typical wage rate for hired unskilled labor was Rp 15,000/day. That wage rate was used also to assess the private costs of family labor. The prices of imported and local seeds were Rp 5,250/kg and Rp 4,976/kg, respectively (Table 4). Because it was not possible to estimate the social profits of the next best alternative crop that could be planted on land used for red onion production, the opportunity costs of land had to be omitted. Profit then was defined to include the returns to land and management. The output price for red onions varied quite widely over time. During the interview period, the price for red onions produced with imported seeds was Rp 2800/kg, somewhat less than the price for red onions produced with local seed, Rp 3000/kg.
Table 4. Private Prices for Red Onion Production in Brebes, for Farming Systems using Local and Imported Seeds
Kind of Input /
Output I t e m Imported Domestic
1. Seed (Rp/kg) 5,250 4,976 Tradable Inputs 2. Fertilizers a. Chemical Fertilizers (Rp/kg) - TSP 2,000 1,600 - Urea 1,275 1,262 - KCl 2,000 1,778 - ZA 1,208 1,174 - NPK 2,800 2,000 - Sendawa Putih (White nitric) 2,600 - - Kamas - 2,867 - SP-36 - 1,650 - Others (Rp/package) 178,601 87,420 b. Compost (Rp/pack)age 177,579 64,853
3. Pesticide (Rp/Package) 1,578,680 1,796,387 Domestic factors
1. Labor (Rp/day) a. Land preparation - Family labor 9,000 15,000 - Hired labor 15,000 15,000 b. Transplanting - Family labor 8,958 5,000 - Hired labor 8,958 15,000 c. Plant care - Family labor 15,000 15,000
9
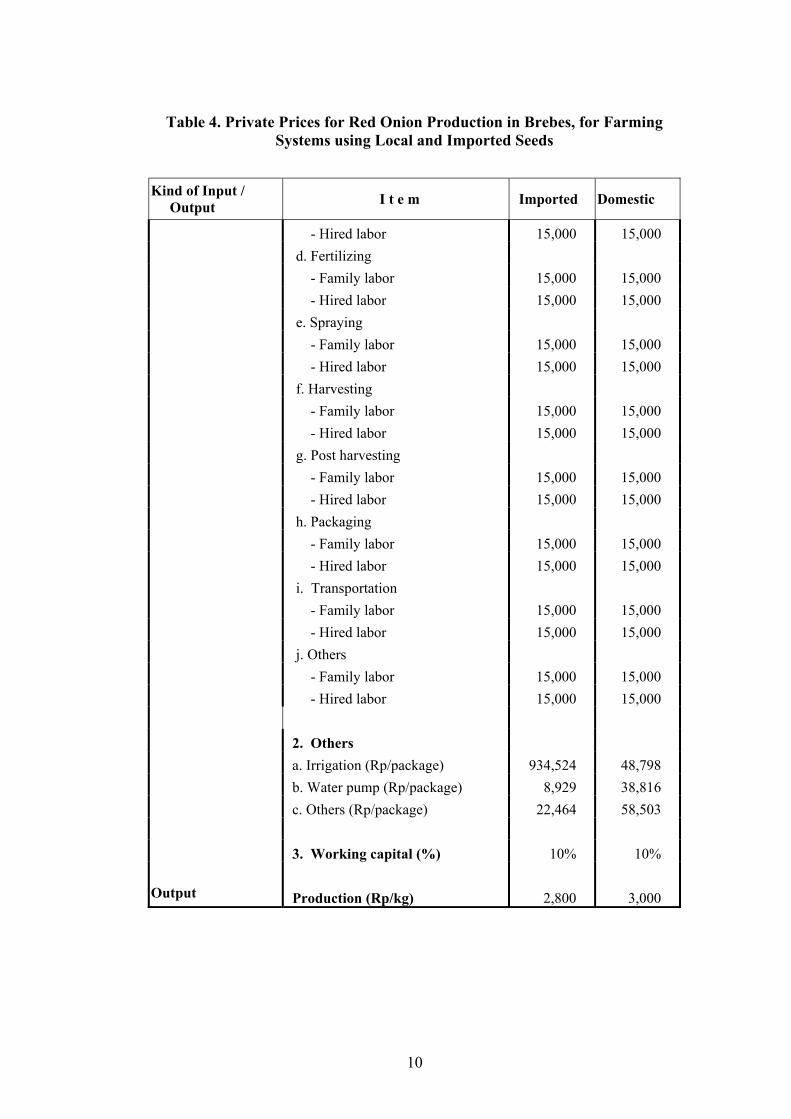
Table 4. Private Prices for Red Onion Production in Brebes, for Farming Systems using Local and Imported Seeds
Kind of Input /
Output I t e m Imported Domestic
- Hired labor 15,000 15,000 d. Fertilizing - Family labor 15,000 15,000 - Hired labor 15,000 15,000 e. Spraying - Family labor 15,000 15,000 - Hired labor 15,000 15,000 f. Harvesting - Family labor 15,000 15,000 - Hired labor 15,000 15,000 g. Post harvesting - Family labor 15,000 15,000 - Hired labor 15,000 15,000 h. Packaging - Family labor 15,000 15,000 - Hired labor 15,000 15,000 i. Transportation - Family labor 15,000 15,000 - Hired labor 15,000 15,000 j. Others - Family labor 15,000 15,000 - Hired labor 15,000 15,000 2. Others a. Irrigation (Rp/package) 934,524 48,798 b. Water pump (Rp/package) 8,929 38,816 c. Others (Rp/package) 22,464 58,503 3. Working capital (%) 10% 10% Output Production (Rp/kg) 2,800 3,000
10

3.2.4. Private Budget
The private budget provides the entries for the first row of the PAM. In PAM research, the private budget is calculated by multiplying the physical input-output relationships (Table 3) by the counterpart private prices (Table 4).
Table 5. Private Budget for Red Onion Production in Brebes, for Farming Systems using Local and Imported Seeds (Rp per Hectare)
Kind of Input / Output I t e m Imported Domestic
Tradable Inputs 1. Seed 6,057,813 5,903,227 2. Fertilizers a. Chemical Fertilizers - TSP 444,841 293,263 - Urea 295,558 245,932 - KCl 353,175 402,956 - ZA 261,386 334,981 - NPK 374,722 300,275 - Sendawa Putih (White nitric) 132,837 - - Kamas - 144,308 - SP-36 - 194,316 - Others 178,601 87,420 b. Compost 177,579 464,853 3. Pesticide 1,578,680 1,796,387 Domestic factors 1. Labor a. Land preparation - Family labor 6,429 73,673 - Hired labor 537,054 543,389 b. Transplanting - Family labor - 60,238 - Hired labor 598,555 873,479 c. Plant care - Family labor - 329,932 - Hired labor 3,437,314 1,818,852 d. Fertilizing - Family labor 21,429 69,796 - Hired labor 414,509 497,201 e. Spraying - Family labor - 438,469 - Hired labor 486,458 1,118,133 f. Harvesting - Family labor 5,357 23,946 - Hired labor 943,452 762,705 g. Post harvesting - Family labor 21,429 30,340 - Hired labor 1,041,220 666,303 h. Packaging - Family labor - 1,020
11
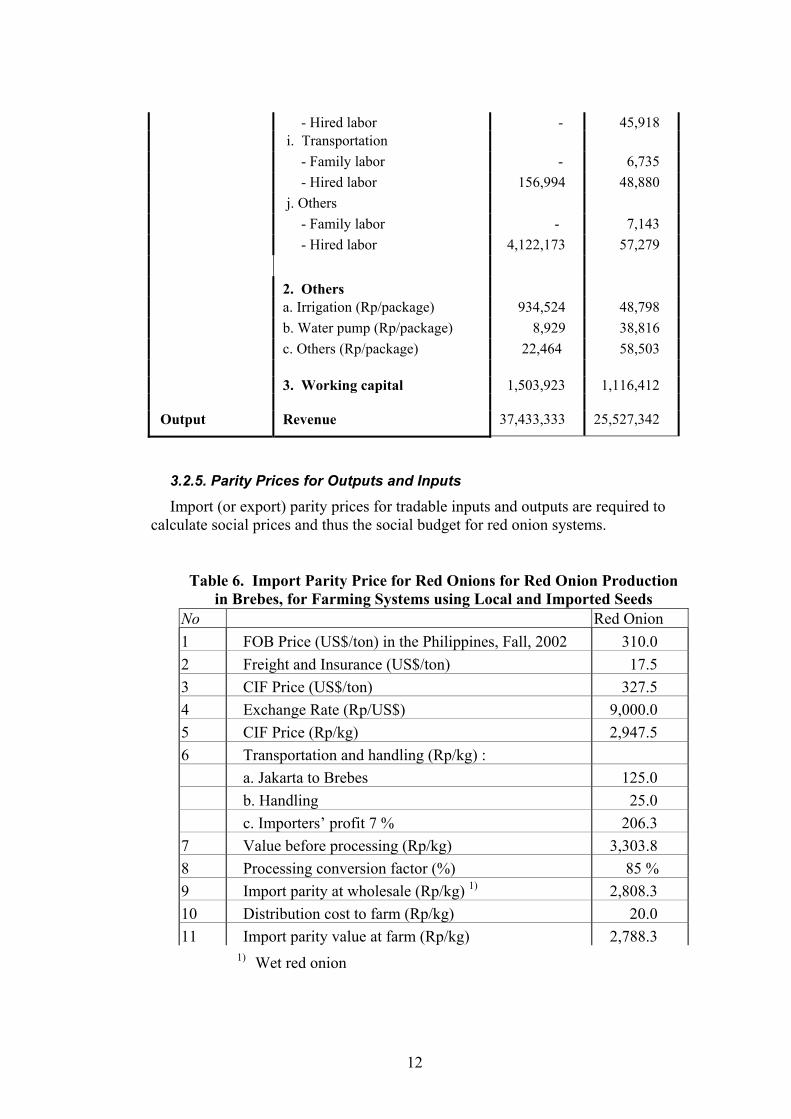
- Hired labor - 45,918 i. Transportation - Family labor - 6,735 - Hired labor 156,994 48,880 j. Others - Family labor - 7,143 - Hired labor 4,122,173 57,279 2. Others a. Irrigation (Rp/package) 934,524 48,798 b. Water pump (Rp/package) 8,929 38,816 c. Others (Rp/package) 22,464 58,503 3. Working capital 1,503,923 1,116,412 Output Revenue 37,433,333 25,527,342
3.2.5. Parity Prices for Outputs and Inputs
Import (or export) parity prices for tradable inputs and outputs are required to calculate social prices and thus the social budget for red onion systems.
Table 6. Import Parity Price for Red Onions for Red Onion Production in Brebes, for Farming Systems using Local and Imported Seeds
No Red Onion 1 FOB Price (US$/ton) in the Philippines, Fall, 2002 310.0 2 Freight and Insurance (US$/ton) 17.5 3 CIF Price (US$/ton) 327.5 4 Exchange Rate (Rp/US$) 9,000.0 5 CIF Price (Rp/kg) 2,947.5 6 Transportation and handling (Rp/kg) : a. Jakarta to Brebes 125.0 b. Handling 25.0 c. Importers’ profit 7 % 206.3 7 Value before processing (Rp/kg) 3,303.8 8 Processing conversion factor (%) 85 % 9 Import parity at wholesale (Rp/kg) 1) 2,808.3 10 Distribution cost to farm (Rp/kg) 20.0 11 Import parity value at farm (Rp/kg) 2,788.3
1) Wet red onion
12
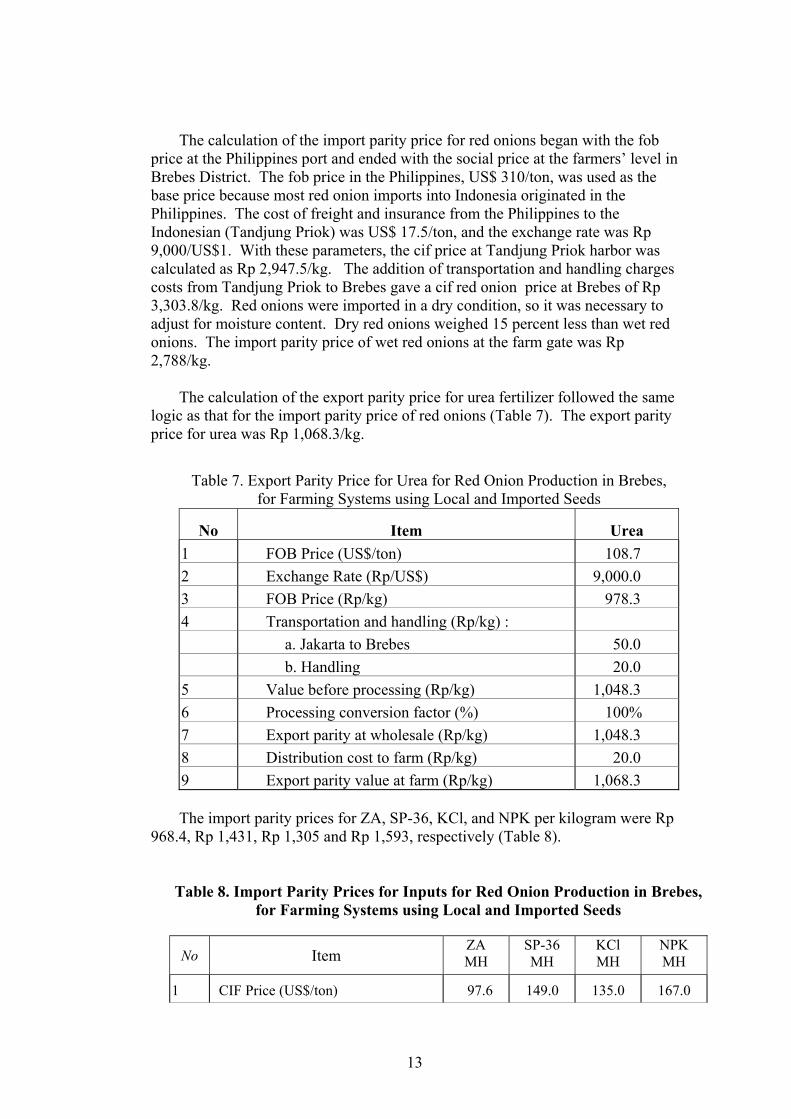
The calculation of the import parity price for red onions began with the fob
price at the Philippines port and ended with the social price at the farmers’ level in Brebes District. The fob price in the Philippines, US$ 310/ton, was used as the base price because most red onion imports into Indonesia originated in the Philippines. The cost of freight and insurance from the Philippines to the Indonesian (Tandjung Priok) was US$ 17.5/ton, and the exchange rate was Rp 9,000/US$1. With these parameters, the cif price at Tandjung Priok harbor was calculated as Rp 2,947.5/kg. The addition of transportation and handling charges costs from Tandjung Priok to Brebes gave a cif red onion price at Brebes of Rp 3,303.8/kg. Red onions were imported in a dry condition, so it was necessary to adjust for moisture content. Dry red onions weighed 15 percent less than wet red onions. The import parity price of wet red onions at the farm gate was Rp 2,788/kg.
The calculation of the export parity price for urea fertilizer followed the same logic as that for the import parity price of red onions (Table 7). The export parity price for urea was Rp 1,068.3/kg.
Table 7. Export Parity Price for Urea for Red Onion Production in Brebes, for Farming Systems using Local and Imported Seeds
No Item Urea 1 FOB Price (US$/ton) 108.7 2 Exchange Rate (Rp/US$) 9,000.0 3 FOB Price (Rp/kg) 978.3 4 Transportation and handling (Rp/kg) : a. Jakarta to Brebes 50.0 b. Handling 20.0 5 Value before processing (Rp/kg) 1,048.3 6 Processing conversion factor (%) 100% 7 Export parity at wholesale (Rp/kg) 1,048.3 8 Distribution cost to farm (Rp/kg) 20.0 9 Export parity value at farm (Rp/kg) 1,068.3
The import parity prices for ZA, SP-36, KCl, and NPK per kilogram were Rp
968.4, Rp 1,431, Rp 1,305 and Rp 1,593, respectively (Table 8).
Table 8. Import Parity Prices for Inputs for Red Onion Production in Brebes, for Farming Systems using Local and Imported Seeds
No Item ZA MH
SP-36 MH
KCl MH
NPK MH
1 CIF Price (US$/ton) 97.6 149.0 135.0 167.0
13
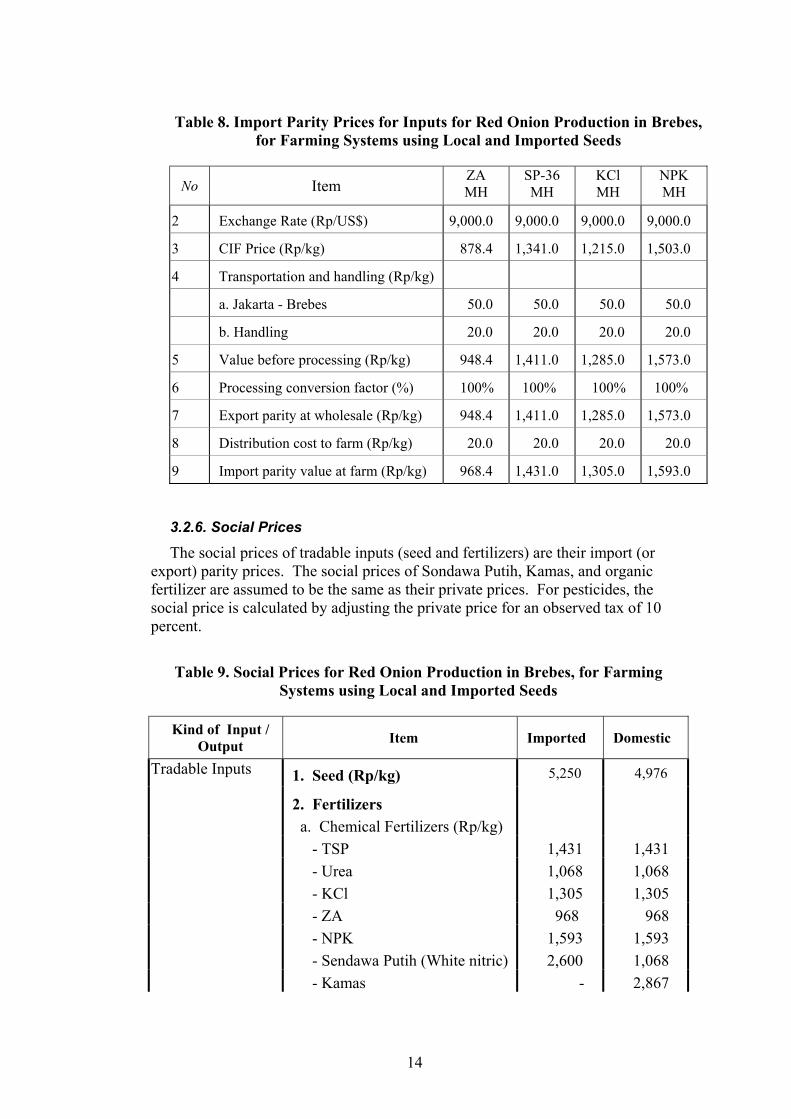
Table 8. Import Parity Prices for Inputs for Red Onion Production in Brebes, for Farming Systems using Local and Imported Seeds
No Item ZA MH
SP-36 MH
KCl MH
NPK MH
2 Exchange Rate (Rp/US$) 9,000.0 9,000.0 9,000.0 9,000.0
3 CIF Price (Rp/kg) 878.4 1,341.0 1,215.0 1,503.0
4 Transportation and handling (Rp/kg)
a. Jakarta - Brebes 50.0 50.0 50.0 50.0
b. Handling 20.0 20.0 20.0 20.0
5 Value before processing (Rp/kg) 948.4 1,411.0 1,285.0 1,573.0
6 Processing conversion factor (%) 100% 100% 100% 100%
7 Export parity at wholesale (Rp/kg) 948.4 1,411.0 1,285.0 1,573.0
8 Distribution cost to farm (Rp/kg) 20.0 20.0 20.0 20.0
9 Import parity value at farm (Rp/kg) 968.4 1,431.0 1,305.0 1,593.0
3.2.6. Social Prices
The social prices of tradable inputs (seed and fertilizers) are their import (or export) parity prices. The social prices of Sondawa Putih, Kamas, and organic fertilizer are assumed to be the same as their private prices. For pesticides, the social price is calculated by adjusting the private price for an observed tax of 10 percent.
Table 9. Social Prices for Red Onion Production in Brebes, for Farming Systems using Local and Imported Seeds
Kind of Input /
Output Item Imported Domestic
Tradable Inputs 1. Seed (Rp/kg) 5,250 4,976 2. Fertilizers
a. Chemical Fertilizers (Rp/kg) - TSP 1,431 1,431 - Urea 1,068 1,068 - KCl 1,305 1,305 - ZA 968 968 - NPK 1,593 1,593 - Sendawa Putih (White nitric) 2,600 1,068 - Kamas - 2,867
14
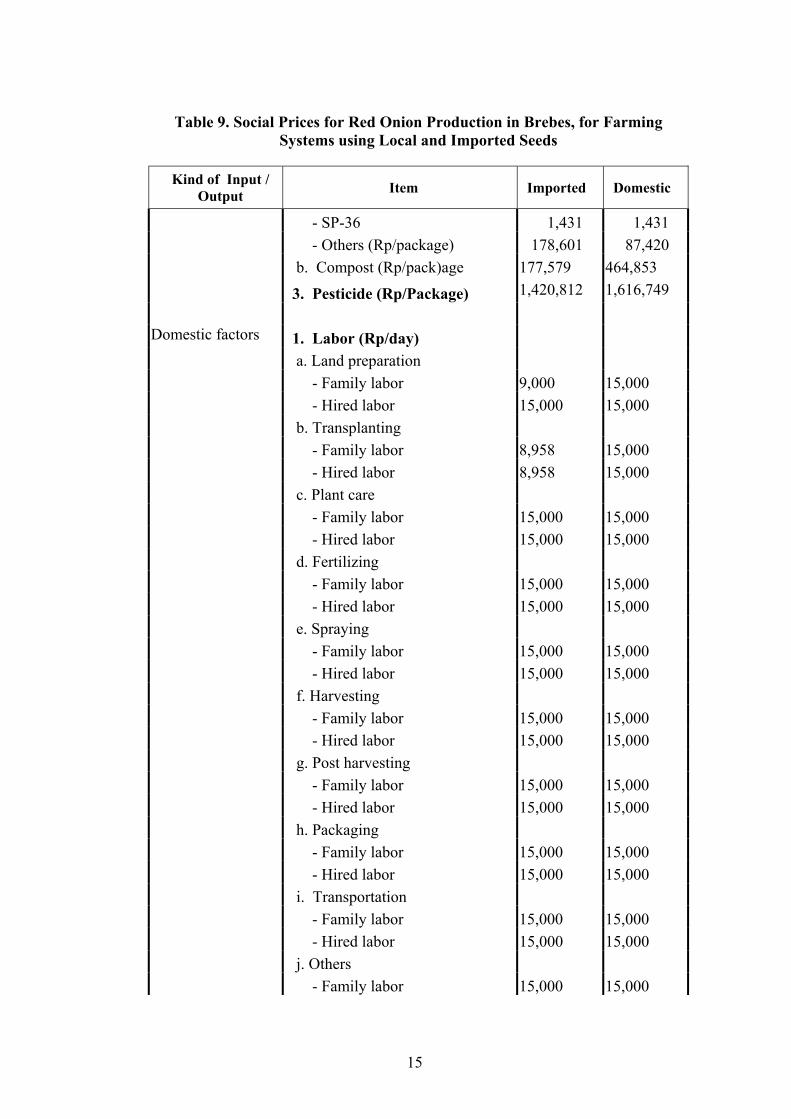
Table 9. Social Prices for Red Onion Production in Brebes, for Farming Systems using Local and Imported Seeds
Kind of Input /
Output Item Imported Domestic
- SP-36 1,431 1,431 - Others (Rp/package) 178,601 87,420 b. Compost (Rp/pack)age 177,579 464,853 3. Pesticide (Rp/Package) 1,420,812 1,616,749
Domestic factors 1. Labor (Rp/day) a. Land preparation - Family labor 9,000 15,000 - Hired labor 15,000 15,000 b. Transplanting - Family labor 8,958 15,000 - Hired labor 8,958 15,000 c. Plant care - Family labor 15,000 15,000 - Hired labor 15,000 15,000 d. Fertilizing - Family labor 15,000 15,000 - Hired labor 15,000 15,000 e. Spraying - Family labor 15,000 15,000 - Hired labor 15,000 15,000 f. Harvesting - Family labor 15,000 15,000 - Hired labor 15,000 15,000 g. Post harvesting - Family labor 15,000 15,000 - Hired labor 15,000 15,000 h. Packaging - Family labor 15,000 15,000 - Hired labor 15,000 15,000 i. Transportation - Family labor 15,000 15,000 - Hired labor 15,000 15,000 j. Others - Family labor 15,000 15,000
15
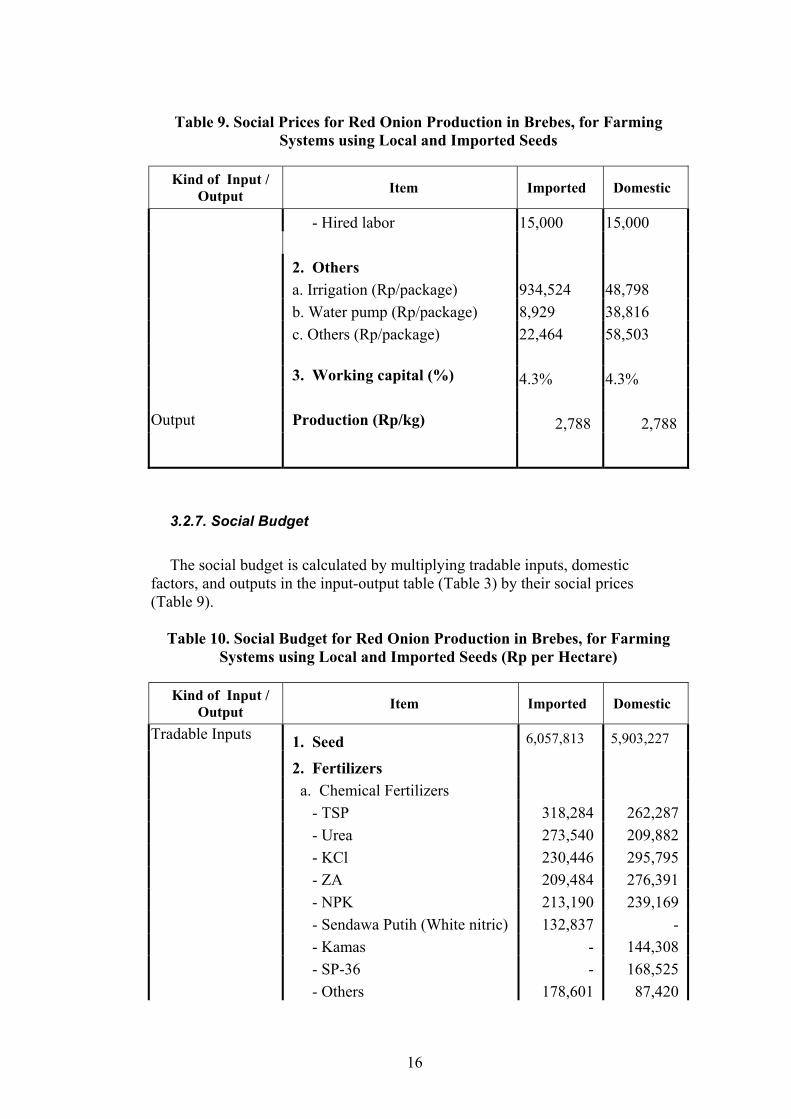
Table 9. Social Prices for Red Onion Production in Brebes, for Farming Systems using Local and Imported Seeds
Kind of Input /
Output Item Imported Domestic
- Hired labor 15,000 15,000 2. Others a. Irrigation (Rp/package) 934,524 48,798 b. Water pump (Rp/package) 8,929 38,816 c. Others (Rp/package) 22,464 58,503 3. Working capital (%) 4.3% 4.3%
Output Production (Rp/kg) 2,788 2,788
3.2.7. Social Budget
The social budget is calculated by multiplying tradable inputs, domestic
factors, and outputs in the input-output table (Table 3) by their social prices (Table 9).
Table 10. Social Budget for Red Onion Production in Brebes, for Farming Systems using Local and Imported Seeds (Rp per Hectare)
Kind of Input /
Output Item Imported Domestic
Tradable Inputs 1. Seed 6,057,813 5,903,227 2. Fertilizers a. Chemical Fertilizers - TSP 318,284 262,287 - Urea 273,540 209,882 - KCl 230,446 295,795 - ZA 209,484 276,391 - NPK 213,190 239,169 - Sendawa Putih (White nitric) 132,837 - - Kamas - 144,308 - SP-36 - 168,525 - Others 178,601 87,420
16
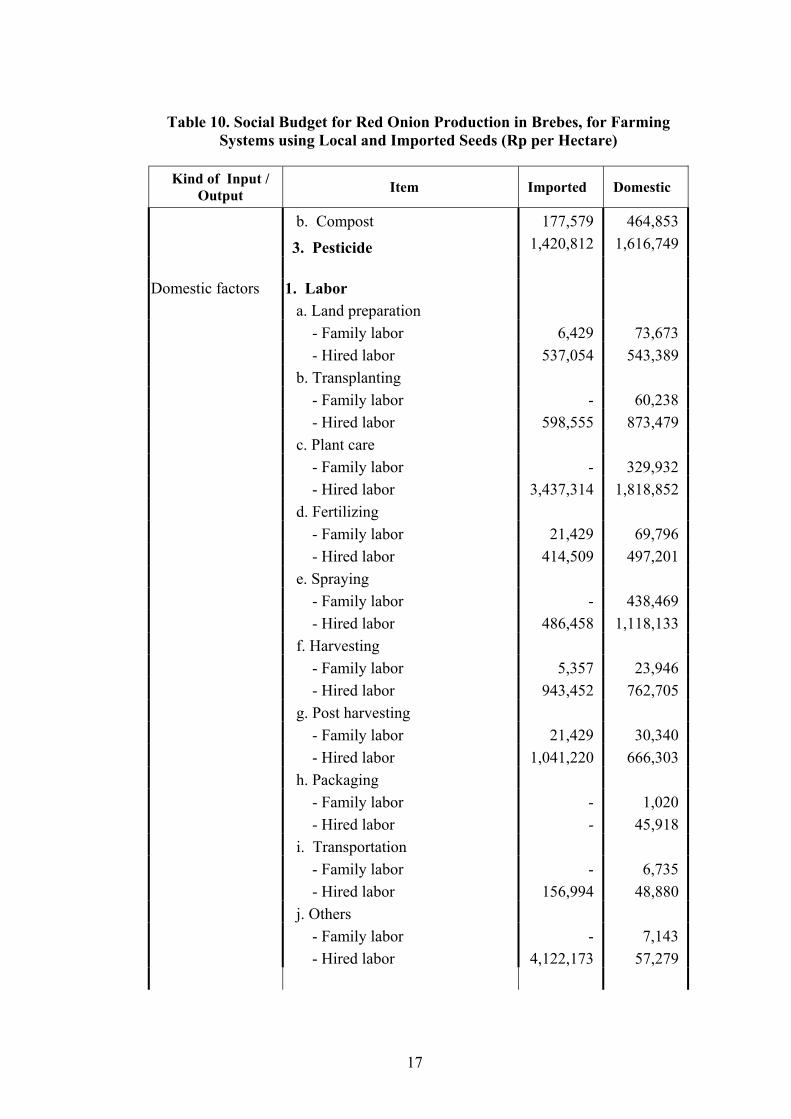
Table 10. Social Budget for Red Onion Production in Brebes, for Farming Systems using Local and Imported Seeds (Rp per Hectare)
Kind of Input /
Output Item Imported Domestic
b. Compost 177,579 464,853 3. Pesticide 1,420,812 1,616,749
Domestic factors 1. Labor a. Land preparation - Family labor 6,429 73,673 - Hired labor 537,054 543,389 b. Transplanting - Family labor - 60,238 - Hired labor 598,555 873,479 c. Plant care - Family labor - 329,932 - Hired labor 3,437,314 1,818,852 d. Fertilizing - Family labor 21,429 69,796 - Hired labor 414,509 497,201 e. Spraying - Family labor - 438,469 - Hired labor 486,458 1,118,133 f. Harvesting - Family labor 5,357 23,946 - Hired labor 943,452 762,705 g. Post harvesting - Family labor 21,429 30,340 - Hired labor 1,041,220 666,303 h. Packaging - Family labor - 1,020 - Hired labor - 45,918 i. Transportation - Family labor - 6,735 - Hired labor 156,994 48,880 j. Others - Family labor - 7,143 - Hired labor 4,122,173 57,279
17

Table 10. Social Budget for Red Onion Production in Brebes, for Farming Systems using Local and Imported Seeds (Rp per Hectare)
Kind of Input /
Output Item Imported Domestic
2. Others a. Irrigation 934,524 48,798 b. Water pump 8,929 38,816 c. Others 22,464 58,503 3. Working capital 977,550 725,668 Output Revenue 37,276,264 23,725,548
Because of the much higher yields, the total social revenue of farming with imported seeds, Rp 37,276,264, was 57 percent higher than that of the system with local seeds, Rp 23,725,548. In contrast, the total social costs of producing red onions with imported seeds, Rp. 20,107,890, were only 31 percent higher than the social costs of farming with local seeds, Rp. 15,418,283. Hence, the social profits were much greater in the red onion system with imported seeds.
3.2.8. PAM Results
The PAMs for both red onion systems are based on the data from the private
and social budgets (Table 11). The private row in the PAM table uses values from the private budget, while the social row in the PAM is taken from the social budget. The third row of PAM, measuring the effects of divergences, is found by subtracting the second row from the first row.
Table 11. PAMs for Red Onion Production in Brebes, for Farming Systems using Local and
Imported Seeds (Rp per Hectare)
Domestic Factors Revenue Tradable
Inputs Labor Capital Land Others Total Profit
Imported
Private 37,433,333 9,677,613 11,792,372 1,503,923 0 1,143,496 14,439,791 13,315,929Social 37,276,264 9,035,007 11,792,372 977,550 0 1,143,496 13,913,418 14,327,839
Divergences 157,070 642,606 0 526,373 0 0 526,373 - 1,011,909
Local
18
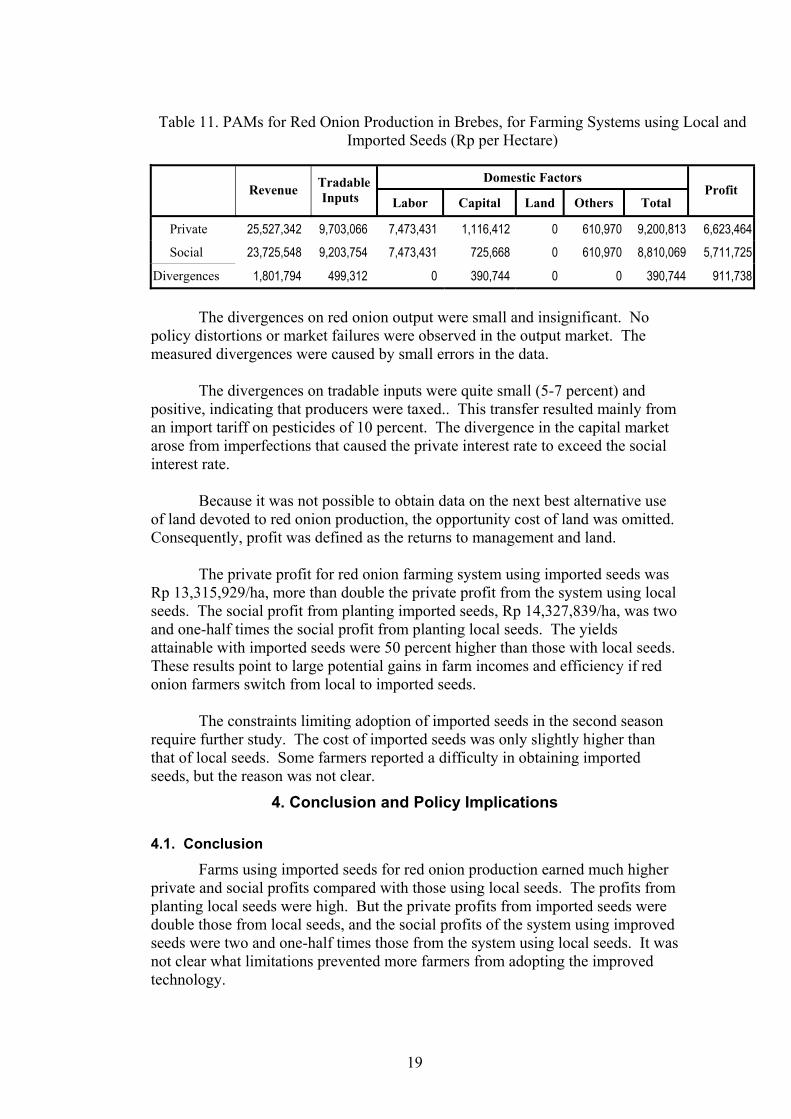
Table 11. PAMs for Red Onion Production in Brebes, for Farming Systems using Local and Imported Seeds (Rp per Hectare)
Domestic Factors
Revenue TradableInputs Labor Capital Land Others Total
Profit
Private 25,527,342 9,703,066 7,473,431 1,116,412 0 610,970 9,200,813 6,623,464Social 23,725,548 9,203,754 7,473,431 725,668 0 610,970 8,810,069 5,711,725
Divergences 1,801,794 499,312 0 390,744 0 0 390,744 911,738
The divergences on red onion output were small and insignificant. No
policy distortions or market failures were observed in the output market. The measured divergences were caused by small errors in the data.
The divergences on tradable inputs were quite small (5-7 percent) and
positive, indicating that producers were taxed.. This transfer resulted mainly from an import tariff on pesticides of 10 percent. The divergence in the capital market arose from imperfections that caused the private interest rate to exceed the social interest rate.
Because it was not possible to obtain data on the next best alternative use
of land devoted to red onion production, the opportunity cost of land was omitted. Consequently, profit was defined as the returns to management and land.
The private profit for red onion farming system using imported seeds was
Rp 13,315,929/ha, more than double the private profit from the system using local seeds. The social profit from planting imported seeds, Rp 14,327,839/ha, was two and one-half times the social profit from planting local seeds. The yields attainable with imported seeds were 50 percent higher than those with local seeds. These results point to large potential gains in farm incomes and efficiency if red onion farmers switch from local to imported seeds.
The constraints limiting adoption of imported seeds in the second season
require further study. The cost of imported seeds was only slightly higher than that of local seeds. Some farmers reported a difficulty in obtaining imported seeds, but the reason was not clear.
4. Conclusion and Policy Implications
4.1. Conclusion
Farms using imported seeds for red onion production earned much higher private and social profits compared with those using local seeds. The profits from planting local seeds were high. But the private profits from imported seeds were double those from local seeds, and the social profits of the system using improved seeds were two and one-half times those from the system using local seeds. It was not clear what limitations prevented more farmers from adopting the improved technology.
19
20
4.2. Policy Implications
It would be desirable if the government could carry out the following measures:
1. Increase the availability of imported seeds for red onion farmers in Brebes District.
2. Raise the yield of both imported and local seed by improving red onion
farming practices and seed selection.
3. Improve rural financial intermediation so that affordable loans would be readily available to allow red onion farmers to buy imported seeds and cover the costs of other inputs.