THE COMPARATIVE PERFOMANCE OF SELECTED AGRIBUSINESS ...
142
THE COMPARATIVE PERFOMANCE OF SELECTED AGRIBUSINESS COMPANIES AND COOPERATIVES IN THE WESTERN CAPE, SOUTH AFRICA. WELLINGTON SIKUKA Thesis presented in partial fulfilment of the requirements for the degree of Master of Science in Agriculture (Agricultural Economics) at Stellenbosch University Supervisor: Prof A.S.M Karaan March 2010
Transcript of THE COMPARATIVE PERFOMANCE OF SELECTED AGRIBUSINESS ...

THE COMPARATIVE PERFOMANCE OF SELECTED AGRIBUSINESS COMPANIES
AND COOPERATIVES IN THE WESTERN CAPE, SOUTH AFRICA.
WELLINGTON SIKUKA
Thesis presented in partial fulfilment of the requirements for the degree of
Master of Science in Agriculture (Agricultural Economics) at Stellenbosch University
Supervisor: Prof A.S.M Karaan March 2010

1
DECLARATION
By submitting this thesis electronically, I declare that the entirety of the work contained therein is
my own, original work, that I am the authorship owner thereof (unless to the extent explicitly
otherwise stated) and that I have not previously in its entirety or in part submitted it for obtaining
any qualification.
Wellington Sikuka
March 2010
Copyright © 2010 Stellenbosch University
All rights reserved
2
ABSTRACT
The main objective of the research is to understand the concept of cooperative conversions and
compare the performance of converted cooperatives to those that never converted using financial
accounting analysis and organisational dynamism. Even though the differences were relatively
small, companies had the strongest relative financial performance than cooperatives. Companies
had the strongest performances in asset and revenue growth. Average revenue growth for
companies from 2004 to 2007 was 29% as compared to 15% by cooperatives and asset growth was
25% for companies compared to 12.5% by cooperatives. Results further indicate that for the past
two years, cooperatives seem to be reporting decreasing performance in most of the financial ratios
analysed. Thus, based on results from the financial analysis, operating as a company or converting
from a cooperative to a company could result in slight increases in financial performance.
Rapid change presents various challenges and opportunities for businesses in today‘s dynamic
environment. As a result, business dynamism is becoming an increasingly important aspect and
factor in determining success. Based on a dynamism score card, the study shows that companies are
by far much more dynamic than cooperatives, with a score of 83.75 compared to 62.33 out of 100
respectively. However, cooperatives compare relatively well to companies in as far as
organisational strategy, management, organisational structure and culture. Their limitations come
from their property rights framework which is by far less dynamic than that of companies owing to
the limitations and constraints of the Cooperatives Act (Act 14 of 2005). The main shortcomings of
cooperative property rights were that of not allowing external investors into the cooperative and the
one member one vote principle for primary cooperatives or the 15% cap for secondary cooperatives.
3
OPSOMMING
Die vernaamste doelwit van hierdie navorsing was om die konsep van koöperatiewe omsettings te
verstaan en die prestasie van omsette koöperasies te vergelyk met dié wat nog nooit deur middel
van finansiële rekeningkundige analise en organisatoriese dinamisme omgesit is nie. Hoewel die
verskille relatief klein was, het maatskappye die sterkste relatiewe finansiële prestasie gehad in
vergelyking met koöperasies. Maatskappye het ook die sterkste prestasie in bate- en inkomstegroei
getoon. Gemiddelde inkomstegroei vir maatskappye vanaf 2004 tot 2007 was 29%, in vergelyking
met 15% vir koöperasies, terwyl bategroei vir maatskappye 25% was in vergelyking met 12.5% vir
koöperasies. Die resultate toon verder dat koöperasies oor die afgelope twee jaar verminderde
prestasie blyk te rapporteer in die meerderheid van die finansiële verhoudings wat geanaliseer is.
Dus, op grond van die resultate van die finansiële analise, sal funksionering as ‘n maatskappy of
omsetting van ‘n koöperasie na ‘n maatskappy kan lei tot ‘n effense verhoging in finansiële
prestasie.
Snelle verandering bied verskeie uitdagings en geleenthede vir maatskappye in die huidige
dinamiese omgewing. Gevolglik is sakedinamisme besig om ‘n toenemend belangrike aspek en
faktor in die bepaling van sukses te word. Op die basis van ‘n dinamisme-telkaart het hierdie studie
getoon dat maatskappye baie meer dinamies is as koöperasies, met ‗n telling van 83.75 in
vergelyking met 62.33 uit 100 onderskeidelik. Koöperasies vergelyk egter relatief goed met
maatskappye in soverre dit organisatoriese strategie, bestuur, organisatoriese struktuur en kultuur
behels. Hulle beperkings kom van hulle eiendomsregraamwerk, wat baie minder dinamies is as dié
van maatskappye op grond van die beperkings van die Wet op Koöperasies (Wet 14 van 2005). Die
vernaamste tekorte van koöperatiewe eiendomsregte is dat hulle nie eksterne beleggers in die
koöperasie toelaat nie en die beginsel van een lid, een stem vir primêre koöperasies of die 15% perk
op sekondêre koöperasies.

4
ACKNOWLEDGEMENTS
I would like to express my sincere gratitude to the following institutions and persons:
I am indebted to the University of Stellenbosch and Pioneer Ltd for funding my studies.
I would like to express my special thanks to my promoter, Prof. Karaan. His meticulous
guidance, keen interest, encouragement and constructive criticism have made this study a
reality.
I would like to extend my special thanks to Prof N Vink for his valuable guidance,
encouragement, unreserved support and insightful criticism.
I am also indebted to all the Agricultural Economics staff for their useful suggestions and
encouragement adding to the success of my study.
Mrs. Tersia Bergsted deserves special thanks for her kind and prompt response to all my
administrative enquires.
I also extend my gratitude towards CIPRO for supplying me with financial statements
I also extend my gratitude to all the agribusinesses executives who took their time for the
interviews and in answering the questionnaires.
I thank all my friends and colleagues for their support and encouragement.
I am grateful to my parents, brothers, sisters and relatives for their encouragement and support.
Their all rounded and unconditional support enabled me to realise my educational goal.
Above all I thank and praise the Almighty God, who continually graces me with
EVERYTHING.

5
TABLE OF CONTENTS
Pages
DECLARATION 1
ABSTRACT 2
OPSOMMING 3
ACKNOWLEDGEMENTS 4
TABLE OF CONTENTS 5
APPENDICES 8
ABBREVIATIONS 9
LIST OF TABLES 10
LIST OF FIGURES 10
CHAPTER ONE: RESEARCH INTRODUCTION
1.1 Introduction 12
1.2 Research questions and issues 13
1.2.1 Questioning the relevance of cooperatives 13
1.2.2 Summary of the research questions 15
1.3 Theoretical framework 15
1.4 Methodology 16
1.5 Limitations of the study 18
1.6 Structure of the study 18
CHAPTER TWO: RESEARCH DATA AND METHODOLOGY
2.1 Introduction 19
2.2 Previous studies on cooperative performance and restructuring 19
2.3. Research methods 20
2.3.1 Financial accounting analysis 20
2.3.2 Economic value added (EVA) 22
2.3.3 Questionnaire survey and the Dynamism score card 22
2.4 Description of agribusinesses, data and limitations 24
2.5 Summary of the research questions and analysis 25
6
CHAPTER THREE: UNDERSTANDING AGRICULTURAL COOPERATIVES
3.1 Introduction 27
3.2 Origin, development and importance of cooperatives 27
3.3 Policy, economic and regulation influences 29
3.4 Cooperative thinking, nature and essence 34
3.4.1 Development imperative 34
3.4.2 Political imperative 36
3.4.3 Commercial imperative 38
3.5 Summary: Are cooperatives relevant or obsolete 39
CHAPTER FOUR: ORGANISATIONAL PERFOMANCE: DYNAMISM AND
FINANCIAL PERFORMANCE
4.1 Introduction 41
4.2 Organisational performance 41
4.2.1 Financial performance 41
4.2.2 Organisational dynamism 43
4.2.2.1. Organisational culture, strategy and structure 44
4.2.2.2. Management style and culture 46
4.2.2.3. Management competence or ability 48
4.2.2.4. Management incentives 50
4.3 Summary 50

7
CHAPTER FIVE: PROPERTY RIGHTS APPROACH
5.1 Introduction 52
5.2 Background on the property rights framework 52
5.2.1. Ownership rights 52
5.2.2. Control rights 53
5.2.3. Agency problem 54
5.3 Property rights that constrain the growth of cooperatives 56
5.4 Evolution of new cooperative models 58
5.4.1. Proportional Investment Co-operatives (PICs) 58
5.4.2. Member-investor Co-operatives (MICs) 59
5.4.3. New Generation Co-operatives (NGCs) 60
5.4.4 Cooperatives with capital seeking entities 61
5.4.5. Investor-share Co-operatives (ISCs) 61
5.5 Alternative organisational changes 62
5.5.1. Mergers 62
5.5.2. Acquisitions and takeovers 64
5.5.3. Integration 64
5.5.4. Joint Ventures 65
5.6 The decision to convert to companies 65
5.6.1 Various hypotheses 65
5.6.2 Company versus the cooperative business model 67
5.6.2.1. Market orientation 67
5.6.2.2. Ownership 68
5.6.2.3. Control 68
5.6.2.4. Managerial behaviour 69
5.6.2.5. Scope for optimization 70
5.6.2.6. Pricing behaviour 70
5.6.2.7. The structure of incentives 71

8
CHAPTER SIX: COMPARATIVE DYNAMISM OF COOPERATIVES AND
COMPANIES
6. 1 Introduction 72
6.2 Comparative performance of cooperatives and companies 72
6.2.1. Organisational strategies 72
6.2.2. Organisational culture and structure 75
6.2.3 Management 78
6.2.4. Property rights 79
6.3 Motivations and reasons for structural changes 81
6.4 Results of the dynamism score card 82
6.5 Summary 83
CHAPTER SEVEN: COMPARATIVE FINANCIAL PERFOMANCE OF
COOPERATIVES AND COMPANIES
7.1 Introduction 85
7.2 Financial accounting analysis 85
7.2.1. Profit margin 85
7.2.2. Return on assets (R.O.A) 87
7.2.3. Return on equity (R.O.E) 89
7.2.4. Current ratio 92
7.2.5. Debt to asset ratio 93
7.2.6 Asset turnover ratio 96
7.2.7 Asset growth 98
7.2.8 Revenue growth 99
7.3 Economic value added 102
7.4 Summary 104
CHAPTER EIGHT: SUMMARY, CONCLUSION AND RECOMMENDATIONS
8.1 Summary of the results 107
8.2 Conclusion of the study 110
8.3 Recommendations and areas for further study 110
REFERENCES 112
APPENDICES
Appendice 1: Questionnaire 131

9
ABBREVIATIONS
ABC Agribusiness Chamber
ANC African National Congress
BEE Black Economic Empowerment
CIPRO Companies and Intellectual Property Registration Office
Comp A Company A
Comp B Company B
Comp C Company C
Comp D Company D
Coop A Cooperative A
Coop B Cooperative A
Coop C Cooperative A
DTI Department of Trade and Industry
EIA Environmental Impact Assessment
EVA Economic Value Added
FAO Food and Agricultural Organisation
IOFs Investor Oriented Firms
ICA International Cooperative Alliance
ISCs Investor-share Co-operatives
MICs Member-investor Co-operatives
NGCs New Generation Co-operatives
NIE New Institutional Economics
NZDB New Zealand Dairy Board
NOPAT Net operating profit after tax
PICs Proportional Investment Co-operatives
PWC Price Water and Coopers
PPAA Petroleum Products Amendment Act
P/E Price to earnings ratio
R.O.A Return on assets
R.O.E Return on equity
USA United States of America
10
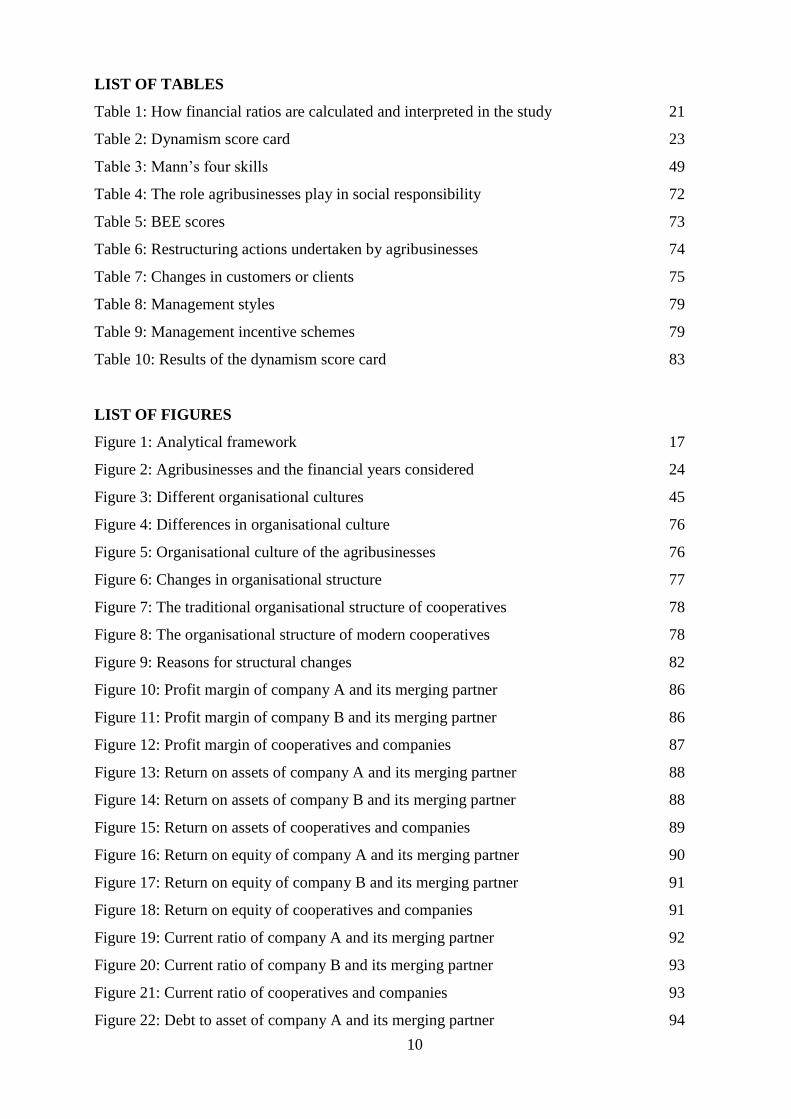
LIST OF TABLES
Table 1: How financial ratios are calculated and interpreted in the study 21
Table 2: Dynamism score card 23
Table 3: Mann‘s four skills 49
Table 4: The role agribusinesses play in social responsibility 72
Table 5: BEE scores 73
Table 6: Restructuring actions undertaken by agribusinesses 74
Table 7: Changes in customers or clients 75
Table 8: Management styles 79
Table 9: Management incentive schemes 79
Table 10: Results of the dynamism score card 83
LIST OF FIGURES
Figure 1: Analytical framework 17
Figure 2: Agribusinesses and the financial years considered 24
Figure 3: Different organisational cultures 45
Figure 4: Differences in organisational culture 76
Figure 5: Organisational culture of the agribusinesses 76
Figure 6: Changes in organisational structure 77
Figure 7: The traditional organisational structure of cooperatives 78
Figure 8: The organisational structure of modern cooperatives 78
Figure 9: Reasons for structural changes 82
Figure 10: Profit margin of company A and its merging partner 86
Figure 11: Profit margin of company B and its merging partner 86
Figure 12: Profit margin of cooperatives and companies 87
Figure 13: Return on assets of company A and its merging partner 88
Figure 14: Return on assets of company B and its merging partner 88
Figure 15: Return on assets of cooperatives and companies 89
Figure 16: Return on equity of company A and its merging partner 90
Figure 17: Return on equity of company B and its merging partner 91
Figure 18: Return on equity of cooperatives and companies 91
Figure 19: Current ratio of company A and its merging partner 92
Figure 20: Current ratio of company B and its merging partner 93
Figure 21: Current ratio of cooperatives and companies 93
Figure 22: Debt to asset of company A and its merging partner 94

11
Figure 23: Debt to asset of company B and its merging partner 95
Figure 24: Debt to asset of cooperatives and companies 95
Figure 25: Asset turnover ratio of company A and its merging partner 96
Figure 26: Asset turnover ratio of company B and its merging partner 97
Figure 27: Asset turnover ratio of cooperatives and companies 97
Figure 28: Total assets of company A and its merging partner 98
Figure 29: Total assets of company B and its merging partner 98
Figure 30: Total assets of cooperative and companies 99
Figure 31: Revenue growth of company A and its merging partner 100
Figure 32: Percentage growth in revenue of company A and its merging partner 100
Figure 33: Revenue growth of company B and its merging partner 101
Figure 34: Percentage growth in revenue of company B and its merging partner 101
Figure 35: Revenue growth of cooperatives and Companies 102
Figure 36: Economic value added of company A and its merging partner 103
Figure 37: Economic value added of company B and its merging partner 103
Figure 38: Economic value added of cooperatives and companies 104

12
CHAPTER ONE
INTRODUCTION
1.1 Introduction
According to the Registrar General of Cooperatives in South Africa, about 90% of commercial
cooperatives have converted to companies since 1993. Changing from a cooperative which by its
nature is user (service) oriented, to a company which is investor (profit) oriented comes with
significant changes to the (i) objectives, structure or purpose of the organisation, (ii) management
and governance issues mainly ownership, control, management, organisational culture and styles
(iii) performance measurement and expectations for example, shares (value, how they are managed
and shareholding), profits (value and how they are distributed). Because of the significance of these
changes, the decision to convert from a cooperative to a company needs to be well informed. The
key question that serves as the main objective of the study is whether the conversion to the
company business model enhances the performance of converted cooperatives relative to
cooperatives that never converted.
Chaddad and Cook (2004) have attributed such organisational changes to the inherent weaknesses
of the traditional cooperative business model mainly its ill defined property rights which result in
the free rider, horizon, portfolio, control and influence costs problem. Chaddad and Cook (2004)
further argue that such weaknesses or ill defined property rights of cooperatives have led to the
emergence of new cooperative models (where policies have allowed such actions) such as the
Proportional Investment Co-operatives (PICs), Member-investor Co-operatives (MICs), New
Generation Co-operatives (NGCs), Cooperatives with capital seeking entities and Investor-share
Co-operatives (ISCs) or alternatively outright conversions to companies. The study will use the
property rights approach as the theoretical framework to understand the motives that induce such
organisational changes and whether companies are a superior business form than cooperatives. In
addition, central issues that have to be addressed before or during a conversion are those of changes
in ownership and control, which can appropriately be analysed under the property rights framework.
Even though the research relies and acknowledges the relevance and importance of property rights
in explaining organisational changes and performance, other factors apart from property rights that
determine the success of business organisations in today‘s increasingly competitive and dynamic
environment, mainly organisational dynamisms and culture, management styles, competence and
incentives are investigated (Godo (2006); O‘Connor (2001); Ruben & Lerman (2004)). The study
seeks to further investigate and compare how cooperatives and companies are different in terms of

13
these factors. In South Africa, the deregulation of markets and withdrawal of state support also
resulted in fundamental changes to agribusinesses and the agriculture sector. Before 1996, most
commercial cooperatives were heavily supported and even operated monopolies in certain
industries. After, deregulation, cooperatives were forced to adapt or fail. Thus, in comparing
dynamism, prudence will be observed as some of the changes were a result of cooperatives catching
up to dynamic practices already implemented by companies.
By studying the conversions from cooperatives to companies, and researching whether the
performance of cooperatives is enhanced if they convert, the research seeks to determine whether
cooperatives are a superior or inferior business model in this regard. The answer to this question
would be important in concluding whether the cooperative form of business still has merits in
modern day business or is obsolete? Thus whether such conversion trends have to be accelerated or
retarded in today‘s modern business environment. Of interesting note is the passing of the
Cooperatives Act 2005 (Act 14 of 2005), which the study will also discuss in light of whether it
accelerates or retards such conversions. Criticisms, merits or the way forward on such policies can
only be levelled if clear understanding of the process and consequences of conversions are
highlighted.
1.2 Research questions and issues
1.2.1 Questioning the relevance of cooperatives
Changes such as increased competition, changing policies, changing consumer profiles, interests or
tastes are becoming too evident (Kyriakopoulos et al, 2004). As such, business organizations are
forced to adopt their organizational structures and strategies to match such changes (Cook and
Chaddad (2000); Evans and Meade (2005); Heit (2007); Kyriakopoulos et al (2004); O‘Connor
(2001) and Sykuta and Cook (2001)). An increasing trend of structural changes and strategies such
as consolidations, mergers, acquisitions, strategic alliances, joint ventures and organisational
changes such as strategic diversification, vertical integration, horizontal integration and conversions
have also been reported in South Africa (Competition Commission, 2006). Chaddad and Cook
(2004) show various types of cooperative models that have emerged mainly in developed countries
such as the USA, New Zealand, Canada and the Netherlands where policies have permitted such
actions. The move towards more investor oriented models such as outright conversions to
companies‘ raises questions on the merits and demerits of the cooperative model compared to the
investor oriented models. More interestingly is whether the cooperative business model has merits
in modern day business or has become obsolete?
14
According to Chaddad and Cook (2004), cooperatives and companies can best be viewed as two
polar forms of business models. As a result, various questions arise as to why a business changes to
another polar business model and how such a change affects the organisation and stakeholders
involved. There are various reasons and motives for converting from a cooperative to a company.
Various motivations and theories have been proposed to explain why cooperatives convert (see
section 5.6). Cook (1995) attributes the ill defined property rights of traditional cooperatives as the
main cause of conversions of cooperatives to other organisational models such as the NGCs or
investor oriented firms. However, other reasons such as political factors, changes in the institutional
arrangements and policies or other individual (either is rational or irrational to pursue personal
benefits) also motivate such changes (Collins (1991); Jorgensen (2001) and Merlo (2001)). Thus
empirical evidence is needed to ascertain why cooperatives convert and whether these conversions
are an inevitable evolutionary process, or instigated by other motives? The decision to convert is
made against other alternative actions such consolidations, mergers, acquisitions, strategic alliances,
joint ventures and organisational changes such as strategic diversification, vertical integration and
horizontal integration. Against an understanding of the motives and reasons to convert a clear
understanding is required on why some of these choices were overlooked.
Changing from a cooperative to a company has many implications because by their very nature,
cooperatives which appear user oriented seem like a totally different organisation from companies
which are investor oriented (Standard Bank, 2006). Cooperatives have been known to mainly serve
their members by providing a service. Thus their motivation is more closely tied to the financial
health of the members as opposed to the profit motive of companies. Thus when cooperatives
convert to companies, there are changes that members, management and the organisation have to
face e.g. the members implications to the nature and extent of services from the re-structured
organisation, issues pertaining to ownership (shares, dividends) and control. Questions on whether
member ownership increases or decreases when cooperatives convert and also which of the two
business model (company or cooperative) makes a better investment choice.
When cooperatives convert to companies, the changes in the objective of the organisation have
direct implications on management. Firstly in terms of how management shifts from a mindset of
protecting the interests of members to that of being market oriented and investor oriented. Conflict
of interests is expected when management tries to reconcile the economic self interest of
shareholders who were previously members versus the interest of external investors. Such a conflict
also raises the dilemma of the developmental imperative versus the economic or commercial
imperative? In a cooperative, performance is based on the member‘s benefits as shown by the price
15
of products and services they receive from the cooperative. However, in companies, profit, return
on investment, shareholders` value constitute the main performance measures. It is interesting to
compare how modern commercial cooperatives compare to companies in such performance
measures as well as the nature and extent of performance incentives especially ownership that they
offer to management?
1.2.2 Summary of research questions
In summary the main objective and specific research question the study seeks to address is;
i. How has the conversion to companies affected performance? Do cooperatives that have
adopted the company business model perform better than cooperatives that never converted?
Subsequently the study will also seek to address the following questions;
ii. What are some of the external and internal reasons and motives that prompted the conversion?
iii. Are cooperatives necessarily a less efficient organisational structure than the company
business model?
iv. Which challenges and opportunities were encountered during the process?
v. What are the implications of such a change to members in as far as service obtained, shares,
control, dividends and member‘s wealth is concerned?
vi. How does the management reconcile the economic self interest of members versus the
investors, or the developmental imperative versus the economic viability of the organisation?
vii. What are the implications of such a change to investors in as far as shares, dividends and
return to investments is concerned?
viii. How has the organisation adapted to the needs of an advancing industrial society, that is,
which organisations are more dynamic?
ix. How do converted cooperatives differ to those that never converted in as far as organisation
culture, management culture, style, competence and incentives?
1.3 Theoretical Framework
There are various schools of thought ranging from economics, sociology, political science to
anthropology that seek to explain organisational behaviour or more commonly, collective action,
group coordination or groups attempting to organise and create collective benefits (Coase (1937),
Demsetz (1997), Fama (1980), Hart (1989), Knight (1957), Milgrom & Roberts (1990), Olson
(1965), Putterman (1993), Williamson (1985)). The research applies the property rights approach
which lies in the domain of the New Institutional Economics (NIE). The relevance of the NIE
comes from the fact that it seeks to explain the basis of the firm, its structure and its significance for

16
a modern economic system, which form part of the key questions the research seeks to address. The
property rights theoretical framework will be used to understanding issues pertaining to ownership
and control whereas the business management approach will be the basis to understanding
management culture, styles, competence and incentives as well as organisational culture.
The property rights approach is mainly concerned with how the assignment of and costs of
transferring property rights affects incentives and economic outcomes (Demsetz (1967); Demsetz
(1983); Demsetz (1997); Harvey & Sykuta (2005)). Property rights being claim, control or
ownership rights entitled to a member. Thus the central issue is mainly of ownership and control.
Thus the organisational form is important in mitigating property rights issues, particularly the
separation of residual claim rights, ownership and control rights in modern firms (Hendrikse &
Veerman, 2001b). Thus it follows that organisational structures with well clearly defined property
rights should perform better than organisational structures with ill defined property rights.
The property rights structure of the firm could be altered over time. Restructuring of property rights
is usually done to improve incentives and/or lower transaction costs with a view to making the firm
more efficient. Actions such as consolidations, mergers, acquisitions, strategic alliances, joint
ventures and organisational changes such as strategic diversification, vertical integration, horizontal
integration and conversions qualify as changes in property rights. However, sometimes such
changes are not motivated or driven by pure efficiency considerations. For example, in the case of
cooperatives, conversions can be driven by members or management with great bargaining power if
it will be beneficial to them but detrimental to other members of the cooperative or the efficiency
and performance of the cooperative.
In today‘s dynamic environment, it is argued that dynamic organisations are more successful than
organisations that do not adapt to change quickly and comprehensively ((Ensley et al (2006); Priem
et al (1995)). Dynamic organisations tend to be innovative and respond to market opportunities and
challenges with speed and comprehensiveness. Dynamism is can be shown by organisational
culture, style and strategy, management and the property rights of the organisation. A full
discussion in chapter four on these issues enlightens why some business organisations are expected
to be more successful than others.
1.4 Methodology
Comparing cooperatives to companies is complicated by their different intrinsic nature. Thus, to
draw up objective and sound conclusions, a balanced comparative methodology adapted from the
17
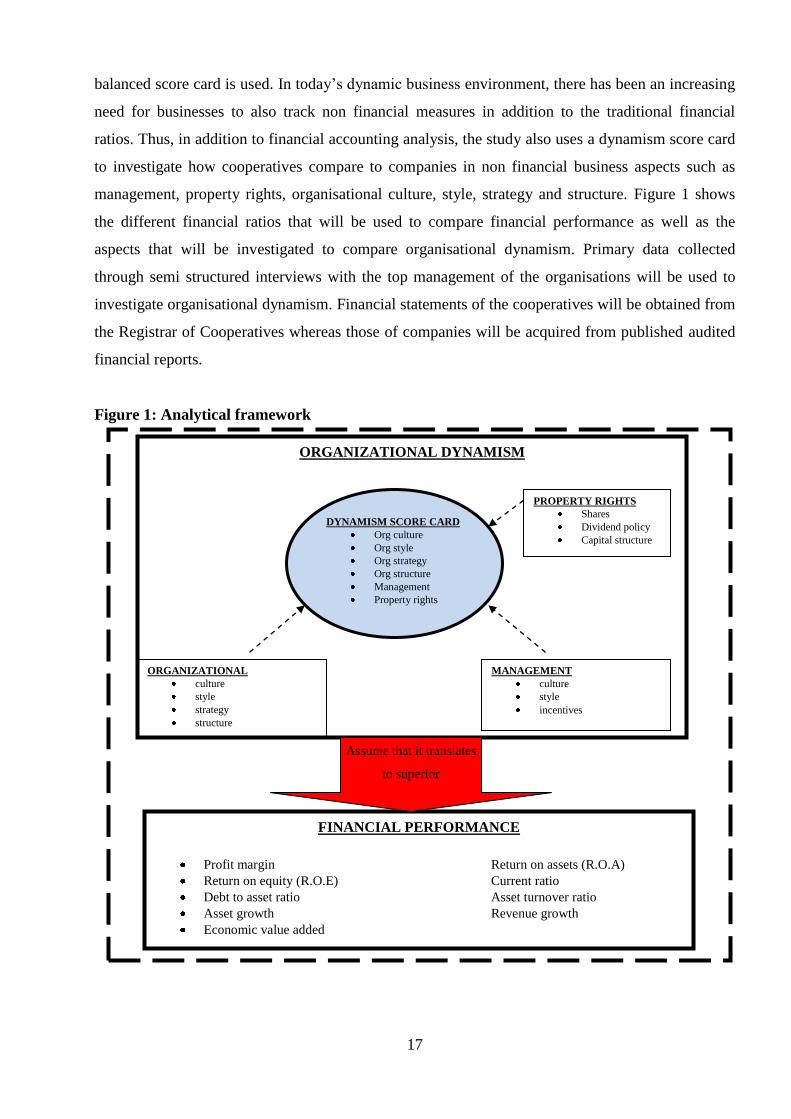
balanced score card is used. In today‘s dynamic business environment, there has been an increasing
need for businesses to also track non financial measures in addition to the traditional financial
ratios. Thus, in addition to financial accounting analysis, the study also uses a dynamism score card
to investigate how cooperatives compare to companies in non financial business aspects such as
management, property rights, organisational culture, style, strategy and structure. Figure 1 shows
the different financial ratios that will be used to compare financial performance as well as the
aspects that will be investigated to compare organisational dynamism. Primary data collected
through semi structured interviews with the top management of the organisations will be used to
investigate organisational dynamism. Financial statements of the cooperatives will be obtained from
the Registrar of Cooperatives whereas those of companies will be acquired from published audited
financial reports.
Figure 1: Analytical framework
ORGANIZATIONAL
culture
style
strategy
structure
MANAGEMENT
culture
style
incentives
ORGANIZATIONAL DYNAMISM
DYNAMISM SCORE CARD
Org culture
Org style
Org strategy
Org structure
Management
Property rights
FINANCIAL PERFORMANCE
Profit margin Return on assets (R.O.A)
Return on equity (R.O.E) Current ratio
Debt to asset ratio Asset turnover ratio
Asset growth Revenue growth
Economic value added
Assume that it translates
to superior
PROPERTY RIGHTS
Shares
Dividend policy
Capital structure
18
1.5 Limitations of the study
There are several noteworthy limitations of the research. The generalizability of these research
findings are limited because they are based on case studies which might not reflect or provide a
conclusion for agribusiness in other regions or the whole country. More case studies need to be
carried out to validate and compare the findings of this study. Secondly, because of data
unavailability, the sample size is small resulting in various financial analysis limitations especially
when averages are used for comparison. Finally, there are other critical factors that the study did not
consider which could impact on the comparative performance of cooperatives to companies e.g.
industry factors, political factors e.t.c.
1.6 Structure of the Study
The study is divided into eight chapters as discussed below;
The first chapter introduces the research topic and articulates the research questions. A brief
on the methodology and the motivation of the study are also explained.
Chapter two will serve as an explanation of the methodology and analysis applied in the
study as well as the data and background information on the agribusinesses analysed
Chapter three is a background to cooperatives by discussing their evolution and various
factors that have influenced their development. The chapter also includes a section on the
changes and sometimes conflicting roles or imperatives of cooperatives in order to ascertain
their role in today‘s modern economy.
Chapter four discuses performance as well as organisation dynamism, organisation culture,
management culture and style, management incentives, management competence or ability
in respect of their influence on performance.
Chapter five provides a review of the property rights approach which is the conceptual
framework used to understand the conversions to companies. The Property rights approach
will be applied to understand the formation and behaviour of cooperatives as compared to
investor oriented business organisations.
Chapter six presents the results from the questionnaire empirical analysis and comparative
dynamism.
Chapter seven presents the results from the financial analysis
Chapter eight presents the summary of the results, conclusion and presents suggestions for
future research.

19
CHAPTER TWO
RESEARCH DATA AND METHODOLOGY
2.1 Introduction
The objective in this chapter is to explain the data, methodology and analysis applied in the study.
The first section outlines previous studies on cooperative performance and restructuring which gave
an informed decision on the research methodology. These studies largely fall into two categories,
i.e. (i) studies based on financial ratios and (ii) studies based on economic efficiency (Evans &
Meade, 2005). The study will use financial accounting analysis, and a dynamism score card to
indicate how cooperatives compare to companies in critical aspects such as management, property
rights, organisational culture, style, strategy and structure. A description of the agribusiness selected
for the study, questionnaire survey and financial accounting data will be provided. The chapter
concludes with an overview of how each specific research question will be addressed.
2.2 Previous studies on cooperative performance and restructuring
Studies that have compared cooperatives to companies using financial ratios show mixed
conclusions. Chan and Robb (1998), Lerman and Parliament (1990) and Parliament et al (1990)
concluded that contrary to theoretical predictions cooperatives and companies were similarly
leveraged and generated similar returns. In other cases, cooperatives financially outperformed
comparable companies (this was especially true for dairy cooperatives because they are capital
intensive and the farmer members involved were efficient). However, studies by Hardesty and
Salgia (2004) and Schrader et al (1985) reveal no significant differences in financial performance
but state that, large, diversified agribusiness companies had significantly higher returns on asset
than cooperatives.
Porter and Scully (1987) examined the relative efficiency of cooperatives and companies according
to eight different measures (such as price, scale, and technical efficiency). Porter and Scully (1987)
indicate that cooperative milk processors were on average only 75.5% as efficient as their company
counterparts, and that by reorganising as companies, cooperative milk processors could raise output
by 32.4% without requiring extra inputs. Porter and Scully (1987) attributed this inefficiency to
problems with cooperative property rights, specifically the horizon, control, free rider, and portfolio
problems as summarised by Cook (1995). Boyle (2004) investigated the economic efficiency of
Irish dairy cooperatives from 1961 to 1987 and reports that cooperatives price their inputs as if they
were profit maximisers (similar to companies) and did not price inefficiently as expected.
20
Doucouliagos and Hone (2000) indicate that the Australian dairy industry was dominated by two
large Victorian cooperatives (Murray Goulburn and Bonlac), accounting for half the market and that
dairy deregulation had encouraged improved industry performance because there was convergence
in productivity levels across agribusinesses and states. Sullivan and Scrimgeour (1995) compare the
performance of the New Zealand Dairy Board (NZDB) to Nestle from 1969 to 1992 and concluded
that Nestle appeared to be more efficient than the NZDB. This is in contrast to the dairy sector
analyses of Lerman and Parliament (1990), and Parliament et al (1990).
Thus from the studies surveyed, overall there is no clear support for the theoretical prediction that
cooperatives will be less efficient and/or less profitable than companies (Evans and Meade, 2005).
In any case, Chaddad and Cook (2004) show that certain inefficiencies predicted to arise in
traditional cooperatives are being resolved with tradable cooperative ownership rights based on fair
values. Comparison of cooperatives to companies has also come with criticism. Babb and Boynton
(1981) argue that cooperatives represent the vertical integration of the producers‘ firms, thus, it is
inappropriate to evaluate performance of the joint entity by examining data for only a portion of the
entity. For example, a cooperative could be less profitable than a company and still be desirable to a
member as long as the member‘s discounted income returns from the cooperative were greater than
those from marketing the commodity directly or through a company. Babb and Boynton (1981) also
indicate that critical stakeholders associated with cooperatives are more concerned with financial
ratios than they are about measures of economic efficiency. Thus to address any bias that can result
from conclusions based on only financial accounting analysis, the study will do a balanced
comparison of the financial performance and other qualitative factors such as organisational
dynamism.
2.3. Research methods
2.3.1 Financial accounting analysis
Table 1 gives a description of how the financial ratios used in the study are calculated and
interpreted. The industry benchmark based on the agribusiness benchmarking survey conducted in
2006 and 2007 by Price Water and Coopers and will be used to provide comparable data on the
performance of both cooperatives and agribusiness relative to the industry performance. However,
the study takes note that the benchmarks are purely averages and not the best performance levels.

21
Table 1: How financial ratios are calculated and interpreted in the study
Measure Calculation Interpretation
1. PROFITABILITY
Profit Margin Net farm Income plus interest minus family living and taxes divided by
gross revenue
The proportion of earnings or revenues that is operating profit and thus available to
compensate debt and equity capital. indicates the operating margins and reflects the
ability to generate revenues and control costs in such a way as to generate a profit
Return On Assets (R.O.A) The net income generated by all assets, after labour has been
compensated but before interest payments, divided by total assets
A measurement of profitability that indicates the profitability per rand of assets, thus
allowing comparisons over different size firms and different types of
business/investment
Return on Equity (R.O.E) The net income after all labour and interest charges, which is the residual
return to the owners investment divided by the equity investment.
A measurement of the return the owner of the business receives on his/her money
invested. Can be compared to rates of return in other investment opportunities such as
stocks, bonds, or savings accounts. a rate of return on equity that is less than the rate
of return on assets indicates unproductive use of borrowed funds
2. LIQUIDITY
Current Ratio
Calculated as current assets (Inventories, cash, accounts receivables,
e.t.c) divided by current liabilities (operating loan payments, accounts
payable, unpaid taxes due, this year‘s payments on term loans, accrued
interest and rent, etc.)
A basic indicator of short term debt servicing and/or cash flow capacity. It indicates
the extent to which current assets, when liquidated, will cover current obligations. It
does not predict the timing of cash flow during the year or the adequacy of future
fund inflows in relation to outflows.
3. SOLVENCY
Debt to Asset ratio Total liability divided by total assets The basic leverage of the business, (i.e. what proportion of the total farm assets is
owed to creditors). Measures the ability of the business to repay all financial
obligations if all assets were sold.
4. GROWTH
Revenue growth Calculated as the annual increases in the total value of products and
services produced by the business on an accrual basis as reflected on
principal the income statement.
Reflects the growth of the business more specifically the income from sales and other
sources available annually to cover expenses, loan payments, family living, income
taxes, expansion, etc.
Asset growth Calculated as the annual increases in the total value of assets as reflected
on the balance sheet
Reflects the growth of the business and its capital base from which income can be
made from.
5. FINANCIAL EFFICIENCY
Asset turnover ratio
Gross revenues divide by total assets Reflects how efficiently farm assets generate revenues, indicates the volume of
business generated by the asset base (i.e. the flow of revenue through the asset
pipeline). Can show wide variation depending on the proportion of owned land or
other assets
6. SHAREHOLDER VALUE
Economic value added (EVA) {After tax operating income - Cost of Capital } × Capital Invested
Capital Invested
Economic value added is a value based financial performance measure, an investment
decision tool and a performance measure reflecting the absolute amount of
shareholder value created (Geyser & Liebenber, 2003)
Source: Boehlje et al (1999).

22
2.3.2 Economic value added
The key principle underlying EVA is that value is created when the return on an investment
exceeds the total cost of capital that correctly reflects its investment risk. A positive EVA
implies that the rate of return on capital must exceed the required rate of return (Hall &
Geyser, 2004). Thus, EVA is the net operating profit minus an appropriate charge for the
opportunity cost of all capital invested in an enterprise or project. EVA gives an objective
comparison of shareholder value for both cooperatives and companies because it captures the
following activities to create value that are common to cooperatives and companies (Hall &
Geyser, 2004):
Generate higher cash flows from existing assets, without affecting its growth
prospects or its risk profile.
Reinvest more and with higher excess returns, without increasing the riskiness of its
assets.
Reduce the cost of financing its assets in place or future growth, without lowering the
returns made on these investments.
Geyser & Liebenberg (2003) state that when calculating EVA, the after-tax operating income
has to be adjusted for operating leases, R&D expenses and one-time charges to compute the
return on capital. At the minimum, three adjustments need to be made to capital invested
when computing EVA — converting operating leases into debt, capitalizing R&D expenses
and eliminating the effect of one-time or cosmetic charges (O‘Byrne, 1996). The cost of
capital should be estimated based upon the market value of debt and equity in the firm, rather
than book values (Kramer & Pushner, 1997). Like other financial performance measures,
EVA has its own limitations, chiefly;
EVA on its own is inadequate for assessing a company‘s progress in achieving its
strategic goals and in measuring performance.
EVA will not work as a value enhancement measure unless there is a commitment on
the part of managers to make value maximization their primary objective (Geyser &
Liebenberg, 2003).
2.3.3 Questionnaire survey and the dynamism score card
The questionnaire survey is used to collect data for investigating dynamism and for the scores
used in the dynamism score card. The study classified the questionnaire into six sections
mainly; (i) organisational information and culture, (ii) organisation restructuring and

23
dynamism (iii) performance information, (iv) ownership information (v) management culture,
style, competence and incentives, and (vi) policies or legislation. The questionnaire survey
will be carried out through semi structured interviews with top management of the
agribusinesses. The respondents were part of the top management and thus the assumption is
that they presented a fairly rational and valid sample for the study to analyse their
organisation and management.
The study compares dynamism in cooperatives versus companies using a dynamism score
card (Table 2) that ranges from 0 to 100, with 0 indicating a firm that is not dynamic at all
and 100 indicating a highly dynamic company. The various agribusinesses were scored on
four factors, which are, organisational strategy, organisational structure and culture,
management and their property rights framework based on what theory and literature review
suggested as dynamic practices. For example, firms with a BEE scoring of less than 40 points
are given a dynamisms score of 1 whereas those with a BEE scoring of 41 to 65 were given a
score of 2 and finally those with a BEE scoring of above 65 were given a dynamism score of
3. The four factors, organisational strategy, organisational structure and culture, management
and their property rights framework were all given the same weightings of 25%. More
research needs to be done to develop an objective dynamism score card that could be used for
analysing the dynamism of agribusinesses (There is none to date).
Table 2: Dynamism score card
Factor Specific criteria of comparing dynamism Score
1 Organisational strategy Role in corporate social investment 3
Environmental sustainability or eco sensitive
initiatives
3
Nature of investments 5
BEE score card 3
Accounting reporting method 3
Changes in customers 4
Changes in product mix or services and value addition 4
2 Management Management style 10
Management incentives and compensation 15
3 Organisational structure and
culture
Organisational culture 10
Structure of the organisation 5
Restructuring actions in the past 5 years? 5
Type of investors 5
4 Property rights framework Shares (price, how they are redeemed, classes) 10
Dividend policy 5
Voting principle 5
Capital structure 5
TOTAL DYNAMISM SCORE 100

24
2.4 Description of agribusinesses and data
The study will use three cooperatives and four companies that were previously cooperatives.
The cooperatives selected include the grain and oil seed cooperatives. However, because of
diversification and ownership in other organisations, the agribusinesses are involved in
various sectors such as grain, input supply and other downstream activities. For the sake of
information privacy, the study will use the following names for the organisations, cooperative
A, cooperative B, cooperative C, company A, company B, company C and company D.
Company A was formed by a merger in 2005 involving two companies that were previously
cooperatives but converted to companies in 1998. The same applies to Company B, whereas
Company C has been a company since 1998 and Company D converted from a cooperative to
a company in 1998. All the cooperatives have been in operation well before 1998 and are still
registered as cooperatives. Figure 2 below shows the agribusinesses used for analysis and the
duration of financial statements under review.
Figure 2: Agribusinesses and the financial years considered
COOPERATIVE A
COOPERATIVE B
COOPERATIVE C
COMPANY D
COMPANY C
Merging partner 1
Merging Partner 2 COMPANY B
Merging Partner 1
Merging Partner 2
COMPANY A
1998 2005 ...……2007
(AMALGAMATION)
Financial statements of the cooperatives will be obtained from the Registrar of Cooperatives,
a subdivision of the Companies and Intellectual Property Registration Office (CIPRO).
Whereas those of companies will be acquired from published audited annual financial
reports.
CO
OP
ER
AT
IVE
S
CO
MP
AN
IES
25
2.5 Summary of the research questions and analysis
Main objective and specific research question
i. How has the conversion to companies affected performance? Do cooperatives that have
adopted the company business model perform better than cooperatives that never
converted?
Financial accounting analysis will be used to assess the relative performance of the
agribusinesses. A wide range of financial performance measures (profitability, liquidity,
solvency, financial efficiency and growth) will inform the conclusion on how agribusinesses
performed from the year 1998 to 2007.
Subsequently the study will also seek to address the following research questions;
ii. Why have cooperatives converted? What are some of the external and internal reasons
and motives that prompted conversion?
A questionnaire survey will be conducted to gain insight and acquire answers on the key
reasons and motives. The property rights approach will form the basic literature to understand
cooperative conversions.
iii. Are cooperatives necessarily a less efficient organisational structure than the company
business model?
Financial efficiency ratios will be applied to investigate which agribusinesses where
relatively more efficient or inefficient.
iv. Which challenges and opportunities were encountered during the process?
The questionnaire survey will be used to investigate company specific experiences with
regard to the conversion process. The property rights approach will provide the literature
review on some of the challenges and opportunities encountered during the conversion
process, specifically ownership and control issues..
v. What are the implications of such a change to members in as far as services obtained,
shares, control, dividends and member‘s wealth is concerned?
EVA will be used to objectively compare shareholders value. In addition, the questionnaire
survey will be used to show how cooperatives and companies differ in as far as control and
ownership issues are concerned.

26
vi. How does the management reconcile the economic self interest of members versus the
investors, or the developmental imperative versus the economic viability of the
organisation?
The property rights approach, specifically agency theory will inform the study on the issue of
conflict of interest. However, the questionnaire interviews will prompt answers on how such
conflicts of interests are addressed or handled if they do indeed exist.
vii. What are the implications of such a change to investors in as far as shares, dividends
and return to investments is concerned?
The property rights approach will form the basic framework of analysis to understand the
issue surrounding this question. However much of the answers will be obtained from the
financial accounting analysis.
viii. How has the organisation adapted to the needs of an advancing industrial society?
The study will use the questionnaire to investigate dynamism and how the agribusinesses are
adapting to the dynamic environment. A dynamism score card will be used to provide an
objective comparison and score to compare how dynamic the organisations are. Management
theory will provide the theoretical framework to understand organisational dynamism.
ix. How do converted cooperatives differ to those that never converted in as far as
organisation culture, management culture, style, competence and incentives?
The study will use the questionnaire to investigate the different organisation cultures,
management cultures, styles, competence and incentives. Management theory will provide
the theoretical framework to understand the concept of organisational culture, management
culture, style, competence and incentives.

27
CHAPTER THREE
UNDERSTANDING AGRICULTURAL COOPERATIVES
3.1. Introduction
The objective in this chapter is to give an insight of the role of institutions in organizational
design (Institutions as defined as the rules of the game). It is important to discuss the
historical development of agricultural co-operatives in South Africa in order to understand
how and why cooperatives behave the way they do today. The chapter discuses the origin of
cooperatives and the resulting impacts some policies had on their development in South
Africa. For example, why there is a dominance of successful white commercial cooperatives
as opposed to unsuccessful black cooperatives e.t.c. The chapter also discusses the
cooperative thinking, nature and its essence. The core of the chapter is the discussion of the
changes and sometimes conflicting imperatives of cooperatives. This discussion serves to
inform on whether cooperatives do have a role or are obsolete in today‘s modern economy.
3.2 Origin and development of cooperatives
History has been shown to be of significant importance in the shaping of institutions and in
explaining current institutional trends (Karaan (2004) and Van Niekerk (1998)). Cooperative
arrangements and principles of cooperation have been shown to date back to the BC period
(Van Niekerk, 1998). However, the popularity of the cooperative movement began with the
application of cooperative principles to the business organization. Even though earlier
unsuccessful attempts on cooperatives were made by individuals such as Owen, the Rochdale
society of equitable pioneers formed in 1844 is widely acknowledged and publicised as the
first successful cooperative (Birchal (2003); Ortmann & King (2007a); Ortmann & King
(2007b) and Van Niekerk (1998)).
Van Niekerk (1998) states that the Rochdale society of equitable pioneers was formed by a
group of 28 weavers and artisans in Rochdale, England. The underlying reason being to work
together and take advantage of economies of scale by opening their own store selling food
items that they could not otherwise afford individually. In order to avoid failure as was the
case with other groups that attempted cooperative actions earlier, they designed the Rochdale
principles which are still the underlying principles that today‘s cooperatives are based. The
Rochdale principles are discussed below (ICA, 2008);
28
Open membership; The years around the establishment of the Rochdale cooperative
in 1844 coincided with poverty, misery, lack of schools and housing, economic
individualism and the industrial revolution. Almost every other form of organisation
at the time was created to discriminate to ensure that its benefits went to its members
who were of the same class, gender, or religion. However, by having open
membership the cooperative was designed to be accessible to the poor and thus
serving as a developmental organisation.
Democratic control (one person, one vote); The one person, one vote element was a
clear principle that the cooperative was committed to democracy which did not
separate or give powers to different individuals based on their wealth or power. The
co-operative also allowed for equality of opportunity for both men and women to own
shares.
Distribution of surplus in proportion to trade; Profits to the user owner set co-
operatives apart from other firms which pay profits to the owners of capital. The
emphasis on co-operatives was the patronage of its members as compared to their
capital.
Payment of limited interest on capital; The intent of the pioneers was to adequately
reward capital but to use the majority of profits to reward usage. The other
distinguishing element was that shares in the co-operative were maintained at par
value to which interest would be paid, rather than the shares being decided in the
market.
Political and religious neutrality. This principle was added because of Owen, who
held a wide range of views on societies which were very progressive at the time but a
number of them were repugnant to many religious groups. As a result, the Rochdale
co-operative adopted this principle to ensure that the society did not involve issues
which had no relationship to the co-operative.
Cash trading (no credit extended). One of the major causes of failure in earlier
attempts of cooperatives had been the extending of credit to members. Thus the co-
operative felt strongly that it would serve its members better if it educated them to
budget their wages and buy at the co-operative.
Promotion of education; This principle appeared in 1854 after the Registrar allowed
co-operatives to set aside money for education. Prior to that the co-operative had
illegally set aside money for education. Initially the pioneers focused on educating
29
their members through providing courses, adult classes, lectures, newspapers and a
library. Through their education programs, the pioneers were to give their members
the tools to get better jobs and gain newer skills. Later, as public education filled their
role, the co-ops concerned themselves much more with the role of cooperative
education.
The success of the Rochdale cooperative resulted in a wave of cooperative formations around
the world. Agriculture cooperatives were mainly more popular in the USA and Netherlands,
from as early as around 1876 and 1877 respectively. In South Africa, cooperatives are
reported to have been registered even before the union of the then four main provinces, Natal,
Cape, Transvaal and Orange Free State which led to the formation of South Africa in 1910
(Van Niekerk,1998). The Pietermaritzburg consumer cooperative that was registered in 1892
in the Natal province in terms of the Companies Act is argued to be the first probable
cooperative. According to Van Niekerk (1998) cooperatives were mainly involved in three
main areas of business
the purchase and sale of agricultural inputs and equipment
the purchase, storage and subsequent sale of agricultural commodities
transport services
financial intermediaries to commercial farmers at subsidized interest rates
3.3 Policy, economic and regulation influences1
Prior to the union of South Africa, legislation that directly affected cooperatives such as the
Company‘s Act (there was no Cooperatives Act until 1908) and the Natal Agricultural
Development Act of 1904 had little impact on the positive development of cooperatives. The
Companies Act is argued to have been unsuitable as cooperatives could not comply with its
stringent legal provisions. On the other hand, even though the Natal Agricultural
Development Act of 1904 was empowered to grant loans to cooperatives, its influence was
limited because it was not adequately used or used at all. Even though there already were a
few agricultural cooperatives when the Cape Development Act of 1905 was passed, it
resulted in a large number of cooperatives being established in the Cape Province within a
few years because it made available easy loans to agriculture cooperatives. However, a large
number of these cooperatives failed.
1 This section relies heavily on Van Niekerk (1998).

30
The Transvaal Land Bank Act of 1907 played a huge role in the development of cooperative
legislation. The Transvaal Land Bank Act of 1907 led to the creation of the land bank for the
Transvaal that granted loans to cooperatives and enabled cooperatives to regulate their
financial affairs more easily. The Transvaal Land Bank Act of 1907 was passed as the
Cooperatives Act of 1908 in 1908. This act contributed to the successful development of
cooperatives in the Transvaal because of its two provisions that were included to avoid the
shortcomings which emerged in other provinces. The two provisions were (i) unlimited
liability of members jointly and severally, and (ii) a superintendent would be appointed to do
regular inspection of cooperatives. However, the unlimited liability lost popularity because
many members lost a significant amount of money when some of these cooperatives failed.
According to Van Niekerk (1998), after the union of South African states, the Land and
Agricultural Bank of South Africa established in 1912 was fundamental in the development
of cooperatives through the financing of cooperatives. The passing of the Land Bank Act of
1913 saw increased support to white commercial farmers and cooperatives through the
provision of subsidized credit at rates of interest that were cheaper than those available from
commercial banks. The Land Bank was prohibited from making such finance available to
other business organisations (Van Niekerk, 1998).
From the union of South Africa in 1910 to the first Cooperative Society Act, Act 28 of 1922,
several cooperatives were established but several others also disappeared. The shortage of
inspectors and the distrust of farmers in the cooperative philosophy and its application was
regarded as the key reasons for the failure of cooperatives. The first Cooperative Society Act,
Act 28 of 1922 was the first legislation to control cooperatives in all provinces in South
Africa. This gave the registrar the opportunity to treat all cooperatives in a uniform manner
and steer them in the same direction.
The Cooperative Societies Act, Act 28 of 1922 was amended in 1925 when the Cooperatives
Societies Amendment Act, Act 38 of 1925 was passed in order to strengthen the bargaining
power of cooperatives and to give them full control over the products in the interest of all
farmers. This act helped farmers to secure input supply and output marketing services.
However, because of the world depression of 1929 to 1933, the South African economy and
agriculture were affected negatively in terms of dropping prices. Cooperative members
increased even though revenues decreased as they sought refuge in cooperatives. This lead to

31
the birth and reinforcement of the attempts to extend the application of compulsory sale of
produce by means of agriculture cooperatives. Thus the 1933 Commission of inquiry which
contributed significantly to the passing of the Marketing Act 1937 and the Cooperative
Society Act, Act 29 of 1939 was appointed to investigate the cooperatives and agricultural
credit.
The Marketing Act 1937 presented a new era to agriculture and agriculture cooperatives that
would later shape how cooperatives behave even today. The Marketing Act of 1937
introduced different types of marketing schemes for different agricultural commodities. The
powers available under these schemes included monopoly buying, single channel exports,
control over agro-processing and quantitative controls over imports etc. The Act appointed
control boards as the sole marketing organisations which in turn favoured cooperatives
against non-cooperative organisations to serve as agents for the control board. The economic
reason behind such action was argued to be the depression that had caused low prices, which
meant that farmers individual bargaining power was low, so control boards were seen as the
only logical means by which agriculture producers could strengthen their bargaining power,
reduce the gap between producer and consumer prices as well as obtain more satisfactory and
stable prices for their products.
However, in employing control boards, the price forming functions of cooperatives were
destroyed. The fixed prices as set by the control boards meant that all producers, members or
non members received the same price for their products. Thus cooperatives strongest
economic argument for their existences at the time, the bargaining for better prices, fell.
Therefore the incentives to become cooperative members also disappeared. However, their
existence did not disappear? The control boards employed agents to undertake the physical
handling of products (collecting, grading storing and distribution) and in most cases
cooperatives were employed as the agents. Hence, the result was that cooperatives enjoyed
state support and thrived during this era with the majority of cooperatives becoming
monopolies in different key agricultural sectors in the marketing of agriculture produce.
However, perhaps because of the biased nature of the government and political economy at
the time white commercial farmers tended to be primarily favoured to access such services,
support and incentives than black farmers. Thus the cooperatives that thrived were
commercial cooperatives that were predominantly white as opposed to the developing sector,
which is predominantly black.
32
The Cooperative Societies Act, Act 28 of 1922 gave way to the Cooperative Society Act, Act
29 of 1939 in 1939. The Cooperative Society Act, Act 29 of 1939 included recommendations
of the 1933 Commission of inquiry into cooperatives and agricultural credit. After 1939 to
around 1960 the trend in cooperative development changed. Contrary to popular opinion that
cooperatives should only serve a certain magisterial district and undertake a restricted series
of functions, there was a noticeable trend in the direction of larger cooperatives expanding
their branches and depots over large areas with a central head office. This was especially the
case of most grain cooperatives in the Transvaal, Orange Free State and to a lesser extent in
the Eastern, Southern and Western Cape. The principle of unlimited liability lost popularity
and the number of cooperatives with unlimited liability reduced in numbers as most
converted to limited liability.
In 1963 a Commission of inquiry was set up which led to the publication of the Steenkamp
report in 1967 which was fundamental to the formulation of the Cooperative Act, Act 91 of
1981. The Cooperative Act, Act 91 of 1981 provided for the establishment, incorporation,
functioning, winding up and dissolution of cooperatives, and the appointment of the Registrar
of cooperatives. The Cooperative Act, Act 91 of 1981 incorporated some agreements that
were reached between the government and the South African Agriculture Union in 1979
based on recommendations made by the Steenkamp Report in 1967.
The Marketing of Agricultural Products Act, No 47 of 1996 led to the deregulation of the
agriculture sector accompanied by reduced state support and intervention (Groenewald, 2000)
and Vink & Kirsten (2000)). Control boards and marketing schemes were disbanded. This
resulted in a shift to a market economy that sought to allow free and fair participation by all
the different stakeholders. As a result, organizations were exposed to increased competition
from both local and international stakeholders (Doyer et al (2007); Groenewald (2000) and
Vink & Kirsten, (2000)). The transition from a regulated era with massive state support to a
much more competitive deregulated market economy era meant that cooperatives had to be
competitive if they were to survive. Cooperatives no longer enjoyed the support and
preferential treatment that they were accorded as agents for control boards and support from
the land bank. Thus a number of cooperatives faced viability challenges or the pressure of
competition (AGRITV (2003); Groenewald (2000); Kruger (2000); Ortmann & King
(2007b); Ortmann (2005); Ortmann (2002)). Thus there was a noticeable trend in various
restructuring actions such as consolidations, mergers, acquisitions, strategic alliances, joint
33
ventures and organisational changes such as strategic diversification, vertical integration,
horizontal integration and conversions with reported cases of a number of cooperatives
closing down (Competition Commission, 2006).
History of the policies and legislation show that biased support was given to commercial
agriculture cooperatives which were predominantly white as opposed to the developing
cooperatives that are predominantly black. Thus the development of cooperatives in South
Africa is best described by two parallel advancements, successful agricultural commercial
cooperatives versus hugely unsuccessful cooperatives in the developing sector (Holloway et
al (2000); Kirsten & Satorious (2002) and Van der Walt (2005)). However, this is not to say
that there haven‘t been any cooperative failures in the commercial sector, cases of failure
have been reported from as early as 1905 (Van Niekerk, 1998). In a recent study of a sample
of 54 registered cooperatives in Limpopo province, Van der Walt (2005) found that reasons
provided for their failure are poor management, lack of training, conflict among members and
the lack of funds, and operations never started after registration.
When the new ANC led government came into play in 1996, inequality was viewed as one of
the main challenges and issues to be dealt with (ANC, 1994). Thus, the growth and support of
co-operatives, especially among historically disadvantaged South Africans, was taken as a
strategy to alleviate poverty and create jobs (Mpahlwa (2005) and Philip (2003)). In light of
such endeavours, the Cooperative Act, Act 91 of 1981 was considered to be unsuitable to
achieve such a strategy mainly because (Ortmann & King, 2007b);
the focus was too much on large, commercial agricultural co-operatives only
the definition of co-operative was not adequate
compliance with co-operative principles was not explicitly required from cooperatives
the registration process was complicated
members' interested were not sufficiently protected.
Based on these shortcomings and the need to enforce cooperatives as a strategy to fight
poverty and create jobs, the Cooperatives Act, Act 14 of 2005, which is mainly characterized
by the following purpose and provisions was passed (DTI, 2008);
A wide variety of primary cooperatives can register in terms of this Act (including
agricultural, consumer, housing, worker, financial services, burial society, and service
34
cooperatives), as well as secondary cooperatives (formed by two or more primary
cooperatives to provide sectoral services to its members) and tertiary cooperatives
(whose members are secondary cooperatives, and whose objective is to advocate and
engage state institutions and the private sector on behalf of its members).
Enable co-operatives to register and acquire a legal status separate from their
members and facilitate the provision of targeted support for emerging co-operatives,
particularly those owned by women and black people.
Promote equity and greater participation by black persons, especially those in rural
areas, women, persons with disability and youth in the formation and management of
co-operatives.
Facilitate the provision of support programmes that target emerging cooperatives.
Despite being introduced recently, the Cooperatives Act 2005, Act 14 of 2005 was criticised
for its limitations and the failure to take note of international cooperative trends (Agricultural
Business Chamber (2008) and Lyne & Collins (2007)). Lyne and Collins (2007) argue that
the Cooperatives Act 2005, Act 14 of 2005 perpetuates the notion of traditional co-
operatives, ignoring trends in developed countries where co-operative legislation has been
amended to encourage investment by patron and non-patron members. Admittedly, trends
originating in developed nations may not be appropriate in developing countries, but the
underlying problems that these changes aimed to address will also constrain development-
oriented co-operatives in South Africa. This notion is further stressed by the Agricultural
Business Chamber (2008) who state that their argument to reconsider such issues were not
considered when passing the ACT as the argument turned political. However, experience
from developed countries and in most commercial cooperatives in South Africa indicate that
traditional co-operatives always come short at raising sufficient capital to finance investments
needed to compete in the changing and competitive global food markets because of their
institutional arrangements discouraged equity investors (Agricultural Business Chamber,
2008).
3.4 Cooperative thinking, nature and essence
3.4.1 Development imperative
Even though the existence or formation of cooperatives is argued to be motivated by
economic reasons, there is wide acknowledgement that cooperatives are founded as a

35
development or social reforming institution (Birchall (2003); Hagerman (2005); Krivokapi-
Skoko (2002); Mooney & Gray (2002); McKee (2006)). The key drivers to the formation of
the Rochdale cooperative and earlier cooperatives appears strongly to have been motivated by
the developmental need of the members at the time by protecting and assisting its poor
members to survive the rising prices (Birchall (2003) and Van Nierkek (1998)). Birchall
(2003) also states that cooperatives were viewed as a revolution to the capitalist system of the
time. The Rochdale cooperative principles illustrate a cooperative as development oriented
and as a means of reducing poverty. Because they were open to new members, did not require
people to invest large amounts of capital, and tended to share economic results equitably,
cooperatives were argued to have a tendency to benefit the poor. Thus their development
imperative was potentially strong as compared to other forms of economic organization,
especially if their values and principles were respected.
The Rochdale principles have since been changed and most cooperatives are adopting
cooperative principles as stated by the International Cooperative Alliance (ICA, 2008). The
new cooperative principles still regard a cooperative as a development organisation but also
emphasise the need for cooperatives to be economically viable if they are to satisfy their
development imperative (ICA, 2008). Thus the commercial imperative is not viewed as the
primary goal of the cooperative but the means to assist members and member communities to
be developed. Birchal (2003) states that the origins of the now successful cooperative credit
banking and agricultural cooperation in Germany started as a bid to distribute food to the
desperate farmers around the 1840s. In Denmark, Canada and the United States, agricultural
cooperatives enabled a whole class of small farmers to reach export markets whereas
throughout Europe, Raiffeisen-type rural cooperative banks were providing a means of saving
and borrowing for farmers (Birchall, 2003). New generation agricultural cooperatives in the
United States have created wealth for poor farmers in the Mid-West through adding value to
members produce (McKee (2007) and Altshul (2002)). Urbanchuk (2007) states that the
impact of cooperative ownership of ethanol production in the USA is as much as 40 percent
larger than the impact of an absentee owned corporate plant to the community. Various other
studies indicate the development imperative of cooperatives (see Altshul (2002); Cooperative
Care (2002); Munkner (2001); Murray (2006); Patel (2001); Parnell (2001); Taylor et al
(2002)).
36
In the context of South Africa, there has been a resurgence of the co-operative movement
with a strong focus on the emerging cooperatives. Cooperatives are acknowledged as an
organization that could empower the poor and address the challenges of unemployment
(Mpahlwa (2005) and Philip (2003)). Barraket (2001) gives a comprehensive view of the role
cooperatives play in community development or revitalisation. FAO (2001) and Munkner and
Shrestha (1999) show that milk cooperatives in Bangladesh have been instrumental in
poverty reduction among the landless and small or marginal farmers. Birchall 2003 shows the
role that cooperatives have played to the tribal communities (Tribal communities are among
the world‘s poorest people). Ruben and Lerman (2004) argue that despite the relative merits
of individual farming to cooperatives in Nicaragua, peasants still patronize cooperatives
because cooperatives assist in addressing uncertainty associated with land ownership as well
as to capture the benefits of rural development programs. Other notable studies of
cooperatives in developing countries include those by Cabo and Rebelo (2006), Francesconi
and Ruben (2007), Gertler (2001), Glasbergen (2000), Maharjan and Fradejas (2006),
Nickson (2000), Schwettmann (2001), Parnell (2001) and Zeller (2006)). Despite the above
arguments, Munkner (2001) argues that cooperatives often do not benefit the poorest of the
poor because they need members who are able to pool their resources in order to reach a
common goal which could be out of reach for the poor.
3.4.2 Political imperative
In their historical origin, cooperatives were clearly also political institutions. Birchal (2003)
and Van Nierkek (1998) show that the motivation of the Owenites and the formation of the
Rochdale cooperatives appears to have been motivated by the need to fight the capitalist
system of the time. As a result, the development of cooperatives generated intense political
opposition from competing economic interests. Ruben and Lerman (2004) state that
cooperatives can only succeed in the right environment, as their success or failure was
affected by the culture, the politics, the system of land tenure, level of education, and
prevailing ethical standards in a country. In addition, Birchall (2003) indicates that the
political structures within a country frequently influenced cooperatives or used them to justify
political means.
The political imperative of cooperatives is also best illustrated by Olson (1960) through the
Kirkpatrick type of cooperatives. The cooperative was controlled by a legally separate
political and lobbying organisation not by the patrons themselves. For example, the Illinois
37
agricultural association, held all the voting stock in the cooperative business and mutual
insurance companies that were associated with it. In another case, the cooperative marketing,
supply and insurance companies associated with the Farm Bureau in Illinois were run by an
organisation that was legally and completely separate. The organisation had legislative and
lobbying objectives rather than the business or economic objectives cooperatives and mutual
insurance companies normally had.
Olson (1960) states that the system was set up in such a way that the business purposes of the
purely economic parts of the system would always be completely subordinate to the political
part of the system. Thus even if cooperatives had their own objectives, they could not escape
the political influence and could be used to pursue political objectives. Political and lobbying
organisations usually had enough strength and influence to attract membership. For example
the farm bureau did not allow some of the business enterprises to sell their products to anyone
who was not and would not become a member of the political organisation (Olson, 1960).
Farmers therefore realised that they were bound to lose out patronage dividends or other non
collective business benefits and a lot of money if they did not join such political groups.
In South Africa, cooperatives have been used as a political tool. The era of control boards
under the Marketing Act of 1937 and the biased support of the land bank indicates the
political imperative of cooperatives. The political environment at the time was biased towards
furthering the interest of whites as opposed to blacks (Van Niekerk, 1998). During the era of
control boards in South Africa, white commercial agricultural cooperatives were the main
organisations employed as agents for the control boards, they also received favourable
financial support from the land bank. In addition, further political bias is illustrated by the
allocation of low interest loans to cooperatives which were not offered to other business
organisations.
Cooperatives have shown that they require enabling legislation to be successful, for which
they need political influence. Ruben and Lerman (2004) show that in Nicaragua, under the
Soviet system cooperatives were taken over by the state or reduced to be mere agencies of the
government, whereas under fascist dictatorships, they were taken over, their assets stripped,
their leaders murdered, imprisoned, or exiled. Birchall (2003) shows that agricultural
cooperatives began a close relationship with government in many countries, regardless of
ideology; as shown in the United States, Japan, the Republic of Korea, India, France e.t.c.

38
Agriculture was seen as too important a part of national economies to be left entirely to
market forces and thus warranted political intervention especially in light that cooperatives
were often the preferred alternative to capitalist owners who might exploit natural
monopolies in the food production chain.
3.4.3 Commercial imperative
Barton (1989), Cook (1995), Hind (1997), Henehan and Anderson (2001), and Schrader
(1989) suggest that cooperatives have a strong commercial imperative and their motivation is
economic. During the Rochdale cooperative era, cooperatives were means by which
individuals could acquire lower purchase prices, higher sales prices, and larger cash
dividends (Birchall, 2003). Though such motivations could have been developmental or
political there is a strong sense of the economic need of the individuals at the time. Cook and
Chaddad (2000), Fulton and Giblings (2000) and Krivokapic-Skoko (2002) show that
globalization and agro-industrialisation has increased competition and resulted in a changing
market environment. Thus, to be successful, cooperatives just like any other organisation
have had to adopt their organisational structure or strategies. Of major note is that it has led to
a conflict on how to balance the cooperatives` duty to maximise cooperative member
individual benefits and interests yet being be a profitable, well-financed and a growing
business which is core to survival in today‘s business environment.
Cook and Chaddad (2000) state that strategies to build a competitive edge can comprise
engaging in value-added processing, brand name development, and entry into international
markets, e.t.c. These strategies have been shown to result in more capital intense, larger and
more often commercial oriented cooperatives in order to finance such actions. The key issue
for co-operatives has been shown to be running successful businesses while adhering to the
co-operative principles (ICA, 2008). Although the primary goal of a co-operative
organisation is to provide a service to members and not to maximize profits, co-operatives
have come under pressure to be profitable or at least generate sufficient revenue to cover
expenses, lower costs and ensure its survival and growth. Thus cooperatives appear to have a
strong commercial imperative.
Piesse et al (2004) argue that grain cooperatives in South Africa are now market oriented and
behave more like companies. Initially, cooperatives were used as instruments of government
policy, but when the agricultural sector was deregulated many cooperatives disappeared,

39
whilst those with strong leadership and good management began to prosper as autonomous
businesses (Van Niekerk, 1998). In addition, Piesse et al (2004) show that cooperatives have
responded by changing the focus of their activities and increasing their economic efficiency.
Cote et al (2000), Evans and Meade (2005), and Henehan and Anderson (2001) state that the
primary underlying motivation to form a cooperative is basically the same as forming any
other business. However, in an investor oriented firm (IOF), an individual investor seeks out
an investment opportunity yielding the greatest growth potential or highest return on
investment possible and often they will have little or no direct involvement in the business
itself, other than as a shareholder. On the contrary, the prospective member-owners of
cooperatives are frequently not simply seeking the highest possible return on their
investment, but a set of returns associated with becoming a member which may include
services, better prices, user control, access to markets, along with a return on capital invested
(Henehan and Anderson, 2001).
Cooperatives have also been shown to grow to an extent that they behave more like
commercial oriented units. For example, approximately 60% of the French banking sector is
formed by co-operatives and mutual associations, which are very successful businesses while
remaining true to the values of the co-operative movement (ICA, 2008). But it is clear that
there would not be successful businesses if they had not embraced some commercial
imperative concepts. ICA (2008) argues that the unique characteristics that differentiates
cooperatives from other enterprise structures is its dual nature that is they are business
enterprises based on a membership-owned model. Thus cooperatives are an alternative
organisation pursuing successful commercial business practices based on the values of self-
help, self-responsibility, solidarity, user control and democracy.
3.5 Summary: Are cooperatives relevant or obsolete
Changes such as increased competition, changing policies, changing consumer profiles,
interests or tastes are becoming too evident (Kyriakopoulos et al, 2004). As such, business
organizations are forced to adopt their organizational structures and strategies to match such
changes (Cook and Chaddad (2000); Evans and Meade (2005); Heit (2007); Kyriakopoulos et
al (2004); O‘Connor (2001) and Sykuta and Cook (2001)). Cooperatives are hence forced to
pursue competitive strategies and be dynamic in response to structural and other changes in
the market place. Clearly, such trends indicate a move towards more competitive oriented

40
business models. Van Nierkek (1998) argues that the primary objective of cooperatives is to
facilitate economic interaction through collective action and enabling members to gain access
to a certain market service or asset, take advantage of economies and partake in activities
they would never afford or manage individually. Thus a co-operative has inherent objectives
of assisting members to enable them to earn profits in their own right but not for the
cooperative to necessarily become a profit organization. Therefore the development
imperative of co-operatives is achieved through the facilitation of economic activities by the
empowerment of members to participate as businesses.
An organization with a purely social or development objective would focus on service
delivery for no gain or profit. This is especially true for where the market system fails and
does not provide a specific service and where the community consequently comes together to
provide that service collectively and in this way also enhances the general livelihood and
alleviate poverty within the community (Birchall, 2003). This was the case in earlier
formations of cooperatives around the world (especially the Rochdale period) and in some
parts of the developing sector of the South African economy. However, in today‘s
competitive business environment, challenges to sustain the organisation and enable it to
service its members has meant that cooperatives are under pressure to adopt a commercial
approach and behave like viable business organisations in order to meet the members` needs
(Ortmann & King (2007a, b)).
Given the above insights, are cooperatives still relevant? Firstly because of their essence,
cooperatives have a social objective to a certain extent, thus tend to get captured by the
government, and are used as instruments of government policy where they get
bureaurocratised and in the end lose their efficiency and effectiveness. Some of the
government actions emanate from the strong and sound argument of the role cooperatives can
play in development. However, if the socialist agenda or their development imperative is
allowed to dominate without a closer concern for their sustainability, co-operatives then
become irrelevant as economic entities. Conclusively, in order for commercial cooperatives
to be relevant as commercial and economic entities, South Africa needs to adopt business
conducive and supportive policy as has been the case in developed countries such USA,
Netherlands, and Canada e.t.c.
41
CHAPTER FOUR
ORGANISATIONAL PERFOMANCE:
DYNAMISM AND FINANCIAL PERFOMANCE
4.1 Introduction
Chapter four discusses the literature on organisational dynamism and financial performance.
Profitability, liquidity, solvency, efficiency and growth ratios are used as the key financial
performance measures to compare agribusiness performance, taking into consideration the
inherent differences between cooperatives and companies. In addition, dynamism as shown
by the firms` management, organisation strategies organisation culture will be discussed in
this chapter. Dynamism is an important determinant of business performance and explains
how organisations adapt to the dynamic business environment and why some businesses
organisations perform better than others.
4.2 Organisational performance
4.2.1 Financial performance
Financial performance is fundamental to the success and sustainability of any business.
Despite several measures of success that business organizations strive for such as status,
market share e.t.c., the bottom line for any business is to be financially successful, otherwise
the business becomes unsustainable in the long run (Boehlje et al (1999); Davidson (2005);
McKee (2006); Miller et al (2001)). The key financial performance measures that are mainly
used by most businesses are profitability, liquidity or solvency, efficiency and growth ratios.
These measures are discussed in table one.
Due to the differences in the nature and essence of companies and cooperatives, their
comparative financial performance is argued to have different interpretations and
expectations (Kyriakopoulos et al, 2004)). Traditionally, profitability is thought to be the real
economic goal of the firm. Cooperatives are not considered to be return on investment
maximizers like companies, their members traditionally expect to receive their returns in the
form of improved market access or lower input prices, rather than a direct return on their
equity investment in the cooperative (Henehan, & Anderson (1989); Henehan, & Anderson
(2001)). In addition, Kyriakopoulos et al (2004) state that cooperatives operate differently
from companies because of the three basic cooperative principles that define the essence of a
cooperative organisation mainly: user-owned, user-benefit and user-control. These service

42
benefits reduce the cooperatives‘ return on investment by lowering revenues and increasing
costs. Comparatively, companies have a clear objective to maximize profitability because of
their built in goal of maximizing shareholder value. Mixed evidence has been found
regarding this interpretation (Evans & Meade, 2005). Some cooperatives have been shown to
outperform companies in terms of profitability (Boyle (2004); Babb & Boynton (1981);
Hardesty & Salgia (2004); Lerman & Parliament (1990)). In addition, in today‘s challenging
business environment, cooperatives have been pressured to be profitable in order to best serve
their members interest.
Both cooperatives and companies aim to achieve financial growth over time. However,
expectations are that cooperative growth is constrained because of the inherent weaknesses of
the cooperative business model, chiefly their constrained capacity to raise equity capital
(Cook, 1995). Thus, as long as cooperatives are best serving the primary interest of their
members, the expectations is that profit, revenue and asset growth are secondary. The same
concept applies with regard to the liquidity and solvency ratios of the cooperative. However,
because of the challenging business environment, both companies and cooperatives are
expected to maintain sound and sustainable liquidity and solvency ratios. Finally, because
cooperatives have the ultimate drive to service members in the best way possible, they search
for the best ways to provide services or products in the cheapest way possible even though
this could be beneficial to the members it could lead to the inefficiency of the cooperative as
an organisation (Porter & Scully, 1987). On the other hand, companies have the ultimate
drive to be efficient in order to perform and increase profitability.
Despite the relative importance of financial performance measures it is necessary for business
organisations to develop a benchmarking tool that provides goals for realistic improvement
and helps the business to understand the changes required for improving financial
performance (Porter (1980) & PWC (2006)). Benchmarking is important mainly because it
(O‘Dell (1993) & Watson (1992));
Provides a reliable way of assessing the relative performance of the business.
Improves strategic planning and provides an assessment of the organization's
strengths and weaknesses
Establishes challenging performance goals and stimulates better performance

43
It is of great importance to choose the appropriate type of benchmarking. The following
describe the benchmarking methods that can be used (O‘Dell (1993) & Watson (1992));
External benchmarking identifies organizations providing similar products or
services and compares their results. The study uses external benchmarking as
calculated by the PWC agribusiness benchmarking survey.
Internal benchmarking compares an organization's own similar processes or
products. This is the easiest type of benchmarking to perform, but is limited to the
organization's best internal practices. It should be considered as a means of
establishing a baseline performance that will later be used for comparison to external
performance and to identify the scope of improvement opportunities
Analogous benchmarking is considered the most difficult and most desirable type of
benchmarking as comparison is made with a world-class organization which may be
performing a similar process but in a different field. Such organizations are hard to
identify and may require adjustment in accounting and other practices
4.2.2 Organisational dynamism
Organisational dynamism refers to the ability for organisations to respond to the
unpredictable and rapidly changing business environment (Ensley et al, 2006). Organisational
dynamism has a significant impact on performance. In today‘s dynamic environment,
organisations have to be dynamic and embrace changes with speed and comprehensiveness to
be successful (Leach, 2003). Organisation dynamism is shown by the changes the
organisation undertakes in response to or in anticipation of market changes (Priem et al,
1995).
Ensley et al (2006) indicates that in today‘s modern dynamic environment, organisations that
consider more alternatives tend to outperform those who do not. Thus flexibility in decision
making is important for organisational dynamism. Eisenhardt (1989) found that the behaviour
of effective decision makers working in dynamic environments is characterized by speed and
comprehensiveness. These results suggest that effective decision makers maintain
sophisticated information search and processing routines, whereas less effective decision
makers resort to using less complex routines to cope with the time pressure and stress that is
brought about by the uncertain and rapidly changing environmental conditions. Because the

44
decision making function is mainly allocated to management, dynamisms can best be
explained by looking at management behaviour (Porter, 1991).
The culture, structure and strategies of the business model also affect organisational
dynamism and are discussed in the next section. However, for organisational culture,
structure and strategies and management to be effective in the organisation, the policies and
business environment have to be appropriate. For example, the deregulation of markets and
withdrawal of state support in South Africa put pressure on organisations to be dynamic.
However, even dynamic organisations are battling to adapt to new regulations such as the
new Cooperatives Act (Act 14 of 2005) that limit cooperatives to adopt modern cooperatives
model. Secondly, an amendment to the Petroleum Products Amendment Act has seen most
agribusinesses denied PPAA licensing even though, acquiring such licensing is a response to
the changing environment.
4.2.2.1 Organisational culture, strategy and structure
Organisational culture is defined as the shared beliefs and values that shape the attitudes of
members, guides behaviours at work and influences the behaviour, performance goals and
aspirations of members (Schermerhorn et al, 2005). Establishing the correct and appropriate
organisational culture is an essential process of managing an organization. Organisations with
strong culture operate with a clear vision of the future that is supported by well developed
and well communicated beliefs and values. According to Schermerhorn et al (2005) high
performance organisations have value driven cultures that emphasise the following values;
information sharing, teamwork, empowerment, participation and continuous learning.
Schermerhorn et al (2005) based on an approach for mapping organisational culture,
categorise organisational cultures into three categories; (i) passive/defensive cultures, (ii)
constructive cultures and (iii) aggressive/defensive cultures as shown in Figure 3. In
constructive cultures members are encouraged to work together in ways that meet higher
order human needs. This has been found to be the most effective culture because workers
tend to work with greater motivation, satisfaction, teamwork and performance. In
passive/defensive cultures, members tend to act defensively in their working relationships,
seeking to protect their security. In aggressive/defensive cultures, members tend to act
forcefully in their working relationships to protect their status. In passive/defensive or
aggressive/defensive cultures motivation tends to be lower and work attitudes less positive,
thus resulting in poor or reduced performance.
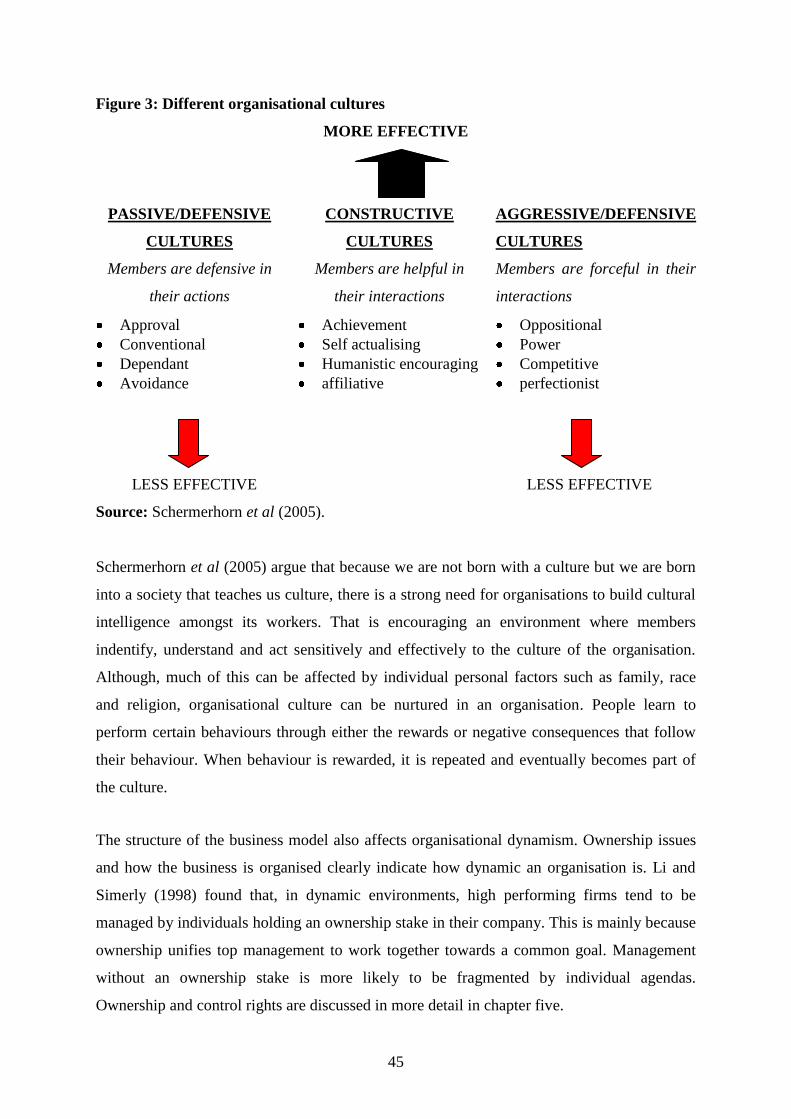
45
Figure 3: Different organisational cultures
MORE EFFECTIVE
PASSIVE/DEFENSIVE
CULTURES
Members are defensive in
their actions
Approval
Conventional
Dependant
Avoidance
CONSTRUCTIVE
CULTURES
Members are helpful in
their interactions
Achievement
Self actualising
Humanistic encouraging
affiliative
AGGRESSIVE/DEFENSIVE
CULTURES
Members are forceful in their
interactions
Oppositional
Power
Competitive
perfectionist
LESS EFFECTIVE LESS EFFECTIVE
Source: Schermerhorn et al (2005).
Schermerhorn et al (2005) argue that because we are not born with a culture but we are born
into a society that teaches us culture, there is a strong need for organisations to build cultural
intelligence amongst its workers. That is encouraging an environment where members
indentify, understand and act sensitively and effectively to the culture of the organisation.
Although, much of this can be affected by individual personal factors such as family, race
and religion, organisational culture can be nurtured in an organisation. People learn to
perform certain behaviours through either the rewards or negative consequences that follow
their behaviour. When behaviour is rewarded, it is repeated and eventually becomes part of
the culture.
The structure of the business model also affects organisational dynamism. Ownership issues
and how the business is organised clearly indicate how dynamic an organisation is. Li and
Simerly (1998) found that, in dynamic environments, high performing firms tend to be
managed by individuals holding an ownership stake in their company. This is mainly because
ownership unifies top management to work together towards a common goal. Management
without an ownership stake is more likely to be fragmented by individual agendas.
Ownership and control rights are discussed in more detail in chapter five.
46
In the ever changing business environment, organisational strategies should reflect and
highlight the unique circumstances that will affect the firm‘s future. Questions that arise
about the organisations` strategy include, (i) the firms‘ role and level of participation in
corporate social investment, (ii) the nature of environmental sustainability or eco sensitive
initiatives, (iii) nature of investments, (iv) the restructuring actions it has or is considering
undertaking, (v) the BEE score, (vi) accounting reporting method, (vii) changes in customers,
(viii) changes in product mix or services and value addition? These questions define how an
organisation will differentiate itself from its competitors and how well they are adapting to
the dynamic environment (Kyriakopoulos et al, 2004).. In addition, these issues are and will
continually shape how businesses in South Africa build competitive advantage through their
strategies.
Rowe (2005) states that four hundred years earlier, social responsibility shifted from the
church to the state, as government replaced religious institutions as society‘s predominant
force. The current trend and expected future trend is that business organisations are more than
likely to take over this responsibility. Various arguments and criticisms have been raised
against corporate social responsibility (Friedman (1970); Orlitzky et al (2003); Rowe (2005);
Williams & Aguilera (Undated)). The biggest question being whether business can meet
social, environmental and responsibility still win financially. However, Porter and Kramer
(2006) present a strong argument that when looked at strategically, corporate social
responsibility can become a source of tremendous social progress as the business applies its
considerable resources, expertise and insights to activities that benefit society because
successful organisations need a healthy society. Porter and Kramer (2006) argue that dynamic
organisations prioritise social responsibility into generic social issues, value chain social
impacts and social dimensions of competitive context2.
4.2.2.2 Management style and culture
It is widely acknowledged that it's important for a company to have a good management team
because it is the backbone of any successful organisation. The main importance of
management emanates from its responsibilities to make strategic decisions and leading the
2 Generic social issues may be important to society but are neither significantly affected by the company‘s
operations nor influence the company‘s long term competitiveness. Value chain social impacts are those that are
significantly affected by the company‘s activities in the ordinary course of business. Social dimensions of
competitive context are factors in the external environment that significantly affect the underlying drivers of
competitiveness in those places where the company operates.
47
company. However, evaluating management is difficult because so many aspects of the
management job are intangible. Hambrick and Mason (1984) state that there is no magic
formula for evaluating management, but there are factors to pay attention to. Management
culture and style, management competence or ability and management incentives are
discussed in this study as they relate strongly to management performance and ultimately
organisational performance.
Management styles can best be explained by the way management manages relationships
with other stakeholders and the manner management leads the company (Sashkin & Morris,
1984). According to Benfari and Knox (1991), differences in management styles occur in
four critical areas, (i) How managers perceive and judge the world around them (ii) how
managers gain a sense of personal satisfaction and competence (iii) how managers handle
conflict, and (iv) how managers use power. As a result, there are various ways to describe
management styles. Autocratic management styles describe management that typically tends
to centralise authority, dictate work methods, make unilateral decisions and limit subordinate
participation. Democratic management styles describes management that tends to involve
subordinates in decision making, delegates authority and use feedback as an opportunity for
coaching subordinates. The lassez faire management styles generally give the group complete
freedom to make decisions and complete the work in whatever way it sees fit (Robbins &
Coulter, 1996).
Management styles may also be determined by the characteristic of management. For
example a quiet or behind-the-scenes management style, out-front, take-charge type, a formal
as opposed to an informal relaxed style. Transactional management style is focused on
motivating the behaviour of subordinates through exchange processes, such as administering
rewards and punishments. In doing so, transactional management style capitalizes on the self-
interests and extrinsic motives of their employees. On the other hand, transformational
management style is focused on motivating followers by appealing to their ideals and
intrinsic motives. Transformational management style inspires others to adopt the vision of
the organization as though it were their own and to focus their energy towards the
accomplishment of higher level goals, rather than the attainment of rewards or avoidance of
punishments (Sashkin & Morris, 1984).
48
Management style should be adapted to suit the generation of employees at the workplace.
Conger (1997) indicates that there are three generations working in today‘s organisation, the
silent generation, baby boomer generation and the generation X. These generation shifts play
a significant role in shaping how employees of the organisation prefer to be managed. In
today‘s working environment, clearly a more informal, team and persuasion based
management style will succeed with the baby boomers and generation X as opposed to the
formal style with a clear distinction between management and employees that worked well
with the silent generation (Conger, 1997).
Management styles can be translated to the management culture of the organisation. If the
management culture is not hierarchical, the line of command between the boss and the
employees is short, and in principle everyone, regardless of education, position or social
status is regarded as equal (Christine, 2006). Thus management listens to its staff and is
willing to take advice because they see them as specialists in their own fields. It is common to
find management taking lunch with the staff and standing in the same queue in the canteen.
The opposite is true for a company with a hierarchical management culture where there is
clear distinction between management and other staff.
4.2.2.3 Management competence or ability
According to Mann (1965) there are four managerial skills that are essential for management
to carry out their duties well. Technical skills which are needed to perform specific tasks;
interpersonal skills which are needed to effectively manage interpersonal relations;
administrative skills which are needed to plan, organises, coordinate and effectively do duties
that are assumed to be managers normal responsibilities and institutional skills which are
required if the manager is to effectively represent the organisation to other organisations and
to society at large. These are discussed in more detail in Table 3. However, different
managerial positions require different degrees of each of the basic four skills. At the
executive level, institutional skills, interpersonal skills and administrative skills are by far the
most important. Whereas at mid management level, a balance of the four skills is important
although with much emphasis on the interpersonal skills and administrative skills. At a
supervisory level, technical skills, interpersonal skills and administrative skills are crucial.

49
Table 3: Mann’s four skills
TECHNICAL SKILLS
The ability to use knowledge, methods, techniques, and equipment
necessary for the performance of specific tasks and activities. These
may be acquired through formal training in professional skills,
informal on job training or combination of school and
apprenticeship programmes
HUMAN RELATIONS/INTERPERSONAL SKILLS
The ability to use pertinent knowledge and methods for working
with people. Includes an understanding of general principles of
human behaviour, particularly those that involve interpersonal
relations and motivation, and the use of this understanding in day to
day interaction with others in the work situation. The supervisor
with human relations skills understands how the principles of
behaviour affect not only others but himself too. He knows hoe both
his own frame of reference and that of others colour what is
perceived and assumed in reality; how attitudes, beliefs, opinions
and values affect behaviour and learning, and how needs and
aspirations shape an individual‘s investment of his energies.
Included in these skills is the ability of members at different levels
in the organisation to represent their needs and goals to each other
so that each can comprehend the problems faced by the other.
Central to human relations skills is the ability of the supervisor to
integrate the goals of individual with the objectives of the
organisation. The supervisor must be able to identify the needs of
others that are central to the self concept and to relate these to
organisational objectives in a manner that is psychologically
meaningful and rewarding to the specific individual. Basically, this
area of skills involves managing the emotional and motivational
dimensions of interpersonal relations and organisation.
ADMINISTRATIVE SKILLS
The ability of the manager to think and act in terms of the
organisation within which he operates; the functions and tasks that
he must fulfil in order to effectively perform his job relates to the
tasks and goals of the organisation. Administrative skills include
planning, organizing, assigning the right tasks to the right people,
giving people the right amount of responsibility and authority,
inspecting and following up on work, and coordinating the efforts
and activities of different organisation members and departments
INSTITUTIONAL SKILLS
This set of skills involves representing the organisation as a whole in
interaction with the other organisation, groups, government agencies,
and so on, that form the environment of the organisation. People
differ in their ability to see, think clearly about, appraise, predict and
understand the demands and opportunities posed to the organisation
by its environment. If a leader is seriously mistaken about the
requirements or needs of the organisation, or about the demands of
the environment, his interpersonal and administrative skills may
become liabilities to the organisation. It is worse to be wrong and
influential than to be merely wrong. It is the top level executive who
needs these institutional skills the most. Part of this category of skills
is an external perspective- an accurate and comprehensive view of
the organisation environment relationship – which includes
sensitivity to environment demands and opportunities (the
possibilities of achieving a more advantageous relationship with the
environment) and sensitivity to trends and changes in the
environment.
Source: Mann (1965) in Sashkin and Morris (1984).
Hambrick and Mason (1984) suggest that heterogeneous top management teams perform best
in dynamic environments, whereas homogeneous teams perform best in more stable
environments. Hambrick and Mason (1984) argue that diverse teams are more capable of
making sense of ambiguous situations than are less diverse teams, which are likely to operate
with a more narrow perspective. Priem (1990) also shows that the level of consensus within
top management teams will likely relate to performance such that low consensus teams will
50
perform best in dynamic environments, whereas high consensus teams will perform best in
stable environments. In support of these complimentary views, a study by Homburg et al
(1999) found that top management team consensus tends to have a lower impact on
performance in dynamic rather than stable environments.
4.2.2.4 Management incentives
Business organisations use various management incentives to enhance performance
(Demsetz, 1983). The most commonly used management incentives are mainly the (i) share
option, (ii) profit share, (iii) incentive bonus and (iv) honorary rewards or non financial
recognition. Share options have long been used as an incentive to ensuring that management
increases shareholder value. Demsetz (1983) indicates that when management owns a
measurable proportion of its shares, it serves as good enough incentives for high performance
and better management as they are not only managing the owners interest but their own as
well. Demsetz (1983) argues that share options are a good incentive for management not to
shirk. In addition, when management have share options, it is much easier to read their
actions concerning the value of shares and future expectations. However, there are cases or
dangers for management to do whatever it takes to drive up the share price so they could vest
their options to make quick returns at the expense of long-term investors.
Profit shares guarantee management a certain specific portion of profits if the company
performs well. Thus profit shares serve as a performance incentive because if the company is
performing well then management also gets a good share of the profit. However, profit shares
also suffer from the same weakness of management driving to increase high profits even if it
means incurring high debts that could affect the company in the long run. Incentive bonuses
are also another form of financial compensation management gets for good performance.
Other companies use non financial recognition such as honorary rewards as management
incentives to encourage performance. Though not financial in nature and argued not to offer
incentive enough to encourage performance, these non financial recognitions can encourage
performance especially if they are highly valued in the organisation for other opportunities
such as promotion.
4.3 Summary
Financial performance is fundamental to the success and sustainability of any
business
51
Benchmarking is important to provide goals for realistic improvement and help the
business to understand the changes required for improving financial performance
The study uses external benchmarking as calculated by the 2006 PWC agribusiness
benchmarking survey.
Organisational dynamism refers to the ability for organisations to respond to the
unpredictable and rapidly changing business environment.
There are various factors that affect organisation dynamism, however, four main
factors are discussed in this chapter, which are management styles and culture,
management competence, organisation culture and strategies
Establishing the correct and appropriate organisation culture is an essential process of
managing an organization
Organisational cultures are categorised into three; (i) passive/defensive cultures, (ii)
constructive cultures and (iii) aggressive/defensive cultures. In constructive cultures
members are encouraged to work together in ways that meet higher order human
needs. This has been found to be the most effective culture because workers tend to
work with greater motivation, satisfaction, teamwork and performance
A strong management is the backbone of any successful company and thus it is
widely acknowledged that it's important for a company to have a good management
team
Management styles are important to business because they are linked to the success of
the business and in other cases can be translated to the management culture of the
organisation.
Management incentives and compensation ((i) share option, (ii) profit share, (iii)
incentive bonus and (iv) honorary rewards or non financial recognition) has been
shown to have a strong link with performance and thus organisation performance
Conclusively, organisational dynamism and organisational culture as well as
management competence, ability, culture, style and incentives can explain why some
businesses organisations perform better than others.

52
CHAPTER FIVE
PROPERTY RIGHTS APPROACH
5.1 Introduction
The main objective of the chapter is to provide an understanding of organisational
restructuring and provide insight of the cooperative business model and its differences to
other business models mainly the investor oriented company. The property rights approach is
mainly concerned with how the assignment of and costs of transferring property rights affect
incentives and economic outcomes (Furubotn & Richter, 2000). Furubotn and Richter (2000)
state that the structure of property rights is important because it affects transaction costs,
incentives and economic behaviour. Blair (1995), Demsetz (1988), Demsetz (1997), and
Chaddad and Cook (2004) show the importance of well defined and enforced property rights
for the success of business. Property rights are important because they influence incentives,
affects stakeholder behaviour and thus economic outcomes of businesses.
Organisational structures with well clearly defined property rights are argued to do better
than organisational structures with ill defined property rights (Chaddad and Cook, 2004).
Demsetz (1967) proposes that market forces push economic organisations in the direction of
efficiency by eliminating inefficient property right structures and promoting the introduction
of new arrangements that are better adapted to the economic challenges and opportunities.
However, Sugden (1989) argues that property rights have emerged over time by convention
(or through the operation of the invisible hand) and that the structures that have evolved need
not be efficient. Demsetz (1988) shows that the efficiency of the firm is argued to depend on
how well its members (including those who supply inputs or are within the enterprise) are
able to blend their efforts and cooperate effectively. Thus the key issue for organisational
economics is to determine how to motivate individuals so that they will work towards
collective interests and make the firm successful through well defined and properly assigned
property rights (Demsetz (1988) and Demsetz (1997)).
5.2 Background on the property rights framework
5.2.1 Ownership rights
Furubotn and Richter (2000) state that when there is uncertainty and asymmetrical
information, ownership of resources matter for economic results. Alchian and Demsetz
(1972) define ownership as the possession of the (i) rights to be a residual claimant, (ii) rights

53
to observe input behaviour (iii) rights to be the central party common to all contracts with
inputs (iv) rights to alter the membership of the team, and (v) the rights to sell these rights as
desired. Ownership rights are argued to affect economic incentives and behaviour which
affects the economic performance of the firm (Demsetz, 1988). It is important that ownership
rights should be able to assign the costs or benefits associated with any individuals‘ actions or
behaviour on that individual. Well defined ownership rights should take into account the
costs an individual can cause by attempting to maximise or minimise the present value of
benefits or costs respectively, at the expense of the organisations future or other individuals.
When the full costs or benefits of an individual‘s activity are borne to him, this creates an
incentive to utilise resources more efficiently and results in efficient maximising decisions.
The critical questions ownership rights have to address are (i) who owns the firm? (ii) what
does ownership of a firm mean? (iii) does it matter whether the firm is owned by those who
invested capital in it, by its workers or by the state? These issues are critical because the
identity of owners, the content of the bundle of ownership rights and the structure of
ownership has consequences on decisions made and hence the outcome or efficiency of the
firm (Demsetz, 1988). Ownership rights in firms tend to be described by the way shares
entitle the rights to the holders. Thus different firms can differ in the way shareholder rights
are allocated as shown by how claims are made to the firms income, dividends entitlement,
what is expected of shareholders and the rights to transfer such ownership.
Demsetz (1988) indicates that the costs of negotiating and monitoring ownership rights
increases with number of owners. Even though a large number of owners can be justified by
the benefits to economies of scale and the equity capital that can be raised from these
shareholders, Demsetz (1988) argues that economies of scale in the provision of capital do
not exist. In addition, if all owners participate in decision making, negotiating costs become
high. As a result, when the scale of ownership rises, there is a growing need to employ
management to make decisions on some aspects of the business. In principle, ownership
means effective control, but when the organisation grows some control rights are allocated to
management.
5.2.2 Control rights
Control rights refer to the ability and extent to exercise influence within an organization by
making crucial decisions affecting the organization or relevant to its functioning (Demsetz,

54
1988). Demsetz (1997) states that control is not limited to the power and incentives of
decision making but also to the wealth gain achievable through effective monitoring of
managerial performance by the firms owners.
Control rights will differ depending on the organisational structure of the firm e.g. control
rights are different for cooperatives, public owned, private owned, state owned organisations.
In most organisational structures, shareholders own the firm and their ownership and
shareholding comes with specified control rights. Individual shareholders or owners have
control rights through their voting power in matters pertaining to the appointment of the
board of directors and approving proposals for fundamental changes affecting the firm such
as liquidations, mergers, acquisitions e.t.c. Depending on the firms structure of control rights
or business model, the voting power can be based on the number, class or types of shares tied
to the level of capital invested or in the case of traditional cooperatives, one member one vote
principle. The importance of voting power is that individuals who possess a majority of
shares and effectively have more voting power to dictate the firm's decisions, thus effectively
controlling the firm. Therefore, control rights are important because they determine the
decisions that the firm makes. Demsetz (1988) presents it as the incentive to control.
When the firm increases in size and scale, shareholders or owners cannot exercise all their
control rights because the control function and activities grow beyond what an individual can
handle (Blair, 1995). Thus some control rights are allocated to the board of directors and
management. The board of directors basically supervises, oversees and controls the
organisation through management. However, the important issues such as the strategy and
objectives of the organisation usually remain the duties of the owners to decide or control.
Because of delegation of duties, some control rights are allocated to management.
5.2.3 Agency problem
When organisations grow, ownership and control rights are usually separated. However, it
becomes important to establish an appropriate property rights structure that will minimise the
conflicts and costs incurred because of the separation of ownership and control by drawing up
the appropriate incentives such that those granted control rights of the organisation,
specifically management, serves the best interest of the owners (Blair (1995); Demsetz
(1988); Demsetz (1997) and Furubotn & Richter, 2000)). The agency theory provides a
framework to discuss the separation of ownership and control rights.
55
Agency theory assumes that there are two economic actors in each case, the principal and the
agent. The principal engages the agent to perform services on his behalf. To facilitate the
achievement of the activity, the principal delegates some decision making authority to the
agent. Information is taken to be asymmetric in the sense that, (i) the agent‘s action is not
directly observable by the principal or (ii) the agent has made some observation that the
principal has not made (e.g. the true output of the firm). Furthermore, it is too costly for the
principal to directly monitor the agent‘s actions or to acquire full knowledge of the agent‘s
unique observational information directly. This could lead to moral hazard and
characteristically, the agent will not act in the best interest of the principal (Furubotn &
Richter, 2000). Based on such a situation, the agency theory shows the importance of
appropriately structuring ownership and control rights in a firm.
Jensen and Meckling (1976), and Furubotn and Richter (2000) indicate that the principal can
limit the agents` divergences from his interest by establishing appropriate incentives for the
agent or alternatively by monitoring the uncharacteristic activities of the agent. In some
situations, the principal can pay the agent to guarantee that he will not do certain actions
which would harm the principal or alternatively insure that the principal will be compensated
if the agent does take such actions (Furubotn & Richter, 2000). Agency costs vary from firm
to firm as they depend on the tastes of managers (attitudes of agents), the ease with which
agents exercise their own preferences as opposed to adopting behaviour that results to the
maximisation of the owners residual, the agents degree of risk aversion, the costs of
monitoring and bonding activities, as well as the organisational structure of the firm
(Furubotn & Richter, 2000). Jensen and Meckling (1976) also indicate that agency costs
depend upon the costs of monitoring the managers‘ performance and evaluating it, as well as
the cost of devising and enforcing specific behavioural rules or policies.
Manne (1965) explains the concept of the separation of ownership and control by indicating
that takeover threats represent the most efficient instrument for disciplining management.
Basically, in a badly run company, the market price of shares would be comparatively low.
Such a low current price of shares indicates the possibility of a more profitable future for the
company provided its existing assets were managed more efficiently. Thus the company
becomes an attractive target for takeover by individuals who believe they could improve its
performance. Manne (1965) argues that the possibility of takeover threat is sufficient to solve
the agency problem.

56
Agency problems can be limited by separating the management and control of decisions, thus
restricting agents from having all the power at their disposal (Furubotn & Richter, 2000). In
the case when monitors are selected to monitor the agent, there is the dilemma on who will
monitor the monitor. Alchian and Demsetz (1972) argue that if the monitor possesses the title
to the market value of the firm and all the gains or losses in the firm‘s market value can be
assigned to the monitor, then there is no incentive to shirk. As a result, the best solution
would seem to be to allow the monitor to become the full owner of the firm. Knott (1993)
states that the market for management also influences the behaviour of managers, if the
market for management is highly competitive, then incentives for managers to pursue their
own interest at the expense of the owners are limited.
5.3. Property rights that constrain the growth of cooperatives
Various studies have been done on the property rights features of cooperatives (Chaddad &
Cook (2004), Chaddad et al (2005), Cook (1995), Harvey & Sykuta (2005), Hendrikse &
Veerman. (2001a, b), Ortmann & King (2007a, b), Sykuta & Cook (2001)). These studies
clearly expose the inherent weaknesses of the cooperative model as a result of the ill defined
property rights. The weaknesses of cooperative property rights seem to be a direct result of
their imperative. If viewed as purely social or developmental institutions then the following
property rights seem justifiable; (i) allowing for everyone to join the cooperative as long as
they share the same principles and can afford the nominal sum for the equity membership fee,
(ii) redeeming only the nominal value of the members nominal investment upon exit, (iii) one
member one vote principle, (iv) restricting external investors to be members. However, once
cooperatives grow in size and undertake activities in competitive markets that requires the
cooperative to be highly competitive to survive, then cooperative problems as a result of ill
defined property rights as described below emerge (Cook (1995); Chaddad & Cook (2004));
Free-rider problem; Emerges when ownership rights are untradeable and not
sufficiently well defined and enforced to ensure that individuals are responsible for
the full cost of their actions or receive the full benefits they create. Chaddad and Cook
(2004) distinguish between external and internal free rider problems. An external free
rider problem arises when the benefits and costs faced by members and non-members
are poorly aligned. For example, where a cooperative is successful in shifting the
market price and terms for the inputs that its owners supply towards competitive
levels (i.e. in an industry otherwise lacking competition), other non-member suppliers
may get to enjoy the same price and terms without paying for membership.

57
An internal free rider problem arises when new members of the cooperative enjoy the
same patronage returns as existing members, or can access the cooperative‘s capital
without paying the full cost of the benefits they derive. As a result, other cooperative
members effectively subsidise their entry. This dilution of existing member returns
creates a conflict between new and old members, and a disincentive for older
members to invest in the cooperative.
Horizon problem; Arises when the owner-patron‘s claim on the cooperative‘s
residual earnings is short lived when compared to the productive life of the
cooperative. When benefits a member receives from an investment are limited to the
period (horizon) over which the member expects to patronize the cooperative because
his ownership claims cannot be traded at market value, cooperatives will tend to
under-invest in assets with long-term payoffs such as research and development, and
marketing (Harte, 1997).
Portfolio problem; Occurs because member shares cannot be freely traded and the
inability of owner-patrons to separate their ownership and patronage decisions.
Therefore, members are unable to adjust their individual investment portfolios
according to their personal wealth and preferences for risk, which could result in
suboptimal investment portfolios. Faced with suboptimal investment portfolios,
members will attempt to direct the activities of the cooperative in a direction that
better matches their own risk-return trade off. This in turn means cooperatives face
pressure from their owner-patrons to adopt investment policies that mitigate this
owner-level lack of diversification, even when this is not optimal for the cooperative.
In addition, potential outside investors, who could diversify the risks, are generally
excluded from investing in a cooperative.
Control problem; Any organization in which ownership and control are separate,
will to some extent experience principal-agent problems due to divergence of interests
between the principal and the agent. Because of this separation it is predicted that the
interests of owners and managers will diverge, giving rise to agency costs. The
absence of an equity market and lack of transferable ownership claims or shares with
an observable current market value for cooperatives means that members are not able
to monitor their cooperative‘s value or evaluate managers‘ performance resulting in
operational inefficiencies being unnoticed. Such control problems are argued to
worsen with cooperative size and complexity.

58
Influence cost problem; The dual role of the member as owner and user could create
a situation in which some members attempt to influence the cooperatives` decisions
for personal benefits ignoring the costs of such poor decisions to the cooperative.
Cooperatives may experience greater influence costs than other forms of organisations
because the interests of cooperative members, who are linked to individual farm
production activities, are more diverse than the interests of corporate shareholder who
share a common objective of maximizing return on investments (Royer, 1999). The
influence cost problem is further worsened if the cooperative‘s range of activities is
wider or if there is great heterogeneity among its members giving incentives for
interest groups to form and seek to influence the cooperative‘s decisions to their
benefit even if it is at the expense of other members. Banerjee et al (2001) present
evidence on the costs of such behaviour in Indian sugar processing cooperatives,
where larger owners face an incentive to reduce the price paid on inputs, to the
detriment of smaller suppliers, in order to increase their personal prestige.
5.4 Evolution of new cooperative models
The inherent weaknesses of traditional cooperatives have led to the evolution of new
cooperative models in cases where policies and legislation have allowed such actions.
Chaddad and Cook (2004) present a classification of cooperative models based on an
ownership typology, in which traditional cooperatives and investor-oriented cooperatives are
polar forms.
5.4.1. Proportional Investment Co-operatives (PICs)
Proportional investment co-operatives require cooperative members to contribute equity
capital in proportion to usage through either one of the three main cooperative policies, the (i)
base capital plans, (ii) narrowing product scopes and (iii) capital acquisitions on business unit
basis. The base capital plan illustrates the simplest way in which the PICs operate. With the
base capital plan, the cooperatives` capital requirements are determined first, based on future
investment opportunities and members‘ willingness to supply risk capital. Secondly,
proportional member usage is then determined by measuring the members‘ average usage
over a base period and calculating the members minimum equity capital requirements based
on relative patronage. With time, it is expected that some members could become over-
invested and others under invested. Thus, it is important to design a plan to increase equity
investment of under-invested members and redeem part of the equity for over-invested

59
members (Chaddad & Cook, 2004). By allowing equity to transfer between over- and under-
invested members, the internal free-rider problem is eliminated. However, the following
weaknesses still exist;
shares in a PIC cannot be traded (portfolio problem) at their market value (horizon
and control problems)
Voting rights are egalitarian (influence problem).
PICs are complex to administer and oblige rather than encourage investment.
5.4.2. Member-investor Co-operatives (MICs)
Member-investor co-operatives give restricted voting, non transferable and redeemable
ownership rights to member patrons but also allows other investors and member patrons to
have non-voting shares that entitles them to the distribution of net earnings in proportion to
member shareholdings rather than patronage. As a result, MICs separates patronage and
investment thus allowing a substantial share of co-operative profits to accrue to member-
investors rather than to member-patrons only. The MICs model can be implemented by
means of either participation units, capital units or redeemable preference shares as evidenced
in countries such as Netherlands, New Zealand and Australia
Participation units are non-transferable, redeemable, nonvoting and appreciable ownership
rights. The board sets the value of participation units that will be issued for member patrons
or member investors. Capital units enable cooperatives to raise additional risk capital and to
provide investment returns to members. Capital units entitle the holder to an interest in the
capital, but not in the members‘ share capital of the co-operative. Capital units are
transferable, appreciate in value so that capital gains can be realised when the shares are
redeemed. Redeemable preference shares are non-transferable, interest bearing, appreciable,
non-voting and have redeemable ownership rights. These different types of shares fully
address the free rider problem, however the following weaknesses still exist;
The portfolio, horizon and control problems is not fully addressed because the
tradability of these shares is reduced by uncertainty about capital gains since shares
are redeemed at a price approved by the democratically elected board of directors not
the market.
The influence problem remains because shares held in a MIC do not grant voting
rights in the co-operative

60
5.4.3. New generation co-operatives (NGCs)
New generation co-operatives (NGCs) were formed and quickly gained popularity in the US
agricultural sector in the 1990s and in other countries including New Zealand. NGCs
introduce the concept of well-defined property rights in the form of delivery rights (Cook,
1995). Delivery contracts set out members‘ rights and obligations to deliver products of a
specified quality and quantity. Members must pay for any shortfalls on contacted delivery
amounts or quality.
Member producers make sizeable capital investments to fund value-added processing
facilities, with shares being linked to units of production. Member equity usually makes up
40 – 50% of capital, with the balance financed externally (Cook, 1995). Membership is
closed, with shares tradable among members at share values that vary with the cooperative‘s
prospects. New shares are sold if equity is required for expansion or in proportion to delivery
volumes where equity is required for other purposes. Profits are distributed as patronage
refunds, but since patronage and investment are proportional, this amounts to proportional
dividends on invested capital. Non-voting securities can be sold to non-members also. New
members have to purchase delivery rights from existing owners at their market price, thus
enabling member-investors to realise capital gains.
Alignment of investment with capital gains and patronage returns addresses the internal free-
rider problem. NGCs apply the one-member-one-vote principle, despite investments being
proportional to patronage. Heterogeneity among members is reduced by NGCs operating in
narrow business fields as compared to other agricultural cooperatives that often diversify.
Directors are chosen from among members. NGCs resolve common traditional cooperative
problems as follows;
Horizon problems – removed by tradable shares
Free-riding problems – are reduced since value of unallocated capital is reflected in
tradable share prices, and investment/patronage signals are not distorted by artificially
setting equity values as in traditional cooperatives;
Portfolio problems – are minimal because NGCs‘ narrow business focus reduces
conflicts over investment policy, members are fairly homogeneous and projects are
thoroughly scrutinised before establishment.

61
However, the following weaknesses exist;
Delivery rights do not fully address the horizon and control problems because
members‘ shares remain non-tradable and therefore do not internalise or signal
growth in NGC net worth when the proceeds of delivery rights issues are invested in
growth assets.
The competitiveness of the delivery rights market is questionable.
Delivery rights have no effect on voting rights and therefore do not address the
influence problem.
5.4.4 Cooperatives with capital seeking entities
This model addresses the restriction of cooperative ownership rights being restricted to
member patrons by acquiring outside capital using a separate legal entity such as a strategic
alliance, a trust company or a publicly held subsidiary. In the USA, some cooperatives form
strategic alliances with another partner to acquire external risk equity capital. The deal could
entitle the alliance to a share of profits or being a long-term supplier of inputs or expertise. As
is the case with the Dairy farmers of America whose deal with a strategic alliance entitles the
alliance to be the long-term preferred supplier in exchange of investing, marketing and
processing the cooperative farmers‘ products. Alternatively, the cooperative can establish a
non-operative entity, a trust company solely for acquiring risk capital from non-member
sources, as is the case with Diamond cooperative owned by walnut growers in California,
which established the Diamond Walnut Capital Trust. Finally, the cooperative could establish
and transfer all its assets to a separate public limited company in order to receive risk capital
from outside investors with new equity shares in the subsidiary company. This model has
been used by Kerry Cooperative Creameries Ltd in Ireland, France by the cooperative bank
Credit Agricole as well as in the USA by Gold Kisk, Agrilink and O`Lakes. However, the
model has the following weaknesses;
New organisational costs such as agency, collective decision making and influence
costs are incurred. A cost benefit analysis is important to decide whether the model is
beneficial or just an addition of costs.
Control and horizon problems are still not fully addressed
5.4.5. Investor-share co-operatives (ISCs)
Neither the PICs nor NGCs accommodate equity and investment by non-members as they are

62
restricted to member-patrons with the possible exception of MICs and cooperatives with
capital seeking entities. ISCs acquire non member equity capital without converting to
investor oriented firms by issuing separate classes of equity in addition to the traditional
ownership rights held by patrons mainly preferred stock, non-voting common stock and
participation certificates. Preferred stock is a non-voting, fixed dividend, non-redeemable
ownership right. These have been issued in the USA by a Denver based cooperative bank,
Cobank specialising in financial services for agribusiness and rural utilities. Non-voting
common stock are a separate bundle of stock from the cooperative patron member non-
transferable, non-appreciable and voting shares.
Investor-share co-operatives afford the cooperative an opportunity to raise permanent risk
capital while maintaining member control. Thus, ISCs effectively publicly lists non-voting
stock while maintaining voting stock in the hands of the cooperative members. ISCs are
common among agricultural cooperatives in Australia (e.g. Australian Agric Co, AWB Ltd),
Canada (Saskatchewan Wheat Pool even trades in the Toronto Stock Exchange). With
participation certificates, outside investors may become members and invest in the
cooperative. Farmer controlled businesses found in the UK exhibit the same model because
farmers hold both control and the majority of shares with the primary goal of serving the
economic interest of farmers. In summary, these shares alleviate the control problem, free
rider, horizon and the portfolio problems. However, the following weaknesses exist;
ISCs are argued to dilute the co-operative principles and thus may not qualify for all
of the benefits and support afforded to conventional co-operatives e.g. South Africa‘s
new Co-operatives Act does not allow development-oriented co-operatives to raise
capital and expertise by taking on external equity partners
5.5. Alternative organisational changes
Hudson and Herndon (2000) state that successful cooperatives are far more likely to expand
operations, merge with other cooperatives, or even to acquire companies before converting.
The following section discusses some of the alternatives.
5.5.1 Mergers
A relatively large number of mergers have occurred in South African agribusinesses as is
reported among U.S. agricultural cooperatives over the last ten years (Competition
Commission (2004), Hudson & Herndon (2000) and Henehan (2002)). A merger is a

63
combination of two or more companies into one larger company through either a stock swap
or cash payment to the target company (Hudson and Herndon, 2002). Mergers usually result
in a new company name. Various classifications of mergers (Wikipedia, 2008);
Horizontal mergers take place when the two merging companies produce similar
product in the same industry.
Vertical mergers occur when two firms, each working at different stages in the
production of the same good, combine.
Conglomerate mergers take place when the two firms operate in different industries.
Reverse merger is used as a way of going public without the expense and time
required by a public corporation.
Accretive mergers are those in which a company with a high price to earnings ratio
(P/E) acquires one with a low P/E.
Dilutive mergers are the opposite of above, whereby a company with a low P/E
acquires one with a high P/E.
There are various reasons companies take part in mergers. However, in the end, mergers are
usually directed to be beneficial to both parties taking part in the merger (Hudson & Herndon
(2000) and Henehan (2002)). The underlying reasons for the failure of mergers have been
shown to include the following among many reasons (Moeller, 2003);
Incompatibility—whether of technology, equipment, or corporate culture.
Inadequate research or by concealment of losses or liabilities by one of the partners.
Overlapping subsidiaries or redundant staff may be allowed to continue creating
inefficiency.
New management may cut too many operations or personnel, losing expertise and
disrupting employee culture.
Henehan (2002) indicates that several mergers have resulted in the formation of the largest
dairy cooperatives in the U.S. Such is the case with some mergers that have occurred in South
African agriculture (Competition commission, 2000). Due to such results, mergers are always
viewed with much scepticism mainly because of concerns that they usually result in unfair or
anti competitive behaviour such as the creation of monopolies or restriction of trade
(Heykoop, 2003). Thus mergers have come under heavy analysis and regulation in most
countries.
64
5.5.2 Acquisitions and takeovers
Acquisition and takeovers involve the buying of one company, the target company by another
company (Hudson & Herndon, 2002). In most cases, target companies are usually smaller
firms than the firm buying. Under normal circumstances, acquisitions are done in good spirit,
with both companies cooperating and willing to take part in the acquisition deal. However,
there are certain circumstances when the target company is unwilling to be bought or the
target's board has no prior knowledge of the offer, this is usually referred to as hostile
takeovers (Foltz, 2002). There are various types of acquisitions, chief of which are (Foltz,
(2002) and Hudson & Herndon (2002));
The buyer buys the shares, and therefore control of the target company being
purchased. Ownership of the company in turn conveys effective control over the
assets of the company, but since the company is acquired intact as a going business,
this form of transaction carries with it all of the liabilities accrued by that business
over its past and all of the risks that company faces in its commercial environment.
The buyer buys the assets of the target company. The cash the target receives from the
sell-off is paid back to its shareholders by dividend or through liquidation. This type
of transaction leaves the target company as an empty shell, if the buyer buys out the
entire assets. A buyer often structures the transaction as an asset purchase to pick the
assets that it wants and leave out the assets and liabilities that it does not.
Reverse takeover; Sometimes, however, a smaller firm will acquire management
control of a larger or longer established company and keep its name for the combined
entity.
5.5.3 Integration
Integration refers to the reorganisation of firms by either moving up the supply or value
chain, or down the supply value chain. There are various motivations for integration but firms
mainly use integration to increase their market shares, improve efficiency, build market
power or to enter other new markets (Gregor (2003). There are basically three forms of
integration, horizontal, vertical and backward integration.
Horizontal integration; relates to the expansion of a firm at the same level in the
value chain. The Competition Commission (2004) illustrates that a relatively large
amount of horizontal integration has taken place in the maize supply chain. Some
examples include OTK Agri/Farm Feed services, Afgri/Laeveld Korporatiewe

65
Beleggings, Afrigrain (Pty) Ltd/Unigrain Cape (Pty) Ltd, Afgri operations/Natal
Agricultural Co-operative, Kaap Agri/ NLK e.t.c.
Vertical integration; describes a situation where a firm has its interests diversified
into related activities. It is basically a linkage between producers and distributors to
final consumers. An example of vertically integrated companies in the South African
maize market are the dominant silo companies (Mc Gregor, 2002). Examples in South
Africa include Afgri/Nedan Oil Mills, Synapp international/Senwesko Voere,
Rainbow Farms/Vector Logistics (Pty) Ltd, Afgri/Daybreak
Backward integration into the production of inputs ensures stable supplies and
reduces the cost of coordinating activities at different stages of production. This puts
potential new entrants at a cost disadvantage and increases their sunk costs.
5.5.4 Joint ventures
A joint venture is an entity formed between two or more companies by combining their assets
for a specific business purpose or to undertake economic activity together (Hudson and
Herndon, 2002). The companies agree to create a new entity by both contributing equity, and
they then share in the revenues, expenses, and control of the enterprise. Francois et al (2002)
argue that unlike a merger, a joint venture typically involves only temporary, partial, and
small activities. Thus the parent companies are still free to continue their activities separately.
The idea is that in case a joint venture fails, the parent firms would be less affected.
5.6 The decision to convert
5.6.1 Various hypotheses
Schrader (1989) proposed that the nature of a patron's equity in terms of the method the
cooperative uses to liquidate a member's equity results in cooperatives restructuring as
investor-oriented firms, especially successful cooperatives. When cooperative members
liquidate their equity and receive no more than its accounting book value, there is an
economic motive for members to approve a sale or corporate reorganization such as
converting to a company when the market value of the members' equity exceeds book value.
Schrader (1989) states that if there is growth in the market value of assets due to inflation or
other market forces, the liquidating value of a member's equity will eventually exceed its
book value. Thus a sale or corporate reorganization of the cooperative will produce more
value for members than liquidating their individual positions. Alternatively, Collins (1991)

66
argues that the limited ability to generate internal equity in a cooperative especially when
there is an opportunity for a profitable investment opportunity may create a rational choice to
restructure the cooperative as a publicly held corporation with access to external equity.
The corporate acquisition hypothesis suggests that the motivation for the conversion of
cooperatives may in some cases come from the corporate sector rather than from the
cooperative (Collins, 1991a). The corporate acquisition hypothesis suggests that cooperatives
may have sources of product supply and processing capacity that fit a corporation's plans for
vertical integration. Alternatively, a corporation may wish to acquire a vertically integrated
cooperative simply to expand its scale and spread the costs of central management functions.
In other cases, a corporation may wish to acquire the cooperative's share of a finished product
market. In addition, (Collins 1991a) argues that corporations may find cooperatives as easy
prey for takeovers compared to taking over a comparable corporation because of the
liquidation mechanism of cooperatives. For example, when a majority of the members of a
cooperative have a short time horizon, the capitalized stream of benefits from cooperative
membership will be small and any bid by a corporation in excess of the book value will be
advantageous to these members.
The cost-of equity hypothesis suggests that contrary to the equity access hypothesis, access to
cheap equity could be the main motivation to conversions. The cooperative could raise equity
from economically rational members if the return expected by the member exceeded the
opportunity cost of the funds (Collins (1991a, 1991b)). However, in cases when the income
of the cooperative is highly correlated with the income of the members, the risk premium
required by the member may exceed the premium required by a well-diversified external
investor and external equity may therefore be cheaper to acquire than equity from members
(Mooney & Gray, 2002). This would occur if the member is poorly diversified and the
cooperative has low systematic risk for a broadly diversified portfolio. In this case, the equity
of the cooperative would have high systematic risk for the member but low systematic risk
for an outside investor, and a powerful incentive would exist for the cooperative to issue
publicly held stock.
Harte (1995; 1997) based on transaction cost theory argues that efficient governance
structures can be expected over time to replace inefficient structures in competitive markets.
Harte (1997 states that as market performance improves and owing to the fact that
67
cooperatives are perceived to be less efficient than corporations, it is expected that there will
be a transition from the cooperative organisational form to the corporate form. Harte (1997
argues that cooperatives would be expected to persist indefinitely only in the case of chronic
market failure. The basis of Harte`s (1997) explanation lies on the assumptions that
cooperatives are less efficient than corporations and that cooperatives would be expected to
persist indefinitely only in the case of chronic market failure.
Cook (1995) presents a five stage model of cooperative formation, growth and demise that
seek to explain why and how cooperatives undertake restructuring activities based on
transaction, agency costs and the property rights framework. Cook (1995) states that during
stage one cooperatives are formed in a defensive nature thus creating incentives for collective
action either when individual producers need institutional mechanisms to bring economic
balance under their control or when they need institutional mechanisms to countervail
opportunisms or market failure. During stage two, Cook (1995) indicates that cooperatives
formed for economic balance or excess supply induced prices are usually short-lived and
have little economic impact on their members. Whereas cooperatives formed to confront
market failures survive the infant stage. When other competitors of successful cooperatives
begin to modify their behaviour or strategies, members in a cooperative become aware of the
problems intrinsic to the cooperative organisational form (mainly horizon, portfolio, control,
free rider and influence costs problems) and the benefits that could be lost if the cooperative
discontinues to operate. Thus the cooperative is faced with three options; (i) exit (ii) continue
or (iii) transition. Cook (1995) states that under the exit option, the cooperative can either
liquidate or restructure as an investor owned corporation. As a result, poorly performing
cooperatives liquidate whereas well performing cooperatives restructure to companies, a
trend similar to the developments of South African cooperatives (Ortmann & King, 2007a, b).
Alternatively, the cooperative can continue operating and adopt modern cooperative models
or take the transition option by converting to new generation cooperatives popular in the USA
or other modern cooperative models.
5.6.2 Company versus the cooperative business model.
5.6.2.1 Market orientation
Kyriakopoulos et al (2004) state that market orientation consists of (i) competitor orientation,
which includes the activities involved in acquiring information about the competitors in the
target market and transmitting it throughout the firm, (ii) customer orientation, which

68
includes the activities involved in acquiring information about the customers in the target
market and disseminating it throughout the firm, and (iii) inter-functional coordination, which
comprises the firm‘s coordinated efforts, involving more than the marketing department, to
create superior value for the customers. Kyriakopoulos et al (2004) show strong evidence that
market orientation is a key strategy that firm‘s adopt to build a long-term competitive
position because it increases customer satisfaction, customer loyalty and new product
success. Thus, it is argued that companies, whose key to survival is their competitive
advantage, tend to be more market oriented than cooperatives (Kyriakopoulos et al, 2004).
Cooperative principles and their essence are argued to limit the extent to which they can be
market oriented as compared to a company. However, despite the strong argument of
companies being more market oriented than cooperatives, Piesse et al (2004) indicate that
grain cooperatives are also changing from being member oriented to being market oriented
by gaining market power and adopting market oriented strategies.
5.6.2.2. Ownership
In a traditional cooperative, ownership is restricted to those who patronise the organisation
and new members often pay only a nominal sum for the equity. This is different in modern
cooperative models as discussed in section 5.4 which have adopted innovative ownership
structures. However, when based on traditional cooperative ownership structures whereby
equity ownership is tied to a normal membership fee and the distribution of profits is in
proportion to patronage, the ownership claim of a cooperative shareholder differs in several
ways from that of a company whose equity ownership is tied to the level of capital invested
and there is a secondary market for company shares. Such arrangements make company
shares more attractive and have possibilities of a higher return as compared to cooperative
shares. This is compounded by the fact that in traditional cooperatives, member‘s shares are
redeemed at the nominal value of their member nominal investment upon exit. Thus the
amount paid on such redemption does not reflect the current market value of cooperative
membership, or the present value of expected future cooperative net cash flows. However, as
was discussed in section 5.4 some new cooperative models have established an internal
secondary market for member shares and allowed for appreciable investments or shares.
5.6.2.3. Control
Democratic control of cooperatives in the form of one member one vote, results in different
control issues and behaviour of cooperatives when compared to companies whose voting is

69
based on the member‘s shareholding. The one member one vote principle creates no incentive
for members who may be willing to contribute large capital as that does not imply that they
influence cooperative decisions in order to protect their investments. As such, it is expected
that coalition building among members is much more important in the decision making
process of cooperatives than in that of companies. Thus, cooperatives that delegate greater
decision making authority to management may be better able to compete with companies,
albeit at the cost of less direct member involvement in decision making. Usually, cooperative
boards restrict non members from serving on the board of directors. The advantage to this is
that because members of the board are users of the cooperatives` services, they may bring to
the board some of the technical knowledge about the cooperatives services and operations
that outside directors may lack. If the cooperative's operations are complex or extend far
beyond the farm, however, it is likely that member directors will lack the expertise in
marketing, manufacturing, or retailing that external directors could provide.
5.6.2.4 Managerial behaviour
The lack of a secondary market for cooperative shares denies the cooperative tools for
influencing managerial behaviour (Suhler & Cook, 1993). Cooperative shareholders have no
simple indicator like a share price by which they can evaluate how well management has
enhanced the future earnings capacity of their firm. If they evaluate management primarily on
the current prices the cooperative charges for its services, the manager may be induced to de-
capitalize the firm in an attempt to increase current earnings, simply reinforcing the horizon
problem. Fluctuations in the value of company shares therefore serve as an important
disciplining mechanism on management. Many firms reinforce the strength of this
disciplining mechanism by offering share options to top management, which makes the
earnings of these personnel based on the share value. Tying the manager's earnings to the
firm's performance, as judged by the share market, may thus reduce managerial shirking
(Alchian & Demsetz, 1972).
Staaz (1987) argues that in most cases cooperatives members tend to pressure management to
adopt more conservative business strategies than those of competing companies because
investments in cooperatives are largely sunk whereas owners of a company can sell their
shares and quit the organisation if they believe the investment is not worth it. Furthermore,
because of the immobility of cooperative capital, it is more difficult for cooperatives than for
companies to spread their risks by diversifying into totally unrelated activities. Finally,

70
Kyriakopoulos et al (2004) indicates that cooperative managers, particularly those of large,
diversified cooperatives may spend more time on member relations, thus putting cooperatives
at a competitive disadvantage because their chief executive officers have less time than
company managers for strategic planning and administration.
5.6.2.5 Scope for optimization
Staaz (1987) states that the scope for optimization in a cooperative is potentially broader than
in a competing company that is not vertically integrated into farming. This is because a
profit-maximizing farmer-member would be interested not in running the farm and the
cooperative as separate profit centres but in optimizing the performance of the integrated
farm/cooperative system (Staaz, 1987). Firstly, the scope for optimization is more diffuse
because cooperative returns are distributed according to patronage, not investment. As a
result, the cooperative does not have one locus for profit maximization but a separate locus
for each member. Secondly, cooperatives tend to give greater weight to their patrons' fixed
costs than companies. For example, an agricultural processing cooperative will more likely
give greater emphasis to providing its supplier-members a market for their product than will a
company because the cooperative takes into account of the need of its members to pay back
their fixed on-farm production investments. Comparatively, a company usually does not have
to deal directly with its suppliers' fixed costs, they are transformed via the market into the
raw-product price that the company pays and considered as purely a variable cost (Staaz,
1987). As a result, the capital of cooperatives tends to be less mobile than that of other
business models as they concentrate their investments in agribusiness activities closely
related to the farming activities of the members because the members might suffer substantial
capital losses if their farming activities were not adequately supported. These capital losses
would not affect the income of shareholders of a company serving these farmers. Hence,
there would be little pressure on company management to invest in these agribusiness
activities if more profitable opportunities lay elsewhere.
5.6.2.6. Pricing behaviour
The pricing behaviour of a cooperative directly affects the income of the members as opposed
to companies whereby the income that shareholders derive from a company depend on the
firm's profitability through dividends (Kyriakopoulos et al, 2004). As a result, cooperative
members using their influence as owners demand to be involved in pricing decisions. But
because of the diversity of member`s interests it may be difficult to reach a consensus about

71
what the appropriate pricing and cost-allocation rules should be. The result is that the price
setting is likely to be a more costly process in cooperatives than in companies where
management often makes pricing decisions with no shareholder input. Thus, a cooperative's
ability to cut prices and offer subsidies in order to gain market share may be much more
restricted than in companies. As a result, cooperatives may be less able than companies to
enter new fields where gaining market share requires initial price-cutting. However, contrary
to the above arguments, Evan and Meade (2006) indicate that the pricing behaviour of
cooperatives were the same as that of investor oriented firms.
5.6.2.7 The structure of incentives facing individual stakeholders
In order for both the cooperatives and company to be successful they have to coordinate their
operations with those of the stakeholder‘s interests. Hind (1994) shows that the interest of the
membership of a cooperative as a whole usually does not correspond with that of individual
members. This is usually the case if incentives exist for cooperative members to operate their
farms in a totally independent manner or when the cooperative has a highly heterogeneous
membership which can make it difficult to get members to agree on anything other than
running the cooperative as a separate profit centre. Such dilemmas‘ or problems of collective
choice are rare in companies whose incentives to participate in the firm is to maximise
shareholder value or profits.
The differences in equity and how equity is treated by cooperative and company are different.
The fact that equity capital does not appreciate in a cooperative may reduce the incentive to
found a cooperative even when the social benefits of doing so exceed the social cost (Shaffer,
1982). In the case that the cooperative is started and substantially improves the profitability
of the founders' farm enterprises, there is the issue of free rider problem, horizon problem and
portfolio problem to be dealt (Chaddad and Cook, 2004). On the contrary, entrepreneurs who
found a successful company are rewarded with substantial capital gains as the net worth of
the firm increases. Attracting new cooperative members may be difficult because of
geographic limits on the cooperative's scope of operations and because, in certain
cooperatives, only farmers engaged in particular types of production are admissible as
members (Mooney and Gray, 2002). In comparison, geographic limitations do not apply to
ownership and membership in a company.

72
CHAPTER SIX
COMPARATIVE DYNAMISM OF COOPERATIVES AND COMPANIES
6. 1 Introduction
This chapter presents the results from the questionnaire survey investigating the dynamism of
cooperatives and companies. Dynamism is compared based on four broad factors, which are
(i) changes in adopting property rights, (ii) organisational strategies (iii) organisational
culture and (iv) management. Of importance is that this chapter discusses recent trends and
developments as well as the diversity in dynamism that both agribusinesses companies and
cooperatives are adopting.
6.2. Comparative dynamism of cooperatives and companies
6.2.1. Organisational strategies
Table 4 indicates that companies take corporate social investment more seriously, especially
in as far as education is concerned. All the companies indicated that they played a direct role
in corporate social investment by being involved in supporting schools and students through
bursaries and donations. This is a clear form of social responsibility with a social dimension
in a competitive context as explained by Porter and Kramer (2006), thus indicating the drive
for agribusiness companies to engage in social responsibility if it will pay off for them in the
future. Comparatively, cooperatives played an indirect role in corporate social responsibility
through their subsidiaries. The difference is that cooperatives are more focused on generic
social issues such as community development. Despite their limited role in education and
training programmes cooperatives indicated that they are struggling to retain or recruit the
right calibre of employees.
Table 4: The role agribusinesses play in social responsibility
Agribusiness Social responsibility
Comp A Offers trainee programmes
Comp B Sponsor student and donate to schools and child welfare institutions
Comp C Focus on educational (Schools) and agriculture initiatives
Comp D In the process of sponsoring a student
Coop A Subsidiary supports a school for the blind
Coop B Subsidiary supports community development
Coop C None

73
Despite the importance of environmental sustainability or eco sensitive initiatives all the
agribusinesses never adopted any environmental sustainability or eco sensitive initiatives
except for two companies. Company A practised sustainable agricultural practises whereas
company D adopted the initiatives in its fuel outlets because of mandated requirements from
the EIA. The growing importance of social and environmental responsibility, has led to the
adoption of triple bottom line accounting in order to account for firms` role in social and
environmental responsibility (Savitz & Weber, 2006). Dynamic businesses firms use triple
bottom line accounting when presenting their annual reports. Only one of the agribusinesses
companies use triple bottom line accounting reporting comprehensively. The rest of the
agribusinesses mainly report their financial and social responsibilities to a limited extent.
Black Economic Empowerment (BEE) is one of the most important and critical
transformations occurring in South Africa. Even though businesses have until 2014 to
become BEE compliant, the implications and impacts of BEE are already being felt
especially in the allocation of certain contracts or tenders. BEE is measured in scorecard
ratings, 40 points or less represents non BEE compliant, 41 to 65 points represents good
contributors and a score of 66 plus represents excellent contributors (DTI, 2007). A business
needs at least 40 points to be BEE compliant. Table 5 shows that only one of the agribusiness
companies was BEE compliant, with a score of 50%, the rest scored less than 40%. This
confirms concerns about the relatively slow pace of BEE compliance in agriculture and
agribusinesses. The areas where agribusinesses have made significant advancements are in
employment management and corporate social responsibility. However, to increase the BEE
scores, agribusinesses need to work on business ownership, skills development, preferential
procurement, enterprise development and employment equity.
Table 5: The BEE scores
Agribusiness BEE SCORE CARD
Comp A Less than 40%
Comp B Less than 40%
Comp C 50%
Comp D Less than 40%
Coop A Less than 40%
Coop B Less than 40%
Coop C Less than 40%
74
All the agribusinesses interviewed acknowledged that competition in the industry were
strong, necessitating the need for various investments and structural changes in order to be
competitive. Horizontal integration appears to be the most widely adopted integration
strategy by both companies and cooperatives as shown in Table 6. Only one company was
involved in vertical integration and no agribusiness was involved in backward integration.
This is mainly because of the advantages horizontal integration has on improving the
competitive position of the company and reducing transaction costs on the same value chain
whereas vertical integration serves more as a risk management strategy which can also be
addressed by diversification as evident from the fact that agribusinesses that undertook
horizontal integration also had diversified investments. Company A which did not diversify
undertook vertical integration. The highly dynamic firms are more likely to have invested in
the money market or outside agriculture, as was the case for company D, whereas, company
C, company D and cooperative A made investments outside agriculture. Table 6 shows that
all cooperatives and agribusiness companies have all taken part in mergers, joint ventures and
strategic alliances. Indicating a trend to building more networked organisations. These
changes and investments have been motivated by management for both cooperatives and
companies, contrary to the belief that members in cooperatives are the ones who push for
such actions. However, it should be noted that management in a cooperative could hugely be
made up of members.
Table 6: Restructuring actions undertaken by the agribusinesses
Comp A Comp B Comp C Comp D Coop A Coop B Coop C
Vertical integration
Horizontal integration
Diversification
Invested in the money market
Invested outside agriculture
Mergers
Joint ventures
Strategic alliances
Conversion to company
acquisitions
75
All the agribusinesses in the study have undergone significant changes in their product mix or
services and have added value to the products they handled before, mainly as a response to
the changing consumer profile, tastes, to improve competitiveness and to gain markets. Table
7 shows that two companies (B and D) have had significant changes to their clients whilst
companies A and C haven‘t had changes to their customers over the past 5 years. Companies
A and C converted from cooperatives to companies in 1998, whereas companies B and D
converted recently, thus it is expected that the recent structural changes came with changes to
customers and clients. Cooperatives still retain more or less the same customers or clients as
they had five more years back. In addition, cooperatives distinguish between member and
non members as clients by offering discounts to their members, thus offering an incentive to
be a cooperative member, whereas companies do not distinguish between members and non
members as clients. Both companies and cooperatives assisted their member clients to
enhance their efficiency or profitability because it created value for the firm.
Table 7: Changes in customers or clients
Comp A Comp B Comp C Comp D Coop A Coop B Coop C
No change
Slight changes
Significant changes
6.2.2 Organisational culture and structure
Establishing the correct and appropriate organisation culture is an essential process of
managing an organization (Schermerhorn et al, 2005). Figure 4 below shows how the
different firms rated the following characteristics from a scale of 0 to 5, with 0 indicating that
the specific characteristic does not exist whereas 5 indicates a strong presence of the
characteristic. The results indicate that companies have a constructive culture which is much
more dynamic than that of cooperatives. Team work and being a learning organisation is
characteristic of companies, cooperatives also exhibits such characteristics though at a
slightly lower scale. Even though diversity in employees is considered highly important by
both cooperatives and companies, there is a consensus that recruitment is inhibited by the
availability of suitable candidates and the negative view the job market has on agriculture, as
well as the rural location of the agribusinesses.
76
Figure 4: Differences in organisational culture
When the organisational culture of the agribusinesses are mapped using the approach
developed by Schermerhorn et al (2005), cooperatives and companies show a hybrid of the
constructive cultures and aggressive/ defensive cultures as shown in Figure 5.
Figure 5: The organisational culture of the agribusinesses
MOST EFFECTIVE
Passive/ Defensive Cultures Constructive cultures Aggressive/ Defensive cultures
Members are defensive in their
actions
• Approval
• Conventional
• Dependant
• Avoidance
Members are helpful in their
interactions
• Achievement
• Self actualising
• Learning organization
• transformational
• Affiliative
• Employee diversity
• Team work
• Work with greater
motivation
• Dynamic
• Informal and relaxed
Members are forceful in their
interactions
• Emphasis of Power
• Competitive
• Perfectionist
• Oppositional
0 1 2 3 4 5 6
learning organisation
Team work
Employee diversity
Comp D
Comp C
Comp B
Comp A
Coop C
Coop B
Coop A
HYBRID

77
All the agribusinesses have undergone some form of changes in their organisational structure
in the past 5 years. This highlights the importance of adapting organisational structures to suit
the environment. Figure 6 show that cooperatives have a hierarchal structure as compared to
companies. Secondly, both cooperatives and agribusinesses are becoming more networked
organisations. Cooperatives indicate that they have acquired a company or some business unit
under their group name as compared to companies who state that they haven‘t done the same,
with the exception of one company. However, analysis of company annual reports presents a
different story because they indicate that companies do own one or more companies under
their group name. Both cooperatives and companies seem to strongly agree that they have
established independent companies or business units. These observations indicate that the
organisational structures of agribusinesses is becoming more networked.
Figure 6: The changes in organisational structure
Figure 7 shows the old traditional organisational structure of most cooperatives. There has
been a transition to a more networked organisational structure by cooperatives and companies
as shown in Figure 8. Most units, subsidiaries and investments have been placed under one
group name. Thus the question of who owns who and what is becoming relatively important
for agribusinesses. Business empires are becoming the norm, with much emphasis becoming
increasingly drawn to size and power. However, the changing organisational structures also
confirm the nature and types of investments the agribusinesses have had to undertake in
response to the dynamic business environment.
0 1 2 3 4 5 6
hierichal structure
Networked organisation
companies or units have been put under one group name
independent companies or units have been established
Comp D
Comp C
Comp B
Comp A
Coop C
Coop B
Coop A

78
Figure 7: Traditional organisation structure of cooperatives
Figure 8: The organisation structure of modern cooperatives
6.2.3 Management
Table 8 shows that the management styles of both cooperatives and companies reflected a
trend that is dynamic, informal, relaxed and focused on transforming people. In addition, all
COOPERATIVE A
BUSINESS UNIT A
Provision of services
BUSINESS UNIT B
Handling, storage,
marketing and
processing of
produce
BUSINESS UNIT C
(Farming requisites,
mechanization and
engineering works)
GROUP NAME
COOPERATIVE A Other investments
Oil Company
(68% shareholding)
Animal feed
manufacturing
(100%)
Precision farming
services and
equipment (70%)
Marketing of
fertilizer
(100%)
Extraction of oil
from canola (50%)

79
the agribusinesses acknowledged to have changed their management styles to suit the new
environment which is critical given the dynamic environment.
Table 8: Management styles
Comp A Comp B Comp C Comp D Coop A Coop B Coop C
Dynamic
Informal and relaxed
Formal
Focused on transforming people
Changed their management styles
to suit the new environment
Heterogeneous
Homogeneous
Management incentives and compensation has been shown to have a strong link with
performance and thus organisational performance (Demsetz, 1983). As expected all the
agribusiness companies offered benefits and incentives to management in order to enhance
performance. Table 9 shows that the most common incentive to all the agribusinesses was the
profit share and incentive bonus. However, one of the companies also offered honorary
rewards or non financial recognition, a clear indication of a strong culture of high
performance in the organisation. Thus, it comes as no surprise that the rate of staff turnover
(management) is low for all the agribusinesses.
Table 9: Management incentive schemes
Comp A Comp B Comp C Comp D Coop A Coop B Coop C
share option
profit sharing
incentive bonus
honorary rewards or non financial
recognition
6.2.4 Property rights
Today‘s challenging environment requires organizations to have well defined and structured
property rights in order to be successful. The cooperatives interviewed showed the same
80
property rights framework that has come under criticism and has led to the emergence of new
cooperative models in other countries. The following summarise the property rights that
emerge from the cooperatives;
No different classes of shares have been established to accommodate new
investors
Shares are traded through private sells and do not fluctuate in value
Members still redeem their equity or shares at nominal value if they want to
exit the organisation
Do not allow non patron investors in the organisation
There is still use of the one member one vote principle
However, all the cooperatives indicated that the continued use of somewhat ill defined
property rights was mainly because of the Cooperatives Act 2005 (Act 14 of 2005) that
prohibits or limits the cooperatives to adopt well defined property rights as has been the case
in other developed countries. The following were cited as the major constraints of the
cooperatives Act 2005 (Act 14 of 2005);
Membership: the act restricts membership of cooperatives to natural persons only.
Thus this provision is challenging or unclear especially for established cooperatives
who are continually seeking membership from high net worth clients such as trust
companies.
Voting principle: section 3(1) b and 14(1)(e) states that in the case of a primary co-
operative, each member has only one vote. Thus even if cooperatives were to adopt
innovative voting systems, it would be against the act. In addition, the act strictly
prohibits a weighted voting system based on shareholding or participation in the
cooperative. Section 3(3) however indicates that the constitution of a secondary or
tertiary co-operative may provide that the members have more than one vote:
Provided that in the case of a secondary co-operative no member shall have more than
fifteen per cent of the vote of all the members of the co-operative. Thus this is a
constraint when compared to the company business model where share participation
is unlimited (unless limited by the company articles).
Shares; section 41 (4) states that all shares issued must be of the same class and
ranking thus making it difficult for cooperatives to create other innovative shares in
order to cater for different investors needs. In addition, 41 (6) indicates that transfer of

81
membership shares is only valid if it complies with section 25, that gives a lot of
power to the cooperative as they can defer such payment for a period not exceeding
two years if the payment would adversely affect the cooperatives financial well-
being.
All the agribusinesses had the advantage of having enough capital to finance their major
investments because they could acquire loans or credit easily due to their balance sheet. As
expected, cooperatives still have members patronising the organisation as the majority of
shareholders. The trend is similar in companies, the main investors are members or those
involved with the organisation in one way or another, even though institutional investors like
trust companies are stakeholders in companies, they are not the major shareholders. Figure 9
shows that cooperatives seem to favour bank loans and reserved funds whereas companies
seem to have a wider choice in sources for finance. All the cooperatives and companies had a
conservative dividend policy in as far as declaring dividends were concerned whereas
companies indicated in having an aggressive dividend policy in as far as investing is
concerned. This indicates the relative importance of investments and the long term view
companies have as compared to cooperatives whose long term view may be influenced by the
horizon period of individual members.
6.3 Motivations and reasons for structural changes
The main reasons cooperatives state for undergoing structural changes is to raise capital, as a
strategy to reduce costs and because of members leaving. Companies indicate that they have
had to undergo structural changes (conversions included) mainly for political reasons, as a
response to the deregulation of the industry, management pressure, seeking to expand the
organization, response to the cooperatives act, relative merits of the company business model
and seeking to improve competitiveness. The deregulation of the industry is cited as the
major reason for structural changes by both cooperatives and companies, which shows the
pressure competition exerts on businesses and the need to improve competitiveness in the
dynamic environment. However, one inconsistent observation is that companies indicated
that they have had to make structural changes in response to the cooperative act (act 14 of
2005) even though they converted to companies in 1998 and were thus unaffected by the new
act then. Figure 9 shows other reasons given for structural and their ratings on a scale of 0 to
5.

82
Figure 9: Reasons for structural changes
6.4 Results of the dynamism score card
Table 10 shows that companies are by far much more dynamic than cooperatives. The
average dynamism score for companies is 83.75 as compared to the score of 62.33 for
cooperatives. Cooperatives compare favourably well in all the dynamism factors except for
their property rights framework, which is the main differential factor. Cooperatives are
definitely not dynamic in terms of their property rights mainly because of the limitations of
the Cooperatives Act (Act 14 of 2005). All the agribusinesses still have to improve their role
in environmental sustainability or eco sensitive initiatives, role in BEE as well as in adopting
the triple bottom line accounting reporting method. Thus contrary to intuition and
expectations, cooperatives are showing that they are as and have the potential to be more
dynamic than companies if their property rights structures are addressed. More specifically if
0 2 4 6
Members leaving the organisation
To raise capital
Improve competitiveness of the organisation
Relative merits of the company business model
Discontent with the perfomance of the organisation
As a strategy to reduce costs
Response to the Cooperatives Act (Act 14 of 2005)
Discontent with the structure of the cooperative
Seeking to expand your business empire
members pressure
Management pressure
Response to the deregulation of the industry
Changes in tax laws
Political reasons
Companies
Cooperatives

83
the Cooperatives Act (Act 14 of 2005) accommodates some issues that are constraining
cooperative dynamism.
Table 10: Results of the dynamism score card
COOPERATIVE COMPANY
Specific criteria of
comparing dynamism
Max
Score
A B C A B C D
Role in corporate social
investment
3 1 1 2 3 3 3 3
Environmental sustainability
or eco sensitive initiatives
3 3 3
Nature of investments 5 5 4 3 5 4 4 5
BEE score card 3 1 1 1 1 1 3 1
Accounting reporting method 3 1 1 1 1 3 1 1
Changes in customers 4 2 2 2 4 2 4 2
Changes in product mix or
services and value addition
4 4 4 4 4 4 4 4
Management style 10 10 8 9 9 9 10 8
Management incentives and
compensation
15 10 10 10 10 10 10 10
Organisational culture 10 8 6 9 9 8 9 8
Structure of the organisation 5 4 3 4 4 4 4 4
Restructuring actions in the
past 5 years?
5 5 4 5 5 5 5 5
Type of investors 5 3 3 3 5 5 4 4
Shares (price, how they are
redeemed, classes)
10 4 4 5 10 8 10 10
Dividend policy 5 4 4 4 5 4 5 5
Voting principle 5 2 2 2 5 5 5 5
Capital structure 5 4 4 4 5 5 5 4
DYNAMISM SCORE 68 61 68 85 80 88 82
TOTAL DYNAMISM
SCORE (Average)
100 62.33 83.75
6.5 Summary
Changes that are occurring in both cooperatives and companies confirm the increasing
importance of dynamism in order to survive and lead in the ever changing business
environment.
Contrary to prior expectations, cooperatives show that they are also embracing change
because they have adopted new organisation strategies, structures and culture.
Cooperative management also shows a great deal of dynamism that is closely
comparable to companies.
However, the property rights of cooperatives are still the same with that of the much
criticised traditional cooperatives. Thus their overall dynamism score is lower than

84
that of companies (62.33 as compared to 83.75). Cooperatives point at the difficulty to
adhere to the Cooperatives Act (Act 14 of 2005) and its limitations to changing the
property rights of the cooperatives. Such limitations have meant that it is difficult or
almost impossible for commercial cooperatives to adhere to such policy thus the
choice to converting to companies. As a result, if amendments are not made to the
cooperative act, there is expectation of a continual decrease in the number of
commercial cooperatives, with the rise of development or emerging cooperatives
which are heavily supported by the new cooperative act and other supporting policies?
On the contrary, companies seem to be more dynamic and embracing change even
though they still have to improve their role in environmental sustainability or eco
sensitive initiatives, role in BEE as well as in adopting the triple bottom line
accounting reporting method in order to be fully dynamic, challenges also shared by
cooperatives.
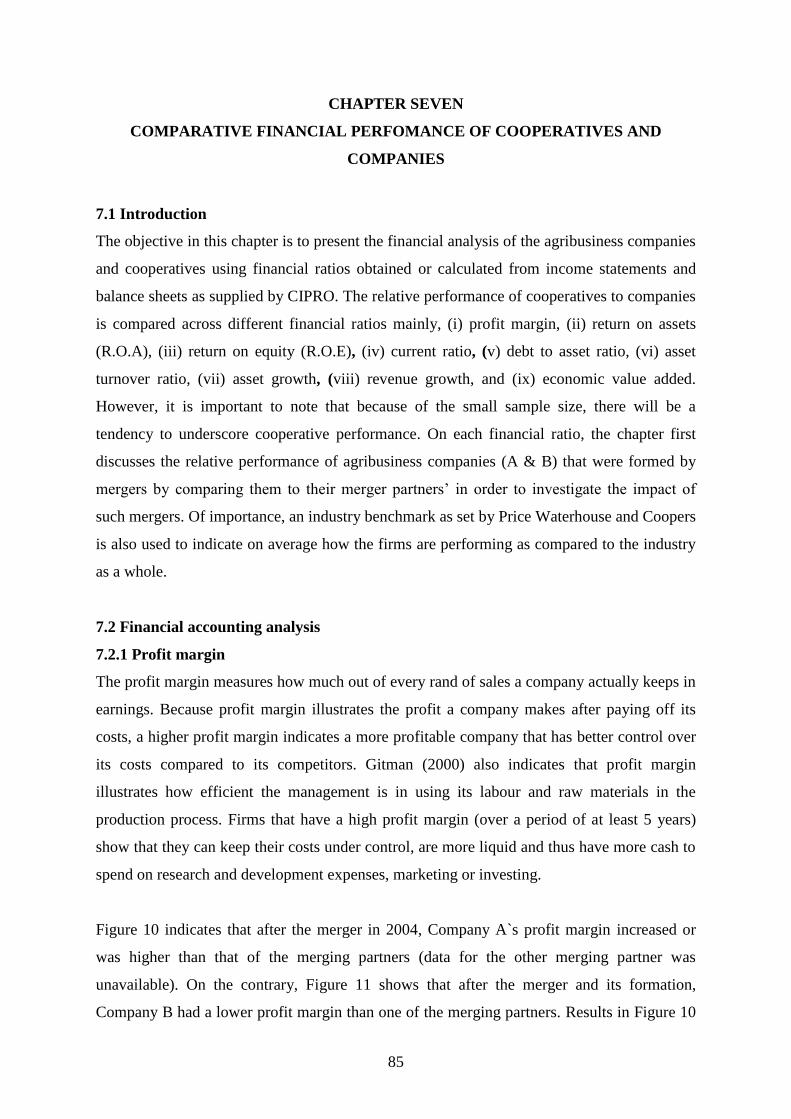
85
CHAPTER SEVEN
COMPARATIVE FINANCIAL PERFOMANCE OF COOPERATIVES AND
COMPANIES
7.1 Introduction
The objective in this chapter is to present the financial analysis of the agribusiness companies
and cooperatives using financial ratios obtained or calculated from income statements and
balance sheets as supplied by CIPRO. The relative performance of cooperatives to companies
is compared across different financial ratios mainly, (i) profit margin, (ii) return on assets
(R.O.A), (iii) return on equity (R.O.E), (iv) current ratio, (v) debt to asset ratio, (vi) asset
turnover ratio, (vii) asset growth, (viii) revenue growth, and (ix) economic value added.
However, it is important to note that because of the small sample size, there will be a
tendency to underscore cooperative performance. On each financial ratio, the chapter first
discusses the relative performance of agribusiness companies (A & B) that were formed by
mergers by comparing them to their merger partners‘ in order to investigate the impact of
such mergers. Of importance, an industry benchmark as set by Price Waterhouse and Coopers
is also used to indicate on average how the firms are performing as compared to the industry
as a whole.
7.2 Financial accounting analysis
7.2.1 Profit margin
The profit margin measures how much out of every rand of sales a company actually keeps in
earnings. Because profit margin illustrates the profit a company makes after paying off its
costs, a higher profit margin indicates a more profitable company that has better control over
its costs compared to its competitors. Gitman (2000) also indicates that profit margin
illustrates how efficient the management is in using its labour and raw materials in the
production process. Firms that have a high profit margin (over a period of at least 5 years)
show that they can keep their costs under control, are more liquid and thus have more cash to
spend on research and development expenses, marketing or investing.
Figure 10 indicates that after the merger in 2004, Company A`s profit margin increased or
was higher than that of the merging partners (data for the other merging partner was
unavailable). On the contrary, Figure 11 shows that after the merger and its formation,
Company B had a lower profit margin than one of the merging partners. Results in Figure 10
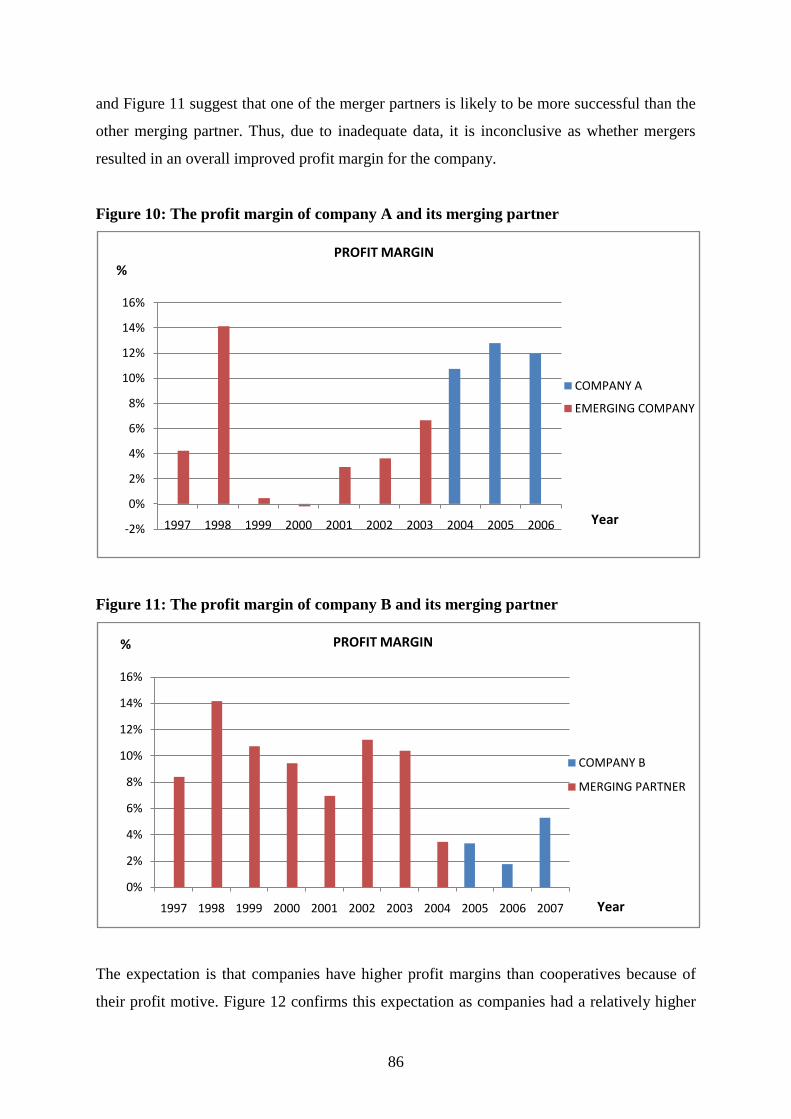
86
and Figure 11 suggest that one of the merger partners is likely to be more successful than the
other merging partner. Thus, due to inadequate data, it is inconclusive as whether mergers
resulted in an overall improved profit margin for the company.
Figure 10: The profit margin of company A and its merging partner
Figure 11: The profit margin of company B and its merging partner
The expectation is that companies have higher profit margins than cooperatives because of
their profit motive. Figure 12 confirms this expectation as companies had a relatively higher
-2%
0%
2%
4%
6%
8%
10%
12%
14%
16%
1997 1998 1999 2000 2001 2002 2003 2004 2005 2006
COMPANY A
EMERGING COMPANY
PROFIT MARGIN%
Year
0%
2%
4%
6%
8%
10%
12%
14%
16%
1997 1998 1999 2000 2001 2002 2003 2004 2005 2006 2007
COMPANY B
MERGING PARTNER
PROFIT MARGIN%
Year

87
profit margin than cooperatives (albeit a small difference) for most years except from 2003 to
2005 when cooperatives show a higher profit margin. Thus from the year 2000 to 2006 the
differences in profit margins is relatively small, but is significantly higher in the years 1999,
2006 and 2007. The PWC benchmarking survey indicates that the industry standard for profit
margin is about 7.4% and 6.8% (2006 and 2007 respectively). Figure 12 shows that
agribusiness companies under review managed to report a higher profit margin than the
industry benchmark for 2007, whereas cooperatives have failed to surpass this industry
benchmark for both 2006 and 2007.
Figure 12: The profit margin of cooperatives and companies
7.2.2. Return on assets (R.O.A)
Return on assets (R.O.A) indicates the profitability per rand of assets by measuring the firms`
overall effectiveness in generating profits with its available assets. R.O.A gives an idea as to
how efficient management is at using its assets to generate profits. The higher the ROA, the
better, because the company is earning more money on less investment. The lower the profit
per rand of assets, the more asset-intensive a business is. The higher the profit per rand of
assets, the less asset-intensive a business is. All things being equal, the more asset-intensive a
business, more money must be reinvested to continue generating earnings.
-2
0
2
4
6
8
10
12
1997 1998 1999 2000 2001 2002 2003 2004 2005 2006 2007
COMPANY
COOPERATIVE
PROFIT MARGIN%
Year
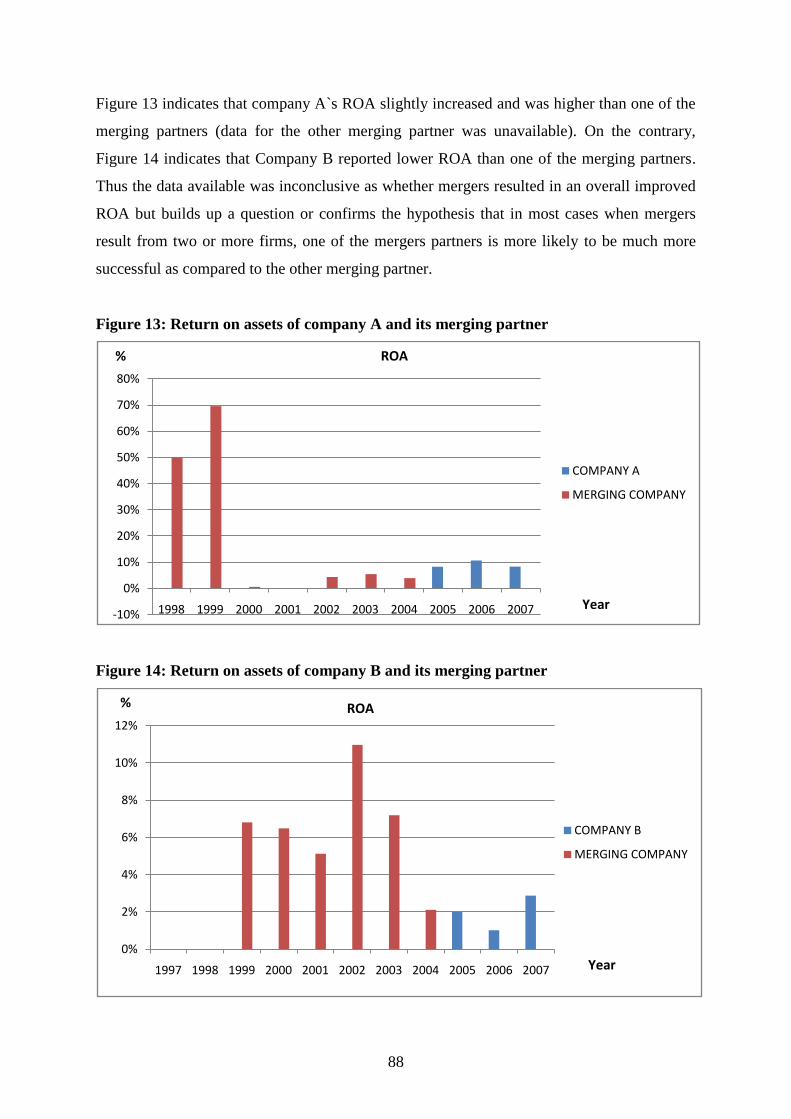
88
Figure 13 indicates that company A`s ROA slightly increased and was higher than one of the
merging partners (data for the other merging partner was unavailable). On the contrary,
Figure 14 indicates that Company B reported lower ROA than one of the merging partners.
Thus the data available was inconclusive as whether mergers resulted in an overall improved
ROA but builds up a question or confirms the hypothesis that in most cases when mergers
result from two or more firms, one of the mergers partners is more likely to be much more
successful as compared to the other merging partner.
Figure 13: Return on assets of company A and its merging partner
Figure 14: Return on assets of company B and its merging partner
-10%
0%
10%
20%
30%
40%
50%
60%
70%
80%
1998 1999 2000 2001 2002 2003 2004 2005 2006 2007
COMPANY A
MERGING COMPANY
ROA
Year
%
0%
2%
4%
6%
8%
10%
12%
1997 1998 1999 2000 2001 2002 2003 2004 2005 2006 2007
COMPANY B
MERGING COMPANY
ROA%
Year
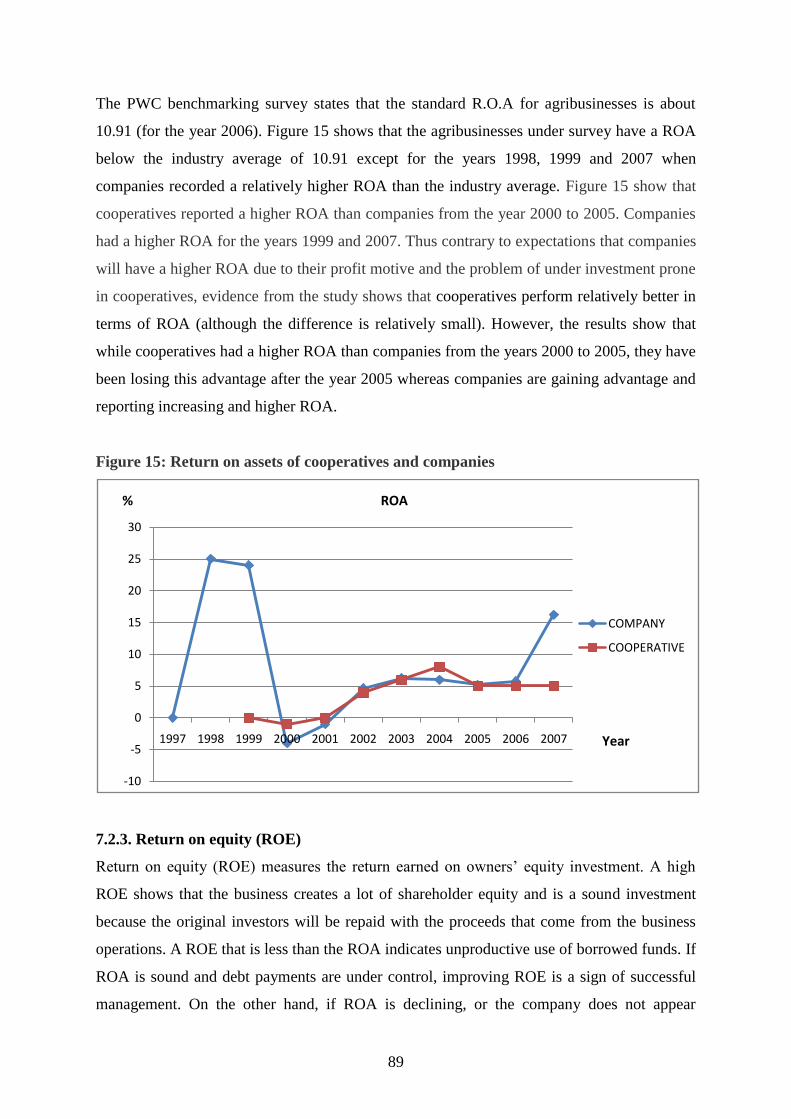
89
The PWC benchmarking survey states that the standard R.O.A for agribusinesses is about
10.91 (for the year 2006). Figure 15 shows that the agribusinesses under survey have a ROA
below the industry average of 10.91 except for the years 1998, 1999 and 2007 when
companies recorded a relatively higher ROA than the industry average. Figure 15 show that
cooperatives reported a higher ROA than companies from the year 2000 to 2005. Companies
had a higher ROA for the years 1999 and 2007. Thus contrary to expectations that companies
will have a higher ROA due to their profit motive and the problem of under investment prone
in cooperatives, evidence from the study shows that cooperatives perform relatively better in
terms of ROA (although the difference is relatively small). However, the results show that
while cooperatives had a higher ROA than companies from the years 2000 to 2005, they have
been losing this advantage after the year 2005 whereas companies are gaining advantage and
reporting increasing and higher ROA.
Figure 15: Return on assets of cooperatives and companies
7.2.3. Return on equity (ROE)
Return on equity (ROE) measures the return earned on owners‘ equity investment. A high
ROE shows that the business creates a lot of shareholder equity and is a sound investment
because the original investors will be repaid with the proceeds that come from the business
operations. A ROE that is less than the ROA indicates unproductive use of borrowed funds. If
ROA is sound and debt payments are under control, improving ROE is a sign of successful
management. On the other hand, if ROA is declining, or the company does not appear
-10
-5
0
5
10
15
20
25
30
1997 1998 1999 2000 2001 2002 2003 2004 2005 2006 2007
COMPANY
COOPERATIVE
ROA
Year
%
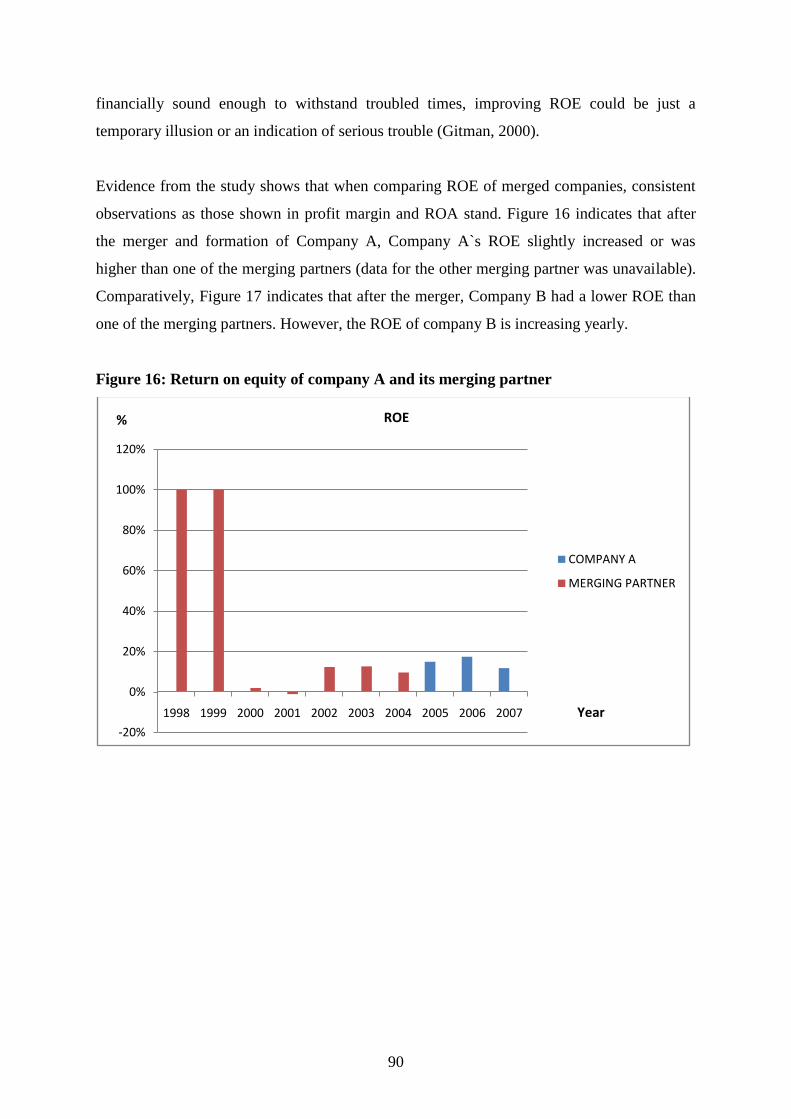
90
financially sound enough to withstand troubled times, improving ROE could be just a
temporary illusion or an indication of serious trouble (Gitman, 2000).
Evidence from the study shows that when comparing ROE of merged companies, consistent
observations as those shown in profit margin and ROA stand. Figure 16 indicates that after
the merger and formation of Company A, Company A`s ROE slightly increased or was
higher than one of the merging partners (data for the other merging partner was unavailable).
Comparatively, Figure 17 indicates that after the merger, Company B had a lower ROE than
one of the merging partners. However, the ROE of company B is increasing yearly.
Figure 16: Return on equity of company A and its merging partner
-20%
0%
20%
40%
60%
80%
100%
120%
1998 1999 2000 2001 2002 2003 2004 2005 2006 2007
COMPANY A
MERGING PARTNER
ROE%
Year

91
Figure 17: Return on equity of company B and its merging partner
The comparative performance of cooperatives and companies as measured by ROE shows
fluctuations. Figure 18 indicates that cooperatives show dominance in performance in the
years 2000, 2001, 2003, 2004 and 2005, whereas companies show a better performance in the
years 1999, 2002, 2006 and 2007. Results on ROE also confirm that cooperatives are
beginning to lose their performance advantage whereas companies show relatively higher
performance gains than cooperatives from the year 2005 to 2007.
Figure 18: Return on equity of cooperatives and companies
0%
2%
4%
6%
8%
10%
12%
14%
16%
18%
1997 1998 1999 2000 2001 2002 2003 2004 2005 2006 2007
COMPANY B
MERGING PARTNER
ROE%
Year
-30
-20
-10
0
10
20
30
40
50
1997 1998 1999 2000 2001 2002 2003 2004 2005 2006 2007
COMPANY
COOPERATIVE
ROE
Year
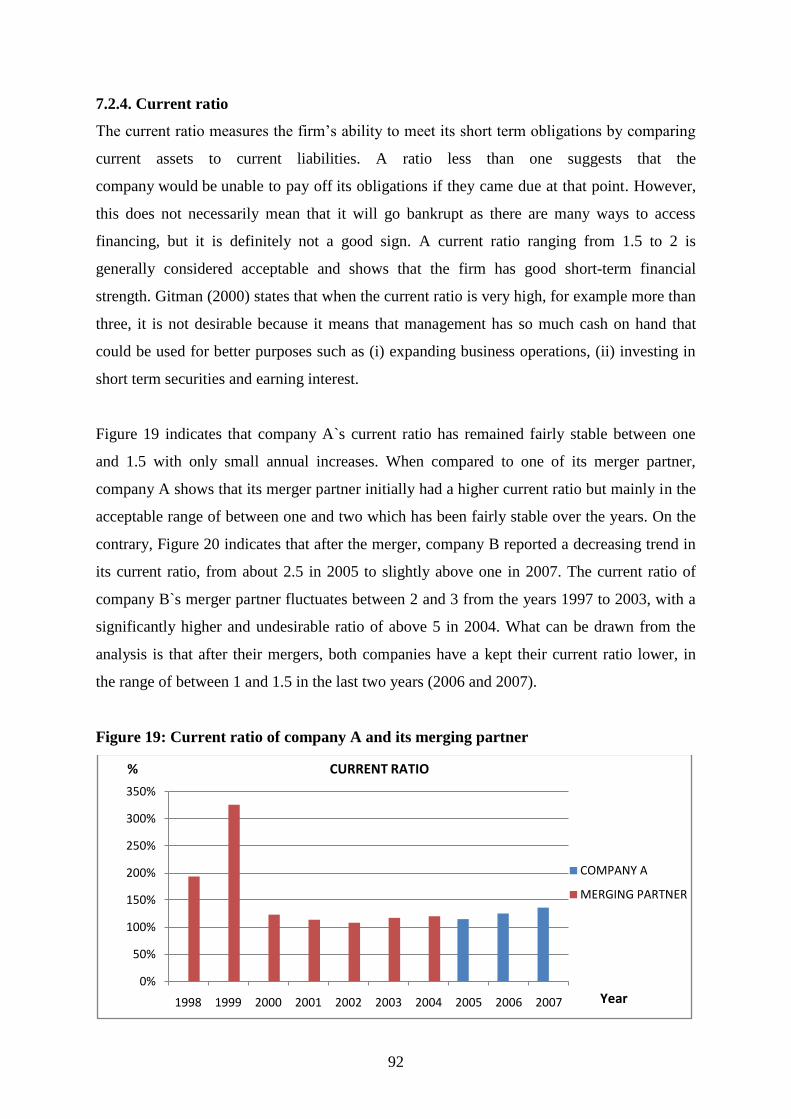
92
7.2.4. Current ratio
The current ratio measures the firm‘s ability to meet its short term obligations by comparing
current assets to current liabilities. A ratio less than one suggests that the
company would be unable to pay off its obligations if they came due at that point. However,
this does not necessarily mean that it will go bankrupt as there are many ways to access
financing, but it is definitely not a good sign. A current ratio ranging from 1.5 to 2 is
generally considered acceptable and shows that the firm has good short-term financial
strength. Gitman (2000) states that when the current ratio is very high, for example more than
three, it is not desirable because it means that management has so much cash on hand that
could be used for better purposes such as (i) expanding business operations, (ii) investing in
short term securities and earning interest.
Figure 19 indicates that company A`s current ratio has remained fairly stable between one
and 1.5 with only small annual increases. When compared to one of its merger partner,
company A shows that its merger partner initially had a higher current ratio but mainly in the
acceptable range of between one and two which has been fairly stable over the years. On the
contrary, Figure 20 indicates that after the merger, company B reported a decreasing trend in
its current ratio, from about 2.5 in 2005 to slightly above one in 2007. The current ratio of
company B`s merger partner fluctuates between 2 and 3 from the years 1997 to 2003, with a
significantly higher and undesirable ratio of above 5 in 2004. What can be drawn from the
analysis is that after their mergers, both companies have a kept their current ratio lower, in
the range of between 1 and 1.5 in the last two years (2006 and 2007).
Figure 19: Current ratio of company A and its merging partner
0%
50%
100%
150%
200%
250%
300%
350%
1998 1999 2000 2001 2002 2003 2004 2005 2006 2007
COMPANY A
MERGING PARTNER
CURRENT RATIO
Year
%
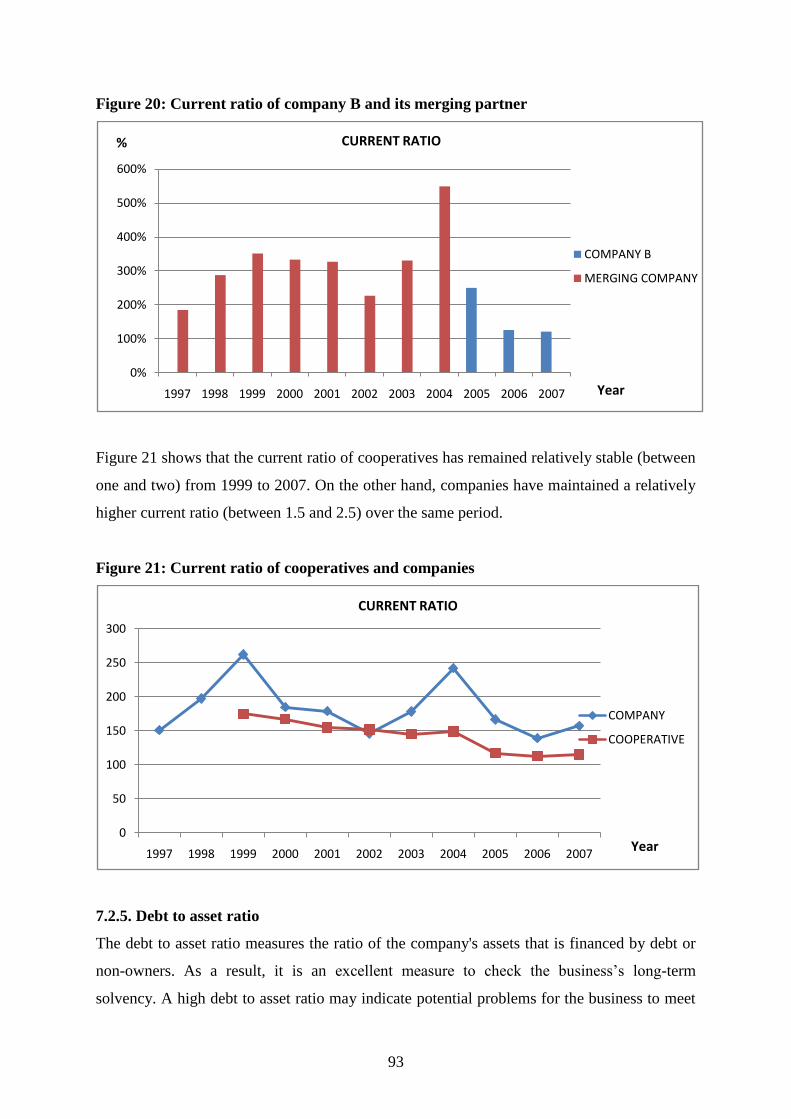
93
Figure 20: Current ratio of company B and its merging partner
Figure 21 shows that the current ratio of cooperatives has remained relatively stable (between
one and two) from 1999 to 2007. On the other hand, companies have maintained a relatively
higher current ratio (between 1.5 and 2.5) over the same period.
Figure 21: Current ratio of cooperatives and companies
7.2.5. Debt to asset ratio
The debt to asset ratio measures the ratio of the company's assets that is financed by debt or
non-owners. As a result, it is an excellent measure to check the business‘s long-term
solvency. A high debt to asset ratio may indicate potential problems for the business to meet
0%
100%
200%
300%
400%
500%
600%
1997 1998 1999 2000 2001 2002 2003 2004 2005 2006 2007
COMPANY B
MERGING COMPANY
CURRENT RATIO%
Year
0
50
100
150
200
250
300
1997 1998 1999 2000 2001 2002 2003 2004 2005 2006 2007
COMPANY
COOPERATIVE
CURRENT RATIO
Year
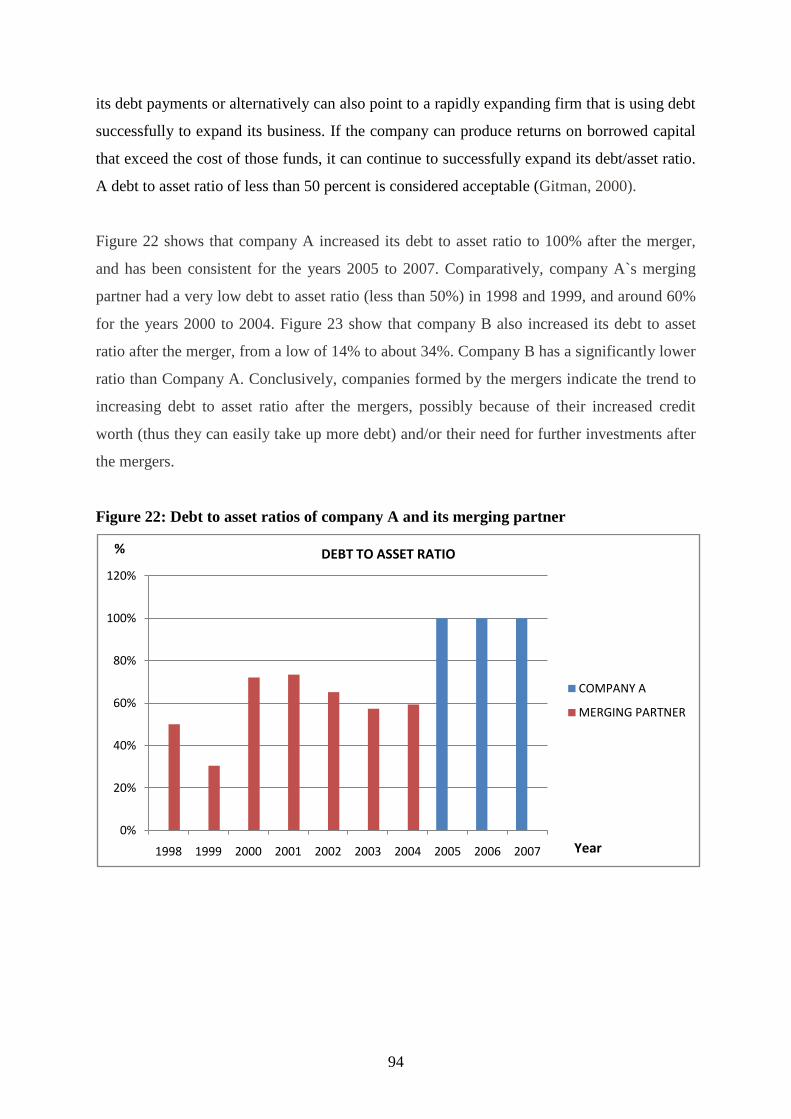
94
its debt payments or alternatively can also point to a rapidly expanding firm that is using debt
successfully to expand its business. If the company can produce returns on borrowed capital
that exceed the cost of those funds, it can continue to successfully expand its debt/asset ratio.
A debt to asset ratio of less than 50 percent is considered acceptable (Gitman, 2000).
Figure 22 shows that company A increased its debt to asset ratio to 100% after the merger,
and has been consistent for the years 2005 to 2007. Comparatively, company A`s merging
partner had a very low debt to asset ratio (less than 50%) in 1998 and 1999, and around 60%
for the years 2000 to 2004. Figure 23 show that company B also increased its debt to asset
ratio after the merger, from a low of 14% to about 34%. Company B has a significantly lower
ratio than Company A. Conclusively, companies formed by the mergers indicate the trend to
increasing debt to asset ratio after the mergers, possibly because of their increased credit
worth (thus they can easily take up more debt) and/or their need for further investments after
the mergers.
Figure 22: Debt to asset ratios of company A and its merging partner
0%
20%
40%
60%
80%
100%
120%
1998 1999 2000 2001 2002 2003 2004 2005 2006 2007
COMPANY A
MERGING PARTNER
DEBT TO ASSET RATIO%
Year

95
Figure 23: Debt to asset of company B and its merging partner
Figure 24 shows that all the agribusinesses had a debt to asset ratio of less than 100%. Figure
25 shows that the debt to asset ratio of companies fluctuates around 40 to 80% and is usually
above that of cooperatives except for the years 2003, 2004 and 2007. Cooperatives on the
other hand have maintained their debt to asset ratio at between 55 to 65% from the year 2001
to 2007, with the exception of the years 1999 and 2000 were a ratio of 30% and 13% was
reported respectively. Conclusively, cooperatives consistently maintained significantly lower
debt to asset ratios than companies. This could be attributable to the debt financing power of
companies as compared to cooperatives.
Figure 24: Debt to asset of cooperatives and companies
0%
5%
10%
15%
20%
25%
30%
35%
40%
1999 2000 2001 2002 2003 2004 2005 2006 2007
COMPANY B
MERGING PARTNER
DEBT TO ASSET RATIO%
Year
0
10
20
30
40
50
60
70
80
90
1997 1998 1999 2000 2001 2002 2003 2004 2005 2006 2007
COMPANY
COOPERATIVE
DEBT TO ASSET RATIO%
Year
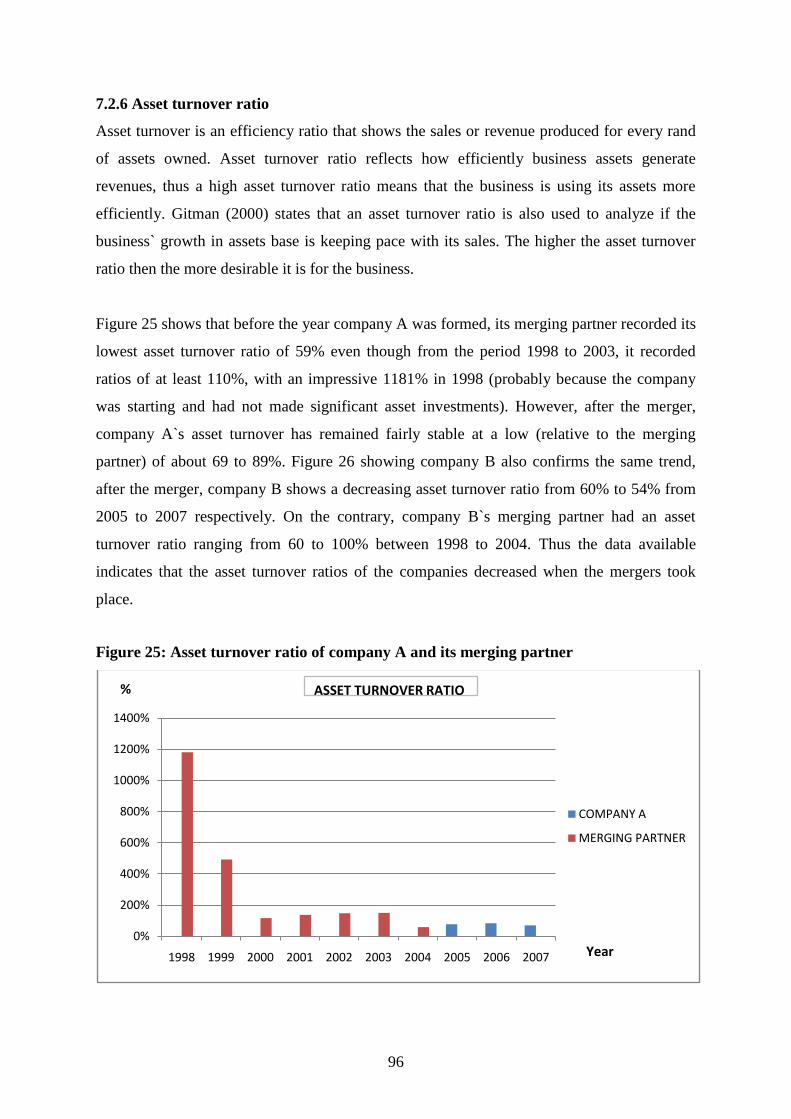
96
7.2.6 Asset turnover ratio
Asset turnover is an efficiency ratio that shows the sales or revenue produced for every rand
of assets owned. Asset turnover ratio reflects how efficiently business assets generate
revenues, thus a high asset turnover ratio means that the business is using its assets more
efficiently. Gitman (2000) states that an asset turnover ratio is also used to analyze if the
business` growth in assets base is keeping pace with its sales. The higher the asset turnover
ratio then the more desirable it is for the business.
Figure 25 shows that before the year company A was formed, its merging partner recorded its
lowest asset turnover ratio of 59% even though from the period 1998 to 2003, it recorded
ratios of at least 110%, with an impressive 1181% in 1998 (probably because the company
was starting and had not made significant asset investments). However, after the merger,
company A`s asset turnover has remained fairly stable at a low (relative to the merging
partner) of about 69 to 89%. Figure 26 showing company B also confirms the same trend,
after the merger, company B shows a decreasing asset turnover ratio from 60% to 54% from
2005 to 2007 respectively. On the contrary, company B`s merging partner had an asset
turnover ratio ranging from 60 to 100% between 1998 to 2004. Thus the data available
indicates that the asset turnover ratios of the companies decreased when the mergers took
place.
Figure 25: Asset turnover ratio of company A and its merging partner
0%
200%
400%
600%
800%
1000%
1200%
1400%
1998 1999 2000 2001 2002 2003 2004 2005 2006 2007
COMPANY A
MERGING PARTNER
ASSET TURNOVER RATIO%
Year
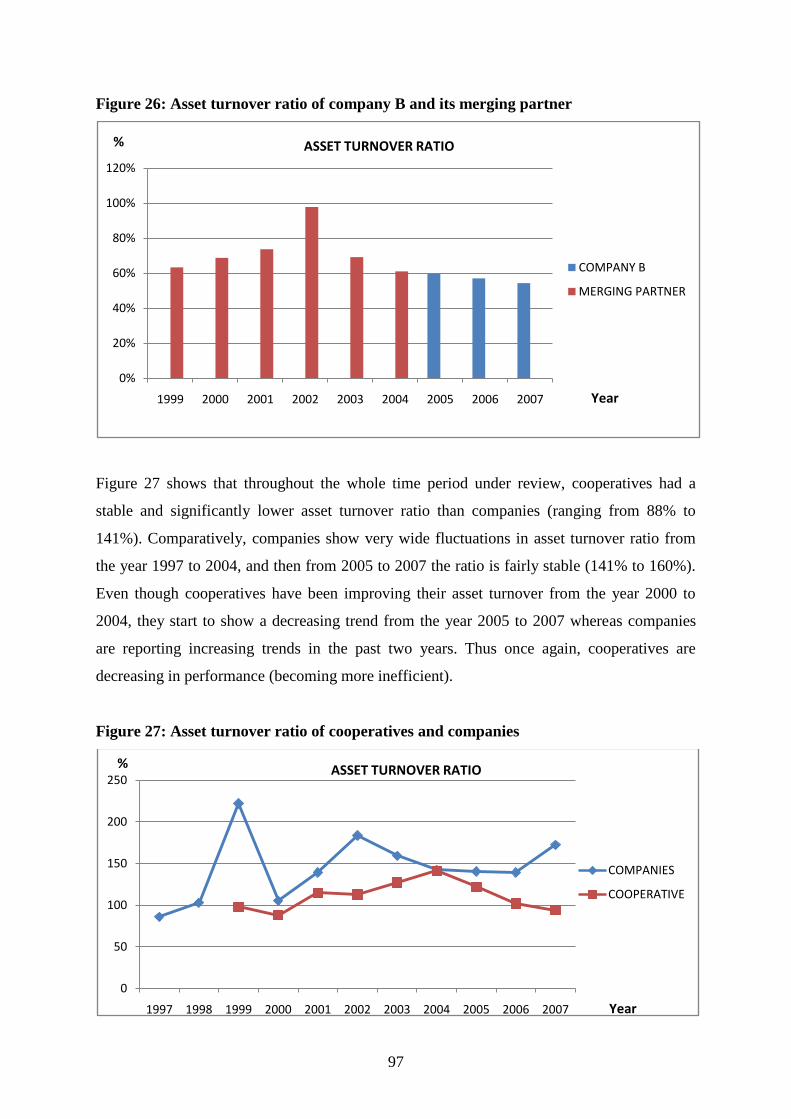
97
Figure 26: Asset turnover ratio of company B and its merging partner
Figure 27 shows that throughout the whole time period under review, cooperatives had a
stable and significantly lower asset turnover ratio than companies (ranging from 88% to
141%). Comparatively, companies show very wide fluctuations in asset turnover ratio from
the year 1997 to 2004, and then from 2005 to 2007 the ratio is fairly stable (141% to 160%).
Even though cooperatives have been improving their asset turnover from the year 2000 to
2004, they start to show a decreasing trend from the year 2005 to 2007 whereas companies
are reporting increasing trends in the past two years. Thus once again, cooperatives are
decreasing in performance (becoming more inefficient).
Figure 27: Asset turnover ratio of cooperatives and companies
0%
20%
40%
60%
80%
100%
120%
1999 2000 2001 2002 2003 2004 2005 2006 2007
COMPANY B
MERGING PARTNER
ASSET TURNOVER RATIO%
Year
0
50
100
150
200
250
1997 1998 1999 2000 2001 2002 2003 2004 2005 2006 2007
COMPANIES
COOPERATIVE
ASSET TURNOVER RATIO%
Year

98
7.2.7. Asset growth
Business firms need to invest in assets in order to be competitive. Such asset investments
include investing in productive processing facilities or processes that improve the efficiency
of their operations. Of importance is that asset growth should result in improved revenues,
profitability and efficiency. A sustainable and positive asset growth is usually desirable for
any business. Figure 28 shows that company A`s assets increased and are higher than its
merging partner. The same observation applies for company B as shown in Figure 29. Thus
the results seem to suggest that assets grew after the mergers and have been increasing which
is expected because of the combined asset value of the merging firms and the drive to
continuously invest in assets to improve competitiveness.
Figure 28: Total assets of company A and its merging partner
Figure 29: Total assets of company B and its merging partner
0.00
500,000,000.00
1,000,000,000.00
1,500,000,000.00
2,000,000,000.00
2,500,000,000.00
3,000,000,000.00
1998 1999 2000 2001 2002 2003 2004 2005 2006 2007
TOTAL ASSETS
Company A
Merging partner
Rands
Year
0.00
200,000,000.00
400,000,000.00
600,000,000.00
800,000,000.00
1,000,000,000.00
1,200,000,000.00
1,400,000,000.00
1998 1999 2000 2001 2002 2003 2004 2005 2006 2007
TOTAL ASSETS
Company B
Merging partner
Rands
Year
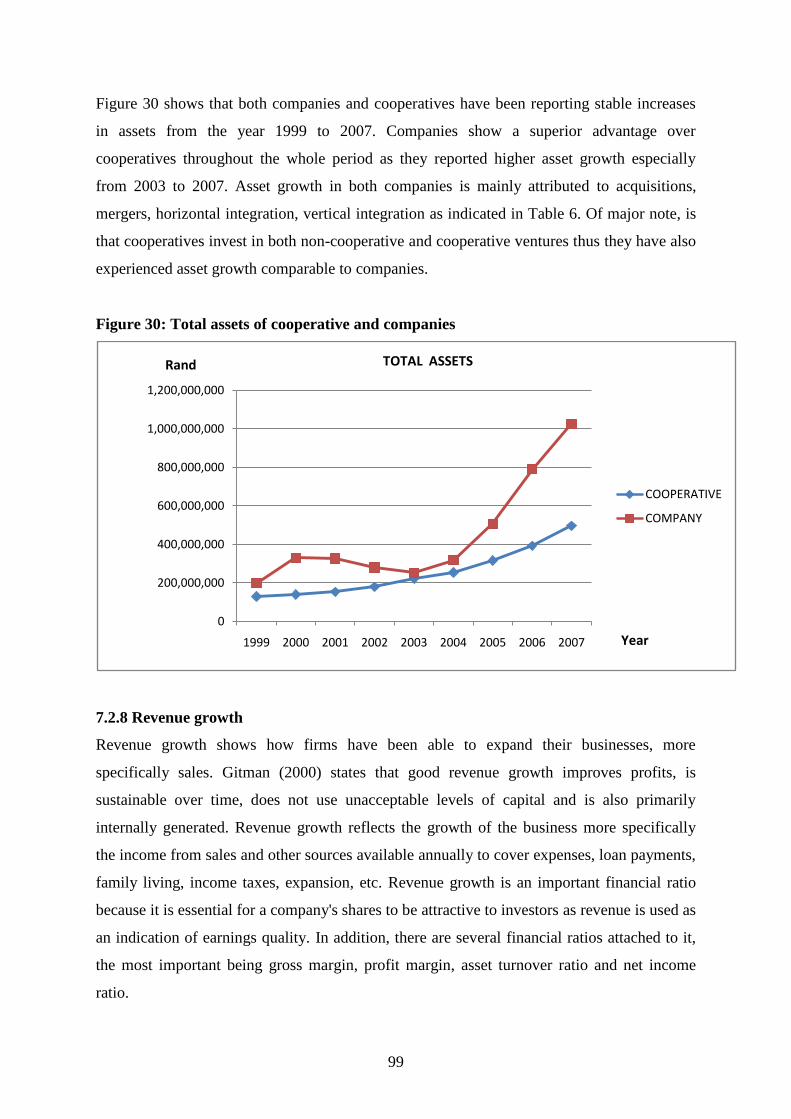
99
Figure 30 shows that both companies and cooperatives have been reporting stable increases
in assets from the year 1999 to 2007. Companies show a superior advantage over
cooperatives throughout the whole period as they reported higher asset growth especially
from 2003 to 2007. Asset growth in both companies is mainly attributed to acquisitions,
mergers, horizontal integration, vertical integration as indicated in Table 6. Of major note, is
that cooperatives invest in both non-cooperative and cooperative ventures thus they have also
experienced asset growth comparable to companies.
Figure 30: Total assets of cooperative and companies
7.2.8 Revenue growth
Revenue growth shows how firms have been able to expand their businesses, more
specifically sales. Gitman (2000) states that good revenue growth improves profits, is
sustainable over time, does not use unacceptable levels of capital and is also primarily
internally generated. Revenue growth reflects the growth of the business more specifically
the income from sales and other sources available annually to cover expenses, loan payments,
family living, income taxes, expansion, etc. Revenue growth is an important financial ratio
because it is essential for a company's shares to be attractive to investors as revenue is used as
an indication of earnings quality. In addition, there are several financial ratios attached to it,
the most important being gross margin, profit margin, asset turnover ratio and net income
ratio.
0
200,000,000
400,000,000
600,000,000
800,000,000
1,000,000,000
1,200,000,000
1999 2000 2001 2002 2003 2004 2005 2006 2007
COOPERATIVE
COMPANY
TOTAL ASSETSRand
Year
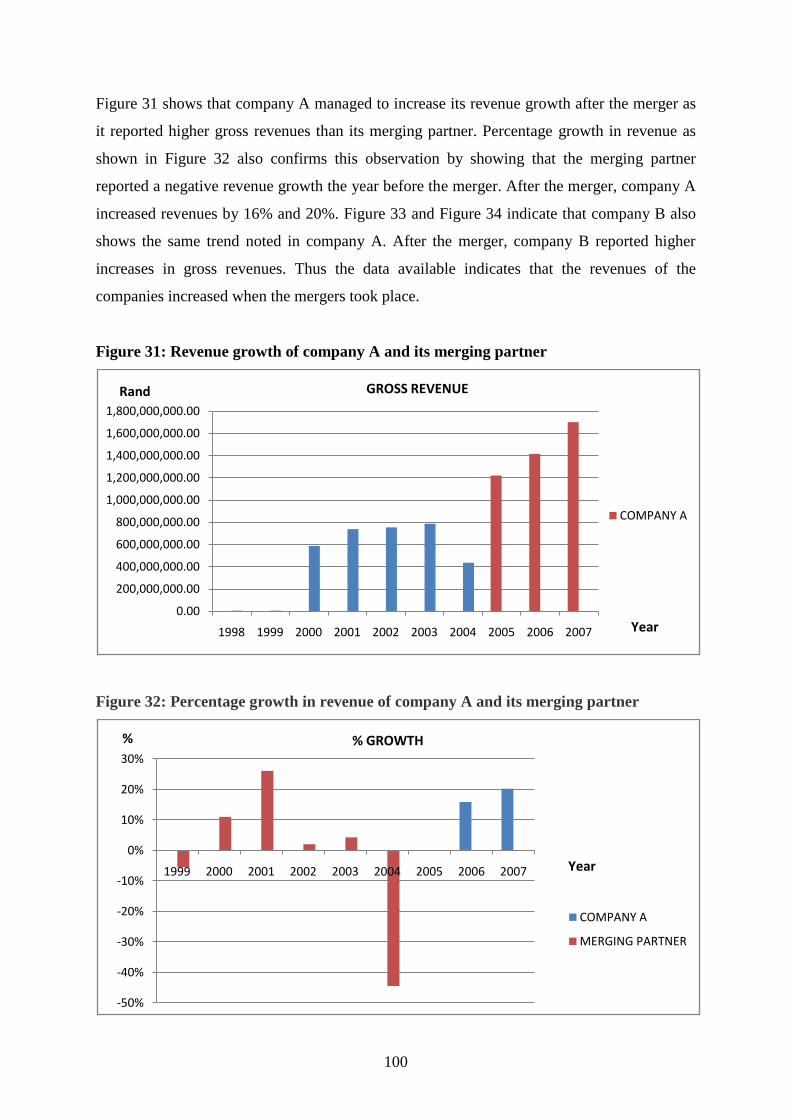
100
Figure 31 shows that company A managed to increase its revenue growth after the merger as
it reported higher gross revenues than its merging partner. Percentage growth in revenue as
shown in Figure 32 also confirms this observation by showing that the merging partner
reported a negative revenue growth the year before the merger. After the merger, company A
increased revenues by 16% and 20%. Figure 33 and Figure 34 indicate that company B also
shows the same trend noted in company A. After the merger, company B reported higher
increases in gross revenues. Thus the data available indicates that the revenues of the
companies increased when the mergers took place.
Figure 31: Revenue growth of company A and its merging partner
Figure 32: Percentage growth in revenue of company A and its merging partner
0.00
200,000,000.00
400,000,000.00
600,000,000.00
800,000,000.00
1,000,000,000.00
1,200,000,000.00
1,400,000,000.00
1,600,000,000.00
1,800,000,000.00
1998 1999 2000 2001 2002 2003 2004 2005 2006 2007
COMPANY A
GROSS REVENUERand
Year
-50%
-40%
-30%
-20%
-10%
0%
10%
20%
30%
1999 2000 2001 2002 2003 2004 2005 2006 2007
COMPANY A
MERGING PARTNER
% GROWTH%
Year

101
Figure 33: Revenue growth of company B and its merging partner
Figure 34: Percentage growth in revenue of company B and its merging partner
Figure 35 shows that through the whole period under review, cooperatives and companies
reported increasing revenues. Companies show wide fluctuations in revenue growth but
maintain significantly higher revenues than cooperatives from the year 1997 to 2007. On a
0.00
100,000,000.00
200,000,000.00
300,000,000.00
400,000,000.00
500,000,000.00
600,000,000.00
700,000,000.00
800,000,000.00
1997 1998 1999 2000 2001 2002 2003 2004 2005 2006 2007
GROSS REVENUE
Company B
Merging partner
Rand
Year
-50%
0%
50%
100%
150%
200%
250%
1998 1999 2000 2001 2002 2003 2004 2005 2006 2007
COMPANY B
MERGING PARTNER
% Growth%
Year

102
positive note though cooperatives show stable increases throughout the period under review.
Interestingly, both cooperatives and companies show revenue or profit from sales of assets
after a year or two of acquiring other firms. This prompts or suggests evidence of asset
stripping3. After a year or two from the purchase or acquisition of other businesses the
agribusinesses have recorded income from the sale of assets thus indicating that there is
prevalence of the purchase of companies in order to strip their assets and make a profit.
Figure 35: Revenue growth of cooperatives and companies
7.3 Economic value added
Figure 36 shows that after the merger, company A created value for the shareholders as
compared to one of its merging partner that actually destroyed value for the shareholders
investments (data for the other merging partner was unavailable). On the contrary, Figure 37
shows that after the merger and its formation, company B destroyed value for its shareholders
than its merging partner. Thus the data available was inconclusive as whether mergers
resulted in an overall improvement in shareholders‘ value, but confirms the observations that
are consistent with the other financial ratios that in most cases when mergers result from two
3 Asset stripping is the process of buying an undervalued company with the intent to sell off
its assets for a profit.
0
100,000,000
200,000,000
300,000,000
400,000,000
500,000,000
600,000,000
700,000,000
800,000,000
900,000,000
1,000,000,000
1999 2000 2001 2002 2003 2004 2005 2006 2007
cooperative
COMPANY
GROSS REVENUERand
Year
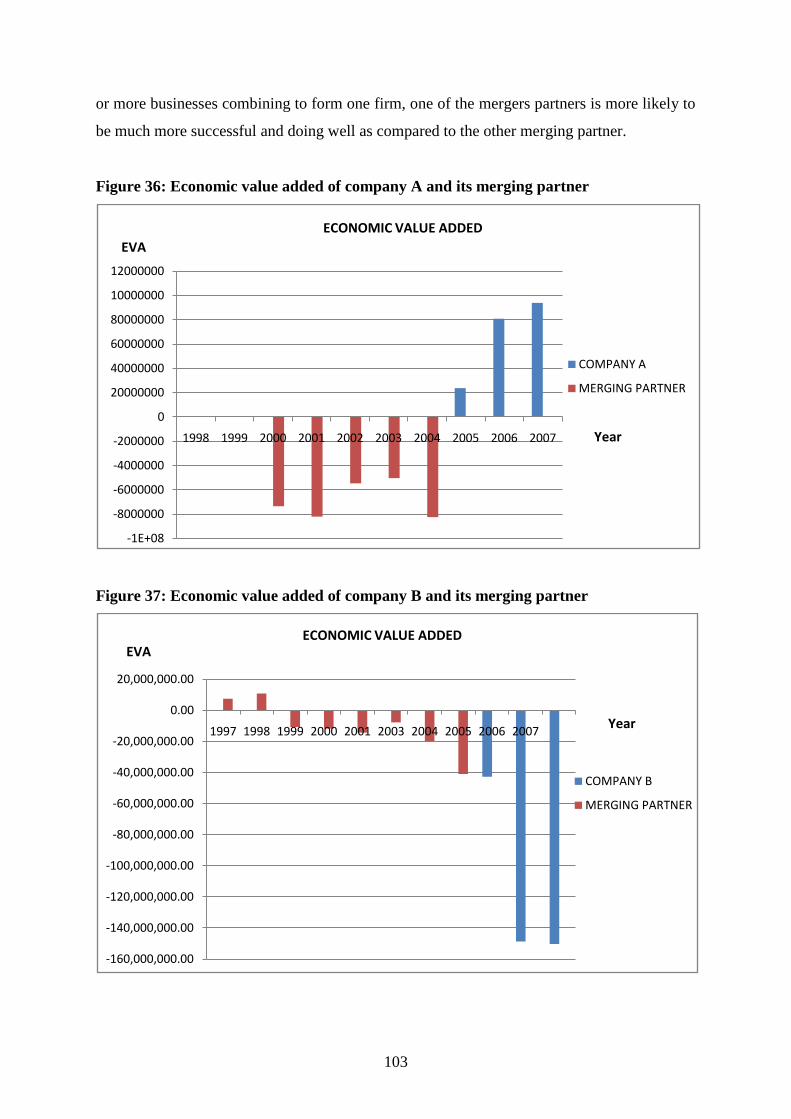
103
or more businesses combining to form one firm, one of the mergers partners is more likely to
be much more successful and doing well as compared to the other merging partner.
Figure 36: Economic value added of company A and its merging partner
Figure 37: Economic value added of company B and its merging partner
-1E+08
-8000000
-6000000
-4000000
-2000000
0
20000000
40000000
60000000
80000000
10000000
12000000
1998 1999 2000 2001 2002 2003 2004 2005 2006 2007
COMPANY A
MERGING PARTNER
ECONOMIC VALUE ADDED
EVA
Year
-160,000,000.00
-140,000,000.00
-120,000,000.00
-100,000,000.00
-80,000,000.00
-60,000,000.00
-40,000,000.00
-20,000,000.00
0.00
20,000,000.00
1997 1998 1999 2000 2001 2003 2004 2005 2006 2007
COMPANY B
MERGING PARTNER
ECONOMIC VALUE ADDEDEVA
Year
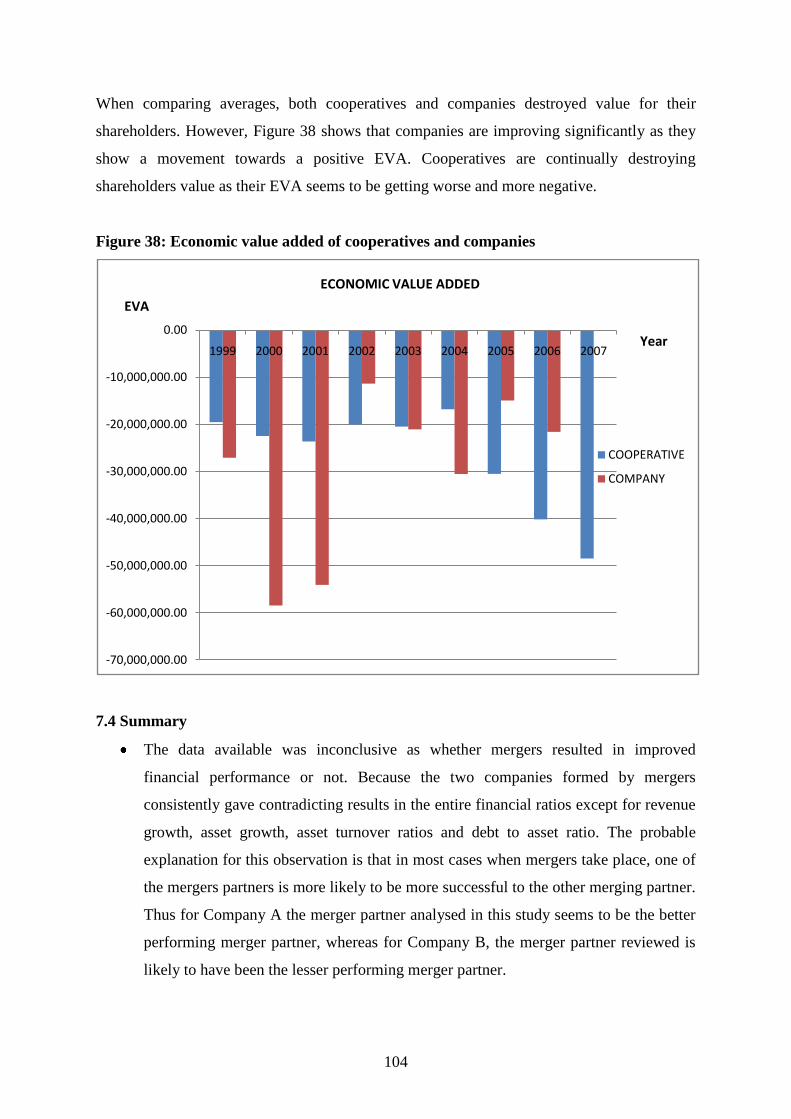
104
When comparing averages, both cooperatives and companies destroyed value for their
shareholders. However, Figure 38 shows that companies are improving significantly as they
show a movement towards a positive EVA. Cooperatives are continually destroying
shareholders value as their EVA seems to be getting worse and more negative.
Figure 38: Economic value added of cooperatives and companies
7.4 Summary
The data available was inconclusive as whether mergers resulted in improved
financial performance or not. Because the two companies formed by mergers
consistently gave contradicting results in the entire financial ratios except for revenue
growth, asset growth, asset turnover ratios and debt to asset ratio. The probable
explanation for this observation is that in most cases when mergers take place, one of
the mergers partners is more likely to be more successful to the other merging partner.
Thus for Company A the merger partner analysed in this study seems to be the better
performing merger partner, whereas for Company B, the merger partner reviewed is
likely to have been the lesser performing merger partner.
-70,000,000.00
-60,000,000.00
-50,000,000.00
-40,000,000.00
-30,000,000.00
-20,000,000.00
-10,000,000.00
0.00
1999 2000 2001 2002 2003 2004 2005 2006 2007
COOPERATIVE
COMPANY
ECONOMIC VALUE ADDED
Year
EVA

105
Results confirm that companies had a relatively higher profit margin than
cooperatives for most years except from 2003 to 2005 (albeit a small difference).
Cooperatives show that they have a higher ROA than companies from the year 2000
to 2006. Companies had a higher ROA for the years 1999 and 2007. Thus contrary to
expectations that companies will have a higher ROA due to their profit motive and the
problem of under investment in cooperatives. Evidence from the study shows that
cooperatives perform relatively better in terns of ROA (although the differences is
relatively small). However, the results show that while cooperatives initially had
higher ROA than companies, they have been losing this advantage from the year
2005.
There are fluctuations in as far as ROE between cooperatives and companies.
Cooperatives show dominance in performance from the years 2000, 2001, 2003, 2004
and 2005, whereas companies show a dominance or better performance in the years
1999, 2002 and from 2005 to 2007. Results on ROE also confirm that cooperatives
are beginning to decline in performance whereas companies show relatively higher
performance gains from 2005 to 2007.
The current ration of companies has been higher than that of companies throughout
the time period.
The debt to asset ratio of companies fluctuates around 40 to 80%, and is usually above
that of cooperatives except for the years 2003, 2004 and 2007.
Cooperatives had significantly lower asset turnover ratio than companies. Even
though cooperatives have been improving their asset turnover from the year 200 to
2004, they start to show a decreasing trend from the year 2005 to 2007. Whereas
companies have shown slight fluctuations and reported increasing trends in the past
two years.
Companies and cooperatives have been reporting stable increases in assets from the
year 1999 to 2007. Companies show a superior advantage over cooperatives as they
reported higher assets and higher growth especially from 2003 to 2007.
Cooperatives and companies reported increasing revenues. Companies show wide
fluctuations in revenue growth but maintain significantly higher revenues than
cooperatives from the year 1997 to 2007. On a positive note though is that
cooperatives show stable increases throughout the period under review.
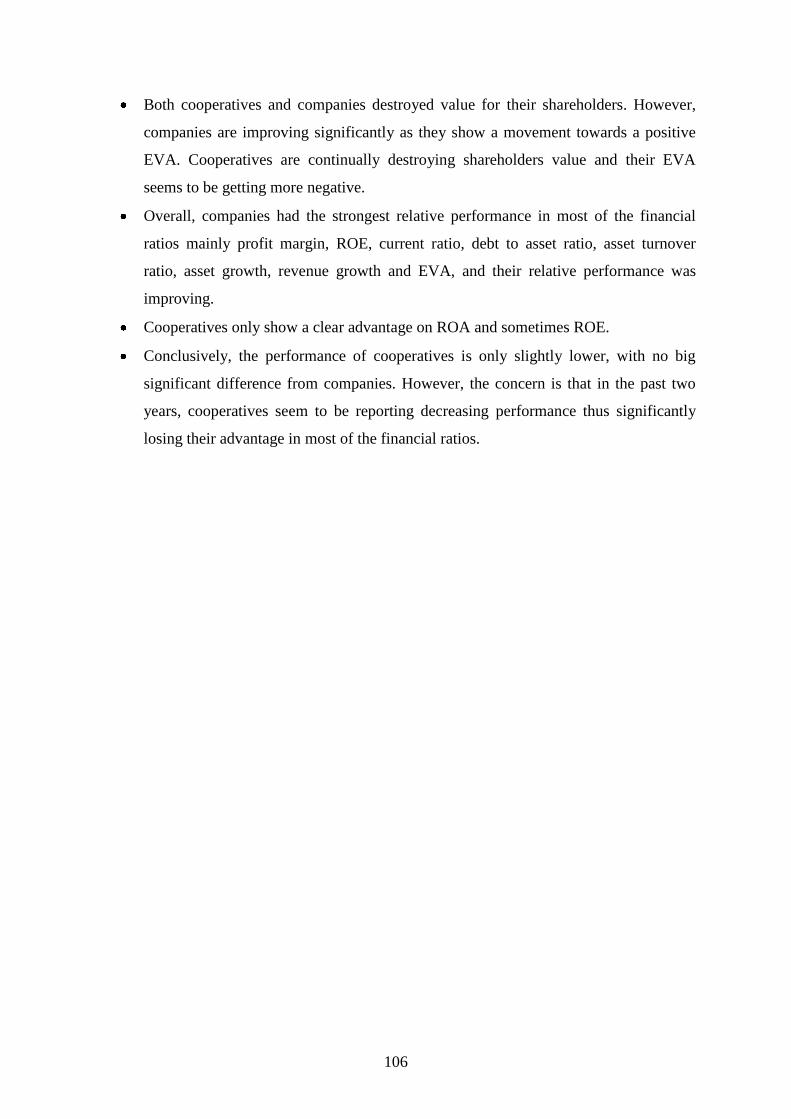
106
Both cooperatives and companies destroyed value for their shareholders. However,
companies are improving significantly as they show a movement towards a positive
EVA. Cooperatives are continually destroying shareholders value and their EVA
seems to be getting more negative.
Overall, companies had the strongest relative performance in most of the financial
ratios mainly profit margin, ROE, current ratio, debt to asset ratio, asset turnover
ratio, asset growth, revenue growth and EVA, and their relative performance was
improving.
Cooperatives only show a clear advantage on ROA and sometimes ROE.
Conclusively, the performance of cooperatives is only slightly lower, with no big
significant difference from companies. However, the concern is that in the past two
years, cooperatives seem to be reporting decreasing performance thus significantly
losing their advantage in most of the financial ratios.
107
CHAPTER EIGHT
SUMMARY, CONCLUSION AND RECOMMENDATIONS
8.1 Summary of the results
This study provided a holistic analysis of the implications of converting from a cooperative to
a company by analysing the comparative performance of cooperatives and companies. The
summary of the research questions and findings as are briefly stated below.
i. How has the conversion to companies affected performance? Do cooperatives that have
adopted the company business model perform better than cooperatives that never
converted?
Companies had the strongest relative performance in most of the financial ratios mainly
profit margin, ROE, current ratio, debt to asset ratio, asset turnover ratio, asset growth,
revenue growth and EVA. Cooperatives only show a clear advantage on ROA and in
some years ROE. Even though, the differences in performance are slightly higher in
favour of companies, in the past two years, cooperatives seem to be reporting decreasing
performance thus losing their advantage in most of the financial ratios analysed. Based
on the financial performance results, operating as a company or converting from a
cooperative to a company could result in slight increases in financial performance.
ii. Why have cooperatives converted? What are some of the external or internal reasons
and motives that prompted conversion?
The main reasons companies indicated for undergoing structural changes and
conversions are, (i) as a response to the deregulation of the industry, (ii) political
reasons, (iii) management pressure, (iv) seeking to expand the organization, (v) response
to the cooperatives act, (vi) relative merits of the company business model and (vii)
seeking to improve the competitiveness of the organization. Response to the
deregulation of the industry is cited as the major reason for converting, which is
consistent with the observation that most conversions occurred in 1998 after the
deregulation of markets and withdrawal of state support.
iii. Are cooperatives necessarily a less efficient organisational structure than the company
business model?

108
Companies show that they are much more efficient than companies. In addition, in the
past two years, cooperatives have been becoming even much more inefficient whereas
companies improved their efficiency in the past two years.
iv. Which challenges and opportunities were encountered during the process?
Because cooperatives are a different organisation from companies the first major
problem encountered during the conversion process was cited as the conflict of interests
between management and members. Most such conversions seem to have been initiated
by management. Although alternative organisational changes exists e.g. mergers,
acquisitions or takeovers, integration, joint venture, that can improve the
competitiveness of cooperatives, they do not fully address the property rights challenges
that cooperatives face. Thus conversions are the preferred solution to address the ill-
defined property rights structure of cooperative.
v. What are the implications of such a change to members in as far as services obtained,
shares, control, dividends and member‘s wealth is concerned?
When the cooperatives converted to companies, members were given an option to be
shareholders in the new companies and thus much of the control came as voting rights
based on their shareholding which varied depending on members individual`s wealth in
purchasing additional shares. Cooperatives distinguish between members and non
members as clients by offering discounts to their members, thus offering an incentive to
be a cooperative member, whereas companies do not distinguish between members and
non members as clients. Of major note is that both companies and cooperatives assisted
their member clients to enhance efficiency or profitability because it created value for
the firm. Converting to companies thus results in the loss of incentives offered by
cooperatives to its members, such a loss should be weighed against the gains from stock
returns in a company.
vi. How does the management reconcile the economic self interest of members versus the
investors, or the developmental imperative versus the economic viability of the
organisation?

109
A consistent observation in all the companies was that once cooperative members have
been admitted as shareholders in the company, the primary objective of the
organisation is changed to that of furthering all members interest as investors, thus
return on investments, dividends and profitability become of primary interest other
than furthering members interest as input suppliers or clients through incentives such
as discounts e.t.c. However, both companies and cooperatives assisted their member
clients to enhance their efficiency or profitability because it created value for the firm.
Thus there appears to be a balance by management to further the interest of members
as investors and members as clients even though investors (shareholders) are the
ultimate primary focus of companies. As such the economic viability of converted
cooperatives seems to be of more importance than its development imperative which is
only furthered to a limited extent through corporate social responsibility.
vii. What are the implications of such a change to investors in as far as shares, dividends
and return to investments is concerned?
Both cooperatives and companies destroyed value for their shareholders. However,
companies are improving significantly as they show a movement towards a positive
EVA. Cooperatives are continually destroying shareholders value as their EVA seems to
be getting more negative.
viii. How has the organisation adapted to the needs of an advancing industrial society?
Results show that even though companies are more dynamic than cooperatives,
cooperatives compare relatively well in all aspects except for their property rights which
is mainly a direct result of the Cooperatives Act (Act 14 of 2005) which affects
cooperatives not companies. Thus cooperatives can be as dynamic as companies or even
better if the Act is revised and consideration is made for commercial cooperatives.
ix. How do converted cooperatives differ to those that never converted in as far as
organisation culture, management culture, style, competence and incentives?
Contrary to prior expectations, cooperatives show that they are also embracing change
because they have adopted new organisation strategies, structures and culture similar to
that of companies. Cooperative management also shows a great deal of dynamism that
is closely comparable to companies. Cooperatives scored a dynamism score of 62.33
compared to 83.75 for companies.

110
8.2 Conclusion of the study
The study indicates that cooperatives compare relatively well to companies although there
have potential to do even much better if their property rights structure is addressed. The main
shortcomings of cooperative property rights were that of not allowing external investors into
the cooperatives and the one member one vote principle for primary cooperatives or the 15%
cap for secondary cooperatives. Cooperatives point at the difficulty to adhere to the
Cooperatives Act (Act 14 of 2005) and its limitations to adopting modern cooperative trends.
Such limitations have left commercial cooperatives with the choice of converting to
companies as the ultimate solution to address their property rights structure. As a result, if
amendments are not made to the cooperative act, there is an expectation of a continual
decrease in the number of commercial cooperatives, with the rise of development or
emerging cooperatives which are heavily supported by the new cooperative act and other
supporting policies.
Because cooperatives compare relatively well to companies then there is evidence to suggest
that there is need to curb such conversions for various reasons. Firstly, it is widely
acknowledged that in order for primary agriculture and farmers to increase their wealth and
competitiveness they have to at least own a part of the supply chain. Even though both
cooperative and companies offer such an opportunity, cooperatives are more member
oriented and thus would serve primary agriculture and farmers better than companies that are
investor oriented. Companies are expected to appeal because they offer a better investment
return than cooperatives, but as shown in the study if cooperatives can compare relatively
well in terms of financial performance, then members seeking to further their interest other
than a higher return in investment could opt for a cooperative than a company.
8.3 Recommendations and areas for further study
Lessons on cooperative policy and structures can be drawn from other countries mainly the
USA and New Zealand. Lobbying for the change of the Cooperatives Act (Act 14 of 2005) in
order to accommodate commercial cooperatives seems farfetched given the length of time it
took for the Act to be drawn up and passed in parliament. In addition, such a task becomes
more challenging because the Act appears to be in line with the political and economic
pressure to address the problem of inequity. Thus, given a debate on commercial versus
developing cooperatives at this stage in South Africa, developing cooperatives will always
win. Therefore, not many changes are bound to be made to the Cooperatives Act (Act 14 of

111
2005). Alternative options exist, commercial cooperatives or policy makers can push to
follow the case of New Zealand where a new type of organisation called the cooperative
company has been introduced. Such an organisation in South Africa can thus be introduced
and governed by the Companies Act instead of the cooperative Act which is more
development oriented. This would make cooperatives much more dynamic and be able to
address some of the constraints and challenges they face in meeting the requirements of the
Cooperatives Act (Act 14 of 2005).
There are various research areas that need to be done in South Africa on cooperatives. Much
of the research is not published and is mainly done for private purposes such as consultancy
work. As such, it is difficult to give trace on what has been done and hasn‘t been done with
regard to cooperative research based on publications from the main journals. However, the
following issues are recommended for further research.
The weakness of case studies is that they cannot be generalised and used to provide a
conclusion for the whole country. Thus, more case studies need to be carried out to
validate and compare the findings of this study.
Given enough data, specific studies on the implications of mergers and other
structural changes such as integration, acquisitions need to be done.
There are several comparative factors between cooperatives and companies that need
to be investigated. For example, investment in infrastructure such as office buildings,
processing facilities, the psychological behaviour and state of their employees e.t.c.
Some of these factors are beyond the discipline of agriculture economics but do have
an impact on the relative performance of firms.
Finally, there is need to investigate the history of cooperative policy in South Africa,
by asking questions such as why, by whom and how cooperative policy is made.
Answers to these questions would be important in showing the influences, impacts
and future direction of cooperatives and cooperative policy in South Africa.
112
REFERENCES
AGRITV. (2003). Are large agricultural co-operatives a dying species? Online:
http://www.agritv.co.za/co_vs_corp.html. Accessed on 15 August 2006.
Agricultural Business Chamber. (2008). DTI Workshop on Co-operatives Amendment Bill.
Newsletter, No 0208, 11 February 2008.
ANC. (1994). Nelson Mandela‘s address to the people of Cape Town, grand parade, on the
occasion of his inauguration as state president. Online:
http://www.anc.org.za/ancdocs/history/mandela/1994/inaugct.html. Accessed on 10 March
2008.
Albaek, S & Schultz, C. (1998). On the relative advantage of cooperatives. Economics
Letters, 59:397-401.
Alchian, A.A & Demsetz, H. (1972). Production, Information Costs, and Economic
Organization. American Economic Review, 62(1972):77-95.
Altshul, G. (2002). Armenia (Ararat, Artshat, Arapan, Vardeniss and Talin) consumer
cooperatives, and Russia (Klinski and Stupinski) consumer cooperatives. In Couture et al, op
cit, 5(12): 19-26.
Babb, E.M & Boynton, R.D. (1981). Comparative Performance of Cooperative and Private
Cheese Plants in Wisconsin. North Central Journal of Agricultural Economics, 3(2): 157-
164.
Banerjee, A., Mookherjee, D., Munshi, K. & Ray, D. (2001). Inequality, control rights, and
rent seeking: sugar cooperatives in Maharashtra. The Journal of Political Economy, 109(1):
138-190.
Bansal, P & Roth, K. (2000). Why companies go green: A model of ecological
responsiveness. Academy of Management Journal, 43(4): 717-736.

113
Barraket, J. (2001). Building Sustainable Communities. Co-operative Solution to Rural
Renewal Report by ACCORD prepared for the NSW Fair Trading Advisory Council.
Barton, D.G. (1989). What is a Cooperative? In: Cobia, D.W. (Ed), Cooperatives in
Agriculture. Prentice Hall, New Jersey, 1-21.
Bau, M. (2002). Cooperative Care: Submission to Harvard Innovations in American
Government Award, USDA Rural Development.
Benfari, R & Knox, J. (1991). Understanding your management style: Beyond the Myers-
Briggs Type indicators. Lexington Books, New York.
Birchall, J. (2003). Rediscovering the cooperative advantage Poverty reduction through self-
help. Cooperative Branch International Labour Office, Geneva.
Blair, M.M. (1995). Ownership and control: Rethinking corporate governance for the twenty
first century. The Brooking Institution, Washington USA.
Boehlje, M., Dobbins, C., Miller, A., Miller, D & Barnard, F. (1999). Measuring &
Analyzing Farm Financial Performance. Department of Agricultural Economics, Purdue
University. Online: http://www.agecon.purdue.edu/extensio/finance/EC-712total.pdf.
Bottger, R. (1999). Economic value added (EVA): The essence to creating real wealth?
Unpublished Memo, Department of Economics, University of Stellenbosch.
Boyle, G.E. (2004). The economic efficiency of Irish Dairy Marketing Co-operatives.
Agribusiness, 20(2): 143-153.
Cabo, P & Rebelo, J. (2006). Governance control mechanisms in Portuguese agricultural
credit cooperatives. Contributed paper prepared for presentation at the International
Association of Agricultural Economists Conference, Gold Coast, Australia, August 12-18,
2006.

114
Chaddad, F.R & Cook, M.L. (2004). Understanding new cooperative models: an ownership-
control rights typology. Review of Agricultural Economics, 23: 348-360.
Chaddad, F.R., Cook, M.L & Heckelei, T. (2005). Testing for the presence of financial
constraints in US Agricultural Cooperatives: An Investment behaviour approach. Journal of
Agricultural Economics, 56(3): 385 – 397.
Chan, K. & Robb, A. (1998). The comparative performance of a co-operative and an investor
owned firm in the New Zealand wholesale grocery and distribution industry.
Christine, K.U. (2006). Management's role in shaping organizational culture. Journal of
Nursing Management, 14: 188.
Coase, R. (1937). The nature of the firm. Economica, 4(1937): 386 – 405.
Cobia, W.D & Brewer, T.A. (1989). Equity and debt. In Cobia, W.D. (Ed), Cooperatives in
agriculture (pp 243–266). Englewood Cliffs, NJ: Prentice-Hall.
Collins. R.A. (1991a). The Conversion of Cooperatives to Publicly Held Corporations: A
Financial Analysis of Limited Evidence. Western Journal of Agricultural Economics, 16(2):
326-330.
Collins, R.A. (1991b). Analysis of Economic Motives for Cooperative Conversions to
Corporations. University of California: Centre for Cooperatives.
Competition Commission. (2006). The South African agricultural industry in context. Online:
http://www.compcom.co.za/policyresearch/policyDocs/Agric_cops.doc. Accessed on 10
December 2007.
Conger, J.A. (1997). How generational shifts will transform organisational life. In:
Hesselbein, F., Goldsmih, M & Beckhard, R (Ed), The organisation of the future. Drucker
foundation, Jossey-bass Publishers, San Francisco.
115
Cook, ML & Chaddad, F. (2000). Agro industrialisation of the global agrifood economy:
Bridging development economics and agribusiness research. Agricultural Economics, 23:
207-18.
Cook M.L & Illiopoulos, C. (2000). Ill-defined property rights in collective action: The case
of US agricultural cooperatives. In: Mernard, C (Ed), Institutions, Contracts and
organisations: Perspectives from New Institutional Economics.
Cook, M.L. (1995). The future of U.S. agricultural cooperatives: a neo-institutional approach.
American Journal of Agricultural Economics, 77(5), 1153-1159.
Cote, D., Fulton, M & Gibblings, J. (2000). Canadian agricultural cooperatives: Critical
success factors in the 21st century. Report prepared for the Canadian Cooperative association,
October 2000.
Darren, H & Herndon C.W. (2000) Mergers, Acquisitions, Joint Ventures and Strategic
Alliances in Agricultural Cooperatives. Research Report 2000-009, Dept. of Agriculture
Economics. Mississippi State University.
Darren, H & Herndon C.W. (2002) Factors Influencing Probability and Participation in
Merger and Partnership Activity in Agricultural Cooperatives. Agribusiness, 18 (2): 231 -246.
Davidsson, P. (2005). Interpreting Performance in Small Business Research. Proceedings of
the Strathclyde Entrepreneurship Research Workshop, Leeds, UK.
Delgado, C. (1999). Sources of Growth in Smallholder Agriculture in Sub-Saharan Africa:
The Role of Vertical Integration of Smallholders with Processors and Marketers of High
Value Added Items. Agrekon (Special Issue), 38: 165-189.
Demsetz, H. (1997). The Economics of the Business firm: Seven Critical Commentaries.
Cambridge University Press, UK.
Demsetz (1988). Ownership Control and the firm. The organisation of economic activity (Vol
1). Blackwell publishing, Oxford.

116
Demsetz, H. (1983). The structure of ownership and the theory of the firm. Journal of Law
and Economics, 26(1983): 375 – 390.
Demsetz, H. (1967). Toward a Theory of Property Rights. American Economic Review,
Papers and Proceedings, 57: 347-359.
Doyer, O.T., D‘Haese, M.F.C., Kirsten, J.F & Van Rooyen, C.J. (2007). Strategic focus areas
and emerging trade arrangements in the South African agricultural industry since the demise
of the marketing boards. Agrekon, 46(4).
Doucouliagos, H & Hone, P. (2000). The efficiency if the Australian dairy processing
industry. The Australian Journal of Agricultural and Resource Economics, 44(3): 423-438.
DTI. (2008). Co-operatives Act 2005, Act No 14, 2005. Online: http://www.thedti.gov.za/Co-
operative/act142005.pdf. Accessed on 16 April 2008.
DTI. (2007). The BEE Codes of Good Practice. Online:
http://www.thedti.gov.za/bee/InterpretiveGuide28june07doc.pdf. Accessed on 17 June 2008.
Eisenhardt, K.M. (1989). Making fast strategic decisions in high-velocity environments.
Academy of Management Journal, 32 (3): 543– 576.
Ensley, M.D., Pearce, C.L & Hmieleski, K.M. (2006). The moderating effect of
environmental dynamism on the relationship between entrepreneur leadership behaviour and
new venture performance. Journal of Business Venturing, 21 (2006): 243–263.
Evans, L & Meade, R. (2005). The role and significance of Cooperatives in New Zealand
Agriculture: A Comparative Institutional Analysis. Report Prepared for the New Zealand
Ministry of Agriculture and Forestry.
Fama, E & Jensen, M. (1980). Organisational forms and investment decisions. Journal of
financial economics, 14(1985): 101 – 119.
117
Foltz, J.C., Araci, H & Kargin, M. (2002). Mergers, acquisitions, joint ventures, and
consolidations in agribusiness: An example of acquisition (acquisition of continental grain by
Cargill).
Francesconi, G.N & Ruben, R. (2007). Impacts of Collective Action on Smallholders‘
Commercialisation: Evidence from Dairy in Ethiopia. Paper prepared for presentation at the I
Mediterranean Conference of Agro-Food Social Scientists. 103rd EAAE Seminar ‗Adding
Value to the Agro-Food Supply Chain in the Future Euro Mediterranean Space‘. Barcelona,
Spain, April 23rd - 25th, 2007.
Francois, J.F., Roehl, T & Hagen, J.M. (2002). Are Joint Ventures with local firms as
efficient way to enter a culturally different market? The case of Japanese entry into the
United States. Department of Applied Economics and Management Working paper, Cornell
University, Ithaca, New York.
Fulton, M.E. (1995). The Future of Canadian Agricultural Cooperatives: A Property Rights
Approach. American Journal of Agricultural Economics, 77: 1144-1152.
Fulton, M & Anderson, K. (2001). Value-Added Enterprises in the Rural Community. In
Merret, C.D & Walzer, N. (Eds) A Cooperative Approach to Local Economic Development.
Quorum Books, Westport, CT, 129-147.
Fulton, M & Gibblings, J. (2000). Response and adaptation: Canadian cooperatives in the 21st
century. In: Cote, D., Fulton, M & Gibblings, J (Ed). Canadian agricultural cooperatives:
Critical success factors in the 21st century. Report prepared for the Canadian Cooperative
association.
Furubotn, E.G & Richter, R. (2000). Institutions and Economic theory: The contribution of
the New Institutional Economics. University of Michigan Press, USA.
Friedman, M. (1970). The Social Responsibility of Business is to Increase its Profits. Online:
http://www.colorado.edu/studentgroups/libertarians/issues/friedman-soc-resp-business.html.
Accessed on 7 August 2008.

118
Gertler, M. (2001). Rural Co-operatives and Sustainable Development. Centre for the Study
of Co-operatives, University of Saskatchewan. Online: Http://www.iira.org/pubs/. Accessed
on 12 April 2008.
Geyser, J.M & Liebenberg, I.E. (2003). Creating a new evaluation tool for South African
cooperatives. Agrekon, 42(2): 106- 115.
Gertler, M. (2001) Rural Co-operatives and Sustainable Development. Centre for the Study
of Co-operatives, University of Saskatchewan. Online: Http://www.iira.org/pubs/. Accessed
on 12 April 2008.
Ginder, R.G & Deiter, R.E. (1989). Managerial skills, functions and participants. In Cobia,
W.D (Ed), Cooperatives in agriculture (pp 308–324). Englewood Cliffs, NJ: Prentice-Hall+
Gitman, L.K. (2000). Principles of managerial finance (9th
edition). Addison Wesley
publishing company, USA.
Glasbergen, P. (2000). The Environmental Cooperative: Self-governance in Sustainable Rural
Development. Journal of Environment & Development. 9(3), 240- 259.
Godo, Y. (2006). Financial Liberalization and Japan‘s Agricultural Cooperatives. Poster
paper prepared for presentation at the International Association of Agricultural Economists
Conference, Gold Coast, Australia August 12-18, 2006.
Gregor, L. (2003). Vertical integration as a factor of competitiveness of agriculture.
Agricultural Economics – Czech, 49(11): 520–525.
Groenewald, J.A. (2000). The Agricultural Marketing Act: A Post-Mortem. The South
African Journal of Economics, 68: 364-402.
Hagerman, A.D. (2005). Practices, perceptions and performance: a Texas cooperative study.
Unpublished MSc Thesis, Graduate Studies of Texas A&M University.

119
Hall, J.H
& Geyser, J.M. (2004). Are wine co-operatives creating value? Agrekon, 43 (3):
331–346.
Hambrick, D.C & Mason, P.A. (1984). Upper echelons: The organization as a reflection of its
top managers. Academy of Management Review, 9: 193– 206.
Hardesty, S.D. (2005). The Bottom Line on the Conversion of Diamond Walnut Growers.
University of California, agriculture and resource economics update, 8 (6), July/August 2005.
Hardesty, S & Salgia, V. (2004). Comparative financial performance of agricultural
cooperatives and investor-owned firms. Paper presented at NCR-194 Research on
Cooperatives Annual Meeting, November 2-3, 2004, Kansas City, Missouri.
Hart, O. (1989). An Economists perspective on the theory of the firm. Columbia law review,
1757 (1989).
Harte, L. N. (1995). Creeping Privatization of Irish Cooperatives: A Transactional Cost
Explanation. Paper presented at EIAM Conference: Institutional Changes in the Globalized
Food Sector. Brussels. April 1995.
Harte, N.L. (1997). Creeping privatisation of Irish cooperatives: A transaction cost
explanation. In Nilsson, J & Van Dijk G (Eds). Strategies and structures in the agro-food
industries.
Harvey, S.J & Sykuta, M.E. (2005). Property Right and Organizational Characteristics of
Producer owned Firms and Organizational Trust. Annals of Public and Cooperative
Economics, 76(4): 545.
Heit, J. D. (2007). Organizational Choice and Behaviour: A Framework for Analyzing
Decision-making in Co-operative Organizations. Unpublished Msc thesis, University of
Saskatchewan.
Hendrikse, G.W.J & C.P. Veerman. (2001a). Marketing Cooperatives: An Incomplete
Contracting Perspective. Journal of Agricultural Economics, 52(1): 53 – 64.
120
Hendrikse, G.W.J & C.P. Veerman. (2001b). Marketing Cooperatives and Financial
structure: A Transaction Cost Economics Analysis. Agricultural Economics, 26(3): 205 –
216.
Henehan, B.M. (2002). The Decision to Merge: A Case Study of U.S. Dairy Cooperatives.
Department of Applied Economics and Management Working Paper, 2002-34, Cornell
University, Ithaca, New York.
Henehan, B.M & Anderson, B.L (2001). Considering cooperation: a guide for new
cooperative development. Department of Applied Economics and Management Working
Paper, Cornell University, Ithaca, New York.
Henehan, B.M & Anderson, B.L. (1994). Decision making in membership organizations: A
study of fourteen U.S cooperatives. A.R.M.E Research Bulletin 94 (5) Cornell University
Ithaca, New York.
Henehan, B.M & Anderson, B.L. (1989). Farmers Weigh Cooperatives against Private Firms.
Department of Applied Economics and Management Working Paper, Cornell University,
Ithaca, New York.
Heykoop, J. (2003). Merger and Antitrust Issues in Agriculture: Statutes and Agencies. CRS
Report for Congress. Online: http://www.nationalaglawcenter.org/assets/crs/RS20562.pdf.
Accessed on 20 March 2008.
Hind, A.M. (1999). Cooperative Performance: Is there a Dilemma? Journal of Cooperatives.
Hind, A.M. (1997). The Changing Values of the Cooperate and Its Business Focus. American
Journal of Agricultural Economics. 79, 1077-1082.
Hind, A.M. (1994). Cooperatives—Underperformers by nature? An exploratory analysis of
cooperative and non-cooperative companies in the agribusiness sector. Journal of
Agricultural Economics, 45(2): 213–219.

121
Hudson, D. & Herndon, C.W. (2002). Factors influencing probability and frequency of
participation in merger and partnership activity in agricultural cooperatives. Agribusiness,
18(2), 231-246.
Holloway, G., Nicholson, C., Delgado, C., Staal, S & Ehui, S. (2000). Agro industrialization
through institutional innovation: Transaction costs, cooperatives and milk-market
development in the east-African highlands. Agricultural Economics, 23(3): 279-288.
Homburg, C., Krohmer, H & Workman, J.P. (1999). Strategic consensus and performance:
the role of strategy type and market-related dynamism. Strategic Management Journal, 20:
339–357.
ICA. (2008). The Present Application of the Rochdale Principles of Co-operation (1937).
Online: http://www.ica.coop/coop/1937-02.html. Accessed on 27 December 2007.
Jansen, C. (1998). South African Marine Corporation Limited: Using economic value added
(EVAtm) for capital project evaluation. University of Cape Town, Graduate School of
Business, South Africa.
Jensen, M.C & Meckling, W.H. (1976). Theory of the Firm: Managerial Behaviour, Agency
Costs, and Capital Structure. Journal of Financial Economics. 3 (October 1976): 305-60.
Jensen, M.C & Meckling, W.H. (1974). The Theory of the Firm: Managerial Behaviour,
Agency Costs and Ownership Structure. Journal of Financial Economics, 3(1974):305-60.
Jorgensen, N. (2005). Leaving home? Reasons vary for co-op conversions; critics remain
wary. Rural Cooperatives, January/February 2005: 8 – 11.
Karaan, A.S.M. (2004). An Institutional Economics approach to agribusiness in development:
South African Case studies. Unpublished PhD dissertation, University of Stellenbosch,
Stellenbosch.
122
Kirsten, J & Sartorius K. (2002). Linking agribusiness and small-scale farmers in developing
countries: Is there a new role for contract farming? Development Southern Africa 19(4):503-
529.
Karlson, D. (2005). Organizational models in U.S. agricultural cooperatives. In: Knott, J.H
(Ed), Public and Private Management: Cooperative Effort and Principal-Agent Relationships.
Journal of Public Administration Research and Theory, 3(1): 93-119.
Karantininis K & Zago, A. (2001). Endogenous membership in mixed duopsonies. American
Journal of Agricultural Economics, 83:1266-1272.
Knight, F. (1957). Risk, Uncertainty and Profit. Kelley and Millman Publishers, New York.
Kyriakopoulos. K., Meulenberg, M & Nilsson, J. (2004). The Impact of Cooperative
Structure and Firm Culture on Market Orientation and Performance. Agribusiness, 20 (4):
379–396.
Kramer, J.R & Pushner, G. (1997). An empirical analysis of economic value added as proxy
of market value added. Financial Practice and Education, 7: 41–49.
Krivokapic-Skoko, B. (2002). The Concept and Classifications of Agricultural Co-operatives.
ACCORD Paper No. 8.
Kruger, K.. L. (2001). The challenges of the fruit supply chain following the deregulation of
the South African fruit industry in 1997. Unpublished MSc thesis, Stellenbosch University,
South Africa.
Leach, E. (2003). The entrepreneurship dynamic: origins of entrepreneurship and the
evolution of industries. Canadian Journal of Administrative Sciences, 20 (1), 87–98.
Leathers, H.D. (2006). Are Cooperatives Efficient When Membership Is Voluntary? Journal
of Agricultural and Resource Economics, 3 1 (3):667-676.

123
Lerman, Z & Parliament, C. (1991). Financing of growth in agricultural cooperatives.
University of Minnesota Department of Applied Economics Staff Paper Series, 91-33.
Lerman, Z & Parliament, C. (1990). Comparative performance of cooperatives and investor
owned firms in US food industries. Agribusiness, 6(6), 527-540.
Lerman, Z & Parliament, C. (1989). Industry and size effects in agricultural cooperatives.
University of Minnesota Staff Paper, 89-40.
Li, M & Simerly, R.L., (1998). The moderating effect of environmental dynamism on the
ownership and performance relationship. Strategic Management Journal, 19: 169–179.
Lloyd, P. (1996). A study of the relationship between changes in share price and
contemporaneous changes in economic value added and other corporate performance
measures. University of Cape Town, Graduate School of Business, South Africa.
Lyne, M & Collins, R. (2007). South Africa‘s New Co-operatives Act: A Missed Opportunity
for Small Farmers and Land Reform Beneficiaries. Unpublished National Research
Foundation (NRF) paper, South Africa.
Maharjan, K.L & Fradejas, C, C. (2006). Role of Cooperative in Improving Accessibility to
Production Resources and Household Economy of Backyard Pig Raisers in Batangas,
Philippines. Poster paper prepared for presentation at the International Association of
Agricultural Economics Conference, Gold Coast, Australia, August 12-18, 2006.
Manne. H. (1965). Mergers and the Market for Corporate Control. Journal of Political
Economy, 73: 110-120.
Mann, F.C. (1965). Toward an understanding of the leadership role in formal organization.
In: Dubin, R., Homans, G.C., Mann, F.C., Miller, D.C. (Eds), Leadership and Productivity.
Chandler Publishing, San Francisco, CA, 68-103.
124
McKee, G.J. (2006). The Development, Operation, and Dissolution of a Value-added
Cooperative: United Spring Wheat Processors. Agribusiness & Applied Economics Report
No. 594 September 2006.
Merlo, C. (2005). Flying the coop Why members leave co-ops and ways to prevent it. Rural
Cooperatives, January/February 2005: 4 – 7.
Milgrom, P & Roberts, J. (1990). Bargaining costs, influence costs and the organisation of
economic activity. In: Putterman, L and Kroszner, R.S. (1996). The Economic nature of the
firm. (2nd
ed). Cambridge University press, Cambridge. Pp
Moeller, D.R. (2003). The problem of agricultural concentration: the case of the Tyson-IBP
merger. Drake Journal of Agricultural Law, Vol. 8.
Mooney, P & Gray, T.W. (2002). Cooperative Conversion and Restructuring in Theory and
Practice. Research Report 185, January 2002.
Mpahlwa, M. (2005). Untitled keynote address by the South African Minister of Trade and
Industry, National Co-operatives Conference, 14-15 March, 2005, Benoni [online]. Accessed
on 18 September 2006 at:
http://www.sarpn.org.za/documents/d0001107/Mpahlwa_March2005.pdf. Accessed on 25
March 2008.
Münkner, H. (2001). Best Practice: Innovative approaches to cooperative solutions of
housing problems of the poor. ICA Housing Cooperatives Habitat II plus 5, Marburg Consult,
Marburg, 2001.
Munkner, H & Shrestha, M. (1999). Strengthening the development of ―modern‖
cooperatives in Nepal. In: World of Cooperative Enterprise, 1999. Oxford Plunkett
Foundation, (1999).
Murray, C. (2006). Social Capital and Cooperation in Central and Eastern Europe toward an
Analytical Framework. Poster paper prepared for presentation at the International Association
of Agricultural Economists Conference, Gold Coast, Australia, August 12-18, 2006.

125
Nickson, A. (2000). Organizational structure and performance in urban water supply: The
case of Saguapac Cooperative in Santa Cruz, Bolivia, Birmingham University International
Development Department, Birmingham.
O‘Byrne, S.F. (1996). EVA and market value. Journal of Applied Corporate Finance,
9(1):116–125.
O‘Connor, J & Thompson, G. (2001). International Trends in the Structure of Agricultural
Cooperatives A report for the Rural Industries Research and Development Corporation.
RIRDC Publication No 01/06.
O‘Dell, C. (1993). Benchmarking: America looks to the customer and best practices,
Continuous Journey, December 1992/January 1993, pp.6-7.
Olson, M. (1965). The logic of collective action. Harvard University press.
Orlitzky, M., Schmidt, F.L & Rynes, S.L. (2003). Corporate Social and Financial
Performance: A Meta-analysis. Organization Studies, 24(3): 403–441.
Ortmann, G.F & King, R.P. (2007a). Small-scale farmers in South Africa: can agricultural
cooperatives facilitate access to input and product markets? Agrekon, 46(2): 219 – 244.
Ortmann, G.F & King, R.P. (2007b). Agricultural Cooperatives I: History, Theory and
Problems. Agrekon, 46(1): 40 – 68.
Ortmann, G.F. (2005). Promoting the competitiveness of South African agriculture in a
dynamic economic and political environment: F.R. Tomlinson Memorial Lecture. Agrekon,
44 (3): 286 - 320.
Ortmann, G.F. (2002). The role of supply chains in promoting competitiveness. In: Van
Rooyen, C.J., Doyer, O.T., Boystyn. F & Haese, L.D (Ed), Agribusiness: A source book for
agribusiness training. University of Pretoria, Pretoria: 127 – 145.
126
Ortmann, G.F. (2001). Industrialisation of Agriculture and The Role of Supply Chains in
Promoting Competitiveness. Agrekon, 40(4).
Patel, S. (2001). Insurance and Poverty Alleviation. ICMIF, Altrincham.
Parnell, E. (2001). The Role of Cooperatives and other Self-help Groups in Crisis Resolution
and Socio-economic Recovery, ILO Cooperative Branch and IFP/CRISIS, Geneva 2001.
Parnell, E. (2000). New Mutualism Helping Self-help: cooperative action for international
development – towards a new strategy framework, London Cooperative Party.
Parliament, C., Lerman, Z & Fulton, J. (1990). Performance of cooperatives and investor
owned firms in the dairy industry. Journal of Agricultural Cooperation, 5: 1-16.
Parliament, C & Taitt, J. (1989). Mergers, consolidations, acquisitions: Effect on
performance of agricultural cooperatives. University of Minnesota Staff Paper, 89-37.
Pearson, G.D. (1998). An analysis of the explanatory power of economic value added and
refined economic value added for share returns in the mining sector. University of Cape
Town, Graduate School of Business, South Africa.
Perraut, E.E. (1983). A comparison managerial behaviour in cooperatives and investor
oriented firms serving farmer. Unpublished MSc thesis, Department of Agricultural
Economics, Michigan State University.
Philip, K. (2003). Co-operatives in South Africa: their role in job creation and poverty
reduction Online: http://www.sarpn.org.za/documents/d0000786/P872-Co-
ops_October2003.pdf. Accessed on 10 March 2008.
Piesse, J., Doyer, T., Thirtle, C & Vink, N. (2004). The changing role of grain cooperatives in
the transition to competitive markets in South Africa. Research Paper 020, The Management
Centre, King‘s College, University of London, London, UK.

127
Porter, M. E. (1991). Towards a dynamic theory of strategy. Strategic Management Journal,
12, 95–117. Porter, M. E. (2001). Strategy and the internet. Harvard Business Review, 79,
62–79.
Porter, P.K & Scully, G.W. (1987). Economic efficiency in co-operatives. The Journal of
Law and Economics, 489-512.
Porter, M. E. (1980). Competitive strategy: Techniques for analyzing industries and
competitors. New York: Free Press.
Pretorius, J.L (1997). Economic value added as an alternative method of valuation. Randse
Afrikaanse Universiteit (RAU), Johannesburg.
Price Water and Coopers. (2008). Agribusiness benchmarking survey 2007. Price Water and
Coopers.
Price Water and Coopers. (2006). Agribusiness benchmarking survey 2006. Price Water and
Coopers.
Price Water and Coopers. (2006). A new cooperatives Dispensation. Price Water and
Coopers.
Priem, R.L., Rasheed, A.M.A. & Kotulic, A.G. (1995). Rationality in strategic decision
processes, environmental dynamism and firm performance. Journal of Management, 21 (5):
913– 929.
Priem, R.L. (1990). Top management group factors, consensus, and firm performance.
Strategic Management Journal, 11: 469– 478.
Putterman, L. (1993). Ownership and the nature of the firm. Journal of comparative
Economics, 17: 243 – 263.
Robbins, S.P & Coulter, M. (1996). Management (5th
ed). Prentice Hall, International, Inc,
New Jersey, USA.

128
Royer, J.S. (1995). Potential for cooperative involvement in vertical co-ordination and value-
added activities. Agribusiness, (11): 473– 481.
Rowe, J.K. (2005). Corporate Social Responsibility as Business Strategy. In Ronnie, L &
James R (Ed), Globalization, Governmentality and Global Politics: Regulation for the Rest of
Us? Routledge (2005).
Ruben, R & Lerman, Z. (2004). Why Nicaraguan Peasants Stay in Agricultural Production
Cooperatives. The Centre for Agricultural Economic Research Discussion Paper No. 13.04.
The Hebrew University of Jerusalem
Sashkin, M & Morris, W. C. (1984). Organisational behaviour: Concepts and Experiences.
Reston Publishing company, Inc, Reston, Virginia.
Savitz, A.W & Weber, K. (2006). The Triple Bottom Line: How Today's Best-Run
Companies Are Achieving Economic, Social and Environmental Success -- and How You
Can Too (Hardcover). John Wiley and Sons publishers, USA.
Schrader, L. F. (1989) Economic Justification. In Cobia, D.W. (ed) Cooperatives in
Agriculture, Prentice Hall, New Jersey, 121-135.
Schrader, L.F., Babb, E.M., Boynton, & Lang, M.G. (1985). Cooperative and proprietary
agribusiness: comparison of performance. Agri. Exp. Stat. Bull. 982, Purdue University.
Schermerhon J.R., Hunt, J.G & Osborn, R.N. (2005). Organisational behaviour (9th
ed).John
Wiley and Sons, Inc, USA.
Schwettmann, J. (2001). Shared service cooperatives in ILO (2002b), (2001).
Sexton, R. (2000). Industrialization and Consolidation in the U.S. Food Sector: Implications
for Competition and Welfare. American Journal of Agricultural Economics, 82(5): 1087-
1104.
129
Staatz, J.M. (1984). A theoretical perspective on the behaviour of farmers Cooperatives.
Unpublished PhD thesis, Michigan State University.
Standard Bank. (2006). Farmers finally fight back. AgriReview, First Quarter Bulletin, 1-3.
Sugden, R. (1989). Spontaneous order. Journal of Economic Perspectives (American
Economic Association), 3(4): 85-97.
Suhler, D.R & Cook, M.L. (1993). Origin of current conflict? An examination of Stock non
stock cooperative Law. Journal of Agricultural Cooperation.
Sullivan, D & Scrimgeour, F. (1995). The NZ Dairy Board: what is the value added? AERU,
Discussion Paper, 142, 92-105.
Sycuan, M & Cook, M. (2001). A New Institutional Economics approach to contracts and
cooperatives. American Journal of Agricultural Economics, 83: 1271-1277.
Sykuta, M & Cook, M. (2001). A New Institutional Economics approach to contracts and
cooperatives. American Journal of Agricultural Economics, 83: 1271-1277.
Taylor, M., Hameenaho, S & Pinion, D. (2002). Options for Cooperative Care: promoting
and supporting cooperative solutions to social care delivery, Cooperative Union, Manchester
2002.
Tsamenyi, M. & McIlgorm, A. (2000). Enhancing fisheries rights through legislation -
Australia's experience. In Use of Property Rights in Fisheries Management. Proceedings of
the FishRights99 Conference. Fremantle, Western Australia, 11-19 November 1999. FAO
Fisheries Technical Paper No.404/2. pp.88-95, FAO, Rome.
Urbanchuk, J.M. (2007). Economic impacts on the farm community of cooperative
ownership of ethanol production. U.S. Department of Agriculture Agricultural Outlook
Forum Presented: March 1-2, 2007.

130
Van Niekerk, J.A.S. (1988). Co-operative theory and practice. Promedia Publications,
Silverton, Pretoria.
Van der Walt, L. (2005). The resuscitation of the cooperative sector in South Africa. Paper
presented at the International Co-operative Alliance XXI International Cooperative Research
Conference, Cork, Ireland, August 11-14, 2005.
Vink, N & Kirsten, J. (2000). Deregulation of agricultural marketing in South Africa:
Lessons learned. Free Market Foundation Monograph No. 25.
Watson, G.H. (1992). The Benchmarking Workbook: Adapting best practices for
performance improvement. Productivity Press, Cambridge.
Wijbenga, F.H & Van Witteloostuijn, A. (2007). Entrepreneurial locus of control and
competitive strategies – The moderating effect of environmental dynamism. Journal of
Economic Psychology, 28 (2007): 566–589.
Wikipedia. (2008). Online: http://www.wikipedia.org/. Accessed 20 March 2008.
Williams, C.A & Aguilera, R.V. (Undated). Corporate social responsibility in a comparative
perspective.
Williamson, O. (1985). The limits of firms: incentives and bureaucratic features. In:
Putterma, L and Kroszner, R.S. (1996). The Economic nature of the firm. (2nd
ed). Cambridge
University press, Cambridge. Pp
Wollni, M & Zeller, M. (2006). Do farmers benefit from participating in specialty markets
and cooperatives? The case of coffee marketing in Costa Rica. Contributed paper prepared
for presentation at the International Association of Agricultural Economists Conference, Gold
Coast, Australia, August 12-18, 2006.
Wood, N. (2000). Economic value added (EVA): Uses, benefits and limitations – A South
African perspective. Southern African Business Review 4(1):46–53.

131
Appendice 1: Questionnaire
Questionnaire concerning the comparative performance of cooperatives that converted
to companies and cooperatives that never converted
Respondent and Organisations` Information
Name of Organisation
Sector
Position of respondent
Contact Phone No.
Location of interview
Date of interview
Hello, I am Wellington Sikuka from Stellenbosch University in the Western Cape. We are
talking to a cross-section of agribusiness companies and cooperatives in the Western Cape
about the issues and implications of converting from a cooperative to a company. Your views
will be used to help inform on the much needed insight on cooperative conversions and assist
policy makers to make informed decisions on cooperatives or agribusinesses.
This interview is completely confidential. Your name will never be associated with your
answers.
I hereby certify that this is an honest interview taken in accordance with my academic needs
only. For further information or enquiries you can contact my supervisor Dr A.M.S Karaan.
………………………………… ………………………..
Interviewer‘s Signature Date

132
SECTION A: ORGANISATIONAL INFORMATION AND CULTURE
Mark with an X or (tick) were appropriate!
1. How do you consider your competition in the industry?
Light Strong Manageable
2. (a) Does your organisation undertake any corporate social investment?
Yes No
(b) If Yes, please specify what type of investments?
......................................................................................................................................................
......................................................................................................................................................
3. (a) Has your organisation undertaken some environmental sustainability or eco sensitive
initiatives?
Yes No
(b) If Yes, please specify what type of initiatives?
......................................................................................................................................................
......................................................................................................................................................
4. To what extent do you agree or disagree with each of the following statements regarding
your organisation?
Strongly disagree 1
Disagree 2
Neutral 3
Agree 4
Strongly Agree 5
1 2 3 4 5
The leadership style has changed to suit the new environment
The company can be described as a learning organization
Team work is an essential structure for the organisations`
success
Organisational culture plays an important role in the success
of the organisation

133
5. When recruiting new employees, to what extent do you consider diversity?
No extent
Small extent
To some extent
To a large extent
To a very large extent
SECTION B: ORGANISATION RESTRUCTURING AND DYNAMISM
Mark with an X or (tick) were appropriate
6. Please indicate the nature of investments your business has undertaken in the past 5 years
Vertical integration
Horizontal integration
Diversification
Money market
Outside agriculture
Other (Please state)
7. Has your organisation undergone any of the following restructuring actions in the past 5
years?
Mergers
Acquisition
Joint venture
Conversion to a company
Strategic alliances
8. Who motivated such actions?
Members
Management
External parties
Other (please specify)

134
9. Rate the following on a scale of 1 to 5 on the decision to convert or restructure? With 1
indicating no role and 5 indicating main role on the decision to convert or restructure.
(a) Members leaving the organisation?
1 2 3 4 5
(b) To raise capital?
1 2 3 4 5
(c) Improve competitiveness of the organisation?
1 2 3 4 5
(d) Relative merits of the company business model?
1 2 3 4 5
(e) Discontent with the performance of the organisation?
1 2 3 4 5
(f) As a strategy to reduce costs?
1 2 3 4 5
(g) Response to the Cooperative Act (Act 14 of 2005)?
1 2 3 4 5
(h) Discontent with the structure of the cooperative?
1 2 3 4 5
(i) Seeking to expand your business empire?
1 2 3 4 5
(j) Members pressure?
1 2 3 4 5

135
(k) Management pressure?
1 2 3 4 5
(l) Response to the deregulation of the industry?
1 2 3 4 5
(m) Changes in tax laws (1997)?
1 2 3 4 5
(n) Political reasons?
1 2 3 4 5
10. What happened to the number of members of the cooperative after the conversion?
Static Decrease Increased
11. (a) What is your BEE score card?
Less that 40% 40.1 to 64.9% Greater than 65
(b) Which area does your organisation need to work on inorder to improve your score
card?
Business Ownership
Employment Equity
Employment Management
Skills Development
Preferential Procurement
Enterprise Development
Corporate Social Responsibility
12. Do you apply triple bottom line accounting reporting on your annual reports?
Yes No
NB: Triple bottom line accounting is reporting financial information, social information as
well as environmental information regarding the business.

136
13. To what extent do you agree or disagree with each of the following statements regarding
your organisational structure?
Strongly disagree 1
Disagree 2
Neutral 3
Agree 4
Strongly Agree 5
1 2 3 4 5
Organisation structure has not changed for the past 5 years
The organisation structure is hierarchal
The organisation is now more networked
Various other companies or units have been put under one
group name
The organisation has established independent companies or
units
SECTION C: PERFOMANCE INFORMATION
Mark with an X or (tick) were appropriate
14. How do you finance your major investments?
Bank loans
Reserved funds
Issue shares
New members
Capital seeking entities (e.g. strategic
alliance, a trust company or a publicly held
subsidiary)
Other
15. How do you rate your staff turnover (specifically management)?
Low Moderate High Very High
137
16. How has the product mix or services you offer changed in the past 5 years?
Still the same
Slight changes
Moderate changes
Significant changes
17. Have you made any value addition to the products you handled before?
Yes No
18. (a) Do you have any performance benchmark for the organisation?
Yes No
(b) If Yes, who are you benchmarking yourself against?
Leading global businesses
Other cooperatives
Local agribusinesses
Internally generated benchmark
Other
19. Do you have enough capital to finance your major investments?
Yes No
20. Which investors provide the majority of equity for the organisation (rank from the highest
to lowest and estimate percentage shareholding)?
Rank (1 to 3) Percentage
Members patronising the organisation
Shareholders
External investors (including trust companies)
21. Have your major customers changed over time?
No changes Slight changes significant changes

138
22. (a) Do you distinguish between member and non members as clients?
Yes No
(b) If Yes, Please state How?
......................................................................................................................................................
......................................................................................................................................................
23. (a) Does your organisation do any special efforts to enhance the efficiency or profitability
of its member clients?
Yes No
(b) Did it create value for the firm?
Yes No
SECTION D: OWNERSHIP INFORMATION
Mark with an X or (tick) were appropriate! (If company head straight to question 26, 28 &
31)
24. Which criteria are used to allow new members to join the organisation?
Based on potential patronage that they will bring to the organisation
Membership is closed
Restricted to members with the same interest
Open to anyone with the money to buy shares (public)
Contribute nominal membership fee
By invitation
Other
25. Have you created different classes of shares to accommodate new investors?
Yes No
26. (a) How are your shares traded?
Private sells Publicly offers Stock exchange
139
(b). Does the share price fluctuate in value?
Yes No
27. How do members redeem their equity or shares if they want to exit the organisation?
Get paid their nominal value
Get paid the market value
Other (please specify)
28. How would you describe your dividend policy?
Conservative Aggressive
29. Do you allow non patron investors in the organisation?
Yes No
30. What voting principle do you use?
One member one vote
Based on patronage
Based on shareholding
Other
31. How well attended are shareholder meetings?
Poorly Average Well Attended
32. Do you feel that members are sufficiently informed about the organisation in the
following areas?
YES NO
Major policy decisions
Operations
Marketing strategy
Financial status
Governance
140
SECTION E: MANAGEMENT CULTURE, STYLE, COMPTENCE AND
INCENTIVES
Mark with an X or (tick) were appropriate
33. How best can you describe the management team of your organisation?
Heterogeneous
Homogeneous
Autocratic
Bureaucratic
Dynamic
Formal
Informal relaxed style.
Focus on transforming people
34. Do you offer benefit programmes to management in order to enhance performance?
Yes No
35. What type of incentives do you use to reward management performance?
Share option
Profit share
Incentive bonus
Honorary rewards or non financial recognition
Other (please state)
SECTION F: POLICIES OR LEGISLATION
Mark with an X or (tick) were appropriate
36. Are you happy with the recent Cooperative Act (Act 14 of 2005)?
Yes No
37. (a) Have you made any response to the Cooperative Act (Act 14 of 2005)?
Yes No

141
(b) If Yes, please state what?
…………………………………………………………………………………………………
…………………………………………………………………………………………………
…………………………………………………………………………………………………
THANK YOU FOR YOUR TIME AND COOPERATION!!!!!!!!!!!!!