THE COMBINED AHP-QFD APPROACH AND ITS USE IN LEAN MAINTENANCE
12
SAIIE25 Proceedings, 9 th – 11 th of July 2013, Stellenbosch, South Africa © 2013 SAIIE 554-1 THE COMBINED AHP-QFD APPROACH AND ITS USE IN LEAN MAINTENANCE T.G. Tendayi 1* and Prof C.J. Fourie 2 1 Department of Industrial Engineering University of Stellenbosch, South Africa [email protected] 2 Department of Industrial Engineering University of Stellenbosch, South Africa [email protected] ABSTRACT The approach of using Quality Function Deployment (QFD) with techniques such as the Analytic Hierarchy Process (AHP) is gaining wide acceptance in many decision-making problems. This combined approach is followed in order to enhance the effectiveness of the decision-making process and is also used to deal with the sometimes subjective linguistic judgements that arise when expressing relationships and correlations required in the QFD approach. Previous uses of the QFD-AHP approach have been made in areas such as facility location problems and evaluation of hardware for mobile stations. Rarely has this approach been used in the field of Lean Thinking and in particular, lean thinking in the maintenance environment. The work presented here broadens the use of this approach by applying it in evaluating the importance of a set of Maintenance Excellence criteria and how they can be addressed by applying lean thinking. A survey, carried out at a maintenance organisation in the railway environment, acts as the foundation of the study. This exercise results in a set of prioritised lean tools used to address a set of ranked maintenance excellence criteria specific to the organisation in question. * Corresponding Author
Transcript of THE COMBINED AHP-QFD APPROACH AND ITS USE IN LEAN MAINTENANCE
SAIIE25 Proceedings, 9th – 11th of July 2013, Stellenbosch, South Africa © 2013 SAIIE
554-1
THE COMBINED AHP-QFD APPROACH AND ITS USE IN LEAN MAINTENANCE
T.G. Tendayi1* and Prof C.J. Fourie2
1Department of Industrial Engineering University of Stellenbosch, South Africa
2Department of Industrial Engineering University of Stellenbosch, South Africa
ABSTRACT
The approach of using Quality Function Deployment (QFD) with techniques such as the Analytic Hierarchy Process (AHP) is gaining wide acceptance in many decision-making problems. This combined approach is followed in order to enhance the effectiveness of the decision-making process and is also used to deal with the sometimes subjective linguistic judgements that arise when expressing relationships and correlations required in the QFD approach. Previous uses of the QFD-AHP approach have been made in areas such as facility location problems and evaluation of hardware for mobile stations. Rarely has this approach been used in the field of Lean Thinking and in particular, lean thinking in the maintenance environment. The work presented here broadens the use of this approach by applying it in evaluating the importance of a set of Maintenance Excellence criteria and how they can be addressed by applying lean thinking. A survey, carried out at a maintenance organisation in the railway environment, acts as the foundation of the study. This exercise results in a set of prioritised lean tools used to address a set of ranked maintenance excellence criteria specific to the organisation in question.
* Corresponding Author
SAIIE25 Proceedings, 9th – 11th of July 2013, Stellenbosch, South Africa © 2013 SAIIE
554-2
1 INTRODUCTION
The approach of using Quality Function Deployment (QFD) with related techniques such as the Analytic Hierarchy Process (AHP) is gaining wide acceptance in many decision-making problems. This approach is usually followed in order to enhance the effectiveness of the decision-making process and is also used to deal with the sometimes subjective linguistic judgements that arise when expressing relationships and correlations required in the QFD approach. Previous uses of the QFD-AHP approach have been made in areas such as facility location problems and evaluation of hardware for mobile stations. Rarely has this approach been used in the field of Lean Thinking and in particular, Lean Thinking in the maintenance environment. In the work presented here, the scope of use of this approach is broadened by applying it in evaluating the importance of a set of Maintenance Excellence (ME) criteria and how they can be addressed by applying lean thinking. A survey, carried out at a maintenance organisation in the railway environment, acts as the foundation of this study. The results of the survey are used as the input of a QFD model. The other set of input necessary for the model is obtained from a literature study of lean thinking and its potential application in addressing the ME criteria. A relationship matrix is then formed from the two sets of input. The AHP process is then used to carry out pairwise comparisons in order to establish the consistency and subsequent ranking of the various relationships according to importance. The organisation of the paper is as follows; there is a brief discussion on the QFD and AHP procedures and how they have been used in previous studies. A description is also made of the concept of lean thinking and its use in maintenance operations, through the concept of lean maintenance. A QFD House of Quality (HOQ) consisting of a set of ME criteria and a set of possible lean tools to meet the criteria, is developed. This is followed by the application of the QFD-AHP approach to evaluate and rank the relationships in the HOQ in order to determine the consistency of the comparisons. Implications of this approach in the area of lean thinking in maintenance operations are then discussed and concluding remarks and recommendations are made.
2 LITERATURE REVIEW
2.1 The Quality Function Deployment Technique
Quality Function Deployment (QFD) was first proposed and used by Mitsubishi Heavy Industry’s Kobe shipyards to design super tankers ReVelle [1]. It is a widely used customer-driven, design and manufacturing tool, and is commonly used in the new product development field to translate customer requirements (WHATs) into appropriate engineering characteristics (HOWs) Zarei & Jamali [2]. Toyota Auto Body developed a quality table that had a “roof” on top, which was later passed on as the House of Quality (HOQ). The HOQ is essentially a matrix that is used to display the relationship between the WHATs and the HOWs and demonstrates how quality characteristics satisfy the customer requirements. The QFD technique is mostly used in conjunction with other techniques in order to enhance its effectiveness and applicability. It is also combined with other techniques in order to deal with the subjective linguistic judgements that arise when expressing relationships and correlations required in the HOQ. One such adaptation is through the use of Fuzzy Logic Bottani [3], which is used to minimise the vagueness frequently represented in decision data. Another approach that is gaining wide acceptance is that of combining QFD with the Analytic Hierarchy Process.
2.2 The Analytic Hierarchy Process
The Analytic Hierarchy Process (AHP) is a systematic decision-making approach that was first developed in 1971 by Thomas L Saaty Saaty [4]. A very detailed literature review of the many applications of AHP is given by Vaidya & Kumar [5] who highlight just how broadly the process has been used. According to the study, AHP has been used in education, engineering, government, industry, management, manufacturing, finance sector and so forth. The reason
SAIIE25 Proceedings, 9th – 11th of July 2013, Stellenbosch, South Africa © 2013 SAIIE
554-3
why it has been so widely used is because of its simplicity, ease of use and flexibility Ho [6]. The process does however have its critics with the earliest being Belton & Gear [7], who state that they discovered many instances where the addition of an alternative causes a change in the relative importance of criteria and thus overall preferences order. They recommend that the pairwise comparison questions be more specific than those advocated in the original method. This view is supported by other studies such as one carried out by Aiqing & Jinli [8] who propose a new method of rank preservation based on what they call the judgement matrix consistency. However, in spite of these perceived shortcomings, AHP in its original form still remains very powerful, especially when it is used in conjunction with other decision making techniques.
2.3 The QFD-AHP Approach
Quality Function Deployment (QFD) has been used extensively in conjunction with AHP to give better solutions. Partovi [9] carries out one such combination where instead of using a standalone AHP approach, an AHP-QFD approach is used for evaluating decision alternatives in a facility location problem. Another QFD-AHP study used in a facility location problem is found in the work done by Chuang [10]. AHP is used to measure the relative importance weighting for each location requirement and also to assess the evaluating score for each candidate location for a particular set of location criterion. Dziadak & Michalski [11] use QFD and AHP in the evaluation of hardware for a mobile station and find that the results of these methods are better than those obtained using quality/price ranking methods. Ho [6] gives many another examples where the AHP-QFD approach has been used including, amongst others:
Improving the education quality for a higher learning institution. Project selection. Determining the composition of an army deployment. New product development.
2.4 Lean Maintenance
The term “lean maintenance” is relatively new having only been coined in the last decade of the 20th Century, well after lean manufacturing Smith & Hawkins [12]. An abbreviated definition of the term is given by Clarke, Mulyran, & Liggan [13] who state that it is the delivery of maintenance services to customers with as little waste as possible hence promoting achievement of a desirable outcome with fewest inputs possible. Definitions are few and hard to come by as most simply prefer to refer to it as the application of lean to maintenance, repair & overhaul (MRO). Whatever expression is used, whether it is “lean maintenance” or “lean in MRO”, the underlying focus for the application of lean is in the reduction of waste, as indicated by Ayeni, Baines, Lightfoot, & Ball [14]. This view is also shared by Ghayebloo [15] who states that the main purpose of lean maintenance is to eliminate all forms of waste in the maintenance process without taking into account serious reliability issues. Lean Tools are the various tools that can be used to increase the leanness of a function. These tools are designed to prepare for, plan and execute the function using lean thinking. And when referring to the maintenance function, these lean tools will allow lean thinking to be applied with the end result that maintenance excellence is attained. Davies & Greenough [16] state that there is no clearly defined lean practice framework which can be referred to for the maintenance function. Table 1 gives a brief overview of tools that have been used or have been determined to be effective in performing lean thinking in the maintenance environment. As can be observed from the table, most of the lean tools have been applied in a manufacturing context.
SAIIE25 Proceedings, 9th – 11th of July 2013, Stellenbosch, South Africa © 2013 SAIIE
554-4
Table 1: Lean Tools/Enablers Used in Maintenance Functions
Lean Tool (s) Application/Industry Author (s)
5S, TPM, OEE, Standards, Mapping, Inventory Management, Visual Management, Root cause problem solving, Continuous improvement, Kaizen Activities, Poka Yoke, Process Activity Mapping, Self-Audits, Story boarding, Kanban, Scenarios, Takt Time, Lead Time mapping, Value Focused Thinking, Supplier Associations, Open Book Management
General – Manufacturing Origins Davies & Greenough [16]
5S, 7 Deadly Wastes, Standardised Work, Value Stream Mapping, Kanban, Jidoka, Poka Yoke, JIT
General – Manufacturing Origins Smith & Hawkins [12]
Jidoka, Just-in-time, Heijunka, Kaizen
Maintenance Repair and Overhaul Zwas [17]
Value Mapping, Criticality Analysis, Hidden Lost Cost Model, Best Practice Development, Lean Maintenance Standards, Focused Improvement
Pharmaceutical Manufacturing Clarke et al [13]
3 IMPLEMENTATION OF AHP-QFD APPROACH
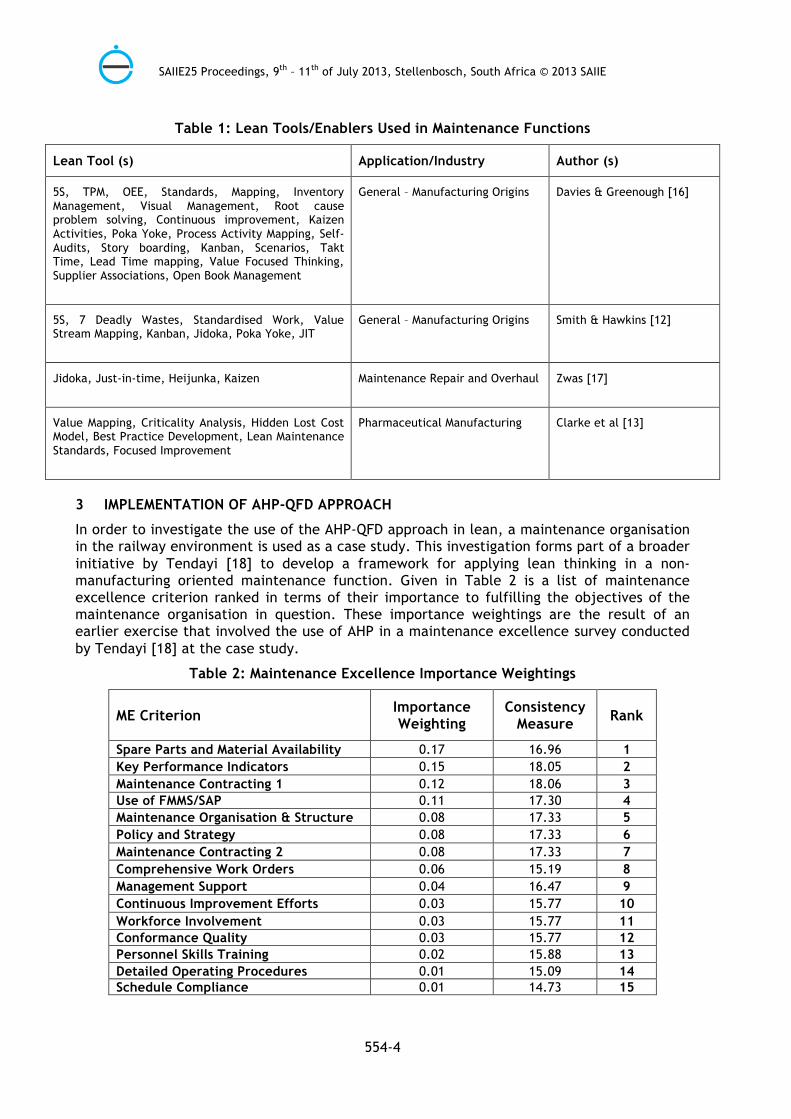
In order to investigate the use of the AHP-QFD approach in lean, a maintenance organisation in the railway environment is used as a case study. This investigation forms part of a broader initiative by Tendayi [18] to develop a framework for applying lean thinking in a non-manufacturing oriented maintenance function. Given in Table 2 is a list of maintenance excellence criterion ranked in terms of their importance to fulfilling the objectives of the maintenance organisation in question. These importance weightings are the result of an earlier exercise that involved the use of AHP in a maintenance excellence survey conducted by Tendayi [18] at the case study.
Table 2: Maintenance Excellence Importance Weightings
ME Criterion Importance Weighting
Consistency Measure Rank
Spare Parts and Material Availability 0.17 16.96 1 Key Performance Indicators 0.15 18.05 2 Maintenance Contracting 1 0.12 18.06 3 Use of FMMS/SAP 0.11 17.30 4 Maintenance Organisation & Structure 0.08 17.33 5 Policy and Strategy 0.08 17.33 6 Maintenance Contracting 2 0.08 17.33 7 Comprehensive Work Orders 0.06 15.19 8 Management Support 0.04 16.47 9 Continuous Improvement Efforts 0.03 15.77 10 Workforce Involvement 0.03 15.77 11 Conformance Quality 0.03 15.77 12 Personnel Skills Training 0.02 15.88 13 Detailed Operating Procedures 0.01 15.09 14 Schedule Compliance 0.01 14.73 15
SAIIE25 Proceedings, 9th – 11th of July 2013, Stellenbosch, South Africa © 2013 SAIIE
554-5
After having identified a set of maintenance excellence criteria that are imperative if a maintenance organisation is to achieve best maintenance standards, the next step is to identify lean tools that will allow the organisation to meet those standards in a manner that eliminates waste and adds value. The lean tools are identified from literature and are then used as input (HOWs) in an HOQ that has the ME criteria as the WHATs as shown in Figure 1. The numbers shown in the ‘Importance Degree of Lean Approach’ row are derived from the absolute importance, 𝑨𝑨𝑰𝑰 ( 𝑗𝑗 = 1,…𝑚𝑚 ) formula of the QFD approach as shown below:
𝑨𝑨𝑰𝑰 = 𝑊𝑊 𝑅𝑅 ,𝒏𝒏 𝑗𝑗 = 1,… ,𝑚𝑚 (1)
Where:
𝑨𝑨𝑰𝑰 is the absolute importance of the 𝑗𝑗th engineering characteristic (𝑗𝑗 = 1,…𝑚𝑚), and 𝑚𝑚 is the total number of characteristics.
𝑊𝑊 is the relative importance of the 𝒊𝒊th Customer Attribute,
𝑅𝑅 expresses the relationship between the 𝑖𝑖th customer attribute and the 𝑗𝑗th engineering characteristic with a numerical scale.
In our case, the numerical scale of the relationships between the lean tools and the ME Criteria is 1-3-9 for the Weak, Medium and Strong relationships respectively and the importance weightings of ME criteria are taken from Table 2. The ‘Normalised Importance Degree’ figures in the HOQ are derived from the relative importance, 𝑹𝑹𝑰𝑰 formula as shown below:
𝑹𝑹𝑰𝑰 = 𝑨𝑨𝑨𝑨𝑨𝑨𝑨𝑨, 𝑗𝑗 = 1,… ,𝑚𝑚 (2)
The last row in the HOQ shows the rankings of the various lean tools according to importance weighting.
SAIIE25 Proceedings, 9th – 11th of July 2013, Stellenbosch, South Africa © 2013 SAIIE
554-6
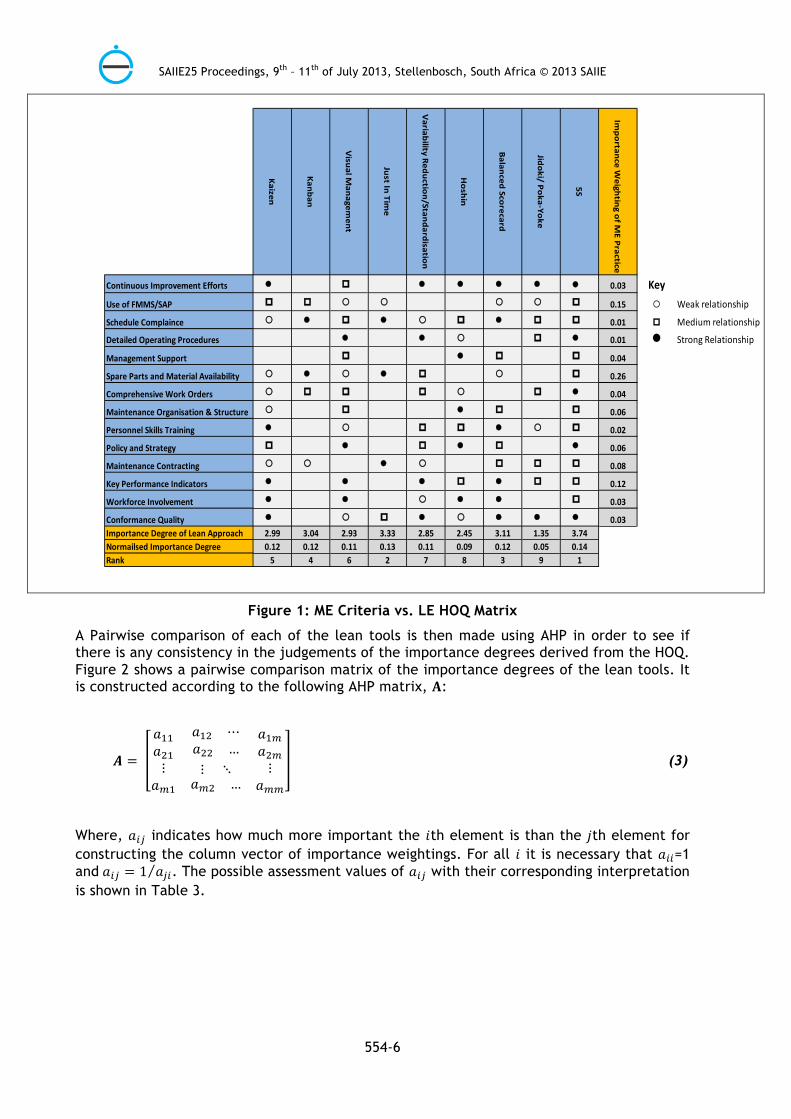
Figure 1: ME Criteria vs. LE HOQ Matrix
A Pairwise comparison of each of the lean tools is then made using AHP in order to see if there is any consistency in the judgements of the importance degrees derived from the HOQ. Figure 2 shows a pairwise comparison matrix of the importance degrees of the lean tools. It is constructed according to the following AHP matrix, 𝐀𝐀:
𝑨𝑨 =
𝑎𝑎 𝑎𝑎 ⋯ 𝑎𝑎𝑎𝑎 𝑎𝑎 … 𝑎𝑎⋮
𝑎𝑎⋮ ⋱
𝑎𝑎 …⋮
𝑎𝑎
(3)
Where, 𝑎𝑎 indicates how much more important the 𝑖𝑖th element is than the 𝑗𝑗th element for constructing the column vector of importance weightings. For all 𝑖𝑖 it is necessary that 𝑎𝑎 =1 and 𝑎𝑎 = 1 𝑎𝑎 . The possible assessment values of 𝑎𝑎 with their corresponding interpretation is shown in Table 3.
Kaizen
Kanban
Visual M
anagement
Just In Time
Variability Reduction/Standardisation
Hoshin
Balanced Scorecard
Jidoki/ Poka-‐Yoke
5S
Importance W
eighting of ME Practice
Continuous Improvement Efforts 0.03 KeyUse of FMMS/SAP 0.15 ¡ Weak relationship
Schedule Complaince 0.01 p Medium relationship
Detailed Operating Procedures 0.01 l Strong Relationship
Management Support 0.04
Spare Parts and Material Availability 0.26
Comprehensive Work Orders 0.04
Maintenance Organisation & Structure 0.06
Personnel Skills Training 0.02
Policy and Strategy 0.06
Maintenance Contracting 0.08
Key Performance Indicators 0.12
Workforce Involvement 0.03
Conformance Quality 0.03Importance Degree of Lean Approach 2.99 3.04 2.93 3.33 2.85 2.45 3.11 1.35 3.74Normailsed Importance Degree 0.12 0.12 0.11 0.13 0.11 0.09 0.12 0.05 0.14Rank 5 4 6 2 7 8 3 9 1
ll pp ll ll ll ll ll
pp pp ¡¡ ¡¡ ¡¡ ¡¡ pp
¡¡ ll pp ll ¡¡ pp ll pp pp
ll ll ¡¡ pp ll
¡¡
¡¡
pp ll pp pp
ll ¡¡ ll pp ¡¡ pp
pp pp pp ¡¡ pp ll
¡¡ pp ll pp pp
ll ¡¡ pp pp ll ¡¡ pp
pp ll pp ll pp ll
¡¡ ¡¡ ll ¡¡ pp pp pp
ll ll ll pp ll pp pp
ll ll ¡¡ ll ll pp
ll ¡¡ pp ll ¡¡ ll ll ll
SAIIE25 Proceedings, 9th – 11th of July 2013, Stellenbosch, South Africa © 2013 SAIIE
554-7
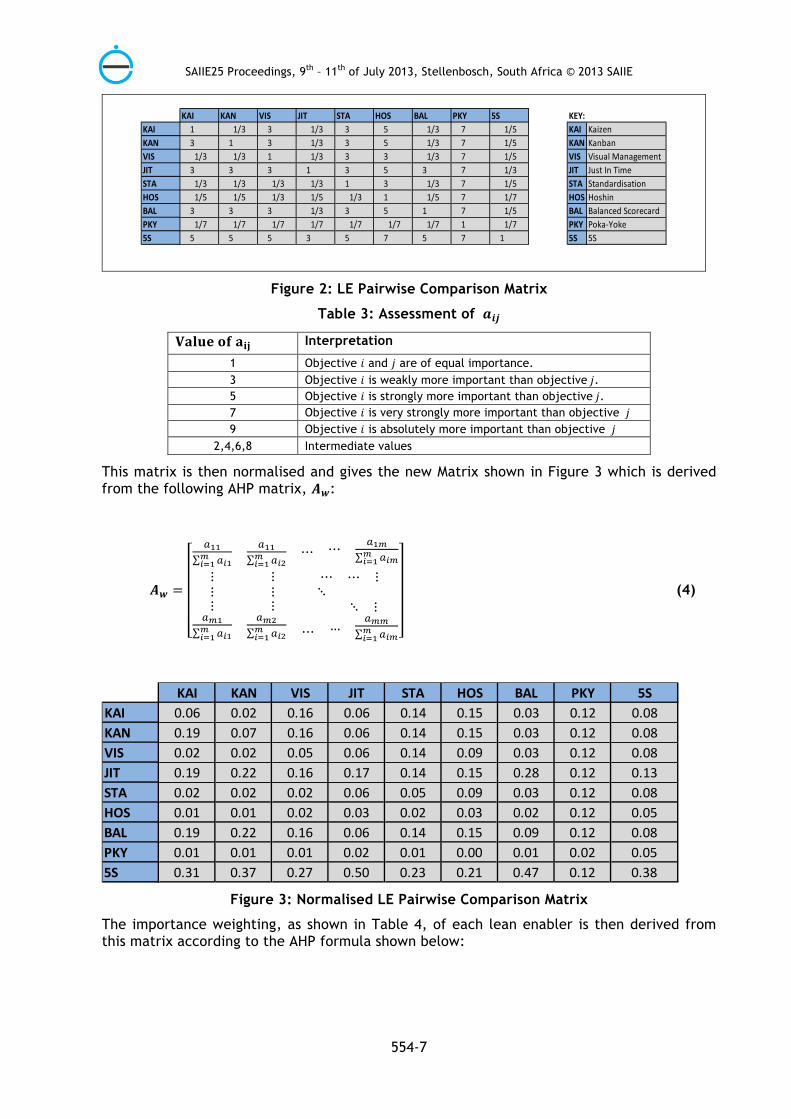
Figure 2: LE Pairwise Comparison Matrix
Table 3: Assessment of 𝒂𝒂𝒊𝒊𝒊𝒊
𝐕𝐕𝐕𝐕𝐕𝐕𝐕𝐕𝐕𝐕 𝐨𝐨𝐨𝐨 𝐚𝐚𝐢𝐢𝐢𝐢 Interpretation
1 Objective 𝑖𝑖 and 𝑗𝑗 are of equal importance. 3 Objective 𝑖𝑖 is weakly more important than objective 𝑗𝑗. 5 Objective 𝑖𝑖 is strongly more important than objective 𝑗𝑗. 7 Objective 𝑖𝑖 is very strongly more important than objective 𝑗𝑗 9 Objective 𝑖𝑖 is absolutely more important than objective 𝑗𝑗
2,4,6,8 Intermediate values
This matrix is then normalised and gives the new Matrix shown in Figure 3 which is derived from the following AHP matrix, 𝑨𝑨𝒘𝒘:
𝑨𝑨𝒘𝒘 =
⋯ ⋯
⋮ ⋮ ⋯ ⋯ ⋮⋮⋮
⋮ ⋮
⋱
⋯
⋱ ⋮…
(4)
Figure 3: Normalised LE Pairwise Comparison Matrix
The importance weighting, as shown in Table 4, of each lean enabler is then derived from this matrix according to the AHP formula shown below:
KAI KAN VIS JIT STA HOS BAL PKY 5S KEY:KAI 1 1/3 3 1/3 3 5 1/3 7 1/5 KAI KaizenKAN 3 1 3 1/3 3 5 1/3 7 1/5 KAN KanbanVIS 1/3 1/3 1 1/3 3 3 1/3 7 1/5 VIS Visual Management JIT 3 3 3 1 3 5 3 7 1/3 JIT Just In TimeSTA 1/3 1/3 1/3 1/3 1 3 1/3 7 1/5 STA StandardisationHOS 1/5 1/5 1/3 1/5 1/3 1 1/5 7 1/7 HOS HoshinBAL 3 3 3 1/3 3 5 1 7 1/5 BAL Balanced ScorecardPKY 1/7 1/7 1/7 1/7 1/7 1/7 1/7 1 1/7 PKY Poka-‐Yoke5S 5 5 5 3 5 7 5 7 1 5S 5S
KAI KAN VIS JIT STA HOS BAL PKY 5SKAI 0.06 0.02 0.16 0.06 0.14 0.15 0.03 0.12 0.08KAN 0.19 0.07 0.16 0.06 0.14 0.15 0.03 0.12 0.08VIS 0.02 0.02 0.05 0.06 0.14 0.09 0.03 0.12 0.08JIT 0.19 0.22 0.16 0.17 0.14 0.15 0.28 0.12 0.13STA 0.02 0.02 0.02 0.06 0.05 0.09 0.03 0.12 0.08HOS 0.01 0.01 0.02 0.03 0.02 0.03 0.02 0.12 0.05BAL 0.19 0.22 0.16 0.06 0.14 0.15 0.09 0.12 0.08PKY 0.01 0.01 0.01 0.02 0.01 0.00 0.01 0.02 0.055S 0.31 0.37 0.27 0.50 0.23 0.21 0.47 0.12 0.38
SAIIE25 Proceedings, 9th – 11th of July 2013, Stellenbosch, South Africa © 2013 SAIIE
554-8
𝑪𝑪 =
𝑐𝑐⋮⋮𝑐𝑐
=
⋯
⋮⋮
⋯
(5)
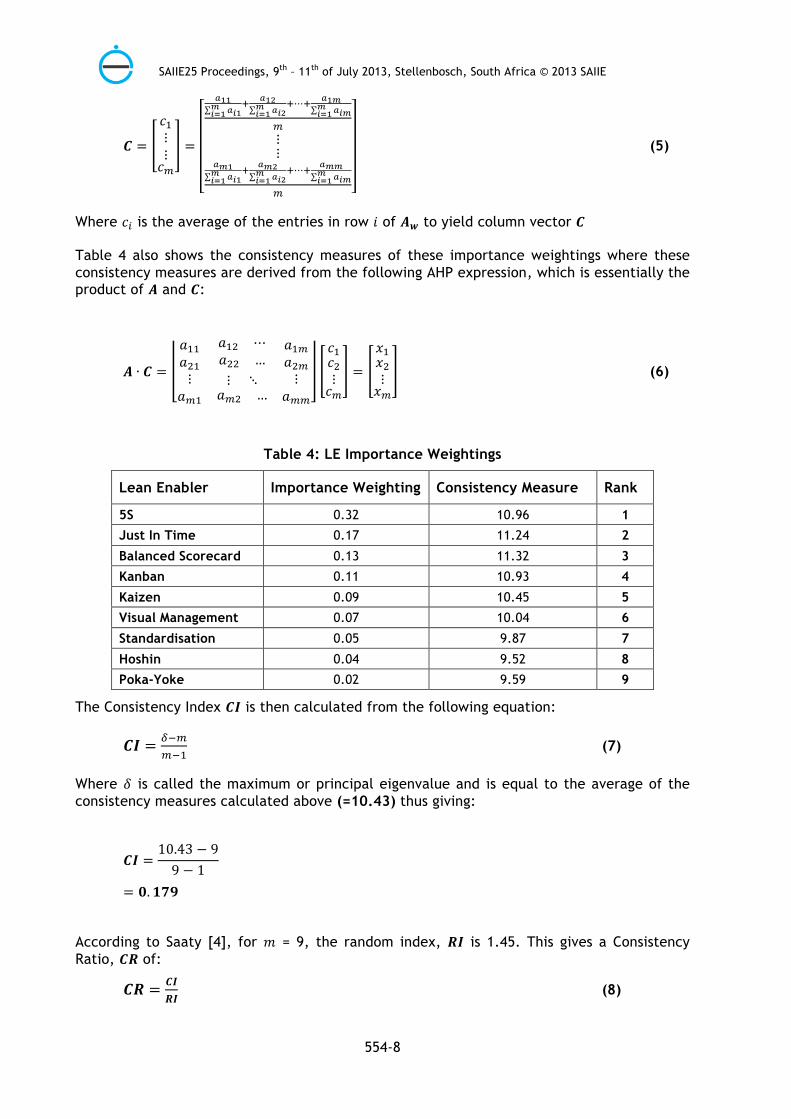
Where 𝑐𝑐 is the average of the entries in row 𝑖𝑖 of 𝑨𝑨𝒘𝒘 to yield column vector 𝑪𝑪
Table 4 also shows the consistency measures of these importance weightings where these consistency measures are derived from the following AHP expression, which is essentially the product of 𝑨𝑨 and 𝑪𝑪:
𝑨𝑨 ∙ 𝑪𝑪 =
𝑎𝑎 𝑎𝑎 ⋯ 𝑎𝑎𝑎𝑎 𝑎𝑎 … 𝑎𝑎⋮
𝑎𝑎⋮ ⋱
𝑎𝑎 …⋮
𝑎𝑎
𝑐𝑐𝑐𝑐⋮𝑐𝑐
=𝑥𝑥𝑥𝑥⋮𝑥𝑥
(6)
Table 4: LE Importance Weightings
Lean Enabler Importance Weighting Consistency Measure Rank
5S 0.32 10.96 1 Just In Time 0.17 11.24 2
Balanced Scorecard 0.13 11.32 3 Kanban 0.11 10.93 4
Kaizen 0.09 10.45 5 Visual Management 0.07 10.04 6
Standardisation 0.05 9.87 7
Hoshin 0.04 9.52 8 Poka-Yoke 0.02 9.59 9
The Consistency Index 𝑪𝑪𝑪𝑪 is then calculated from the following equation:
𝑪𝑪𝑪𝑪 = (7)
Where 𝛿𝛿 is called the maximum or principal eigenvalue and is equal to the average of the consistency measures calculated above (=10.43) thus giving:
𝑪𝑪𝑪𝑪 =10.43 − 99 − 1
= 𝟎𝟎.𝟏𝟏𝟏𝟏𝟏𝟏
According to Saaty [4], for 𝑚𝑚 = 9, the random index, 𝑹𝑹𝑹𝑹 is 1.45. This gives a Consistency Ratio, 𝑪𝑪𝑪𝑪 of:
𝑪𝑪𝑪𝑪 = 𝑪𝑪𝑪𝑪𝑹𝑹𝑹𝑹
(8)
SAIIE25 Proceedings, 9th – 11th of July 2013, Stellenbosch, South Africa © 2013 SAIIE
554-9
=0.1791.45
= 𝟎𝟎.𝟏𝟏𝟏𝟏
The value of 0.12 is a little over the commonly accepted threshold of 0.10. By following a procedure given by Saaty [4], which involves replacing all 𝑎𝑎 in the initial matrix in question by the corresponding priority ratios, 𝑤𝑤 𝑤𝑤 and recalculating the priority vector, convergence to a consistent case is possible. This procedure is carried out on the lean tools and it is observed that the consistency ratio can be improved to 00..0044 with the revised importance weightings as shown in Table 5.
Table 5: Revised LE Importance Weightings
Lean Enabler Importance Weighting
Consistency Measure
Rank
Balanced Scorecard 0.25 10.40 1
Visual Management 0.18 10.59 2
5S 0.15 11.28 3
Kaizen 0.15 10.03 4
Standardisation 0.10 9.69 5
Hoshin 0.08 9.66 6
Just In Time 0.04 7.74 7
Kanban 0.04 8.50 8
Poka-Yoke 0.02 7.04 9
4 DISCUSSION
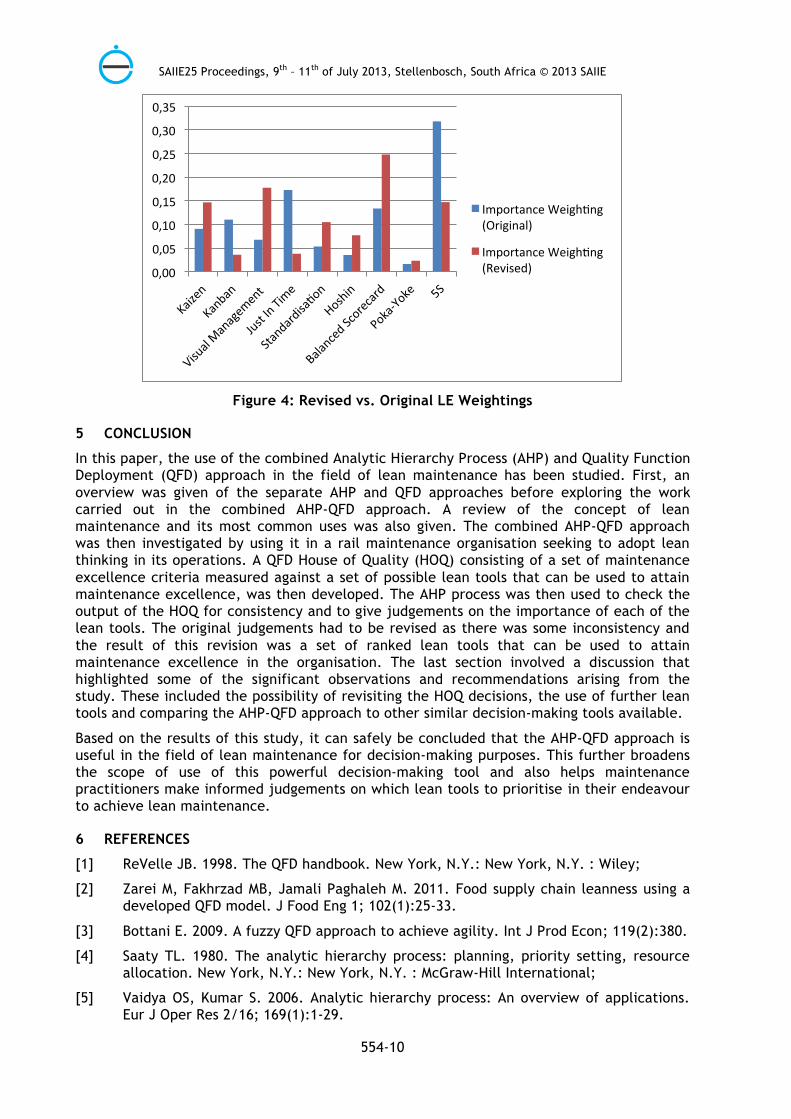
The changes that occur in the importance weightings when the judgements are revised, in order to make them more consistent are illustrated in the chart shown in Figure 4. These new weightings are more useful to the decision-maker than those obtained initially. There is need, however, not to excessively force the values of the judgements in order to improve consistency as this may distort the results. A more advisable approach, given time and resources, would be to go back to the HOQ and investigate what caused the inconsistencies in the first place. One possible reason for these inconsistencies can be attributed to the rather subjective correlations made in the HOQ when allocating lean tools to specific maintenance excellence criteria. The number of lean tools used in this exercise is by no means exhaustive or exclusive as the concept of lean thinking is very broad and subject to a number of external factors that determine its usefulness or otherwise. In further studies that were carried out using this same scenario, additional lean tools were also discovered to be essential in helping the organisation in question meet its maintenance excellence objectives. It would also be useful to compare the results obtained in this study using the AHP-QFD approach, against other integrated AHP approaches. This would help determine if this is indeed the best approach or there are some that can provide a more accurate representation of the real world scenario.
SAIIE25 Proceedings, 9th – 11th of July 2013, Stellenbosch, South Africa © 2013 SAIIE
554-10
Figure 4: Revised vs. Original LE Weightings
5 CONCLUSION
In this paper, the use of the combined Analytic Hierarchy Process (AHP) and Quality Function Deployment (QFD) approach in the field of lean maintenance has been studied. First, an overview was given of the separate AHP and QFD approaches before exploring the work carried out in the combined AHP-QFD approach. A review of the concept of lean maintenance and its most common uses was also given. The combined AHP-QFD approach was then investigated by using it in a rail maintenance organisation seeking to adopt lean thinking in its operations. A QFD House of Quality (HOQ) consisting of a set of maintenance excellence criteria measured against a set of possible lean tools that can be used to attain maintenance excellence, was then developed. The AHP process was then used to check the output of the HOQ for consistency and to give judgements on the importance of each of the lean tools. The original judgements had to be revised as there was some inconsistency and the result of this revision was a set of ranked lean tools that can be used to attain maintenance excellence in the organisation. The last section involved a discussion that highlighted some of the significant observations and recommendations arising from the study. These included the possibility of revisiting the HOQ decisions, the use of further lean tools and comparing the AHP-QFD approach to other similar decision-making tools available.
Based on the results of this study, it can safely be concluded that the AHP-QFD approach is useful in the field of lean maintenance for decision-making purposes. This further broadens the scope of use of this powerful decision-making tool and also helps maintenance practitioners make informed judgements on which lean tools to prioritise in their endeavour to achieve lean maintenance.
6 REFERENCES
[1] ReVelle JB. 1998. The QFD handbook. New York, N.Y.: New York, N.Y. : Wiley;
[2] Zarei M, Fakhrzad MB, Jamali Paghaleh M. 2011. Food supply chain leanness using a developed QFD model. J Food Eng 1; 102(1):25-33.
[3] Bottani E. 2009. A fuzzy QFD approach to achieve agility. Int J Prod Econ; 119(2):380.
[4] Saaty TL. 1980. The analytic hierarchy process: planning, priority setting, resource allocation. New York, N.Y.: New York, N.Y. : McGraw-Hill International;
[5] Vaidya OS, Kumar S. 2006. Analytic hierarchy process: An overview of applications. Eur J Oper Res 2/16; 169(1):1-29.
0,00
0,05
0,10
0,15
0,20
0,25
0,30
0,35
Importance Weigh�ng (Original)
Importance Weigh�ng (Revised)
SAIIE25 Proceedings, 9th – 11th of July 2013, Stellenbosch, South Africa © 2013 SAIIE
554-11
[6] Ho W. 2008. Integrated analytic hierarchy process and its applications - A literature review. Eur J Oper Res; 186(1):211-228.
[7] Belton V, Gear T. 1983. On a short-coming of Saaty's method of analytic hierarchies. Omega; 11(3):228-230.
[8] Aiqing & Jinli 2010 Study on a new approach of rank preservation in Analytic Hierarchy Process. Intelligent Control and Information Processing (ICICIP), 2010 International Conference on
[9] Partovi FY. 2004. An analytic model for locating facilities strategically. Omega; 34(1):41.
[10] Chuang P. 2001. Combining the Analytic Hierarchy Process and Quality Function Deployment for a Location Decision from a Requirement Perspective. The International Journal of Advanced Manufacturing Technology;18(11):842-849.
[11] Dziadak B, Michalski A. 2010 Evaluation of the hardware for a mobile measurement station.(Technical report). IEEE Trans Ind Electron; 58(7):2627.
[12] Smith R, Hawkins B. 2004. Lean Maintenance. : Butterworth-Heinemann;
[13] Clarke G, Mulyran G, Liggan P. 2010 Lean maintenance - A risk-based approach. Pharmaceutical Engineering; 30(5):10+12+14+1.
[14] Ayeni P, Baines T, Lightfoot H, Ball P. 2011State-of-the-art of ' Lean' in the aviation maintenance, repair, and overhaul industry. Proc Inst Mech Eng Pt B: J Eng Manuf; 225(11):2108.
[15] Ghayebloo S. 2010 Methodology and theory: Determining maintenance system requirements by viewpoint of reliability and lean thinking: A MODM approach. Journal of Quality in Maintenance Engineering; 16(1):89-106.
[16] Davies C, Greenough RM. 2003. Measuring the effectiveness of lean thinking activities within maintenance.
[17] Zwas A. 2006. Lean manufacturing techniques in bus and rail maintenance: Study at Chicago transit authority in Illinois. Transp Res Rec (1986):54-58.
[18] Tendayi TG. 2013. An Investigation into the Applicability of Lean Thinking in an Operational Maintenance Environment.

SAIIE25 Proceedings, 9th – 11th of July 2013, Stellenbosch, South Africa © 2013 SAIIE
554-12


![An Integrated QFD-TOPSIS Method for Prioritization of Major ......69 An integrated QFD-TOPSIS method for prioritization of ajor lean tools: a case study et al. [19] investigated the](https://static.fdocuments.in/doc/165x107/5f9a4974df9f7e323759560b/an-integrated-qfd-topsis-method-for-prioritization-of-major-69-an-integrated.jpg)


![Using QFD and AHP Tools in the Case...166 VOL. 48, No 1, 2020 FME Transactions 2.2 AHP tool AHP represents a tool for determining priority in relation to customer requirements [21].](https://static.fdocuments.in/doc/165x107/5e5fc41b1b88480d0e5c254f/using-qfd-and-ahp-tools-in-the-case-166-vol-48-no-1-2020-fme-transactions.jpg)