![[cla] 2011-2012 CLA INSTITUTIONAL REPORT...2011-2012 CLA Institutional Report 3 The Collegiate Learning Assessment (CLA) is a major initiative of the Council for Aid to Education.](https://static.fdocuments.in/doc/165x107/5ea0b63053e10568032c63c0/cla-2011-2012-cla-institutional-report-2011-2012-cla-institutional-report.jpg)
The Collegiate Learning Assessment (CLA)
24
The Collegiate Learning Assessment (CLA) Stephen Klein and Roger Benjamin June 12, 2008
-
Upload
deborah-wilder -
Category
Documents
-
view
28 -
download
0
description
The Collegiate Learning Assessment (CLA). Stephen Klein and Roger Benjamin June 12, 2008. Overview. Purposes of the CLA Limitations of other approaches CLA’s measures CLA’s distinguishing features Indices of test quality Value-added score reporting Research and development plans - PowerPoint PPT Presentation
Transcript of The Collegiate Learning Assessment (CLA)
The Collegiate Learning Assessment (CLA)
Stephen Klein and Roger Benjamin
June 12, 2008
6-12-08
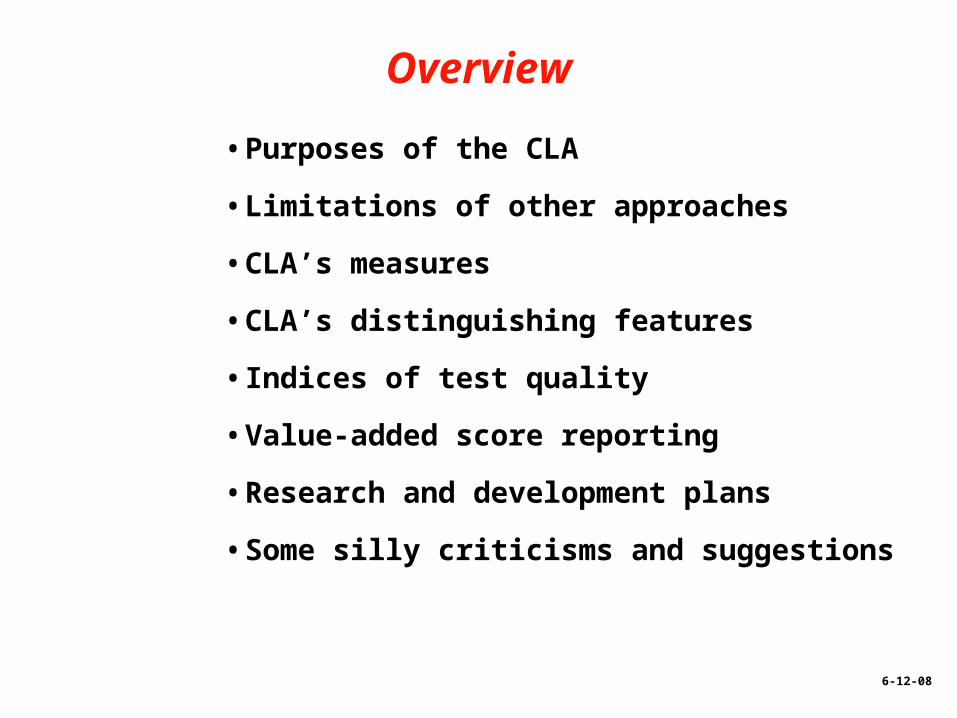
Overview
• Purposes of the CLA
• Limitations of other approaches
• CLA’s measures
• CLA’s distinguishing features
• Indices of test quality
• Value-added score reporting
• Research and development plans
• Some silly criticisms and suggestions

6-12-08
Purposes of the CLA
• Assess certain abilities that colleges and employers say are important– Critical thinking– Analytic reasoning– Problem solving– Writing skills
• Compare amount of improvement in these skills over time between:– Colleges after controlling for input– Programs within colleges
• Influence curriculum and instruction

6-12-08
Limitations of Other Assessment Methods
• Accreditation (only measures inputs)
• Actuarial indicators (Graduation rate, Access)
• US News & World Report reputational rankings rather than student learning and improvement
• NSSE (ambiguous choices for items that focus on “engagement” rather than learning)
• Subject matter tests – too many majors and too little agreement on what to measure within each
• Portfolios (very costly to score, unreliable grading, and no control for variation in task difficulty)

6-12-08
CLA’s Measures
• Analytic writing prompts– Make-an-argument (45 minutes)– Break-an-argument (30 minutes)
• Performance Tasks (90 minutes)
• Several tasks of each type
• All tasks are administered at all schools
• A student takes no more than one task per type

6-12-08
Make-An-Argument Prompt
“In our time, specialists of all kinds are highly overrated. We need more generalists – people who can provide broad perspectives.”
Directions: 45 Minutes, agree or disagree and explain the reasons for your position.
Answers graded on a few holistic scales.
6-12-08
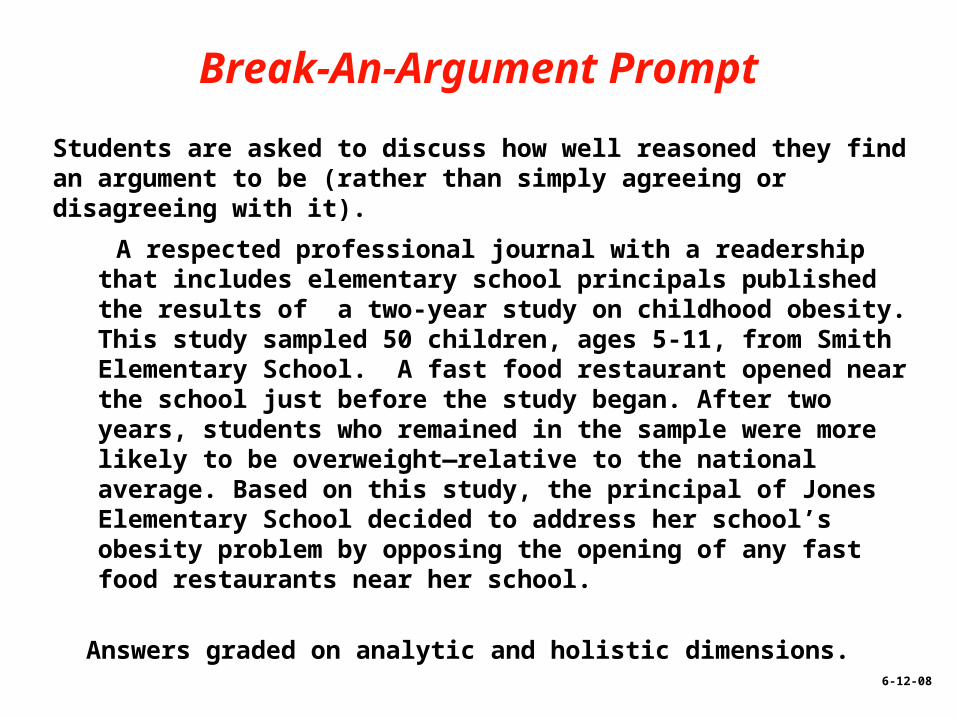
Break-An-Argument Prompt
Students are asked to discuss how well reasoned they find an argument to be (rather than simply agreeing or disagreeing with it).
A respected professional journal with a readership that includes elementary school principals published the results of a two-year study on childhood obesity. This study sampled 50 children, ages 5-11, from Smith Elementary School. A fast food restaurant opened near the school just before the study began. After two years, students who remained in the sample were more likely to be overweight—relative to the national average. Based on this study, the principal of Jones Elementary School decided to address her school’s obesity problem by opposing the opening of any fast food restaurants near her school.
Answers graded on analytic and holistic dimensions.
6-12-08
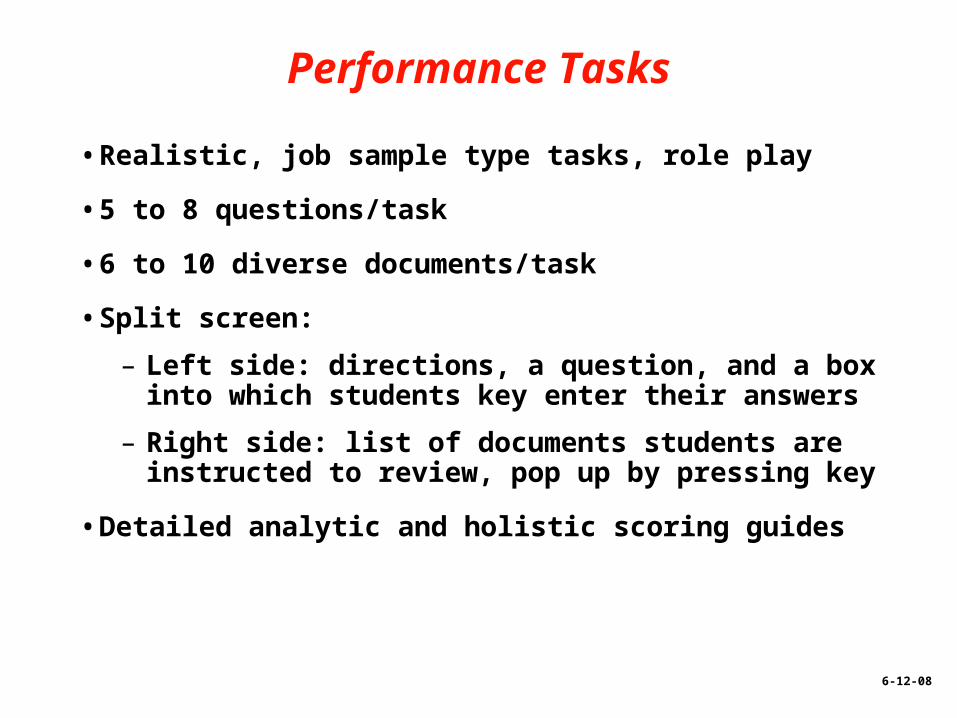
Performance Tasks
• Realistic, job sample type tasks, role play
• 5 to 8 questions/task
• 6 to 10 diverse documents/task
• Split screen:
– Left side: directions, a question, and a box into which students key enter their answers
– Right side: list of documents students are instructed to review, pop up by pressing key
• Detailed analytic and holistic scoring guides

6-12-08
CLA’s Distinguishing Features – Focus
• College mission statements guide skills tested
• Measure high level skills needed across majors
• Assess skills employers emphasize
• Report results in terms of value-added
– Improvement within a school over time(e.g., between freshmen and seniors)
– Improvement relative to students with comparable ability at other colleges

6-12-08
CLA Opposite of NCLB
• All colleges use the same tests and scoring rules
• Focus on improvement rather than percent achieving some arbitrary standard that varies across states
• Matrix sample tasks across students
• Participation is voluntary
• Provide realistic benchmarks against which to assess progress

6-12-08
CLA’s Distinguishing Features – Format
• All open-ended, constructed response tests
• Answers can be machine scored
• Analyses presently focused on schools and programs
• Matrix sampling of measures within schools
• Control for input (ACT/SAT scores from registrar)
• Paperless test administration and score reporting
• Use engaging “work samples” that assess an integrated combination of skills

6-12-08
Indices of Test Quality
• Validity
• Reliability
• Fairness
• Cost effectiveness

6-12-08
Validity
• Job sample tasks
• Matrix sampling reduces question/prompt specific variance
• Content validity vetted by students and faculty
• Positive correlations with college grades
• Construct validity (empirical study underway)
• Rapid increase in colleges adopting CLA
• Characteristics of participating schools are similar to those in the IPEDs national database
• Building the case for validity is a continuous process……….

6-12-08
Reliability
• Grading
– Inter-reader consistency
– Agreement between hand and machine assigned scores
• Test scores – split sample analyses – high correlations:
– School means on a task
– School difference (“residual”) scores within a grade
– School value-added scores across grades
• High correlations could not occur if scores were unreliable
• Results reported in peer reviewed national journals (see CAE website for details)

6-12-08
Fairness
• Standardized test administration and scoring
• Scores on different measures are converted to a common scale
• Differences in CLA scores among racial/ethnic groups disappear when control on SAT scores
• No systematic interaction of tasks with student demographic characteristics
• Controls for contextual effects and reader drift
6-12-08
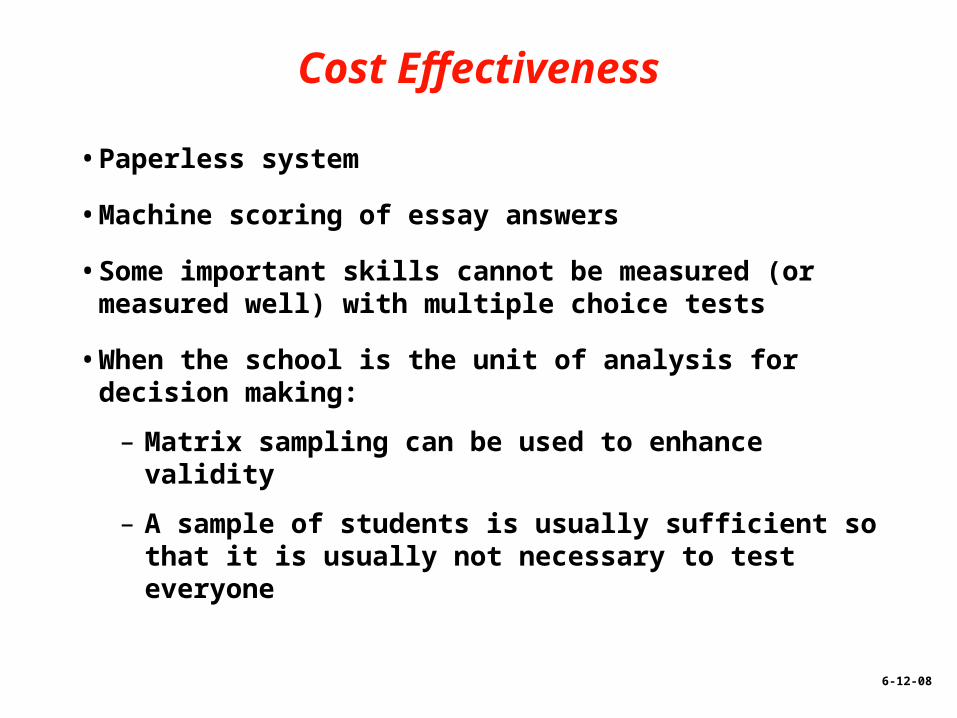
Cost Effectiveness
• Paperless system
• Machine scoring of essay answers
• Some important skills cannot be measured (or measured well) with multiple choice tests
• When the school is the unit of analysis for decision making:
– Matrix sampling can be used to enhance validity
– A sample of students is usually sufficient so that it is usually not necessary to test everyone

6-12-08
Value-Added Score Reporting
• Provides an estimate of a school’s contribution to student learning after controlling for input.
• Involves computing whether a school’s mean CLA score is higher or lower than what would be expected given (a) its mean SAT score and (b) the typical relationship between mean CLA and SAT scores among all the schools in the program.
• Facilitates measuring and interpreting the progress a school’s students made relative to comparable students at other colleges.
• Value added can be computed in different ways.

6-12-08
Research and Development Activities( A work in progress)
• Compare effects of different ways of computing value added.
• Conduct G-theory analyses to quantify amount of variance (measurement error) due to different sources.
• Investigate construct validity collaboratively with ACT and ETS.
• Explore whether task and prompt type interact with student background characteristics and academic major.
• Assess whether measures constructed from the same shell have more similar statistical properties than tasks created from other shells.
• Evaluate feasibility of extending the CLA to high schools, graduate schools, and colleges in other countries.
6-12-08
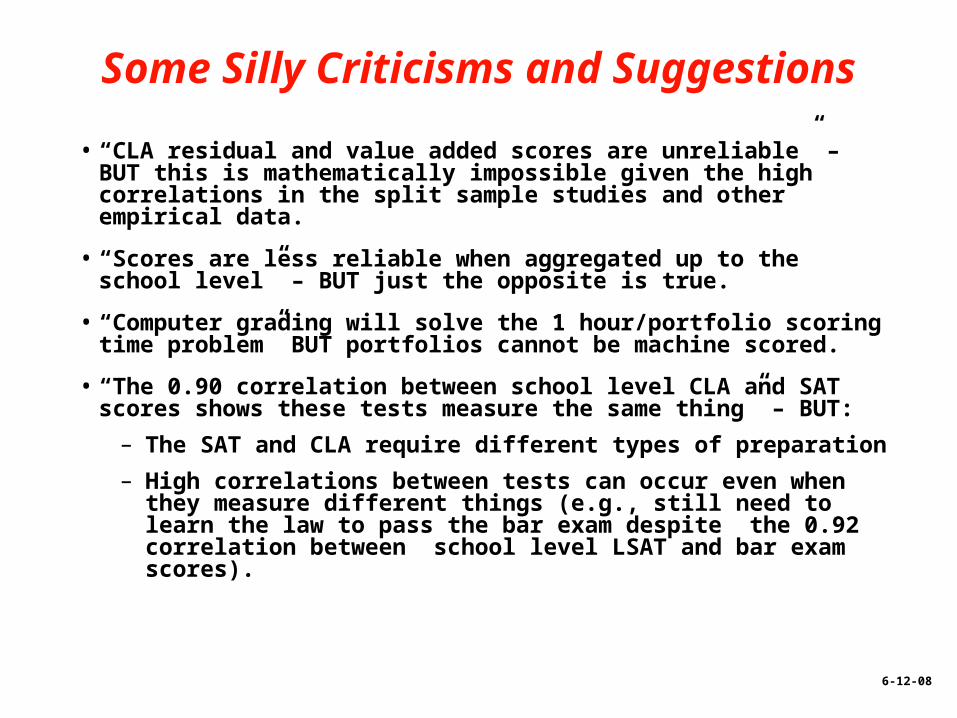
Some Silly Criticisms and Suggestions
• “CLA residual and value added scores are unreliable” – BUT this is mathematically impossible given the high correlations in the split sample studies and other empirical data.
• “Scores are less reliable when aggregated up to the school level” – BUT just the opposite is true.
• “Computer grading will solve the 1 hour/portfolio scoring time problem” BUT portfolios cannot be machine scored.
• “The 0.90 correlation between school level CLA and SAT scores shows these tests measure the same thing” – BUT:
– The SAT and CLA require different types of preparation
– High correlations between tests can occur even when they measure different things (e.g., still need to learn the law to pass the bar exam despite the 0.92 correlation between school level LSAT and bar exam scores).

6-12-08
Relationship of Mean LSAT to Passing Rate at California ABA Schools:
All July Exams Between 1995 - 2004 Combined
40%
50%
60%
70%
80%
90%
100%
145 150 155 160 165 170
Mean LSAT
% P
assi
ng

6-12-08
3 Methods for Computing Value-Added
• Linear regression using the school as the unit of analysis, the school’s mean SAT score as the sole predictor, and expected levels set by the standard error for the regression—this is the current method
• Linear regression using the student as the unit of analysis with the SAT and a dummy variable for each school as the predictors (and a separate standard error for each school)
• HLM treats students as nested within institutions with SAT as the student-level predictor (and a separate standard error for each school).
6-12-08
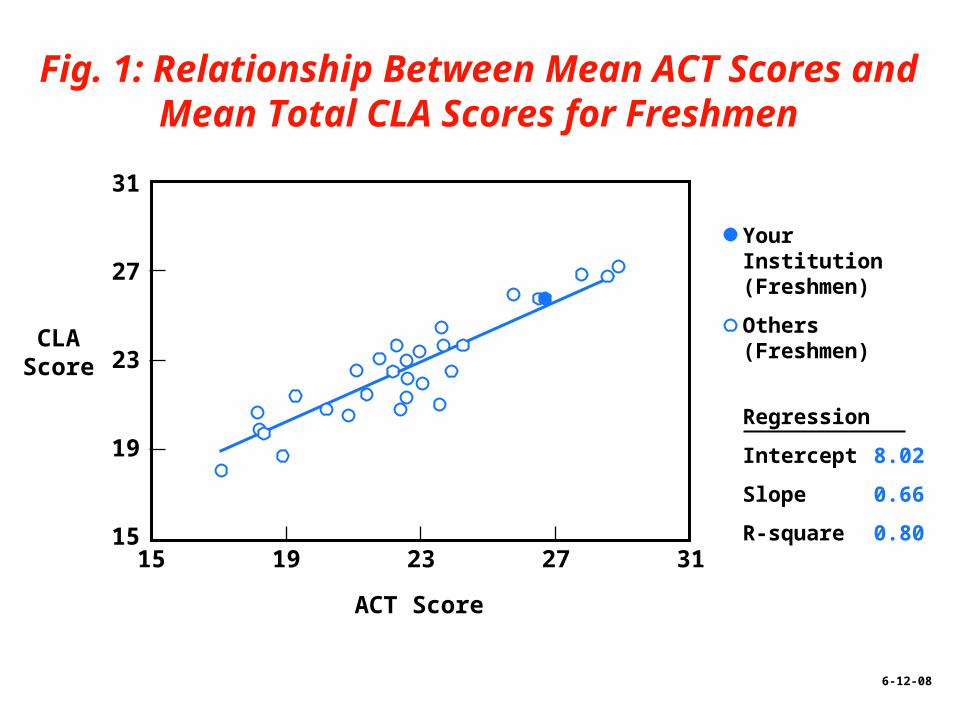
Fig. 1: Relationship Between Mean ACT Scores and Mean Total CLA Scores for Freshmen
31
27
23
19
1515 19 23 27 31
ACT Score
CLAScore
Your Institution (Freshmen)
Others (Freshmen)
Regression
Intercept 8.02
Slope 0.66
R-square 0.80

6-12-08
31
27
23
19
1515 19 23 27 31
ACT Score
CLAScore
Your Institution (Seniors)
Others (Seniors)
Regression
Intercept 11.96
Slope 0.62
R-square 0.75
Fig. 2: Relationship Between Mean ACT Scores and Mean Total CLA Scores for Seniors
6-12-08
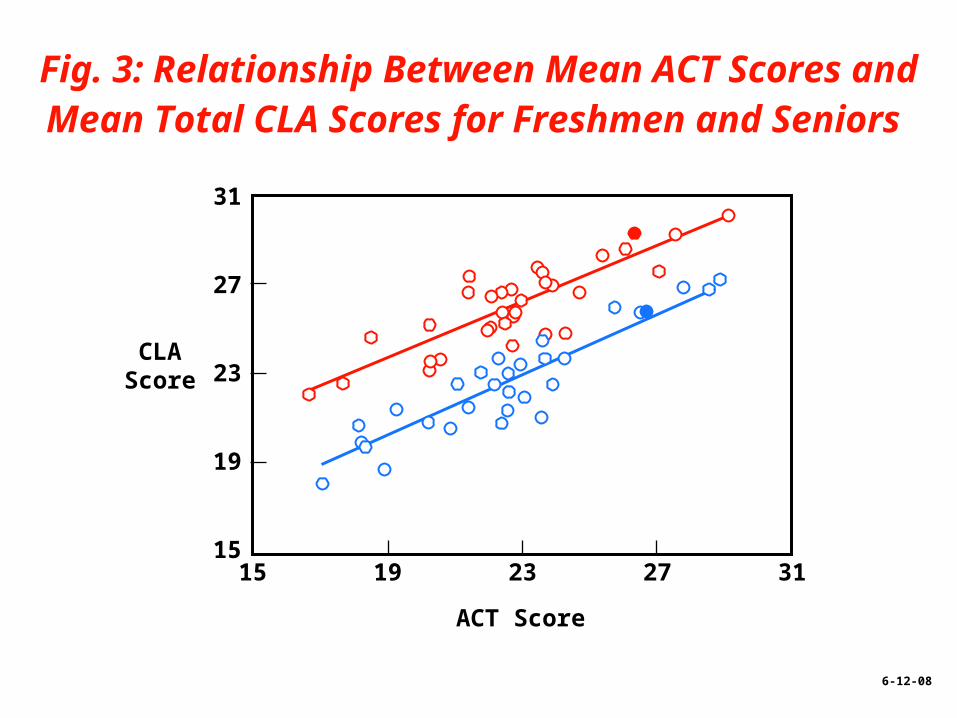
Fig. 3: Relationship Between Mean ACT Scores and Mean Total CLA Scores for Freshmen and Seniors
31
27
23
19
1515 19 23 27 31
ACT Score
CLAScore


![[cla] 2010-2011 CLA INSTITUTIONAL REPORT · technique known as hierarchical linear modeling (HLM).** Under this value-added methodology, a ... by the Community College Learning Assessment](https://static.fdocuments.in/doc/165x107/5ea649e4fa658e0b884221a9/cla-2010-2011-cla-institutional-report-technique-known-as-hierarchical-linear.jpg)
![Fall Faculty Workshop August 21, 2008 Assessment [CLA]](https://static.fdocuments.in/doc/165x107/56649c925503460f9494d912/fall-faculty-workshop-august-21-2008-assessment-cla.jpg)