The Collapse of Crude Oil Prices: How Low and For How … · ALVAREZ & MARSAL READINGS IN...
16
ALVAREZ & MARSAL READINGS IN QUANTITATIVE RISK MANAGEMENT The Collapse of Crude Oil Prices: How Low and For How Long? Part Two: Impacts on Lenders
Transcript of The Collapse of Crude Oil Prices: How Low and For How … · ALVAREZ & MARSAL READINGS IN...

ALVAREZ & MARSAL READINGS IN QUANTITATIVE RISK MANAGEMENT
The Collapse of Crude Oil Prices: How Low and For How Long?
Part Two: Impacts on Lenders

2 PART TWO: IMPACTS ON LENDERS
THE COLLAPSE OF CRUDE OIL PRICES:HOW LOW AND FOR HOW LONG?
INTRODUCTIONThe volatility of oil prices continues to wreak havoc within the global energy markets as oil exploration and production (E&P) companies, as well as the firms that provide oil field services (OFS), attempt to cope with the declining profits and share prices that have accompanied the historical decline in the price of crude oil. Many firms have undertaken significant restructurings, merged with other companies and/or initiated substantial layoffs of employees to attempt to offset the decline in revenues. Others have also struggled in their attempt to make payments on debt and a number have failed to do so.
This paper is the second in a two-part series that examines the impact of falling oil prices on E&P and OFS companies, lenders to energy companies, and the real estate markets in areas dominated by energy exploration, production and distribution. In Part One, we demonstrated that operating profits and share prices of E&P and OFS firms are closely correlated with crude oil prices, with the implication that default risk increases since declining profits mean reduced ability to service debt and declining share price means increased financial leverage in market value terms. Also in Part One, we showed that the value of real estate in energy-sensitive markets is tied to the price of oil; as oil prices decline, so does the value of real estate in those markets.
Bruce Stevenson | Managing Director | Alvarez & Marsal
2
In this second paper, we examine the implication of falling oil prices on default rates of energy companies and the implications for lenders to such firms. We conclude that default rates are inversely correlated with oil prices; as prices fall, default rates increase for the E&P and OFS companies with the impact of falling revenues and higher losses to their lenders. The mathematical association of changing oil prices to energy company default rates and losses to banks is so strong that lenders now have the capacity to predict the probability of default of energy companies as a function of oil prices. They also have the capacity to assess the impact of various scenarios of oil prices on default and loss rates and the implications to their own capital, a form of “stress testing.”
THE IMPORTANCE OF HYDRAULIC FRACTURINGThe United States has experienced a boom in domestic oil production since the turn of the millennium. The extensive commercial application of hydraulic fracturing (“fracking,” “hydrofracturing” or “hydrofracking”) was the single major factor for this growth. It grew faster than other sources of oil, as a result of the higher oil prices of the 2000s, accounting for 51 percent of crude oil production in the U.S at year-end 2015, up from less than two percent in 2000.1 Fracking has been a major source of the new jobs created in U.S. oil and gas production since the 2000s and before.
1 Source: U.S. Energy Information Administration. http://www.eia.gov/todayinenergy/detail.cfm?id=25372.

3THE COLLAPSE OF CRUDE OIL PRICES: HOW LOW AND FOR HOW LONG?
U.S. oil production from hydraulic fracturing is concentrated in the central states from North Dakota to Texas as well as Wyoming, Pennsylvania and Ohio where crude oil is locked up in extensive deposits of shale and other sedimentary rock. Oil is extracted from these deposits when the rock is fractured by a pressurized liquid called “fracking fluid,” consisting of water, sand and other proppants suspended with thickening agents, which is forced into a wellbore to create cracks in deep rock formations. From these cracks, natural gas and petroleum flow into the well head and are extracted and collected for future distillation.
The areas of greatest fracking activity have witnessed both the economic benefits from high and rising oil prices and the contraction that comes with the oil price collapse, as we noted in Part One. The Eagle Ford Shale region of southern Texas is a prime example. Oil and gas development in the Eagle Ford Shale is one of the largest economic developments in the history of the state of Texas and is one of the largest oil and gas developments in the world based on capital invested. Almost $30 billion was spent developing oil and gas in this region in 2013. The Eagle Ford had more than a $60 billion dollar impact on the local South Texas economy in 2012, resulting in the creation of over 116,000 jobs in
the 20 county area impacted by this development. The University of Texas at San Antonio estimated that in 2014, the Eagle Ford Shale region generated more than $87 billion in economic output, including 155,000 full-time jobs and $4.4 billion in tax revenues to the state and local governments.2
However, oil production in the Eagle Ford region peaked in March 2015 at 1.7 million barrels per day and has declined since. The Energy Information Agency estimated that production was 565,000 fewer barrels per day in March 2016.
FRACKING IS FINANCED WITH LARGE AMOUNTS OF DEBTThe rapid growth of hydraulic fracturing in the 2000s has been financed largely with debt as most U.S. firms involved in fracking invest more than they earn. Correspondingly, the amount of debt issued by energy companies grew exponentially from 2000 to 2015 (Figure 1). Small and mid-sized energy companies sold $241 billion of bonds from 2007 to 2015, the period of greatest issuance.
2 University of Texas at San Antonio Institute for Economic Development.
Figure 1: Debt Issued by Energy Companies in the U.S. Corporate Bond Market from 2000 to 2016.
$0
$50,000
$100,000
$150,000
$200,000
$250,000
0.0%
1.0%
2.0%
3.0%
4.0%
5.0%
6.0%
7.0%
8.0%
9.0%
2000 2001 2002 2003 2004 2005 2006 2007 2008 2009 2010 2011 2012 2013 2014 2015 2016
New
Issu
ance
of
Pu
blic
Deb
t ($
Mill
ion
s)
Wei
gh
ted
Ave
rag
e C
ou
po
n (
Wei
gh
ted
by
Off
erin
g A
mo
un
t)
U.S. Public Debt Markets Issuance of Debt by Energy Companies
2000 - 2016
Offering Amount ($MM) (right axis) Outstanding Amount ($MM) (right axis) Weighted Average Coupon (%) (left axis)

4 PART TWO: IMPACTS ON LENDERS
This debt generally is non-investment grade in quality with the nominal yield and default rates associated with high-yield debt. Energy companies accounted for 15 to 17 percent3 of all outstanding junk bonds at mid-year 2016, up from nine percent in 2009. Total energy junk bond debt exceeded $210 billion as of year-end 2014 and debt for listed E&P firms has nearly doubled since 2009. According to Standard & Poor’s (S&P), half of all debt issued by U.S. energy companies was rated below BBB- at the end of 2015.4
Energy companies also relied on bank debt to finance operations and acquisitions. In 2014, the energy sector accounted for 4.6 percent of outstanding leveraged loans, up from 3.1 percent a decade ago. However, since 2014, the bank loan market for energy companies has shrunk dramatically and the weakest E&P companies have found their lines of credit, financed as “borrowing base revolvers,” shrinking.
FRACKING IS A HIGH-COST SOURCE OF OIL PRODUCTIONSince the collapse of prices began in 2014, oil producers have taken significant steps to reduce the costs of oil production. Nevertheless, it is clear that fracking is a high-cost form of oil production and it emerged as a significant source of crude oil only after global oil prices made it profitable. For example, the most commonly quoted range of West Texas Intermediate (WTI) crude oil that represents the breakeven cost5 for shale oil wells in North America is $47 per barrel to $79 per barrel, above the current market price (e.g., $45.16 on July 20, 2016). Further, according to research from J.P. Morgan Asset Management, of the 12 largest shale oil basins in the U.S., 80 percent are barely profitable when WTI is below $80 per barrel. These estimates do not include interest payments on debt.6
3 Intelligent Money, “Today’s Junk Bond Market,” Volume 14 (1), February 25, 2015, www.havenfinancial.com/newsletter/intelligent Money Todays Junk Bond Market.pdf and Citi Fixed Income Indices, U.S. High-Yield Market Index, June 30, 2016, www.yieldbook.com/x/ixfactsheet_quarterly_hyi.pdf.4 www.standardandpoors.com.5 This per barrel breakeven cost includes exploration, drilling, extraction of oil and nine percent return on investment.6 The measurement of the breakeven costs of oil production is difficult and it remains a controversial subject, with at least three different concepts of breakeven costs (cash cost breakeven price which is an appropriate measure for individual oil producers and types of production, fiscal breakeven cost which is a statistic used to compare oil producing countries and marginal breakeven cost that attempts to measure the cost of the next barrel of oil for existing, operating wells). It is beyond the scope of this paper to attempt to add value to the debate about the costs of oil production.

THE COLLAPSE OF CRUDE OIL PRICES: HOW LOW AND FOR HOW LONG?
by some producers means much lower margins of error for their interest coverage ratios.
Alvarez & Marsal (A&M) estimates that the incidence of default on public debt issued by energy companies from 2000 to 2015 averaged 3.5 percent (weighted by commitments), consistent with the very high interest rates paid (average = 7.0%) and with historical default rates for non-investment grade issuers. However, default rates for U.S. energy companies are growing rapidly. In 2015, 42 oil and gas companies filed for bankruptcy, accounting for $17.85 billion in defaulted debt. The majority of these bankruptcies (both in number and exposure) occurred in the second half of the year, when oil prices were weakest.8 Of these bankruptcies, 29 energy companies also defaulted on their public debt, accounting for 26 percent of all corporate defaults (S&P) in 2015. According to Fitch Ratings, defaults topped 11 percent in December 2015, up from 0.5 percent in December 2014.
At the end of this report, we highlight the case of Sabine Oil and Gas Corporation, one of the E&P companies for which the sensitivity of operating profits to crude oil prices was highest and for which the combination of volatile profits and high financial ratios ultimately proved fatal.
5
As a consequence, E&P companies are closing down wells. As shown in Figure 2, there is a very close association between the price of WTI crude oil and the number of active rotary rigs used to extract oil and natural gas in the United States, especially since 2007. As the price of oil continues to fall and remain low, more and more rigs will be taken offline and remain idle. Whether the recent increase in oil prices leads to more wells coming back online remains to be seen. In addition, since 2014, both major and minor oil producing companies have cut back on new drilling and other capital expenditures.7
Revenues will naturally fall as these companies take rigs out of production and for those companies with high debt loads, default and bankruptcy become increasingly likely. For most major oil producers, lower operating profits and share prices will not lead to default, since even lower operating profits still cover interest expense, though their default probabilities (“expected default frequencies [EDFs]”) will increase. Lower equity prices also mean higher EDFs.
However, for small, more highly leveraged producers, lower operating profits can readily lead to default, since the debt coverage ratios are tight even at high oil prices. Heavy borrowing
Figure 2: Relationship of West Texas Intermediate Crude Oil Price and the Number of Active Rotary Oil and Gas Rigs in the U.S.
7 U.S. Oil and Gas E&P Companies Slash 2016 Capital Spending Plan, Leading (Finally) to Lower Production. S&P Global Market Intelligence, Global Credit Portal.8 Other counts of 2015 defaults ranged as high as 67 energy companies.
0
20
40
60
80
100
120
140
0
500
1000
1500
2000
2500N
um
ber
of
Act
ive
Rig
s
Oil and Gas Production in the United StatesNumber of Active Rotary Rigs and WTI Crude Oil Price
1991 - 2016
Number of Active Rigs
WTI Oil Price1Q
1991
4Q19
91
3Q19
92
2Q19
93
1Q19
94
4Q19
94
3Q19
95
2Q19
96
1Q19
97
4Q19
97
3Q19
98
2Q19
99
1Q20
00
4Q20
00
3Q20
01
2Q20
02
1Q20
03
4Q20
03
3Q20
04
2Q20
05
1Q20
06
4Q20
06
3Q20
07
2Q20
08
1Q20
09
4Q20
09
3Q20
10
2Q20
11
1Q20
12
4Q20
12
3Q20
13
2Q20
14
1Q20
15
4Q20
15
6 PART TWO: IMPACTS ON LENDERS
DEFAULTS BY ENERGY COMPANIES WILL GROW DRAMATICALLYThe major rating agencies are forecasting big increases in defaults among energy companies in 2016. Moody’s Investor Service has stated that energy companies have three times the financial stress of other U.S. corporates. Fitch published a report in March 2016 indicating that an additional $40 billion could default this year, leading to a sector-specific high-yield default rate of 20 percent (and at a rate of 30 percent to 35 percent by the end of the year). A report published by Deloitte indicated that as many as one-third of the world’s publicly-traded oil companies are at risk of default. S&P expects about six percent of all U.S. energy corporates to default in 2016.
A&M has developed mathematical models that predict the probability of default for commercial and industrial firms, including energy companies (see the case study at the end of this paper). One of our predictive models relates a company’s asset values to the value of its liabilities using option pricing theory to determine the firm’s “distance to default” and thus its default probability (so-called “structural” model). A second model analyzes company-level financial ratios to observed defaults using classic logistic regression from which the model predicts probabilities of default.
A key predictor variable in the logistic model is “EBIT (earnings before interest and taxes to revenues) margin.” As EBIT (a key measure of operating profits) falls for an energy company, that company’s default probability increases. As we showed in Part One, operating profits of E&P and OFS companies are closely correlated to oil prices and it is possible to mathematically predict EBIT and EBITDA (earnings before interest, taxes, depreciation and amortization) of these companies from oil prices. Consequently, one can estimate the default probability of these companies from today’s spot oil price and estimate default probabilities based upon scenarios of future oil prices.
These models enable forecasts of operating profits under a range of oil price scenarios as well as firm-specific default probabilities. Stress testing of default risk under a range of scenarios of oil prices allow for effective management in this volatile market. Because we anticipate that oil prices will remain low in 2016, operating profits for E&P and OFS companies will also remain low. For many of these companies, the operating profits will likely be insufficient to support debt service requirements and default rates will grow.

7THE COLLAPSE OF CRUDE OIL PRICES: HOW LOW AND FOR HOW LONG?
FINANCING FOR ENERGY COMPANIES BECOMES MORE DIFFICULT AND MORE EXPENSIVEAccess to the capital markets for energy companies has become very cautious and selective. The fall in energy prices has prompted a corresponding fall in the prices of high-yield debt issued by energy companies and an effective freeze on the issuance of new debt.9 In 1Q2016, the market value of non-defaulted high-yield bonds issued by U.S. energy companies fell to a mark of just 56 cents on the dollar, indicating that investors are expecting the observed trend of defaults to continue and to become more numerous. Yields on these energy bonds averaged 8.54 percent at the beginning of December 2015, up from 5.68 percent in June and the highest since July 2010. Premiums to comparable Treasuries exceed 750 basis points (bps).
Over the last 12 months, the S&P 500 Energy Corporate Bond Index has dropped by 11.6 percent. It is already down 1.84 percent year-to-date, and more defaults suggest further declines in the index. Similarly, the Bank of America Merrill Lynch High Yield Energy Bond Index closed in mid-January at a yield of 17.43 percent. Previously, the high was 17.05 percent posted on December 5, 2008, during the depths of the financial crisis. At
9 In February 2016, for example, no new energy debt was issued in the U.S. corporate bond market, according to Bloomberg. www.oilprice.com/energy/energy-general/bond-markets-loosing-faith-even-in-large-oil-companies.html.10 www.tcw.com/insights/monthly_commentary/01-06-16_loan_review.aspx
year-end 2015, the Credit Suisse Leveraged Loan Index was down 0.38 percent year-over-year and energy was the worst performing sector of that index, down 27.14 percent.10
Banks have been very reluctant to extend new loans to energy companies. As of January 2015, energy-related loans in the U.S. broadly-syndicated loan market became “stuck” and have not recovered. Instead, banks have heightened their attention to managing existing energy portfolios, focusing principally on exposures under borrowing base revolvers (reserve-based financing [RBF]) thus far. Under RBF, banks determine the market value of in-ground oil reserves and reset the legal commitment to the borrower based on the market value of pledged collateral. Under falling energy prices, borrowing bases shrink and borrowers must repay the difference between outstanding revolving credits and their smaller borrowing bases. In 2015, borrowing bases shrank by 15 percent to 20 percent; in 2016, reductions will likely be similar.
Anticipating significant cuts in their reserve-based revolvers, a number of energy companies drew down the full amount of their revolving credits in 1Q2016. Some of these drawdowns required repayments since the 2Q2016 borrowing base redeterminations

8 PART TWO: IMPACTS ON LENDERS
resulted in credit lines below the amount drawn. Further, banks have added “anti-hoarding” provisions to revised loan agreements to require borrowers to draw only what is needed for operations but not to fully draw for other purposes, such as to prepare for bankruptcy.
Borrowing base revolvers protect banks from energy-related losses only to a degree. Other companies, for which loans are not structured as borrowing base revolvers, are experiencing the same elevated probabilities of default and the actual defaults (non-accruals in bank accounting) without the protection of reduced exposures offered by RBF. And, of course, banks are reluctant to cut off all lending for fear of precipitating more defaults.
However, even in the absence of excessive tightening by lenders, the defaults or non-accruals have been rising. In Figure 3, we show the evolution of non-accruing loans and net charge-offs in the energy portfolio of Cullen/Frost Bankers. Cullen/Frost has its headquarters in San Antonio, not far from the Eagle Ford Shale region. Frost has been an active lender to energy companies throughout the southwest and its geographic footprint overlaps both the Eagle Ford and Permian Basin Shale oil regions. Consequently, it has both direct exposure to the default probabilities of energy companies and to the indirect impacts of falling energy prices on both individuals living in these areas and non-energy companies that will be adversely impacted by the resulting economic contraction.
In 2015, there was an enormous increase in non-accruing loans in Frost’s portfolio of loans to energy companies and a smaller, though still significant, increase in net charge-offs. This pattern
Figure 3: The Incidences of Non-Accruing Loans and Net Charge-offs for Cullen/Frost Bankers, Headquartered in San Antonio, Texas
corresponds quite closely with the very large increase in defaults among U.S. energy companies in 2015, reported by the major rating agencies.
Other U.S. banks reported similar increases in non-accruals and charge-offs at the end of 2015 and, consequently, they increased their loan loss reserves. Citigroup increased its reserves by $250 million in the fourth quarter of 2015 to protect against losses in its energy portfolio. At the same time and for the same reason, J.P. Morgan Chase added $124 million to its energy-related reserves and Bank of America added $264 million.
Even as banks become cautiously more conservative, they are being pushed to become more so by the regulators. In March 2016, the Office of the Comptroller of the Currency published an update to its manual on energy lending that establishes stricter guidelines for loans tied to future oil and gas production. One guideline calls for banks to classify a loan as substandard or worse if the borrower has debt more than four times EBITDA.
As we demonstrated in Part One, the EBITDA of E&P and OFS companies are strongly correlated with crude oil prices. If crude remains low, so will the EBITDA of these companies while their debt / EBITDA will increase and remain high, resulting in many such loans being downgraded to substandard and worse. According to the A&M default models, defaults should increase in 2016 and beyond.
-20
0
20
40
60
80
100
120
140
2011 2012 2013 2014 2015
bp
sCullen / Frost
Energy Loan PortfolioIncidence of Non-Accruing Loans and Net Charge-offs
Non-Accruing Loans / Total Loans
Net Charge-offs / Total Loans

9THE COLLAPSE OF CRUDE OIL PRICES: HOW LOW AND FOR HOW LONG?
10 PART TWO: IMPACTS ON LENDERS
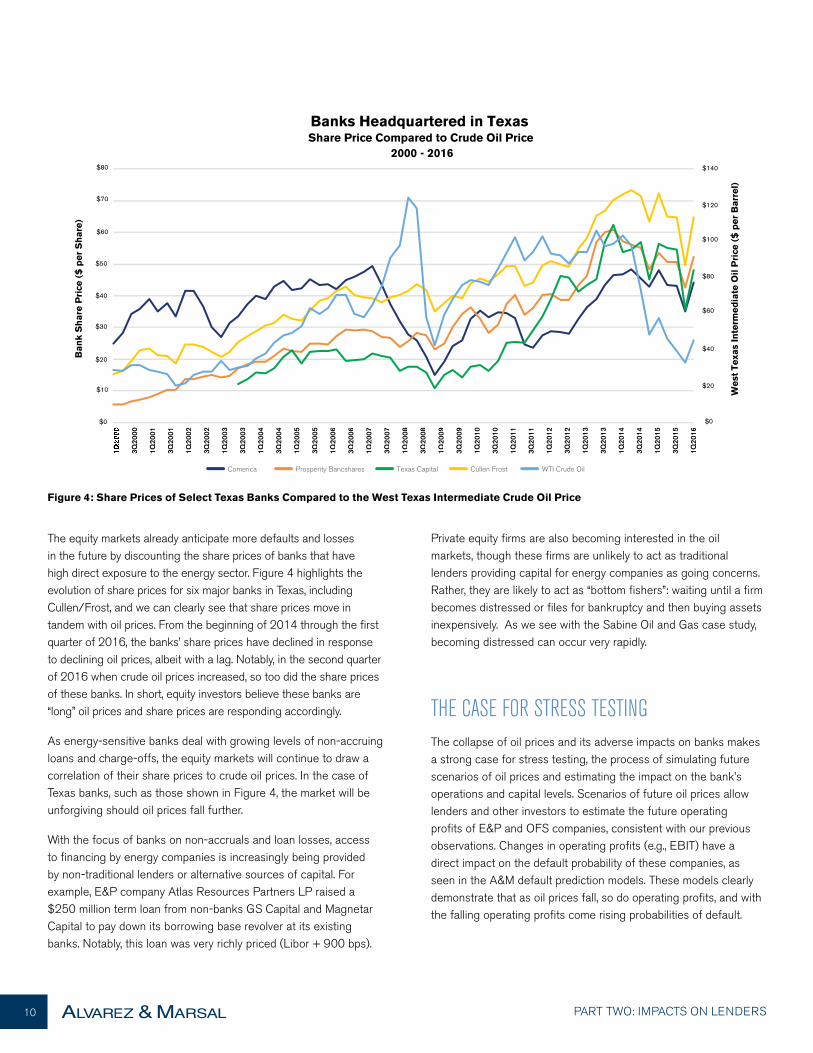
The equity markets already anticipate more defaults and losses in the future by discounting the share prices of banks that have high direct exposure to the energy sector. Figure 4 highlights the evolution of share prices for six major banks in Texas, including Cullen/Frost, and we can clearly see that share prices move in tandem with oil prices. From the beginning of 2014 through the first quarter of 2016, the banks’ share prices have declined in response to declining oil prices, albeit with a lag. Notably, in the second quarter of 2016 when crude oil prices increased, so too did the share prices of these banks. In short, equity investors believe these banks are “long” oil prices and share prices are responding accordingly.
As energy-sensitive banks deal with growing levels of non-accruing loans and charge-offs, the equity markets will continue to draw a correlation of their share prices to crude oil prices. In the case of Texas banks, such as those shown in Figure 4, the market will be unforgiving should oil prices fall further.
With the focus of banks on non-accruals and loan losses, access to financing by energy companies is increasingly being provided by non-traditional lenders or alternative sources of capital. For example, E&P company Atlas Resources Partners LP raised a $250 million term loan from non-banks GS Capital and Magnetar Capital to pay down its borrowing base revolver at its existing banks. Notably, this loan was very richly priced (Libor + 900 bps).
Private equity firms are also becoming interested in the oil markets, though these firms are unlikely to act as traditional lenders providing capital for energy companies as going concerns. Rather, they are likely to act as “bottom fishers”: waiting until a firm becomes distressed or files for bankruptcy and then buying assets inexpensively. As we see with the Sabine Oil and Gas case study, becoming distressed can occur very rapidly.
THE CASE FOR STRESS TESTINGThe collapse of oil prices and its adverse impacts on banks makes a strong case for stress testing, the process of simulating future scenarios of oil prices and estimating the impact on the bank’s operations and capital levels. Scenarios of future oil prices allow lenders and other investors to estimate the future operating profits of E&P and OFS companies, consistent with our previous observations. Changes in operating profits (e.g., EBIT) have a direct impact on the default probability of these companies, as seen in the A&M default prediction models. These models clearly demonstrate that as oil prices fall, so do operating profits, and with the falling operating profits come rising probabilities of default.
Figure 4: Share Prices of Select Texas Banks Compared to the West Texas Intermediate Crude Oil Price
Wes
t Te
xas
Inte
rmed
iate
Oil
Pri
ce (
$ p
er B
arre
l)
Ban
k S
har
e P
rice
($
per
Sh
are)
Banks Headquartered in TexasShare Price Compared to Crude Oil Price
2000 - 2016
Comerica Prosperity Bancshares Texas Capital Cullen Frost WTI Crude Oil
$0
$20
$30
$40
$50
$60
$70
$80
$10
$0
$20
$40
$60
$80
$100
$120
$140
3Q20
00
1Q20
01
3 Q20
01
1Q20
02
3Q20
02
1Q20
03
3Q20
03
1Q20
04
3Q20
04
1Q20
05
3 Q20
05
1Q20
06
3Q20
06
1Q20
07
3Q20
07
1Q20
08
3Q20
08
1Q20
09
3Q20
09
1Q20
10
3Q20
10
1Q20
11
3Q20
11
1 Q20
12
3Q20
12
1Q20
13
3Q20
13
1Q20
14
3Q20
14
1Q20
15
3 Q20
15
1 Q20
16
11THE COLLAPSE OF CRUDE OIL PRICES: HOW LOW AND FOR HOW LONG?
Banks that undertake such stress tests will be able to estimate the outcomes for their portfolios under a range of scenarios of oil prices and they will be better positioned to deal with the range of outcomes represented by these scenarios.
We began this two-part series with the observation that the question for these firms is not simply “how far will oil prices fall” or “how long will the decline last” but rather “how low and for how long?” The answers to these questions cannot be provided with certainty but the stress tests described above can provide a best estimate of the impact of both parts of the question.
CONCLUSIONSThe collapse of oil prices over the last two years has been of epic proportions and is the consequence of significant increases in the supply of crude oil, especially in the United States, coupled with falling demand and the strengthening of the U.S. dollar. The rapid increase in production capacity of crude oil in the U.S. and across the globe from the new technologies of fracking and horizontal drilling has largely been financed with debt, comprised of public bonds and private bank loans. This debt is now experiencing a wave of defaults that began in 2015 and this trend is likely to continue through 2016, exposing investors and lenders to significant losses.
Already, the capital markets are making it very difficult for energy companies to refinance that debt. New issues of public bonds, if available, are increasingly difficult and expensive and bank loans are even more difficult to obtain as lenders are focusing on managing the redeterminations of their reserve-based loans and adhering to more demanding regulatory requirements for classifying loans.
The operating profits of energy companies, particularly E&P firms and OFS companies, are strongly correlated with crude oil prices and it is possible to build mathematical models relating operating profits to oil prices. Such models permit forecasts of operating profits under different scenarios of future oil prices.
A&M has built separate mathematical models that predict the probability of default for energy companies that use EBIT margin as a key predictor variable. As EBIT margin shrinks, the probability of default increases. With the capacity to forecast EBIT as a function of oil prices and default probability as a function of EBIT, investors in debt issued by energy companies now have the capacity to test the credit risk of their energy portfolios under a range of scenarios for future oil prices, including the scenarios that are implied by the question: “collapsing oil prices – how low and for how long?”“
“ “
THE COLLAPSE OF OIL PRICES OVER THE LAST TWO YEARS HAS BEEN OF EPIC PROPORTIONS AND IS THE CONSEQUENCE OF SIGNIFICANT INCREASES IN THE SUPPLY OF CRUDE OIL, ESPECIALLY IN THE UNITED STATES, COUPLED WITH FALLING DEMAND AND THE STRENGTHENING OF THE U.S. DOLLAR.

12 PART TWO: IMPACTS ON LENDERS
CASE STUDY: SABINE OIL AND GAS CORPORATIONSabine Oil and Gas Corporation is an oil and gas E&P company headquartered in Houston, Texas. Since the early 1980s, it has been active in oil exploration and production, most recently focusing its operations in the Eagle Ford Shale region of South Texas, the Cotton Valley Sand and Haynesville Shale regions of East Texas, and the Granite Wash formation of North Texas. For reasons outlined below, Sabine Oil and Gas is a good example of the wave of defaults passing through the oil and gas industry.
Sabine filed for bankruptcy protection in July 2015 while owing a group of banks $1 billion in senior debt and a second group of banks $700 million of second-lien debt. At its bankruptcy date, Sabine also owed $350 million in unsecured notes due in 2017, $577 million in notes due in 2019 and about $222 million in notes due in 2020. In April 2015, Sabine missed an interest payment on the second lien loan and in June, it missed an interest payment on its senior notes.
As with all E&P companies, Sabine’s operating profits (EBITDA) are strongly correlated with crude oil prices, particularly from the collapse in oil prices in 2008 onward (Figure 5).
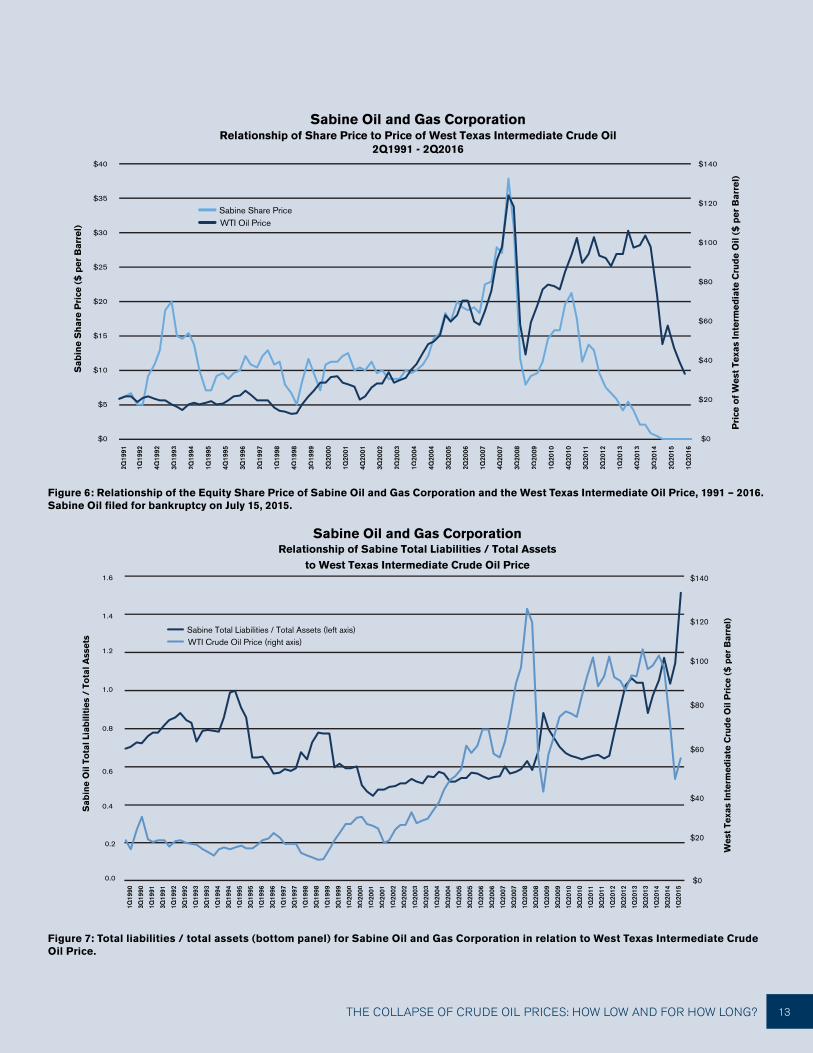
From the early 1990s, Sabine’s share price tracked WTI closely (with some volatility on the upside in the 1990s) until 2010 when the market turned sour on this company (Figure 6). That share price plummeted until mid-2014 when it fell below $1.00 per share.
One reason for the separation of Sabine’s share price from crude oil prices since 2010 was the increase in financial leverage in this period, most notably from 2012 onward (Figure 7). Clearly, with this increased leverage and the sensitivity of Sabine’s EBITDA to oil prices, equity investors discounted the firm’s share price due to the possibility of the firm being unable to repay its debt leaving few if any assets left for them. The downward acceleration in the firm’s share price came as falling oil prices put real pressure on the firm’s operating profits.
Figure 5: Earnings before interest, taxes, depreciation and amortization (EBITDA) for Sabine Oil and Gas Corporation in relation to West Texas Intermediate Crude Oil Price.
Wes
t Te
xas
Inte
rmed
iate
Cru
de
Oil
Pri
ce (
$ p
er B
arre
l)
$0
$20
$40
$60
$80
$100
$120
$1401Q
1991
4Q19
91
3Q19
92
2Q19
93
1Q19
94
4Q19
94
3Q19
95
2Q19
96
1Q19
97
4Q19
97
3Q19
98
2Q19
99
1Q20
00
4Q20
00
3Q20
01
2Q20
02
1Q20
03
4Q20
03
3Q20
04
2Q20
05
1Q20
06
4Q20
06
3Q20
07
2Q20
08
1Q20
09
4Q20
09
3Q20
10
2Q20
11
1Q20
12
4Q20
12
3Q20
13
2Q20
14
1Q20
15
4Q20
15
2Q19
90 8
4Q20
09
1Q20
15
3Q20 20
11 12
Q20
12
-$3,500
-$3,000
-$2,500
-$2,000
-$1,500
-$1,000
-$500
$0
$500
$1,000
$1,500
Sab
ine
Ear
nin
gs
Bef
ore
Inte
rest
, Tax
es, D
epre
ciat
ion
an
d A
mo
rtiz
atio
n($
Mill
ion
s)
Sabine Oil and Gas CorporationRelationship of Earnings Before Interest, Taxes, Depreciation and Amortization
to West Texas Intermediate Crude Oil Price
Sabine EBITDA (left axis)
WTI Crude Oil Price (right axis)
13THE COLLAPSE OF CRUDE OIL PRICES: HOW LOW AND FOR HOW LONG?
Figure 6: Relationship of the Equity Share Price of Sabine Oil and Gas Corporation and the West Texas Intermediate Oil Price, 1991 – 2016. Sabine Oil filed for bankruptcy on July 15, 2015.
Figure 7: Total liabilities / total assets (bottom panel) for Sabine Oil and Gas Corporation in relation to West Texas Intermediate Crude Oil Price.
Pri
ce o
f W
est
Texa
s In
term
edia
te C
rud
e O
il ($
per
Bar
rel)
$0
$20
$40
$60
$80
$100
$120
$140
Sab
ine
Sh
are
Pri
ce (
$ p
er B
arre
l)
Sabine Oil and Gas CorporationRelationship of Share Price to Price of West Texas Intermediate Crude Oil
2Q1991 - 2Q2016
Sabine Share PriceWTI Oil Price
$0
$5
$10
$15
$20
$25
$30
$40
$35
1Q19
92
4Q19
92
3Q19
93
2Q19
94
1Q19
95
4Q19
95
3Q19
96
2Q19
97
1Q19
98
4Q19
98
3Q19
99
2Q20
00
1Q20
01
4Q20
01
3Q20
02
2Q20
03
1Q20
04
4Q20
04
3Q20
05
2Q20
06
1Q20
07
4Q20
07
3Q20
08
2Q20
09
1Q20
10
4Q20
10
3Q20
11
2Q20
12
1Q20
13
4Q20
13
3Q20
14
2Q20
15
1Q20
16
2Q19
91
Wes
t Te
xas
Inte
rmed
iate
Cru
de
Oil
Pri
ce (
$ p
er B
arre
l)
$0
$20
$40
$60
$80
$100
$120
$140
Sab
ine
Oil
Tota
l Lia
bili
ties
/ T
ota
l Ass
ets
Sabine Oil and Gas CorporationRelationship of Sabine Total Liabilities / Total Assets
to West Texas Intermediate Crude Oil Price
Sabine Total Liabilities / Total Assets (left axis)WTI Crude Oil Price (right axis)
0.2
0.4
0.6
0.8
1.0
1.2
1.4
1.6
0.0
1Q19
90
3Q19
90
1Q19
91
3Q19
91
1Q19
92
3Q19
92
1Q19
93
3Q19
93
1Q19
94
3Q19
94
1Q19
95
3Q19
95
1Q19
96
3Q19
96
1Q19
97
3Q19
97
1Q19
98
3Q19
98
1Q19
99
3Q19
99
1Q20
00
3Q20
00
1Q20
01
3Q20
01
1Q20
02
3Q20
02
1Q20
03
3Q20
03
1Q20
04
3Q20
04
1Q20
05
3Q20
05
1Q20
06
3Q20
06
1Q20
07
3Q20
07
1Q20
08
3Q20
08
1Q20
09
3Q20
09
1Q20
10
3Q20
10
1Q20
11
3Q20
11
1Q20
12
3Q20
12
1Q20
13
3Q20
13
1Q20
14
3Q20
14
1Q20
15

14 PART TWO: IMPACTS ON LENDERS
A&M has applied its default prediction models to this bankruptcy to determine the pattern of default probabilities in the years leading up to default. A&M has two such models: (1) a logistic regression model that relates company financial ratios to observed defaults and non-defaults in six industry sectors and (2) a “structural” model that relates the market value of the assets of a publicly-traded company to the market value of the firm’s liabilities to determine the distance to default and, hence, its default probability.
Between 2010 and 2014, Sabine’s default probability (as estimated by A&M proprietary models) generally ranged between 2.8 percent and 6.7 percent per year, consistent with issuers of non-investment grade debt (Figure 8). The weakening of its operations due to falling oil prices, coupled with increased financial leverage, is reflected in the upward trend in its probability of default (PD) until the models confirm default in the second half of 2015.
Figure 8: Two Model-Based Estimates of the Probability of Default for Sabine Oil and Gas Corporation from 2010 to 2015.
The bankruptcy proceedings for Sabine could significantly impact default rates in the future. The presiding judge has ruled that bankruptcy law permits Sabine to cancel contracts it holds with midstream firms on the company’s petroleum licenses in Texas. Sabine held three separate contracts with pipeline firms in Texas for the transport and sale of oil and gas produced by Sabine under “deliver or pay” features. Under such contracts, Sabine must pay these companies regardless of levels of oil production. The judge’s ruling likely allows Sabine to cancel these contracts. If so, other troubled E&P companies may be more likely to enter bankruptcy to cancel such contracts with possible increases in default rates of midstream companies as well.
0%
10%
20%
30%
40%
50%
60%
70%
80%
90%
100%
Structural Model of Default Logistic Regression Model of Default
Pro
bab
ility
of
Def
ault
ove
r N
ext
12 M
on
ths
(%)
Sabine Oil and Gas Corporation
A&M Models of Default Probability
1H2010 2H2010 1H2011 2H2011 1H2012 2H2012 1H2013 2H2013 1H2014 2H2014 1H2015 2H2015
Probability of Default

15THE COLLAPSE OF CRUDE OIL PRICES: HOW LOW AND FOR HOW LONG?

PART TWO: IMPACTS ON LENDERS
Companies, investors and government entities around the world turn to Alvarez & Marsal (A&M) when conventional approaches are not enough to activate change and achieve results.
Privately-held since 1983, A&M is a leading global professional services firm that delivers performance improvement, turnaround management and business advisory services to organizations seeking to transform operations, catapult growth and accelerate results through decisive action. Our senior professionals are experienced operators, world-class consultants and industry veterans who draw upon the firm’s restructuring heritage to help leaders turn change into a strategic business asset, manage risk and unlock value at every stage.
For more information, visit www.alvarezandmarsal.com.
© 2016 Alvarez & Marsal Holdings, LLC. All rights reserved.
Follow us on:
LEADERSHIP.
PROBLEM SOLVING.
VALUE CREATION.
Bruce Stevenson is a Managing Director with A&M in New York, with more than 27 years of experience in applying quantitative technology to challenges within the financial services industry. He has a unique blend of experience developing analytical solutions within banks and as a financial services consultant.
An industry thought-leader, Mr. Stevenson has published nearly 20 papers on risk management, portfolio management and quantitative analytics in lending and risk management journals.
Bruce G. StevensonManaging DirectorAlvarez & MarsalFinancial Industry Advisory Services, LLC600 Madison AvenueNew York, New York 100221-212-328-8595 (Office)1-917-565-2593 (Mobile)