THE COGNITIVE AND AFFECTIVE ANTECEDENTS TO CONSUMER ...
152
The American University in Cairo School of Global Affairs and Public Policy THE COGNITIVE AND AFFECTIVE ANTECEDENTS TO CONSUMER BEHAVIOR TOWARDS ON-DEMAND TRANSPORTATION SERVICES IN EGYPT A Thesis Submitted To The Department of Journalism and Mass Communication In partial fulfillment of the requirements for the Degree of Master of Arts By Islam Nasser Salah Eldin Asaad Under the supervision of Dr. Ahmed Taher December 2018
Transcript of THE COGNITIVE AND AFFECTIVE ANTECEDENTS TO CONSUMER ...

The American University in Cairo
School of Global Affairs and Public Policy
THE COGNITIVE AND AFFECTIVE ANTECEDENTS TO
CONSUMER BEHAVIOR TOWARDS ON-DEMAND
TRANSPORTATION SERVICES IN EGYPT
A Thesis Submitted To
The Department of Journalism and Mass Communication
In partial fulfillment of the requirements for
the Degree of Master of Arts
By Islam Nasser Salah Eldin Asaad
Under the supervision of Dr. Ahmed Taher
December 2018

ii
ACKNOWLEDGEMENTS
In this page, I would like to grasp the opportunity to present and extend my sincerest gratitude
which I owe to all the people who supported and encouraged me in this thesis study in particular
and my life in general…
This thesis study would have never been achievable without the continuous encouragement,
support, advice, and patient guidance of Dr. Ahmed Taher, who wasn't only my thesis
supervisor but also my role model in the academic and marketing fields. I have been honored
and lucky to have such a helpful supervisor who was worried a lot about my thesis and
responded immediately to my queries and questions. I would also like to thank Dr. Hesham
Dinana as well as Dr. Ashraf Tawakkol, my committee readers of this thesis for giving me their
valuable thoughts, feedback and precious time.
Equally, I will not forget the fantastic people of AUC, who gave me their limitless experience
and knowledge starting from Dr. Naila Hamdy, Dr. Marvet Abou Oaf, and Dr. Hussein Amin
as well as all the team of the JRMC department and special thanks to Nesrine Azmy and Mr.
Amr Abdel Latif for their keen assistance. Also, thanks to all my supportive friends at AUC
specially Yasmine Kasseb and Mohamed Gameel.
To my lovely and amazing family, my father Nasser Asaad, my mother Eman Youssef, and my
younger sister Nourhan, no words can describe how much I feel now and how much I owe you
all.
To my backbone and future wife Zainabe El Nachaby, I sincerely appreciate your endless care,
love, and encouragement in completing this thesis, I am really so lucky to have you in my life.
As for my best and lifetime friends, who assisted me in making this thesis possible, I would
warmly thank John Adel, Ahmed Ezz, Ramy Raafat, Abanoub Soliman, and Mazen Gawish.
Similarly, I will not also forget my work colleagues and friends who give me an extra mileage
in completing this study; accordingly, I would like to thank Dr. Ibtessam ElGindy, Dean of
Mass Communication Faculty, Dr. Lamees ElBaghdady, Director of Learning & Quality and
all my MSA friends in B121 Monia Moshen, Engy Atef, Nadine El Abby, Mariam Amer, Dina
Younis, Mariam Selim, Farrah Shawki, and Hassan Marrie. Besides, special thanks to Marry
Habib, Shaden Kamel, and all MSA Team.
iii
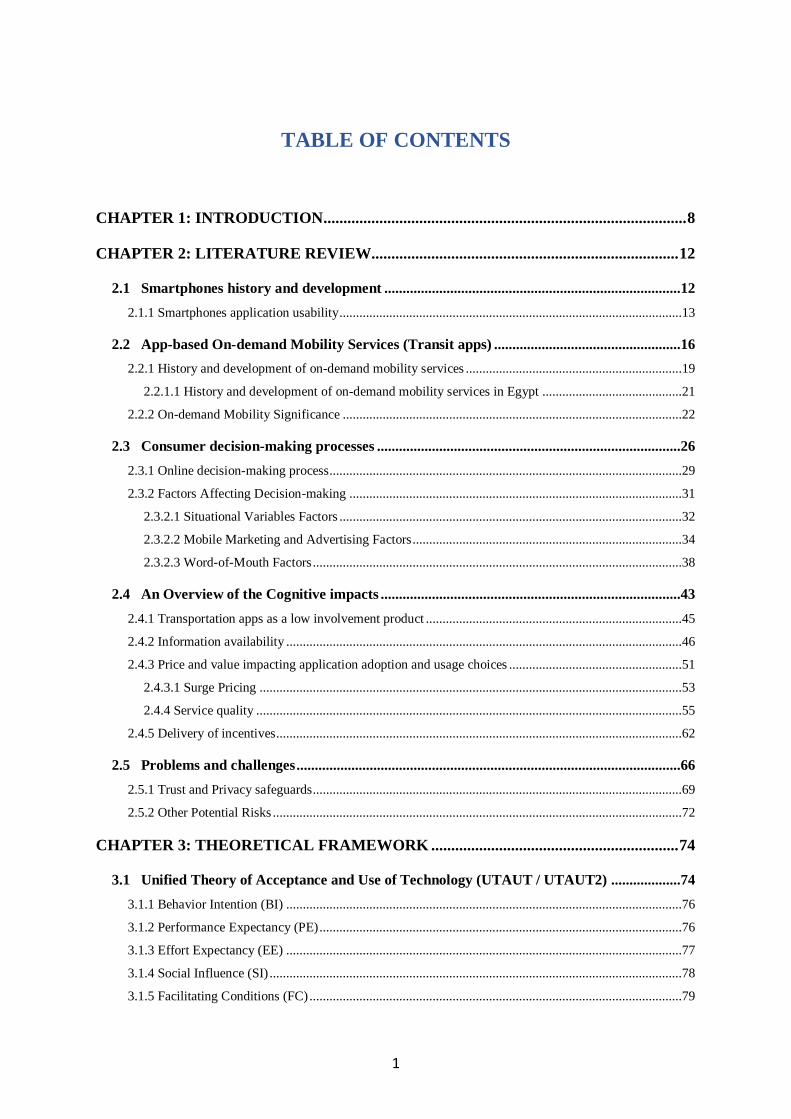
ABSTRACT
In the recent few years, smartphones have shaped and assisted in the creation of new business
models to formulate and develop some additional dimensions such as shared-economy or
shared-mobility. Since transportation is one of the most essential aspects of shared-economy,
it is vital to this study to focus and investigate the consumers’ intention to use the new
commuting services provided by Transportation Network Companies (TNCs) in Egypt.
Consequently, this research aims to examine and understand the cognitive and affective
antecedents to consumers’ behavior towards TNCs in Egypt. Therefore, the model of the
Unified Theory of Acceptance and Use of Technology (UTAUT2) has been applied to
understand and explain the factors that influence the behavioral intention (BI) to use TNCs
services. The factors of Performance Expectancy (PE), Effort Expectancy (EE), Social
Influence (SI), Facilitating Conditions (FC), Hedonic Motivation (HM), Price Value (PV), and
Habit (HT) tested through surveying 200 respondents thru online (Google Forms) and offline
(Self-Administered Questionnaires) techniques. The results showed that consumers’ intention
to use TNCs services in Egypt, was positively affected by the factors of (performance
expectancy, social influence, price value, and habit). However, the variables of (effort
expectancy, facilitating conditions, and hedonic motivation) showed a negative influence on
the intention to use TNCs services in Egypt. Thus, upon the evaluation of the gathered data and
discovered findings, the market acceptance and share of TNCs services can be increased if
these services considered the factors affecting the consumers' intention that mentioned earlier.
Keywords: Shared-economy, Shared-mobility, On-demand Mobility, On-demand
Transportation Services, Transportation Network Companies, TNCs, Ride-sourcing
Companies, UTAUT2.
1
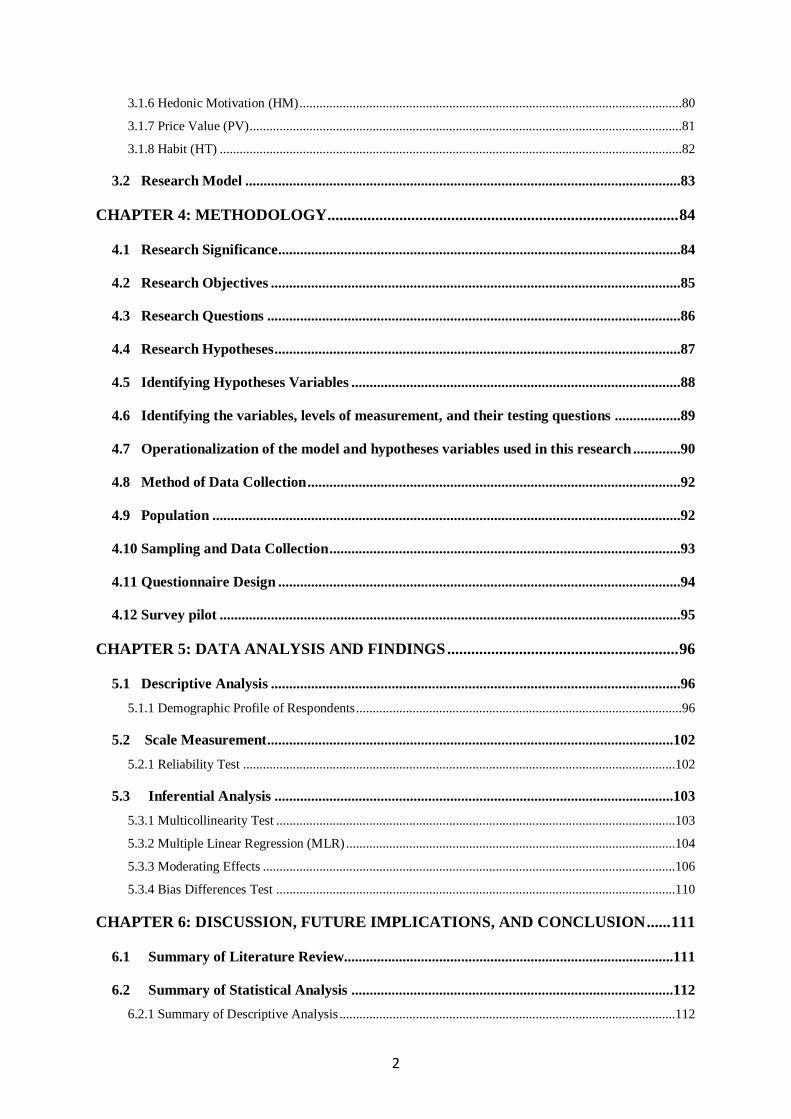
TABLE OF CONTENTS
CHAPTER 1: INTRODUCTION ........................................................................................... 8
CHAPTER 2: LITERATURE REVIEW............................................................................. 12
2.1 Smartphones history and development .................................................................................12
2.1.1 Smartphones application usability .......................................................................................................13
2.2 App-based On-demand Mobility Services (Transit apps) ...................................................16
2.2.1 History and development of on-demand mobility services .................................................................19
2.2.1.1 History and development of on-demand mobility services in Egypt ..........................................21
2.2.2 On-demand Mobility Significance ......................................................................................................22
2.3 Consumer decision-making processes ...................................................................................26
2.3.1 Online decision-making process ..........................................................................................................29
2.3.2 Factors Affecting Decision-making ....................................................................................................31
2.3.2.1 Situational Variables Factors .......................................................................................................32
2.3.2.2 Mobile Marketing and Advertising Factors .................................................................................34
2.3.2.3 Word-of-Mouth Factors ...............................................................................................................38
2.4 An Overview of the Cognitive impacts ..................................................................................43
2.4.1 Transportation apps as a low involvement product .............................................................................45
2.4.2 Information availability .......................................................................................................................46
2.4.3 Price and value impacting application adoption and usage choices ....................................................51
2.4.3.1 Surge Pricing ...............................................................................................................................53
2.4.4 Service quality ................................................................................................................................55
2.4.5 Delivery of incentives ..........................................................................................................................62
2.5 Problems and challenges .........................................................................................................66
2.5.1 Trust and Privacy safeguards ...............................................................................................................69
2.5.2 Other Potential Risks ...........................................................................................................................72
CHAPTER 3: THEORETICAL FRAMEWORK .............................................................. 74
3.1 Unified Theory of Acceptance and Use of Technology (UTAUT / UTAUT2) ...................74
3.1.1 Behavior Intention (BI) .......................................................................................................................76
3.1.2 Performance Expectancy (PE) .............................................................................................................76
3.1.3 Effort Expectancy (EE) .......................................................................................................................77
3.1.4 Social Influence (SI) ............................................................................................................................78
3.1.5 Facilitating Conditions (FC) ................................................................................................................79
2
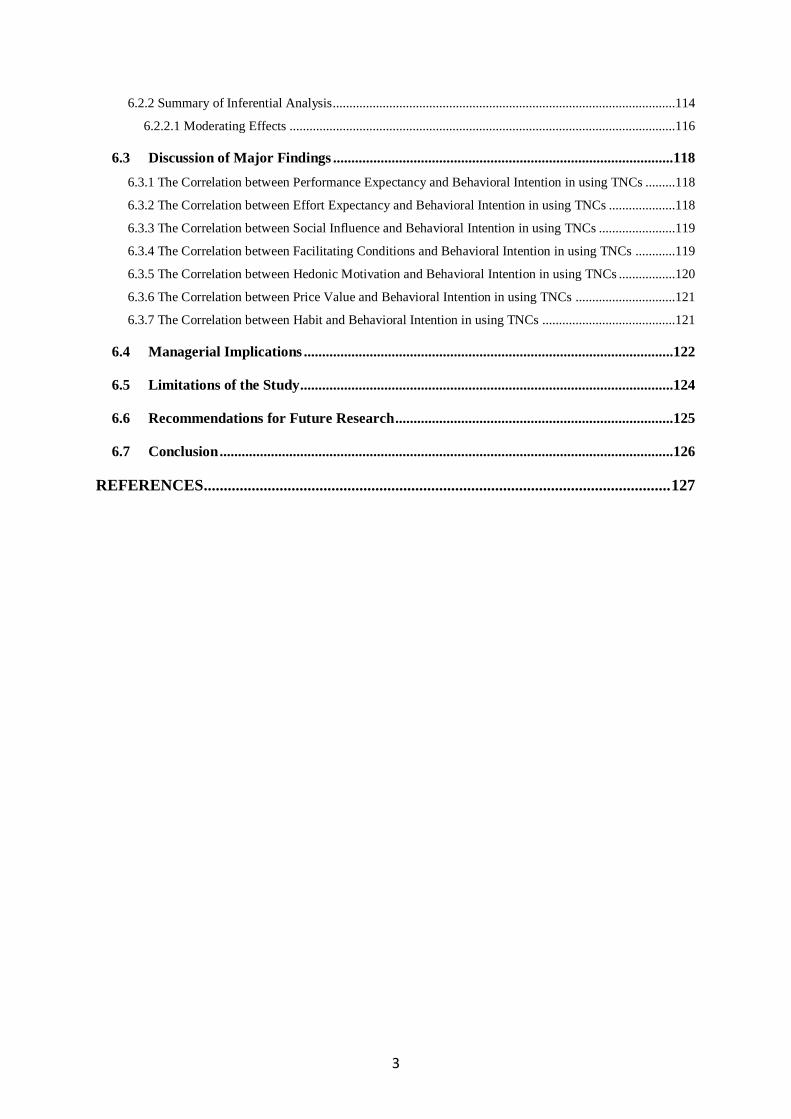
3.1.6 Hedonic Motivation (HM) ...................................................................................................................80
3.1.7 Price Value (PV) ..................................................................................................................................81
3.1.8 Habit (HT) ...........................................................................................................................................82
3.2 Research Model .......................................................................................................................83
CHAPTER 4: METHODOLOGY........................................................................................ 84
4.1 Research Significance..............................................................................................................84
4.2 Research Objectives ................................................................................................................85
4.3 Research Questions .................................................................................................................86
4.4 Research Hypotheses ...............................................................................................................87
4.5 Identifying Hypotheses Variables ..........................................................................................88
4.6 Identifying the variables, levels of measurement, and their testing questions ..................89
4.7 Operationalization of the model and hypotheses variables used in this research .............90
4.8 Method of Data Collection ......................................................................................................92
4.9 Population ................................................................................................................................92
4.10 Sampling and Data Collection ................................................................................................93
4.11 Questionnaire Design ..............................................................................................................94
4.12 Survey pilot ..............................................................................................................................95
CHAPTER 5: DATA ANALYSIS AND FINDINGS .......................................................... 96
5.1 Descriptive Analysis ................................................................................................................96
5.1.1 Demographic Profile of Respondents ..................................................................................................96
5.2 Scale Measurement...............................................................................................................102
5.2.1 Reliability Test ..................................................................................................................................102
5.3 Inferential Analysis .............................................................................................................103
5.3.1 Multicollinearity Test ........................................................................................................................103
5.3.2 Multiple Linear Regression (MLR) ...................................................................................................104
5.3.3 Moderating Effects ............................................................................................................................106
5.3.4 Bias Differences Test ........................................................................................................................110
CHAPTER 6: DISCUSSION, FUTURE IMPLICATIONS, AND CONCLUSION ...... 111
6.1 Summary of Literature Review..........................................................................................111
6.2 Summary of Statistical Analysis ........................................................................................112
6.2.1 Summary of Descriptive Analysis .....................................................................................................112
3
6.2.2 Summary of Inferential Analysis .......................................................................................................114
6.2.2.1 Moderating Effects ....................................................................................................................116
6.3 Discussion of Major Findings .............................................................................................118
6.3.1 The Correlation between Performance Expectancy and Behavioral Intention in using TNCs .........118
6.3.2 The Correlation between Effort Expectancy and Behavioral Intention in using TNCs ....................118
6.3.3 The Correlation between Social Influence and Behavioral Intention in using TNCs .......................119
6.3.4 The Correlation between Facilitating Conditions and Behavioral Intention in using TNCs ............119
6.3.5 The Correlation between Hedonic Motivation and Behavioral Intention in using TNCs .................120
6.3.6 The Correlation between Price Value and Behavioral Intention in using TNCs ..............................121
6.3.7 The Correlation between Habit and Behavioral Intention in using TNCs ........................................121
6.4 Managerial Implications .....................................................................................................122
6.5 Limitations of the Study......................................................................................................124
6.6 Recommendations for Future Research ............................................................................125
6.7 Conclusion ............................................................................................................................126
REFERENCES ..................................................................................................................... 127
4
LIST OF TABLES
Table 4.1: Variables and their level of measurement .............................................................. 89
Table 4.2: Variables and their definitions ................................................................................ 90
Table 5.1: Gender Categorization ............................................................................................ 96
Table 5.2: Age Categorization ................................................................................................. 97
Table 5.3: Respondents who are Using TNCs ......................................................................... 98
Table 5.4: Payment Method ..................................................................................................... 99
Table 5.5: Respondents Usage Rate ...................................................................................... 100
Table 5.6: Respondents Experience ....................................................................................... 101
Table 5.7: Reliability Statistics .............................................................................................. 102
Table 5.8: Pearson Correlation Coefficients .......................................................................... 103
Table 5.9: Model Summary ................................................................................................... 104
Table 5.10: ANOVA of MLR for Behavioral Intention (BI) ................................................ 104
Table 5.11: Parameter Estimates of the Constructs ............................................................... 105
Table 5.12: Gender T-Test Summary .................................................................................... 106
Table 5.13: Age ANOVA Summary...................................................................................... 107
Table 5.14: Payment Method T-Test Summary..................................................................... 107
Table 5.15: Usage Rate ANOVA Summary .......................................................................... 108
Table 5.16: Usage Experience ANOVA Summary ............................................................... 109
Table 5.17: Bias Differences T-Test ...................................................................................... 110
Table 6.1: Summary of the demographic profiles’ results ..................................................... 112
Table 6.2: Summary of the Inferential Analysis .................................................................... 114
Table 6.3: Summary of the Demographic Effects ................................................................. 116
5
LIST OF FIGURES
Figure 2.1: The Consumer Decision Model............................................................................. 26
Figure 2.2: TNCs Ridership Chart in USA .............................................................................. 45
Figure 3.1: The UTAUT2 Model ............................................................................................. 83
Figure 5.1: Gender Categorization ........................................................................................... 96
Figure 5.2: Age Categorization ................................................................................................ 97
Figure 5.3: Respondents who are Using TNCs........................................................................ 98
Figure 5.4: Payment Method ................................................................................................... 99
Figure 5.5: Respondents Usage Rate ..................................................................................... 100
Figure 5.6: Respondents Experience ..................................................................................... 101

6
LIST OF APPENDICES
Appendix A: IRBs Approval ................................................................................................. 137
Appendix B: CAPMAS Approval ......................................................................................... 138
Appendix C: Informed Consent ............................................................................................. 139
Appendix D: English Questionnaire ...................................................................................... 140
Appendix E: Arabic Translated Questionnaire ...................................................................... 146
7
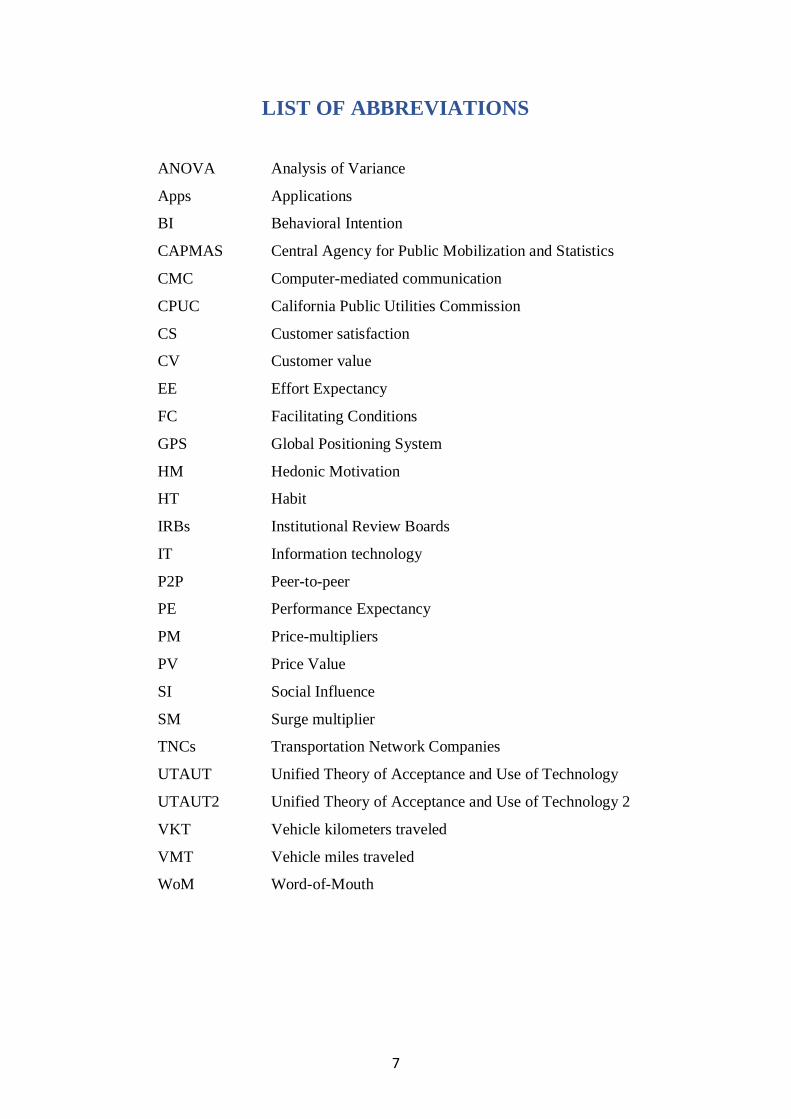
LIST OF ABBREVIATIONS
ANOVA Analysis of Variance
Apps Applications
BI Behavioral Intention
CAPMAS Central Agency for Public Mobilization and Statistics
CMC Computer-mediated communication
CPUC California Public Utilities Commission
CS Customer satisfaction
CV Customer value
EE Effort Expectancy
FC Facilitating Conditions
GPS Global Positioning System
HM Hedonic Motivation
HT Habit
IRBs Institutional Review Boards
IT Information technology
P2P Peer-to-peer
PE Performance Expectancy
PM Price-multipliers
PV Price Value
SI Social Influence
SM Surge multiplier
TNCs Transportation Network Companies
UTAUT Unified Theory of Acceptance and Use of Technology
UTAUT2 Unified Theory of Acceptance and Use of Technology 2
VKT Vehicle kilometers traveled
VMT Vehicle miles traveled
WoM Word-of-Mouth
8
CHAPTER 1: INTRODUCTION
During the last few decades, technology has shifted the way individuals live, and a new
era of digitalizing of products and services has started to emerge. This era of digitalization
started to change the current landscape of numerous business sectors and areas related to
products and services. The enthusiasm of using state-of-the-art technologies counting the
expectancy, intention to use, perception, as well as concrete usage behavior that determines
consumers’ recognition and acceptance (Chen, Wolfram, & Akram, 2017).
Generally, this user acceptance has been researched to clarify and understand the
indention to use as well as the adoption of countless distinctive developing innovations,
technologies, and services. For instance, the appearance of Web 2.0 allowed uncountable
chances for a new market access beyond the borderlines. One of the most extensively debated
topics considering the evolving market appearance as a consequence of the existence of Web
2.0 technology is "sharing economy business."
This advanced sharing economic model is describing the capability of groups or
individuals to make revenue from underutilized resources. The need for such model has been
originated from the development of the world population, which suffer from a shortage of
resources. Meanwhile, consumers search for the ultimate solutions to meet their requirements
(Hawapi, Sulaiman, Abdul Kohar, & Talib, 2017).
Likewise, sharing economy is the potentially more sustainable method to apply the
resources. Presently, collaborative consumption which is a part of the sharing economy has
benefited from the presence of Web 2.0 technology. This peer-to-peer (P2P) constructed
9
interest is managed throughout on-line platform as a channel of communication. Indeed, shared
economy is regularly linked with a P2P model where the information technology (IT) becomes
the platform for individuals to share and offer under-utilized assets, that are financial, social,
and environmental (Hawapi et al. 2017).
Moreover, in shared economy, everybody is capable to completely use resources by
modifying the budget of the ownership throughout the act of renting, subscribing, sharing,
reselling, loaning, donating, and/or exchanging. With the excessive escalation in the amount
of smartphones and mobile consumers, the shared economy started to be more developed and
available through a countless number of services and products.
The current era has seen a fast explosion of mobile devices with a vast number of 5
billion mobile subscribers worldwide at the end of 2017 (Gsma, 2018). Apart from offering
entertainment content and apps to consumers; mobile devices/platforms such as tablets and
smartphones develop the consumers’ productivity through an overabundance of mobile
applications. Examples of such apps contain but are not limited to shopping (e.g., Amazon),
news organizer (e.g., flip- board), transportation (e.g., Uber), project management (e.g., slack),
health/fitness (e.g., Fitbit), payment (e.g., square), note taking (e.g., Evernote), and so on
(Tamilmani, Rana, & Dwivedi, 2018).
Accordingly, these devices and apps provide users’ geolocations, allow immediate
peer-to-peer interaction, and support ubiquitous communications, giving escalation to a new
category of businesses “on-demand companies”, which target to efficiently adhere consumers,
services such as (computer programming and home cleaning), and vendors of resources such
as (parking spaces and houses) and charge very low transaction charges.
10
These types of businesses are reshaping our daily lives and shaking up their industries.
(Zha, Yin, & Yang, 2016).
Furthermore, as a standard sample of the on-demand shared economy, ride-sourcing
establishment or Transportation Network companies (TNCs) like Lyft and Uber are changing
the method we use to commute in cities. These types of companies offer online platforms and
ride-hailing apps that intelligently links contributing drivers to consumers. A consumer/rider
can view and monitor in a real time setting and distance the position of the oncoming requested
vehicle and get notified when it reaches (Zha et al. 2016). Besides, TNCs offer the real-time
feature, through online-based platforms that cleverly source the trip requests to nearby
connected available private drivers. Unlike the conventional dispatch taxi system, the internet-
based selection does not have a human interference, which makes it conceivable for dispatch
system to enhance the service (Zha, Yin, & Xu, 2018).
In Egypt, TNCs like (e.g., Uber, Careem, Swvl, and others) started to be more
prominent and to take the market from regular taxis and other local transportation modes. The
competition between Uber-like services to acquire the Egyptian market is a strong example of
user acceptance and adoption of TNCs. As an example, in October 2017, Uber has announced
a $20 million for investing on its new support in the center of Cairo (Hamdi, Mourad, &
Knecht, 2018).
From the time when the digital and online platforms have become the originators of
shared economy, technology recognition also might influence the acceptance level of shared
economy business — the term "Technophilia” or in other words the dependence on internet
11
platform to do stuff more easily and efficiently is one of the aspects that have an impact on
individuals’ adoption rate in shared economy (Hawapi et al. 2017).
As the development of these types of technologies and innovations spans from the
initial computer systems to the contemporary mobile applications and devices, new theories
and models expanded correspondingly. One of the theories and models is the “Unified Theory
of Acceptance and Use of Technology” (UTAUT2), which is a model of clarifying consumer’s
acceptance and usage of specific technologies and systems (Venkatesh, James, and Xu, 2012).
Accordingly, this research study is attempting to understand and analyze the cognitive
and affective antecedents to consumers’ behavior towards the new sharing economy businesses
represented as TNCs (Uber, Careem, Swvl, etc.). In this paper, the user’s usage and acceptance
of TNCs embed the ‘intention to use' of the TNCs’ services and mobile applications (apps) by
Egyptian consumers. Hence, the UTAUT2 model is used to fully utilize the aspects that affect
the behavioral tendency of TNCs’ consumers in Egypt. All these aspects make this study
interesting to explore and understand why Egyptian users are vulnerable to sharing economy
in general, and TNCs in specific.
12
CHAPTER 2: LITERATURE REVIEW
2.1 Smartphones history and development
Nowadays, people use smartphones as their personal assistant to locate and explore
restaurants, hotels, and stores. Furthermore, Islam and Want (2014) said that people use
smartphones in locating their positions on maps, monitoring their health system through
activity recording, purchase of products from the Internet, and watching videos. The
smartphones are being even more common, and their market is increasing endlessly (Daponte,
De Vito, Picariello, & Riccio, 2013).
Islam & Want (2014) stated that people experienced an extraordinary transformation in
which mobiles had developed from devices that make phone calls, to smart devices that made
individuals connected with each other, furthermore the information is accessible almost all the
time.
This transformation had made Internet applications, previously available to desktop
users only, easily available to anyone who has a mobile device at any time and accessible from
anywhere. Additionally, numerous inventions and developments were serious in the
implementation of smartphones—specifically, high-performance networks like 3G and
(4G/LTE), which had been broadly adopted; recent operating systems with user-friendly
interfaces as well as wealthy programming instruments; besides business models for installing
applications like app-stores (Islam & Want, 2014).
Latest memory technologies associated with smartphones have provided greater
capacities, cheaper, and usage of less power; which enables smartphones to save terabytes of
information data. Consequently, this will evoke a new variety of applications that collect and
13
store personal context and content, improving the privacy of user information and the speed of
access (Islam & Want, 2014).
Although mobile platforms are distinctive from desktop computers (PC’s) and laptops
due to the limitation of screen size and keyboard, they provide features (e.g. Global-
Positioning System GPS, camera, and scanners. This marks mobile marketing field as
favorably distinctive from large screen PC-Internet as well as conventional marketing (Ström,
Vendel, & Bredican, 2014). Hence, the Mobile Marketing Association defined mobile
marketing as:
"A set of practices that enable organizations to communicate and engage with
their audience interactively and relevantly through any mobile device or
network" (as cited in Ström, Vendel, & Bredican, 2014).
Relatedly, consumers observed gratification and media image opportunities differently;
this justifies consumers' selections between one media compared to the others. Mobile Internet
consumers viewed mobile phones as timely and enjoyable, identifying the three main benefits:
Users’ convenience (e.g., the flexibility of determination regarding location and time),
efficiency, and companionship compared to the PC (Ström, Vendel, & Bredican, 2014).
2.1.1 Smartphones application usability
In the last few years, improvements in communication and information technology have
allowed new services that deliver an extensive variety of demand-responsive and real-time
trips. Companies like Sidecar, Uber, and Lyft have appeared proposing mobile phone
14
applications to connect passengers with registered drivers (Rayle, Shaheen, Chan, Dai, &
Cervero, 2014).
These examples of Transportation Network Companies (TNCs), also referred as "ride-
sourcing," or "on-demand ride services” are used through smartphone applications (apps) to
match and connect passengers with community drivers (Shaheen & Chan, 2015). Moreover,
Passengers request a trip from a (generally) non-commercially licensed driver who drives a
private owned vehicle through a smartphone application, consquently links the driver to the
passenger's location via GPS (Rayle, Shaheen, Chan, Dai, & Cervero, 2014).
According to Rayle, Shaheen, Chan, Dai, and Cervero (2014), these applications
request a distance-variable fare, relatively Eighty percent of the payment represent the driver’s
share, and the remaining twenty percent to the TNC being the service provider.
Some of these apps provide a mutual “rating system” and content-aware process that
enables both the drivers and the passengers to rate each other after the ride completion. The
users' credit card data can be kept in the TNC’s computer system to use for future rides. A
comprehensive classification of ride-sourcing is hard because these types of services are
rapidly developing (Rayle, Shaheen, Chan, Dai, & Cervero, 2014). In fact, Islam and Want
(2014) mentioned that context-aware process for smartphones enables an improved user-
experience by adjusting smartphones' behavior based on the location, characteristics of the
user, and nearby objects.
By leveraging improvements in technology, ride-sourcing companies like Lyft, Uber
and their competitors, TNCs, or more equally, "ride-sharing"— assure to rise trustworthiness
15
and lessen waiting times of point-to-point transference (Rayle, Shaheen, Chan, Dai, & Cervero,
2014). Additionally, mobile phones are very individualized media and are used more actively
compared to laptop and desktop computers (Pescher, Reichhart, & Spann, 2014).
Switching between PC and the mobile Internet might be clarified as a balancing media
to the DSL Internet in high involvement circumstances, although mobile Internet operated as
an alternative in inferior involvement circumstances (Ström, Vendel, & Bredican, 2014).
As a result of the convergence of mobile and wireless devices technology, customers
are now untethered or unbound from their desktops, office and homes, with the capability to
share, access, and communicate information within their usage of buying products, social
networks, and playing games thru location-based mobile applications (Rohm, Gao, Sultan, &
Pagani, 2012).
16
2.2 App-based On-demand Mobility Services (Transit apps)
Car-sharing (Shared Vehicle), ride-sharing (Car-pooling / Van-pooling), ride-sourcing
(e.g. Lyft, Uber, and Sidecar), and e-hauling services (Normal Taxis) are all sorts of on-demand
mobility; the differences of these types are as follows:
1) Car-sharing is short-definition to a shared vehicle, the notion of car-sharing started
in 1994 in Canada and then it became vivid by 45 operators in several countries like Brazil,
USA, and Mexico. In this respect, individuals took advantage of their private vehicles’ usage
without the obligations and costs of ownership overheads, because the payment is per-use and
/ or agreed monthly fees (Greenblatt & Shaheen, 2015).
2) Ride-sharing services are also referred to as car-pooling and van-pooling, in its
conventional sense the users share a vehicle for trip-making with the same destination, origin
or both. These ride-sharing services help in reduction of the number of automobiles existing
on the road (Greenblatt & Shaheen, 2015).
3) Ride-sourcing services, which are also identified as “Transportation Network
Companies” shortly named “TNCs" offer on-demand as well as pre-organized transportation
facilities with several payment options; that happens by linking drivers of private vehicles with
other passengers. In fact, TNCs connect and link the users (both drivers and passengers)
through smartphone applications that are used for ordering, ratings and cashless payment.
Moreover, ride-sourcing services started in 2012, in San Francisco, CA, since its lunch the
services have been extent rapidly all over the USA and the globe, facing both resistance and
support (Greenblatt & Shaheen, 2015). Additionally, Rayle, Shaheen, Chan, Dai, and Cervero
(2014) selected to signify these services as "ride-sourcing" because it briefly delivers the
needed technology; a platform which used to “source” trips from a driver collection.
17
Ride-sourcing has origins in sharing behaviors of traditional taxis and ride-sharing.
Despite the arguments of some ride-sourcing proponents, ride-sourcing varies from ride-
sharing; which includes the notion of grouping passengers in a private vehicle, each going to
a similar direction, with the purpose of reducing fuel consumption, travel costs, vehicle
emissions, and congestion. In contrast, ride-sourcing drivers' motivation is income, so they
typically don't share a direction with passengers (Rayle, Shaheen, Chan, Dai, & Cervero, 2014).
In some conditions, ride-sourcing might become more related to ride-sharing by letting
unconnected passengers to share a ride. Nevertheless, ride-sourcing in its present condition is
more closely to look like a taxi when a driver asks for a ride in exchange for a fare. Ride-
sourcing supporters preserve that, unlike taxis, ride-sourcing allows more effective use of a
vehicle that is owned by the drivers. Others also claim that ride-sourcing differs from
traditional taxis because of its reliability, efficiency of the pricing tools and matching platform,
alongside with the liability of the evaluation system (Rayle, Shaheen, Chan, Dai, & Cervero,
2014).
4) E-hauling services is one of the on-demand mobility methods that depends on "for-
hire" vehicle services; this service works by using specific smartphone applications to
electronically haul an available taxi on-request. Although all vacant taxis can be dispatched or
reserved, through direct street dispatching or hauling via a phone operator call. Currently, e-
hauling applications are implemented as ride-sourcing services and that has concurrently
multiplied in the on-demand mobility area. Similarly, both e-hauling and ride-sourcing services
enable real-time connection between passengers to drivers as well as electronic payment
(Greenblatt & Shaheen, 2015).
18
These modes are all essential types of "Shared-Mobility" or as also referred as "On-
demand Mobility Services" which is sharing the usage of a bicycle, vehicle, or some other low-
speed methods, through an advanced transport method that facilitates immediate access to
transport methods "as-needed." To users. Furthermore, shared-mobility contains private
sharing of vehicles; peer-to-peer (P2P) car-sharing, shuttle-services sharing, scooter-sharing,
bike-sharing, ride-sharing, and on demand ride services and facilities (Shaheen & Chan, 2015).
Many debates had gone into clarifying these services; currently, there is no agreement
on a specific terminology. Additional terms like: “parataxis”, “on demand rides”, “real-time
ride-sharing”, “app-based rides”, “ride-matching”, and “Transportation Network Companies
(TNCs)” (Rayle, Shaheen, Chan, Dai, & Cervero, 2014; Zha, Yin, & Yang 2016).
Typically, ride-sharing is not aiming for profit; however, the provision of TNCs-like
facilities is mostly driven by financial motivation. Consequently, the California Public Utilities
Committee in the United States of America recommended using the term ‘‘Transportation
Network Companies" to classify TNCs-like companies/services (Zha, Yin, & Yang, 2016).
These services are experiencing numerous major expansions, using improvements in
mobile related technology to enhance and spread the recognition of shared vehicle systems for
trip-making (Greenblatt & Shaheen, 2015).
Shared-mobility might also involve commercial “delivery-vehicles” offering a flexible
method for commodities movement. Furthermore, the shared-mobility resulted in a
transformational effect on various international cities by improving the mode of transportation
accessibility as well as instantaneously decreasing ownership of personal vehicles (Shaheen &
Chan, 2015).
19
Lately, TNCs have launched new services of on-demand mobility that allow riders to
split and share the fees of a charge, which is referred to as "ride-splitting." For instance, some
TNCs like UberPool, Line, Lyft, and Sidecar Shared Rides target to group riders with related
routes and trips into car-pools (Greenblatt & Shaheen, 2015).
Since 2014, a rise took place related to the implementation of e-hauling services,
specifically in major urban areas by using mainly third-party dispatch and haul mobile
applications such as Curb and Flywheel. Several regions and states throughout the country are
approving legislation to allow TNCs/ride-sourcing companies to operate (Greenblatt &
Shaheen, 2015).
In the perspective of common ride-sharing (such as car-pooling and van-pooling) and
on demand mobility facilities, such as (Transportation Network Companies - TNCs), lots of
the related suppliers use information technology (IT) to enable the matching of drivers and
riders for trip-making (Shaheen & Chan, 2015). At their mainstream, the ride-sourcing
platforms decrease the friction in dispatch and matching for transport. A typical operation on
these service apps is represented as follows: a possible consumer launches the mobile
application on his/her phone and then demands a ride, and after that, the automated system
authenticates his/her to the closest available driver (Banerjee, Johari, & Riquelme, 2016).
2.2.1 History and development of on-demand mobility services
In 1994, the first car-sharing and bike-sharing programs started in North America, and
during the mid-1990s the “shared-mobility” services developed rapidly. Besides, car-sharing
and bike-sharing, there was an expanding activity and newly establishes in respect to IT-based
ridesharing; car-sharing P2P, scooter based-sharing and on demand ride sharing services like
(Sidecar, Lyft, and Uber) (Shaheen & Chan, 2015).

20
Undoubtedly, the car-sharing business has developed notably over the last few years all
over the globe, and it revealed infinite possibility as well as offering a viable transportation
mode, and that implies powerful business chances (de Luca & Di Pace, 2015).
Uber was one of the first TNCs that was established in San Francisco in 2009, primarily
with the intent of challenging what was commonly treated to be the city’s insufficient and
inefficient taxi service. Later, its policy of audacious and persistent expansion has supported it
to rapidly increase its services and coverage internationally, consequently by (2017) Uber was
operating in more than seventy countries, with nearly 16 billion US$ spent in the establishment
since it started. The range of its growth was exemplified by the expected valuation provided of
70 billion US$, making Uber the best valuable privately-owned technological company in the
whole world (Dudley, Banister, & Schwanen, 2017).
The company’s growth has resulted in broad consequences that do not only offer
transportation but also varying examples of urban related planning concerns, forms of mobility,
employment and business throughout the 21st century. The effective growth of Uber was based
on speciously easy usage of contemporary technology applications where the primary
reservations, the path, the calculation of charge, and lastly the payment are all performed and
completed by the assistance of a smartphone application (Dudley, Banister, & Schwanen,
2017).
In operative terms, Dudley, Banister, & Schwanen, 2017 highlighted that this
technological service brings the notion of “sharing economy” that targets to adhere consumers
and suppliers together by means of the creation of a spare capacity. In this respect, for a vehicle
that is usually idle for almost 90% of the time, the driver can install the Uber application and
go live with the customers who are utilizing the same application.
21
Technology that offers ‘sharing economy,' should be more effective in the matching
process of demand and supply rather than the traditional taxi services. Additionally, Uber
employs adjustable pricing systems that can be implemented to deal with times of peak
demand, whereas both customer and driver run score ratings for each other. Mainly for
regulatory reasons, Uber defined itself as a ‘technology platform’ rather than a ‘taxi company’
to distinguish itself from its rivals, and it classifies its drivers as ‘registered partners' not as
employees (Dudley, Banister, & Schwanen, 2017).
2.2.1.1 History and development of on-demand mobility services in Egypt
In Egypt, Uber was launched in 2014 in Cairo, and then in 2017, the service expanded
to help more than four million users, with nearly 160,000 drivers who are working as partners
with the company. Today, Uber Egypt operates in eight distinctive areas across the country:
(Cairo, Alexandria, Tanta, El Gouna, Hurghada, Mansoura, Zagazig, and Damanhour) (Elewa,
2018).
As for its services, Uber provides some different methods and types for its users;
starting with 1) Uber X which is (the service any user can get at everywhere, associated with
comfortable sedans presenting fabulous but reasonable everyday rides). Likewise, 2) Uber
Select, which is (sleeker and newer cars that deliver more luxurious rides at a premium price)
(Elewa, 2018).
Moreover, 3) Uber TukTuk, which is available only in El Gouna, it allows any user to
transfer from one area to another in the coolest way possible. And lastly, 4) Uber Scooter,
which is the most recent method is simpler, quicker, and brilliant for beating the traffic jams
(Elewa, 2018).
22
Careem is the second well-known TNC provider in Egypt and the main competitor to
Uber, and it started in late 2014 in Cairo (Al-Ahram Weekly, 2016). Afterward, the company
expanded its services and cities; Currently according to the main website of Careem Egypt, the
company operates in the following cities (Cairo / Alexandria / El-Sahel / El-Gouna /
Damanhour / Tanta / Mansoura / Hurghada / Port Said / Suez / Ismailia / Zagazig / Damietta /
Banha and El-Sokhna). Likewise, Careem provides a number of different methods and types
for its users such as (Go Value, Go+ Comfort, White Taxi, and Bike) (Careem Website, n.d.).
Similar to Uber and Careem, a new company started to take place in transporting
individuals through its vehicles called Swvl. It started in 2017, and it works on the concept of
van-pooling to decrease the number of vehicles on the streets, lessening the limited resources
like time, money, and space. The company now operates and handles over 600 Lines in Cairo
and Alexandria (Swvl Website, n.d.).
2.2.2 On-demand Mobility Significance
On demand mobility methods conveyed a number of social, environmental, and
“transportation-related” benefits. Numerous studies have pointed out that the lessening of
ownership, vehicles use, and vehicle distance covered (miles/kilometers) traveled (VMT/VKT)
(Shaheen & Chan, 2015).
Shaheen and Chan (2015) mentioned that cutting costs and the attenuated convenience
are often quoted as the most popular reasons for changing to a shared transportation mode.
“Shared modes” can moreover expand to the coverage of public transit sectors, and possibly
have a vital role in linking the existing gaps in the transportation networks consequently
encouraging “multi-modality” by tackling the first & last mile concern in respect to the access
of public transit.
23
de Luca and Di Pace (2015) stated that, the speedy development of car-sharing
originates from two distinctive reasons that complement each other. Firstly, car-sharing turned
out to be a substitute method of traditional city transportation, which lets it achievable to
complete various aims of transportation planning concurrently aiding in the viable urban
growth. Consequently, car-sharing introduces a suitable mode of transportation for every trip,
it favors trip-chaining and decreases spontaneous trips. Secondly, car-sharing is a sort of
‘incentive' added to the earnings of the vehicle riders, contrasting the majority of the
transportation strategies that target to suggest ‘sticks’ versus vehicles. Undeniably,
transportation riders can benefit from the vehicle's flexibility without suffering from its fixed
charges.
Furthermore, on demand mobility is supposed to offer some economical gains in terms
of the budget savings, improved economical activity close to the public transit locations and
multiple-transportation centers, and improved reachability by generating chances for possible
new trips that were not previously available by usual public transit plus facilitating new (one-
direction) or (point-to-point) service choices (Shaheen & Chan, 2015).
Additionally, a rising form of empirical indication implies that on demand mobility
services can deliver transportation, social, environmental, and land oriented optimization
benefits. Whereas influence findings on round-trip car-sharing are fairly broad, the effects of
ride-sharing and the latest service methods of ride-splitting, ride-sourcing, and e-hauling
services are less understood and studied (Greenblatt & Shaheen, 2015).
24
The latest appearance of on-demand and app-based ride services has generated a debate
on their role in urban transit (Rayle, Shaheen, Chan, Dai, & Cervero, 2014). Therefore, a case
study formulated by Shaheen and Chan (2015) in San Francisco was on 380 TNC’s users,
discovered that ride-sourcing customers were mostly younger and better educated than the city
average.
Moreover, decreased vehicle ownership is the most prominent effect of round-trip car-
sharing. In fact, every shared vehicle subtracts nine to thirteen vehicles from the roads. A latest
study in San Francisco, CA asked TNC’s / ride-sourcing users for essential trip data such as
destination/origin, wait times, and trip purpose (Greenblatt & Shaheen, 2015).
Accordingly, the respondents listed that if ride-sourcing services were unavailable,
39% highlighted that they would take a taxi, and 24% would take a bus. Moreover, the
respondents recommended TNC’s / ride-sourcing can operate as a first-/last-mile trip.
Likewise, the study discovered that ride-sourcing waiting times managed to be noticeably
shorter than regular taxi dispatch and haul idle periods. Compared to taxis in the analysis of
matched pair, ride-sourcing vehicles occupancy levels were higher by having the average of
1.8 indifference to 1.1 passengers (Greenblatt & Shaheen, 2015).
Another example by Rayle, Shaheen, Chan, Dai, and Cervero (2014), who surveyed
customers of three main ride-sourcing companies: Lyft, Sidecar, and Uber. Uber suggests
several choices that involve both ride-sourcing and professional driver facilities. The cheapest
option is "UberX," which matches passengers with regular drivers who typically don't have a
"commercial vehicle license." Furthermore, UberX is consider as a "genuine" ride-sourcing
facility rather than both Uber SUV and Uber Black, which use particular drivers and vehicles
25
with a “for-hire” license. Both Sidecar and Lyft offer ride-sourcing services that deliver on-
demand rides over a system of group drivers.
Furthermore, TNCs’ services as facilitated by smartphones’ applications and
exchanging generational expectancies might be more wide-ranging by the time of 2020s and
raise the occupancy levels through sharing the personal transportation by 2050. People will be
convenient by the notion of self-driving cars, while consumers/passengers’ complete other
duties for instance talking, texting, reading, or watching TV; vehicles might develop among
richer passengers to develop a sort of a “mobile home,” proposing recreation, eating, sleeping,
or workspace tasks during the journey (Greenblatt & Shaheen, 2015).

26
2.3 Consumer decision-making processes
Based on previous research (Hafstrom, Chae, & Chung, 1992; Lysonski, Durvasula, &
Zotos, 1996) of decision-making, processes showed that it became more significant and
complex for consumers than in ever before (as cited in Sam & Chatwin, 2015). Likewise,
literature done on the consumer decision-making process (Hawkins, Best, & Coney, 2001;
Blackwell, Miniard, & Engel, 2006; Hawkins & Mothersbaugh, 2014; Karimi, Papamichail, &
Holland, 2015), suggested that a purchase decision method is the behavioral form of an
individual or a consumer who follows and determines the process of decision-making including
numerous phases to make a certain choice or action.
Figure 2.1: The Consumer Decision Model
Adapted from: Engel, Blackwell, & Miniard (1993)
The traditional purchase behavior model is a “linear model” as demonstrated in Figure
2.1, exemplifies the core phases of the purchase process. It includes the following stages: 1)
The need recognition phase; 2) The information search phase; 3) The evaluation of alternatives
phase; 4) The purchase phase and; 5) finally the post-purchase phase. Decision-
27
makers/consumers frequently don’t follow all stages or even sometimes they skip stages in the
linear form and process instances regularly comprise differences from the main iterations and
route between stages (Karimi, Papamichail, & Holland, 2015).
de Lorimier and El-Geneidy (2013) had discovered that vehicle's proximity and age to
the users are vital decision aspects (as cited in Zoepf & Keith, 2016). However, Zoepf and
Keith (2016) argued that car-sharing literature still didn't reflect the ordering decision-making
from the perception of different consumers, highlighting the impact of operational
characteristics like the availability and the relevant location of the vehicle to the consumer(s)
desired time as well as place.
Moreover, literature has revealed that kind of (products/ brands) that affects the nature
of information investigation and eventually the decision-making process that customers apply
to choose a certain product (Senecal, Kalczynski, & Nantel, 2005). The primary literature on
car-sharing has explored a range of concerns involving the effect of car-sharing on vehicle
ownership, elements persuading the success of car-sharing schemes, vehicle miles traveled
(VMT), the demographics of car-sharing users, and the connection between car-sharing and
other transportation types. Generally, shared-mobility services are currently a fascinating field
for the analysis of the behavior intention as well as the decision-making process, because
consumers take systematic and obvious decisions showing their own preferences and beliefs
(Zoepf & Keith, 2016).
Consumers' awareness of products is a personal feature that has been demonstrated to
have an influence on the decision-making procedure. Besides, decision-making, which also
expressed as the tendency to maximize or satisfy a choice, is the person’s behavior that has
28
been represented to be a forecaster of making a decision and a factor in the method decision-
making procedures unfold (Karimi, Papamichail, & Holland, 2015).
During the procedure of selecting a product/brand, customers are proposed to do a
domestic search (e.g., trusting the previous information of brands) and, if essential, an exterior
search. Accordingly, the latter might include behaviors like collecting more information around
the product and requesting suggestions from other related sources. Correspondingly, dissimilar
customers might use distinctive decision-making tactics to perform a selection decision
(Senecal, Kalczynski, & Nantel, 2005).
Consequently, Senecal, Kalczynski, and Nantel (2005) highlighted that customers who
implement their personal grounded decision selection processes that could be manipulated by
suggestions, but don't depend on these suggestions entirely to perform decisions. For example,
a customer might request a familiar friend opinion about the characteristics which are
significant to reflect on a certain product; nevertheless, he/she might also collect corresponding
data from other sources of information such as sales-people, advertisements, and store visits to
decide the related product characteristics to be considered.
At different stages of the process, several aspects that influence consumer decision-
making may be measured using demographic, socio-metric, and psychographic variables as
well as through consumer usage personalities (Pescher, Reichhart, & Spann, 2014).
29
2.3.1 Online decision-making process
Online decision-making process is highly flexible and dynamic process, as the decision-
making process reveals, individuals make decisions during the process and might use
distinctive paths. This type of flexibility has been outlined as the capability to adapt the process
outflow on demand thru skipping, adding, or structure reordering of the process stages.
Similarly, knowledge of the product influences the purchase behavior and has exemplified to
affect the information processing steps as well as the information search steps (Karimi,
Papamichail, & Holland, 2015). Moreover, in online contexts, Chircu and Mahajan (2006)
hypothesize the online consumer experience process as follows: 1) store/shop accessibility, 2)
searching, 3) evaluation as well as selection, 4) making an order, 5) payment method, 6) the
order gratification, and 7) after sales services (as cited in Pham & Ahammad, 2017).
Furthermore, Klaus (2013) classifies online consumer purchase process with three
fundamental phases involving a prior-, a during- and an after- purchase. Therefore, the prior-
purchase phase contains behaviors like searching for information as well as evaluating the
information gathered. The purchase phase contains behaviors such as (selection of the
product/service, then ordering, and afterwards paying it). The after- purchase phase includes
behaviors like (evaluating of benefits) (as mentioned by Pham & Ahammad, 2017).
In the pre-purchase stage, an online consumer frequently performs a set of actions
involving search information about the product, compare different alternatives, check
consumer reviews to take the ultimate purchasing decision. Previous findings recommend that
several aspects of the vending website containing website simplicity of use/performance,
customization, website design and appearance, and information quality make consumer
experience in the phase of pre-purchase and have a major impact on consumer satisfaction with
online providers (Pham & Ahammad, 2017).
30
In view of research done on customers’ use of related sources in the pre- purchase
exterior investigation attempts and inattention of the appearance of online information
providers offering individualized suggestions (Maes, 1999) as well as Senecal and Nantel
(2002) stated that online reference sources can be classified into major three classifications: 1)
The important others (e.g., acquaintances, friends, and relatives), 2) individual specialists (e.g.,
independent professionals, and salespersons) and 3) systems that assists the customer which
are experienced systems such as “intelligent-agent-based systems and recommender systems”
(as cited in Senecal, Kalczynski, & Nantel, 2005).
The electronic commerce is growing quickly, our knowledge of e-consumer behavior
is still limited, and Internet purchase behavior doesn’t essentially obey traditional consumer
purchase behavior. In fact, several attempts have been initiated to interpret and model online
purchase behavior. Hence, some studies have discovered behavioral variation, considering
personal features such as trust, involvement, perceived risk, and Web skills. However, there
are variances in our understanding of how distinctive persons act in the purchase decision-
making processes and how these processes unfold (Karimi, Papamichail, & Holland, 2015).
As a matter of fact, consumers with higher levels of knowledge related to the
product/service are more aware of their desires and are likely to start the decision process with
a minor studied set of alternatives (Karimi, Papamichail, & Holland, 2015). Therefore,
profiling consumer decision-making types are essential to the advertisers as well as the
marketers. The appearance of e-commerce activities, is crucial to study online users’ needs and
desires in making decisions that impact their enthusiasm to purchase products. Subsequently,
one of the methods that describe consumer types is the categorization of the consumer, through
31
focusing on the affective and cognitive orientations associated with consumer decision-making
(Sam & Chatwin, 2015).
Undoubtedly, better market share of shared-cars relies on the possibility to make TNCs
more appealing according to thoughtful understanding of individual’s decision and selection
process of joining a TNC service (Kim, Rasouli, & Timmermans, 2017). Accordingly, any E-
businesses that offer self-service technologies to address consumer needs can provide aspects
that can produce constructive responses on the online platform. Businesses that implement self-
service abilities (e.g., product/service search engine, order tracking, or communication stations
for product/service inquiry) can enlarge customer satisfaction by 65% and customer retention
by 39%, these are considerably greater rates that doesn’t exists in the businesses that depend
only on cost bargain (Sam & Chatwin, 2015).
2.3.2 Factors Affecting Decision-making
According to Chocarro, Cortiñas, and Villanueva (2013) who stated that the initial
studies had showed that the main factors of actual and intended practice of a particular purchase
platform are users’ opinions of the platform’s characteristics, personal behaviors toward using
them, the factors of the underlying technologies, users’ experience as well as consumption of
technology, consumers’ psychographic, psychological, socio-demographic characteristics, and
product features.
Alongside the technological expansions, companies are gradually attaining their
customers across a range of platforms (e.g., electronic commerce, mobile commerce, and brick-
and-mortar establishments). Research done commonly centralized the attention on how
consumers use, evaluate, and accept certain platforms/channels and the ecosystem associated
with the purchase (e.g., aspects like uncertainty, risk, and trust) which plays a vital role
32
throughout the adoption and selection process. While these findings enhance our knowledge of
the degree of which consumers are frequently starting their decision-making duties on distinct
platforms/channels, a small number of studies focused on examining the variation of channels
that affect the decision-making process as well as the channel choice, thru a mixture of
platforms/channels (Maity & Dass, 2014).
Moreover, the online capability to transfer only written and particular types of graphical
information has been questionable of its appropriateness as a shopping platform and routed the
studies in resulting a mass of product/services attributes constructed on perceived, deep-rooted
or other characteristics, like the degree of differentiation, tangibility, complexity, and price
(Chocarro, Cortiñas, & Villanueva, 2013).
2.3.2.1 Situational Variables Factors
Situational variables represent the aspects that is related to specific place and time of
inspection, which doesn't follow from an awareness of stimulus (choice-alternative) or personal
(intra-individual) attributes. Consumer behavior is mostly determined by these mentioned
variables or other shopping variables, which can inspire their process in search the information
(Gehrt and Shim 2002, Mattson and Dubinsky 1987), price sensitivity (Wakefield and Inman
2003), product/service selection, product/service evaluation, and preferences (Belk 1974,
1975), their choice of purchase channel, and other variables such as their consumption of in-
store features like the self-service equipment and their preferred store layout (Chocarro,
Cortiñas, & Villanueva, 2013).
Situational variables initially were categorized as follows (Belk 1975):
33
1. Variables that is related to the physical contexts in which the decision is formulated
based on place; contain crowdedness, the weather, distance-to-store, and likewise store
atmosphere variables (e.g. tidiness and background music).
2. Variables that are related to time, which contain day-of-the-week or time-of-day,
product availability, time pressures, and urgency of purchase.
3. Variables related to the social setting, like (the opportunity for social interaction, the
existence of others who are important to the consumer at the time of the selection process, and
the prominent roles of such people.
4. Variables related to antecedent states, involving moods, fatigue, and temporary
mental or physical states.
5. Variables related to task-definition such as the motivational and cognitive
characteristics of the purchase setting (whether the product is for personal use or needed as a
gift, etc.) (as cited in Chocarro, Cortiñas, & Villanueva, 2013).
Similarly, Chocarro, Cortiñas, & Villanueva, (2013) discovered the significance of the
characteristic dimensions of situational variables, and the social, time and the physical-related
dimensions affect consumers' preferences on virtual against physical purchase channels.
In the online-purchasing process consumers perform as both product/service users as
well as buyers of the web-based technologies. Once consuming the Internet to purchase
products/services, the essential risks appears with privacy and trust concerns, the degree to
which consumers perceive that consuming the online nature will be secure, the time consumed
searching for particular information, the difficulty of navigation, the inability of purchasers to
34
directly engage with the seller, and vagueness about the aftersales service warranty compared
to more traditional modes of shopping (Pappas, 2016).
2.3.2.2 Mobile Marketing and Advertising Factors
Mobile as a technology symbolizes the quickest developing marketing communication
areas, and the selection of the mobile platforms are in extensive use across the planet.
Concurring with the great implementation of both 3G and 4G smartphones between users,
mobile marketing has progressively developed a core tactic in the brands' promotion and
advertising settings. Brands like Puma, Ralph Lauren, Chanel, FIFA, Starbucks, Dunkin
Donuts, and Volkswagen signify a few number of customer brands varying from Asia, Europe,
and United States, which had begun to hostilely implement un-tethered mobile marketing
programs to produce related and closer links with certain consumers (Rohm, Gao, Sultan, &
Pagani, 2012).
There is no doubt that businesses can circulate a marketing message with the objective
of inspiring the consumers to redistribute the targeted message to their own contacts (e.g.,
relatives, acquaintances or friends) (Pescher, Reichhart, & Spann, 2014). Furthermore, Ström,
Vendel, and Bredican (2014) stated that the research was regulated to personal reviewed
journals and was grounded on terminologies like: “m-marketing”, “mobile marketing”, “m-
commerce”, “mobile commerce”, “m-advertising”, “mobile advertising”, “m-loyalty”, and
“mobile loyalty”.
Pescher, Reichhart, and Spann (2014) said that mobile devices similar to smartphones
improve users’ capacity to easily, rapidly, and electronically share information about
products/services and to get mobile advertisements instantly in any location and at any time
(e.g., through mobile text message advertisements). In fact, mobile applications and mobile
35
devices provide dealers more than just a chance to use a fresh channel/ platform to reach
consumers and provide opportunities to combine interaction alongside with information search
and phone functionality while consuming a product/ service or shopping in a store (Ström,
Vendel, & Bredican, 2014).
In academic studies, the added value generated by mobile platforms and services for
users was originated from being reachable, being independent of place and time, and being
personalized; based on personal profile, location, and time, self-ascribed roll types (e.g., private
(off duty), professional (on duty)) and stance types (e.g., waiting, busy, time on hand,).
Furthermore, the value is the advantages proposed by the service or product related to the
consumer sacrifices for the use and acquisition of the service and product relevant to
competition and varies based on the consumer product knowledge. Perceived value has an
effect on the acceptancy and usability of mobile technology, marketing, and loyalty to mobile
marketing and services (Ström, Vendel, & Bredican, 2014).
Mobile marketing and services observed values are different founded on “situational
value” and “novelty value." Pilstrom and Brusch (2008) mentioned that the situational value
affected emotional, utilitarian, monetary, and social value, whereas novelty aspects affects only
the social and emotional value for both entertainment and information facilities, as well as
financial values for the information facilities (as cited in Ström, Vendel, & Bredican, 2014).
Therefore, in pursuing to understand the marketing stand view of the mobile as a
powerful medium, companies often create the most repetitive mistake of observing mobile
marketing area as a platform of “one-size-fits-all” which is executed in the same approach
36
within international markets, regardless of other media-related platforms (Rohm, Gao, Sultan,
& Pagani, 2012).
Ström, Vendel, and Bredican (2014) presented results that demonstrated better reply
choices in mobiles’ push- advertising, which improved customization and playfulness features
in mobiles’ game- advertising, followed by boosted perceived constructive attitudes and
interactivity regarding mobile game- advertising and push- advertising.
On the other hand, the drawback that Rohm, Gao, Sultan, and Pagani (2012) had
discovered that companies frequently fail to study individual characteristics like (risk
perceptions) and culture-specific aspects such as (Customer's overall thoughts of the platform).
Another common error companies do frequently is considering the mobiles’ marketing
as a separate and standalone channel/ platform that utilities impartially from the remaining of
the marketing eco-system, involving conventional media (Rohm, Gao, Sultan, & Pagani,
2012).
Rohm, Gao, Sultan, and Pagani (2012) claimed that both large and small businesses
who features mobile marketing plans into their comprehensive marketing plans should
distinguish that costumers' reception of mobile marketing can vary; differing on where they
work and live. Also, content quality and reliability had a solid outcome on loyalty towards
mobile marketing and services (Ström, Vendel, & Bredican, 2014).
As individuals, we are currently at an intersection where the marketing strategy
encounters the next-generations’ mobility and interactivity. Therefore, to survive and thrive in
37
this different point of marketing, corporations have to discover involvement of customers thru
worldwide markets as well as the digital and traditional platforms/channels where they ‘live.'
(Rohm, Gao, Sultan, & Pagani, 2012).
Mobile Marketing Association (2008), theorized mobile marketing as brands',
companies' as well organizations' attempts to sell, inform, promote, or similarly push customers
to make certain kind of activity thru using the mobile channel/platform (as cited in Rohm, Gao,
Sultan, & Pagani, 2012).
Mahatanankoon et al. (2005), classified useful mobile business process as possible
user-based apps. Hence, apps of a particular concentration for mobile platfrom consumers
appeared to be delivering a content (e.g., searching and obtaining information concerning
dealers, brands, varieties, prices, and much more), transaction-based functions (e.g., payment
and order services), location-based functions (getting more personalized, time-based/location-
based, suitable offers, route and map navigation to the closest store via (GPS system),
advertising, discovering usage instructions and products in-store) (Ström, Vendel, & Bredican,
2014).
Rohm, Gao, Sultan, and Pagani (2012) also offered three different individual features
of risk avoidance, innovativeness, and personal attachment that influence and/or moderate the
direct outcome of perceived practicality of smartphones’ programs and content as well as
customers' thoughts toward mobile marketing.
Some researches had covered mobile advertising efficiency, and the effect of the value
linked with marketing activities in all of the following: mobile pull-advertising, push-
38
advertising, value chain, as well as cross-media outcomes of Internet pull- and mobiles’ push-
advertising. Initial findings revealed great recognition of mobiles’ pull- advertising strategy
(e.g. SMS), purchase intentions, and reply rates, accordingly surpassing results were recorded
of direct-marketing, whereas the results of branding outcomes were low to moderate. Thus,
mobiles’ push-media could alternate conventional direct-marketing assets to specific user
classes rising communication efficiency for low and high involvement types for both
services/products (Ström, Vendel, & Bredican, 2014).
Consequently, marketing executives should be aware that mobiles’ interaction with
customers allows them to knock into two distinctive paybacks: 1) smartphones’ technology is
being gradually location-/timely-based, therefore, delivers marketers from getting customers
solitary within the physical boundaries of either office or home and 2) smartphones’ are
extremely interactive, personal, and engaging medium. Whereas traditional media (e.g. outdoor
advertising), which is founded on the location, where it's neither as attractive nor interactive as
the mobiles’ advertising (Rohm, Gao, Sultan, & Pagani, 2012).
2.3.2.3 Word-of-Mouth Factors
Word-of-mouth (WoM) was a subject of interest to marketing scholars for more than
five decades. It can roughly be described as the way information is shared concerning a (e.g.
product, promotion, and etc.) among the consumer and colleague, relative, or other friend.
Furthermore, WoM had shown a noticeable impact on consumers' behavior and attitude, also
in influencing brand swapping decisions WoM is up to seven times more efficient than
traditional printed advertising (Kaplan & Haenlein, 2011).
39
Moreover, a huge amount of research was done in the recent years that is studying
WoM in online space. Chevalier & Mayzlin (2006), argued that parallel to traditional WoM,
electronic WoM, (e.g, book reviews shared on websites like Amazon.com) had shown to
impact purchase behavior and lead to the attainment of better value customers (as mentioned
in Kaplan & Haenlein, 2011).
The Internet intensely simplifies user inter-connections; forums of online users,
newsgroups, and e-mail recommendations, as well as consumers’ feedbacks stimulated by
commercial websites that enable users to share their information and thoughts further naturally
than ever done before. This inter-connectivity is an international experience that smooth the
distribution of both negative and positive WoM, dissemination that can't be precisely controlled
by brand managers or marketers (De Bruyn & Lilien, 2008).
Nevertheless, De Bruyn and Lilien, (2008) said that marketers have noticed that
customer-leveraging options the Internet presents, between the viral marketing that is included
as the most fascinating extent of online marketing. The purpose of viral marketing is to use a
peer-to-peer (or a consumer-to-consumer) channels, as disparate to a company-to-consumer
channels to distribute information related to a service or product, thus achieving further cost-
efficient and rapid acceptance in the market.
This gives fascinating organizational implications, as the essential anonymity of online
feedback tools which can make such platforms subject to tactical manipulations by companies,
accordingly it would increase their sales throughout promising observations. Likewise, the
effortlessness of which electronic WoM can be gathered and evaluated enables companies to
use comments shared thru newsgroups (Kaplan & Haenlein, 2011).
40
There is no doubt that the responsibility of experts and professionals in the information
flow and guidance over social networks platforms, which has been one of the most extensively
examined features of WoM communications. In fact, consumers are motivated in obtaining the
opinion from and be persuaded by the specialist sources rather than being persuaded by non-
specialist ones; accordingly, there are explanations to be considered in the discovery of
applying the viral marketing framework (De Bruyn & Lilien, 2008).
Furthermore, electronic WoM has two core advantages compared to traditional WoM
that was only limited to exchanging information thru traditional face-to-face communication.
E-WoM firstly lies in its advanced dissemination rate for different bits of information; and
secondly, it is considerably easier to monitor than usual WoM, which can only be analyzed
through a fairly tedious method (Kaplan & Haenlein, 2011).
The viral marketing notion proposes that marketing practionars can influence the
supremacy of personal channels to endorse a product/service. Besides, the idea of viral
marketing suggests that electronic peer-to-peer or (e-P2P) communications are efficient
resources to convert channels networks electronically into influencing channels, in which it
captures receivers' attention, triggers interest, and ultimately leads to sales or adoption (De
Bruyn & Lilien, 2008).
Viral marketing is defined as (e-WoM) or electronic word-of-mouth, which is a sort of
a marketing message that is related to either a service, brand, product, or company, and
transferred at an exponential rate frequently via the usage of social media platforms. Kaplan &
Haenlein (2011) stated that viral marketing has two major fundamentals: 1) is the better
reproduction, or growth rate which indicates that every receiver exchanges the message to other
41
individual(s). 2) Social media applications usage; which is referred as a collection of Internet-
based apps that formulated based on the technological and ideological basis of the technology
of Web 2.0, therefore it allows the exchange and creation of "User Generated Content''.
It is an umbrella term defining diverse kinds of applications such as content
communities like (i.e, YouTube), blogs/micro-blogs (i.e., Twitter), collaborative websites and
projects (i.e., Wikipedia), social networking platforms (i.e., Facebook), virtual-social as well
as virtual-game worlds (i.e., Second Life, World of Warcraft) (Kaplan & Haenlein, 2011).
Practitioners and academics have focused their concentration on Word-of-mouth
communications for long periods of time. Since 1950s, investigators have showed that
individual discussions and informal conversations of information between connections not
only convince consumers' purchase and selections decisions, but also form consumers’
anticipations before-usage approaches and similar after-usage insights of a service/product (De
Bruyn & Lilien, 2008).
Sevreal studies have stated that WoM effect is more superior than personal selling,
radio, and print advertising, while Van den Bulte and Lilien (2001), mentioned that several of
those results and impacts have been exaggerated (as cited in De Bruyn & Lilien, 2008).
Likewise, Viral marketing is a fairly contemporary phenomenon and has been reviewed
in the literature underneath a range of different terminologies some of which are “word-of-
mouth marketing, buzz marketing, word-of-mouse, and stealth marketing”, (Kaplan &
Haenlein, 2011).

42
De Bruyn and Lilien, (2008) argued that extensive research pointed extensively that
utilizing the consequences and antecedents of WoM. As, the current literature can be
categorized into three distinctive streams. First stream highlights the motives and reasons
behind the consumers who proactively disseminate information about services/products that
they have experienced. The second stream targets a better justification of consumers who seek
information, or more precisely, beneath what conditions the consumer depend on WoM
communications in comparison to the alternative origins of information to formulate a
purchasing decision.
As in the third stream, which was aimed to examine why specific individual sources of
information exercise further impact than others. As a matter of fact, researchers have classified
elements that includes perceptual affinity, demographic relationship, source expertise, and tie
strength, as significant antecedents of WoM influence (De Bruyn & Lilien, 2008).
It has been claimed extensively that it’s worthy to observe the consumer's purchasing
decision due to its multi-phases and complex processes; hence, those phases are theoretically
different while not essentially obvious. De Bruyn and Lilien (2008), stated that the multi-staged
decision process model includes a series of conceptual cognitive levels or stages that consumer
practice during the purchasing decision or the theoretically known by (the final stage). The
structure normally involves the subsequent phases:
First stage is Awareness, in which the consumer identifies the alternative endures, but
might not have either passion in it or adequate information to entirely grasp its possible
paybacks. Certainly, Interest is the second stage, in which the consumer is informed, advances
some attention, and henceforth chooses to understand more about the product. The third and
43
final stage is the Final decision, in which the consumer has instantly acquired a noticeable
action, thus obtaining a service, good, or constant acceptance of an innovation
2.4 An Overview of the Cognitive impacts
Currently, most research investigates the elements influencing online consumer
experience through focusing on the factors associated with consumers' behaviors in the stages
of pre-/post- purchase such as the characteristics of the vending website, which contains the
website performance and design, ease of use, security, and information quality (Pham &
Ahammad, 2017).
Progressively, the quantity of private vehicles worsens environmental harms like
lessening the limited resources, emission, and acquiring insufficient land for parking and road
spaces. The harshness of these harmful outcomes is more challenging as it is recognized that
personal vehicles are parked nearly all the time. Additionally, public transportation might be a
respectable substitute; however, it has some limitations concerning the flexibility, door-to-door
access, carrying goods and customization. In this perspective, TNCs’ networks have lately
involved the attention gradually. These systems offer users the paybacks of the privately-
owned vehicles without the responsibilities and costs of vehicle-ownership (Kim, Rasouli, &
Timmermans, 2017).
Promoters view ride-sourcing as a type of a set of transportation choices that serves
formerly unachieved demand for convenient, flexible, and fast mobility in urban spaces. By
offering an interesting substitute for driving, these services can decrease ownership,
automobile consumption, and environmental issues (Rayle, Shaheen, Chan, Dai, & Cervero,
2014).
44
Shaheen et al. (2006) highlighted that there are five main demographic marketplaces in
which car-sharing might be an effective transportation substitute: for business, neighborhood,
school, commute, and low-income. Between them, it was pointed by the authors' that the inter-
urban trip request can be an interesting possible market, particularly among cities that
considerably deal with each other (as cited in de Luca & Di Pace, 2015)
Primary, the availability of a shared-vehicle shows a vital role in taking the decision of
selecting a sharing vehicle; Secondly, the gratification with the recent surroundings
considerably influences individual’s intention to join or use a TNC; and thirdly, according to
the flexibilities, a structure cutting the deposit, the hourly rate and the monthly membership
payment can be more effectual than a structure cutting the operating fee counting the fuel cost
and the distance-based rate, in relation to the rising numbers of vehicle-sharing members (Kim,
Rasouli, & Timmermans, 2017).
Similarly, order fulfillment was expressed as the facility to deliver the guaranteed
service accurately and dependability. More precisely, according to (Coyle et al., 1992; Davis-
Sramek et al., 2008; Stock and Lambert, 2001), order fulfillment means a corporation's
capability to provide:
“the right amount of the right product at the right place at the right time
in the right condition at the right price with the right information,” (as
quoted in Pham & Ahammad, 2017).
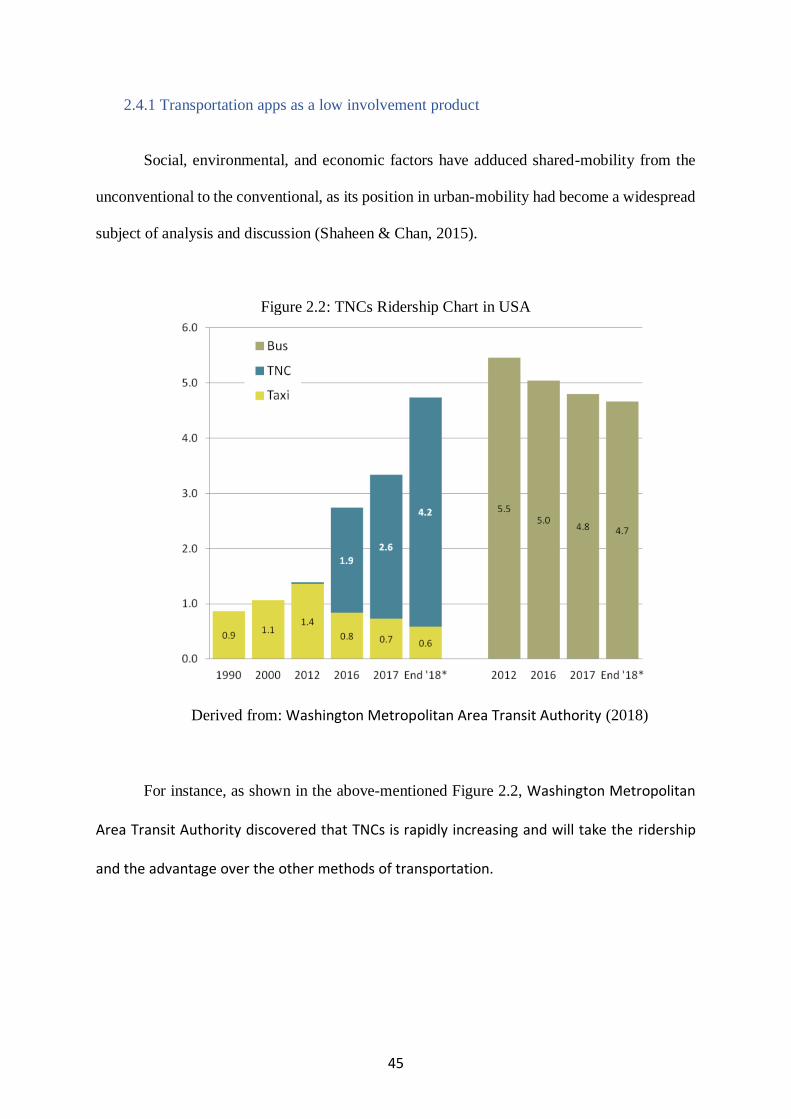
45
2.4.1 Transportation apps as a low involvement product
Social, environmental, and economic factors have adduced shared-mobility from the
unconventional to the conventional, as its position in urban-mobility had become a widespread
subject of analysis and discussion (Shaheen & Chan, 2015).
Figure 2.2: TNCs Ridership Chart in USA
Derived from: Washington Metropolitan Area Transit Authority (2018)
For instance, as shown in the above-mentioned Figure 2.2, Washington Metropolitan
Area Transit Authority discovered that TNCs is rapidly increasing and will take the ridership
and the advantage over the other methods of transportation.
46
The majority of studies is generally focused at urban contexts in North America, and
they have most commonly been concentrated across analyses of real data and/or focus groups
or throughout discovered preferences (ex-post) (de Luca & Di Pace, 2015).
Kim, Rasouli, and Timmermans (2017) argued that taking a decision of using shared
vehicle can be considered as either “mid-term” and/or a “short-term” commuting choice; thus,
from the perception of a mid-term commuting choice (i.e., buying a public transportation
seasonal ticket, car-ownership decision, or more), the choice is whether or not to use TNCs to
obtain this commuting preference for forthcoming travel-demand. When taking this choice, the
future-demand is ambiguous since it varies on different unexpected and expected requirements
for specific activities.
From the standpoint of a short-term commuting choice, the user(s) build their decision
on which type or method to select for handling a particular day-to-day activity. After picking
a car-sharing company, users might consider a shared-car for a precise trip, and they compare
it to other transport types like public transportation, bicycle, and more. Henceforward,
individual intention to use ride-sourcng companies might vary between both the mid-term and
the short-term decisions (Kim, Rasouli, & Timmermans, 2017).
2.4.2 Information availability
Nowadays, technological improvements push information transform and growth to the
the way that individual(s) share information. Accordingly, there is a demand to utilize the shift
to networked backgrounds which affects individual's cognition, specifically, decision-making
(Marusich et al., 2016). In fact, the most important core goal that face the marketers is to
provide information to consumers/users on which they develop their decisions (Ariely, 2000).
47
It is mostly recognized that people have limited capacity of processing the information,
as studies have presented the duration of processing information for individuals, which is
between five to nine chunks (Gao, Zhang, Wang, & Ba, 2012). Additionally, processing online
information is impacted by the level of engagement environment associated with this medium.
Individuals can choose their needed information to read, in which order and length that they
prefer (Sicilia & Ruiz, 2010).
Besides, Bei, Chen, and Widdows (2004), highlighted that dissimilar to conventional
information providers involving examples of magazines, TV, and newspapers; the Internet
serves its users with additional interactional communications that it is an exclusive feature this
medium.
In virtual setting, Sicilia and Ruiz (2010), stated that users access websites looking for
precise information. Taking the benefit of the Internet capability to transfer numerous
information to the users swiftly and effortlessly is a crucial aspect to e-commerce success.
Considerably there are many information systems (IS) studies related to e-commerce that
aimed to provide further great information to gratify consumers (Gao, Zhang, Wang, & Ba,
2012).
Likewise, the rising Internet dependency had led to explore information that is caused
by the subsequent features: a simpler accessibility to the product and price information,
comfortable purchase of related products/services, low transaction costs, and the capability to
reach mass volume (Bei, Chen, & Widdows, 2004).
48
In this respect, recent studies have noticed that the consequences of the quantity of
information has been raised on consumer's behavior. Selected studies were done by Chen,
Clifford, and Wells (2002); Luo (2002); Wang et al. (2007), have offered experimental
outcomes that implied that more information is better; however, others mentioned that negative
effects were resulted from delivering the consumers too much amount of information (as cited
in Sicilia & Ruiz, 2010).
All products/services can be positioned on a scale varying from an easy level to a
difficult level to evaluate; hence, their position on the scale relies on the level or the amount of
information obtained, categorizing information as experience, credence, or search products.
Nelson (1974), described search goods as those items categorized by product characteristics
where comprehensive information around the product is obtained before the purchase; as for
the experience goods which is categorized according to experience characteristics that can’t be
recognized until the purchase phase and afterwards the use of the purchased product (as
mentioned by Pham & Ahammad, 2017).
For instance, search goods like electronic and technological products are linked with a
greater level of standardization. Therefore, these types of goods are easily assessed before
purchase. Goods like telecommunication, vacations reservation, restaurants or books depend
on the expertise characteristics as a resultant of their intangible environment which prevents
consumers from assessing the desired quality unless they are purchased or consumed.
Accordingly, these experience-based goods should be linked with the minimal degree of
standardization. Credence goods like the financial investments, education, as well as legal
services are hard to evaluate, even succeeding the purchase and use. They are linked with the
lowest degree of standardization (Pham & Ahammad, 2017).
49
The increased amount of info might be stimulating to individuals' reduced processing
capability. From this angle and point of view, offering more knowledge to consumers could
not assure improved consumer satisfaction (Gao, Zhang, Wang, & Ba, 2012). Moreover,
studies done on the amount of info in the consumers’ decisions area indicates that offering
excessive information to consumers will result in negative effects for the marketer. The impact
on “decision-quality” researches, has been said that excessive information can lead to bigger
selectivity in the phase of information processing as well as consumer confusion, and in
common dysfunctional processing (Sicilia & Ruiz, 2010).
Another research aspect finds that the studies related to information processing
concludes that information quantity and information quality are between the most significant
aspects, that disrupts decision-quality (Gao, Zhang, Wang, & Ba, 2012). As a matter of fact, a
firm that offers information online to consumers related to the establishment, its services,
products, promotions, news, facts, (and/or) figures, as well as many other criteria, will be far
better than the offline media, because the consumer extracts more info from the Internet rather
than the regular offline media, which raises a possibility of its outperforming the consumers’
processing capability (Sicilia & Ruiz, 2010).
This condition is particularly unfavorable for online experience product purchases.
These experience goods are categorized by equivocality, indecision, and are challenging to
assess. These features make the buying of experience products / services over the internet a
considerably complicated mission if compared to the mission of buying search products or
services (Gao, Zhang, Wang, & Ba, 2012).
50
Bei, Chen, and Widdows (2004), defined search products as products that have many
integral features on which the need for full information to be obtained before purchase like
mobile phones or athletes’ shoes. In contrast, the experience products are governed by features
that can't be identified until the buying decision takes place and the actual use of the product,
or due to the search for information which is pricier and / or challenging than the direct goods
and product experiences, like dinning at new restaurants and travel packages.
Additionally, individuals’ informational related costs of searching are generally
somewhat uniquely built on the features and attributes of search products versus the experience
products. Essential attributes of the search products are found to be more objective, easily
accessed, and solid for comparing the quality of the product. On the other hand, consumers
depend on more external cues to judge and analyze the quality of the experience based products
and services (Bei, Chen, & Widdows, 2004).
For instance, Bei, Chen, and Widdows, (2004) mentioned that the info for choosing an
adequate travel package is relatively theoretical and oriented to experience. Accordingly,
others suggestions might be applicable for experience goods more than search goods.
Furthermore, Westbrook and Fomell (1979), argued that information sources are
generally characterized into neutral, commercial, and personal sources. The neutral
information sources involve magazine articles, consumer reports, books, the commercial
information sources contain stores visits and media, and the personal information sources
involve seeking opinion or advice of family, neighbors, or friends. Equally, Hawkins and
Mothersbaugh (2014), well-defined the available sources of information based on five main
sources or types:
51
- Personal sources such as family, friends, and others.
- Personal experiences, low-involvement learning, and memory of past searches.
- Independent sources like government agencies, consumer groups, and magazines.
- Marketing sources like websites, advertising and sales personnel.
- Experiential sources like product trial and inspection.
Empirical studies by Hill, King and Cohen, (1996); King and Balasubramanian, (1994),
have recommended that consumer search for experience products depends on the Word-of-
Mouth (WoM) product testing assessments, communications and related sources of a group or
individual decision concerning quality of products (as cited in Rha, 2002).
2.4.3 Price and value impacting application adoption and usage choices
In comparison to the traditional taxi market, ride-sourcing significantly varies in the
essential market principles like demand, supply, price, and competition. In fact, the competition
between Lyft, Sidecar, and Uber set prices at competitive levels. For instance, McBride (2015),
claimed that UberX is the cheapest service against its rivals and it costs less than traditional
taxis services in nearly all major cities around the world. In this respect, many consumers will
formulate their decisions based on price, and the fact that ride-sourcing normal fares are
cheaper than those of traditional taxis enables them to have a competitive advantage.
The research proposes that customers are sensitive to the price factor when they request
a ride. Relatively, consumers are expected to cancel their trips if they are not served instantly.
Genuinely, consumers who utilize ride sourcing apps must experience paying an amount of
waiting period price that depends and varies based on the number of consumers who are
simultaneously demanding the services, the available nearby drivers, and the matching
technology criteria adopted by that specific ride sourcing. (Zha, Yin, & Du, 2017). Likewise,
52
clear information and waiting time concerning price most obviously encourage efficiency for
consumers (McBride, 2015). Accordingly, the consumers are sensitive to both the average
waiting time and the fare price.
Similarly, vehicle ownership is linked with an enlarged likelihood of greater revenues
and employment chances, yet the ownership of vehicles can be an extra burden for the low
income persons because they can hardly tolerate the costs of acquisition, maintenance, and fuel
(Dillahunt, Kameswaran, Li, & Rosenblat, 2017).
There is no doubt that the capability to expect trip fares through the ride-sourcing
company's platform promote increases consumer understanding concerning a trip - as the GPS
systems simply estimate the time and distance required of the possible trip. A consumer's
capability to know the price enables his/her to fairly assess the trip's utility and sort decisions
accordingly (McBride, 2015). Moreover, real-time ride-sourcing services can decrease the
charge of transference through making use of idle private vehicles (Dillahunt, Kameswaran,
Li, & Rosenblat, 2017).
Besides, the entire trip-related costs are generated by the automated payment and
pricing functions of that specific ride sourcing company, that consequently eliminates the mess
resulting from bargaining and soliciting that repeatedly arises after a taxi market is decontrolled
(Zha, Yin, & Yang, 2016). The smartphone app generates the fare with no physical meter;
unlike taxis, that require a physical meter (McBride, 2015).
Studies were done by Zha, Yin, and Yang (2016); Zha, Yin, and Xu (2018), showed
that these ride-sourcing apps are free to use and applying a similar ride payment schema as
conventional taxi services, which embeds distance-based, time-based, and frag-drop charges.
Although, every accomplished ride/ transaction, the company usually charges 20–25% of the

53
cost paid by the consumer as a commission. Thanks to their competitive prices and
convenience, ride sourcing companies managed to effectively attract many consumers,
corroding the conventional taxi marketplace.
In spite of the less charges, these ride sourcing services might still be unreachable for
individuals with weak income because of the payment techniques required to use these
services, furthermore the requirement of mobile Internet data access which is not available for
all slices (Dillahunt, Kameswaran, Li, & Rosenblat, 2017).
2.4.3.1 Surge Pricing
The major key aspect of differentiation in the ride sourcing market is the offered price
variation and accompanied strategies, e.g., Lyft and Uber surge-pricing systems. The
differentiation of price is both spatial and temporal. Also, it is promoted to be generated when
there is a shortage in vehicles supply (or equally if there was a demand surge) subsequently, to
appeal more drivers to be online or operate in the zones suffering from supply shortages,
additionally bound the service to customers with the greater eagerness for payment (Zha, Yin,
& Xu, 2018).
Alongside the unregulated supply, and the shortage of pricing regulation that forms an
environment with charges below that of taxis throughout normal periods within Lyft and
UberX (McBride, 2015). As a matter of fact, these TNCs provide price controls target to protect
both riders and drivers (McBride, 2015).
Although, the main drawback of the ride-sourcing pricing system is the "surge-pricing",
that multiplies the price of Uber-like services' , accordingly rides fare jumps by mutiliple times
of the base fare on the holidays, weekends and rush hours (The Economist, 2014). Banerjee,
Johari, and Riquelme (2016), mentioned that both Uber and Lyft have been using a dynamic
54
pricing strategy (referred to as ‘Surge-Pricing' in Uber & ‘Primetime Pricing' in Lyft) for many
consecutive years.
Surge pricing, basically described as a “dynamic pricing system” that adapts the trip’s
cost in real time. It is based on the market circumstances in respect of a geographical range,
the base trip’s cost is adapted by an automatic surge multiplier which is generated from the
application’s algorithm. Information derived from the surge multiplier (SM) and the price-
multipliers (PM) is displayed to both the driver and the customer before a commitment
transaction starts (McBride, 2015; Zha, Yin, & Du, 2017).
Equally, ride-sourcing consumers determine their pricing preferences when choosing
whether or not to agree on a higher fare. Following a user’s request for a trip, he/she is informed
that surge pricing is valid and inquired whether he/she would like to take a ride for the higher
fare, or to be notified when the surge pricing period ends (McBride, 2015). Furthermore, the
surge-pricing is encouraged to promote a rational amount of waiting time for customers (Zha,
Yin, & Du, 2017), and typical price-multipliers are related to the specified area based on
geolocation which is updated frequently (Zha, Yin, & Xu, 2018).
Surge pricing commonly function properly with the TNCs present policy of charging a
calculated fixed percentage of commission consequently earning outcomes close to the ideal
agreement, the app continuously establishes and calculates both the wage for the drivers and
the price for the customers. Thus, it helps to increase the company’s profit though the resulting
effect on customers’ surplus is still unclear. (Zha, Yin, & Du, 2017).
Furthermore, Uber's price surge aims to solve this issue, through a countless technology
businesses, Uber is a middle-man; that links the independent vehicle drivers with customers
requesting a ride similar to the manner that Google does when it connects advertisers and
55
searchers in addition to those who eBay links bidders & sellers (The Economist, 2014).
Likewise, Identifying the role of waiting-time in customers’ the demand causes a distinctive
comprehension of the fundamental technique, which is mainly significant to assess the agents’
satisfaction in surge-pricing (Zha, Yin, & Du, 2017).
Business model performs if successful links are complete, since cost points increase the
payment that Uber's drivers obtain (the drivers receive Eighty % of any charge, if they use their
owned vehicle), more vehicles are attracted on the roads at intervals of high-demand. The
prices go high at 2 am at the weekend because some people are willing to pay more to find a
vehicle. Additionally, some drivers are not willing to work during the weekends (The
Economist, 2014).
Nevertheless, the business practice of surge like pricing resulted in opposition among
its customers. Many are disappointed and also annoyed consequent to being charged
particularly with considerably high tariffs. Others stated their concern about these platforms
regarding the use of surge-like tariffs to gather higher income benefiting from the existing
percentage and commission schema (Zha, Yin, & Xu, 2018).
A few studies conducted by Hall and Krueger (2015); Chen and Sheldon (2016), about
exploring how the supply of labor replies about surge-pricing by Uber-like services: however,
no robust sign that surge-pricing stimulates drivers to work in highly surged areas specifically
in a short time period during the surge. (as cited by Zha, Yin, & Xu, 2018).
2.4.4 Service quality
During the past twenty years, literature done on conventional quality of service that is
related to the retailing experience or an interpersonal service, has presented a better
clarification through providing the notions and factors of “the aspects, the consequences, and
56
the antecedents”. In fact, factors like credibility, appearance, communication, understanding,
availability and accessibility are similarly appropriate to the electronic commerce; because they
are related to the conventional retailing (Bressolles, Durrieu, & Deans, 2015).
Likewise, quality of the service contains some aspects that is associated to the delivery
of the service process as well as tackling the intangible standards of the added value, security,
and ease of manipulation of the information to consumers (Kahn, Strong, & Wang, 2002).
Besides, Zha, Yin, & Xu2 (2018) argued that the present attempts are still trying to maintain
and ensure the quality level of the service provided like (i.e., driver censoring, inspection of
the vehicle, and requirement of an insurance coverage).
Over a long period of time, the quality of the service has been the most significant area
to study the consumers’ assessment of the service provided (Anselmsson & Johansson, 2014).
Besides, Mehta, Lalwani, and Li Han (2000), emphasized that quality of the service is gradually
being proposed by marketers as a strategy to place themselves more effectively in the market.
Thus, the research on quality provides more exclusive sights, defining quality in one of four
common means: as value, conformance to qualifications, excellence, and/or exceeding or
meeting consumer expectations (Kahn, Strong, & Wang, 2002).
Kahn, Strong, and Wang (2002), claimed that information consumers don't obviously
differentiate between the characteristic features of information as well as the characteristic
features of both the software and hardware structures that bring this information. On the other
hand, information that is considered as a service emphasis on the behaviors happening once
the info is saved as a final-product in the database: gaining and consuming information.
Information related to the quality of the service tackles these hidden features that become
57
obvious throughout the consumption (e.g. whether the information is clearly accessible and can
simply be manipulated and aggregated).
To regulate a business quality of a service, it is critical to pay attention on particular
characteristics that are regarded as significant to the selected consumers and to also provide the
suitable and respectful kind of services (Anselmsson & Johansson, 2014). Literature done in
information systems and marketing (Barnes and Vidgen, 2002; Bauer et al., 2006; Bressolles,
2006; Collier and Bienstock, 2006; Cristobal et al., 2007; Loiacono et al., 2007; Parasuraman
et al., 2005; Wolfinbarger and Gilly, 2003; Yoo and Donthu, 2001), suggest that five key
aspects of online quality of service that is commonly applied to evaluate electronic service
quality (as cited in Bressolles, Durrieu, & Deans, 2015).
1. Information: the lack of communication with the provider of the service throughout the
online purchasing may rises the demand for precision as well as clarity of information.
This aspect measures the online consumer’s insights of the quantity and quality of both
technical and commercial information concerning the services/products that the online
provider offers.
2. Aesthetics: are related to the prosperity and richness associated with the demonstration
of the website’s context as allied to its proper appearances, such as images, videos,
graphics, icons, colors, animated structures, and much more. These aspects provide the
feeling, appearance, and ambiance of the website.
3. Ease of use: online payment transactions may appear as a complicated action and thus
it might terrify some users. In fact, the ease of use of a website is an imperative element
on electronic service quality. Eventually, the ease of use was signified to as “Usability”
of the online context. Moreover, usability as an element in the substantial world,
indicates the layout of the store/shop. Comparably, usability for a website, signifies the
58
capability of the consumer to locate the information or make transactions with the
minimum extent of effort used.
4. Security and privacy: is identified as defending and saving the consumer from any
potential risk of imitation or monetary losses. While privacy defined as protecting the
user’s private information and the explicit or implicit settlement not to exchange or sell
the user’s private data that was collected throughout process of completing the
purchase. Therefore, this aspect is important and specific to e-commerce.
5. Reliability: in a conventional environment, is associated to the capability of online
suppliers to sustain their guarantees to satisfy the standings of the trading as well as
distributing the product as it was originally requested (as regards of the description,
amount, and cost) whereas fulfilling the service needs and admiring the stated delivery
time frame.
Furthermore, both product and service quality are significant features of information
quality (IQ), while the conservative opinion of IQ is product-oriented (Kahn, Strong, & Wang,
2002). Additionally, service quality is associated with some consumer outcomes: purchase
intentions, customer satisfaction, and attitudinal loyalty. However, no agreement occurs on the
magnitude, direction, or statistical significance of the impacts of the quality of the service on
such consequences. Miranda, Tavares, and Queiró (2018), when research evaluate the relation
between satisfaction and service quality, their results are unreliable. Whereas some studies
suggested a powerful impact, others discover a much weaker impact. Carrillat et al. (2009)
discovered that the service quality is positively affect and impact the satisfaction (as cited in
Miranda, Tavares, & Queiró, 2018).
In previous literature two models were dominating the studies on the service quality.
The first model is "SERVQUAL", which is constructed and grounded on the theory of
59
"disconfirmation of expectations" which depends on the variation among the consumer's
anticipations around a certain service/product and the assessment of the perception regarding
the service/product. Also, the SERVQUAL model is a multi-dimensional method that applies
the aspects of empathy, tangibles, responsiveness, assurance, and reliability. In addition to the
second model of the "SERVPERF" method, which undertakes only service quality that requires
to be assessed by applying the consumers' perception of the perceived quality. Both models
demonstrate the presence of a relation between consumer satisfaction and quality of service (as
cited by Miranda, Tavares, & Queiró, 2018).
Some consumers believe that online payment transactions are subjected to delay dates
of delivering the products, or total failure to deliver, unnecessarily complex, experience a
shortage of reply response to the e-mails, and don’t offer enough information concerning the
products. Thus, this might provide a negative impact on the customer value (CV) as well as
customer satisfaction (CS) with the online familiarity and electronic loyalty. Similar to the
conventional retailers, service quality presents an essential part in the survival and success of
online providers (Bressolles, Durrieu, & Deans, 2015).
Bressolles, Durrieu, and Deans (2015), mentioned the definitions of four core
dimensions of CV. These elements were utilized for the online environment; as the Social
value: is originated from the website’s capability to improve social self-belief; similar to the
website’s ability to be allied with the social status, group, and class; As for the functional value:
which is originated from the expected performance and obtained quality of the website; the
observed utility gained from a website’s capability for utilitarian and/or functional
performance.
In monetary value: the provided utility is originated from the website throughout the
decrease of its observed costs over long-term and short-term periods; it is motivated and
60
impacted by factors like convenience, time savings, and economic value for money; Emotional
value: is originated from the affective states and/or feelings that the website produces.
Moreover, satisfaction as mentioned earlier is crucial in the perceived service quality;
therefore, satisfaction as a concept is a pre-post assessment of the consumers’ consumption or
experience of the product/service, and it is recorded as a negative, identical, or positive
emotion. Additionally, satisfaction is well-defined as it is the effective condition happening
from an activity of cognitive and affective assessment of a particular payment transaction.
Besides, mainstream elements of satisfaction are consumer assessments of the service as well
as the service features, their perception of fairness or equity, consumer feelings during the time
the service was consumed, and the impact of others (e.g. family and friends) who use the
service simultaneously or occasionally (Bressolles, Durrieu, & Deans, 2015).
In other words, satisfaction can be defined as a general assessment grounded on the
overall buying decision as well as the gained experience associated with the product/service
over time. The concept of gratification has developed from a mental-based perception to a
mental-emotional perception. Otherwise, the concept of complete satisfaction is quite
commonly applied to measure the overall assessment according to the aggregate accumulated
experiences linked within the company, product, or service in a justifiable manner, which
explains the prolonged time limit (Miranda, Tavares, & Queiró, 2018).
Currently, Electronic satisfaction represents the most vital aspects of service quality, E-
satisfaction as a concept had become increasing prominence in marketing research in current
years. Accordingly, e-satisfaction is referred to the consumers' selection of their online selling
experience via there retailer's website that is compared to the experiences they had previously
with different traditional or online stores (Bressolles, Durrieu, & Deans, 2015).
61
Similarly, CS is defined as the consumer's inclusive assessment of a certain
product/service following the purchase phase. Plus, CS is a result of consumer's experiences
throughout the purchasing process and shows an essential function that straightforwardly affect
the consumers' potential behavior (Pham & Ahammad, 2017).
In this respect, CS is a crucial element to generate customer loyalty, as consumer loyalty
influences behavioral consequences like a positive WoM, repurchase intention and eagerness
to pay a little more. Numerous reports have discovered indications for a positive correlation
between the repurchase intentions and the consumer satisfaction. When consumers are
disappointed after doing a purchase, they are expected to provide a negative WoM, while
satisfied consumers are expected to deliver positive WoM (Pham & Ahammad, 2017).
Henceforth, Oliver (1997) well-defined customer loyalty as:
“Deeply held commitment to rebuy or re-patronize a preferred product or
service consistently in the future, despite situational influences and
marketing efforts having the potential to cause switching behavior,”
(Oliver, 1997, p. 392).
Normally, loyalty contains two basic dimensions (the attitudinal and the behavioral).
The Attitudinal loyalty, is understood as the behavioral intention of sharing or repeating
positive outcomes related to the same product/service. Attitudinal loyalty is considered as the
final result of any other evaluation (Bressolles, Durrieu, & Deans, 2015).
In the online environment, e-loyalty is referred to the consumer eagerness to sustain
and secure a stable connection in the future and similarly to involve in a repetition behavior of
ac certain purchase and/or visits of online services/products, through using the firm's website
as the basic primary select among alternatives, maintained thru positive emotions and
62
promising viewpoints towards the online firm, in spite of marketing efforts and situational
impacts that leads to the transference of a behavior (Bressolles, Durrieu, & Deans, 2015).
The gradually organized usage of the internet in the processes of the consumers’
decision, is attached with the improvement of e-commerce that has guided the practitioners and
researchers to inspect the correlation between the service quality, CS, CV as well as loyalty in
the online setting. Furthermore, at any selling framework, the greatest method to improve CS
and eventually enhance loyalty is to provide excellent added value that is oriented from
exceptional service quality (Bressolles, Durrieu, & Deans, 2015). As a matter of fact, research
demonstrations that perceived service quality is considered to be an antecedent of the consumer
satisfaction. In fact, service quality is a variation among the anticipations of the consumers and
their insights about the service performance (Miranda, Tavares, & Queiró, 2018).
2.4.5 Delivery of incentives
The common brand-oriented advertising doesn’t have the necessary effect on the
consumer anymore. A crucial matter for businesses is the improvement of mixed product-
promotion strategy where the mechanisms complement and support each other. Efficient sales
promotion management can boost purchasing, even in the situation a consumer was initially
attracted to an alternative brand (Karpenko, 2016).
Moreover, to encourage consumers to use a new service on a mobile platform
underneath an aggressive competition, companies have applied several mobile application
marketing strategies, exclusively on sales promotion, to battle over the number of transactions
and users (Suriyamongkol, 2016).
Currently, there is no agreement between the practitioners and scholars of marketing
regarding a unified method to describe types of sales promotion. Simultaneously, several
63
methods and types of sales promotion are extensively applied in practical marketing activity
(Karpenko, 2016).
Sales promotion is an effective aspect of marketing communications as they enable
enhancing and accelerating reverse consumer's response, to form consumers demand in a
particular place and at a specific time. Thus, it can be considered as an instrument to enhance
and incentive motivation (Karpenko, 2016).
Usually, tools of sales promotion (in common research is regularly used a term below-
the-line tools – BTL tools) include purchasing with a discount card (coupon discount);
sampling which is a free tasting (or offer) of a product sample; lotteries, games, competitions,
purchasing with a gift, merchandising, contests for consumers, brand souvenirs, and
promotional pack (Karpenko, 2016).
Furthermore, price incentives policy is applied by methods of discounts, usage of
coupons and promo codes at the sites of distributors and entrepreneurs (Karpenko, 2016). For
example, Ackaradejruangsri (2015) argued that the fare of on-demand transportation services
could be paid either by credit card or by cash, and several promo codes can be applied as a
discount to the fare.
Karpenko (2016), mentioned that picking any specific sales promotion tool relies on
the objectives of the entrepreneurs. Modern sales promotion tools are divided intothree3 main
categories:
1) Price quotations such as (selling with discount coupons, decreased prices, cumulative
discounts, discount ticket, etc.)
2) In-kind offers such as (free product samples, premium, etc.)
64
3) Special active offers such as (Lotteries, contests for customers, games, etc.)
Contemporary sales promotion tools have to be technological and individualized.
Instantaneously, they have to be a straightforward mechanism of execution, and have
substantial impact on the progress of purchasing (Karpenko, 2016).
As a result of implementing incentives to on-demand transportation services area,
several TNCs are established with the notion of sustainability in concentration, although TNCs
needs to provide incentives to attract multiple passengers (Retamal, 2017).
Suriyamongkol (2016), mentioned that two prominent transportation network services
in Thailand (Grab and Uber), have been heavily providing promotions and discounts on their
services; such as (Discount Promo Code, Free ride trial, Discount by limited area or time,
Referral program, etc.).
Besides, Grabhase generated much more different promotional messages than Uber
with numerous types of sales promotion methods, such as (area discount, holiday campaign,
credit card promotion, co-promotion with other brands, etc.). In contrast, Uber sales promotion
techniques typically offer more general methods at a longer period of time, and sometime Uber
involved with a special event, specific places or locations (Suriyamongkol, 2016).
Overall, Suriyamongkol (2016) said that both companies have rare common limitations
for sale promotion practice and they both apply similar techniques such as (Discount amount,
eligible times, promotion period or usage date condition, time of day and area or location
conditions).
65
Leesa-nguansuk (2015) claimed that greater marketing promotions and incentives must
be presented to consumers and drivers to push the ride-sourcing app market, which justifies
this insistent sales promotion between the new ride-sourcing service apps.
Such promotion tools can improve sales within the shortest achievable period by 300
to 500%, but if the product/service itself was poor in quality, then sales promotion can weaken
the sales and reducing the credibility of the brand (Karpenko, 2016).
It is worth to highlight that sales promotion tools can’t be perceived as an instrument
for the long-standing communicative influence. These communicative activity tools are
beneficial for the short-term impact on the market, emphasizing one specific brand, and
creating a customer flow (Karpenko, 2016).
66
2.5 Problems and challenges
Recently, these on-demand mobility services have developed quickly in terms of
drivers, customers, and geographic ranges operated. In the current situation, ride-sourcing
companies seem similar to taxis, which had made an excessive tension and policy confusion
“fairness” in regulatory dealing between ride-sourcing companies and taxis (Rayle, Shaheen,
Chan, Dai, & Cervero, 2014).
Since their beginning in 2009, TNCs have experienced enormous achievement, but also
generated several debates. Since the traditional taxi market is typically restricted in terms of
entry, fare, as well as service quality whereas relatively less regulatory demands that have been
forced on TNCs’ services; likewise, imbalanced competition was claimed mostly by taxi
drivers and their managers, who filed lawsuits and prepared strikes all over the world. TNCs
have caused a headache to the legislators and government representatives (Zha, Yin, & Yang,
2016).
As several legislators and government officials are still speculating on what to do
regarding the ride-sourcing services, some of them have already determined to forbid and/or
consider these services as illegal; while others accepted these services as a new sort of
transportation provider, and others have approved them according to laws and regulations.
While these rules and laws had some variances, in terms of largely unify the inspection
protocols, drivers’ background checking, and insurance coverage that applied already by the
TNCs’ services. There is no involvement in the size and the number of the associated fleet (i.e.,
the amount of available vehicles) or service fares (Zha, Yin, & Yang, 2016).
Likewise, opponents mentioned that ride-sourcing services are unfairly doing the
following: ignore current regulations, rise jamming at peak times, battle with public transport,
67
endanger public safety and misinform customers through blurred pricing practices (Rayle,
Shaheen, Chan, Dai, & Cervero, 2014). In this respect, de Luca and Di Pace (2015) highlighted
the most critical problems rely on the fixed costs of the TNCs’ services as well as the
overvalued or undervalued profits, mostly decided by the misinterpretation of riders’ behavior.
The success of TNCs has raised the worries on the regulation related to the taxi market
that is frequently complained about its limited supply. Features like mutual rating (the
reputation system) and real-time rider/driver matching presented by the TNCs to improve the
communication between the riders and drivers. In fact, on-demand transportation industry is
considered as self-regulated due to the competition between multiple TNCs’ services that might
decrease the costs and diminish the market control of a specific major platforms (Zha, Yin, &
Yang, 2016).
Furthermore, the research proposes that the individuals with low-income don't benefit
as much as the individuals with higher-income, because several drivers are unwilling to work
in poorer zones due to distance and observed safety issues. Despite what these services offer
as a substitute to vehicle ownership which accordingly can dramatically lesser the budgets of
transportation by making personal vehicles more effective and useful, scholars have discovered
that families with low-income are not as likely as families with high-income in using and
gaining benefits from these types of services (Dillahunt, Kameswaran, Li, & Rosenblat, 2017).
On the other side, the present-day trend shows that the car-sharing industry is fighting
to attain profitability even as membership rises over time. Undoubtedly, several existing car-
sharing programs had been (and are) monetarily sustained by governments and communities
thru marketing, free parking spaces, starting investments, tax incentives, etc. Simultaneously
68
alternative methods to make car-sharing more cost-effective are targeting to escalate the
quantity of their members (with charge), however there is a reduction in the rate of use (de
Luca & Di Pace, 2015).
As an example, the kind of service delivered by Uber is unique compared to some of
its competitors like Lyft and Sidecar in San Francisco itself, who already afforded app-based
services similar to the ones that presented by Uber in 2010. In fact, Lyft still a main opponent
in the United States, although Uber had met main regional competition from companies as Ola
services in India, Gett services in Israel, and Grab services in South-East Asia (Dudley,
Banister, & Schwanen, 2017).
In several cities and nations, Uber has implemented an intrusive method which has
wanted to bypass regulatory systems. As a result, this was mostly obvious in Europe, where
the company has challenged severe battles with regulators, governments and traditional taxi
operators in Belgium, France, Italy, and Germany, as in 2016 in Hungary, Uber was effectively
as illegal and pitched out of the nation by its regulators (Dudley, Banister, & Schwanen, 2017).
Dudley, Banister, and Schwanen (2017), emphasized that the critical political dilemma
for regulators and governments is that, while Uber offers an effective and fairly cheap service
that is common with the customers, which can threaten the existence and status of traditional
operators, and make regulatory systems look unsuccessful. Likewise, by involving into idle
capacity, Uber can perform as an essential initiator of occupations. Simultaneously, the
company rejected to treat its drivers as employees in which can cause pressures in terms of
hours operated, broader social security, and the payment of benefits.
Therefore, the California Public Utilities Commission (CPUC) — released desist and
terminate letters to all the companies like Uber, Lyft, and Sidecar, which were obeyed by
69
citations of $20,000 each in 2012 for claimed illegal operations. In September 2013, the CPUC
created a new classification of motorized vehicle transporters, identified as Transportation
Network Companies (TNCs). Besides, the CPUC described the TNCs as operators that offers
pre-arranged transport services for a fare-using an online-based platform or application like
(smartphone applications) to associate passengers with the drivers who are using their personal
vehicles (Rayle, Shaheen, Chan, Dai, & Cervero, 2014).
Underneath the new procedures, companies that accepted to operate as a TNCs were
requested to take a license from the CPUC, have a driver teaching program, provide criminal
background reports of all drivers, preserve a “zero tolerance” rule on alcohol and drugs, and
keep at least $ 1 million for each accident as an insurance coverage (Rayle, Shaheen, Chan,
Dai, & Cervero, 2014).
CPUC approved other policy provisions considering secondary insurance through two
main phases of TNC operations: 1) “app-on” as well as 2) “in-service” (passenger(s) in the
vehicle) (Rayle, Shaheen, Chan, Dai, & Cervero, 2014).
2.5.1 Trust and Privacy safeguards
Trust is considered to be a major obligation for the shared-economy including TNCs to
be successful, otherwise distrust in Internet may result in safety concerns. Therefore, the users
are not that comfortable with the notion of providing their personal credit card information and
disbelieved other users’ evaluations of suppliers for companies like Lyft. In fact, trust is
associated with safety, privacy, monetary transactions administered by the online platform,
trust between strangers, and time investment as well as upfront social commitment to shaping
trusted relationships. As a matter of fact, all the current apps require trust as an essential
function to be successful, particularly the technologies that depend on both social and monetary
transactions (Dillahunt, Kameswaran, Li, & Rosenblat, 2017).
70
Trust has been considered through distinctive disciplinary lenses, in fact former
research associated to trust in the e-commerce environment tends to be loosely integrated, case-
specific, and/or disjointed. For instance, most literature on technological trust has focused
closely on concerns of public key infrastructure, security, privacy, and other technical parts of
trust. Some contemporary studies have based their attention on the behavioral and social
dimensions of trust in an e-commerce setting, but these were also barely focused (e.g., focused
on trust in the society of retailers as a group, or researches focused on a restricted amount of
trust antecedents), and consequently researchers had not yet settled an inclusive utilization of
the elements that anticipate consumers’ trust in the e-commerce context (Kim, Ferrin, & Rao,
2008).
Characteristics of trust had been studied in several types of researches in many
distinctive fields, such as management, economics, social, institutional, and technology
contexts, consumer psychology and behavior. Trust as a factor is grounded on the consumer's
anticipations towards the vendor who did not take advantage of the situation and did not have
an opportunistic attitude, but will perform in an ethical, dependable, and socially suitable
manner, achieving his/her promises despite the consumer's dependence and vulnerability.
Accordingly, the consumers' perceptions of trust-worthiness are expected to control the final
purchasing decision between the consumer and seller (Pappas, 2016).
Dillahunt, Kameswaran, Li, and Rosenblat (2017), highlight some important
characteristics of trust such as the lack of transparency about the control the platform like
(decision-makers, surge-pricing decisions, monetary transactions) as well as trust between
strangers. Likewise, a shortage in transparency according to the means of how surge pricing
71
system is implemented; similarly, shortage of digital literacy and/or accessibility (i.e., an
accessibility shortage to either the Internet, Wi-Fi, or smartphones), restricted accessibility to
credit cards, mobility and accessibility concerns.
The connection between behavior and intention is grounded on the belief that people
effort to perform reasonable choices according to the information offered. Accordingly, an
individual's behavioral intention to complete (or not to complete) certain behavior is resulted
as an instant factor of that individual's genuine behavior (Kim, Ferrin, & Rao, 2008).
Additionally, it has been discovered that individuals are more possible to believe the
information offered by other consumers like themselves more than the information that offered
by companies. Thus, throughout the consumers’ positive trust in recommendations or opinions
distributed by dissimilar other consumers, online platforms could escalate their transactions
(Hsiao, Chuan‐Chuan Lin, Wang, Lu, & Yu, 2010).
Consumers might pay slightly more on online transactions that sellers provide to defend
their personal information. A huge number of United States consumers have worries towards
the online security and privacy, as they are suspicious of dealing with online businesses that
don't have acceptable security system, according to their point of view. Businesses, consumer
groups as well as governmental agencies agreed that confidentiality should be significantly
enhanced (Sam & Chatwin, 2015).
Kim, Ferrin, and Rao (2008) argue that there are four types of antecedents that affect
consumers’ trust as well as consumers' perceived risk regarding electronic commerce bodies.
These include the following types: 1) Cognition/observation-based antecedents (i.e.,
72
information quality, security protection, privacy protection, system reliability, etc.). 2) Affect-
based antecedents (i.e., word-of-mouth, reputation, recommendation, referral, purchasers'
feedback, and much more). 3) Experience-based antecedents (i.e., familiarity of the product or
service as well as Internet and e-commerce experience). 4) Personality-oriented antecedents
(i.e., the tendency to trust, style of shopping).
2.5.2 Other Potential Risks
In order to deliver an improved experience and expand consumer participation in on-
demand mobility services, the risk related to this new market must be recognized. In the
performance risk, the probabilities of an element lacking to fulfill the performance desires
initially proposed during the purchase. The consumer satisfaction level is profoundly affected
by the performance risk, when the service obtained isn’t fulfilled and met the expectations.
Similarly, performance risk is very close to operative risk in which it includes the user’s
conviction of the obtained product/service that did not provide the desired remunerations to the
consumer (Hawapi, Sulaiman, Abdul Kohar, & Talib, 2017).
Most the TNCs’ drivers are not professional drivers, as they are likely to be unaware
with exact places or roads. Figures adopted from Benenson Strategy Group in (2014),
demonstrates that almost 64 percentage of Uber drivers, does not have former driving
Likewise, riders worry about the vehicle’s availability at the required time they chose. So,
product availability as a risk is categorized as the noticed product/service risk (as cited in
Hawapi, Sulaiman, Abdul Kohar, & Talib, 2017).
One of the external aspects of psychological risk is a social risk that is defined as the
possibility of making the purchase decision depending on others. Alternatively, the social risk
73
is similarly described as the possible damage to standing in a social belief as a consequence
result of accepting a product/service. One of the reasons for rejecting the social recognition
regarding collaborative consumption is due to the licensing and unfair tax obligation (Hawapi,
Sulaiman, Abdul Kohar, & Talib, 2017).
Reputation as a risk was defined as consumers’ noticed perception of a particular
product/service or inclusive perception of the noteworthy features regarding the
products/services or companies. Likewise, reputation is clarified as the observed value gained
from the product/service according to previously gathered behavior of the value. Moreover,
reputation might be negative influence by the gap happened in the time resulted by wrong or
late transaction, which it is reliable on the recent done transactions; accordingly, it may be
diminished over time. Inclusive evaluation founded on long-term behaviors lessen reputation
from the associated risk, which is linked to short-term behavior evaluation (Hawapi, Sulaiman,
Abdul Kohar, & Talib, 2017).
74
CHAPTER 3: THEORETICAL FRAMEWORK
3.1 Unified Theory of Acceptance and Use of Technology (UTAUT /
UTAUT2)
To explain consumers’ acceptance and use of TNCs, there have been numerous
theoretical academic models, established from distinctive theories in the sociology and the
psychology areas. One of them is “the Unified Theory of Acceptance and Use of Technology”
or as known as (UTAUT) that was developed and created in 2003 by Venkatesh, Morris, Davis,
and Davis.
In fact, Venkatesh and his colleagues reviewed, compared and summarized eight
previous models/theories of technology use: 1) the Technology Acceptance Model (TAM); 2)
the Innovation Diffusion Theory (IDT); 3) the Social Cognitive Theory (SCT); 4) the Theory
of Reasoned Action (TRA); 5) the Theory of Planned Behavior (TPB); 6) the Motivational
Model (MM); 7) the Expectation-Confirmation Theory (ECT); 8) and the Model of PC
utilization (MPCU).
Research on UTAUT has shown that this model has four significant constructs:
Performance Expectancy (PE), Effort Expectancy (EE), Social Influence (SI), and Facilitating
Conditions (FC), which has an influence on the behavioral intention (BI) to use a technology
and/or technology use (Venkatesh et al. 2003; Venkatesh et al. 2012; Chang, 2012; and Arenas-
Gaitán, 2015).
Furthermore, Venkatesh et al. (2012) mentioned that UTAUT had refined the major
contingencies and factors related to the prediction of behavioral intention to adopt or use a
certain technology and/or technology use. Since its original development, UTAUT has been
75
used as a standard model and executed to explain a variety of technologies in non-
organizational as well as organizational contexts. Various replications and applications of the
whole model or selected parts of it took place in either non-organizational and organizational
settings. According to Venkatesh et al. (2012), UTAUT integrations/extensions have three
broad types:
The first type of integrations/extensions studied UTAUT in new settings, e.g., new
cultural settings (such as China, India), new technologies (such as collaborative technology
and health information systems), and new consumers’ populations (such as healthcare
consumers and specialists). The second type was the add-on of new, different variables in order
to enlarge the opportunity of the internal hypothetical instruments defined in UTAUT. The
third and the last type is the presence of external predictors of the UTAUT constructs. These
wide-ranging applications, integrations/extensions, and replications of UTAUT have been
valuable in developing the model to UTAUT2 to understand technology usage and adoption as
well as increasing the theoretical edges of the provided theory (Venkatesh et al., 2012).
In 2012, Venkatesh et al., provided an updated version to their prior UTAUT model to
adapt it to the consumers’ setting. The new updated model was (UTAUT2) and combined three
new primary variables: Hedonic Motivation (HM), Price Value (PV) and Habit (HT), that plays
a major role in the use of innovative technologies by consumers. Furthermore, Arenas-Gaitán
(2015) said that fundamental variance between UTAUT and UTAUT2 models is the behavior
intention (BI) and the usage relationship that is controlled by the experience associated with
technology. Besides, the individual characteristics can moderate the impact of habit on the
behavioral intention.
76
3.1.1 Behavior Intention (BI)
Behavioral Intention (BI) well-defined as a consumer’s intention to achieve a exact
action, which can be expected similar behaviors when an individual performs actions
voluntarily (Islam, Kim Cheng Low, & Hasan, 2013). Similarly, behavior intention is the range
to which a consumer has expressed conscious plans to either to perform or not to perform
several required future behaviors (Arenas-Gaitán, 2015).
Likewise, behavioral intention is a possibility subjective of carrying out behavior and
also the specific cause usage of a behavior (Yi, Jackson, Park & Probst, 2006). Hence,
intentions demonstrate the motivational elements that influence behavior (Mafe, Blas &
Tavera-Mesias, 2010). According to the UTAUT2 model, all the seven constructs of
(performance expectancy, effort expectancy, social influence, facilitating conditions, hedonic
motivation, price value, and habit) considered as antecedents of behavior intention (Arenas-
Gaitán, 2015).
3.1.2 Performance Expectancy (PE)
Venkatesh et al. (2012), described performance expectancy (PE) as the extent to which
by means of technology will deliver paybacks to consumers in doing particular actions.
Furthermore, Shin (2009), said that three factors that have an impact of performance
expectancy are extrinsic motivation (through the Motivation Model), perceived usefulness
(through the implementation of Technology Acceptance Model), and job-fit (through the
Model of PC Utilization). Besides, each factor was positively strong enough to support
performance expectancy to influence the behavior intention in using new technology (Chang,
2012).
77
In this respect, the actual clarification of performance expectancy is replicating in the
work that might be varying on whether tasks or jobs will be resolved easier and faster or the
entire production of the work is improved on both quantity and quality through using the
system (Chen & Salmanian, 2017).
For instance, Sun, Cao and You (2010), discovered that perceived effectiveness had a
constructive impact on behavior intention to use and select m-commerce in China, according
to an online questionnaire validated and gathered that applied the structural equation modeling
(SEM).
In the light of TNCs, Chen, and Salmanian (2017), performance expectancy (PE) might
be measured as working performance, as ordering a TNC vehicle can prevent and save effort,
time, and monetary costs, whether it needed by the work or going to the work, consumers can
be discharged from the burden of searching for a parking space or waiting for the standard taxi.
Accordingly, that raises the effectiveness of working performance.
3.1.3 Effort Expectancy (EE)
Effort Expectancy (EE) was defined as the amount of which a technology is linked to
the consumers is easy to use (Venkatesh et al. 2003; Venkatesh et al., 2012). Equally, effort
expectancy is also well-defined as the extent of easiness connected with the use of a particular
system (Chang, 2012). Davis (1989) discovered that an application perceived by individuals to
be easy to use possible to be acceptable (as cited in Chang, 2012).
78
Moreover, Venkatesh et al. (2003), mentioned that three variables from the current
model could implie the effort expectancy: 1) the perceived ease of use (throught the
implementation of the Technology Acceptance Model/ the Technology Acceptance Model 2);
2) the complexity (through th application of the Model of PC Utilization); 3) and ease of use
(through the use of Innovation Diffusion Theory).
In the context of TNCs, effort expectancy reflects on the level of easiness or battle
consumers noticing through using the TNC app to order a vehicle and finish the journey by
paying the fare when it arrives. It involves the consumer's operating or learning manners about
TNCs’ apps concerning whether it requires consumers to have a particular level of knowledge
ahead or consumers can acquire knowledge by themselves to progress (Chen & Salmanian,
2017).
3.1.4 Social Influence (SI)
Social Influence (SI), is definite as the extent to which a consumer perceives his/her
main others (i.e., friends and family), and believe that he/she must accept and use a particular
technology (Venkatesh et al. 2003; Venkatesh et al. 2012; Chang, 2012; and Arenas-Gaitán,
2015).
Venkatesh et al. (2003) emphasized that social influence (SI) as a direct factor of the
behavioral intention can be exemplified as follows: 1) Subjective norms (i.e., The individual's
opinion regarding the most persons who are significant to him/her think that he/she would or
would not do a certain behavior); 2) The social factors such as (person's internalization of a
reference and specific personal deals that a person has been prepared with others, in particular,
social circumstances); and/or 3) The image factor that was described by Moore and Benbasat
79
(1991), since the extent to which consuming a particular technology innovation is seen to
improve individuals’ status or image in his/her social group (as mentioned in Chang, 2012).
In the context of TNCs, social influence also proposed that consumers appear to be
concerned or inclined to the thoughts and information of their references (e.g., relatives,
parents, colleagues, and friends) in deciding to select and use TNCs’ services and apps (Chen
& Salmanian, 2017).
3.1.5 Facilitating Conditions (FC)
Facilitating Conditions explained the users’ insights of the support and resources
available to perform a certain behavior (Venkatesh et al. 2003; Venkatesh et al. 2012; Chang,
2012; and Arenas-Gaitán, 2015). Also, facilitating conditions is also referred to the extent of
which a consumer considers technical and organizational structure found to assist and support
the use of the technology or the system (Chang, 2012).
This definition implies notions expressed by three unique variables: 1) The Perceived
behavioral control; 2) The facilitating conditions; 3) and lastly the compatibility. Accordingly,
each variable is operationalized to contain features of the organizational and/or technological
setting that are considered to eliminate obstacles of use.
In the framework of TNCs, facilitating conditions occur in the shape of essential
resources that are necessary for consumers to use TNCs’ services and apps effectively and
successfully. Afforded with the missing prerequisites like (mobile network, mobile phones,
Wi-Fi, or payment methods), TNCs is deactivated anyway. Besides, a team of customer support
80
accessible in control of technical issues and rich guidance on how to use the TNCs’ apps to
complete a trip is both parts of facilitating conditions (Chen & Salmanian, 2017).
3.1.6 Hedonic Motivation (HM)
Venkatesh et al. (2012) clearly-defined hedonic motivation as the pleasure or fun
originated from using a specific technology, and this construct showed a fundamental role in
determining certain technology adoption and usage. Furthermore, research done on hedonic
motivation (theorized as noticed enjoyment) has discovered that it is directly influenced
technology adoption and usage (Venkatesh et al. 2012; Chang, 2012; and Arenas-Gaitán,
2015).
Several studies designate that hedonic motivation affects behavior intention towards
accepting new technologies by consumers, such as (e-commerce, mobile shopping services, e-
learning, or the travel advice web) (Arenas-Gaitán, 2015).
According to the framework of TNCs, hedonic motivation is considered as a perception
of pleasure, delight, joy, and entertainment that is presented to consumers when they use the
TNCs’ services and apps. For instance, the presentation of icons of the services regarding price
level, such as UberX’s vehicle symbol that become a “sculling boat” and Uber Black, which a
symbol of “yacht.” This innovative change gave consumers pleasurably astonished moods and
it is considered to have a higher outcome on consumers’ adoption and use (Chen & Salmanian,
2017).
81
3.1.7 Price Value (PV)
Venkatesh et al. (2012); Chang, (2012); and Arenas-Gaitán, (2015), well-defined price
value as the pricing and cost structure, might have a major influence on users’ technology
acceptance and usage. Furthermore, according to marketing studies, the monetary price/cost is
frequently theorized simultaneously with the quality of services/products to decide the
perceived value of those services / products (Zeithaml 1988, as cited Venkatesh et al., 2012).
Likewise, price value is described as an individuals’ cognitive exchange between the
observed benefits of the new technologies and the monetary budgets for using them. Some
examples such as (e-commerce, the use of 3G technology, or smartphones), shows how PV
affects BI towards adopting a specific technology (Arenas-Gaitán, 2015).
Additionally, the price value is a constructive variable when the benefits associated
with using specific technology are seen to be better than the monetary price/costs, and such
construct has a positive influence on the consumers’ intention (Venkatesh et al., 2012; Chang,
2012).
In the framework of TNCs, price value is the fact that the TNCs’ services reasonably
valued for the consumers. Commonly, TNCs costs remarkably lesser than regular taxi fare and
in utmost circumstances, have a better and clear vehicle condition as the vehicle owned by the
private drivers. Consequently, the degree of values and benefits perceived by TNCs’ consumers
to use the services are extended, as well as the consumer's intention to use TNCs (Chen &
Salmanian, 2017).
82
3.1.8 Habit (HT)
A habit has defined in two different means: firstly, habit observed as previous behavior;
and secondly habit is measured as the degree to which a person considers the behavior to be
automatic (Venkatesh et al. 2012; Chang, 2012; and Arenas-Gaitán, 2015). Ajzen and Fishbein
(2005), mentioned that reviews and feedbacks from prior experiences would impact the
countless beliefs towards a technology use (as cited in Venkatesh et al., 2012).
Relatedly, Venkatesh et al. (2012) operationalized the factor of habit based on three
distinctive levels according to the time passage: first, when the provided system has originally
been offered to use; one month later; and three months later. Research shows that habit is
perfectly defined as the degree to which individuals tend to do certain behaviors in an
automatically way because of the prior learning (Arenas-Gaitán, 2015).
From the angle of TNCs, habit reflects on consumers using TNCs’ services and apps
frequently in their daily lives since TNCs convenience can guide consumers to increase
dependency on TNCs. With broaden aggregate dependence, consumers can be even more
addicted to TNCs as their primary selection for transportation mode (Chen & Salmanian,
2017).
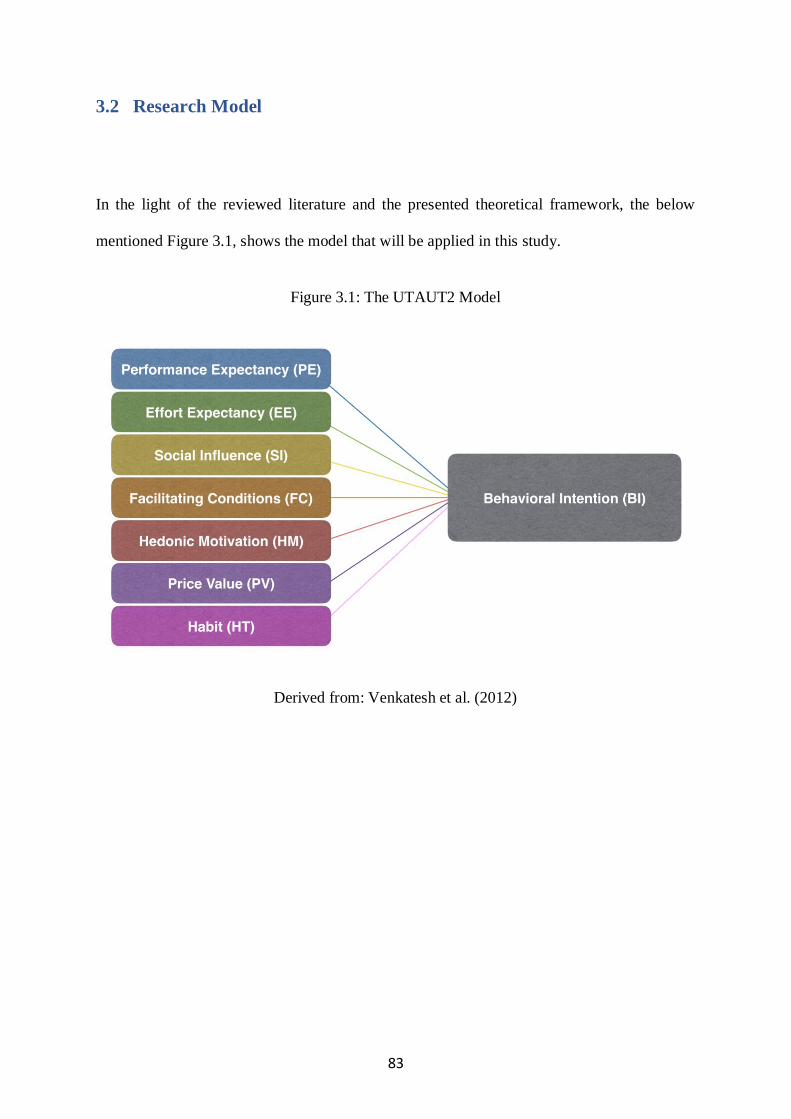
83
3.2 Research Model In the light of the reviewed literature and the presented theoretical framework, the below
mentioned Figure 3.1, shows the model that will be applied in this study.
Figure 3.1: The UTAUT2 Model
Derived from: Venkatesh et al. (2012)

84
CHAPTER 4: METHODOLOGY
In respect of the reviewed literature, the current research study is an examination of the
consumers’ behavior and intention decision towards the on-demand transportation services in
Egypt. Accordingly, this study is aiming to fully utilize and investigate the cognitive and
affective antecedents to consumers’ behavior towards the new sharing economy businesses
represented as TNCs (Uber, Careem, Swvl, etc.).
Therefore, the seven different variables of UTAUT2 framework such as ‘Performance
Expectancy (PE), Effort Expectancy (EE), Social Influence (SI), Facilitating Conditions (FC),
Hedonic Motivation (HM), Price Value (PV), and Habit (HT)’ will be tested in order to
understand the consumers’ behavioral intention (BI) towards using these TNCs services.
4.1 Research Significance
In terms of academic significance, this research will provide recent data about the
consumers' decisions and intention to use towards TNCs in Egypt. Likewise, regarding the
practical significance, this reach will provide to business practitioners in the transportation
industry a better indication on how to improve and develop TNCs' services and apps that
support consumers' needs and boost the usability of these services. Thus, this research will
assist future researchers to understand the nature of the Egyptians’ consumer behavior towards
TNCs services, because UTAUT2 supports to determine its impact on the behavioral intention
of using a particular technology.
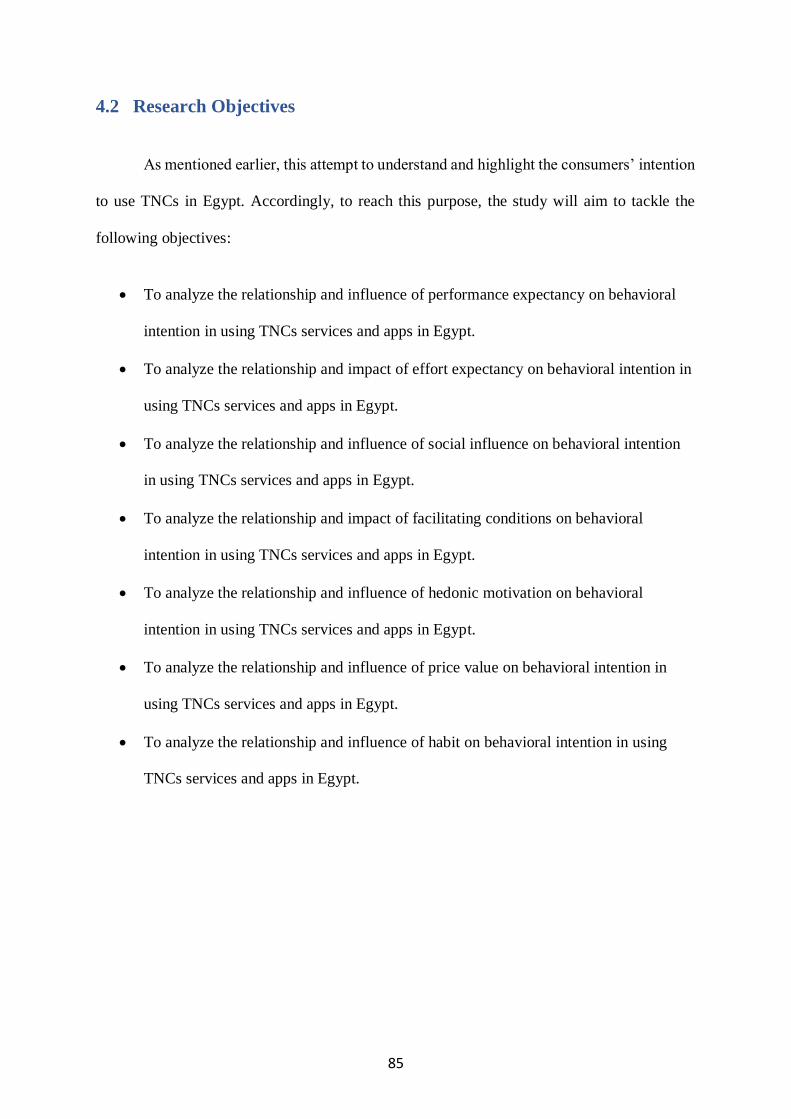
85
4.2 Research Objectives
As mentioned earlier, this attempt to understand and highlight the consumers’ intention
to use TNCs in Egypt. Accordingly, to reach this purpose, the study will aim to tackle the
following objectives:
• To analyze the relationship and influence of performance expectancy on behavioral
intention in using TNCs services and apps in Egypt.
• To analyze the relationship and impact of effort expectancy on behavioral intention in
using TNCs services and apps in Egypt.
• To analyze the relationship and influence of social influence on behavioral intention
in using TNCs services and apps in Egypt.
• To analyze the relationship and impact of facilitating conditions on behavioral
intention in using TNCs services and apps in Egypt.
• To analyze the relationship and influence of hedonic motivation on behavioral
intention in using TNCs services and apps in Egypt.
• To analyze the relationship and influence of price value on behavioral intention in
using TNCs services and apps in Egypt.
• To analyze the relationship and influence of habit on behavioral intention in using
TNCs services and apps in Egypt.
86
4.3 Research Questions What are the Cognitive and Affective Antecedents to Consumer Behavior Towards On-
demand Transportation Services in Egypt?
The question mentioned above was the general question, and the following questions are
more specific ones:
Q1: Does performance expectancy (PE) affect the behavioral intention (BI) of using TNCs
services and apps?
Q2: Does effort expectancy (EE) affect the behavioral intention (BI) of using TNCs services
and apps?
Q3: Does social influence (SI) affect the behavioral intention (BI) of using TNCs services
and apps?
Q4: Does facilitating conditions (FC) affect the behavioral intention (BI) of using TNCs
services and apps?
Q5: Does hedonic motivation (HM) affect the behavioral intention (BI) of using TNCs
services and apps?
Q6: Does price value (PV) affect the behavioral intention (BI) of using TNCs services and
apps?
Q7: Does habit (HT) affect the behavioral intention (BI) of using TNCs services and apps?
87
4.4 Research Hypotheses H1: Performance Expectancy (PE) is positively correlated to the behavioral intention (BI) of
using TNCs.
H2: Effort Expectancy (EE) is positively correlated to the behavioral intention (BI) of using
TNCs.
H3: Social Influence (SI) is positively correlated to the behavioral intention (BI) of using
TNCs.
H4: Facilitating Conditions (FC) is positively correlated to the behavioral intention (BI) of
using TNCs.
H5: Hedonic Motivation (HM) is positively correlated to the behavioral intention (BI) of
using TNCs.
H6: Price Value (PV) is positively correlated to the behavioral intention (BI) of using TNCs.
H7: Habit (HT) is positively correlated to the behavioral intention (BI) of using TNCs.
88
4.5 Identifying Hypotheses Variables H1: Performance Expectancy (PE) is positively correlated to the behavioral intention (BI) of
using TNCs.
Dependent variable: Behavioral Intention (BI)
Independent variable: Performance Expectancy (PE)
H2: Effort Expectancy (EE) is positively correlated to the behavioral intention (BI) of using
TNCs.
Dependent variable: Behavioral Intention (BI)
Independent variable: Effort Expectancy (EE)
H3: Social Influence (SI) is positively correlated to the behavioral intention (BI) of using
TNCs.
Dependent variable: Behavioral Intention (BI)
Independent variable: Social Influence (SI)
H4: Facilitating Conditions (FC) is positively correlated to the behavioral intention (BI) of
using TNCs.
Dependent variable: Behavioral Intention (BI)
Independent variable: Facilitating Conditions (FC)
H5: Hedonic Motivation (HM) is positively correlated to the behavioral intention (BI) of
using TNCs.
Dependent variable: Behavioral Intention (BI)
Independent variable: Hedonic Motivation (HM)
H6: Price Value (PV) is positively correlated to the behavioral intention (BI) of using TNCs.
Dependent variable: Behavioral Intention (BI)
Independent variable: Price Value (PV)
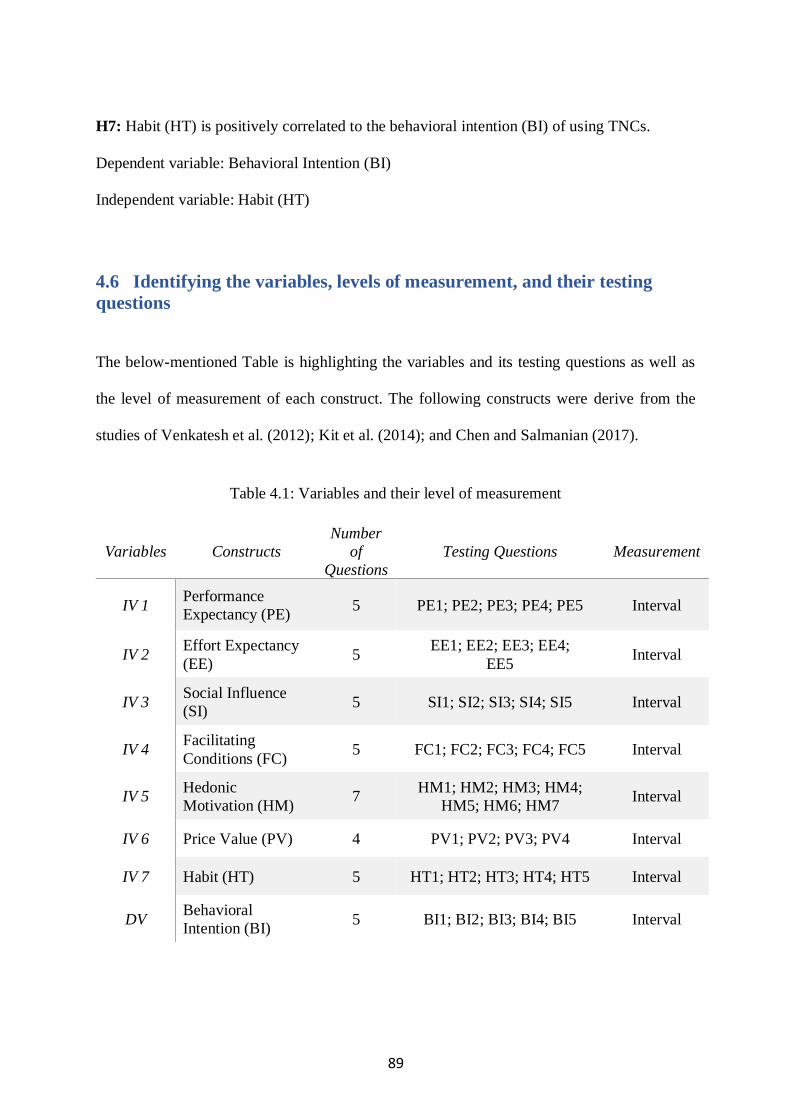
89
H7: Habit (HT) is positively correlated to the behavioral intention (BI) of using TNCs.
Dependent variable: Behavioral Intention (BI)
Independent variable: Habit (HT)
4.6 Identifying the variables, levels of measurement, and their testing
questions The below-mentioned Table is highlighting the variables and its testing questions as well as
the level of measurement of each construct. The following constructs were derive from the
studies of Venkatesh et al. (2012); Kit et al. (2014); and Chen and Salmanian (2017).
Table 4.1: Variables and their level of measurement
Variables Constructs Number
of
Questions Testing Questions Measurement
IV 1 Performance
Expectancy (PE) 5 PE1; PE2; PE3; PE4; PE5 Interval
IV 2 Effort Expectancy
(EE) 5
EE1; EE2; EE3; EE4;
EE5 Interval
IV 3 Social Influence
(SI) 5 SI1; SI2; SI3; SI4; SI5 Interval
IV 4 Facilitating
Conditions (FC) 5 FC1; FC2; FC3; FC4; FC5 Interval
IV 5 Hedonic
Motivation (HM) 7
HM1; HM2; HM3; HM4;
HM5; HM6; HM7 Interval
IV 6 Price Value (PV) 4 PV1; PV2; PV3; PV4 Interval
IV 7 Habit (HT) 5 HT1; HT2; HT3; HT4; HT5 Interval
DV Behavioral
Intention (BI) 5 BI1; BI2; BI3; BI4; BI5 Interval
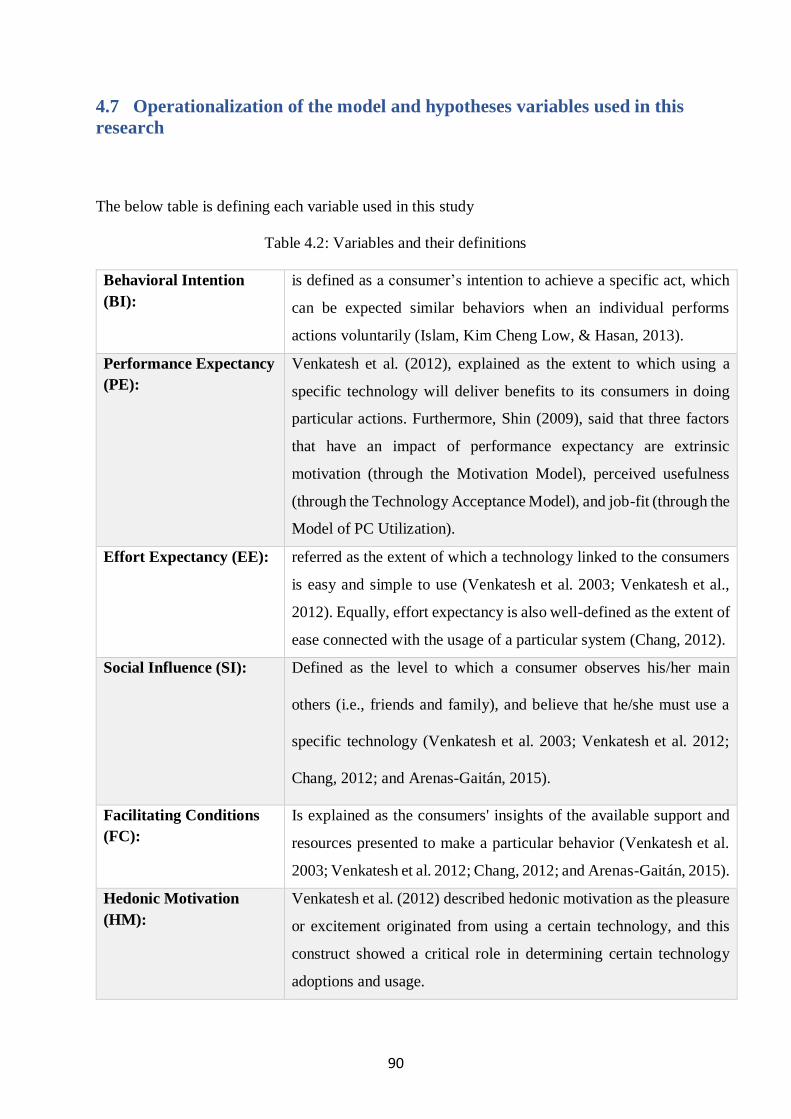
90
4.7 Operationalization of the model and hypotheses variables used in this
research The below table is defining each variable used in this study
Table 4.2: Variables and their definitions
Behavioral Intention
(BI):
is defined as a consumer’s intention to achieve a specific act, which
can be expected similar behaviors when an individual performs
actions voluntarily (Islam, Kim Cheng Low, & Hasan, 2013).
Performance Expectancy
(PE):
Venkatesh et al. (2012), explained as the extent to which using a
specific technology will deliver benefits to its consumers in doing
particular actions. Furthermore, Shin (2009), said that three factors
that have an impact of performance expectancy are extrinsic
motivation (through the Motivation Model), perceived usefulness
(through the Technology Acceptance Model), and job-fit (through the
Model of PC Utilization).
Effort Expectancy (EE): referred as the extent of which a technology linked to the consumers
is easy and simple to use (Venkatesh et al. 2003; Venkatesh et al.,
2012). Equally, effort expectancy is also well-defined as the extent of
ease connected with the usage of a particular system (Chang, 2012).
Social Influence (SI):
Defined as the level to which a consumer observes his/her main
others (i.e., friends and family), and believe that he/she must use a
specific technology (Venkatesh et al. 2003; Venkatesh et al. 2012;
Chang, 2012; and Arenas-Gaitán, 2015).
Facilitating Conditions
(FC):
Is explained as the consumers' insights of the available support and
resources presented to make a particular behavior (Venkatesh et al.
2003; Venkatesh et al. 2012; Chang, 2012; and Arenas-Gaitán, 2015).
Hedonic Motivation
(HM):
Venkatesh et al. (2012) described hedonic motivation as the pleasure
or excitement originated from using a certain technology, and this
construct showed a critical role in determining certain technology
adoptions and usage.
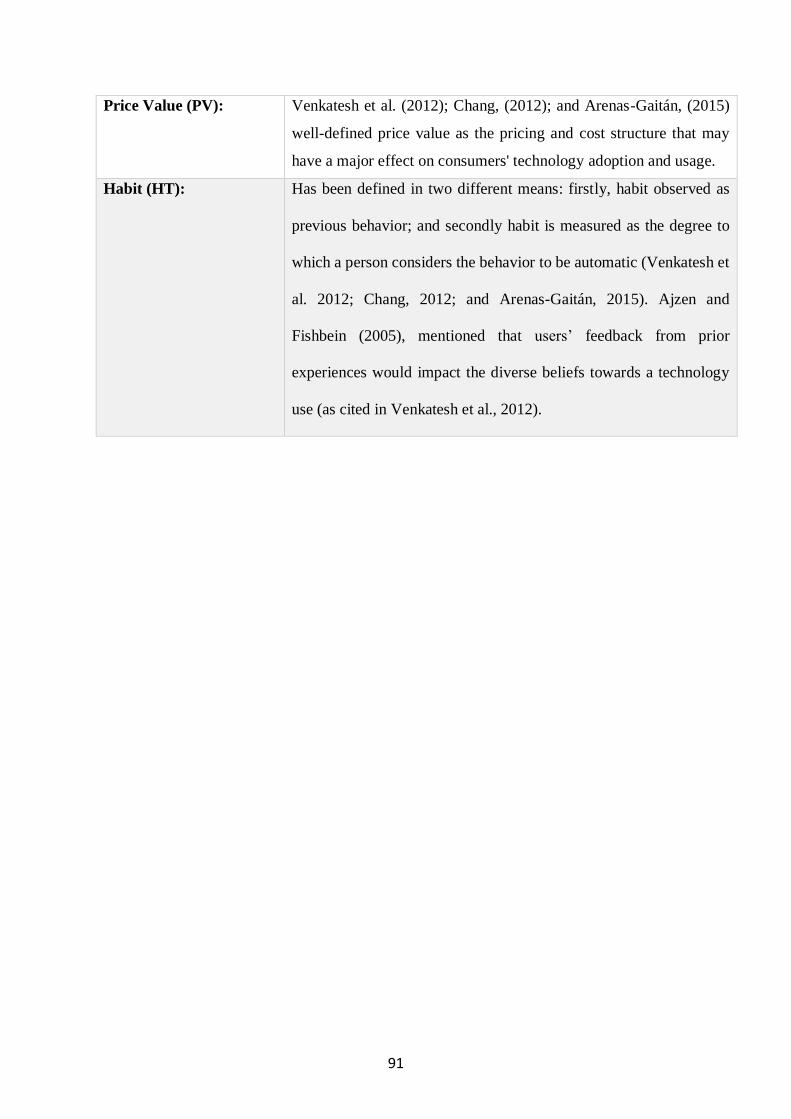
91
Price Value (PV):
Venkatesh et al. (2012); Chang, (2012); and Arenas-Gaitán, (2015)
well-defined price value as the pricing and cost structure that may
have a major effect on consumers' technology adoption and usage.
Habit (HT): Has been defined in two different means: firstly, habit observed as
previous behavior; and secondly habit is measured as the degree to
which a person considers the behavior to be automatic (Venkatesh et
al. 2012; Chang, 2012; and Arenas-Gaitán, 2015). Ajzen and
Fishbein (2005), mentioned that users’ feedback from prior
experiences would impact the diverse beliefs towards a technology
use (as cited in Venkatesh et al., 2012).
92
4.8 Method of Data Collection
This research is aiming to use a quantitative methodology for gathering data that will
be useful to acquire descriptive, statistical, objective, and accurate information about
consumers’ behavioral intention towards TNCs in Egypt. Accordingly, the research will
provide a descriptive survey through several types of questions (such as close-ended and
multiple-choice questions as well as Likert scale statements) presented to a certain sample of
Egyptians; both electronic (by using an online survey) and physical (by using a self-
administered survey) surveys will be presented to answer the given questions, consequently
support or refute the research hypotheses.
4.9 Population
A population of Egyptian TNCs consumers will be the targeted population for this
study, and the targeted sample should be using these types of TNCs’ services; additionally,
they should have mobile and internet literacy. Therefore, the survey will be distributed online
(through Google Forms) and offline (face to face) by using social media platforms such as
“Facebook” as well as self-administered in places like “The American University in Cairo”
(AUC) and October University of Modern Sciences and Arts (MSA) particularly in front of the
gates where these participants are waiting for or willing to use TNCs. The purpose of choosing
this population is to reach the appropriate participants for this study to obtain accurate results
and data.
93
4.10 Sampling and Data Collection
As mentioned earlier, the methodology is based on the quantitative technique using
non-random sampling, because not all the online or offline consumers had the equal chance of
filling the survey; accordingly, purposive sampling was chosen to survey online and offline
consumers who are using TNCs. However, the survey is provided and utilized randomly to
ensure that there was no potential bias, as a matter of fact, users didn't have to provide their
names.
As for the sample size, a total of 200 respondents were required to complete the survey,
100 participants completed the self-administered questionnaire (50) at AUC and (50) at MSA;
in addition to 100 participants who completed the online survey through Google forms.
Furthermore, the survey was revised and approved from the IRBs (Institutional Review
Boards) and CAPMAS (Central Agency for Public Mobilization and Statistics) to ensure that
this survey didn't impose any possible harms on participants; this survey didn't require
provision of any personal information like name, and it was based on anonymity procedures
where no one person knows the participants of this survey. Accordingly, after the relevant IRBs
and CAPMAS permissions, the survey was conducted with the selected participants.
94
4.11 Questionnaire Design
The survey was designed and developed grounded on relevant findings and studies of
Venkatesh et al. (2012); Kit et al. (2014); and Chen and Salmanian (2017), to tackle and test
all the sides of the proposed variables and hypotheses, therefore a scale of different questions
was developed to measure and test the different research variables; For instance, the survey
design was constructed as follows: the first part of the survey, participants were requested to
provide descriptive and general statistical information like (Gender, Age, TNCs’ services
usage, TNCs' services usage rate, and experience, etc.).
While in the second part of the questionnaire, the focus was on the variables and testing
the consumers’ behavior intention using UTAUT2 model factors of Performance Expectancy
(PE), Effort Expectancy (EE), Social Influence (SI), Facilitating Conditions (FC), Hedonic
Motivation (HM), Price Value (PV), and Habit (HT); afterward the last part is dedicated to the
behavior intention (BI) questions only.
The design of the questions was mainly developed on the multiple-choice questions and
Likert scale statements that requested the respondents to signify their agreement or
disagreement on a seven-point Likert-type scale, varying from “Strongly Disagree” (1) to
“Strongly Agree” (7).
95
4.12 Survey pilot
A pilot testing was created to avoid any possible problems as well as to elect clear, up
to the point and obvious questions. Accordingly, seven survey pilots were distributed on
volunteers to test the language, clearness of the questions, and even the online layout. The
pilot was essential because the feedbacks of the respondents were valued and thus, some
questions were edited or rephrased.
The modifications of the questionnaire were minor; however, it was taken into
consideration that the participant desires an understandable and clear survey, especially in the
questions and answers that provide some terminologies.
Likewise, the online survey’s layout script was tested on several browsers to ensure
that it was supported on multiple browsers and platforms.
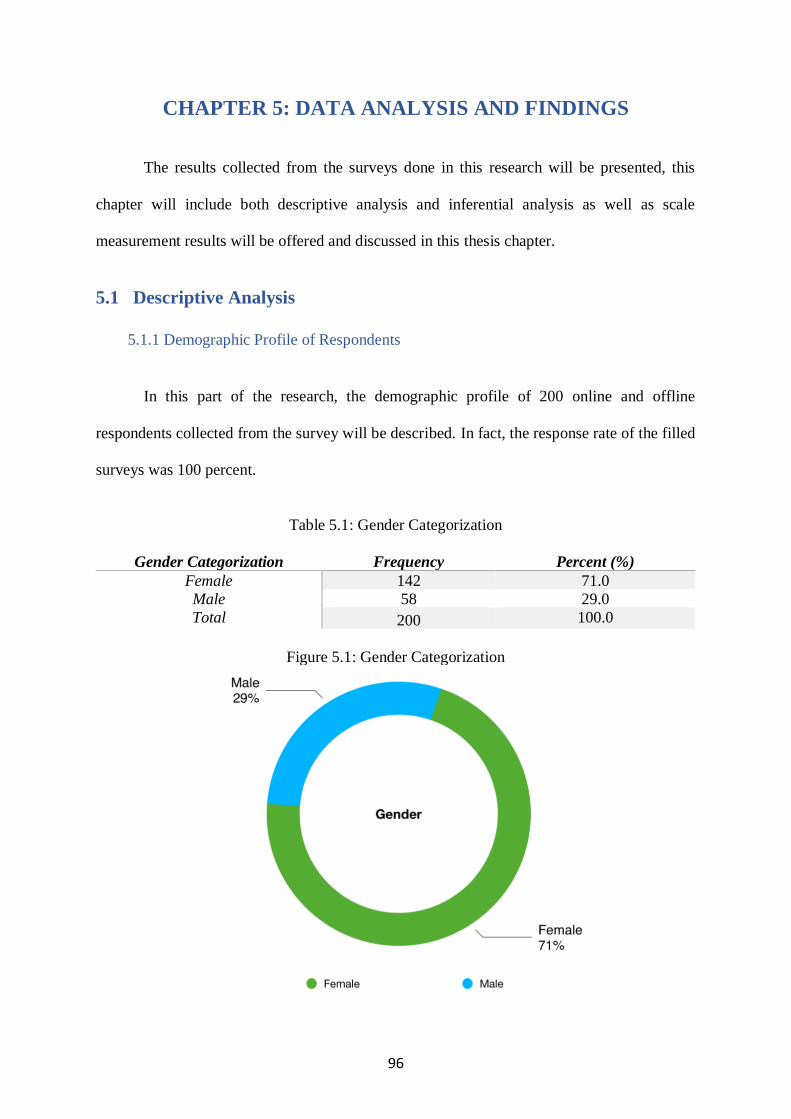
96
CHAPTER 5: DATA ANALYSIS AND FINDINGS
The results collected from the surveys done in this research will be presented, this
chapter will include both descriptive analysis and inferential analysis as well as scale
measurement results will be offered and discussed in this thesis chapter.
5.1 Descriptive Analysis
5.1.1 Demographic Profile of Respondents
In this part of the research, the demographic profile of 200 online and offline
respondents collected from the survey will be described. In fact, the response rate of the filled
surveys was 100 percent.
Table 5.1: Gender Categorization
Gender Categorization Frequency Percent (%) Female 142 71.0
Male 58 29.0
Total 200 100.0
Figure 5.1: Gender Categorization
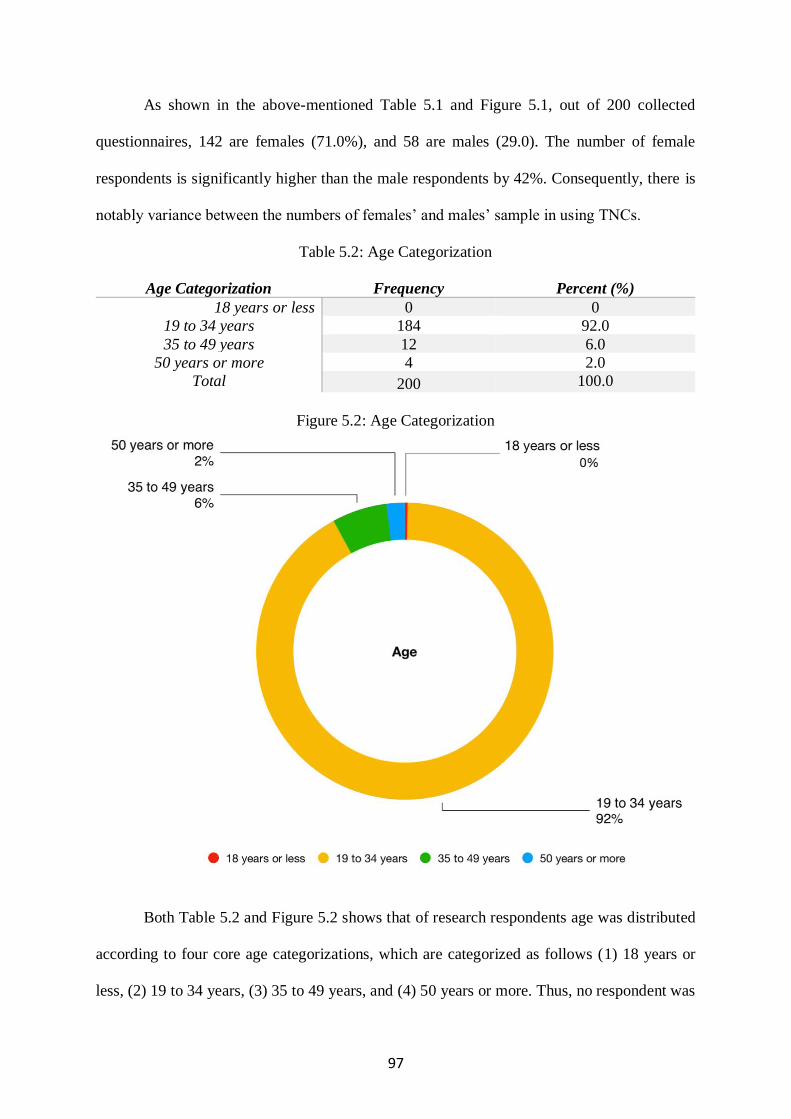
97
As shown in the above-mentioned Table 5.1 and Figure 5.1, out of 200 collected
questionnaires, 142 are females (71.0%), and 58 are males (29.0). The number of female
respondents is significantly higher than the male respondents by 42%. Consequently, there is
notably variance between the numbers of females’ and males’ sample in using TNCs.
Table 5.2: Age Categorization
Age Categorization Frequency Percent (%) 18 years or less 0 0
19 to 34 years 184 92.0
35 to 49 years 12 6.0
50 years or more 4 2.0
Total 200 100.0
Figure 5.2: Age Categorization
Both Table 5.2 and Figure 5.2 shows that of research respondents age was distributed
according to four core age categorizations, which are categorized as follows (1) 18 years or
less, (2) 19 to 34 years, (3) 35 to 49 years, and (4) 50 years or more. Thus, no respondent was
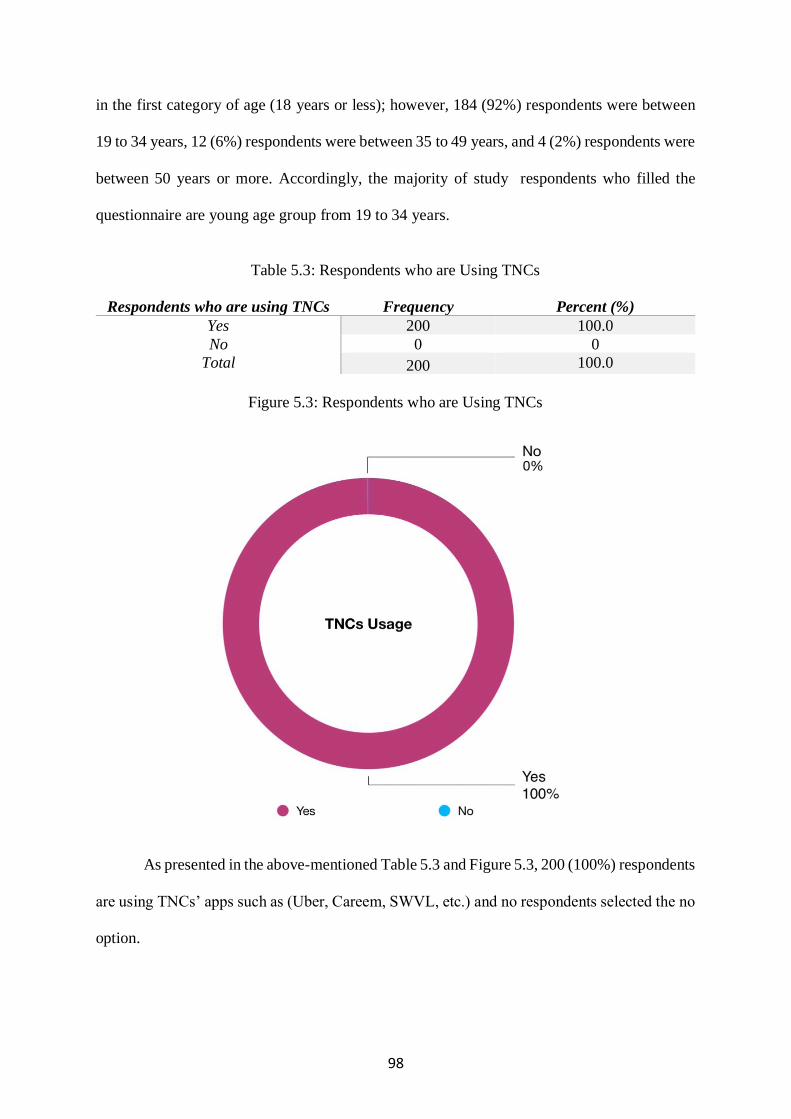
98
in the first category of age (18 years or less); however, 184 (92%) respondents were between
19 to 34 years, 12 (6%) respondents were between 35 to 49 years, and 4 (2%) respondents were
between 50 years or more. Accordingly, the majority of study respondents who filled the
questionnaire are young age group from 19 to 34 years.
Table 5.3: Respondents who are Using TNCs
Respondents who are using TNCs Frequency Percent (%) Yes 200 100.0
No 0 0
Total 200 100.0
Figure 5.3: Respondents who are Using TNCs
As presented in the above-mentioned Table 5.3 and Figure 5.3, 200 (100%) respondents
are using TNCs’ apps such as (Uber, Careem, SWVL, etc.) and no respondents selected the no
option.
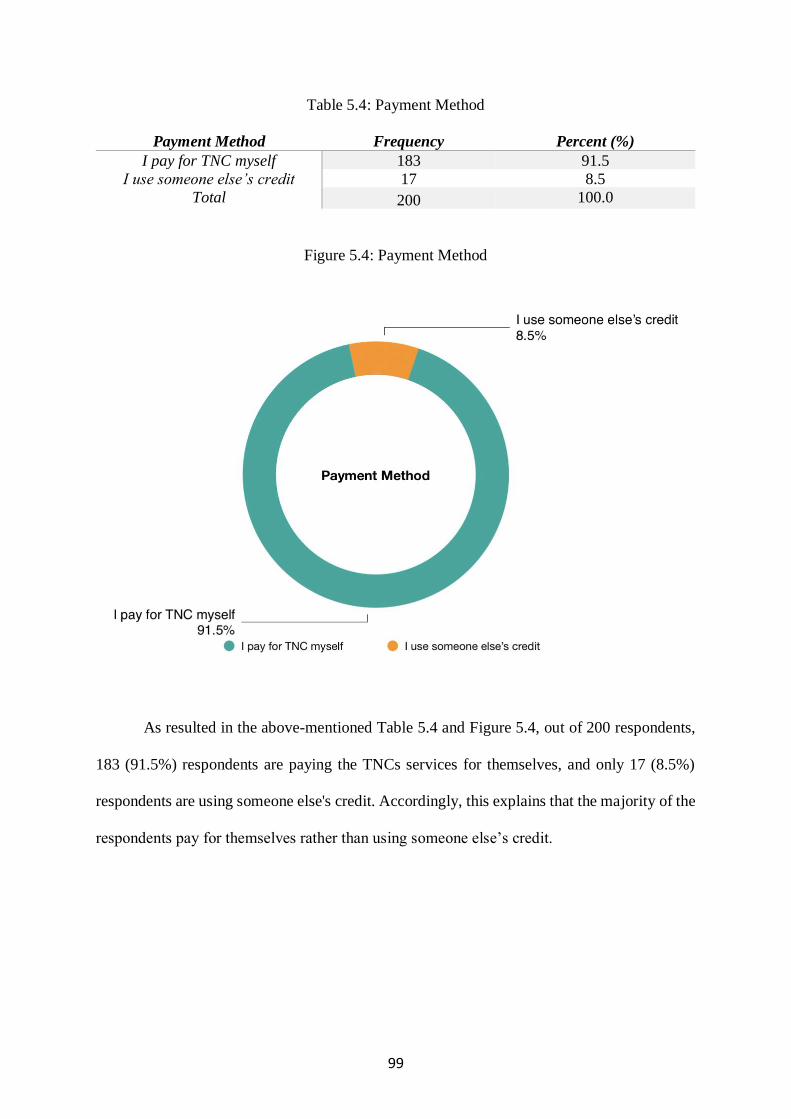
99
Table 5.4: Payment Method
Payment Method Frequency Percent (%) I pay for TNC myself 183 91.5
I use someone else’s credit 17 8.5
Total 200 100.0
Figure 5.4: Payment Method
As resulted in the above-mentioned Table 5.4 and Figure 5.4, out of 200 respondents,
183 (91.5%) respondents are paying the TNCs services for themselves, and only 17 (8.5%)
respondents are using someone else's credit. Accordingly, this explains that the majority of the
respondents pay for themselves rather than using someone else’s credit.
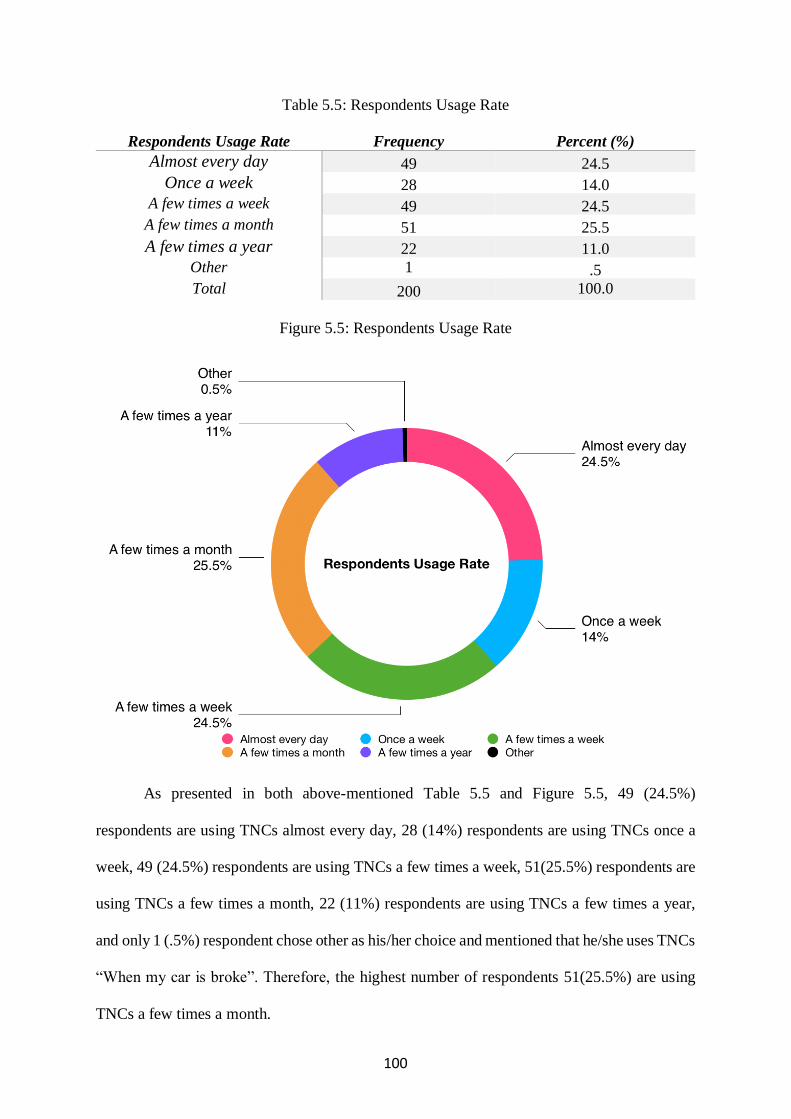
100
Table 5.5: Respondents Usage Rate
Respondents Usage Rate Frequency Percent (%)
Almost every day 49 24.5
Once a week 28 14.0
A few times a week 49 24.5
A few times a month 51 25.5
A few times a year 22 11.0
Other 1 .5
Total 200 100.0
Figure 5.5: Respondents Usage Rate
As presented in both above-mentioned Table 5.5 and Figure 5.5, 49 (24.5%)
respondents are using TNCs almost every day, 28 (14%) respondents are using TNCs once a
week, 49 (24.5%) respondents are using TNCs a few times a week, 51(25.5%) respondents are
using TNCs a few times a month, 22 (11%) respondents are using TNCs a few times a year,
and only 1 (.5%) respondent chose other as his/her choice and mentioned that he/she uses TNCs
“When my car is broke”. Therefore, the highest number of respondents 51(25.5%) are using
TNCs a few times a month.
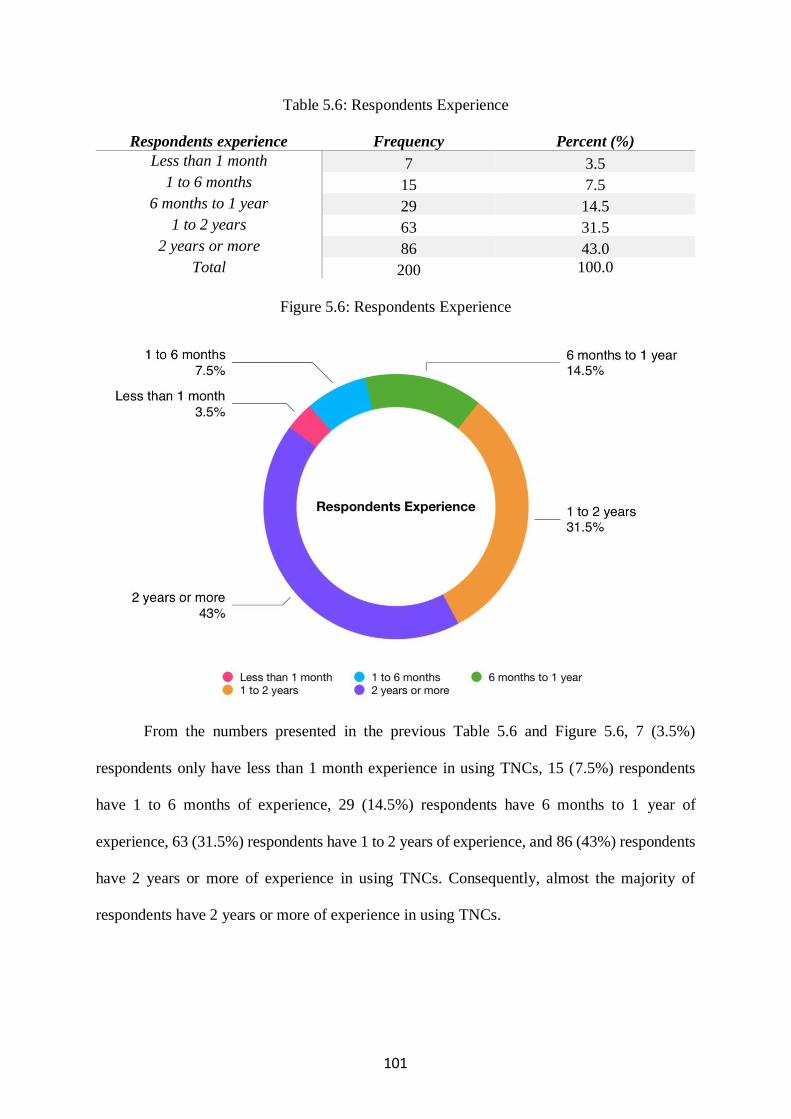
101
Table 5.6: Respondents Experience
Respondents experience Frequency Percent (%) Less than 1 month 7 3.5
1 to 6 months 15 7.5
6 months to 1 year 29 14.5
1 to 2 years 63 31.5
2 years or more 86 43.0
Total 200 100.0
Figure 5.6: Respondents Experience
From the numbers presented in the previous Table 5.6 and Figure 5.6, 7 (3.5%)
respondents only have less than 1 month experience in using TNCs, 15 (7.5%) respondents
have 1 to 6 months of experience, 29 (14.5%) respondents have 6 months to 1 year of
experience, 63 (31.5%) respondents have 1 to 2 years of experience, and 86 (43%) respondents
have 2 years or more of experience in using TNCs. Consequently, almost the majority of
respondents have 2 years or more of experience in using TNCs.
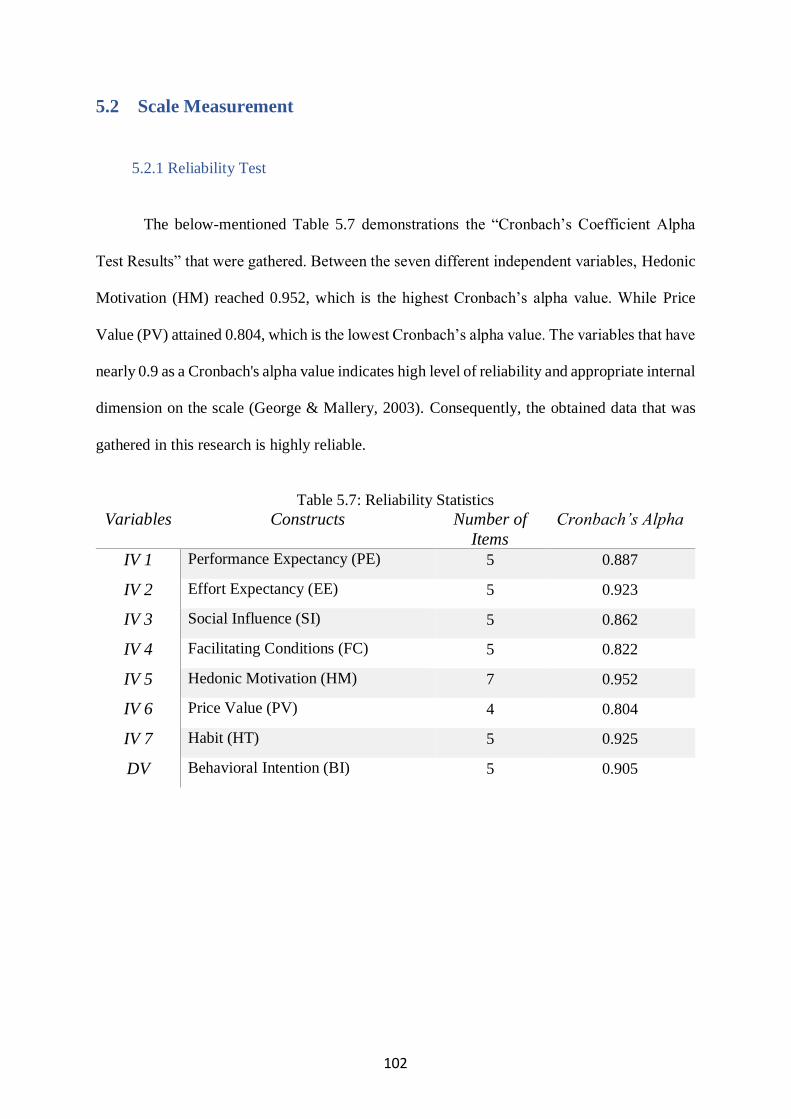
102
5.2 Scale Measurement
5.2.1 Reliability Test
The below-mentioned Table 5.7 demonstrations the “Cronbach’s Coefficient Alpha
Test Results” that were gathered. Between the seven different independent variables, Hedonic
Motivation (HM) reached 0.952, which is the highest Cronbach’s alpha value. While Price
Value (PV) attained 0.804, which is the lowest Cronbach’s alpha value. The variables that have
nearly 0.9 as a Cronbach's alpha value indicates high level of reliability and appropriate internal
dimension on the scale (George & Mallery, 2003). Consequently, the obtained data that was
gathered in this research is highly reliable.
Table 5.7: Reliability Statistics
Variables Constructs Number of
Items
Cronbach’s Alpha
IV 1 Performance Expectancy (PE) 5 0.887
IV 2 Effort Expectancy (EE) 5 0.923
IV 3 Social Influence (SI) 5 0.862
IV 4 Facilitating Conditions (FC) 5 0.822
IV 5 Hedonic Motivation (HM) 7 0.952
IV 6 Price Value (PV) 4 0.804
IV 7 Habit (HT) 5 0.925
DV Behavioral Intention (BI) 5 0.905
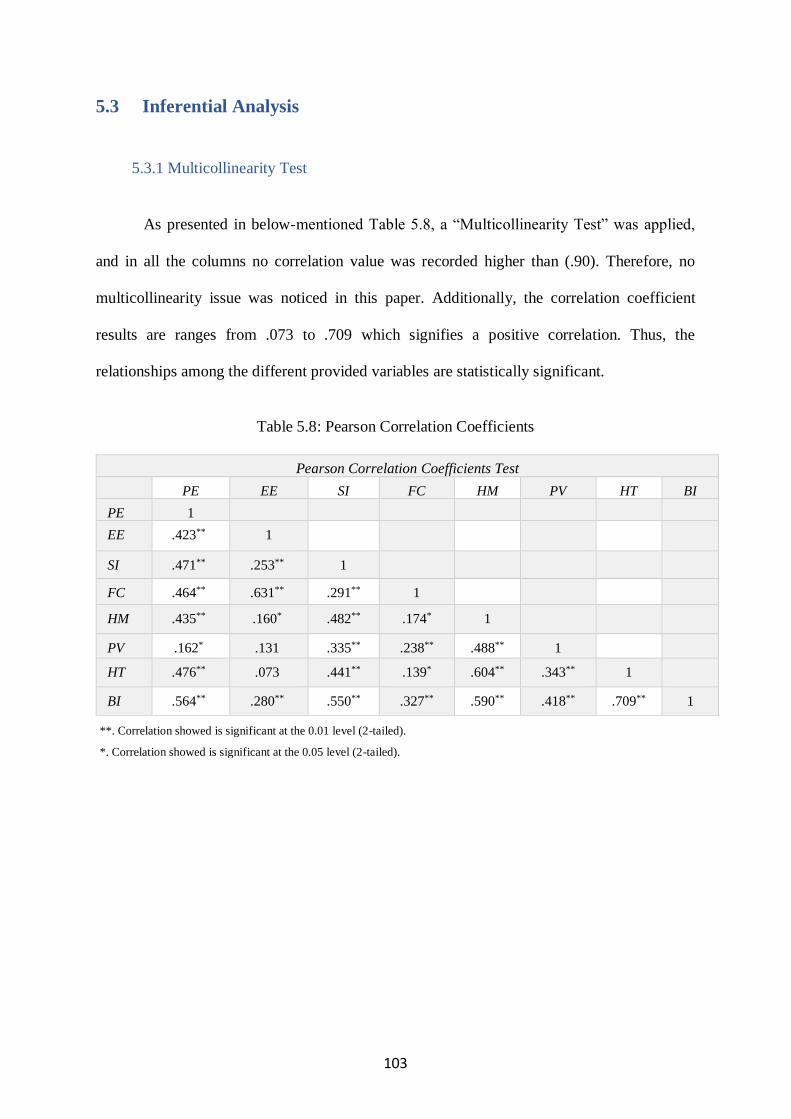
103
5.3 Inferential Analysis
5.3.1 Multicollinearity Test
As presented in below-mentioned Table 5.8, a “Multicollinearity Test” was applied,
and in all the columns no correlation value was recorded higher than (.90). Therefore, no
multicollinearity issue was noticed in this paper. Additionally, the correlation coefficient
results are ranges from .073 to .709 which signifies a positive correlation. Thus, the
relationships among the different provided variables are statistically significant.
Table 5.8: Pearson Correlation Coefficients
Pearson Correlation Coefficients Test
PE EE SI FC HM PV HT BI
PE 1
EE .423** 1
SI .471** .253** 1
FC .464** .631** .291** 1
HM .435** .160* .482** .174* 1
PV .162* .131 .335** .238** .488** 1
HT .476** .073 .441** .139* .604** .343** 1
BI .564** .280** .550** .327** .590** .418** .709** 1
**. Correlation showed is significant at the 0.01 level (2-tailed).
*. Correlation showed is significant at the 0.05 level (2-tailed).
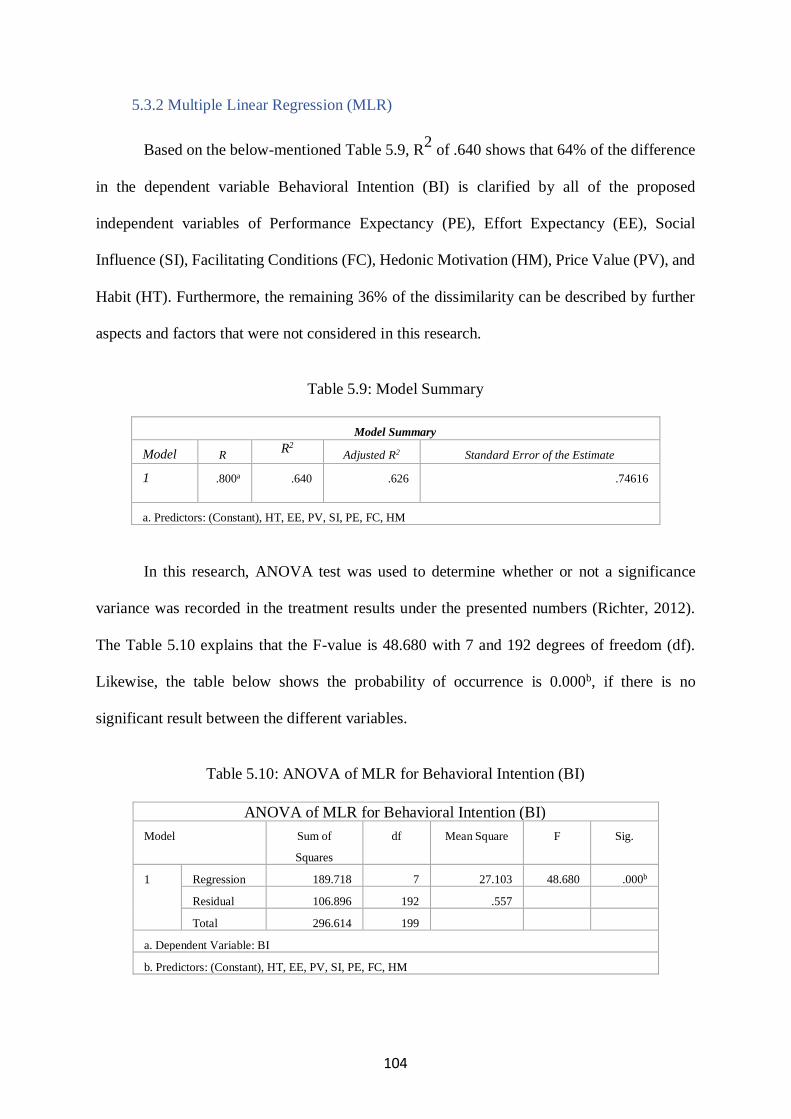
104
5.3.2 Multiple Linear Regression (MLR)
Based on the below-mentioned Table 5.9, R2
of .640 shows that 64% of the difference
in the dependent variable Behavioral Intention (BI) is clarified by all of the proposed
independent variables of Performance Expectancy (PE), Effort Expectancy (EE), Social
Influence (SI), Facilitating Conditions (FC), Hedonic Motivation (HM), Price Value (PV), and
Habit (HT). Furthermore, the remaining 36% of the dissimilarity can be described by further
aspects and factors that were not considered in this research.
Table 5.9: Model Summary
Model Summary
Model R R2
Adjusted R2 Standard Error of the Estimate
1 .800a .640 .626 .74616
a. Predictors: (Constant), HT, EE, PV, SI, PE, FC, HM
In this research, ANOVA test was used to determine whether or not a significance
variance was recorded in the treatment results under the presented numbers (Richter, 2012).
The Table 5.10 explains that the F-value is 48.680 with 7 and 192 degrees of freedom (df).
Likewise, the table below shows the probability of occurrence is 0.000b, if there is no
significant result between the different variables.
Table 5.10: ANOVA of MLR for Behavioral Intention (BI)
ANOVA of MLR for Behavioral Intention (BI)
Model Sum of
Squares
df Mean Square F Sig.
1 Regression 189.718 7 27.103 48.680 .000b
Residual 106.896 192 .557
Total 296.614 199
a. Dependent Variable: BI
b. Predictors: (Constant), HT, EE, PV, SI, PE, FC, HM
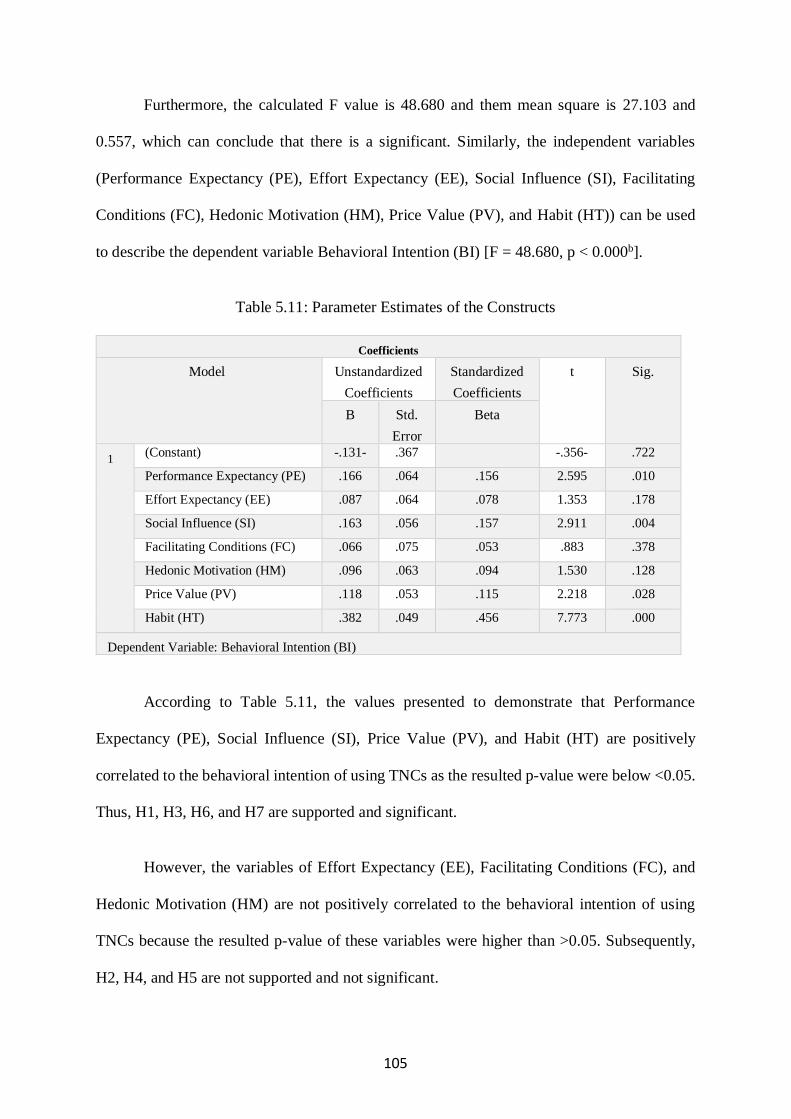
105
Furthermore, the calculated F value is 48.680 and them mean square is 27.103 and
0.557, which can conclude that there is a significant. Similarly, the independent variables
(Performance Expectancy (PE), Effort Expectancy (EE), Social Influence (SI), Facilitating
Conditions (FC), Hedonic Motivation (HM), Price Value (PV), and Habit (HT)) can be used
to describe the dependent variable Behavioral Intention (BI) [F = 48.680, p < 0.000b].
Table 5.11: Parameter Estimates of the Constructs
Coefficients
Model Unstandardized
Coefficients
Standardized
Coefficients
t Sig.
B Std.
Error
Beta
1 (Constant) -.131- .367 -.356- .722
Performance Expectancy (PE) .166 .064 .156 2.595 .010
Effort Expectancy (EE) .087 .064 .078 1.353 .178
Social Influence (SI) .163 .056 .157 2.911 .004
Facilitating Conditions (FC) .066 .075 .053 .883 .378
Hedonic Motivation (HM) .096 .063 .094 1.530 .128
Price Value (PV) .118 .053 .115 2.218 .028
Habit (HT) .382 .049 .456 7.773 .000
Dependent Variable: Behavioral Intention (BI)
According to Table 5.11, the values presented to demonstrate that Performance
Expectancy (PE), Social Influence (SI), Price Value (PV), and Habit (HT) are positively
correlated to the behavioral intention of using TNCs as the resulted p-value were below <0.05.
Thus, H1, H3, H6, and H7 are supported and significant.
However, the variables of Effort Expectancy (EE), Facilitating Conditions (FC), and
Hedonic Motivation (HM) are not positively correlated to the behavioral intention of using
TNCs because the resulted p-value of these variables were higher than >0.05. Subsequently,
H2, H4, and H5 are not supported and not significant.
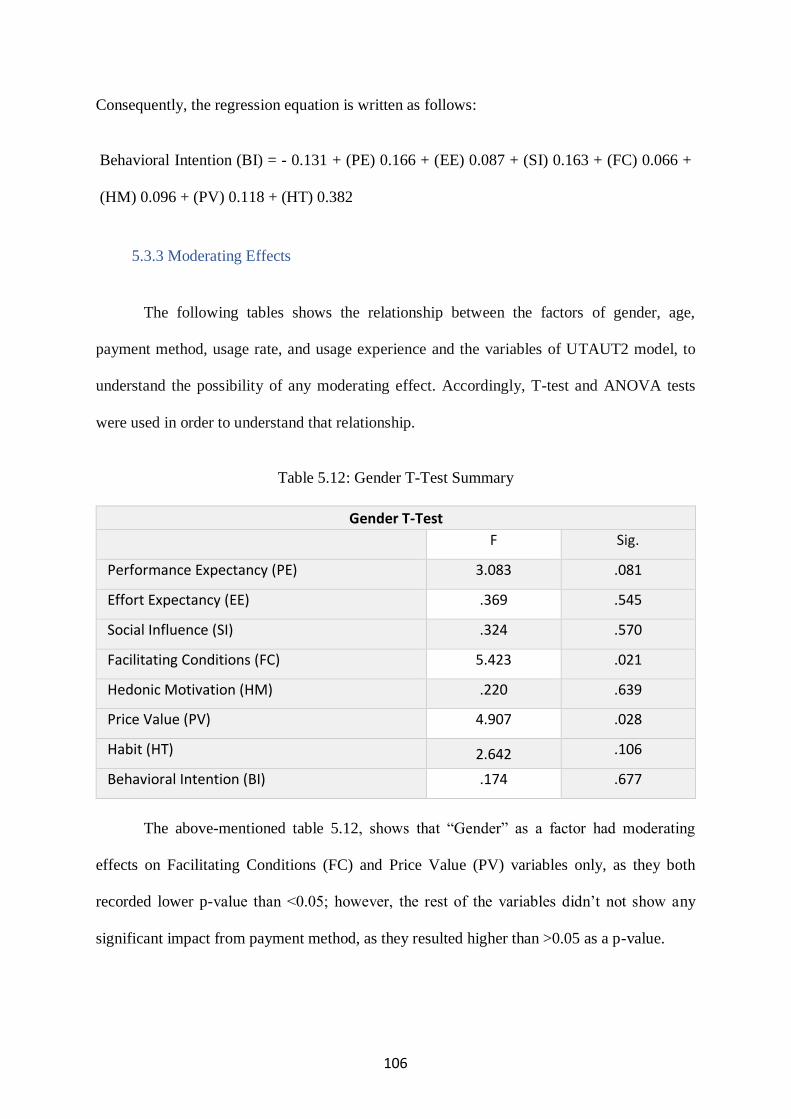
106
Consequently, the regression equation is written as follows:
Behavioral Intention (BI) = - 0.131 + (PE) 0.166 + (EE) 0.087 + (SI) 0.163 + (FC) 0.066 +
(HM) 0.096 + (PV) 0.118 + (HT) 0.382
5.3.3 Moderating Effects
The following tables shows the relationship between the factors of gender, age,
payment method, usage rate, and usage experience and the variables of UTAUT2 model, to
understand the possibility of any moderating effect. Accordingly, T-test and ANOVA tests
were used in order to understand that relationship.
Table 5.12: Gender T-Test Summary
Gender T-Test
F Sig.
Performance Expectancy (PE) 3.083 .081
Effort Expectancy (EE) .369 .545
Social Influence (SI) .324 .570
Facilitating Conditions (FC) 5.423 .021
Hedonic Motivation (HM) .220 .639
Price Value (PV) 4.907 .028
Habit (HT) 2.642 .106
Behavioral Intention (BI) .174 .677
The above-mentioned table 5.12, shows that “Gender” as a factor had moderating
effects on Facilitating Conditions (FC) and Price Value (PV) variables only, as they both
recorded lower p-value than <0.05; however, the rest of the variables didn’t not show any
significant impact from payment method, as they resulted higher than >0.05 as a p-value.
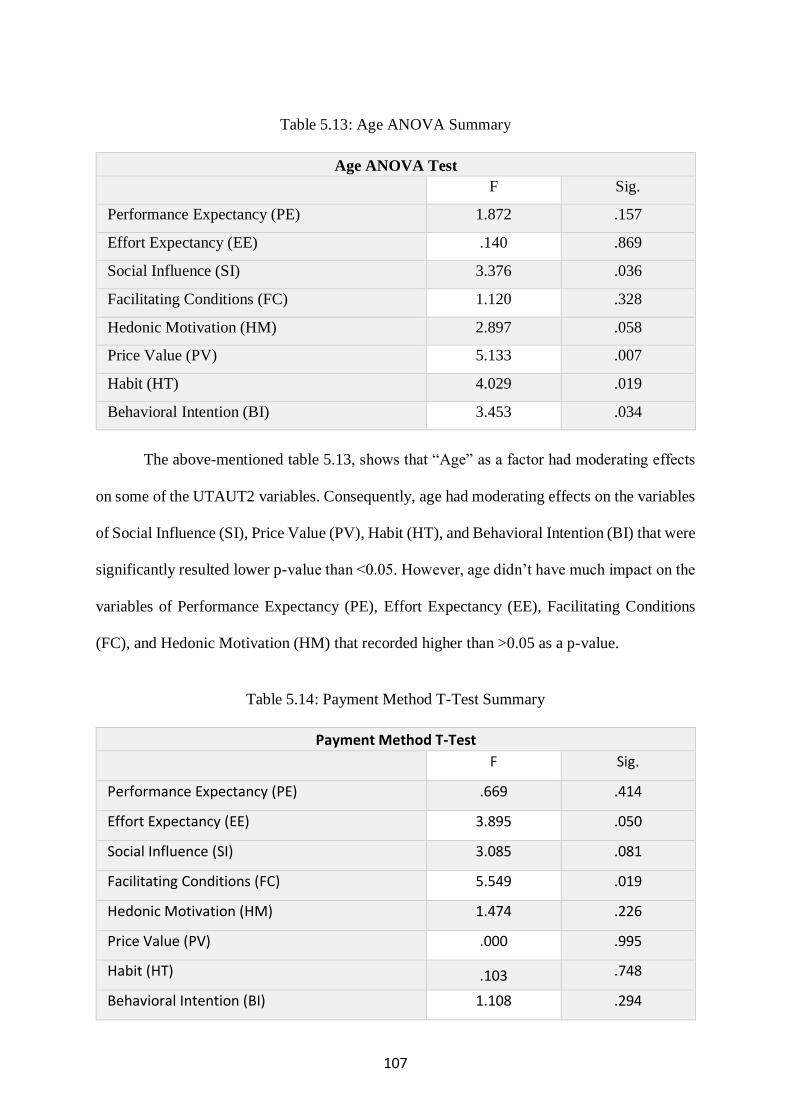
107
Table 5.13: Age ANOVA Summary
Age ANOVA Test
F Sig.
Performance Expectancy (PE) 1.872 .157
Effort Expectancy (EE) .140 .869
Social Influence (SI) 3.376 .036
Facilitating Conditions (FC) 1.120 .328
Hedonic Motivation (HM) 2.897 .058
Price Value (PV) 5.133 .007
Habit (HT) 4.029 .019
Behavioral Intention (BI) 3.453 .034
The above-mentioned table 5.13, shows that “Age” as a factor had moderating effects
on some of the UTAUT2 variables. Consequently, age had moderating effects on the variables
of Social Influence (SI), Price Value (PV), Habit (HT), and Behavioral Intention (BI) that were
significantly resulted lower p-value than <0.05. However, age didn’t have much impact on the
variables of Performance Expectancy (PE), Effort Expectancy (EE), Facilitating Conditions
(FC), and Hedonic Motivation (HM) that recorded higher than >0.05 as a p-value.
Table 5.14: Payment Method T-Test Summary
Payment Method T-Test F Sig.
Performance Expectancy (PE) .669 .414
Effort Expectancy (EE) 3.895 .050
Social Influence (SI) 3.085 .081
Facilitating Conditions (FC) 5.549 .019
Hedonic Motivation (HM) 1.474 .226
Price Value (PV) .000 .995
Habit (HT) .103 .748
Behavioral Intention (BI) 1.108 .294
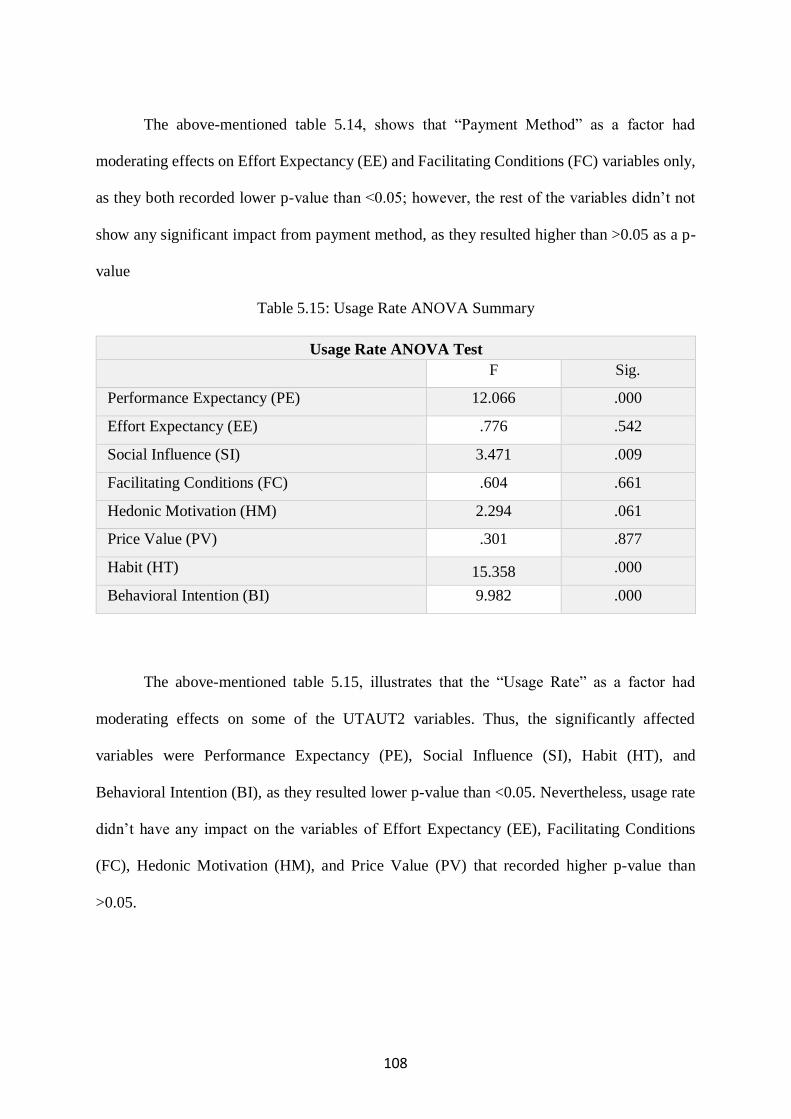
108
The above-mentioned table 5.14, shows that “Payment Method” as a factor had
moderating effects on Effort Expectancy (EE) and Facilitating Conditions (FC) variables only,
as they both recorded lower p-value than <0.05; however, the rest of the variables didn’t not
show any significant impact from payment method, as they resulted higher than >0.05 as a p-
value
Table 5.15: Usage Rate ANOVA Summary
Usage Rate ANOVA Test
F Sig.
Performance Expectancy (PE) 12.066 .000
Effort Expectancy (EE) .776 .542
Social Influence (SI) 3.471 .009
Facilitating Conditions (FC) .604 .661
Hedonic Motivation (HM) 2.294 .061
Price Value (PV) .301 .877
Habit (HT) 15.358 .000
Behavioral Intention (BI) 9.982 .000
The above-mentioned table 5.15, illustrates that the “Usage Rate” as a factor had
moderating effects on some of the UTAUT2 variables. Thus, the significantly affected
variables were Performance Expectancy (PE), Social Influence (SI), Habit (HT), and
Behavioral Intention (BI), as they resulted lower p-value than <0.05. Nevertheless, usage rate
didn’t have any impact on the variables of Effort Expectancy (EE), Facilitating Conditions
(FC), Hedonic Motivation (HM), and Price Value (PV) that recorded higher p-value than
>0.05.
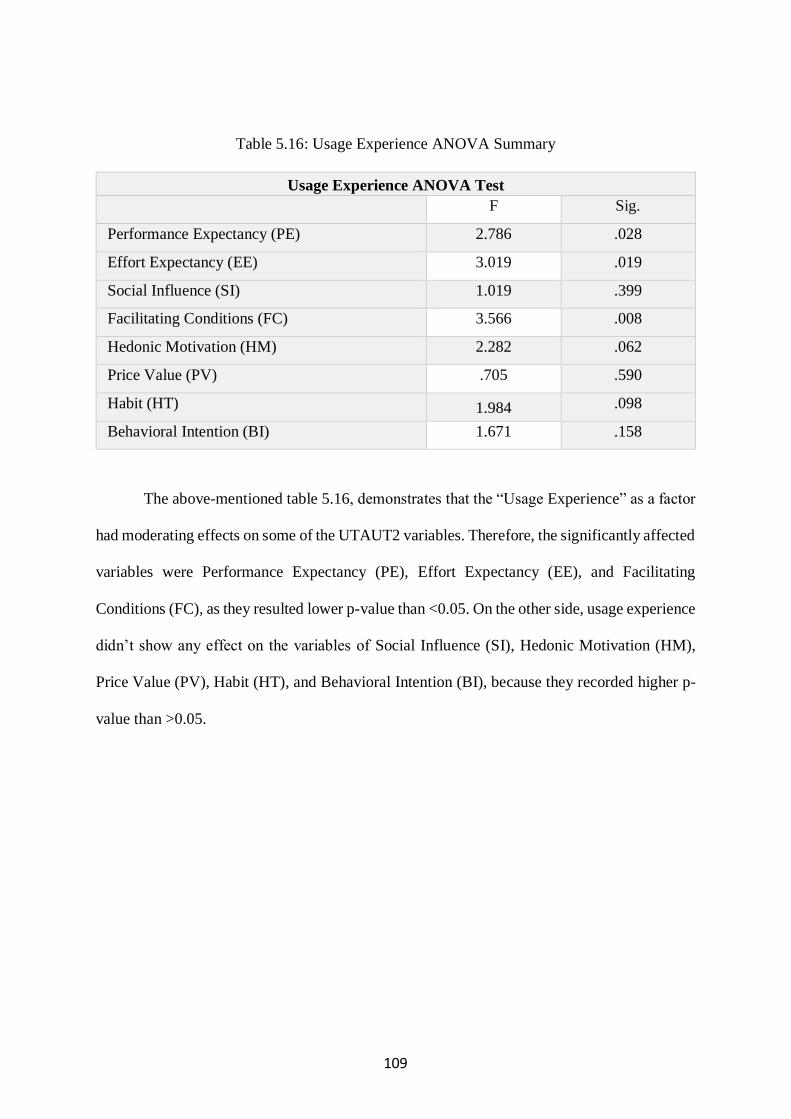
109
Table 5.16: Usage Experience ANOVA Summary
Usage Experience ANOVA Test
F Sig.
Performance Expectancy (PE) 2.786 .028
Effort Expectancy (EE) 3.019 .019
Social Influence (SI) 1.019 .399
Facilitating Conditions (FC) 3.566 .008
Hedonic Motivation (HM) 2.282 .062
Price Value (PV) .705 .590
Habit (HT) 1.984 .098
Behavioral Intention (BI) 1.671 .158
The above-mentioned table 5.16, demonstrates that the “Usage Experience” as a factor
had moderating effects on some of the UTAUT2 variables. Therefore, the significantly affected
variables were Performance Expectancy (PE), Effort Expectancy (EE), and Facilitating
Conditions (FC), as they resulted lower p-value than <0.05. On the other side, usage experience
didn’t show any effect on the variables of Social Influence (SI), Hedonic Motivation (HM),
Price Value (PV), Habit (HT), and Behavioral Intention (BI), because they recorded higher p-
value than >0.05.
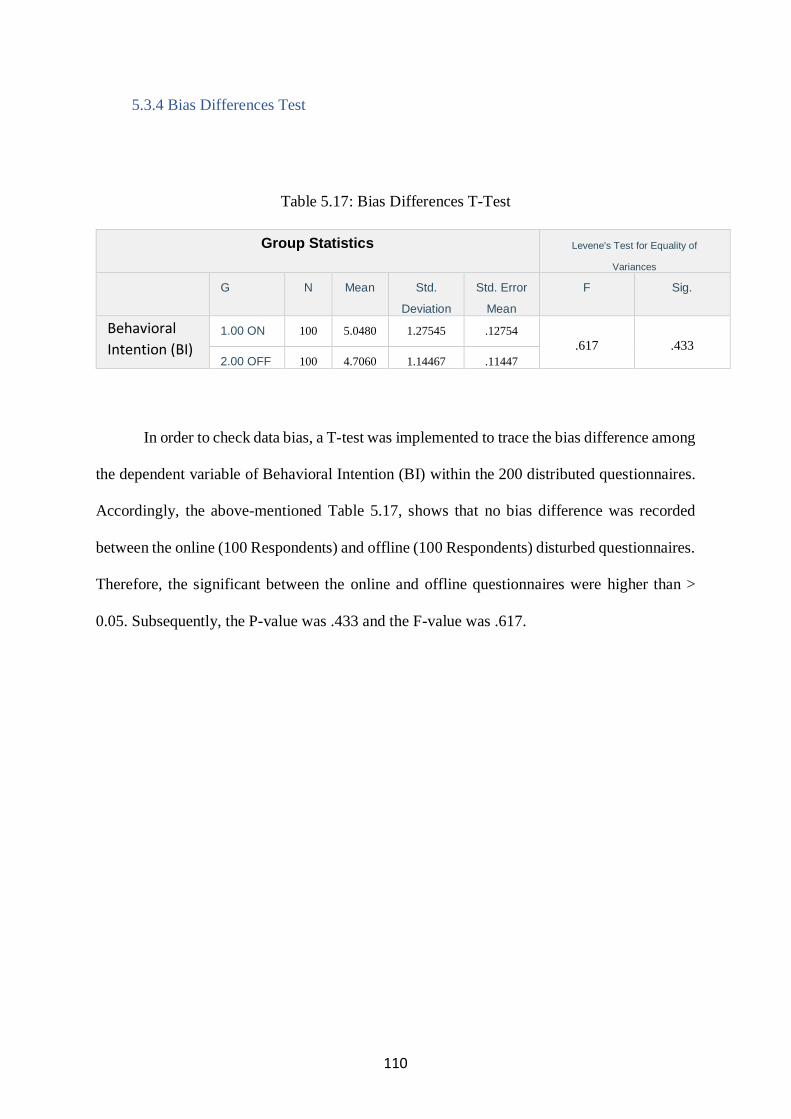
110
5.3.4 Bias Differences Test
Table 5.17: Bias Differences T-Test
Group Statistics Levene's Test for Equality of
Variances G N Mean Std.
Deviation
Std. Error
Mean
F Sig.
Behavioral
Intention (BI) 1.00 ON 100 5.0480 1.27545 .12754
.617 .433
2.00 OFF 100 4.7060 1.14467 .11447
In order to check data bias, a T-test was implemented to trace the bias difference among
the dependent variable of Behavioral Intention (BI) within the 200 distributed questionnaires.
Accordingly, the above-mentioned Table 5.17, shows that no bias difference was recorded
between the online (100 Respondents) and offline (100 Respondents) disturbed questionnaires.
Therefore, the significant between the online and offline questionnaires were higher than >
0.05. Subsequently, the P-value was .433 and the F-value was .617.
111
CHAPTER 6: DISCUSSION, FUTURE IMPLICATIONS, AND
CONCLUSION
In this chapter, the summaries and discussions will be presented about the general
statistical analysis and the significant findings based on what was mentioned earlier of the
results in chapter four. Likewise, this thesis chapter will also include the managerial
implications, limitations, as well as recommendations for future studies alongside an inclusive
conclusion about this research study.
6.1 Summary of Literature Review
This study went through different angles and dimensions that are related to the
smartphones, apps in general and TNCs in specific. Undoubtedly, this paper highlighted the
history and development of the smartphones and the new era of adopting apps as a background,
then the literature chapter went through a broad view of the TNCs development and history,
and then it was narrowed to Egypt as it is the focus of this paper.
Afterward, the research highlighted the consumer's decision process which is
significant to understand how and why to take certain actions to accept or use services such as
the TNCs services and apps. Accordingly, it was also important to study and highlight the
factors that influence the decision as well as the cognitive and affective antecedents that affects
the consumer’s behavioral intention to use these type of transportation services.
Consequently, aspects like mobile marketing, word-of-mouth, information availability,
price, delivery of incentives, service quality, trust and privacy, and much more were provided
and explained to understand what affects the consumers' intention to use certain
product/service such as (TNCs).
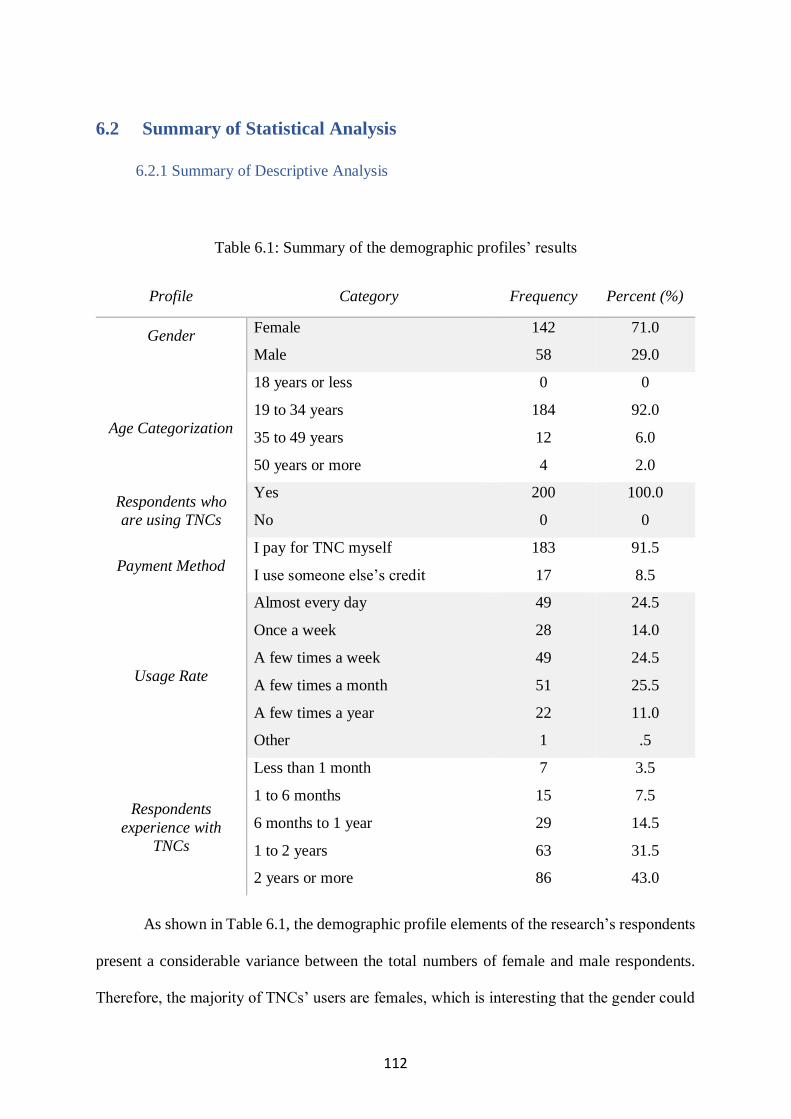
112
6.2 Summary of Statistical Analysis
6.2.1 Summary of Descriptive Analysis
Table 6.1: Summary of the demographic profiles’ results
Profile Category Frequency Percent (%)
Gender
Female
Male
142
58
71.0
29.0
Age Categorization
18 years or less
19 to 34 years
35 to 49 years
50 years or more
0
184
12
4
0
92.0
6.0
2.0
Respondents who
are using TNCs
Yes
No
200
0
100.0
0
Payment Method I pay for TNC myself
I use someone else’s credit
183
17
91.5
8.5
Usage Rate
Almost every day
Once a week
A few times a week
A few times a month
A few times a year
Other
49
28
49
51
22
1
24.5
14.0
24.5
25.5
11.0
.5
Respondents
experience with
TNCs
Less than 1 month
1 to 6 months
6 months to 1 year
1 to 2 years
2 years or more
7
15
29
63
86
3.5
7.5
14.5
31.5
43.0
As shown in Table 6.1, the demographic profile elements of the research’s respondents
present a considerable variance between the total numbers of female and male respondents.
Therefore, the majority of TNCs’ users are females, which is interesting that the gender could
113
be a major aspect of studying UTAUT2 and consumer behavior towards TNC’s in Egypt. In
China, Chen and Salmanian (2017), also found in their study that (58%) of females are using
TNCs in comparison to (39%) of males, which is a prominently large number.
Likewise, the mainstream of the volunteered respondents were between the age group
of 19 to 34 years, and that was close also to the majority of the age group (25 to 30 years) who
are using TNCs services in China (Chen & Salmanian, 2017). This indicates the strong
connection of the millennial generation towards technology.
Furthermore, all the research respondents have used TNCs' services, and the majority
of them pay for TNCs’ services by themselves instead of using someone’s credit. Besides, the
respondents are mainly using the TNCs’ services a few times a month, and most of them have
2 years or more of experience in using TNCs.
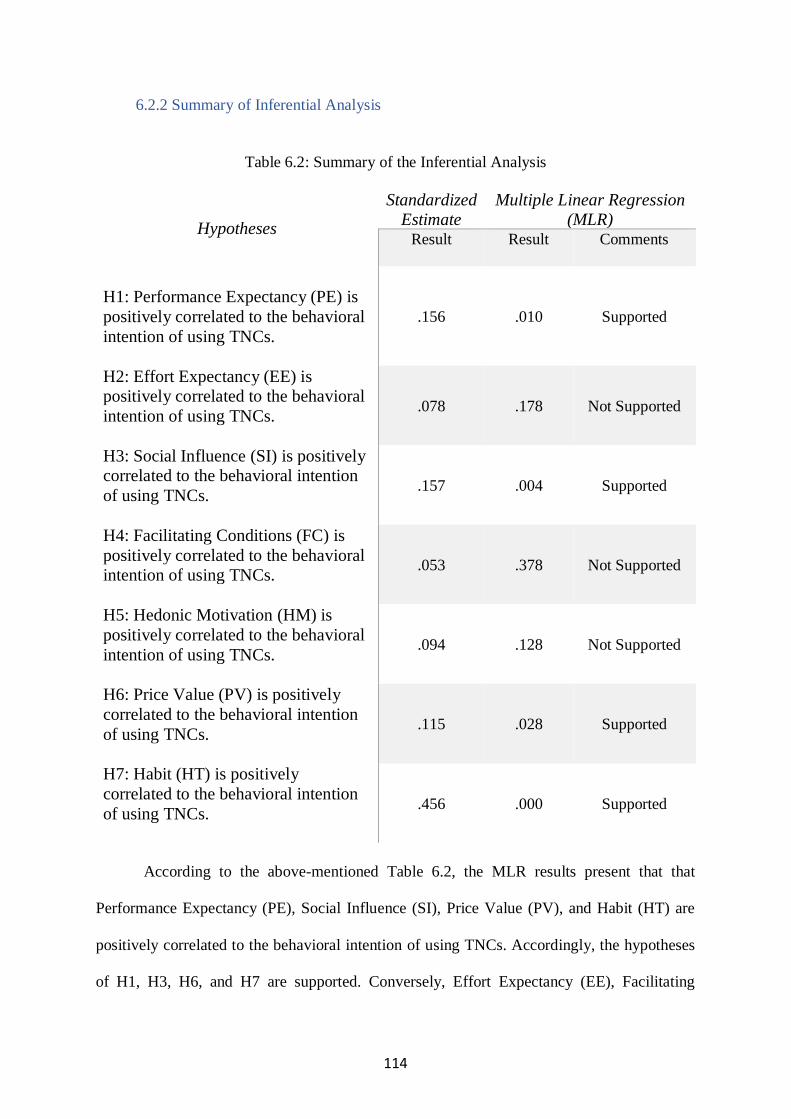
114
6.2.2 Summary of Inferential Analysis
Table 6.2: Summary of the Inferential Analysis
Hypotheses
Standardized Estimate
Multiple Linear Regression (MLR)
Result
Result
Comments
H1: Performance Expectancy (PE) is
positively correlated to the behavioral
intention of using TNCs.
.156 .010 Supported
H2: Effort Expectancy (EE) is positively correlated to the behavioral
intention of using TNCs.
.078 .178 Not Supported
H3: Social Influence (SI) is positively correlated to the behavioral intention
of using TNCs.
.157 .004 Supported
H4: Facilitating Conditions (FC) is
positively correlated to the behavioral intention of using TNCs.
.053 .378 Not Supported
H5: Hedonic Motivation (HM) is
positively correlated to the behavioral
intention of using TNCs.
.094 .128 Not Supported
H6: Price Value (PV) is positively
correlated to the behavioral intention
of using TNCs.
.115 .028 Supported
H7: Habit (HT) is positively
correlated to the behavioral intention
of using TNCs.
.456 .000 Supported
According to the above-mentioned Table 6.2, the MLR results present that that
Performance Expectancy (PE), Social Influence (SI), Price Value (PV), and Habit (HT) are
positively correlated to the behavioral intention of using TNCs. Accordingly, the hypotheses
of H1, H3, H6, and H7 are supported. Conversely, Effort Expectancy (EE), Facilitating
115
Conditions (FC), and Hedonic Motivation (HM) are not positively correlated to the behavioral
intention of using TNCs. Thus, the hypotheses of H2, H4, and H5 are not supported.
Additionally, the standardized estimates numbers and results signify that Habit (HT)
variable is the strongest factor with positive impact on behavioral intention of using TNCs,
followed by Social Influence (SI), Performance Expectancy (PE), Price Value (PV), Hedonic
Motivation (HM), Effort Expectancy (EE), and Facilitating Conditions (FC).
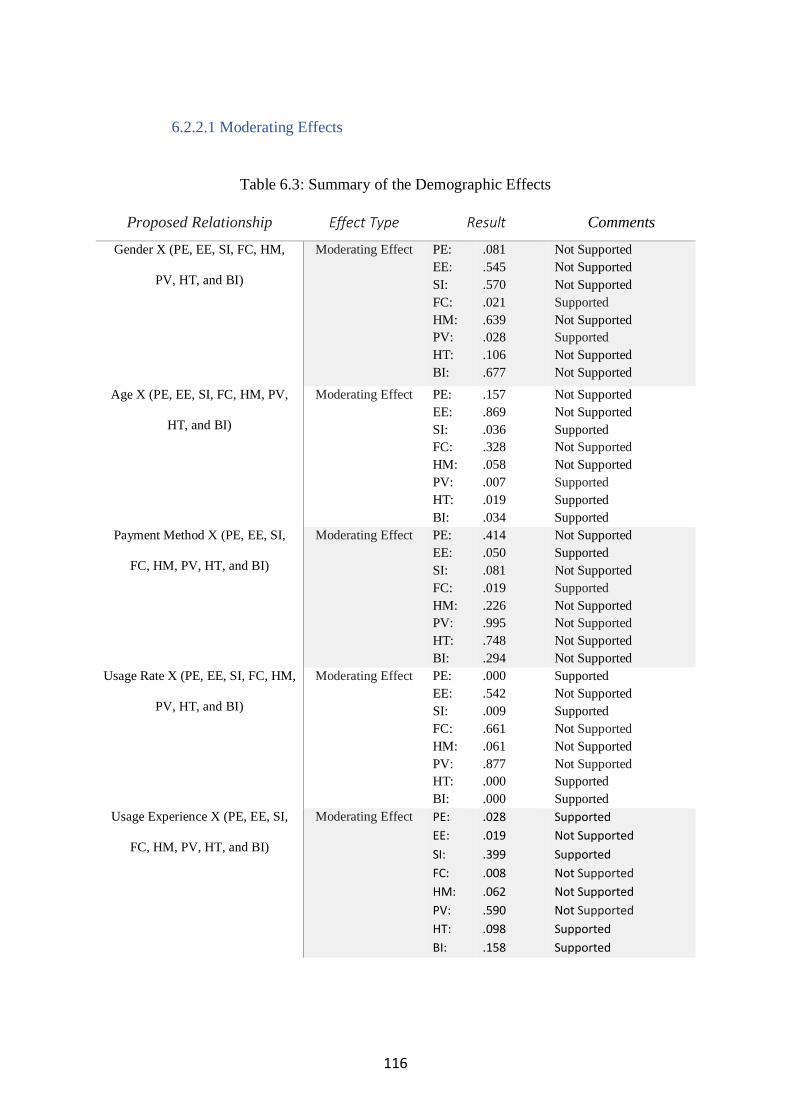
116
6.2.2.1 Moderating Effects
Table 6.3: Summary of the Demographic Effects
Proposed Relationship Effect Type Result Comments
Gender X (PE, EE, SI, FC, HM,
PV, HT, and BI)
Moderating Effect PE:
EE:
SI:
FC:
HM:
PV:
HT:
BI:
.081
.545
.570
.021
.639
.028
.106
.677
Not Supported
Not Supported
Not Supported
Supported
Not Supported
Supported
Not Supported
Not Supported
Age X (PE, EE, SI, FC, HM, PV,
HT, and BI)
Moderating Effect PE:
EE:
SI:
FC:
HM:
PV:
HT:
BI:
.157
.869
.036
.328
.058
.007
.019
.034
Not Supported
Not Supported
Supported
Not Supported
Not Supported
Supported
Supported
Supported
Payment Method X (PE, EE, SI,
FC, HM, PV, HT, and BI)
Moderating Effect PE:
EE:
SI:
FC:
HM:
PV:
HT:
BI:
.414
.050
.081
.019
.226
.995
.748
.294
Not Supported
Supported
Not Supported
Supported
Not Supported
Not Supported
Not Supported
Not Supported
Usage Rate X (PE, EE, SI, FC, HM,
PV, HT, and BI)
Moderating Effect PE:
EE:
SI:
FC:
HM:
PV:
HT:
BI:
.000
.542
.009
.661
.061
.877
.000
.000
Supported
Not Supported
Supported
Not Supported
Not Supported
Not Supported
Supported
Supported
Usage Experience X (PE, EE, SI,
FC, HM, PV, HT, and BI)
Moderating Effect PE:
EE:
SI:
FC:
HM:
PV:
HT:
BI:
.028
.019
.399
.008
.062
.590
.098
.158
Supported
Not Supported
Supported
Not Supported
Not Supported
Not Supported
Supported
Supported
117
This Table 6.3, summarizes the relationship and the impact of demographic factors on
all the UTUAT2 variables including the behavioral intention. Henceforward, factors of Gender,
Age, Payment Method, Usage Rate, and Usage Experience were neither “not supported” nor
“supported” in all the research’s variables. Accordingly, it can’t be assumed that a single factor
can moderate all the variables, but it can be assumed that it might moderate some of the
UTAUT2 variables. For instance, the results showed that Age had moderating effects of the
variables of Social Influence (SI), Price Value (PV), Habit (HT), and Behavioral Intention (BI),
while Gender as a factor had moderating effects on Facilitating Conditions (FC) and Price
Value (PV) variables only.
Furthermore, payment method had moderating effects on Effort Expectancy (EE) and
Facilitating Conditions (FC) variables. Usage rate as a factor had an impact on Performance
Expectancy (PE), Social Influence (SI), Habit (HT), and Behavioral Intention (BI) variables.
Finally, Usage Experience had moderating effects on Performance Expectancy (PE), Effort
Expectancy (EE), and Facilitating Conditions (FC) variables.
118
6.3 Discussion of Major Findings
6.3.1 The Correlation between Performance Expectancy and Behavioral Intention in
using TNCs
As mentioned earlier in this paper, performance expectancy (PE) indicates to the degree
to which TNCs’ users believe its services and apps will help them to develop and enhance their
performance. This aligns with the findings discovered by Chen and Salmanian (2017), which
showed that this variable positively influences the consumer towards the efficiency of TNCs'
services and apps.
In fact, the results gathered in showed that majority of the respondents agreed on the
degree of productivity and perceived usefulness that TNCs services offer. Consequently, there
is a positive correlation between the variable of performance expectancy (PE) on behavioral
intention to use TNCs services. In fact, productivity makes TNCs services and apps cope with
shared-mobility and shared economy’s main factor to offer access and support without demand
for vehicles’ ownership (Chen & Salmanian, 2017).
Moreover, participants mentioned that TNCs are beneficial and improve the efficiency
in achieve more activities during their daily life, which explains the effectiveness associated
with these types of services. Therefore, in light of the UTAUT / UTAUT2 models created by
Venkatesh et al. (2003); and Venkatesh et al. (2012), H1 is supported.
6.3.2 The Correlation between Effort Expectancy and Behavioral Intention in using
TNCs
As highlighted previously in this study, effort expectancy defined as the degree of
which consumers consider TNCs’ apps are easy and simple to use. However, the respondents’
results of this research showed that effort expectancy doesn’t have an effect on behavioral
intention to use TNCs services. Henceforward, users consider TNCs’ apps as they are not that
119
easy and clear to use. Which match with what Tan et al. (2011), mentioned on using apps in
general, and highlight that apps that need excessive efforts, users can be discouraged from
accepting or using them. Thus, in respect of the UTAUT / UTAUT2 models created by
Venkatesh et al. (2003); and Venkatesh et al. (2012), H2 is not supported.
6.3.3 The Correlation between Social Influence and Behavioral Intention in using
TNCs
As pointed previously, social influence was described as the degree to which important
people like (i.e., families, co-workers, friends), assists and guides the user to believe that he/she
should use a system or technology like (TNCs). The results presented in this paper showed that
there a positive correlation from the social influence factor towards the behavioral intention of
using TNCs services.
As a matter of fact, consumers are persuaded by the recommendations, suggestions,
and opinions of their important people, when determining which or whether TNCs should be
selected. This result of social influence is similar to the findings defined or witnessed in Chen
and Salmanian (2017) study that was also related to TNCs’ services and apps. Hence, in light
of the UTAUT / UTAUT2 models created by Venkatesh et al. (2003); and Venkatesh et al.
(2012), H3 is supported.
6.3.4 The Correlation between Facilitating Conditions and Behavioral Intention in
using TNCs
As emphasized earlier, facilitating conditions means the extent to which an external
infrastructure can affects consumers' intention to use new technology such as TNCs services
apps. The findings in this research presented the negative relationship between on behavioral
intention to use TNCs services, which was the opposite and accepted in Chen and Salmanian
120
(2017) research. However, this is not the only construct that provides a negative result in
understanding the behavioral intention of the consumers towards TNCs services and apps.
Furthermore, when consumers find TNCs’ apps productive and they seek others
opinion and suggests, they eliminate the demand for support infrastructure. Accordingly, this
justifies why facilitating conditions are discovered to be irrelevant in predicting the behavioral
intention since the variables of performance expectancy and social influence that were
mentioned in this paper (Venkatesh et al., 2003). Consequently, in view of the UTAUT /
UTAUT2 models created by Venkatesh et al. (2003); and Venkatesh et al. (2012), H4 is not
supported.
6.3.5 The Correlation between Hedonic Motivation and Behavioral Intention in using
TNCs
As mentioned prior, hedonic motivation factor refers to the level of pleasure and
enjoyment associated with the technology that the user experience when he/she use, in this
paper the technology is TNCs services and apps. The hedonic motivation variable was
supported in the several studies Venkatesh et al., (2012); Chang, (2012); Arenas-Gaitán (2015);
and Chen and Salmanian (2017).
However, this research findings showed negative correlation between hedonic
motivation on behavioral intention in using TNCs services and apps. Correspondingly, users
do not experience high levels of enjoyment, pleasure, and entertainment when they use TNCs
services and apps. Henceforth, in respect of the UTAUT2 model created by Venkatesh et al.
(2012), H5 is not supported.
121
6.3.6 The Correlation between Price Value and Behavioral Intention in using TNCs
As stressed beforehand, price value refers to whether consumers view technology like
TNCs are worth its value or not (Venkatesh et al., 2012). The findings in this paper proved that
price value imposes a notably intermediate positive influence on behavioral intention in
adopting and using TNCs services. This implies that TNCs’ consumers carefully assess
financial variances between the available transportation modes and providers.
In a nutshell, TNCs' users are price sensitive, and they evaluate the service alongside
other factors before taking the purchase decision. According to Chen and Salmanian (2017),
price value is associated to the current shared economy research, in which it shows a significant
part as the practice of idle resources that reduces monetary costs. Therefore, in view of the
UTAUT2 model created by Venkatesh et al. (2012), H6 is supported.
6.3.7 The Correlation between Habit and Behavioral Intention in using TNCs
As stated before, habit indicates the automatic behavior associated of using a certain
technology or system such as TNCs. The findings of this research showed that habit is the
strongest factor and predictor of behavioral intention to use TNCs’ services and apps. This
positively aligns with work of Venkatesh et al. (2012); Kit et al. (2014); and Chen and
Salmanian (2017).
As a result, based on the study survey, consumers are addicted to use TNCs’ services
and apps. Liao, Palvia, and Lin (2006) mentioned that the use of certain apps becomes a more
of a routine, thus, habit will be an added factor and element that raises the behavioral intention
to stay using particular systems or apps. Consequently, in light of the UTAUT2 model created
by Venkatesh et al. (2012), H7 is supported.
122
6.4 Managerial Implications
The future managerial implications that suggested by this paper to business and
marketing practitioners in the transportation industry services to support them in evaluating
successful factors for developing, enhancing, and sustain TNCs services and apps.
The factors of habit, social influence, performance expectancy, and price value should
be taken into consideration because these variables are the most noteworthy on the behavioral
intention of using TNCs in Egypt.
Farther, creating TNCs’ services and apps that enhance usefulness, simplicity, and rich
information, developers and system designers should try to strengthen consumers' habit with
value-added upgrades and services regularly.
Likewise, developers should focus on the TNCs’ services and apps functionality as well
as usability from the customers’ standpoint separately from designing apps and services that
are easy to use, access, and navigate. As a matter of fact, Chen and Salmanian (2017)
mentioned that TNCs should prioritize the accessibility and the simplicity of its apps.
Additionally, since consumers’ adoption and purchase decisions are created based on
ratings and reviews, TNCs marketers must keep the right image and quality by solving the
problems, provide instant response to negative and positive feedback to help consumers make
better decisions. Besides, marketers of TNCs should increase the number of incentives to
consumers, which will return of higher usage rate because according to this paper the users are
keen and sensitive to the monetary costs of TNCs services.
Due to the strong competition and other methods of computing, TNCs’ consumers are
considering to get the most attainable high value with low monetary costs. For example,
123
subsidizing the prices of the services that allows the opportunity of dominant a superior market
share and consequently better consumer’s adoption and usage of TNC’s services (Chen and
Salmanian, 2017).
Generally, practitioners can enhance and develop the TNCs’ services by understanding
and evaluate the performance expectancy in terms of the services performance and usability,
effort expectancy in terms of the services and apps clearness and easiness, social influence in
terms of seeking advice of other important people, facilitating conditions in terms of
information and knowledge availability, hedonic motivation in terms of the services’ level of
pleasure and fun, price value in terms of the value gained and pricing strategies, and lastly
habit in terms of service usage as a daily commuting method.
Lastly, this paper highly suggests that the research and development department in each
company should work hand by hand with the marketing department to study the factors that
influence the consumers to use the current services, the new ones (e.g., Uber Bus and Careem
Bus) as well as the future ones using the framework of UTAUT2 model. The implementation
of this model will provide better understanding for TNCs to understand the factors that are
associated with the consumers’ intention to use their services and apps.
124
6.5 Limitations of the Study
This research paper had faced some limitations that would be better if it can be solved
and tackled on the future studies. Firstly, the main limitation was the population of the study,
which was surveying a non-random sample of TNCs users in Egypt over the internet and self-
administered surveys in particular areas. Also, the size of the sample (200 Respondents) was
limited for this study, which is considered as a limitation. Accordingly, the results gathered
cannot be generalized, and thus, the research lacks external validity. Moreover, this study
didn’t present multi-side models that includes the drivers’ side and their behavior towards the
TNCs’ services, as it focused only on the riders’ angle.
Furthermore, this study was limited to investigate the certain variables that affect the
consumers’ behavior intention to use the TNCs services and apps in Egypt by applying the
UTAUT2 framework only. Therefore, other dimensions and aspects might be interesting
(e.g., service quality, trust, privacy, pricing systems and structure) to be tested and analyzed.
125
6.6 Recommendations for Future Research
In order to apply the same techniques or replicate this study, a few of suggests and
recommends was pointed to future researchers and scholars. In fact, as mentioned previously
in the limitations section, the type and size of the sample might be modified and adjusted in
order to have more generalized results, hence achieve an external validly. Likewise, other
geographical areas and zones (e.g. Alexandria, Tanta, Mansoura, Damanhour, etc.) or other
zones regional or international might be interesting in replicating this study.
Furthermore, selecting a specific TNC (e.g., Uber, Careem, Swvl) or specific method
such as the newly announced services (e.g., Uber Bus and Careem Bus) will be highly
recommend for future studies and research.
Moreover, applying different methodology is one of the most recommended advice
from this study. Actually, this study was focusing on applying surveys only to test the UTAUT2
model; accordingly, the quantitative method was used. Therefore, it is recommended to use a
qualitative approach in order to reach more comprehensive and concrete results. As an
example, interview different TNCs’ employees and practitioners or requesting big data set of
the consumers' reviews and feedback on their rides from each TNC in order to fully understand
and utilize the consumers’ behavior and satisfaction.
Lastly, new dimensions might be added to future studies on UTAUT2 model like
privacy and trust, because both aspects are predictable to make an impact on certain consumer's
behavioral intention to use TNCs services and apps. Equally, rather than applying the UTAUT2
model, new frameworks, models, or theories might be interesting to investigate and applied on
TNCs, such as studying the service quality of the TNCs using the model of "SERVQUAL" or
"SERVPERF."
126
6.7 Conclusion
There is no doubt that smartphones and digitalization have shaped the path for new
business models to form and develop such as shared-economy or shared-mobility. Since
transportation is one of the most important and controversial topics in Egypt, it is vital to focus
and observe the market growth of the new TNCs in the Egyptian market and how the Egyptian
consumer react to these type services.
Accordingly, this paper aimed to understand the Egyptian consumer behavior and
his/her intention to use these TNCs services and apps. Therefore, after surveying 200
respondents, the key factors that influence the behavioral intention in using TNCs has been
successfully studied and examined by applying the UTAUT2 model.
In fact, the research findings discovered that Social Influence (SI), Performance
Expectancy (PE), Habit (HT), and Price Value (PV) are positively correlated to the behavioral
intention of using TNCs in Egypt. However, other factors like the Effort Expectancy (EE),
Hedonic Motivation (HM), and Facilitating Conditions (FC), are not positively correlated to
the behavioral intention of using TNCs in Egypt. Overall, the results achieved from this study
are certainly beneficial for the future researchers to replicate the study or for the business
practitioners who are interested in understanding the consumers’ behavioral intention towards
TNCs, in order to develop their marketing strategies.
127
REFERENCES
Ackaradejruangsri, P. (2015). Insights on GrabTaxi: An Alternative Ride Service in Thailand.
Review of Integrative Business and Economics Research, 4(3), 49.
Al-Ahram Weekly (2016). Taxi wars hit Cairo. Retrieved October 14, 2018, from
http://weekly.ahram.org.eg/News/15474.aspx
Al-Tarawneh, H. A. (2011). The Main Factors beyond Decision Making. Journal of Management
Research, 4(1). https://doi.org/10.5296/jmr.v4i1.1184
Anselmsson, J., & Johansson, U. (2014). A comparison of customer perceived service quality in
discount versus traditional grocery stores: An examination of service quality measurement
scales in a Swedish context. International Journal of Quality and Service Sciences, 6(4),
369–386. https://doi.org/10.1108/IJQSS-03-2013-0012
Arenas-Gaitán, J. (2015). Elderly and Internet Banking: An Application of UTAUT2, 20(1), 23.
Ariely, D. (2000). Controlling the Information Flow: Effects on Consumers’ Decision Making and
Preferences. Journal of Consumer Research, 27(2), 233–248.
https://doi.org/10.1086/314322
Banerjee, S., Johari, R., & Riquelme, C. (2016). Dynamic pricing in ridesharing platforms. ACM
SIGecom Exchanges, 15(1), 65–70.
Bei, L.-T., Chen, E. Y., & Widdows, R. (2004). Consumers’ online information search behavior
and the phenomenon of search vs. experience products. Journal of Family and Economic
Issues, 25(4), 449–467.
Blackwell, R. D., Miniard, P. W., & Engel, J. F. (2006). Consumer behavior. Mason, OH:
Thomson/South-Western.
Bressolles, G., Durrieu, F., & Deans, K. R. (2015). An examination of the online service-profit
chain. International Journal of Retail & Distribution Management, 43(8), 727–751.
https://doi.org/10.1108/IJRDM-11-2013-0214
128
Camarero, C., & San José, R. (2011). Social and attitudinal determinants of viral marketing
dynamics. Computers in Human Behavior, 27(6), 2292–2300.
https://doi.org/10.1016/j.chb.2011.07.008
Careem Website (n.d.). Where does Careem operate? - Careem Cities. Retrieved October 14,
2018, from https://www.careem.com/en-ae/cities/
Chang, A. (2012). UTAUT and UTAUT 2: A Review and Agenda for Future Research. The
Winners, 13(2), 10. https://doi.org/10.21512/tw.v13i2.656
Chen, Y., & Salmanian, W. (2017). User Acceptance in the Sharing Economy: An explanatory
study of Transportation Network Companies in China based on UTAUT2.
Chen, Y., Wolfram, S., & Akram, A. (2017). User Acceptance in Sharing Economy - A Study of
Transportation Network Companies in China, 18.
Chocarro, R., Cortiñas, M., & Villanueva, M.-L. (2013). Situational variables in online versus
offline channel choice. Electronic Commerce Research and Applications, 12(5), 347–361.
https://doi.org/10.1016/j.elerap.2013.03.004
cycles, T. text provides general information S. assumes no liability for the information given being
complete or correct D. to varying update, & Text, S. C. D. M. up-to-D. D. T. R. in the. (n.d.).
Topic: Mobile internet usage worldwide. Retrieved September 30, 2018, from
https://www.statista.com/topics/779/mobile-internet/
Daponte, P., De Vito, L., Picariello, F., & Riccio, M. (2013). State of the art and future
developments of measurement applications on smartphones. Measurement, 46(9), 3291–
3307. https://doi.org/10.1016/j.measurement.2013.05.006
De Bruyn, A., & Lilien, G. L. (2008). A multi-stage model of word-of-mouth influence through
viral marketing. International Journal of Research in Marketing, 25(3), 151–163.
https://doi.org/10.1016/j.ijresmar.2008.03.004
129
de Luca, S., & Di Pace, R. (2015). Modelling users’ behaviour in inter-urban carsharing program:
A stated preference approach. Transportation Research Part A: Policy and Practice, 71, 59–
76. https://doi.org/10.1016/j.tra.2014.11.001
Dillahunt, T. R., Kameswaran, V., Li, L., & Rosenblat, T. (2017). Uncovering the Values and
Constraints of Real-time Ridesharing for Low-resource Populations. In Proceedings of the
2017 CHI Conference on Human Factors in Computing Systems - CHI ’17 (pp. 2757–2769).
Denver, Colorado, USA: ACM Press. https://doi.org/10.1145/3025453.3025470
Dudley, G., Banister, D., & Schwanen, T. (2017). The Rise of Uber and Regulating the Disruptive
Innovator. The Political Quarterly, 88(3), 492–499. https://doi.org/10.1111/1467-
923X.12373
Elewa, N. (2018). Know your Uber Egypt services | Uber Blog. Retrieved October 4, 2018, from
https://www.uber.com/en-EG/blog/a-guide-to-uber-egypt-services/
Engel, J.F., Blackwell, R. and Miniard, P.W. (1986). Consumer Behavior. New York: Dresden
Press.
Engel, J. F., Blackwell, R. D., Miniard P.W. (1993). Consumer behavior. Fort Worth, TX: Dryden
Press.
Ferguson, D. A., & Perse, E. M. (2000, Spring). The World Wide Web as a Functional Alternative
to Television. Journal of Broadcasting & Electronic Media, 44(2), 155. Retrieved from
http://link.galegroup.com/apps/doc/A63018839/BIC1?u=aucairo&xid=78c8677e
Gao, J., Zhang, C., Wang, K., & Ba, S. (2012). Understanding online purchase decision making:
The effects of unconscious thought, information quality, and information quantity. Decision
Support Systems, 53(4), 772–781. https://doi.org/10.1016/j.dss.2012.05.011
George, D., & Mallery, P. (2003). SPSS for windows step by step: A simple guide and reference,
11.0 update (4th ed.). Boston: Allyn & Bacon.
130
Greenblatt, J. B., & Shaheen, S. (2015). Automated Vehicles, On-Demand Mobility, and
Environmental Impacts. Current Sustainable/Renewable Energy Reports, 2(3), 74–81.
https://doi.org/10.1007/s40518-015-0038-5
Gsma (2018). The Mobile Economy 2018. Retrieved from:
https://www.gsma.com/mobileeconomy/wp-content/uploads/2018/02/The-Mobile-
Economy-Global-2018.pdf
Hamdi, N., Mourad, M., & Knecht, E. (2018, May 7). Egypt passes law regulating Uber, Careem
ride-sharing services. Reuters. Retrieved from https://www.reuters.com/article/us-egypt-uber-
idUSKBN1I81VG
Hawapi, M. W., Sulaiman, Z., Abdul Kohar, U. H., & Talib, N. A. (2017). Effects of Perceived
Risks, Reputation and Electronic Word of Mouth (E-WOM) on Collaborative Consumption
of Uber Car Sharing Service. IOP Conference Series: Materials Science and Engineering,
215, 12019. https://doi.org/10.1088/1757-899X/215/1/012019
Hawkins, D. I., & Mothersbaugh, D. L., (2014). Consumer behavior: Building marketing strategy.
New York, NY: McGraw-Hill Education.
Hawkins, D. I., Best, R. J., & Coney, K. A. (2001). Consumer behavior: Building marketing
strategy. Boston, Mass. [u.a.: Irwin McGraw-Hill.
He, F., Wang, X., Lin, X., & Tang, X. (2018). Pricing and penalty/compensation strategies of a
taxi-hailing platform. Transportation Research Part C: Emerging Technologies, 86, 263–
279. https://doi.org/10.1016/j.trc.2017.11.003
Hsiao, K., Chuan‐Chuan Lin, J., Wang, X., Lu, H., & Yu, H. (2010). Antecedents and
consequences of trust in online product recommendations: An empirical study in social
shopping. Online Information Review, 34(6), 935–953.
https://doi.org/10.1108/14684521011099414
131
Ishak, F., & Abd Ghani, N. H. (2013). A review of the literature on brand loyalty and customer
loyalty. Retrieved from http://repo.uum.edu.my/16316/1/20.pdf
Islam, N., & Want, R. (2014). Smartphones: Past, Present, and Future. IEEE Pervasive
Computing, 13(4), 89–92. https://doi.org/10.1109/MPRV.2014.74
Islam, Z., Kim Cheng Low, P., & Hasan, I. (2013). Intention to use advanced mobile phone
services (AMPS). Management Decision, 51(4), 824–838.
https://doi.org/10.1108/00251741311326590
Kahn, B. K., Strong, D. M., & Wang, R. Y. (2002). Information quality benchmarks: product and
service performance. Communications of the ACM, 45(4), 184–192.
Kaplan, A. M., & Haenlein, M. (2011). Two hearts in three-quarter time: How to waltz the social
media/viral marketing dance. Business Horizons, 54(3), 253–263.
https://doi.org/10.1016/j.bushor.2011.01.006
Karimi, S., Papamichail, K. N., & Holland, C. P. (2015). The effect of prior knowledge and
decision-making style on the online purchase decision-making process: A typology of
consumer shopping behaviour. Decision Support Systems, 77, 137–147.
https://doi.org/10.1016/j.dss.2015.06.004
Karpenko, Y. M. (2016). Development of the sales promotion under modern market conditions.
scientific bulletin of Polissia, (4), 335–339.
Kim, D. J., Ferrin, D. L., & Rao, H. R. (2008). A trust-based consumer decision-making model in
electronic commerce: The role of trust, perceived risk, and their antecedents. Decision
Support Systems, 44(2), 544–564. https://doi.org/10.1016/j.dss.2007.07.001
Kim, J., Rasouli, S., & Timmermans, H. (2017). Satisfaction and uncertainty in car-sharing
decisions: An integration of hybrid choice and random regret-based models. Transportation
Research Part A: Policy and Practice, 95, 13–33. https://doi.org/10.1016/j.tra.2016.11.005
132
Kit, A. K. L., Ni, A. H., Badri, E. N. F. B. M., & Tang, K. Y. (2014). UTAUT2 influencing the
behavioural intention to adopt mobile applications (Bachelor dissertation, Universiti Tunku
Abdul Rahman).
Liao, C., Palvia, P., & Lin, H. N. (2006). The roles of habit and web site quality in e-commerce.
International Journal of Information Management, 26, 469- 483.
Mafe, C. R., Blas, S. S. & Tavera-Mesias, J. F. (2010). A comparative study of mobile messaging
services acceptance to participate in television programmes. Journal of Service Management,
21(1), 69-102.
Maity, M., & Dass, M. (2014). Consumer decision-making across modern and traditional
channels: E-commerce, m-commerce, in-store. Decision Support Systems, 61, 34–46.
https://doi.org/10.1016/j.dss.2014.01.008
Marusich, L. R., Bakdash, J. Z., Onal, E., Yu, M. S., Schaffer, J., O’Donovan, J., Gonzalez, C.
(2016). Effects of information availability on command-and-control decision making:
performance, trust, and situation awareness. Human Factors, 58(2), 301–321.
McBride, S. (2015). Ridesourcing and the taxi marketplace (PhD Thesis). PhD. Dissertation.
Dissertation thesis submitted to Boston College, College of Arts and Sciences.
Mehta, S. C., Lalwani, A. K., & Li Han, S. (2000). Service quality in retailing: relative efficiency
of alternative measurement scales for different product‐service environments. International
Journal of Retail & Distribution Management, 28(2), 62–72.
https://doi.org/10.1108/09590550010315106
Miranda, S., Tavares, P., & Queiró, R. (2018). Perceived service quality and customer satisfaction:
A fuzzy set QCA approach in the railway sector. Journal of Business Research, 89, 371–377.
https://doi.org/10.1016/j.jbusres.2017.12.040
Monash University (n.d.). Marketing dictionary - Usage Rate. Retrieved October 14, 2018, from
https://www.monash.edu/business/marketing/marketing-dictionary/u/usage-rate
133
Pappas, N. (2016). Marketing strategies, perceived risks, and consumer trust in online buying
behaviour. Journal of Retailing and Consumer Services, 29, 92–103.
https://doi.org/10.1016/j.jretconser.2015.11.007
Pescher, C., Reichhart, P., & Spann, M. (2014). Consumer Decision-making Processes in Mobile
Viral Marketing Campaigns. Journal of Interactive Marketing, 28(1), 43–54.
https://doi.org/10.1016/j.intmar.2013.08.001
Pham, T. S. H., & Ahammad, M. F. (2017). Antecedents and consequences of online customer
satisfaction: A holistic process perspective. Technological Forecasting and Social Change,
124, 332–342. https://doi.org/10.1016/j.techfore.2017.04.003
Rayle, L., Shaheen, S., Chan, N., Dai, D., & Cervero, R. (2014). App-Based, On-Demand Ride
Services: Comparing Taxi and Ridesourcing Trips and User Characteristics in San Francisco.
University of California Transportation Center (UCTC). Retrieved from
https://www.its.dot.gov/itspac/dec2014/ridesourcingwhitepaper_nov2014.pdf
Retamal, M. (2017). Product-service systems in Southeast Asia: Business practices and factors
influencing environmental sustainability. Journal of Cleaner Production, 143, 894–903.
https://doi.org/10.1016/j.jclepro.2016.12.032
Richter, T. (2012). International marketing mix management: Theoretical framework, contingency
factors and empirical findings from the world- markets. Berlin: Logos Verlag.
Rha, J.-Y. (2002). Consumers in the Internet Era: Essays on the impact of electronic commerce
from a consumer perspective (PhD Thesis). The Ohio State University.
Rohm, A. J., Gao, T. (Tony), Sultan, F., & Pagani, M. (2012). Brand in the hand: A cross-market
investigation of consumer acceptance of mobile marketing. Business Horizons, 55(5), 485–
493. https://doi.org/10.1016/j.bushor.2012.05.004
134
Sam, K. M., & Chatwin, C. (2015). Online consumer decision-making styles for enhanced
understanding of Macau online consumer behavior. Asia Pacific Management Review, 20(2),
100–107. https://doi.org/10.1016/j.apmrv.2014.12.005
Senecal, S., Kalczynski, P. J., & Nantel, J. (2005). Consumers’ decision-making process and their
online shopping behavior: a clickstream analysis. Journal of Business Research, 58(11),
1599–1608. https://doi.org/10.1016/j.jbusres.2004.06.003
Shaheen, S., & Chan, N. (2015). Mobility and the sharing economy: Impacts synopsis. Berkeley,
CA: Transportation Sustainability Research Center, University of California. Retrieved from
http://innovativemobility.org/wp-content/uploads/Innovative-Mobility-Industry-
Outlook_SM-Spring-2015.pdf
Shin, D. H. (2009). Towards an understanding of the consumer acceptance of mobile wallet
Original Research Article. Computers in Human Behavior, 25, 1343-1354. doi:
10.1016/j.chb.2009.06.001
Sicilia, M., & Ruiz, S. (2010). The Effect of Web-Based Information Availability on Consumers’
Processing and Attitudes. Journal of Interactive Marketing, 24(1), 31–41.
https://doi.org/10.1016/j.intmar.2009.10.001
Ström, R., Vendel, M., & Bredican, J. (2014). Mobile marketing: A literature review on its value
for consumers and retailers. Journal of Retailing and Consumer Services, 21(6), 1001–1012.
https://doi.org/10.1016/j.jretconser.2013.12.003
Sun, Q., Cao, H., & You, J. (2010, May). Factors influencing the adoption of mobile service in
China: An integration of TAM. Journal of Computers, 5(5), 799-806.
Suriyamongkol, M. C. (2016). The influence of sales promotion on Thai customer purchase
decision for transportation service application: A case study of Grab and Uber in Thailand
(PhD Thesis). Thammasat University.
135
Swvl Website (n.d.). Reinventing public transportation in Egypt. Retrieved October 14, 2018,
from https://swvl.com/
Tamilmani, K., Rana, N. P., & Dwivedi, Y. K. (2018). Mobile Application Adoption Predictors:
Systematic Review of UTAUT2 Studies Using Weight Analysis. In S. A. Al-Sharhan, A. C.
Simintiras, Y. K. Dwivedi, M. Janssen, M. Mäntymäki, L. Tahat, … N. P. Rana (Eds.),
Challenges and Opportunities in the Digital Era (Vol. 11195, pp. 1–12). Cham: Springer
International Publishing. https://doi.org/10.1007/978-3-030-02131-3_1
Tan, G. W. H., Sim, J. J., Ooi, K. B., & Phusavat, K. (2012). Determinants of mobile learning
adoption: an empirical analysis. Journal of Computer Information Systems, 82-91.
The Economist. (2014). Pricing the surge. Retrieved September 23, 2018, from
https://www.economist.com/finance-and-economics/2014/03/29/pricing-the-surge
Venkatesh, V., James Y. L. Thong, & Xu, X. (2012). Consumer acceptance and use of information
technology: Extending the unified theory of acceptance and use of technology.MIS
Quarterly, 36(1), 157-178. doi:10.2307/41410412
Venkatesh, V., Morris, M. G., Davis, G. B., & Davis, F. D. (2003). User acceptance of
information technology: toward a unified view. MIS Quarterly, 27(3), 425-478.
Wang, X., He, F., Yang, H., & Oliver Gao, H. (2016). Pricing strategies for a taxi-hailing
platform. Transportation Research Part E: Logistics and Transportation Review, 93, 212–
231. https://doi.org/10.1016/j.tre.2016.05.011
Washington Metropolitan Area Transit Authority (2018). Transportation Network Companies
(TNCs) in the Washington Region: Transportation Planning Board. Retrieved December 23,
2018, from https://www.mwcog.org/assets/1/28/04062018_-_Item_2_-
_Transportation_Network_Companies_(TNCs)_in_the_Region.pdf
Westbrook, R. A. and Fomell, C. (1979). “Patterns of information source usage among durable
goods buyers”. Journal of Marketing Research, 16,303-312.
136
Yi, M., Jackson, J., Park, J., & Probst, J. (2006). Understanding information technology
acceptance by individual professionals: Toward an integrative view. Information and
Management, 43(3), 350-363.
Zha, L., Yin, Y., & Du, Y. (2017). Surge pricing and labor supply in the ride-sourcing market.
Transportation Research Part B: Methodological. https://doi.org/10.1016/j.trb.2017.09.010
Zha, L., Yin, Y., & Xu, Z. (2018). Geometric matching and spatial pricing in ride-sourcing
markets. Transportation Research Part C: Emerging Technologies, 92, 58–75.
https://doi.org/10.1016/j.trc.2018.04.015
Zha, L., Yin, Y., & Yang, H. (2016). Economic analysis of ride-sourcing markets. Transportation
Research Part C: Emerging Technologies, 71, 249–266.
https://doi.org/10.1016/j.trc.2016.07.010
Zoepf, S. M., & Keith, D. R. (2016). User decision-making and technology choices in the U.S.
carsharing market. Transport Policy, 51, 150–157.
https://doi.org/10.1016/j.tranpol.2016.01.010
137
Appendix A: IRBs Approval

138
Appendix B: CAPMAS Approval
139
Appendix C: Informed Consent
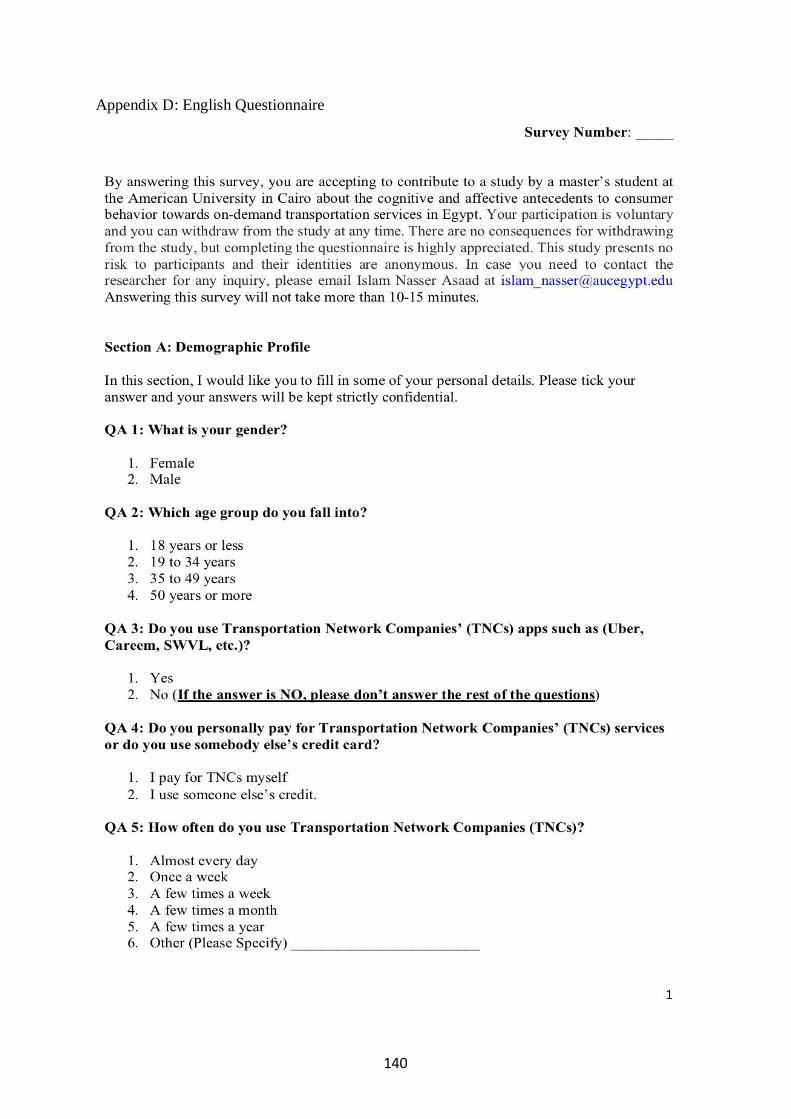
140
Appendix D: English Questionnaire
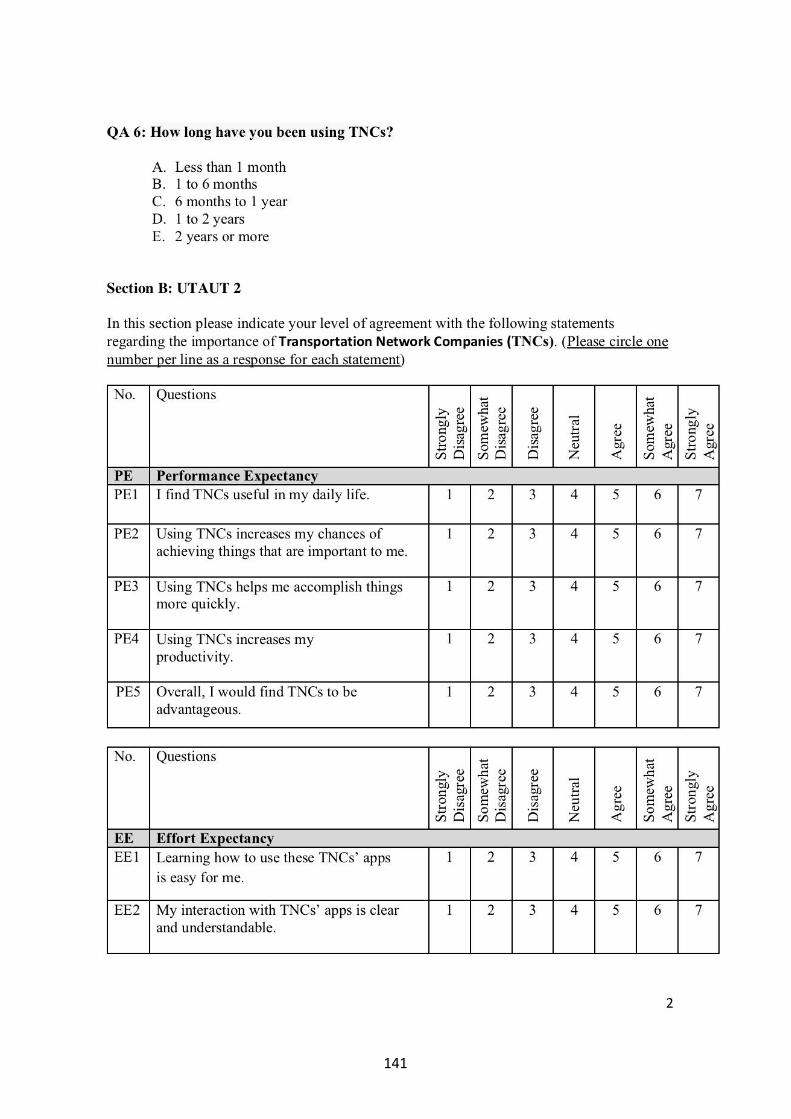
141
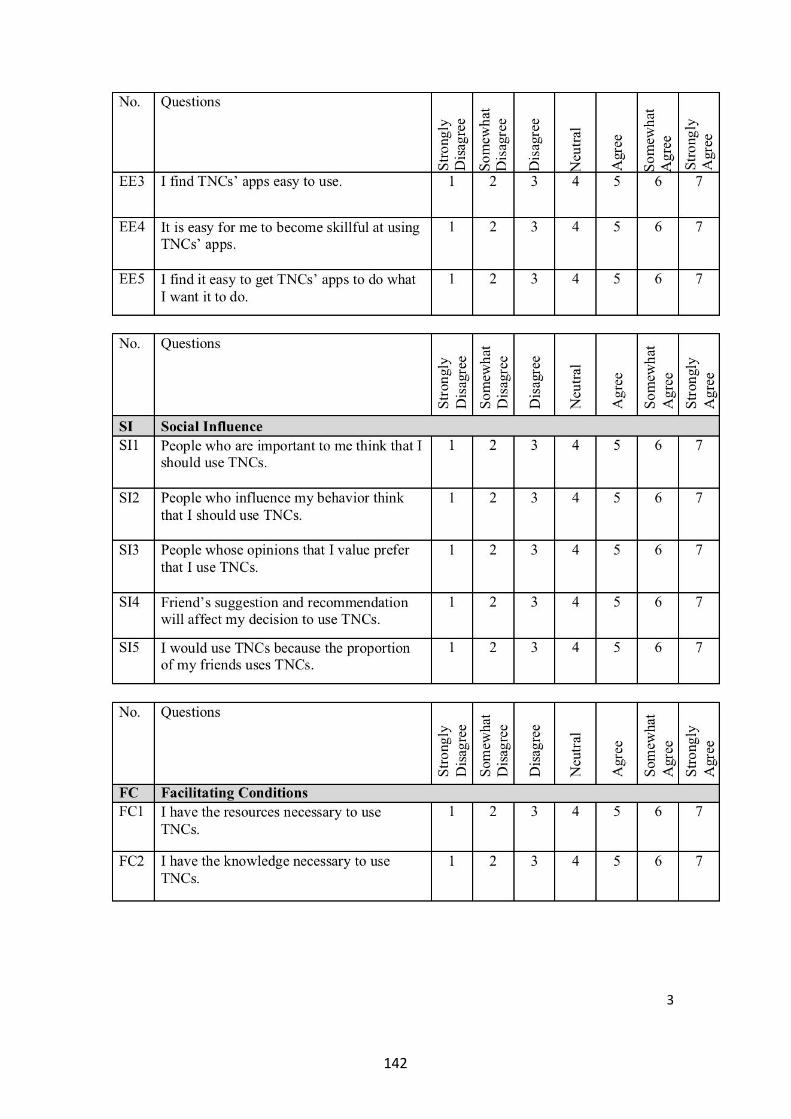
142
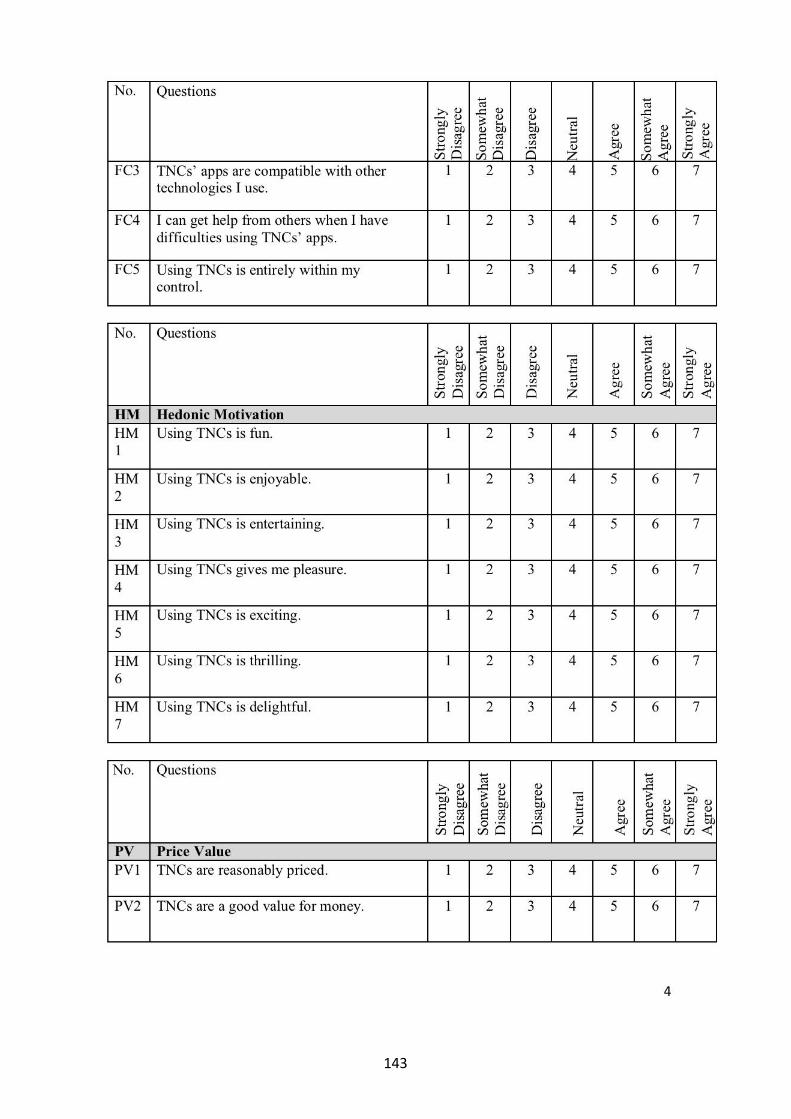
143
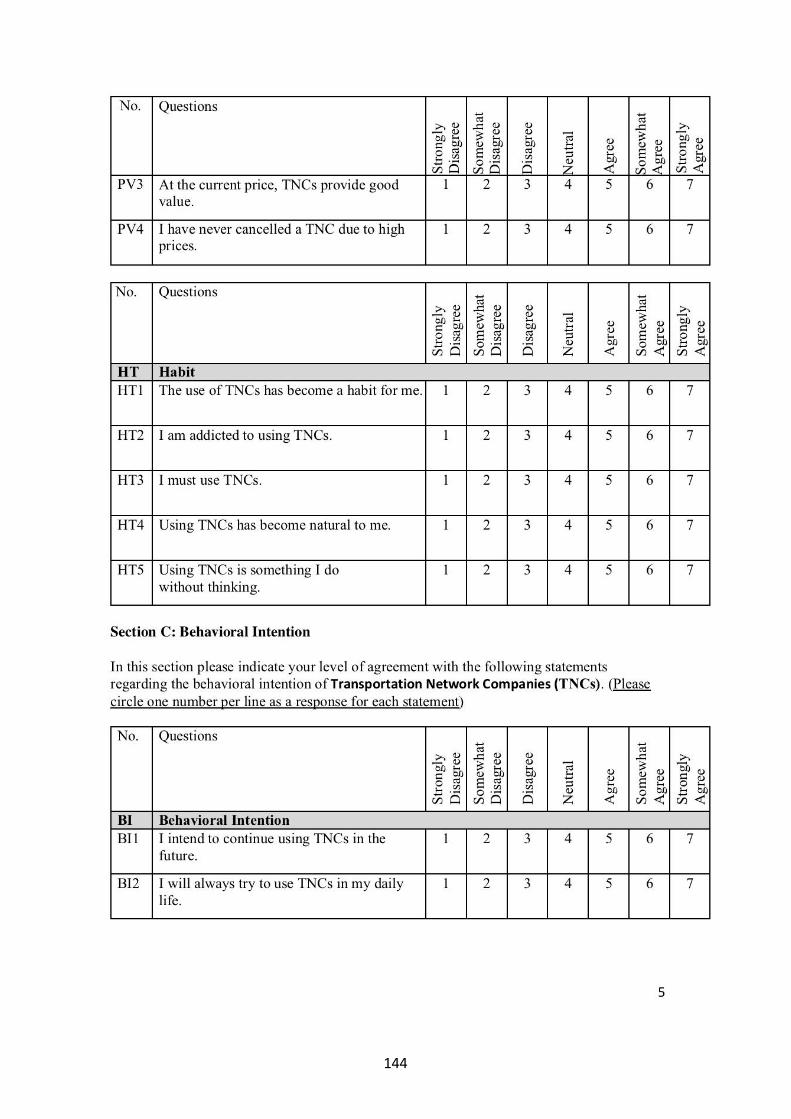
144
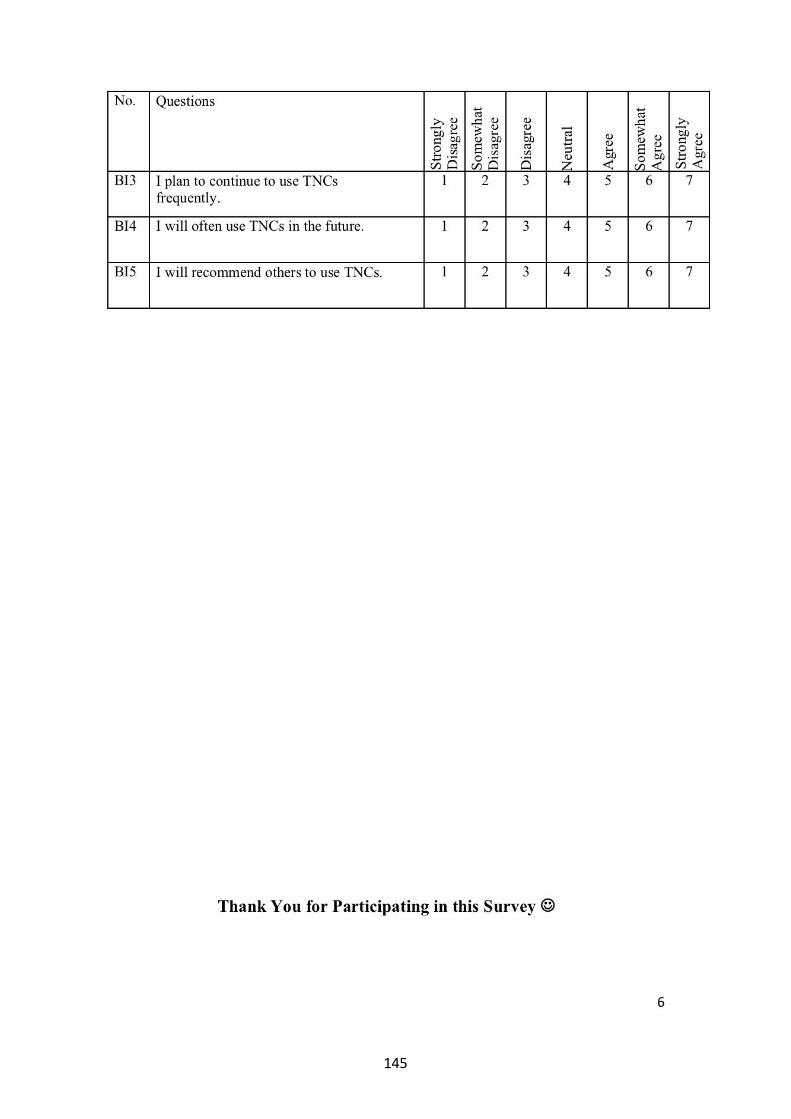
145
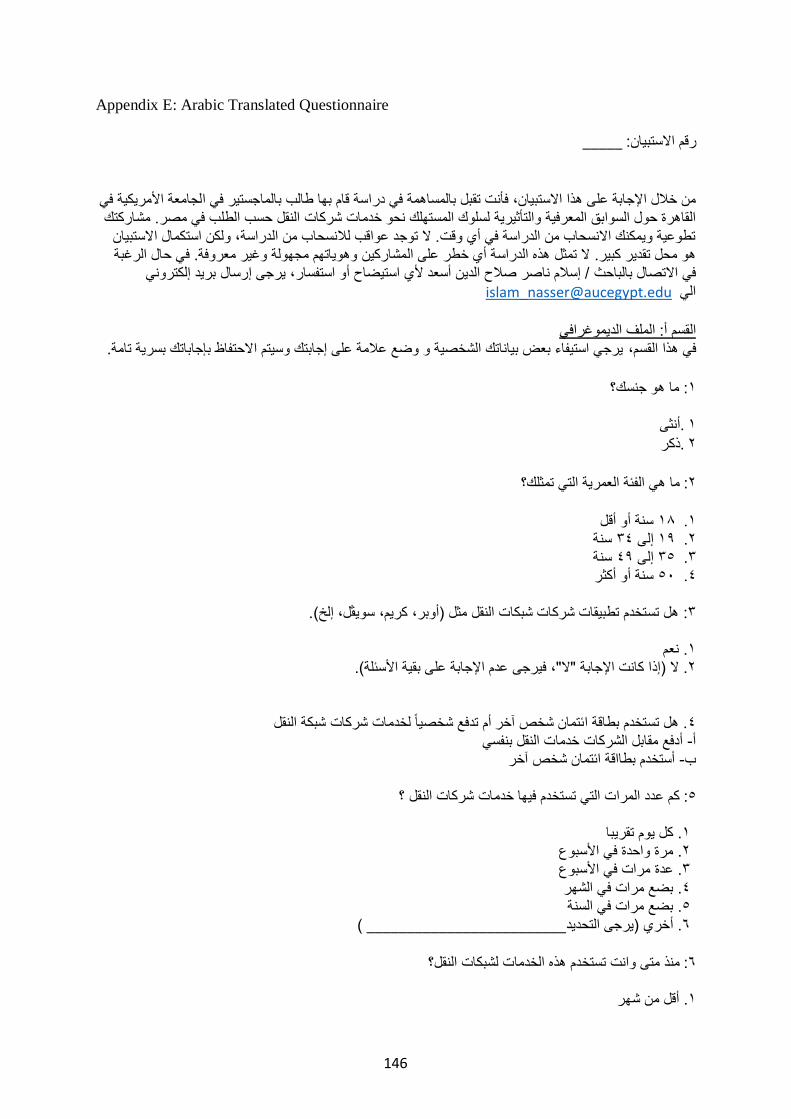
146
Appendix E: Arabic Translated Questionnaire
_____ الاستبيان: رقم
الماجستير في الجامعة الأمريكية في بفأنت تقبل بالمساهمة في دراسة قام بها طالب الاستبيان،من خلال الإجابة على هذا النقل حسب الطلب في مصر. مشاركتك شركات لسلوك المستهلك نحو خدمات والتأثيريةالقاهرة حول السوابق المعرفية
ولكن استكمال الاستبيان اسة،الدرتطوعية ويمكنك الانسحاب من الدراسة في أي وقت. لا توجد عواقب للانسحاب من الرغبة . في حالوغير معروفةهذه الدراسة أي خطر على المشاركين وهوياتهم مجهولة للا تمثهو محل تقدير كبير.
يرجى إرسال بريد إلكتروني استيضاح أو استفسار،ي لأ / إسلام ناصر صلاح الدين أسعد الاتصال بالباحث في[email protected] الي
القسم أ: الملف الديموغرافي
.يرجي استيفاء بعض بياناتك الشخصية و وضع علامة على إجابتك وسيتم الاحتفاظ بإجاباتك بسرية تامة القسم،في هذا
: ما هو جنسك؟١ أنثى .١ ذكر .٢ ؟تمثلكما هي الفئة العمرية التي :٢ سنة أو أقل ١٨. ١ سنة ٣٤إلى ١٩. ٢ سنة ٤٩إلى ٣٥. ٣ أكثرأو سنة ٥٠. ٤
٣: هل تستخدم تطبيقات شركات شبكات النقل مثل )أوبر، كريم، سويڤل، إلخ(.
نعم. ١ (.فيرجى عدم الإجابة على بقية الأسئلة "،لا )إذا كانت الإجابة "لا. ٢
. هل تستخدم بطاقة ائتمان شخص آخر٤ أم تدفع شخصيا لخدمات شركات شبكة النقل أدفع مقابل الشركات خدمات النقل بنفسي -أ
أستخدم بطااقة ائتمان شخص آخر -ب كم عدد المرات التي تستخدم فيها خدمات شركات النقل ؟ :٥
تقريباكل يوم . ١ مرة واحدة في الأسبوع .٢ عدة مرات في الأسبوع .٣ بضع مرات في الشهر .٤ بضع مرات في السنة .٥ ( _________________________)يرجى التحديد. أخري ٦ النقل؟ اتشبكلمنذ متى وانت تستخدم هذه الخدمات :٦ من شهرأقل . ١
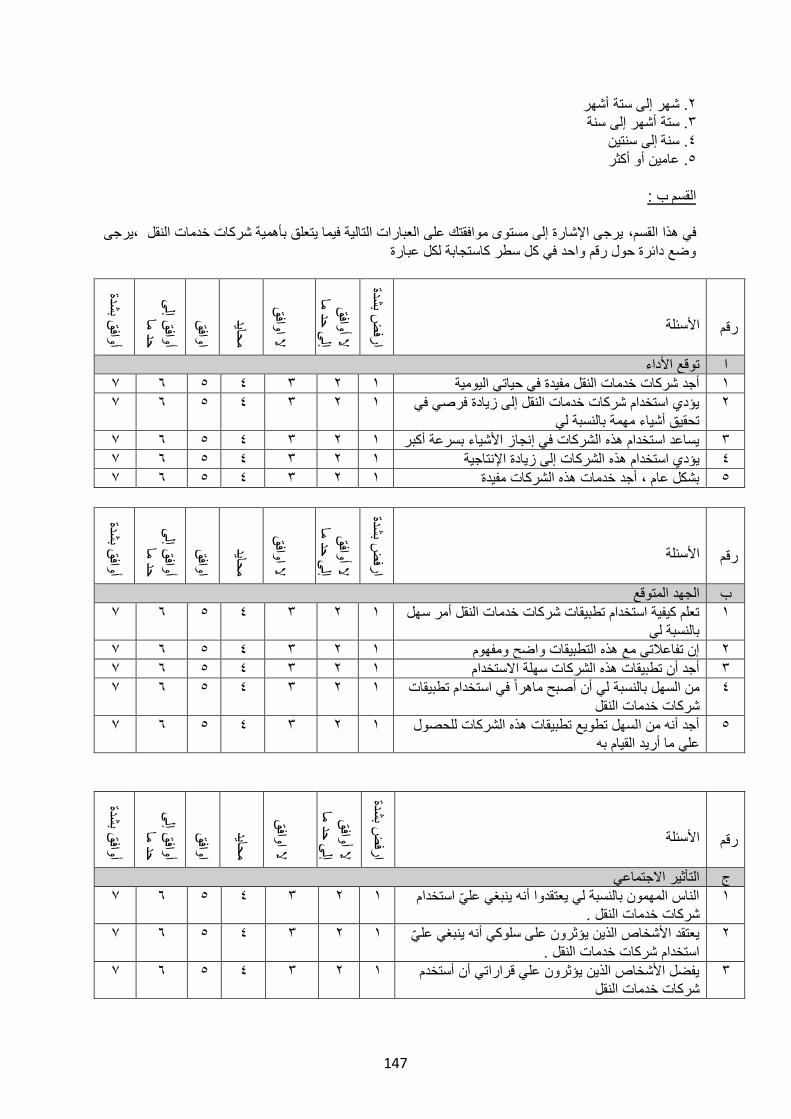
147
أشهر ستةإلى . شهر٢ إلى سنةأشهر . ستة٣ سنتينإلى ةسن. ٤ عامين أو أكثر. ٥
: ب القسم
يرجى الإشارة إلى مستوى موافقتك على العبارات التالية فيما يتعلق بأهمية شركات خدمات النقل ،يرجى القسم،في هذا وضع دائرة حول رقم واحد في كل سطر كاستجابة لكل عبارة
رقم
الأسئلة
شدةض ب
رفا
ق لا أواف
حد ماى
إل
ق
لا اواف
حايدم
قاواف
ى ق إل
أوافحد ما
شدةق ب
أواف
الأداءتوقع ا
٧ ٦ ٥ ٤ ٣ ٢ ١ أجد شركات خدمات النقل مفيدة في حياتي اليومية ١
يؤدي استخدام شركات خدمات النقل إلى زيادة فرصي في ٢ تحقيق أشياء مهمة بالنسبة لي
٧ ٦ ٥ ٤ ٣ ٢ ١
٧ ٦ ٥ ٤ ٣ ٢ ١ يساعد استخدام هذه الشركات في إنجاز الأشياء بسرعة أكبر ٣
٧ ٦ ٥ ٤ ٣ ٢ ١ الشركات إلى زيادة الإنتاجيةيؤدي استخدام هذه ٤
٧ ٦ ٥ ٤ ٣ ٢ ١ بشكل عام ، أجد خدمات هذه الشركات مفيدة ٥
رقم
الأسئلة
شدةض ب
رفا
ق لا أواف
حد ماى
إل
ق
لا اواف
حايدم
قاواف
ى ق إل
أوافحد ما
شدةق ب
أواف
الجهد المتوقع ب
خدمات النقل أمر سهل تعلم كيفية استخدام تطبيقات شركات ١ بالنسبة لي
٧ ٦ ٥ ٤ ٣ ٢ ١
٧ ٦ ٥ ٤ ٣ ٢ ١ إن تفاعلاتي مع هذه التطبيقات واضح ومفهوم ٢
٧ ٦ ٥ ٤ ٣ ٢ ١ أجد أن تطبيقات هذه الشركات سهلة الاستخدام ٣
من السهل بالنسبة لي أن أصبح ماهرا في استخدام تطبيقات ٤ شركات خدمات النقل
٧ ٦ ٥ ٤ ٣ ٢ ١
أجد أنه من السهل تطويع تطبيقات هذه الشركات للحصول ٥ علي ما أريد القيام به
٧ ٦ ٥ ٤ ٣ ٢ ١
رقم
الأسئلة
شدةض ب
رفا
ق لا أواف
حد ماى
إل
ق
لا اواف
حايدم
قاواف
ى ق إل
أوافحد ما
شدةق ب
أواف
التأثير الاجتماعي ج
علي استخدام الناس المهمون بالنسبة لي يعتقدوا أنه ينبغي ١ شركات خدمات النقل .
٧ ٦ ٥ ٤ ٣ ٢ ١
يعتقد الأشخاص الذين يؤثرون على سلوكي أنه ينبغي علي ٢ استخدام شركات خدمات النقل .
٧ ٦ ٥ ٤ ٣ ٢ ١
يفضل الأشخاص الذين يؤثرون علي قراراتي أن أستخدم ٣ شركات خدمات النقل
٧ ٦ ٥ ٤ ٣ ٢ ١
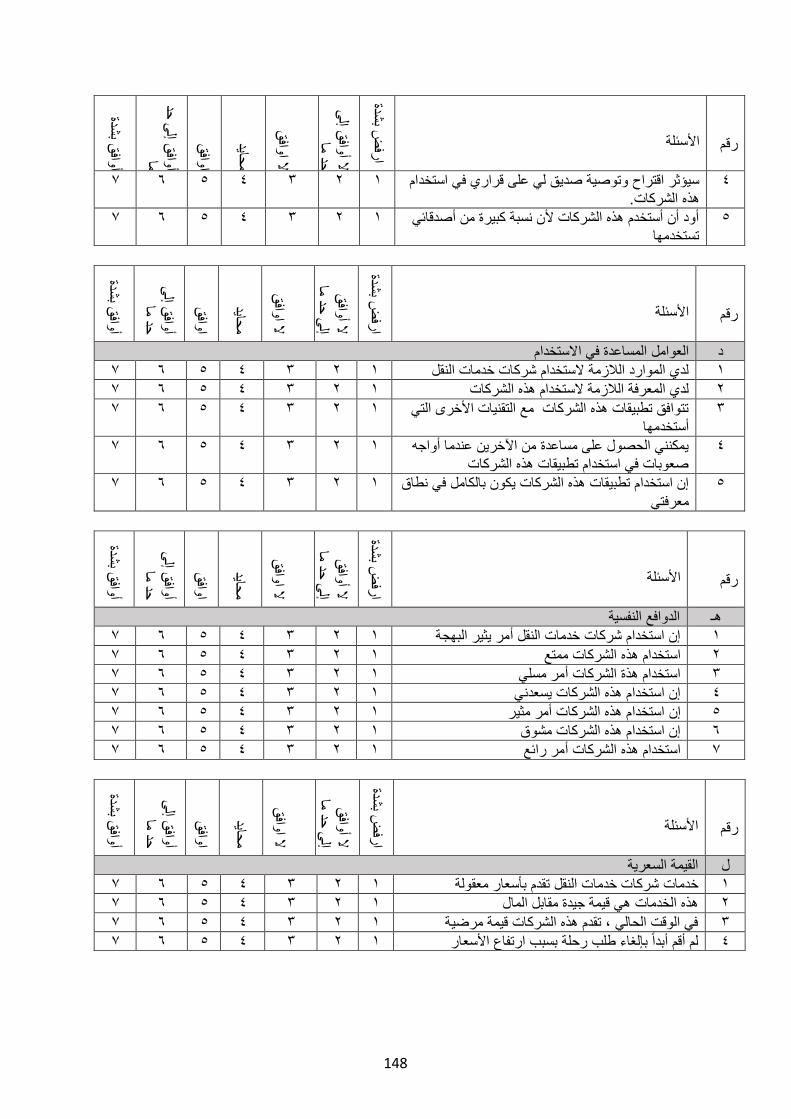
148
رقم
الأسئلة
ض رف
اشدة
ب
ى
ق إللا أوافحد ما
ق
لا اواف
حايدم
قاواف
حد ى
ق إلماأواف
شدةق ب
أواف
سيؤثر اقتراح وتوصية صديق لي على قراري في استخدام ٤ هذه الشركات.
٧ ٦ ٥ ٤ ٣ ٢ ١
أود أن أستخدم هذه الشركات لأن نسبة كبيرة من أصدقائي ٥ تستخدمها
٧ ٦ ٥ ٤ ٣ ٢ ١
رقم
الأسئلة
شدةض ب
رفا
ق لا أواف
حد ماى
إل
ق
لا اواف
حايدم
قاواف
ى ق إل
أوافحد ما
شدةق ب
أواف
المساعدة في الاستخدامالعوامل د
٧ ٦ ٥ ٤ ٣ ٢ ١ لدي الموارد اللازمة لاستخدام شركات خدمات النقل ١
٧ ٦ ٥ ٤ ٣ ٢ ١ لدي المعرفة اللازمة لاستخدام هذه الشركات ٢
تتوافق تطبيقات هذه الشركات مع التقنيات الأخرى التي ٣ أستخدمها
٧ ٦ ٥ ٤ ٣ ٢ ١
يمكنني الحصول على مساعدة من الآخرين عندما أواجه ٤ صعوبات في استخدام تطبيقات هذه الشركات
٧ ٦ ٥ ٤ ٣ ٢ ١
إن استخدام تطبيقات هذه الشركات يكون بالكامل في نطاق ٥ معرفتي
٧ ٦ ٥ ٤ ٣ ٢ ١
رقم
الأسئلة
شدةض ب
رفا
ق لا أواف
حد ماى
إل
ق
لا اواف
حايدم
قاواف
ى ق إل
أوافحد ما
شدةق ب
أواف
النفسيةالدوافع هـ
٧ ٦ ٥ ٤ ٣ ٢ ١ إن استخدام شركات خدمات النقل أمر يثير البهجة ١
٧ ٦ ٥ ٤ ٣ ٢ ١ الشركات ممتع هذهاستخدام ٢
٧ ٦ ٥ ٤ ٣ ٢ ١ استخدام هذة الشركات أمر مسلي ٣
٧ ٦ ٥ ٤ ٣ ٢ ١ إن استخدام هذه الشركات يسعدني ٤
٧ ٦ ٥ ٤ ٣ ٢ ١ استخدام هذه الشركات أمر مثيرإن ٥
٧ ٦ ٥ ٤ ٣ ٢ ١ إن استخدام هذه الشركات مشوق ٦
٧ ٦ ٥ ٤ ٣ ٢ ١ الشركات أمر رائع هذهاستخدام ٧
رقم
الأسئلة
شدةض ب
رفا
ق لا أواف
حد ماى
إل
ق
لا اواف
حايدم
قاواف
ى ق إل
أوافحد ما
شدةق ب
أواف
السعريةالقيمة ل
٧ ٦ ٥ ٤ ٣ ٢ ١ تقدم بأسعار معقولة شركات خدمات النقلخدمات ١
٧ ٦ ٥ ٤ ٣ ٢ ١ هي قيمة جيدة مقابل المال الخدماتهذه ٢
٧ ٦ ٥ ٤ ٣ ٢ ١ في الوقت الحالي ، تقدم هذه الشركات قيمة مرضية ٣
٧ ٦ ٥ ٤ ٣ ٢ ١ لم أقم أبدا بإلغاء طلب رحلة بسبب ارتفاع الأسعار ٤
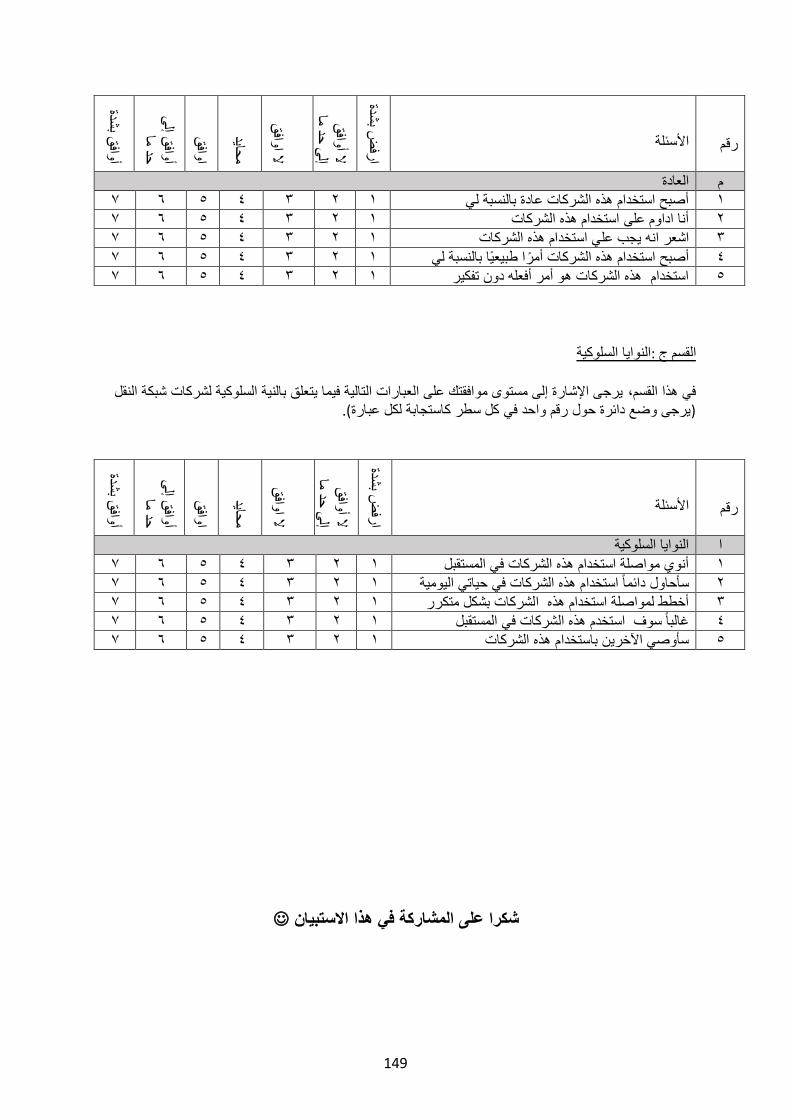
149
رقم
الأسئلة
شدةض ب
رفا
ق لا أواف
حد ماى
إل
ق
لا اواف
حايدم
قاواف
ى ق إل
أوافحد ما
شدةق ب
أواف
العادة م
٧ ٦ ٥ ٤ ٣ ٢ ١ أصبح استخدام هذه الشركات عادة بالنسبة لي ١
٧ ٦ ٥ ٤ ٣ ٢ ١ أنا اداوم على استخدام هذه الشركات ٢
٧ ٦ ٥ ٤ ٣ ٢ ١ انه يجب علي استخدام هذه الشركاتاشعر ٣
٧ ٦ ٥ ٤ ٣ ٢ ١ أصبح استخدام هذه الشركات أمرا طبيعيا بالنسبة لي ٤
٧ ٦ ٥ ٤ ٣ ٢ ١ استخدام هذه الشركات هو أمر أفعله دون تفكير ٥
النوايا السلوكية :ج القسم
يرجى الإشارة إلى مستوى موافقتك على العبارات التالية فيما يتعلق بالنية السلوكية لشركات شبكة النقل القسم،في هذا (يرجى وضع دائرة حول رقم واحد في كل سطر كاستجابة لكل عبارة).
رقم
الأسئلة
شدةض ب
رفا
ق لا أواف
حد ماى
إل
ق
لا اواف
حايدم
قاواف
ى ق إل
أوافحد ما
ق أواف
شدةب
النوايا السلوكية ا
٧ ٦ ٥ ٤ ٣ ٢ ١ أنوي مواصلة استخدام هذه الشركات في المستقبل ١
٧ ٦ ٥ ٤ ٣ ٢ ١ سأحاول دائما استخدام هذه الشركات في حياتي اليومية ٢
٧ ٦ ٥ ٤ ٣ ٢ ١ أخطط لمواصلة استخدام هذه الشركات بشكل متكرر ٣
٧ ٦ ٥ ٤ ٣ ٢ ١ المستقبلغالبا سوف استخدم هذه الشركات في ٤
٧ ٦ ٥ ٤ ٣ ٢ ١ سأوصي الآخرين باستخدام هذه الشركات ٥
☺الاستبيان شكرا على المشاركة في هذا