THE CLIMATE AND WEATHER OF TARANAKI - NIWA Climate WEB.pdf · The climate of Taranaki is determined...
40
THE CLIMATE AND WEATHER OF TARANAKI 2nd edition P.R. Chappell
Transcript of THE CLIMATE AND WEATHER OF TARANAKI - NIWA Climate WEB.pdf · The climate of Taranaki is determined...
THE CLIMATE AND WEATHER OF
TA R A N A K I2nd edition P.R. Chappell

Note to Second EditionThis publication replaces the first edition of the New Zealand Meteorological Service Miscellaneous Publication 115 (9), written in 1981 by C.S. Thompson. It was considered necessary to update the second edition, incorporating more recent data and updated methods of climatological variable calculation.
NIWA SCIENCE AND TECHNOLOGY SERIES NUMBER 64
ISSN 1173-0382
© 2014. All rights reserved. The copyright for this report, and for the data, maps, figures and other information (hereafter collectively referred to as “data”) contained in it, is held by NIWA. This copyright extends to all forms of copying and any storage of material in any kind of information retrieval system.
While NIWA uses all reasonable endeavours to ensure the accuracy of the data, NIWA does not guarantee or make any representation or warranty (express or implied) regarding the accuracy or completeness of the data, the use to which the data may be put or the results to be obtained from the use of the data. Accordingly, NIWA expressly disclaims all legal liability whatsoever arising from, or connected to, the use of, reference to, reliance on or possession of the data or the existence of errors therein. NIWA recommends that users exercise their own skill and care with respect to their use of the data and that they obtain independent professional advice relevant to their particular circumstances.

THE CLIMATE AND WEATHER OF TARANAKI2nd edition P.R. Chappell

4
5
CONTENTSSUMMARY 6INTRODUCTION 7TYPICAL WEATHER SITUATIONS IN TARANAKI 9
Northerly airstreams 9Northeasterly airstreams 10Southeasterly airstreams 11Southwesterly airstreams 11Westerly airstreams 12Sea breeze situations 12Cyclones of tropical origin 13
CLIMATIC ELEMENTS 15Wind 15Rainfall 17
Rainfall distribution 17Rainfall frequency and intensity 20Recent extreme events in Taranaki 21Periods of low rainfall 22
Temperature 23Sea surface temperature 23Air temperature 23Earth Temperatures 26Frosts 27
Sunshine and Solar Radiation 28Sunshine 28Solar radiation 29UV (Ultra-violet radiation) 29Fog 29
Severe convective storms 30Thunderstorms 30Hail 30Tornadoes 30Snow 30
Sea swell and waves 31DERIVED CLIMATOLOGICAL PARAMETERS 33
Vapour pressure and relative humidity 33Evapotranspiration and soil water balance 34
Drought in Taranaki 34Degree-day totals 36
ACKNOWLEDGEMENTS 38REFERENCES 38
Phot
o: ©
myc
hilly
bin.
co.n
z/Ch
ris G
in

6
SUMMARYThe climate of Taranaki is determined largely by its position in relation to the large scale weather patterns affecting New Zealand. Situated on the western side of the North Island, Taranaki is exposed to all weather systems migrating over the Tasman Sea. The predominant westerly airstream makes the Taranaki region one of the windiest in New Zealand. Taranaki is therefore generally a sunny, windy region with a good supply of evenly distributed rainfall and moderate temperatures. Except at higher elevations, snow and hail are rare occurrences, and fogs occur most frequently in areas away from the coast. The climate and soils are well suited for the intensive dairy production of the region, although moisture deficiency during most summer months limits pasture production for a time.

Figure 1. Map of Taranaki region, with locations of places mentioned in the text, tables, and figures.
7
INTRODUCTIONNew Zealand lies in a vast area of ocean within the mid-latitude westerly wind zone. It is a narrow mountainous country with a major range extending from Puysegur Point in the south to East Cape in the north, broken only by Cook Strait which separates the two main islands. The westerly winds are normally moisture-laden and cause high rainfalls and reduced sunshine west of the ranges, and low rainfalls and higher sunshine duration to the east.
Within the mid-latitude westerlies, eastward moving anticyclones and depressions affect the day-to-day weather of New Zealand, and determine the broad climatic features of the country. Occasionally, New Zealand is affected by airmasses which originate in the tropics or the Antarctic region. These airmasses are modified as they move over the oceans, and when they reach New Zealand, they bring periods of intense showery weather associated with cold air, or heavy rainfalls from a warm humid airmass.
In this publication, the Taranaki region is that administered by Taranaki Regional Council (Figure 1). The focal point of the region is the snow-capped dormant volcano, Mt Taranaki, rising 2518 m above mean sea level. The main peak of Mt Taranaki forms the centre of the 33,500 ha Egmont National Park. Part of Whanganui National Park also overlaps into the region. The major urban area in the region is New Plymouth, situated on the coast to the north of Mt Taranaki. The Taranaki region is bordered by the Manawatu-Wanganui region to the east, and there is a small border with the Waikato region to the north. The region is well-suited to intensive dairy production, which for over 100 years has been a major industry. Besides dairying, some beef and sheep farming is carried out but on a much smaller scale. The soils of volcanic origin are highly fertile and free-draining.
All numbers given in the following tables are calculated from the 1981-2010 normal period (a normal is an average or estimated average over a standard 30-year period), unless otherwise stated.
Phot
o: ©
myc
hilly
bin.
co.n
z/Tr
evor
Rea
d
Phot
o: ©
myc
hilly
bin.
co.n
z/Tr
evor
Rea
d

8

9
TYPICAL WEATHER SITUATIONS IN TARANAKINortherly airstreamsA typical northerly airstream occurred on 30 June 1980 (Figure 2). With such an airstream, mild humid air from tropical regions ahead of the cold front can flow over the country, and localised heavy rainfalls are common on Mt Taranaki. In the northerly airflow ahead of a frontal system, high cloud steadily increases with the approach of the front. North Taranaki frequently becomes covered in a sheet of stratocumulus cloud from which scattered showers occur while south Taranaki experiences scattered cloud and mainly dry conditions.
Figure 2. Mean sea level analysis for 0000 NZST 30 June 1980.
Figure 3. Meteorological situations producing heavy rain over Taranaki.
Phot
o: ©
myc
hilly
bin.
co.n
z/Ju
lie F
itz-G
eral
d

10
Northeasterly airstreamsWhen the airflow over New Zealand is mostly northeasterly, rainfall observed in Taranaki tends to be scattered and light until the next frontal zone crosses the region. Taranaki is sheltered in such airflows and surface winds are relatively light. Figure 4 illustrates the situation for 20 July 1980. Although Taranaki skies were covered by middle and high layered cloud, light rain did not break out until late on the following day. Surface winds are generally deflected from the broad-scale northeast flow; therefore southeasterlies prevailed at New Plymouth up to the time when the front passed, and at Stratford and Hawera the winds were from northwest and north, respectively.
On 30 June 1980 rain fell all day in Taranaki and there was a period of heavier rain with the passage of the front about midday. The rainfall for this day was: at Uruti (20 mm), New Plymouth airport (12 mm), Stratford Mountain House (165 mm), Normanby (16 mm), Te Wera Forest (32 mm), and Nukuhau (4 mm). Wind strength varied throughout the day at New Plymouth from 35 to 55 km/hr with gusts to 75 km/hr. The track of the depression centre is important in these situations, as further periods of rain are common if the centre passes to the north. On this occasion the depression moved southeast, and consequently the flow turned westerly and the rain eased to scattered showers.
Many periods of high rainfall occur in Taranaki when a slow moving anticyclone lies to the east of New Zealand, allowing warm moist northerly air from the tropics to flow over the country. Heavy rain for periods of up to three days can occur if these conditions are associated with slow moving fronts lying north-south near Taranaki, or when depressions move across the region. Figure 3 illustrates such meteorological situations in which high rainfalls were recorded in Taranaki.
Figure 4. Mean sea level analysis for 0000 NZST 20 July 1980.
Figure 5. Mean sea level analysis for 0000 NZST 4 March 1980.
Figure 6. Mean sea level analysis for 0000 NZST 6 September 1977.

11
Southeasterly airstreamsWith a depression to the east of the North Island and an anticyclone southeast of New Zealand, southeasterlies cover the North Island (e.g. Figure 5) bringing mostly fine weather to Taranaki. However, if the airflow is more southerly, southern Taranaki generally has cloudy skies with light showers. At midday on 4 March 1980 the Maui A Platform reported winds of 65 km/hr from the east-southeast, Hawera reported east-southeast 10 km/hr, Stratford reported south-southwest 10 km/hr, New Plymouth reported southeast 27 km/hr and the wind over northern Taranaki was light and variable. Mild conditions prevailed, New Plymouth reporting a temperature of 23°C at 2pm. This was mainly due to foehn heating of the airflow as it crossed the North Island.
Another example of a southeasterly airstream over Taranaki is shown in Figure 6 for 6 September 1977. This illustrates a cold south to southeast flow over New Zealand. There were scattered showers in south Taranaki, snow showers on Mt Taranaki, and dry weather elsewhere. Winds at midday on 6 September 1977 were as follows: New Plymouth reported southerly winds at 46 km/hr, Stratford reported southerly at 37 km/hr, Hawera reported southeast at 55 km/hr, and Awakino reported southerly at 37 km/hr.
Southwesterly airstreamsThe distribution of weather over Taranaki is very much dependent on the direction of the isobars in a southwesterly airflow. If the flow of air is more south-southwest, then fine weather will generally be experienced, but if it is west-southwest then scattered showers commonly prevail throughout the region. Small-scale features such as the afternoon development of heat lows over the north of the South Island further affect the weather. These lows, for example, deflect the airflow more westerly over Taranaki;
Figure 7. Mean sea level analysis for 0000 NZST 13 July 1980.
Figure 8. Mean sea level analysis for 0000 NZST 17 September 1980.
Figure 9. Mean sea level analysis for 0000 NZDT 20 February 1980.

12
consequently shower activity may become widespread and especially so if the airstream is unstable.
Figure 7 shows a typical meteorological situation for 13 July 1980 where a cool southwesterly airflow covers New Zealand. Winds over Taranaki on 13 July 1980 were mostly southwest. Cape Egmont measured winds between 45 and 55 km/hr, New Plymouth reported winds of 28 to 37 km/hr, and Egmont East recorded 37 to 45 km/hr with very frequent gusts to 75 km/hr. Offshore at the Maui A Platform, west-southwest winds 55 to 65 km/hr were observed.
Westerly airstreamsIn Taranaki, westerly airstreams are associated with periods of unsettled showery weather. In these situations, a belt of high pressure lies to the north of the country, while to the south migratory depressions move steadily eastwards. The westerly airstream, which can span a large portion of the hemisphere, frequently contains rapidly moving cold fronts, which bring periods of heavier showers to western regions of New Zealand. Figure 8 shows the situation for 17 September 1980. During the day, surface winds were west-southwest 27 to 37 km/hr, and the Maui A Platform reported 65 km/hr at midday. New Plymouth reported gusts to 83 km/hr in squally showers. Rainfall was recorded in most areas of Taranaki, but the amounts were small.
Sea breeze situationsSea breezes in Taranaki are not as common as in east coast regions, because of more prevalent on-shore gradient winds. However, they do occur under clear skies in anticyclonic conditions, and typically have a wind speed of 18 to 28 km/hr. The sea breeze circulation is a shallow system, characterised by a low level onshore wind, with offshore winds at a height between
Figure 10a. Tropical cyclones which made landfall in New Zealand during December, 1970-2010. Source: Southwest Pacific Enhanced Archive of Tropical Cyclones (SPEArTC; Diamond et al., 2012).
Figure 10b. Tropical cyclones which made landfall in New Zealand during January, 1970-2010. Source: SPEArTC (Diamond et al., 2012).
Figure 10c. Tropical cyclones which made landfall in New Zealand during February, 1970-2010. Source: SPEArTC (Diamond et al., 2012).

13
200 and 1000 m. Figure 9 illustrates a day when sea breezes occurred in Taranaki.
Cyclones of tropical originThe tropical cyclone season in the southern hemisphere lasts from November to April. Originating in low latitudes within the cloud masses of the South Pacific Convergence Zone, tropical cyclones reaching northern New Zealand and still retaining true cyclonic characteristics, such as a warm core, are extremely rare. They are nevertheless accompanied by heavy rain and strong winds. Ex-tropical cyclones often approach New Zealand from the northwest, and sometimes affect the Taranaki region. Tracks of tropical cyclones which have made landfall in New Zealand between 1970 and 2010 are shown in Figure 10a-e.
Figure 11 shows the meteorological situation for 8 March 1988 as ex-tropical cyclone Bola was positioned east of Cape Reinga. Bola caused gale force winds in the Taranaki region, which damaged 500 houses in the New Plymouth District, felled power lines, and caused extensive property damage. These winds also caused widespread damage to forestry throughout the central North Island. Average wind speeds at the Maui A Platform were 110-130 km/hr for 36 hours from 12pm on 7 March to 12am on 9 March, with a peak gust of 152 km/hr (Burgess et al., 2006). A Civil Defence Emergency was declared in Taranaki due to the damaging winds. Insurance losses due to wind damage alone amounted to $19 million in the Taranaki region alone.
Figure 10d. Tropical cyclones which made landfall in New Zealand during March, 1970-2010. Source: SPEArTC (Diamond et al., 2012).
Figure 10e. Tropical cyclones which made landfall in New Zealand during April, 1970-2010. Source: SPEArTC (Diamond et al., 2012).
Figure 11. Synoptic map showing ex-tropical cyclone Bola at 0000 NZST 8 March 1988 (near the time of most intense wind). Source: Burgess et al. (2006)

14

15
CLIMATIC ELEMENTSWindThe prevailing winds over New Zealand in the zone directly above the earth’s surface are westerly, and they influence the general precipitation and temperature regimes of Taranaki. At the surface, winds are markedly influenced by local terrain effects, notably the location relative to Mt Taranaki and the central high country and the orientation of the coast. At Maui A Platform, the predominant wind direction is from the west. At New Plymouth airport, southeasterlies predominate. These winds are due to:
a. The deflection by Mt Taranaki of winds from a southerly quarter to a southeasterly direction;
b. A southeasterly drainage of cold air (katabatic wind) from the slopes of Mt Taranaki, and
c. Night-time land breezes.
Northerly flows are dominant at Stratford and Hawera. Figure 12 shows mean annual frequencies of surface wind based on hourly observations from selected stations. Exposed sites such as Maui A Platform have a higher percentage of strong winds than more sheltered sites, such as Stratford.
Table 1. Mean monthly/annual wind speeds (km/hr) for Taranaki sites, from all available data.
Location Jan Feb Mar Apr May Jun Jul Aug Sep Oct Nov Dec AnnCape Egmont 20.9 20.6 21.2 23.6 24.6 23.4 23.5 23.8 25.8 24.7 23.6 23.3 23.3Maui A Platform 33.3 34.5 37.4 39.4 39.6 39.5 37.8 37.3 43.3 38.8 35.8 34.1 37.6New Plymouth Aero 18.0 16.8 17.2 18.4 18.8 18.9 19.3 19.3 20.7 20.8 19.9 18.8 18.9Normanby EDR 15.3 13.9 14.1 13.0 14.6 15.4 14.4 15.7 16.5 18.1 17.3 15.8 15.3
Figure 12. Mean annual wind frequencies (%) of surface wind directions from hourly observations at selected Taranaki stations. The plots show the directions from which the wind blows, e.g. the dominant wind direction at Stratford is from the north.
New Plymouth AWS Stratford EWS
Maui A Platform HaweraAWS
Table 2. Seasonal percentages of strong and light winds (%) for Taranaki sites, from all available data.
Location Summer Autumn Winter Spring
Cape EgmontStrong 20 24 28 28Light 27 24 25 24
New Plymouth AeroStrong 21 23 24 31Light 26 26 24 23
Normanby EDRStrong 19 20 24 36Light 24 26 26 24
Phot
o: ©
myc
hilly
bin.
co.n
z/Th
omas
Neu
baue
r

16
Mean wind speed data (average wind speeds are taken over the 10 minute period preceding each hour) are available for several sites in Taranaki, and these illustrate the different wind regimes of the region (Table 1). Maui A Platform, which is located 33 km offshore, is much windier throughout the year compared with the other onshore sites. Normanby, which is located inland from Hawera, experiences the lightest winds of the sites considered.
Spring is generally the windiest season throughout the region, whereas the least strong winds are observed in summer. Table 2 gives the seasonal proportion of strong and light winds as a percentage of the annual total. For example, of all strong winds recorded at New Plymouth, 21% occurred in summer, 23% in autumn, 24% in winter and 31% in spring. In compiling this table a strong wind was defined as having a mean wind speed of at least 31 km/hr.
Diurnal variation in wind speed is well-marked, with greatest wind speeds occurring in the middle of the afternoon. This is because at that time of day heating of the land surface is most intense and stronger winds aloft are brought down to ground level by turbulent mixing. Cooling at night generally detaches the upper flow and restores a lighter wind regime. Table 3 gives average wind speeds at three-hourly intervals for selected stations.
Gusts of at least 63 km/hr are recorded at the exposed site at Cape Egmont on an average of 126 days each year, and gusts over 96 km/hr occur on average 12 days each year (Table 4). In comparison, the more sheltered site further inland at Normanby records 46 days per year with gusts over 63 km/hr, and only one day each year with gusts over 96 km/hr.
Table 3. Average wind speed (km/hr) for selected hours, from all available data.
Table 4. Average number of days per year with gusts exceeding 63 km/hr and 96 km/hr for selected stations, from all available data.
Table 5. Highest recorded gusts at selected Taranaki stations, from all available data.
Location 00 03 06 09 12 15 18 21Cape Egmont 22 22 22 23 26 26 23 22New Plymouth Aero 18 18 18 19 22 23 20 18
Normanby EDR 13 13 13 16 20 21 16 12
LocationGusts
>63 km/hrGusts
>96 km/hrCape Egmont 126 12New Plymouth Aero 83 6Normanby EDR 46 1Omata 60 3
Location Gust (km/hr) Direction (°) DateCape Egmont 139 SSE 14/03/1985Egmont East 172 NNW 10/09/1980Hawera AWS 104 NNE 12/06/2006Maui A Platform 174 SE 21/05/1981New Plymouth Aero 158 SE 9/04/1982New Plymouth AWS 118 S 24/01/2011Normanby EDR 109 - 9/07/1998Omata 113 SE 27/05/1986Paritutu 134 - 26/11/1971
Although gale force winds can occur in any month, they are most frequent in winter. The highest gust recorded on land in the region was 172 km/hr at Egmont East on 10 September 1980 (this excludes the maximum gust from the offshore Maui A Platform of 174 km/hr). Maximum gusts recorded at different stations in the region are listed in Table 5.
17
Rainfall
Rainfall distribution
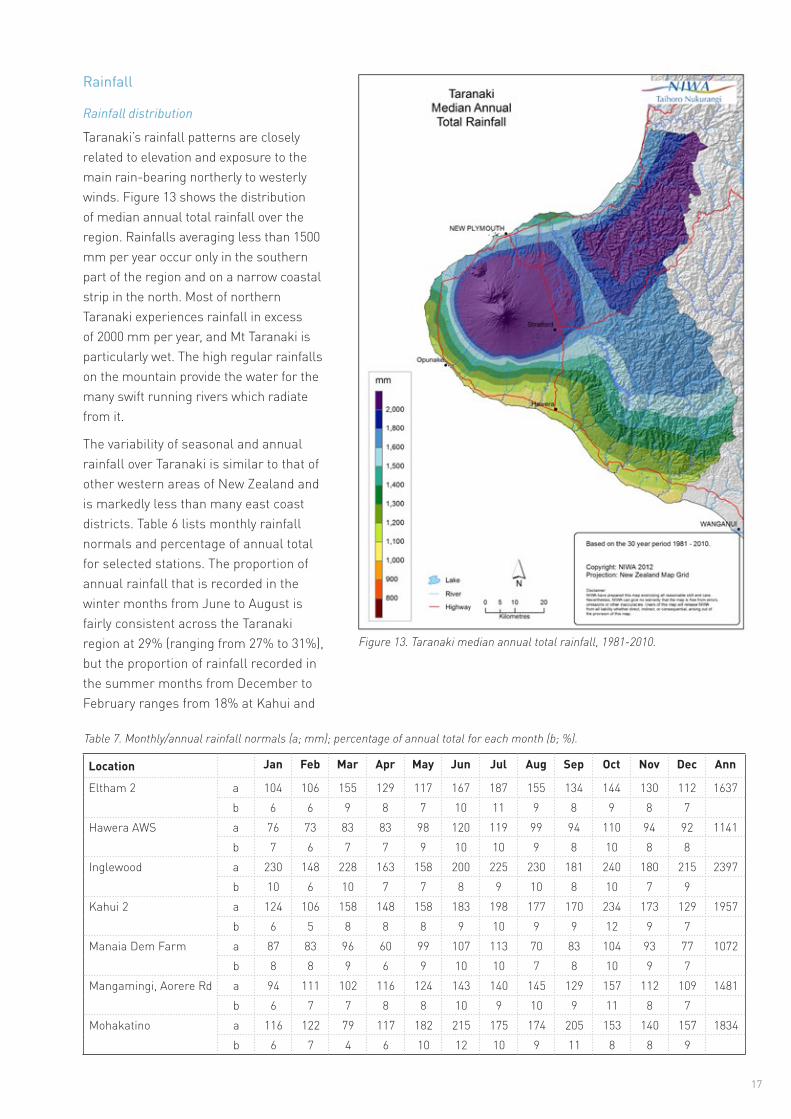
Taranaki’s rainfall patterns are closely related to elevation and exposure to the main rain-bearing northerly to westerly winds. Figure 13 shows the distribution of median annual total rainfall over the region. Rainfalls averaging less than 1500 mm per year occur only in the southern part of the region and on a narrow coastal strip in the north. Most of northern Taranaki experiences rainfall in excess of 2000 mm per year, and Mt Taranaki is particularly wet. The high regular rainfalls on the mountain provide the water for the many swift running rivers which radiate from it.
The variability of seasonal and annual rainfall over Taranaki is similar to that of other western areas of New Zealand and is markedly less than many east coast districts. Table 6 lists monthly rainfall normals and percentage of annual total for selected stations. The proportion of annual rainfall that is recorded in the winter months from June to August is fairly consistent across the Taranaki region at 29% (ranging from 27% to 31%), but the proportion of rainfall recorded in the summer months from December to February ranges from 18% at Kahui and
Table 7. Monthly/annual rainfall normals (a; mm); percentage of annual total for each month (b; %).
Location Jan Feb Mar Apr May Jun Jul Aug Sep Oct Nov Dec Ann
Eltham 2 a 104 106 155 129 117 167 187 155 134 144 130 112 1637b 6 6 9 8 7 10 11 9 8 9 8 7
Hawera AWS a 76 73 83 83 98 120 119 99 94 110 94 92 1141b 7 6 7 7 9 10 10 9 8 10 8 8
Inglewood a 230 148 228 163 158 200 225 230 181 240 180 215 2397b 10 6 10 7 7 8 9 10 8 10 7 9
Kahui 2 a 124 106 158 148 158 183 198 177 170 234 173 129 1957b 6 5 8 8 8 9 10 9 9 12 9 7
Manaia Dem Farm a 87 83 96 60 99 107 113 70 83 104 93 77 1072b 8 8 9 6 9 10 10 7 8 10 9 7
Mangamingi, Aorere Rd a 94 111 102 116 124 143 140 145 129 157 112 109 1481b 6 7 7 8 8 10 9 10 9 11 8 7
Mohakatino a 116 122 79 117 182 215 175 174 205 153 140 157 1834b 6 7 4 6 10 12 10 9 11 8 8 9
Figure 13. Taranaki median annual total rainfall, 1981-2010.

18
Figure 14. Monthly variation in rainfall for selected Taranaki stations. Note that North Egmont has a different vertical scale.
Table 7 continued.
Mean
Lowest Monthly Total
90 Percentile Value
10 Percentile Value
Highest Monthly Total
Normanby to 25% at Inglewood. Throughout Taranaki there is a seasonal variation with a winter maximum and a summer or early autumn minimum.
The distribution of monthly rainfall is shown in Figure 14. The 10th percentile, 90th percentile, and mean rainfall values for each month are shown along with maximum and minimum recorded values for several stations.
Rainfall variability over longer periods is indicated by rainfall deciles, as given in Table 7. The 10th percentile values show the accumulated rainfalls that will normally be exceeded in nine out of ten years, while the 90th percentile values indicate the accumulated falls that will normally be exceeded in only one year in ten. The table includes periods from one month to twelve months; each period over one month begins
Location Jan Feb Mar Apr May Jun Jul Aug Sep Oct Nov Dec AnnNew Plymouth AWS a 93 96 98 116 126 148 136 127 120 125 104 121 1409
b 7 7 7 8 9 11 10 9 9 9 7 9Normanby EDR a 63 77 82 102 93 116 128 108 104 128 120 74 1195
b 5 6 7 9 8 10 11 9 9 11 10 6North Egmont a 457 381 432 480 603 654 698 695 676 809 555 589 7029
b 6 5 6 7 9 9 10 10 10 12 8 8Patea Hydro a 121 91 114 132 148 158 173 149 138 154 163 119 1659
b 7 6 7 8 9 10 10 9 8 9 10 7Patiki a 89 87 93 101 113 143 139 113 114 132 112 107 1343
b 7 6 7 8 8 11 10 8 9 10 8 8Pukeiti a 228 213 243 235 297 316 306 295 312 363 264 304 3376
b 7 6 7 7 9 9 9 9 9 11 8 9Purangi a 145 146 143 160 178 193 205 185 202 230 178 206 2171
b 7 7 7 7 8 9 9 9 9 11 8 9Stratford EWS a 122 132 140 146 172 196 208 190 181 218 152 165 2022
b 6 7 7 7 9 10 10 9 9 11 8 8Tarata a 118 116 122 138 155 173 166 155 161 172 137 153 1766
b 7 7 7 8 9 10 9 9 9 10 8 9Warea, Lower Bayly Road
a 82 76 69 95 137 142 132 124 94 120 102 118 1290b 6 6 5 7 11 11 10 10 7 9 8 9

19
Table 7. Rainfall deciles for consecutive months for selected Taranaki stations.
with the month stated. For example, using the table for New Plymouth, it can be seen that in the three month period beginning in April, 286 mm or more of rainfall can be expected in nine years in ten, while a total of 541 mm or more is expected in only one year in ten.
Jan Feb Mar Apr May Jun Jul Aug Sep Oct Nov DecHawera, Green Lane1 month10th 33 25 36 35 54 71 40 59 56 55 61 3390th 166 152 159 164 148 184 183 150 132 202 152 1533 months10th 152 171 177 202 209 207 209 216 237 186 148 17590th 367 358 373 418 464 434 399 381 395 431 382 3796 months10th 416 445 483 482 457 459 460 455 432 415 410 40690th 682 719 766 762 844 830 767 688 747 746 659 64912 months10th 942 981 1010 1001 926 893 892 983 947 934 935 95790th 1327 1364 1320 1366 1410 1373 1351 1339 1359 1408 1374 1390New Plymouth AWS1 month10th 29 15 43 54 72 77 59 64 36 67 35 6290th 139 235 151 225 198 217 231 236 236 226 197 1793 months10th 152 191 230 286 305 268 219 266 240 242 195 17890th 437 529 451 541 540 583 610 493 489 627 434 6526 months10th 478 525 557 620 633 578 554 481 466 391 404 46790th 867 851 982 1046 1022 995 1036 967 1149 988 900 88212 months10th 1135 1116 1076 1086 1150 1097 1138 1168 1126 1099 1116 109390th 1669 1755 1844 1830 1841 1781 1726 1730 1724 1742 1734 1736Stratford Dem Farm1 month10th 42 23 40 67 85 105 93 89 83 113 89 6090th 252 213 335 306 299 315 344 293 259 337 312 2683 months10th 193 243 329 317 388 365 373 423 374 360 290 31490th 609 634 603 651 730 762 739 698 716 795 703 5586 months10th 678 711 863 835 910 859 940 870 777 744 674 78690th 1146 1180 1246 1277 1394 1461 1402 1272 1292 1291 1260 113312 months10th 1670 1678 1733 1684 1698 1607 1642 1745 1697 1631 1646 171890th 2468 2489 2414 2410 2618 2479 2392 2328 2389 2449 2443 2397

Heavy rainfalls can occur in Taranaki with northerly and westerly flows, when ex-tropical depressions pass near the region, and also with thunderstorms. In Table 9, maximum short period rainfalls for periods of 10 minutes to 72 hours with calculated return periods are given for several stations. Also listed in this table are the maximum rainfalls expected in 2, 5, 10, 20, and 50
years. Depth-duration frequency tables for Taranaki locations are available from NIWA’s High Intensity Rainfall Design System (HIRDS). HIRDS uses the index-frequency method to calculate rainfall return periods. For more information on methods and to use the tool, see hirds.niwa.co.nz.
20
Table 8. Average monthly rain days and wet days for Taranaki stations; a: 0.1 mm rain day, b: 1 mm wet day.
Rainfall frequency and intensity
Rain day frequency increases towards Mt Taranaki. The frequency of rain days is greatest during winter months (around 30% of the annual total) and least in summer (around 20% of the annual total). Rain is frequently heavier and more intense in the high country than elsewhere. The annual number of rain days (where at least 0.1mm falls) over the Taranaki
region as a whole is about 180, but varies from 123 days at Tarata to 224 at Pukeiti. The annual number of wet days (where at least 1 mm of rain falls) exhibits the same geographic variability, with an average of 155 days across the region, but a minimum of 118 days at Tarata to a maximum of 193 days at Pukeiti. Table 8 lists the average number of days per month with 0.1 mm and 1 mm of rain for selected stations.
Location Jan Feb Mar Apr May Jun Jul Aug Sep Oct Nov Dec AnnEltham 2 a 11 9 13 15 19 20 20 18 18 18 14 12 188
b 10 8 11 13 17 17 18 16 15 16 12 11 164Hawera,Green Lane a 13 11 13 15 18 20 19 19 19 17 16 15 195
b 9 8 9 11 13 15 15 14 13 13 11 11 142Inglewood a 14 11 14 13 17 18 18 18 17 19 15 15 188
b 12 9 11 11 13 15 15 15 15 16 12 13 155Kahui 2 a 14 12 14 16 19 22 20 21 20 20 16 16 209
b 10 9 11 12 16 19 17 15 15 16 12 12 164Mangamingi, Aorere Rd a 10 9 10 11 13 15 14 15 14 14 11 11 147
b 10 9 9 11 12 14 14 14 13 14 11 11 142New Plymouth AWS a 11 11 12 13 17 19 18 20 18 17 14 16 186
b 9 8 9 10 13 15 14 15 14 13 11 12 142Normanby EDR a 12 11 12 15 18 20 20 20 19 17 15 13 191
b 8 7 9 11 11 14 15 15 14 13 12 10 139North Egmont a 15 12 15 16 18 20 20 21 20 21 18 17 212
b 13 11 12 14 17 18 19 19 18 19 16 15 192Patea Hydro a 14 12 14 15 20 22 21 21 19 19 17 15 209
b 11 10 11 12 15 18 18 17 15 15 15 13 169Patiki a 9 8 9 11 14 16 16 14 13 13 11 12 147
b 9 8 9 11 13 15 15 14 13 13 11 11 141Pukeiti a 15 13 15 17 20 22 21 22 21 22 18 19 224
b 12 11 12 15 18 20 18 19 18 18 15 16 193Purangi a 12 10 12 12 16 16 16 17 16 18 13 15 174
b 10 9 10 10 12 13 14 15 14 16 11 13 146Stratford Dem Farm a 12 10 12 13 15 18 18 18 16 17 14 14 177
b 10 8 10 11 13 14 15 15 14 15 12 12 147Tarata a 8 8 8 8 10 13 10 14 11 12 10 11 123
b 8 7 8 8 9 12 10 13 10 12 9 11 118

21
Table 9. Maximum recorded short period rainfalls and calculated return periods (or average recurrence intervals, ARI) from HIRDS.
a: highest fall recorded (mm)b: calculated return period of a (years)c: max fall calculated with ARI 2 years (mm)d: max fall calculated with ARI 5 years (mm)e: max fall calculated with ARI 10 years (mm)f: max fall calculated with ARI 20 years (mm)g: max fall calculated with ARI 50 years (mm)
Recent extreme events in Taranaki
Taranaki region has experienced a number of extreme weather events, with significant damage and disruption caused by flooding and high winds. The events listed below are some of the most severe events to have affected the Taranaki region between 1980 and 2013.
7-8 March 1988: Ex-tropical cyclone Bola caused significant damage in the Taranaki region. Almost 500 houses in the New Plymouth District were severely damaged by high winds. More than 50 houses lost their roofs, and a number were uninhabitable. An estimated 10,000 trees were downed, 54 km of fencing was destroyed, and 90 hay barns and 30 dairy sheds were severely damaged or destroyed. All schools in north Taranaki and most shops were closed during the storm, and a number of roads were also closed. Power
Location 10min 20min 30min 1hr 2hrs 6hrs 12hrs 24hrs 48hrs 72hrsNew Plymouth Aero
a 22 34 37 48 69 125 226 361 393 396b 50 55 30 16 28 70 100+ 100+ 100+ 100+c 10 15 19 28 36 52 66 84 102 114d 13 19 24 37 46 67 85 108 131 147e 15 23 29 43 55 79 101 127 155 174f 18 27 34 51 65 93 118 149 182 204g 22 33 42 63 80 115 145 183 223 250
North Egmont
a 17 24 27 48 90 173 286 378 501 612b 10 7 4 5 11 8 10 4 5 7c 12 19 24 38 61 127 203 322 410 472d 15 23 30 48 75 156 248 393 499 574e 17 27 35 55 87 179 283 447 568 654f 19 31 40 63 99 204 321 507 644 741g 23 36 48 75 118 241 379 596 757 871
Stratford NZED
a 31 46 52 77 83 105 163 258 301 308b 90 100+ 87 100+ 50 20 39 94 68 40c 11 15 18 25 35 58 81 112 140 159d 14 20 24 33 46 75 103 141 175 200e 17 24 29 41 55 89 121 163 204 232f 21 29 35 49 66 105 141 189 235 268g 26 37 45 63 83 130 172 227 283 323

22
was cut to isolated areas, and millions of dollars in cash crops were destroyed. A Civil Defence Emergency (CDE) was in effect for some parts of the region during and following the storm.
20-23 April 1995: Very heavy rain associated with a depression caused widespread flooding in and around New Plymouth. The city was cut off from the north and east by flooding, and a number of people were evacuated from their homes. The 21st was one of the wettest days in New Plymouth’s history, with a nine-hour period of high intensity rainfall. Insurance payout for the floods was approximately $5 million 2010 dollars.
14-19 February 2004: A deep low moved slowly eastwards over the North Island, causing intense rainfall and strong winds. Parts of the Taranaki region were without power for several days, which closed schools and meant that farmers could not milk their cows. Extensive flooding and landsliding occurred in the region. Slipping blocked access to farms, destroyed fences, and damaged water supply systems. The township of Waitotara was evacuated due to flooding. High winds caused significant damage to buildings, especially hay barns. A CDE was declared in south Taranaki on the 15th, which lasted for 10 days.
29 April – 1 May 2008: A combination of fronts caused heavy rain and flooding in the Taranaki region. Water supplies and kilometres of fencing were destroyed in coastal Taranaki. The storm caused record-high river levels between Opunake and Oakura, and numerous small road bridges were washed away. Bridges and tracks in Egmont National Park were destroyed by flooded streams and slips.
Numerous tornados have also caused damage in the Taranaki region. Information on tornadoes in the region is detailed in the ‘Severe convective storms’ section.
Periods of low rainfall
Periods of fifteen days or longer with less than 1 mm of rain on any day are referred to as ‘dry spells’. There is an average of 1.4 such periods each year in the Taranaki region. The average duration of a dry spell is about 19 days. The longest recent dry spell between three key sites in Taranaki (New Plymouth AWS, Stratford Dem Farm/Stratford EWS, and Hawera Green Lane/ Hawera AWS) was 40 days recorded in Stratford, from 6 February to 17 March 2013. During this dry spell, 38 consecutive days were without any rain. The longest recent dry spell in Hawera was 38 days, from 7 February to 16 March 2013 (all days without any rain). In New Plymouth, the longest recent dry spell was 27 days from 4 to 30 March 2008, of which 14 consecutive days were without any rain.

23
Figure 15. Mean monthly land (New Plymouth AWS) and sea surface temperatures (off the coast of New Plymouth)
Figure 16. Monthly mean sea surface temperatures (°C) for: a) February; b) August. Source: NIWA SST Archive, Uddstrom and Oien (1999).
Temperature
Sea surface temperature
Monthly mean sea surface temperatures (SST) off the coast of Taranaki are compared with mean air temperature for New Plymouth in Figure 15. The minima of land and sea temperatures occurs at about the same time of year (July). Throughout the year, mean air temperatures are cooler than mean sea surface temperatures. Figure 16 shows the mean sea surface temperatures for the New Zealand region for February and August, which are the warmest and coolest months with respect to sea surface temperatures.
MEAN FEBRUARY SST (°C) MEAN AUGUST SST (°C)
Air temperature
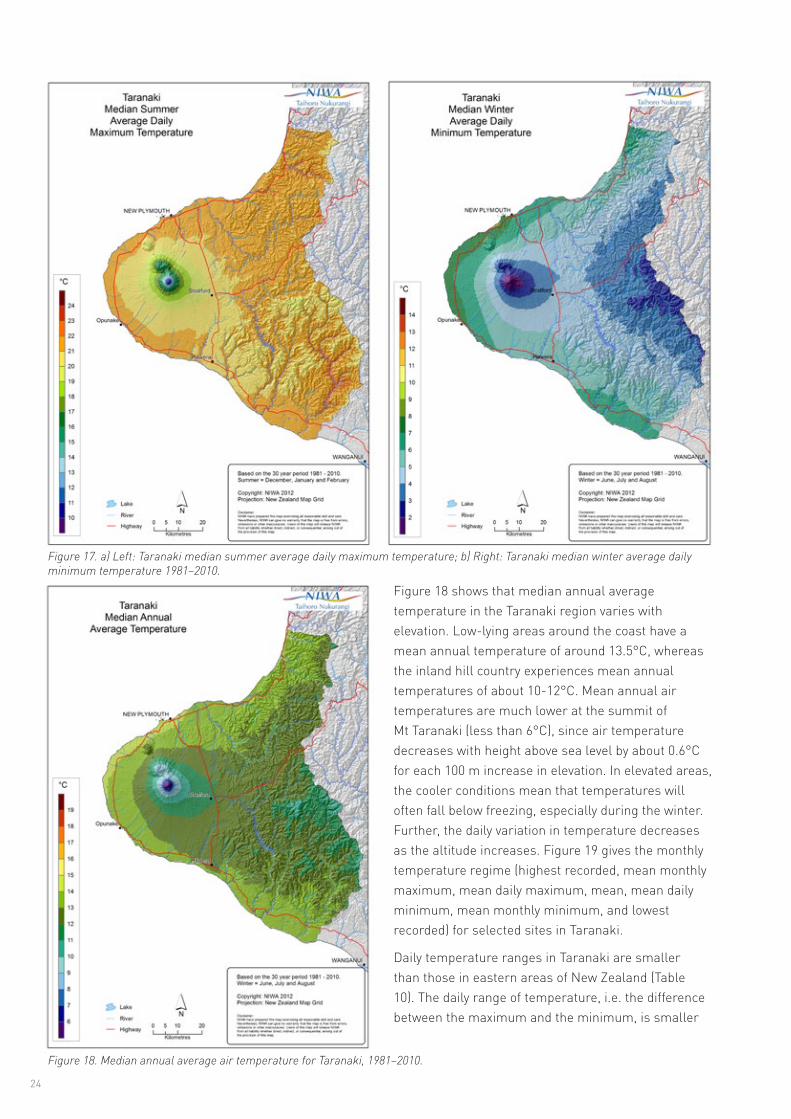
In general, most of the Taranaki region experiences warm summer afternoon temperatures of 20-22°C, with temperatures appreciably cooler towards the summit of Mt Taranaki (Figure 17a). During winter nights, temperatures on the coastal strip are milder than further inland and at higher elevations, due to the modifying effect of the sea on air temperature (6-8°C at the coast, 2-3°C further inland, and less than 2°C near the summit of Mt Taranaki, Figure 17b).
a b
0
5
10
15
20
25
Jan Feb Mar Apr May Jun Jul Aug Sep Oct Nov Dec
Tem
pera
ture
(°C)
Month
Air temperature New Plymouth AWS (°C) SST Taranaki (°C)
24
Figure 18 shows that median annual average temperature in the Taranaki region varies with elevation. Low-lying areas around the coast have a mean annual temperature of around 13.5°C, whereas the inland hill country experiences mean annual temperatures of about 10-12°C. Mean annual air temperatures are much lower at the summit of Mt Taranaki (less than 6°C), since air temperature decreases with height above sea level by about 0.6°C for each 100 m increase in elevation. In elevated areas, the cooler conditions mean that temperatures will often fall below freezing, especially during the winter. Further, the daily variation in temperature decreases as the altitude increases. Figure 19 gives the monthly temperature regime (highest recorded, mean monthly maximum, mean daily maximum, mean, mean daily minimum, mean monthly minimum, and lowest recorded) for selected sites in Taranaki.
Daily temperature ranges in Taranaki are smaller than those in eastern areas of New Zealand (Table 10). The daily range of temperature, i.e. the difference between the maximum and the minimum, is smaller
Figure 17. a) Left: Taranaki median summer average daily maximum temperature; b) Right: Taranaki median winter average daily minimum temperature 1981–2010.
Figure 18. Median annual average air temperature for Taranaki, 1981–2010.

25
Table 10. Average daily temperature range (Tmax – Tmin, °C) for Taranaki sites (* Stratford data from 1971-2000).
Table 11. Mean hourly temperature at New Plymouth Aero in January and July (°C).
Figure 20. Mean hourly temperatures at New Plymouth Aero for January and July.
Location Jan Feb Mar Apr May Jun Jul Aug Sep Oct Nov Dec AnnNew Plymouth AWS 7.8 8.2 8.2 7.9 7.2 7.0 7.2 7.2 6.8 6.6 7.1 7.0 7.4Patea AWS 7.4 7.3 8.0 7.3 6.7 6.6 7.0 6.9 6.8 6.7 7.5 7.3 7.1Stratford Dem Farm* 9.9 9.8 9.3 8.7 7.8 7.5 7.7 7.9 8.2 8.5 9.0 9.4 8.6North Egmont 8.1 7.9 7.5 7.1 6.3 5.6 5.7 6.0 6.4 7.1 7.4 7.5 6.9
hrs 00 01 02 03 04 05 06 07 08 09 10 11January 15.9 15.6 15.3 15.1 14.9 14.7 15.0 16.3 17.7 18.7 19.3 19.8July 8.3 8.1 8.0 8.0 7.8 8.1 8.0 7.9 8.0 8.8 10.4 11.4
hrs 12 13 14 15 16 17 18 19 20 21 22 23January 20.2 20.4 20.4 20.5 20.3 20.0 19.5 18.7 17.8 17.1 16.6 16.3July 12.1 12.4 12.5 12.5 12.1 11.3 10.4 9.8 9.5 9.1 8.7 8.5
at the coast (e.g. New Plymouth and Patea) than inland areas (e.g. Stratford). However, in the ranges the daily variation is also influenced by cloudiness and elevation; the higher the elevation and cloudier the conditions, the smaller the temperature range (e.g. North Egmont).
The diurnal temperature range for New Plymouth is moderate, and less than that of locations further inland due to the modifying effect of the sea. Table 11 and Figure 20 show mean hourly temperatures for New Plymouth for January and July.
Figure 19. Monthly variation in air temperatures for selected Taranaki stations.
Highest Recorded
Mean
Mean Daily Maximum
Mean Daily Minimum
Mean Monthly Minimum
Mean Monthly Maximum
Lowest Recorded
0.0
5.0
10.0
15.0
20.0
25.0
0:00
1:00
2:00
3:00
4:00
5:00
6:00
7:00
8:00
9:00
10:0
011
:00
12:0
013
:00
14:0
015
:00
16:0
017
:00
18:0
019
:00
20:0
021
:00
22:0
023
:00
Tem
pera
ture
(°C)
Time (hours)
January July New Plymouth has an average of 5 days per year when the maximum temperature exceeds 25°C and has about 1.5 days per year when the temperature falls below 0°C. Manaia also records about 5 days per year when the maximum temperature exceeds 25°C, but has about 8 days per year when temperatures below 0°C are recorded. In contrast, Stratford only records 3 days per year with temperatures above 25°C, and 11 days with temperatures below 0°C.

26
Earth Temperatures
Earth (soil) temperatures are measured once daily at 9 am at several Taranaki locations. Earth temperatures are measured at varying depths and are important, amongst other things, for determining the growth and development of plants. Different plants have different rooting depths and as such, earth temperatures are routinely monitored at 10, 20, 30, and 100 cm depths. Table 12 lists mean monthly earth temperatures for a number of standard depths.
In the Taranaki region, earth temperatures, like air temperatures, vary spatially. The sites at higher elevations, such as Stratford DEM Farm, exhibit cooler 9 am earth temperatures than sites at lower elevations, such as New Plymouth. Figure 21 shows how earth temperatures change throughout the year at New Plymouth, compared with air temperature. The temperature cycle for 100 cm depth is more damped and lagged than at shallower depths.
Table 12. Mean 9 am earth temperatures at different Taranaki locations, with station elevations, from all available data.Location Jan Feb Mar Apr May Jun Jul Aug Sep Oct Nov Dec Ann
Manaia Dem Farm (98 m)
10 cm 18.1 17.6 15.8 12.7 10.0 8.1 7.0 7.7 9.7 12.1 14.3 16.6 12.520 cm 19.1 18.9 17.1 14.2 11.4 9.3 8.2 8.8 10.6 12.8 15.1 17.4 13.630 cm 18.9 18.9 17.4 14.8 12.2 10.1 8.9 9.5 11.1 13.2 15.3 17.4 14.0
100 cm 16.2 16.9 16.7 15.8 14.4 12.8 11.5 11.1 11.4 12.4 13.6 14.9 14.0
New Plymouth Aero (27 m)
10 cm 18.4 18.6 16.9 13.8 11.0 8.8 7.8 8.6 10.4 12.6 14.9 17.0 13.220 cm 19.8 20.2 18.5 15.6 12.6 10.4 9.2 9.9 11.5 13.7 16.0 18.2 14.630 cm 19.7 20.1 18.7 16.0 13.1 10.8 9.6 10.2 11.7 13.8 16.1 18.1 14.8
100 cm 18.4 19.2 19.0 17.5 15.4 13.3 11.9 11.6 12.2 13.5 15.1 16.8 15.3
Stratford Dem Farm (311 m)
10 cm 16.9 16.8 15.0 12.1 9.5 7.3 6.2 6.9 8.8 11.1 13.4 15.7 11.620 cm 18.2 18.3 16.6 13.8 11.0 8.8 7.5 8.2 9.8 12.1 14.4 16.6 12.930 cm 18.0 18.2 16.7 14.1 11.4 9.3 8.0 8.5 10.0 12.1 14.4 16.5 13.1
100 cm 15.7 16.4 16.4 15.4 13.8 12.1 10.5 9.9 10.3 11.3 12.8 14.2 13.2
0.0
5.0
10.0
15.0
20.0
25.0
Jan Feb Mar Apr May Jun Jul Aug Sep Oct Nov Dec
Tem
pera
ture
(°C)
Month
10 cm 20 cm 30 cm 100 cm Air temp
Extreme maximum temperatures in Taranaki are not as high as have been recorded under foehn conditions in east coast regions of New Zealand. The highest maximum temperature measured in the region to date is 31.3°C, recorded at Te Wera Forest on 5 January 1975. The extreme minimum temperature of -7.5°C was recorded at Stratford Dem Farm on 2 July 2001. These extreme temperatures compare to national extremes of 42.4°C and -25.6°C.
Figure 21. Average monthly 9 am earth temperatures for different depths and mean 9 am air temperature at New Plymouth Aero.
Phot
o: ©
myc
hilly
bin.
co.n
z/Gi
les
Step
ney
27
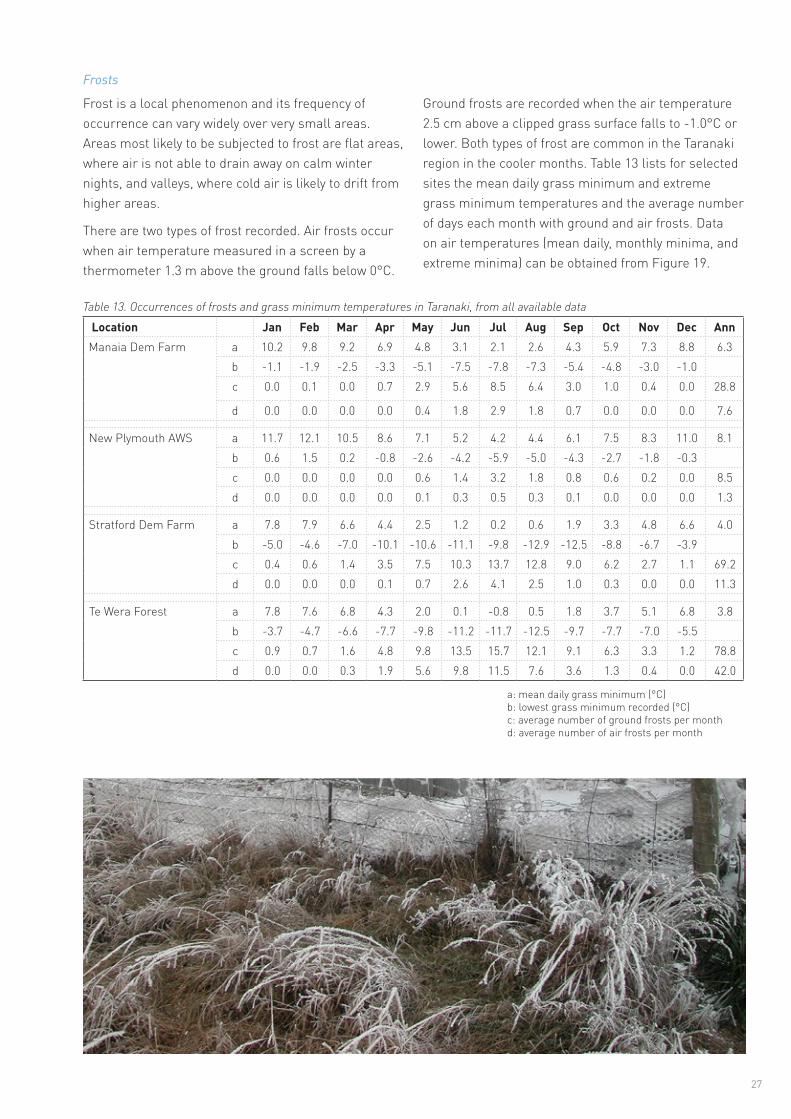
Table 13. Occurrences of frosts and grass minimum temperatures in Taranaki, from all available data
Frosts
Frost is a local phenomenon and its frequency of occurrence can vary widely over very small areas. Areas most likely to be subjected to frost are flat areas, where air is not able to drain away on calm winter nights, and valleys, where cold air is likely to drift from higher areas.
There are two types of frost recorded. Air frosts occur when air temperature measured in a screen by a thermometer 1.3 m above the ground falls below 0°C.
Ground frosts are recorded when the air temperature 2.5 cm above a clipped grass surface falls to -1.0°C or lower. Both types of frost are common in the Taranaki region in the cooler months. Table 13 lists for selected sites the mean daily grass minimum and extreme grass minimum temperatures and the average number of days each month with ground and air frosts. Data on air temperatures (mean daily, monthly minima, and extreme minima) can be obtained from Figure 19.
a: mean daily grass minimum (°C)b: lowest grass minimum recorded (°C)c: average number of ground frosts per monthd: average number of air frosts per month
Location Jan Feb Mar Apr May Jun Jul Aug Sep Oct Nov Dec AnnManaia Dem Farm a 10.2 9.8 9.2 6.9 4.8 3.1 2.1 2.6 4.3 5.9 7.3 8.8 6.3
b -1.1 -1.9 -2.5 -3.3 -5.1 -7.5 -7.8 -7.3 -5.4 -4.8 -3.0 -1.0c 0.0 0.1 0.0 0.7 2.9 5.6 8.5 6.4 3.0 1.0 0.4 0.0 28.8
d 0.0 0.0 0.0 0.0 0.4 1.8 2.9 1.8 0.7 0.0 0.0 0.0 7.6
New Plymouth AWS a 11.7 12.1 10.5 8.6 7.1 5.2 4.2 4.4 6.1 7.5 8.3 11.0 8.1b 0.6 1.5 0.2 -0.8 -2.6 -4.2 -5.9 -5.0 -4.3 -2.7 -1.8 -0.3c 0.0 0.0 0.0 0.0 0.6 1.4 3.2 1.8 0.8 0.6 0.2 0.0 8.5d 0.0 0.0 0.0 0.0 0.1 0.3 0.5 0.3 0.1 0.0 0.0 0.0 1.3
Stratford Dem Farm a 7.8 7.9 6.6 4.4 2.5 1.2 0.2 0.6 1.9 3.3 4.8 6.6 4.0b -5.0 -4.6 -7.0 -10.1 -10.6 -11.1 -9.8 -12.9 -12.5 -8.8 -6.7 -3.9c 0.4 0.6 1.4 3.5 7.5 10.3 13.7 12.8 9.0 6.2 2.7 1.1 69.2d 0.0 0.0 0.0 0.1 0.7 2.6 4.1 2.5 1.0 0.3 0.0 0.0 11.3
Te Wera Forest a 7.8 7.6 6.8 4.3 2.0 0.1 -0.8 0.5 1.8 3.7 5.1 6.8 3.8b -3.7 -4.7 -6.6 -7.7 -9.8 -11.2 -11.7 -12.5 -9.7 -7.7 -7.0 -5.5c 0.9 0.7 1.6 4.8 9.8 13.5 15.7 12.1 9.1 6.3 3.3 1.2 78.8d 0.0 0.0 0.3 1.9 5.6 9.8 11.5 7.6 3.6 1.3 0.4 0.0 42.0

Highest Recorded
Mean
Lowest Recorded
28
Sunshine and Solar Radiation
Sunshine
Western and coastal areas of Taranaki are generally quite sunny (Figure 22), generally experiencing over 2000 sunshine hours per year. Increased cloudiness in the hill country reduces the amount of sunshine towards the border with Manawatu-Wanganui, where sunshine is less than 1800 hours per year, and the summit of Mt Taranaki receives less than 1750 hours of annual bright sunshine. Figure 23 shows the monthly mean, maximum, and minimum recorded bright sunshine hours for selected sites in Taranaki.
Figure 23. Mean, highest, and lowest recorded monthly bright sunshine hours for selected sites in Taranaki.
Figure 22. Median annual sunshine hours for Taranaki, 1981-2010.

29
Table 14. Mean daily global solar radiation (MJ/m2/day) for Taranaki sites.
Solar radiation
Solar radiation records are available for a number of sites in Taranaki, but only a few sites have a long record (>10 years). Insolation is at a maximum in December and January and a minimum in June. Table 14 shows mean daily solar radiation (global) for each month for New Plymouth Aero and Normandy.
UV (Ultra-violet radiation)
UV measurements are not available for any stations in the Taranaki region. Figure 24 shows an example of a UV forecast for New Plymouth, and indicates the levels of UV and times of the day where sun protection is required.
Fog
Most fogs reported in Taranaki form at night under anticyclonic conditions with clear skies and very little air movement. Radiational cooling of the land also cools the air above and fogs will normally form if the air is cooled to its dew-point, allowing the water vapour in the air to condense.
Location Jan Feb Mar Apr May Jun Jul Aug Sep Oct Nov Dec AnnNew Plymouth AWS 24.0 21.2 16.9 11.6 7.8 6.2 7.0 9.8 13.4 17.3 21.6 22.2 14.9Normanby EDR 22.4 19.8 15.5 10.6 7.3 5.6 6.7 8.8 12.4 16.2 20.1 21.9 13.9
Figure 24. UV Index forecast for New Plymouth, January and July. Source: https://www.niwa.co.nz/our-services/online-services/uv-and-ozone.
Table 15. Average number of days each year with thunder, fog, and hail, from all available data.
Location Thunder Fog HailCape Egmont 4 5 2Manaia Dem Farm 6 2 4New Plymouth Aero 15 16 7Normanby MAF 4 4 4Stratford Dem Farm 7 15 5Stratford Mtn House 7 39 13Te Wera Forest 3 23 1
The frequency of fog varies widely over the Taranaki region, ranging from an average of 39 days with fog per year at Stratford Mountain House to an average of once every six months at Manaia Dem Farm. Although fog can occur at any time of the year it is recorded most frequently between March and August. The average number of days per year with fog for selected stations in the Taranaki region is listed in Table 15.

30
Severe convective storms
Thunderstorms
Thunderstorms are fairly evenly distributed throughout the year, but there is a tendency for them to be more frequent during the winter when cold and unstable air masses cross the region. Thunderstorms are usually associated with cold south or southwest airstreams. Average annual frequencies for selected stations are given in Table 15, and range from 15 per year at New Plymouth to three per year at Te Wera Forest. At some of the stations, it is likely that not all thunderstorms are detected. The heavy rain, lightning, hail, wind squalls, and rare tornadoes which can occur with thunderstorms will sometimes cause severe local flooding, disruption of electrical and electronic equipment, and damage to trees, crops, and buildings.
Hail
Table 15 gives the average number of days per year on which hail is reported at selected stations. These range from one day per year at Te Wera Forest up to 13 days per year at Stratford Mountain House. As with thunderstorms, an unknown number of hail falls will escape detection at some of the stations. Hail is most likely over the winter and spring months.
Tornadoes
Tornadoes are rapidly rotating columns of air extending from the base of a cumulonimbus cloud, and have in New Zealand a damage path typically 10-20 m wide and 1-5 km long. The small size (compared to tornadoes in the USA), their short lifetimes, and the sparse population of much of New Zealand must result in an unknown number of tornadoes not being reported.
On average, one tornado occurs in the Taranaki region per year, with the frequency of severe cases about once in four years (Burgess et al., 2007). Most tornadoes that occur in Taranaki have wind speeds between 116 and 180 km/hr, with 10% attaining wind speeds in excess of 180 km/hr. Most tornadoes occur in August, double the frequency of any other month, and the least occur in November (Burgess et al., 2007).
An extreme tornado event occurred in the Taranaki region on the night of 5 July 2007. A swarm of about seven tornadoes hit near Oakura, Egmont Village, Inglewood, Waitara, and Bell Block. Roofs were blown off, trees were uprooted, cars were lifted and spun
around and debris was scattered widely. About 50 houses were damaged in Oakura, some sustaining damage of up to 80%, making many uninhabitable. The main state highway south of New Plymouth (SH 45) was blocked by fallen trees and powerlines. Power was cut to about 8000 homes. A CDE was declared in the New Plymouth District which lasted until the 7th. The total insurance cost of the tornadoes was $8.3 million. More information on tornadoes in Taranaki can be found at NIWA’s Historical Weather Events Archive (hwe.niwa.co.nz).
Snow
There is a permanent snow field on Mt Taranaki, and during winter the snow line usually descends to about 1000 m. However, snow fall occurs on Mt Taranaki with very few synoptic conditions, and snowfalls are therefore highly variable from year to year. Stratford Mountain House (846 m above sea level) with an average of 18 days of snowfall per year, had 26 days in 1977, and only 7 days in 1973. Snow is very infrequent at sea level. During the period 1972-1991, there were only 2 reported occasions of snowfall at New Plymouth. On 20-22 May 2009, a front brought a southerly airflow to the country. Snow fell in the Taranaki region, with heavy snow in Stratford and Dawson Falls, and on Mt Taranaki. Ice was a major problem for motorists, causing numerous accidents.
Most snowfalls on Mt Taranaki are associated with a trough of low pressure or a depression over or east of the North Island with a strong cold south to southwest airstream over the southern districts of the North Island. Typical meteorological situations associated with falls of snow on Mt Taranaki are given in Figure 25.

31
Table 16. Generated wave heights associated with specific wind speeds. Assumes a fetch length of 500 km with unlimited wind duration.
Wind speed (km/hr) Associated wave height (m)10 0.520 130 240 350 475 7
100 11125 13+
Sea swell and wavesThe ocean off Taranaki is exposed to the prevailing west to southwest swells of its latitude zone. Consequently, swells off the west coast of New Zealand are much higher than those off the east coast. At Maui A Platform, prevailing swells come from the southwest quarter (75% of the time). Of all swells observed, the frequency of those from one to two metres is 35%, while for those greater than two metres is 30% (Gorman et al., 2003). Swells greater than four metres account for about 2% of waves.
There is a known relationship between steady wind speed and wave heights over the open sea. The most probable wave heights for a given wind speed over a typical fetch length in New Zealand coastal waters of about 500 km are given in Table 16.
Figure 25. Typical meteorological situations associated with snowfalls on Mt Taranaki; left: 0000 NZST 6 September 1977, right: 0000 NZST 12 June 1980.
Phot
o: ©
myc
hilly
bin.
co.n
z/Ch
ris G
in

32

DERIVED CLIMATOLOGICAL PARAMETERSApart from elements such as temperature and rainfall which can be measured directly, it has been found that parameters computed from several elements have some important uses especially in industry. Parameters which define the overall suitability of the climate for agriculture, horticulture, architectural and structural designs, and contracting, etc., are vapour pressure, relative humidity, evapotranspiration (leading to soil water balance), degree-days (thermal time), and rainfall extremes. Some of these and their uses are discussed in the following paragraphs. Short-term high intensity rainfalls have been covered previously.
Vapour pressure and relative humidityVapour pressure and relative humidity are the two parameters most frequently used to indicate moisture levels in the atmosphere. Both are calculated from simultaneous dry and wet bulb thermometer readings, although a hygrograph may be used to obtain continuous humidity readings.
Location Jan Feb Mar Apr May Jun Jul Aug Sep Oct Nov Dec AnnNew Plymouth Aero 16.5 16.8 15.6 13.7 12.3 10.7 9.9 10.5 11.8 12.7 13.5 15.6 13.3Normanby EDR 16.0 16.1 14.7 13.2 11.8 10.5 9.5 10.2 11.2 12.2 12.6 14.8 12.7Stratford Dem Farm 15.7 15.8 14.6 13.0 11.3 9.8 9.2 9.5 10.5 11.6 12.7 14.5 12.4
Vapour pressure is the part of total air pressure that results from the presence of water vapour in the atmosphere. It varies greatly with air masses from different sources, being greatest in warm air masses that have tropical origins and lowest in cold, polar-derived air masses. Vapour pressure can be important in determining the physiological response of organisms to the environment (very dry air, especially if there is a pre-existing soil moisture deficit, can cause or increase wilting in plants). Average 9 am vapour pressures for several stations are given in Table 17.
Relative humidity is quite high in all seasons, but there is a peak in winter, as shown in Table 18. The sites inland (Normanby and Stratford) tend to have higher relative humidity than coastal sites (New Plymouth).
Location Jan Feb Mar Apr May Jun Jul Aug Sep Oct Nov Dec AnnNew Plymouth Aero 80.9 82.5 81.8 82.4 85.4 86.1 85.7 84.4 82.7 82.8 80.1 81.4 83.0Normanby EDR 82.5 84.3 83.2 85.2 86.6 88.3 89.0 87.5 84.1 83.1 80.3 80.6 84.5Stratford Dem Farm 86.9 88.6 86.4 87.6 88.3 89.7 89.1 86.8 84.4 84.7 85.9 84.4 86.9
33
Table 17 Mean monthly/annual 9 am vapour pressure (hPa) for selected Taranaki sites.
Table 18. Mean monthly/annual 9 am relative humidity (%) for selected Taranaki sites.
Phot
o: ©
myc
hilly
bin.
co.n
z/Gl
en R
oebu
ck

Evapotranspiration and soil water balanceEvapotranspiration is the process where water held in the soil is gradually released to the atmosphere through a combination of direct evaporation and transpiration from plants. A water balance can be calculated by using daily rainfalls and by assuming that the soil can hold a fixed amount of water with actual evapotranspiration continuing at the maximum rate until total moisture depletion of the soil occurs. The calculation of water balance begins after a long dry spell when it is known that all available soil moisture is depleted or after a period of very heavy rainfall when the soil is completely saturated. Daily calculations are then made of moisture lost through evapotranspiration or replaced through precipitation. If the available soil water becomes insufficient to maintain evapotranspiration then a soil moisture deficit occurs and irrigation becomes necessary to maintain plant growth. Runoff occurs when the rainfall exceeds the soil moisture capacity (assumed to be 150 mm for most New Zealand soils).
Mean monthly and annual water balance values are given in Table 19, for a number of sites in Taranaki. It can be seen from this table that sites at lower elevations have more days of soil moisture deficit, e.g.
New Plymouth (43 days of soil moisture deficit between November and April) compared with Stratford (11 days of soil moisture deficit). There is generally adequate moisture available to maintain plant growth between June and October. Higher elevation sites exhibit more runoff than lower elevation sites. Figure 26 shows region-wide variability in days of soil moisture deficit per year.
Potential evapotranspiration (PET) has been calculated for New Plymouth, Normanby, and Stratford using the Penman method (Penman, 1948). The monthly mean, minimum, and maximum PET values are listed in Table 20.
Drought in Taranaki
The Taranaki region is generally not prone to drought, due to exposure to moisture-laden westerly winds. However, a significant drought occurred throughout the entire North Island during summer and early autumn of 2012-2013. Extreme soil moisture deficits (more than 130 mm of deficit) were present in parts of the Taranaki region (Figure 27), meaning that pasture growth had all but ceased. The dry conditions meant that farmers had to dry off cattle early and sell off stock. The stock feed situation remained low in drought-stricken
34
Location Jan Feb Mar Apr May Jun Jul Aug Sep Oct Nov Dec AnnHawera, Green Lane (105m) NR 0 1 0 1 5 13 14 11 7 4 1 0 58
RO 1 6 5 10 35 98 96 66 45 41 15 3 421ND 11 11 7 3 1 0 0 0 0 0 1 6 40DE 48 44 19 5 1 0 0 0 0 0 3 24 145
New Plymouth AWS (30m) NR 1 1 0 2 6 12 12 11 8 4 2 1 58RO 3 14 2 26 64 115 104 86 71 51 20 18 577ND 12 12 9 2 1 0 0 0 0 0 3 5 44DE 60 51 31 4 2 0 0 0 0 0 11 22 181
Patiki (152m) NR 1 1 1 2 9 14 14 11 8 6 2 1 69RO 10 11 7 18 67 125 116 81 65 62 23 14 599ND 8 10 6 2 0 0 0 0 0 0 1 3 30DE 34 38 17 3 0 0 0 0 0 0 2 13 107
Stratford Dem Farm (311m) NR 2 1 4 6 10 14 14 13 10 8 5 4 91RO 32 33 61 94 142 182 189 159 127 154 81 64 1318ND 3 4 2 1 0 0 0 0 0 0 0 1 11DE 11 14 6 1 0 0 0 0 0 0 0 2 34
NR is the average number of days per month on which runoff occursRO is the average amount of runoff in mmND is the average number of days per month on which a soil moisture deficit occursDE is the average amount of soil moisture deficit in mm
Table 19. Mean monthly/annual water balance summary for a soil moisture capacity of 150 mm.

areas, and the price of feed significantly increased. Numerous locations in the region experienced low rainfall during the drought, with New Plymouth recording only 30 mm of rain in February 2013, 31% of normal February rainfall. During November 2012 to March 2013, New Plymouth recorded 61% of normal rainfall for these five mouths (312 mm). At the time of writing (July 2013), economic costs due to the 2012-13 drought across the North Island and Westland were estimated at a minimum of $2 billion. Figure 28 shows the soil moisture deficits reached at New Plymouth over the drought period, compared to normal soil moisture deficit conditions for the same time of year (soil moisture deficit from September to May averaged from 1981-2010).
35
Figure 26. Taranaki median annual days of soil moisture deficit, 1981-2010.
Figure 27. Soil moisture deficit as at 1 March 2013 (right hand map). Areas of extreme soil moisture deficit (more than 130 mm of soil moisture deficit) are shown in red, and areas of significant soil moisture deficit (more than 110 mm of soil moisture deficit) are shown in dark orange. Normal soil moisture deficit conditions for the time of year are given in the left hand figure, and the middle figure shows soil moisture deficit conditions as at 1 March 2012.
36
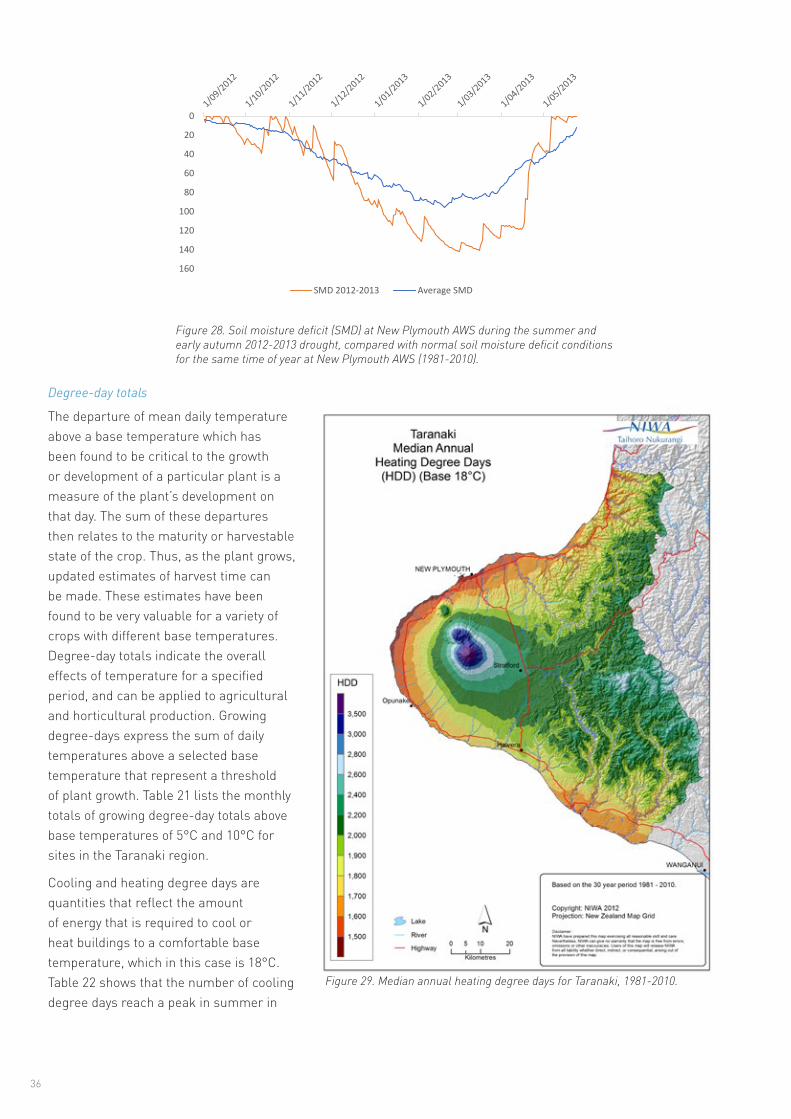
Degree-day totals
The departure of mean daily temperature above a base temperature which has been found to be critical to the growth or development of a particular plant is a measure of the plant’s development on that day. The sum of these departures then relates to the maturity or harvestable state of the crop. Thus, as the plant grows, updated estimates of harvest time can be made. These estimates have been found to be very valuable for a variety of crops with different base temperatures. Degree-day totals indicate the overall effects of temperature for a specified period, and can be applied to agricultural and horticultural production. Growing degree-days express the sum of daily temperatures above a selected base temperature that represent a threshold of plant growth. Table 21 lists the monthly totals of growing degree-day totals above base temperatures of 5°C and 10°C for sites in the Taranaki region.
Cooling and heating degree days are quantities that reflect the amount of energy that is required to cool or heat buildings to a comfortable base temperature, which in this case is 18°C. Table 22 shows that the number of cooling degree days reach a peak in summer in
Figure 29. Median annual heating degree days for Taranaki, 1981-2010.
Figure 28. Soil moisture deficit (SMD) at New Plymouth AWS during the summer and early autumn 2012-2013 drought, compared with normal soil moisture deficit conditions for the same time of year at New Plymouth AWS (1981-2010).
0
20
40
60
80
100
120
140
160
SMD 2012-2013 Average SMD
37
Table 21. Average growing degree-day totals above base 5°C and 10°C for selected Taranaki sites.
Table 22. Average cooling (CDD) and heating (HDD) degree-day totals with base 18°C for selected Taranaki sites.
Location Jan Feb Mar Apr May Jun Jul Aug Sep Oct Nov Dec AnnNew Plymouth AWS 5°C 388 371 360 288 241 172 150 161 196 237 268 344 3176
10°C 233 230 205 138 89 42 26 28 55 86 118 189 1439
Normanby EDR 5°C 360 341 325 244 201 136 108 127 163 220 238 320 278210°C 205 200 170 98 60 24 11 13 35 72 91 165 1144
Stratford Dem Farm 5°C 340 318 300 220 166 101 85 98 135 185 224 291 246210°C 185 177 145 75 34 10 5 6 19 46 77 136 914
Location Jan Feb Mar Apr May Jun Jul Aug Sep Oct Nov Dec AnnNew Plymouth AWS CDD 21 26 11 2 0 0 0 0 0 0 0 7 67
HDD 37 22 54 104 162 218 253 242 194 166 123 66 1640
Normanby EDR CDD 14 16 6 1 0 0 0 0 0 0 1 4 41HDD 57 41 84 147 202 254 298 277 227 183 152 87 2011
Stratford Dem Farm CDD 7 7 2 0 0 0 0 0 0 0 0 1 17HDD 70 56 106 170 238 290 321 306 255 218 166 113 2309
Taranaki, where there is a higher demand for energy to cool building interiors to 18°C. Conversely, heating degree days reach a peak in winter, where the demand for energy to heat buildings to 18°C is highest. Figure 29 shows region-wide variability in the number of heating degree days per year. The number of heating degree days tends to be lower in low elevation coastal areas (e.g. New Plymouth), compared with areas further inland and at higher elevations (e.g. Normandy and Stratford).
Location Jan Feb Mar Apr May Jun Jul Aug Sep Oct Nov Dec AnnNew Plymouth AWS Max 174 139 114 75 50 34 45 53 68 109 136 144
Mean 145 120 100 59 37 27 30 43 60 90 117 130 80Min 125 103 85 49 32 19 25 28 48 73 98 118
Normanby EDR Max 144 116 92 53 35 25 25 37 60 89 113 143
Mean 129 103 81 44 28 18 20 32 52 80 103 124 68Min 113 85 60 34 19 13 13 23 46 71 89 95
Stratford Dem Farm Max 128 108 85 49 29 19 22 33 54 82 105 133
Mean 119 98 74 41 23 13 17 30 47 73 94 111 62Min 101 86 58 32 12 6 10 20 38 56 82 99
Table 20. Penman calculated maximum, mean, and minimum monthly potential evapotranspiration (mm), as well as total mean annual PET.
Phot
o: ©
myc
hilly
bin.
co.n
z/Gi
les
Step
ney

38
ACKNOWLEDGEMENTSThe following people from NIWA are acknowledged for their assistance in preparing this publication: Dr Andrew Tait, James Sturman, Dr Elizabeth Somervell, Dr Michael Uddstrom, Dr Richard Gorman, Georgina Griffiths, Erika Mackay, and Hisako Shiona.
Photo credits:Page 21, 22, Ryan Paulik, NIWAPage 27, Steve LeGal, NIWAPage 33, Alan Blacklock, NIWA
REFERENCESNIWA databases used:
The National Climate Database cliflo.niwa.co.nz
HIRDS (High Intensity Rainfall Design System) hirds.niwa.co.nz
New Zealand Historic Weather Events Catalogue hwe.niwa.co.nz
NIWA Sea Surface Temperature Database
References:
BURGESS, S., SALINGER, J., GRAY, W. & MULLAN, B. 2006. Climate hazards and extremes – New Plymouth District: Cyclones of tropical origin. Wellington: NIWA client report WLG2006-27.
BURGESS, S., SALINGER, J., TURNER, R. & REID, S. 2007. Climate hazards and extremes – Taranaki region: High winds and tornadoes. Wellington: NIWA client report WLG2007-048.
DIAMOND, H. J., LORREY, A. M., KNAPP, K. R. & LEVINSON, D. 2012. Development of an enhanced tropical cyclone track database for the southwest Pacific from 1840-2010. International Journal of Climatology, 32, 2240-2250.
GORMAN, R. M., BRYAN, K. R. & LAING, A. K. 2003. Wave hindcast for the New Zealand region: Nearshore validation and coastal wave climate. New Zealand Journal of Marine and Freshwater Research, 37, 567-588.
PENMAN, H. L. 1948. Natural evaporation from open water, bare soil, and grass. Proceedings of the Royal Society of London A, 193, 120-145.
UDDSTROM, M. J. & OIEN, N. A. 1999. On the use of high resolution satellite data to describe the spatial and temporal variability of sea surface temperatures in the New Zealand Region. Journal of Geophysical Research (Oceans), 104, 20729-20751.