The climate and weather of Northland - NIWA ClimateWEB.pdf · THE CLIMATE AND WEATHER OF NORTHLAND...
40
THE CLIMATE AND WEATHER OF NORTHLAND 3rd edition P.R. Chappell
Transcript of The climate and weather of Northland - NIWA ClimateWEB.pdf · THE CLIMATE AND WEATHER OF NORTHLAND...

THE CLIMATE AND WEATHER OF
NORTHLAND3rd edition P.R. Chappell
Note to Third EditionThis publication replaces the second edition of New Zealand Meteorological Service Miscellaneous Publication 115 (2), written in 1986 by R.W. Moir, B. Collen, and C.S. Thompson. It was considered necessary to update the second edition, incorporating more recent data and updated methods of climatological variable calculation.
NIWA SCIENCE AND TECHNOLOGY SERIES NUMBER 59
ISSN 1173-0382
© 2013. All rights reserved. The copyright for this report, and for the data, maps, figures and other information (hereafter collectively referred to as “data”) contained in it, is held by NIWA. This copyright extends to all forms of copying and any storage of material in any kind of information retrieval system.
While NIWA uses all reasonable endeavours to ensure the accuracy of the data, NIWA does not guarantee or make any representation or warranty (express or implied) regarding the accuracy or completeness of the data, the use to which the data may be put or the results to be obtained from the use of the data. Accordingly, NIWA expressly disclaims all legal liability whatsoever arising from, or connected to, the use of, reference to, reliance on or possession of the data or the existence of errors therein. NIWA recommends that users exercise their own skill and care with respect to their use of the data and that they obtain independent professional advice relevant to their particular circumstances.
THE CLIMATE AND WEATHER OF NORTHLAND3rd edition P.R. Chappell


4
CONTENTSSUMMARY 6
INTRODUCTION 7
THE WEATHER IN NORTHLAND 9Weather systems affecting Northland 9Characteristic weather sequences in Northland 10
Fine weather spells 10Brief periods of rain 11Showery weather 11Prolonged rainfall 12
CLIMATIC ELEMENTS 15Wind 15Rainfall 17
Rainfall distribution 17Rainfall frequency and intensity 20Recent extreme events in Northland 21Periods of low rainfall 22
Temperature 23Sea temperature 23Air temperature 24Earth Temperatures 26Frosts 27
Sunshine and Solar Radiation 28Sunshine 28Solar radiation 29UV (Ultra-violet radiation) 29
Fog 30Severe convective storms 30
Thunderstorms 30Hail 30Tornadoes 31
Sea swell and waves 31
DERIVED CLIMATOLOGICAL PARAMETERS 33Vapour pressure and relative humidity 33Evapotranspiration and soil water balance 34Degree-day totals 36
ACKNOWLEDGEMENTS 38
REFERENCES 38

5
SUMMARYNorthland, with its northern location, low elevation and close proximity to the sea is characterised by a mild, humid, and rather windy climate. Summers are warm and tend to be humid, while winters are mild, with many parts of the region having only a few light frosts each year. Rainfall is typically plentiful all year round with sporadic very heavy falls. However dry spells do occur, especially during summer and autumn. Most parts of Northland receive about 2000 hours of sunshine per year. It can be very windy in exposed areas and occasionally Northland experiences gales, sometimes in association with the passage of depressions of tropical origin.

Figure 1. Map of Northland, with locations of places mentioned in the text, tables, and figures.
7
INTRODUCTIONThe North Auckland peninsula extends from Auckland City to North Cape for a length of about 300 km. Northland is defined here as the region administered by Northland Regional Council, encompassing the jurisdictions of Kaipara, Whangarei, and Far North Districts.
Most of Northland lies between the latitudes 34° S and 36° S. Despite its length, the peninsula is less than 100 km across at its widest point. The eastern coastline is indented by many inlets and bays, the most famous of which is the Bay of Islands. On the western side, the Kaipara and Hokianga Harbours penetrate far inland, but much of the exposed coastline is dominated by long surf beaches. Figure 1 provides geographic context for the Northland region, and shows all locations mentioned in the following text and tables.
Most of the region lies below 150 m elevation although some points in the central ranges are above 600 m. Together these factors give Northland a climate that is warm and humid in the summer and mild in the winter. Rainfall is highest in winter while dry spells tend to occur in summer and autumn. Cultivation of sub-tropical fruits is well suited to these climatic conditions, especially in eastern areas. However even with this diversification, Northland’s economy still largely depends on forestry, intensive dairy farming, and tourism, which like horticulture are industries closely linked to the climate.
All numbers given in the following tables are calculated using data from the 1981-2010 normal period (a normal is an average or estimated average over a standard 30 year period), unless otherwise stated.

8

9
THE WEATHER IN NORTHLANDWeather systems affecting NorthlandNorthland’s latitude means that the tracks of anticyclone centres crossing New Zealand are often to the south of the region. As a result, winds tend to be southeasterly following the passage of a trough as the next anticyclone advances, and turn to the northeast once the anticyclone has moved off to the east and the next trough is approaching. The northeast winds have had a long passage over a warm water surface to the north of New Zealand. They are usually very moist and cloud may develop as the air turns southward and is cooled from below by the sea surface. Upward motion associated with the trough leads to rain. Sometimes subtropical depressions form in these troughs in the easterlies and move close to Northland, producing heavy rain. When anticyclones pass to the north of New Zealand the passage of the following trough is accompanied by a wind change from northwesterly to southwesterly. The cold fronts in such troughs of low pressure are likely to bring less rain to Northland than areas further south.
Figure 2a. Tropical cyclones which made landfall in New Zealand during December, 1970-2010. Source: Southwest Pacific Enhanced Archive of Tropical Cyclones (SPEArTC; Diamond et al., 2012).
Figure 2b. Tropical cyclones which made landfall in New Zealand during January, 1970-2010. Source: SPEArTC (Diamond et al., 2012).
Figure 2c. Tropical cyclones which made landfall in New Zealand during February, 1970-2010. Source: SPEArTC (Diamond et al., 2012).
Tropical cyclones that reach Northland and still retain very low pressures and hurricane force winds are very rare. However, other storms of tropical origin (which may never have been fully developed tropical cyclones) affect Northland about once or twice each year, mainly between the months of December and April. They usually bring heavy rain and strong easterly winds. See ‘Recent extreme events in Northland’ section for a detailed description of the impact of Cyclone Bola in March 1988. Figure 2 shows, by months, the tracks of tropical cyclones which made landfall in New Zealand during the period between 1970 and 2010.

10
Characteristic weather sequences in Northland
Fine weather spells
The simplest situation, resulting in a long spell of fine weather (five days or more), occurs when a large anticyclone moves slowly over the Northland region. For example if the centre of an anticyclone moves slowly over the South Island with an eastward moving ridge of high pressure extending northward or northwestward from its centre, a period of fine weather will result in Northland.
In summer, Northland sometimes experiences two to three weeks of mostly fine weather due to a process known as anticyclone replacement. In this process, an anticyclone becomes stationary east of Australia and begins to lose intensity. A following cold front moves along the southern edge of the anticyclone and over New Zealand, bringing cloudy conditions and little or no rainfall. The original anticyclone, which has virtually disappeared, is replaced by the next in a series, and the whole process repeats itself, sometimes several times. Except for a short period with the passage of the weak fronts, the weather in Northland is fine and temperatures are normal or slightly above normal, often for quite prolonged periods. This type of situation is shown in Figure 3. No rain fell at Kaitaia during 9-26 April 1984, a total of 17 days without rain. Daytime temperatures were generally between 2°C and 3°C higher than usual, although night time temperatures were a little cooler than usual due to strong outgoing radiation associated with clear skies.
Figure 2d. Tropical cyclones which made landfall in New Zealand during March, 1970-2010. Source: SPEArTC (Diamond et al., 2012).
Figure 2e. Tropical cyclones which made landfall in New Zealand during April, 1970-2010. Source: SPEArTC (Diamond et al., 2012).
Figure 3. Prolonged period of fine weather.

11
Figure 5. Brief period of heavy rainfall.
Brief periods of rain
When a cold front oriented northwest to southeast crosses Northland, preceded by north to northwest winds and followed by southwesterlies, there is usually only a brief period of rain, often light. Figure 4 illustrates this situation. The passage of this front brought rain between midnight and 7 am on 22 September 1983 when 21.4 mm of rain fell at Kaitaia during this period.
When a depression develops in the trough between two anticyclones and subsequently moves over central and southern New Zealand, the rainfall in Northland is again brief but may be heavy. Figure 5 illustrates such a situation.
Showery weather
Prolonged changeable weather with frequent and sometimes heavy showers occurs with two main types of situation:
(i) Following the passage of a depression or cyclonic storm which has moved over Northland from the northwest or west, cold weather with moderate or fresh southwesterly to southerly winds and frequent showers may last two to three days. This type of situation is shown in Figure 6.
(ii) When the track of an anticyclone lies well to the south of Northland, the region experiences easterlies for long periods. A trough of low pressure between two anticyclones may develop to the north of the region. The wind east of the trough is north-east and to the west of the trough is southeasterly. Once established, such troughs usually move slowly and may cause several days of showery weather in Northland, with rainfalls typically higher in the east than in the west. This type of situation is shown in Figure 7.
Figure 6. Showers associated with a depression or cyclonic storm.
Figure 7. Showers associated with a trough of low pressure.
Figure 4. Brief period of rainfall.

12
Prolonged rainfall
Most long periods of rain in Northland occur when there is an anticyclone to the east or southeast of New Zealand that has become stationary. The anticyclone is typically elliptic in shape with its major axis extending far to the north or northeast of New Zealand. Under such circumstances there is a flow of moist warm air from the low latitudes over Northland. Where this flow is lifted by vertical motion associated with a trough in the north Tasman Sea, rain may occur for several days and high rainfall totals can accumulate – often up to 100 mm, occasionally more. A situation of this type is shown in Figure 8.
Other situations that can lead to prolonged rainfalls are illustrated in Figures 9 and 10. In Figure 9 successive daily positions of a depression centre moving off Australia, across the Tasman Sea and South Island are shown. In advance of the frontal trough (which by 25 October had become stationary) persistent rain fell in Northland.
Figure 10 is representative of situations where a depression which originated as a tropical cyclone passes over or, in this case, close to, Northland. Successive daily positions of the centre are again shown. On this occasion Northland received between 70 and 130 mm of rain. Such situations (and those of the type illustrated in Figure 8) may also be accompanied with damaging winds.
Figure 9. Prolonged heavy rainfall.
Figure 8. Prolonged heavy rainfall associated with a stationary anticyclone.
Figure 10. Prolonged heavy rainfall associated with a severe depression passing over Northland.
13
14

15
CLIMATIC ELEMENTSWindThe airflow over Northland is predominantly from the southwest (Tomlinson, 1975). This is particularly so in winter and spring, but in summer the proportion of winds from the easterly quarter, especially in eastern districts, about equals that from the southwest. This arises from the changing location of the high pressure belt, which is further to the south in summer and early autumn than it is in winter and spring. As well, sea breezes add to the proportion of easterlies in eastern areas in summer and early autumn. Figure 11 shows mean annual wind frequencies of surface wind based on hourly observations from selected stations.
Mean wind speed data (average wind speeds are taken over the 10 minute period preceding each hour), are available for several sites in Northland, and these illustrate the several very different wind regimes of the region. Exposed coastal areas tend to be very windy, with mean annual wind speeds among the highest in New Zealand. Such areas are typified by data from Cape Reinga and Mokohinau Islands, where mean annual wind speeds are around 30 km/hr. Areas that are exposed to most winds but receive some sheltering, such as Kaitaia Airport, characteristically have speeds of between 15 and 20 km/hr. Inland and sheltered areas of Northland are among the least windy in the country, with mean annual wind speeds at Kaikohe and Kerikeri about 10 km/hr. Table 1 gives mean monthly wind speeds for selected stations in Northland.
Table 1. Mean monthly and annual wind speed (km/hr).
Location Jan Feb Mar Apr May Jun Jul Aug Sep Oct Nov Dec AnnCape Reinga 29 28 28 29 32 34 33 33 30 32 30 28 31Kaitaia Airport 16 15 15 15 15 16 17 16 17 18 17 16 16Kaikohe AWS 11 10 10 9 10 11 12 12 13 14 13 12 11Kerikeri EWS 7 7 6 6 6 7 7 7 7 8 8 7 7Whangarei Airport 12 12 11 10 10 10 11 11 12 13 13 12 11Mokohinau Islands 24 24 24 25 28 30 31 29 27 28 28 25 27
Figure 11. Mean annual wind frequencies (%) of surface wind directions, from hourly observations at selected Northland sites. The plots show the directions from which the wind blows, e.g. the dominant wind direction at Cape Reinga is from the southwest.

Winds can be strong and gusty at times, especially in exposed coastal areas. As expected, the well exposed site at Cape Reinga records the greatest number of days each year on which gusts exceed 63km/hr and 96km/hr. Table 4 shows the average number of days each year with gusts exceeding 63km/hr and 96km/hr and also lists the average number of days each year on which gale force winds (10-minute average speeds in excess of 63 km/hr) are recorded.
Although gale force winds can occur in any month they are most frequent between May and August, and especially in July. The highest gust recorded in the region was 183 km/hr at Cape Reinga on 22 July 2002. Maximum gusts recorded at different stations in the region are listed in Table 5.
Sea breezes are common on both coasts during summer and autumn on days when there is no strong pressure gradient over the region. They may reach 20 to 30 km/hr when there is a marked difference between the sea temperature and the land temperature, especially in the afternoon. On occasions the opposing sea breezes from the west and east coasts converge inland in a zone marked by a line of cloud and showers. At Kaitaia both sea breezes can occur at different times of the day.
16
Spring is generally the windiest season except in exposed places such as Cape Reinga and Mokohinau Islands where winter tends to be the windiest period. Summer and autumn are the seasons when the greatest numbers of light wind days are recorded. Table 2 gives the seasonal proportion of strong and light winds as a percentage of the annual total. For example, of all strong winds recorded at Cape Reinga, 21 percent occurred in summer, 24 percent in autumn, 29 percent in winter, and 26 percent in spring. In compiling this table a strong wind was defined as having a mean speed of at least 31 km/hr.
Diurnal variation in wind speed is, well-marked, with greatest wind speeds occurring in the early part of the afternoon (Table 3).
Table 2. Seasonal proportions of strong winds or calms (%).
Table 3. Average wind speed (km/hr) for selected hours.
Table 4. Average number of days per year with gusts exceeding 63 km/hr and 96 km/hr, and gale force winds.
Table 5. Highest recorded gusts at Northland stations, from all available data.
Location Summer Autumn Winter Spring
Cape ReingaStrong 21 24 29 26Light 28 26 22 24
Kaitaia ObservatoryStrong 13 17 32 38Light 26 25 25 24
Kaikohe AWSStrong 11 10 36 43Light 25 25 25 25
Kerikeri EWSStrong 24 17 23 37Light 25 25 25 24
Whangarei AirportStrong 19 15 36 30Light 25 25 25 25
Mokohinau IslandsStrong 20 24 30 27Light 28 26 23 24
Location 00 03 06 09 12 15 18 21Cape Reinga 30 29 29 29 31 32 32 30Kaitaia EWS 11 12 12 13 18 20 17 12Kaikohe AWS 9 8 8 10 16 17 15 10Kerikeri EWS 5 5 5 9 10 10 8 6Whangarei Airport 8 8 8 10 16 18 15 10
LocationGusts
>63 km/hrGusts
>96 km/hrDays of gale
Cape Reinga 167 34 42Kaitaia Observatory 63 3 2Whangarei Airport 22 0.3 1
Location Gust (km/hr) Direction (°) DateCape Reinga 183 060 22/07/2002Kaitaia Observatory 139 320 24/04/1991Kerikeri Aerodrome 85 281 12/09/2011Whangarei Airport 122 090 28/07/1982Marsden Point 154 050 28/06/1977Dargaville 117 084 10/07/2007Mokohinau Islands 152 110 29/11/1998
17
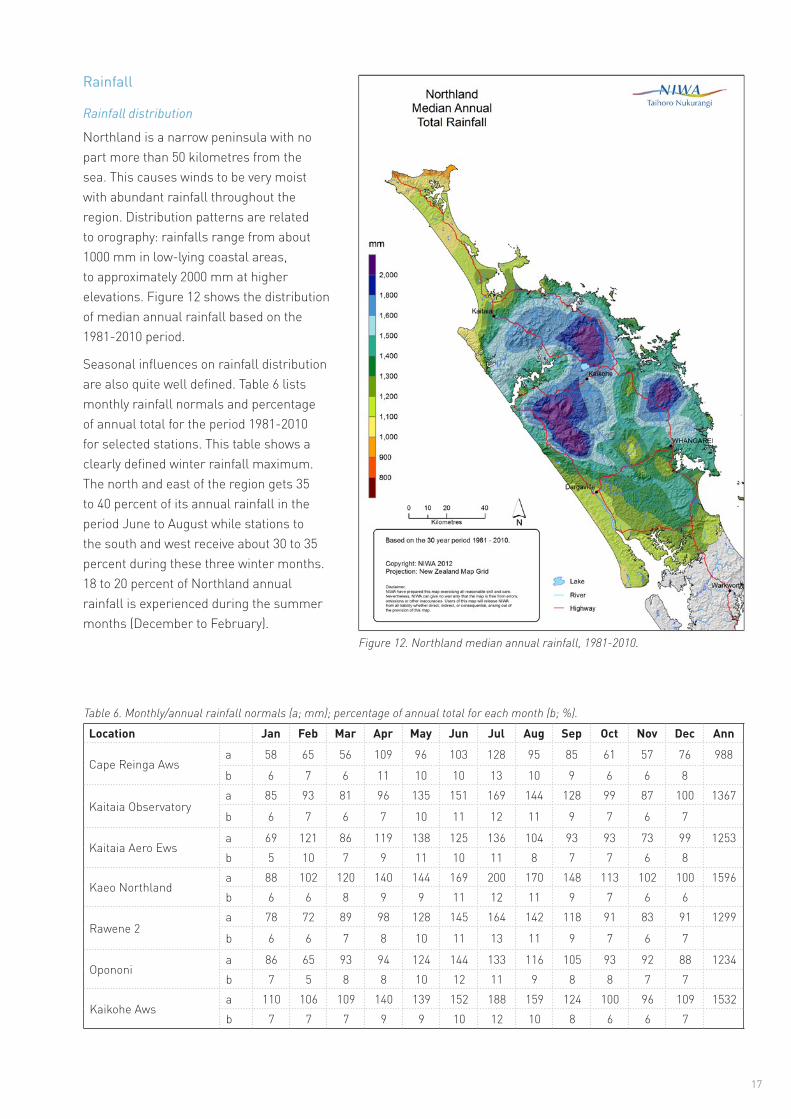
Figure 12. Northland median annual rainfall, 1981-2010.
Rainfall
Rainfall distribution
Northland is a narrow peninsula with no part more than 50 kilometres from the sea. This causes winds to be very moist with abundant rainfall throughout the region. Distribution patterns are related to orography: rainfalls range from about 1000 mm in low-lying coastal areas, to approximately 2000 mm at higher elevations. Figure 12 shows the distribution of median annual rainfall based on the 1981-2010 period.
Seasonal influences on rainfall distribution are also quite well defined. Table 6 lists monthly rainfall normals and percentage of annual total for the period 1981-2010 for selected stations. This table shows a clearly defined winter rainfall maximum. The north and east of the region gets 35 to 40 percent of its annual rainfall in the period June to August while stations to the south and west receive about 30 to 35 percent during these three winter months. 18 to 20 percent of Northland annual rainfall is experienced during the summer months (December to February).
Table 6. Monthly/annual rainfall normals (a; mm); percentage of annual total for each month (b; %).
Location Jan Feb Mar Apr May Jun Jul Aug Sep Oct Nov Dec Ann
Cape Reinga Awsa 58 65 56 109 96 103 128 95 85 61 57 76 988
b 6 7 6 11 10 10 13 10 9 6 6 8
Kaitaia Observatorya 85 93 81 96 135 151 169 144 128 99 87 100 1367
b 6 7 6 7 10 11 12 11 9 7 6 7
Kaitaia Aero Ewsa 69 121 86 119 138 125 136 104 93 93 73 99 1253b 5 10 7 9 11 10 11 8 7 7 6 8
Kaeo Northlanda 88 102 120 140 144 169 200 170 148 113 102 100 1596b 6 6 8 9 9 11 12 11 9 7 6 6
Rawene 2a 78 72 89 98 128 145 164 142 118 91 83 91 1299
b 6 6 7 8 10 11 13 11 9 7 6 7
Opononia 86 65 93 94 124 144 133 116 105 93 92 88 1234b 7 5 8 8 10 12 11 9 8 8 7 7
Kaikohe Awsa 110 106 109 140 139 152 188 159 124 100 96 109 1532b 7 7 7 9 9 10 12 10 8 6 6 7
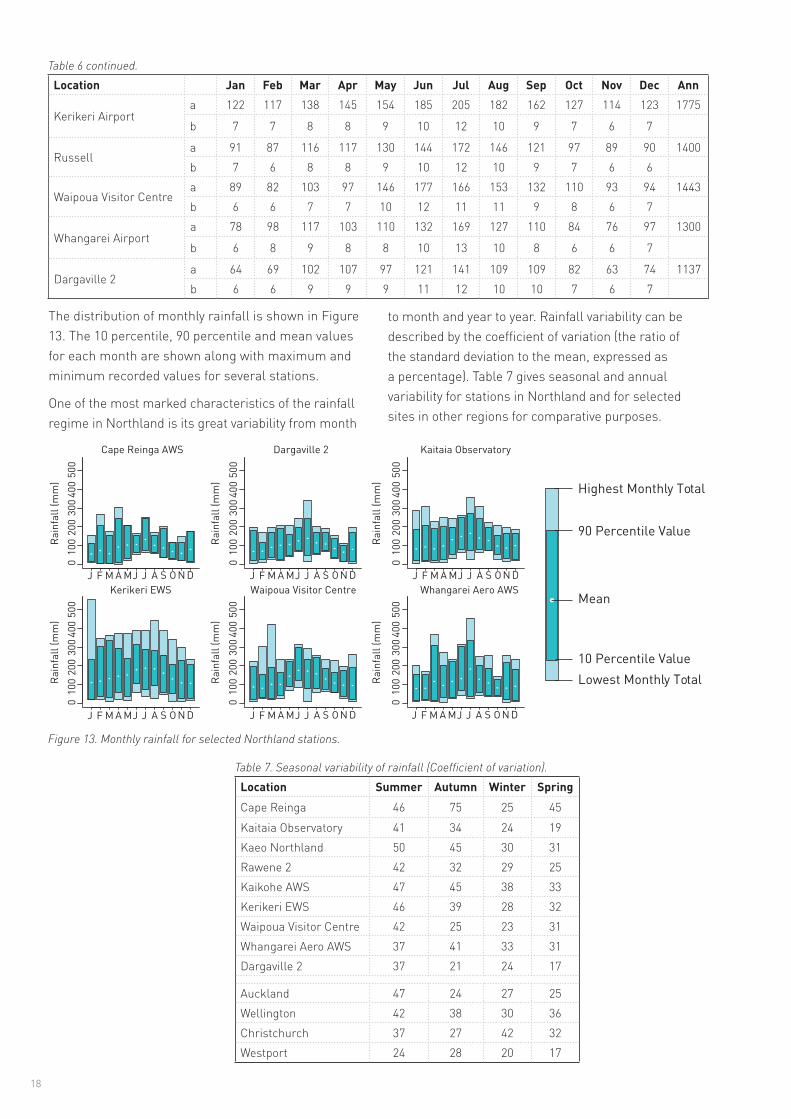
The distribution of monthly rainfall is shown in Figure 13. The 10 percentile, 90 percentile and mean values for each month are shown along with maximum and minimum recorded values for several stations.
One of the most marked characteristics of the rainfall regime in Northland is its great variability from month
to month and year to year. Rainfall variability can be described by the coefficient of variation (the ratio of the standard deviation to the mean, expressed as a percentage). Table 7 gives seasonal and annual variability for stations in Northland and for selected sites in other regions for comparative purposes.
Cape Reinga AWS
Rain
fall
(mm
)
Rain
fall
(mm
)
Rain
fall
(mm
)
Rain
fall
(mm
)
Rain
fall
(mm
)
Rain
fall
(mm
)
010
020
030
040
050
00
100
200
300
400
500
010
020
030
040
050
0
010
020
030
040
050
0
010
020
030
040
050
0
010
020
030
040
050
0
J F M J J N D
Dargaville 2 Kaitaia Observatory
Kerikeri EWS Waipoua Visitor Centre Whangarei Aero AWSA M A S O
J F M J J N DA M A S O
J F M J J N DA
A
M A S O J F M J J N DA M A S O
J F M J J N DA M A S OJ F M J J N DM A S O
18
Table 7. Seasonal variability of rainfall (Coefficient of variation).
Figure 13. Monthly rainfall for selected Northland stations.
Location Jan Feb Mar Apr May Jun Jul Aug Sep Oct Nov Dec Ann
Kerikeri Airporta 122 117 138 145 154 185 205 182 162 127 114 123 1775
b 7 7 8 8 9 10 12 10 9 7 6 7
Russella 91 87 116 117 130 144 172 146 121 97 89 90 1400b 7 6 8 8 9 10 12 10 9 7 6 6
Waipoua Visitor Centrea 89 82 103 97 146 177 166 153 132 110 93 94 1443b 6 6 7 7 10 12 11 11 9 8 6 7
Whangarei Airporta 78 98 117 103 110 132 169 127 110 84 76 97 1300
b 6 8 9 8 8 10 13 10 8 6 6 7
Dargaville 2a 64 69 102 107 97 121 141 109 109 82 63 74 1137b 6 6 9 9 9 11 12 10 10 7 6 7
Location Summer Autumn Winter SpringCape Reinga 46 75 25 45Kaitaia Observatory 41 34 24 19Kaeo Northland 50 45 30 31Rawene 2 42 32 29 25Kaikohe AWS 47 45 38 33Kerikeri EWS 46 39 28 32Waipoua Visitor Centre 42 25 23 31Whangarei Aero AWS 37 41 33 31Dargaville 2 37 21 24 17
Auckland 47 24 27 25Wellington 42 38 30 36Christchurch 37 27 42 32Westport 24 28 20 17
Table 6 continued.
Mean
Lowest Monthly Total
90 Percentile Value
10 Percentile Value
Highest Monthly Total

Rainfall variability over longer periods is indicated by rainfall deciles, as given in Table 8. The 10th percentile values show the accumulated rainfalls that will normally be exceeded in nine out of ten years, while the 90th percentile values indicate the accumulated falls that will normally be exceeded in only one year in ten. The table includes periods from one month to twelve
months; each period over one month begins with the month stated. For example, using the table for Kaitaia, for three months it can be seen that in the three month period beginning in April, 257 mm or more of rainfall can be expected for nine years in ten, while a total of 522 mm or more should occur in only one year in ten.
19
Table 8. Rainfall deciles for consecutive months.
Jan Feb Mar Apr May Jun Jul Aug Sep Oct Nov DecKaitaia Observatory1 month10th 18 18 17 26 53 78 73 80 72 53 30 2690th 183 207 189 200 198 248 271 242 196 156 166 1663 months10th 114 118 192 257 301 301 301 270 221 194 159 13090th 431 423 472 522 550 603 606 479 407 426 423 4816 months10th 412 528 563 631 672 611 556 513 405 302 274 36490th 829 894 917 981 993 947 879 790 836 770 718 75512 months10th 1086 1119 1093 1102 1046 1054 993 1131 1116 1074 1035 110590th 1584 1569 1619 1533 1625 1652 1643 1578 1637 1609 1593 1587Kerikeri EWS1 month10th 22 33 3 60 38 104 72 94 57 50 24 2490th 232 302 335 295 240 314 290 282 257 208 230 2063 months10th 148 221 228 305 360 385 379 298 226 166 143 15390th 617 629 731 645 663 748 727 626 545 550 554 6246 months10th 534 639 699 779 781 736 594 548 507 357 433 46290th 1148 1222 1229 1269 1290 1188 1157 1194 1025 1045 1078 107912 months10th 1303 1334 1258 1332 1283 1231 1267 1342 1327 1275 1349 128890th 2175 2358 2293 2186 2162 2129 2094 2130 2128 2181 2244 2202Whangarei Aero1 month10th 14 19 16 32 29 67 37 55 40 42 18 1490th 156 153 310 204 222 303 334 203 188 127 217 1833 months10th 122 113 165 175 229 261 253 193 156 140 108 12990th 578 504 630 742 768 784 805 648 480 459 499 4176 months10th 359 469 517 586 557 518 439 384 374 296 299 34990th 877 1003 988 961 927 1034 948 757 720 775 803 83612 months10th 955 979 966 932 879 939 831 927 953 942 937 93690th 1642 1636 1697 1606 1732 1843 1741 1595 1586 1641 1624 1609

Rainfall frequency and intensity
The average number of days each year on which 0.1 mm or more of rain is recorded varies from around 150 days in eastern coastal areas of the peninsula to over 200 days in some western and inland areas. Table 9 lists the average number of days per month with 0.1 mm and 1 mm of rain for selected stations. The 0.1 mm rain days and 1 mm wet days show the same geographic variability.
As noted in Section 2, heavy rainfalls can occur with the passage of depressions of tropical origin over or close to Northland, and with northeasterly flows between ridges of high pressure to the east and troughs over the Tasman Sea. Intense rainfalls also occur with thunderstorms. In Table 10, maximum short period rainfalls for periods of 10 minutes to 72 hours with calculated return periods are given for several
stations. Also listed in this table are the maximum rainfalls expected in 2, 5, 10, 20, and 50 years. Depth-duration frequency tables for Northland locations are available from NIWA’s High Intensity Rainfall Design System (HIRDS). HIRDS uses the index-frequency method to calculate rainfall return periods. For more information on methods and to use the tool, see www.hirds.niwa.co.nz.
20
Table 9. Average monthly rain days and wet days for Northland region. a: 0.1 mm rain day; b: 1 mm wet day.
Location Jan Feb Mar Apr May Jun Jul Aug Sep Oct Nov Dec Ann
Kaitaia Observatorya 11 10 12 15 18 19 22 21 18 16 14 13 191b 7 7 7 11 13 15 16 16 13 11 9 10 134
Kaeo Northlanda 9 10 11 12 15 16 17 18 15 12 11 10 167b 7 8 9 10 12 13 15 14 12 10 8 9 128
Kaikohe AWSa 12 12 15 18 21 21 23 23 18 18 15 14 217b 9 8 9 12 14 14 16 16 13 12 10 10 147
Opononia 11 10 12 15 19 20 21 22 18 16 15 12 198b 8 7 8 10 14 16 16 16 13 12 10 9 142
Rawene 2a 10 9 11 13 18 19 20 20 17 15 12 11 191b 7 7 9 10 14 16 17 17 14 12 10 9 154
Kerikeri EWSa 13 13 15 17 20 20 22 22 19 17 14 14 206b 8 8 9 11 12 13 15 14 13 11 9 9 134
Russella 9 9 10 12 14 15 17 16 14 12 10 10 156b 7 7 7 10 11 11 14 13 11 9 8 8 120
Waipoua Visitor Centrea 11 10 13 15 18 19 19 20 17 16 14 12 199b 9 8 10 11 16 16 17 16 15 14 11 10 163
Whangarei Aero AWSa 11 12 13 15 20 21 22 21 17 15 13 13 192b 8 8 9 10 13 14 15 15 13 11 9 9 133
Dargaville 2a 11 10 13 15 19 21 23 23 19 17 15 12 197b 8 7 9 11 14 16 17 17 15 11 9 8 142

21
Table 10. Maximum recorded short period rainfalls and calculated return periods
Location 10min 20min 30min 1hr 2hrs 6hrs 12hrs 24hrs 48hrs 72hrsKaitaia Observatory a 15 26 30 47 66 146 158 159 166 169
b 15 29 29 21 30 100+ 60 18 9 8c 10 15 18 27 36 56 73 97 114 126d 12 18 23 34 45 70 93 122 145 160e 14 21 27 40 53 82 108 143 169 187f 17 25 31 46 61 95 125 166 196 217g 20 30 37 56 74 115 152 201 238 263
Kerikeri EWS a 11 20 23 33 53 100 134 165 339 340b 4 7 6 5 9 13 9 4 64 43c 10 15 18 27 38 66 93 132 155 171d 13 18 23 33 47 83 117 166 195 215e 15 21 27 39 55 96 137 194 228 251f 17 24 31 45 64 111 158 225 264 291g 20 29 37 54 77 134 191 272 320 351
Whangarei Aero AWS a 12 18 24 34 43 75 95 125 162 207b 4 4 4 4 3 4 3 3 3 6c 11 16 20 28 39 63 86 117 143 160d 14 20 25 36 49 80 108 148 180 202e 16 23 29 42 57 93 126 172 210 235f 18 27 33 48 66 108 146 199 243 272g 22 32 40 59 80 130 177 241 293 329
Dargaville 2 a 12 18 26 25 43 69 94 122 129 133b 7 10 23 3 13 17 20 20 11 8c 9 13 16 23 29 43 55 71 86 96d 11 16 19 28 36 54 70 90 109 121e 13 18 22 32 41 63 81 105 127 142f 14 21 26 36 47 72 94 122 148 165g 17 25 30 43 57 87 114 149 180 200
a: highest fall recorded (mm)b: calculated return period of a (years)c: max fall calculated with ARI 2 years (mm)d: max fall calculated with ARI 5 years (mm)e: max fall calculated with ARI 10 years (mm)f: max fall calculated with ARI 20 years (mm)g: max fall calculated with ARI 50 years (mm)Recent extreme events in Northland
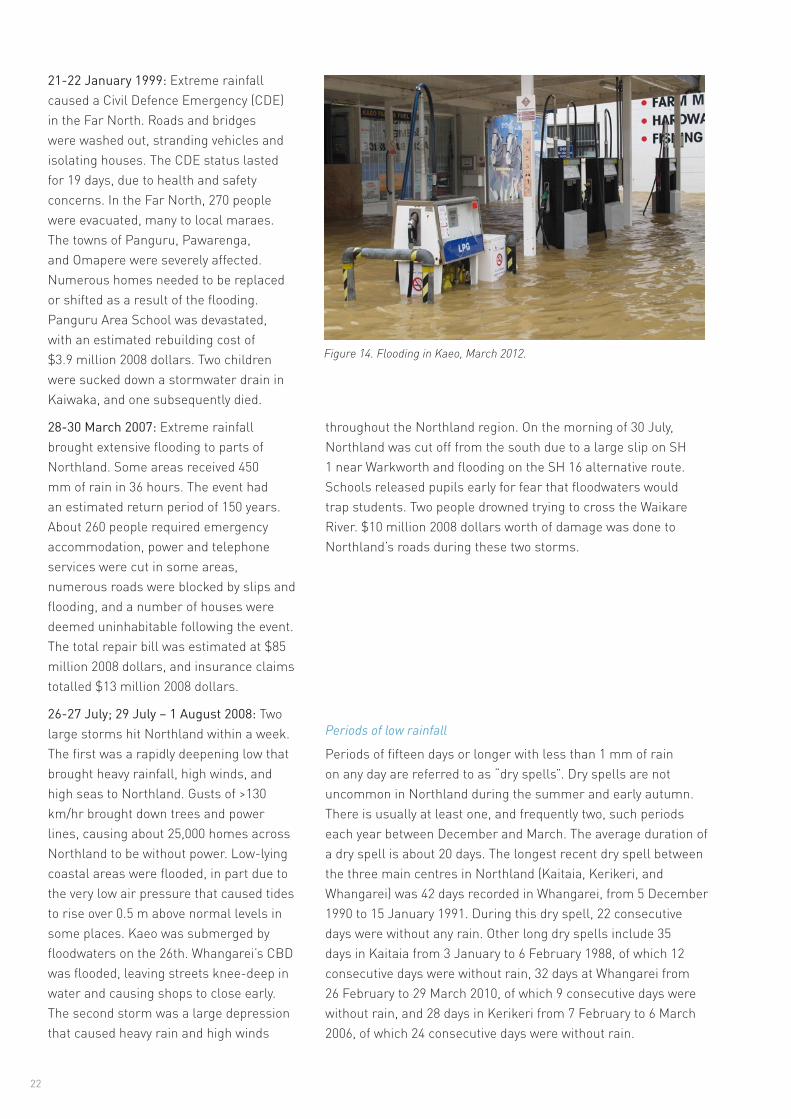
Northland has experienced numerous extreme weather events, with significant damage and disruption caused by flooding and high winds (e.g. Figure 14). The events listed below are some of the most severe events to have affected Northland in the past 30 years.
6-9 March 1988: Ex-tropical Cyclone Bola caused widespread flooding and wind damage throughout the North Island. In Northland, most of the region was without power and telephone. A total of $17 million 2008 dollars of damage was done to Northland’s horticulture and farming industries, and wind gusts up to 130 km/hr damaged 1500 ha of plantation forest. Up to 500 mm of rain fell in the 6 day period, causing widespread slipping and flooding, which closed roads and isolated people.
22
21-22 January 1999: Extreme rainfall caused a Civil Defence Emergency (CDE) in the Far North. Roads and bridges were washed out, stranding vehicles and isolating houses. The CDE status lasted for 19 days, due to health and safety concerns. In the Far North, 270 people were evacuated, many to local maraes. The towns of Panguru, Pawarenga, and Omapere were severely affected. Numerous homes needed to be replaced or shifted as a result of the flooding. Panguru Area School was devastated, with an estimated rebuilding cost of $3.9 million 2008 dollars. Two children were sucked down a stormwater drain in Kaiwaka, and one subsequently died.
28-30 March 2007: Extreme rainfall brought extensive flooding to parts of Northland. Some areas received 450 mm of rain in 36 hours. The event had an estimated return period of 150 years. About 260 people required emergency accommodation, power and telephone services were cut in some areas, numerous roads were blocked by slips and flooding, and a number of houses were deemed uninhabitable following the event. The total repair bill was estimated at $85 million 2008 dollars, and insurance claims totalled $13 million 2008 dollars.
26-27 July; 29 July – 1 August 2008: Two large storms hit Northland within a week. The first was a rapidly deepening low that brought heavy rainfall, high winds, and high seas to Northland. Gusts of >130 km/hr brought down trees and power lines, causing about 25,000 homes across Northland to be without power. Low-lying coastal areas were flooded, in part due to the very low air pressure that caused tides to rise over 0.5 m above normal levels in some places. Kaeo was submerged by floodwaters on the 26th. Whangarei’s CBD was flooded, leaving streets knee-deep in water and causing shops to close early. The second storm was a large depression that caused heavy rain and high winds
Periods of low rainfall
Periods of fifteen days or longer with less than 1 mm of rain on any day are referred to as “dry spells”. Dry spells are not uncommon in Northland during the summer and early autumn. There is usually at least one, and frequently two, such periods each year between December and March. The average duration of a dry spell is about 20 days. The longest recent dry spell between the three main centres in Northland (Kaitaia, Kerikeri, and Whangarei) was 42 days recorded in Whangarei, from 5 December 1990 to 15 January 1991. During this dry spell, 22 consecutive days were without any rain. Other long dry spells include 35 days in Kaitaia from 3 January to 6 February 1988, of which 12 consecutive days were without rain, 32 days at Whangarei from 26 February to 29 March 2010, of which 9 consecutive days were without rain, and 28 days in Kerikeri from 7 February to 6 March 2006, of which 24 consecutive days were without rain.
Figure 14. Flooding in Kaeo, March 2012.
throughout the Northland region. On the morning of 30 July, Northland was cut off from the south due to a large slip on SH 1 near Warkworth and flooding on the SH 16 alternative route. Schools released pupils early for fear that floodwaters would trap students. Two people drowned trying to cross the Waikare River. $10 million 2008 dollars worth of damage was done to Northland’s roads during these two storms.
23
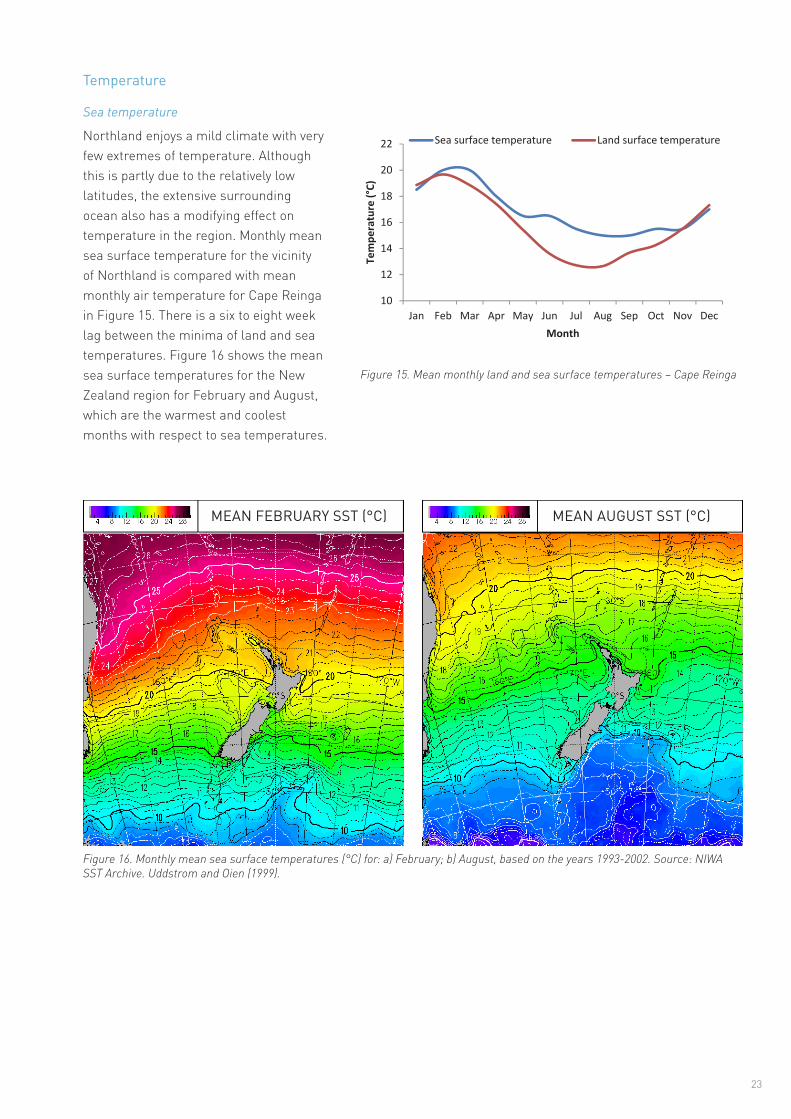
Figure 15. Mean monthly land and sea surface temperatures – Cape Reinga
Figure 16. Monthly mean sea surface temperatures (°C) for: a) February; b) August, based on the years 1993-2002. Source: NIWA SST Archive. Uddstrom and Oien (1999).
Temperature
Sea temperature
Northland enjoys a mild climate with very few extremes of temperature. Although this is partly due to the relatively low latitudes, the extensive surrounding ocean also has a modifying effect on temperature in the region. Monthly mean sea surface temperature for the vicinity of Northland is compared with mean monthly air temperature for Cape Reinga in Figure 15. There is a six to eight week lag between the minima of land and sea temperatures. Figure 16 shows the mean sea surface temperatures for the New Zealand region for February and August, which are the warmest and coolest months with respect to sea temperatures.
10
12
14
16
18
20
22
Jan Feb Mar Apr May Jun Jul Aug Sep Oct Nov Dec
Tem
pera
ture
(°C)
Month
Sea surface temperature Land surface temperature
MEAN FEBRUARY SST (°C) MEAN AUGUST SST (°C)
24
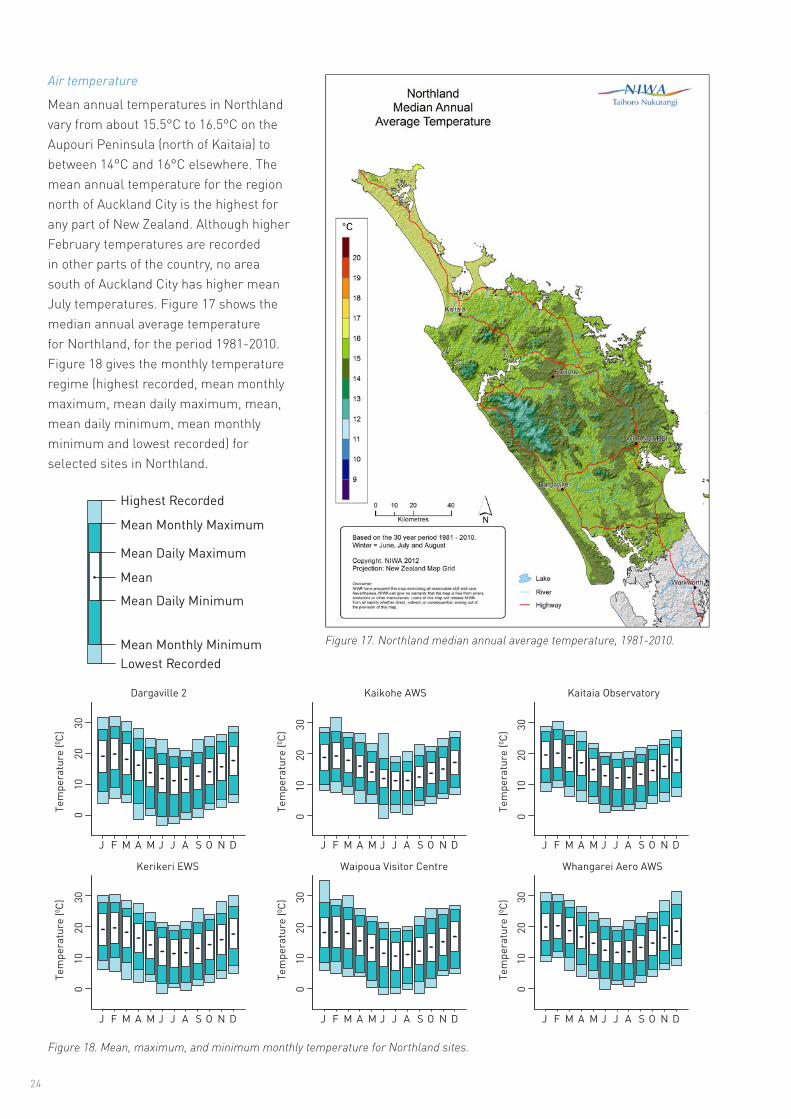
Figure 18. Mean, maximum, and minimum monthly temperature for Northland sites.
Air temperature
Mean annual temperatures in Northland vary from about 15.5°C to 16.5°C on the Aupouri Peninsula (north of Kaitaia) to between 14°C and 16°C elsewhere. The mean annual temperature for the region north of Auckland City is the highest for any part of New Zealand. Although higher February temperatures are recorded in other parts of the country, no area south of Auckland City has higher mean July temperatures. Figure 17 shows the median annual average temperature for Northland, for the period 1981-2010. Figure 18 gives the monthly temperature regime (highest recorded, mean monthly maximum, mean daily maximum, mean, mean daily minimum, mean monthly minimum and lowest recorded) for selected sites in Northland.
Figure 17. Northland median annual average temperature, 1981-2010.
Dargaville 2
Tem
pera
ture
(0 C)
Tem
pera
ture
(0 C)
Tem
pera
ture
(0 C)
Tem
pera
ture
(0 C)
Tem
pera
ture
(0 C)
Tem
pera
ture
(0 C)
3020
100
3020
100
3020
100
3020
100
3020
100
3020
100
J F M A M J J A S O DN J F M A M J J A S O DN
J F M A M J J A S O DN J F M A M J J A S O DN J F M A M J J A S O DN
J F M A M J J A S O DN
Kaikohe AWS
Kaitaia Observatory
Kerikeri EWS Waipoua Visitor Centre
Whangarei Aero AWS
Highest Recorded
Mean
Mean Daily Maximum
Mean Daily Minimum
Mean Monthly Minimum
Mean Monthly Maximum
Lowest Recorded

25
The mean annual temperature range for Northland is small, averaging 8.1°C. Table 11 shows the average daily temperature range for each month for a number of sites in Northland. Cape Reinga has the smallest temperature range for any station in the region and Kerikeri one of the greatest.
Diurnal temperature variations are also relatively minor. Table 12 and Figure 19 show mean hourly temperatures for Kaikohe for January and July.
Table 11. Average daily temperature range (Tmax – Tmin,°C).
Table 12. Mean hourly temperature at Kaikohe in January and July (°C).
Figure 19. Mean hourly temperature at Kaikohe, January and July.
Location Jan Feb Mar Apr May Jun Jul Aug Sep Oct Nov DecCape Reinga 5.9 5.9 5.7 5.3 4.4 4.2 4.2 4.6 4.9 5.2 5.5 5.4Kaitaia Observatory 8.8 9.1 8.8 8.0 7.4 7.2 7.1 7.2 7.4 7.4 7.8 8.2Kerikeri EWS 10.2 9.9 10.0 9.3 8.8 9.1 9.0 9.1 9.4 9.5 9.7 9.8Waipoua Visitor Centre 9.7 10.0 9.4 9.4 8.7 8.8 8.9 8.4 8.7 8.9 8.5 9.6Whangarei Aero AWS 8.7 8.2 8.3 7.7 7.1 7.2 7.3 7.4 8.0 7.9 8.2 8.5Dargaville 2 10.1 10.0 10.0 9.4 9.2 8.8 8.7 8.3 8.5 8.2 8.7 9.4
hrs 00 01 02 03 04 05 06 07 08 09 10 11January 15.7 15.5 15.3 15.2 15.1 15.0 15.1 16.2 17.9 18.8 19.7 20.6July 9.5 9.5 9.4 9.3 9.2 9.2 9.1 9.1 9.2 10.2 11.3 12.1
hrs 12 13 14 15 16 17 18 19 20 21 22 23January 21.2 21.6 21.8 21.6 21.3 20.5 19.7 18.6 17.3 16.7 16.3 16.0July 12.6 12.8 12.9 12.8 12.4 11.6 10.7 10.3 10.0 9.9 9.8 9.7
Extreme temperatures are also moderate. The highest temperature recorded in Northland was 35.0°C at Waipoua Forest on 30 January 1991, and the lowest -5.6°C at Glenbervie Forest on 31 July 1957. These compare with national extremes of 42.4°C and -25.6°C.
0
5
10
15
20
25
00 01 02 03 04 05 06 07 08 09 10 11 12 13 14 15 16 17 18 19 20 21 22 23
Mea
n ho
urly
tem
pera
ture
(°C)
Time
January July

26
Earth Temperatures
Earth (soil) temperatures are measured once daily at 9 am at several Northland locations. Table 13 lists mean monthly earth temperatures covering the period 1981-2010 for a number of standard depths.
Although earth temperatures are particularly sensitive to specific site conditions (aspect, elevation, soil colour and type, etc.) no great spatial variations in earth temperatures are apparent in Northland. There is also some response to elevation at all depths. Earth temperatures at Kaikohe (204 m above sea level), the highest station, are approximately 2°C cooler at all depths than those at Kerikeri (79 m above sea level). Fluctuations in earth temperatures are less than air temperatures due to the slower heating and cooling rates of the soil. Highest temperatures are found in January or February and lowest in July or August. Figure 20 shows how earth temperatures change throughout the year for different depths at Kaitaia. The temperature cycle for 100 cm depth is more dampened than shallower depths.
Table 13. Mean 9am earth temperatures at different Northland locations (°C).
Figure 20. Average monthly 9 am earth temperatures for different depths at Kaitaia Observatory (air temperature for Kaitaia EWS, 140 m from Observatory site).
Location Jan Feb Mar Apr May Jun Jul Aug Sep Oct Nov Dec AnnKaitaia Observatory (85m)
10cm 20.0 20.1 18.4 16.2 13.6 11.6 10.6 10.7 12.3 14.0 16.0 18.5 15.220cm 21.3 21.6 19.9 17.6 15.0 12.9 11.8 12.0 13.4 15.2 17.2 19.6 16.530cm 21.3 21.7 20.3 18.1 15.7 13.6 12.5 12.6 13.9 15.5 17.5 19.7 16.9
100cm 20.1 20.9 20.5 19.2 17.5 15.6 14.2 13.8 14.4 15.6 17.1 18.7 17.4
Kaikohe AWS (204m) 10cm 18.1 18.4 16.9 15.3 13.4 11.1 9.9 10.0 11.5 12.9 14.8 17.1 14.120cm 19.3 19.7 18.2 16.3 14.4 12.1 11.0 11.1 12.3 13.8 15.7 17.9 15.250cm 19.5 20.1 19.1 17.5 15.5 13.4 12.0 12.2 13.1 14.3 16.1 18.1 16.0
100cm 18.7 19.5 19.2 18.2 16.8 15.2 13.8 13.3 13.7 14.6 15.8 17.3 16.3
Kerikeri EWS (79m) 10cm 20.9 20.6 18.6 16.0 13.2 10.7 9.5 10.3 12.5 14.8 17.1 19.6 15.220cm 22.4 22.4 20.4 17.7 14.8 12.4 11.1 11.8 13.7 16.0 18.5 20.9 16.830cm 22.7 22.7 21.0 18.4 15.7 13.3 11.9 12.6 14.3 16.7 19.1 21.3 17.2
100cm 20.0 20.9 20.5 19.4 17.7 15.7 14.1 13.7 14.2 15.5 17.0 18.4 17.1
Dargaville 2 (15m) 10cm 19.5 19.2 18.0 15.2 12.5 10.8 9.7 10.4 12.1 14.2 16.5 18.7 14.720cm 20.1 19.9 18.4 15.7 13.1 11.5 10.3 10.9 12.3 14.2 17.0 19.2 15.230cm 20.9 20.6 19.1 16.5 13.9 12.2 10.9 11.4 12.8 14.7 17.5 19.7 15.8
0
5
10
15
20
25
Jan Feb Mar Apr May Jun Jul Aug Sep Oct Nov Dec
Tem
pera
ture
(°C)
Month
10 cm 20 cm 30 cm 100 cm Air temp

27
Table 14. Occurrences of frosts and grass minimum temperatures in Northland.
Frosts
Frost is a local phenomenon and its frequency of occurrence can vary widely over very small areas. Areas most likely to be subjected to frost are flat areas, where air is not able to drain away on calm nights, and valleys, where cold air is likely to drift from higher areas.
There are two types of frost recorded. Air frosts, when air temperature measured in a screen by a thermometer 1.3 m above the ground falls below 0°C, are rare in most parts of Northland. Ground frosts are recorded when the air temperature 2.5 cm above a
Location Jan Feb Mar Apr May Jun Jul Aug Sep Oct Nov Dec AnnKaitaia Observatory a 12.7 13.1 11.6 10.4 8.7 6.9 6.1 6.1 7.3 8.4 9.5 11.4 9.4
b 2.2 4.4 2.5 1.3 0.6 -1.9 -3.4 -1.9 -1.0 0.0 0.3 2.1 -3.4c 0.0 0.0 0.0 0.0 0.0 0.1 0.2 0.2 0.0 0.0 0.0 0.0 0.5d 0.0 0.0 0.0 0.0 0.0 0.0 0.0 0.0 0.0 0.0 0.0 0.0 0.0
Kerikeri EWS a 11.5 12.2 10.7 8.8 6.7 4.4 3.7 3.8 5.3 6.6 8.3 10.1 7.6b 0.6 1.8 -0.5 -1.5 -2.9 -6.8 -5.0 -3.5 -2.2 -2.1 -0.2 -1.1 -6.8c 0.0 0.0 0.0 0.0 0.2 3.0 3.8 2.7 0.9 0.3 0.0 0.0 10.7d 0.0 0.0 0.0 0.0 0.0 0.3 0.0 0.1 0.0 0.0 0.0 0.0 0.4
Waipoua Visitor Centre
a 11.5 11.2 10.9 8.6 6.6 4.9 3.9 4.2 5.1 6.4 8.6 9.7 7.7b 4.6 2.0 0.5 0.3 -1.0 -5.2 -4.5 -3.0 -3.0 0.0 1.4 1.0 -5.2c 0.0 0.0 0.0 0.0 0.1 1.8 3.9 1.6 1.0 0.0 0.0 0.0 11.6d 0.0 0.0 0.0 0.0 0.0 0.5 1.3 0.1 0.1 0.0 0.0 0.0 1.7
Dargaville 2 a 11.6 12.3 10.5 9.0 7.0 5.4 4.7 5.0 5.9 7.7 9.2 10.5 8.2b 1.0 1.6 0.1 -4.2 -5.3 -7.2 -6.0 -4.2 -5.0 -1.0 0.0 -1.0 -7.2c 0.0 0.0 0.0 0.3 0.7 2.3 3.9 1.6 1.8 0.1 0.0 0.1 14.6d 0.0 0.0 0.0 0.1 0.0 1.4 1.7 0.4 0.1 0.0 0.0 0.0 4.7
clipped grass surface falls to -1.0°C or lower. Ground frosts can be quite frequent in Northland, especially in sheltered inland areas. However many recorded ground frosts are restricted to a very shallow layer just above the surface and do not seriously affect plant life. Table 14 lists for selected sites the mean daily grass minimum and extreme grass minimum temperatures and the average number of days each month with ground and air frosts, for the period 1981-2010. Data on air temperatures (mean daily, monthly minima and extreme minima) can be obtained from Figure 18.
a: mean daily grass minimum (°C)b: lowest grass minimum recorded (°C)c: average number of ground frosts per monthd: average number of air frosts per month
Highest Recorded
Mean
Lowest Recorded
28
Sunshine and Solar Radiation
Sunshine
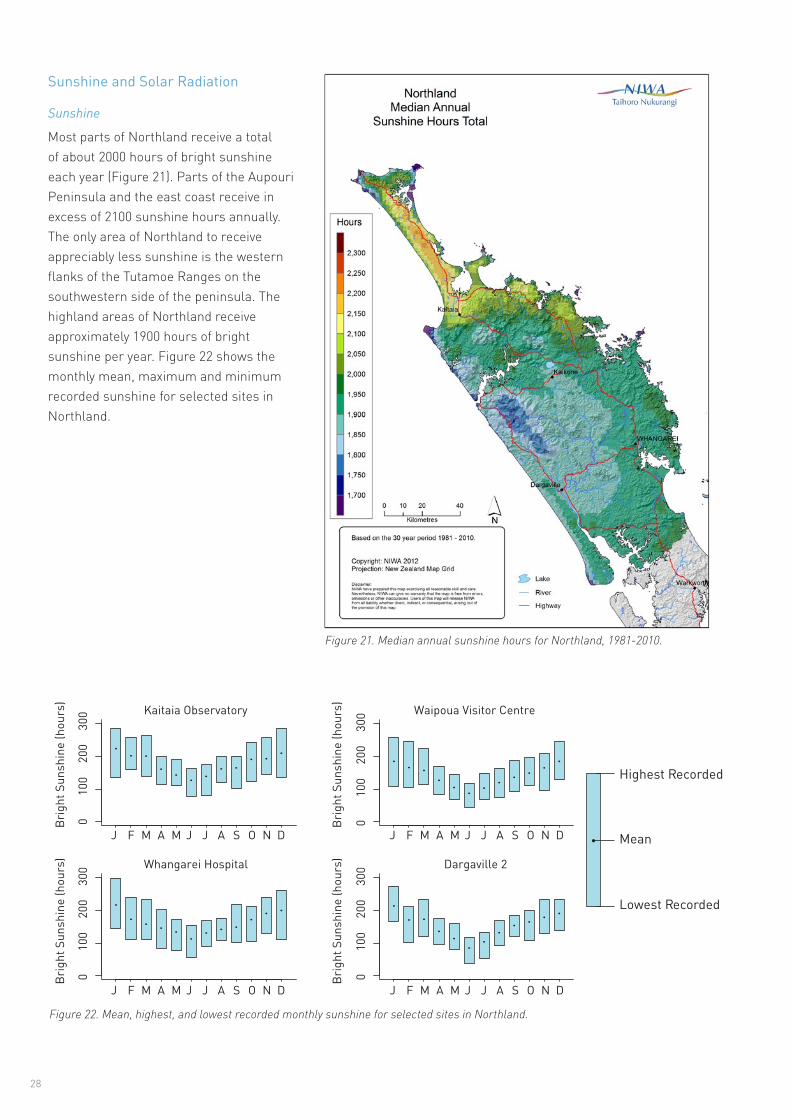
Most parts of Northland receive a total of about 2000 hours of bright sunshine each year (Figure 21). Parts of the Aupouri Peninsula and the east coast receive in excess of 2100 sunshine hours annually. The only area of Northland to receive appreciably less sunshine is the western flanks of the Tutamoe Ranges on the southwestern side of the peninsula. The highland areas of Northland receive approximately 1900 hours of bright sunshine per year. Figure 22 shows the monthly mean, maximum and minimum recorded sunshine for selected sites in Northland.
Figure 22. Mean, highest, and lowest recorded monthly sunshine for selected sites in Northland.
Kaitaia Observatory
010
020
030
0
J F M A M J J A S O N D J F M A M J J A S O N D
J F M A M J J A S O N D J F M A M J J A S O N D
Waipoua Visitor Centre
010
020
030
0
Whangarei Hospital
010
020
030
0 Dargaville 2
Brig
ht S
unsh
ine
(hou
rs)
Brig
ht S
unsh
ine
(hou
rs)
Brig
ht S
unsh
ine
(hou
rs)
Brig
ht S
unsh
ine
(hou
rs)
010
020
030
0
Figure 21. Median annual sunshine hours for Northland, 1981-2010.

29
Table 15. Mean daily global solar radiation (MJ/m2/day).
Table 16. Mean daily maximum UV Index at Leigh and Lauder.
Solar radiation
Solar radiation records are available for a number of sites in Northland. Solar radiation is presented for Kaitaia, Kaikohe, and Whangarei for the 1981-2010 normal period. Insolation is at a maximum in December and January and a minimum in June. Table 15 shows mean daily solar radiation for each month for these three stations.
Location Jan Feb Mar Apr May Jun Jul Aug Sep Oct Nov Dec AnnKaitaia Observatory 21.7 19.4 16.4 11.6 8.5 7.0 7.7 10.1 13.5 16.9 19.9 22.1 14.5Kaikohe AWS 20.5 18.2 15.3 11.0 8.2 7.1 7.5 9.8 13.3 16.5 19.2 20.6 13.9Whangarei Aero AWS 21.4 18.2 15.5 11.1 8.2 7.0 7.4 10.1 13.6 17.0 19.6 20.4 14.1
Location Jan Feb Mar Apr May Jun Jul Aug Sep Oct Nov Dec AnnLeigh 12.2 10.7 8.4 5.1 2.8 1.8 1.9 3.0 4.8 7.2 9.8 11.5 6.6Lauder 10.4 8.9 6.0 2.9 1.3 0.8 0.9 1.7 3.3 5.2 7.9 10.0 4.9
UV (Ultra-violet radiation)
Ultra-violet radiation (UV) is not recorded at any stations in the Northland region. Table 16 and Figure 23 show the mean monthly UV Index at Leigh, the closest site to the Northland region, compared with Lauder, a site in Central Otago in the South Island. Leigh records higher UV levels than Lauder throughout the year due to Leigh’s more northerly location, although at both sites, summer months record significantly higher UV levels than winter months. Figure 24 shows an example of a UV forecast for Whangarei, and indicates the levels of UV and times of the day where sun protection is required.
Figure 23. Mean monthly maximum UV Index at Leigh and Lauder.
0
2
4
6
8
10
12
14
Jan Feb Mar Apr May Jun Jul Aug Sep Oct Nov Dec
UV
Inde
x
Month
Leigh Lauder

30
Figure 24. UV Index forecast for Whangarei, January and July. Source: http://www.niwa.co.nz/our-services/online-services/uv-ozone
Table 17. Average number of days each year with thunder, fog, and hail, from all available data.
FogThe frequency of fog in Northland is variable, ranging from an average of 47 days with fog per year at Cape Reinga and Dargaville to only twice per year at Glenbervie Forest. Although fog can occur at any time of the year it is recorded most frequently between March and August.
Radiation fogs are the most frequent and these tend to form under anticyclonic conditions when skies are clear and there is little wind. Such fogs usually clear by 9 am.
Widespread sea fog and low stratus is also recorded at times. These can be advected over land and occur particularly during humid northeast airstreams on the east coast, or humid northwestern airstreams on the western coast. This type of fog tends to be more persistent than radiation fog but even so seldom stays for longer than one day. The average number of days with fog for selected stations is listed in Table 17.
Location Thunder Fog HailCape Reinga 4 47 1Kaitaia Observatory 15 24 4Kerikeri EWS 6 5 0Waipoua Visitor Centre 6 3 5Glenbervie Forest 3 2 1Whangarei aero 2 11 0Dargaville 2 4 47 1
Severe convective storms
Thunderstorms
Thunderstorms occur throughout the year but days of thunder are most frequent between May and August when cold, unstable air masses cross the region. Western and central areas have more thunderstorm days than areas on the eastern side of the peninsula. Average occurrences vary from about 15 each year at Kaitaia to 2 thunderstorms per year at Whangarei. The average number of days with thunderstorms each year for selected stations is listed in Table 17. It is highly likely that not all thunderstorm episodes are detected.
Hourly weather observations from Kaitaia Airport show a diurnal variation in thunderstorm occurrence. In summer, there is a pronounced maximum in the afternoon, while in winter most thunderstorms occur during the night and morning (Revell, 1984). This type of diurnal variation pattern occurs over much of northern Northland. Over the rest of the region thunderstorms are most frequent during the afternoon in all four seasons.
Hail
Hailstorms occur on about two days each year in Northland, although this varies from an average of five days a year at Waipoua Forest to less than once in five years at Whangarei. As with thunderstorms, many hail storms could also pass unnoticed. Days with hail are

31
Table 18. Generated wave heights associated with specific wind speeds. Assumes a fetch length of 500 km with unlimited duration.
most frequently recorded between May and October when ninety percent of hailstorms in the region occur, and are least likely to occur between January and April. The average number of hailstorms reported each year is listed in Table 17.
Tornadoes
Tornadoes in New Zealand are much smaller than those that occur in the USA, with paths typically in the order of ten to thirty metres wide and between one and five kilometres in length. They are reported infrequently in Northland, where only seven damage-causing tornadoes were noted during the twelve year period from 2001 to 2012. However, because of their local and highly transient nature, many probably pass unnoticed. Tornadoes occasionally cause damage when they travel through urban areas, such as in Kaitaia on 4 July 2009. On that occasion a small tornado approached Kaitaia from the west coast during a period of intense frontal activity. The tornado travelled rapidly through the southern part of the town, removing roof tiles and smashing windows of about 20 houses, as well as the hospital. Many trees were also uprooted, some crushing cars.
Sea swell and wavesIn enclosed waters such as the Whangarei, Kaipara, and Hokianga Harbours it is unlikely that the wind generated waves ever exceed two metres. This is because the winds to generate such waves would need to be either a steady wind of 70 km/hr or more (a very rare event in Northland), or would require a much longer fetch than the enclosed harbours provide.
There is a known relationship between steady wind speed and wave heights over the open sea. The most probable wave heights for a given wind speed over a typical fetch length in New Zealand coastal waters of about 500 km are given in Table 18.
Much of the swell that affects the west coast of New Zealand originates in the ocean to the south of Australia.
On the west coast of Northland, the most frequent swell direction is from the southwest, occurring nearly 40 percent of the time (Gorman et al., 2003). The frequency of swells of less than one metre is about 20 percent, while swells over two metres occur
Wind speed (km/hr) Associated wave height (m)10 0.520 130 240 350 475 7
100 11125 13+
approximately 35 percent of the time. Heavy southwest swells are particularly noticeable in winter and spring.
On the east coast of Northland, swells from an easterly or northeasterly direction tend to predominate. These can originate from tropical cyclones well to the north of New Zealand or from anticyclones far to the east. Of all swells observed on the eastern coast the frequency of those less than one metre is about 40 percent, while for those greater than two metres is 8 percent (Gorman et al., 2003).

32

DERIVED CLIMATOLOGICAL PARAMETERSApart from elements such as temperature and rainfall which can be measured directly, it has been found that parameters computed from several elements have some important uses especially in industry. Parameters which define the overall suitability of the climate for agriculture, horticulture, architectural and structural designs, and contracting, etc., are degree-days (thermal time), evapotranspiration (leading to soil moisture balance), rainfall extremes, and relative humidity. Some of these parameters and their uses are discussed in the following paragraphs.
Vapour pressure and relative humidityVapour pressure and relative humidity are the two parameters most frequently used to indicate moisture levels in the atmosphere. Both are calculated from simultaneous dry and wet bulb thermometer readings, although a hygrograph may be used to obtain continuous humidity readings.
Location Jan Feb Mar Apr May Jun Jul Aug Sep Oct Nov Dec AnnCape Reinga 17.5 18.2 16.9 15.9 14.0 12.4 11.9 11.6 12.7 12.6 13.9 16.3 14.5Kaitaia Observatory 18.1 18.3 16.9 15.8 14.0 12.5 11.8 11.9 13.0 13.5 14.5 16.8 14.8Kaikohe AWS 17.4 18.0 16.5 15.3 13.7 11.9 11.3 11.4 12.3 13.1 14.1 15.9 14.2Kerikeri Airport 17.3 17.6 16.6 15.1 13.3 11.6 10.9 11.3 12.3 12.7 14.0 16.0 14.0Whangarei Airport 17.8 18.4 17.1 15.9 14.1 12.1 11.5 11.5 12.6 13.1 14.1 16.2 14.5Dargaville 2 18.5 19.0 17.6 15.8 13.4 12.0 11.5 11.6 12.7 13.8 15.0 17.0 14.8
Vapour pressure is the part of total air pressure that results from the presence of water vapour in the atmosphere. It varies greatly with air masses from different sources, being greatest in warm air masses that have tropical origins and lowest in cold, polar-derived air masses. Vapour pressure can be important in determining the physiological response of organisms to the environment (very dry air, especially if there is a pre-existing soil moisture deficit, can cause or increase wilting in plants). Average 9 am vapour pressures for several stations are given in Table 19.
Relative humidity is high in all seasons throughout the region due to the influence of the surrounding sea and the lack of any large mountain masses. Stations on the western side of the peninsula and those very close to the sea (e.g. Cape Reinga) tend to have slightly higher humidity than those on the east or inland. Table 20 gives the average relative humidity at 9 am for selected stations in Northland.
Location Jan Feb Mar Apr May Jun Jul Aug Sep Oct Nov Dec AnnCape Reinga 83 84 81 81 81 80 82 81 82 79 81 84 82Kaitaia Observatory 87 88 87 87 89 90 90 88 87 86 84 85 87Kaikohe AWS 86 88 87 88 89 89 89 88 85 86 84 83 87Kerikeri Airport 86 89 88 88 90 91 91 89 86 83 83 83 87Whangarei Airport 80 84 84 86 88 89 89 85 81 81 77 78 83Dargaville 2 83 87 85 85 87 89 89 86 83 82 81 80 85
33
Table 19. Mean monthly/annual 9 am vapour pressure (hPa) for selected Northland stations.
Table 20. Mean monthly/annual 9 am relative humidity (%) for selected Northland stations.

Evapotranspiration and soil water balanceEvapotranspiration is the process where water held in the soil is gradually released to the atmosphere through a combination of direct evaporation and transpiration from plants. A water balance can be calculated by using daily rainfalls and by assuming that the soil can hold a fixed amount of water with actual evapotranspiration continuing at the maximum rate until moisture depletion of the soil occurs. The calculation of water balance begins after a long dry spell when it is known that all available soil moisture is depleted or after a period of very heavy rainfall when the soil is completely saturated. Daily calculations are then made of moisture lost through evapotranspiration or replaced through precipitation. If the available soil water becomes insufficient to maintain evapotranspiration then a soil moisture
34
Location Jan Feb Mar Apr May Jun Jul Aug Sep Oct Nov Dec AnnKaitaia Observatory DE 74 55 37 15 1 0 0 0 0 1 24 48 254
ND 15 12 11 7 1 0 0 0 0 0 6 11 62RO 7 16 5 16 45 105 129 92 62 21 6 6 510NR 0 0 0 1 4 11 13 11 6 2 1 0 52
Kaeo Northland DE 62 39 25 10 1 0 0 0 0 0 21 44 202ND 13 10 8 5 1 0 0 0 0 0 5 10 52RO 15 18 31 50 80 136 167 129 92 38 22 9 787NR 1 0 1 2 6 10 12 10 6 3 1 1 53
Rawene 2 DE 60 51 25 10 0 0 0 0 0 0 13 38 198ND 14 13 8 5 0 0 0 0 0 0 4 9 54RO 7 9 9 16 51 113 125 100 57 22 11 6 527NR 0 0 0 2 5 13 15 13 7 3 1 1 61
Kerikeri EWS DE 50 31 15 7 0 0 0 0 0 0 14 34 151ND 11 8 5 4 0 0 0 0 0 0 4 8 40RO 27 25 44 62 97 153 161 145 105 55 32 19 925NR 1 1 1 3 6 11 13 10 7 4 2 1 60
Whangarei aero DE 75 51 29 12 1 0 0 0 0 3 38 61 268ND 16 12 9 6 1 0 0 0 0 1 9 13 67RO 3 0 34 23 48 79 157 80 52 11 15 11 514NR 0 0 1 2 5 10 13 9 5 1 1 1 47
DE is the average amount of soil moisture deficit in mmND is the average number of days per month where a soil moisture deficit occursRO is the average amount of runoff in mmNR is the average number of days per month where runoff occurs
Table 21. Mean monthly/annual water balance summary for a soil moisture capacity of 150 mm.

deficit occurs and irrigation becomes necessary to maintain plant growth. Runoff occurs when the rainfall exceeds the soil moisture capacity (assumed to be 150 mm for most New Zealand soils). Mean monthly and annual water balance values are given in Table 21, for a number of sites in Northland.
It can be seen from this table that Northland has on average about 55 days between November and April when there is insufficient soil moisture to maintain plant growth without irrigation. There is adequate moisture available to maintain plant growth between May and October. Figure 25 shows region-wide variability in days of soil moisture deficit per year.
Potential evapotranspiration (PET) has been calculated for Kaitaia, Kaikohe, and Whangarei, using the Penman method (Penman, 1948). The monthly mean, minimum, and maximum PET values are listed in Table 22.
35
Table 22. Penman calculated maximum, mean, and minimum monthly potential evapotranspiration (mm), as well as total mean annual PET.
Location Jan Feb Mar Apr May Jun Jul Aug Sep Oct Nov Dec AnnKaitaia Observatory Max 174 134 122 81 53 38 44 59 77 107 127 156
Mean 145 120 105 67 46 32 38 52 70 98 116 136 1025Min 125 108 96 58 36 28 34 48 60 87 104 126
Kaikohe AWS Max 152 115 103 67 40 30 33 47 67 109 123 158Mean 125 102 89 54 35 25 28 41 62 87 104 123 877Min 93 81 72 49 32 20 22 33 53 71 86 102
Whangarei Aero AWS Max 175 127 121 68 42 31 40 52 76 119 129 167Mean 143 114 97 58 38 27 31 46 67 99 121 135 977Min 124 94 83 53 35 23 27 40 60 81 109 111
Figure 25. Northland median annual days of soil moisture deficit, 1981-2010.

36
Table 23. Average growing degree-day totals above base 5°C and 10°C.
Degree-day totalsThe departure of mean daily temperature above a base temperature, which has been found to be critical to the growth or development of a particular plant, is a measure of the plant’s development on that day. The sum of these departures then relates to the maturity or harvestable state of the crop. Thus, as the plant grows, updated estimates of harvest time can be made. These estimates have been found to be very valuable for a variety of crops with different base temperatures. Degree-day totals indicate the overall effects of temperature for a specified period, and can be applied to agricultural and horticultural production. Growing degree-days express the sum of daily temperatures above a selected base temperature that represent a threshold of plant growth. Table 23 lists the monthly totals of growing degree-day totals above base temperatures of five and ten degrees Celsius.
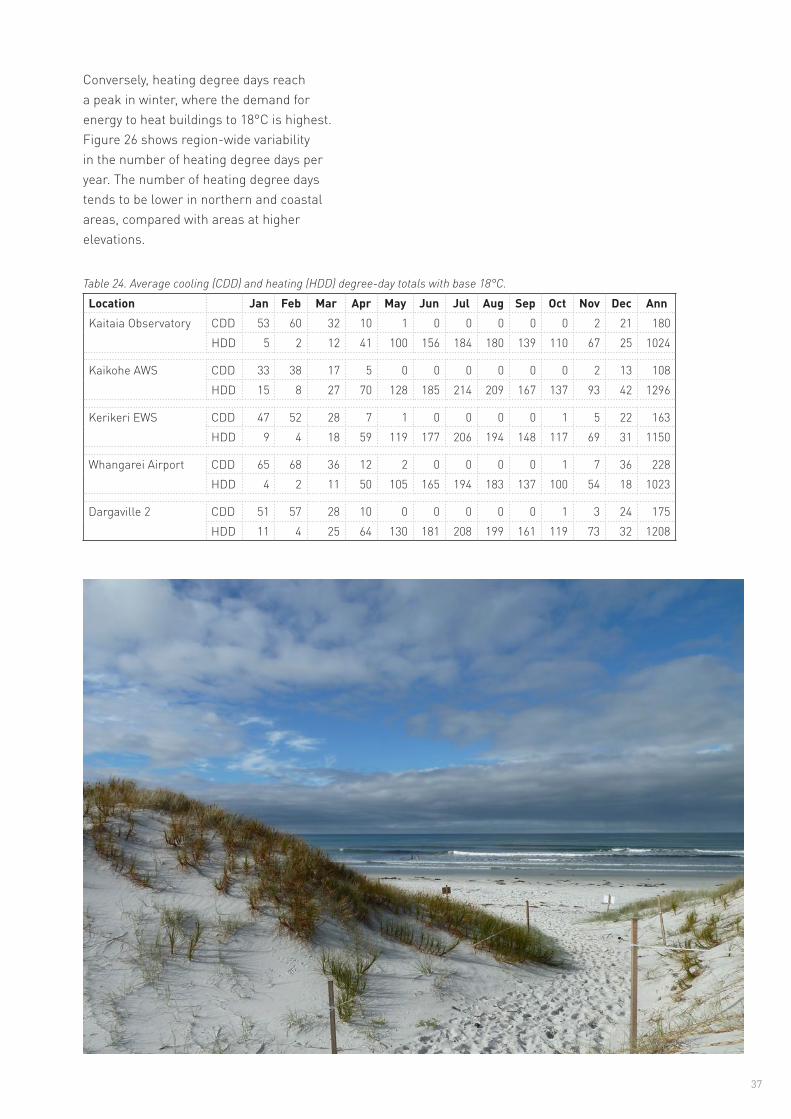
Cooling and heating degree days are measurements that reflect the amount of energy that is required to cool or heat buildings to a comfortable base temperature, which in this case is 18°C.
Location Jan Feb Mar Apr May Jun Jul Aug Sep Oct Nov Dec AnnKaitaia Observatory 5°C 450 425 423 359 305 234 219 223 251 293 325 399 3904
10°C 295 284 268 209 150 86 67 70 101 138 175 244 2086
Kaikohe AWS 5°C 420 398 393 325 276 205 189 194 224 266 298 374 356110°C 265 256 238 175 121 61 44 47 76 111 148 219 1761
Kerikeri EWS 5°C 440 415 414 339 285 213 197 209 243 286 325 394 376210°C 285 274 259 189 131 69 50 59 94 131 175 239 1956
Whangarei Airport 5°C 464 433 428 352 300 225 209 220 253 304 343 422 395310°C 309 292 273 202 145 80 61 69 104 149 193 267 2143
Dargaville 2 5°C 337 362 348 336 273 209 195 204 229 284 321 395 349310°C 289 278 251 186 120 69 54 56 82 129 171 240 1925
Figure 26. Median annual heating degree days for Northland, 1981-2010.
37
Table 24. Average cooling (CDD) and heating (HDD) degree-day totals with base 18°C.
Conversely, heating degree days reach a peak in winter, where the demand for energy to heat buildings to 18°C is highest. Figure 26 shows region-wide variability in the number of heating degree days per year. The number of heating degree days tends to be lower in northern and coastal areas, compared with areas at higher elevations.
Location Jan Feb Mar Apr May Jun Jul Aug Sep Oct Nov Dec AnnKaitaia Observatory CDD 53 60 32 10 1 0 0 0 0 0 2 21 180
HDD 5 2 12 41 100 156 184 180 139 110 67 25 1024
Kaikohe AWS CDD 33 38 17 5 0 0 0 0 0 0 2 13 108HDD 15 8 27 70 128 185 214 209 167 137 93 42 1296
Kerikeri EWS CDD 47 52 28 7 1 0 0 0 0 1 5 22 163HDD 9 4 18 59 119 177 206 194 148 117 69 31 1150
Whangarei Airport CDD 65 68 36 12 2 0 0 0 0 1 7 36 228HDD 4 2 11 50 105 165 194 183 137 100 54 18 1023
Dargaville 2 CDD 51 57 28 10 0 0 0 0 0 1 3 24 175HDD 11 4 25 64 130 181 208 199 161 119 73 32 1208

38
ACKNOWLEDGEMENTSThe following people from NIWA are acknowledged for their assistance in preparing this publication: Dr Andrew Tait, James Sturman, Dr Elizabeth Somervell, Dr Michael Uddstrom, Dr Richard Gorman, Georgina Griffiths, Dr Andrew Lorrey and Erika Mackay.
Photo credits:Contents page, page 7, 34, 37, Petra Chappell, NIWAPage 6, 8, 14, 29, 31, 32, Erika Mackay, NIWAPage 13, Dave Allen, NIWAPage 22, 27, APN Holdings [APN)
REFERENCESNIWA databases used:
The National Climate Database cliflo.niwa.co.nz
HIRDS (High Intensity Rainfall Design System) hirds.niwa.co.nz
New Zealand Historic Weather Events Catalogue hwe.niwa.co.nz
NIWA Sea Surface Temperature Database
Non-NIWA databases used:Southwest Pacific Enhanced Archive of Tropical Cyclones (SPEArTC) (Diamond et al., 2012)
References:
DIAMOND, H. J., LORREY, A. M., KNAPP, K. R. & LEVINSON, D. H. 2012. Development of an enhanced tropical cyclone tracks database for the southwest Pacific from 1840 to 2010. International Journal of Climatology, 32: 2240-2250. http://apdrc.soest.hawaii.edu/projects/speartc/
GORMAN, R. M., BRYAN, K. R. & LAING, A. K. 2003. Wave hindcast for the New Zealand region: Nearshore validation and coastal wave climate. New Zealand Journal of Marine and Freshwater Research, 37, 567-588.
PENMAN, H. L. 1948. Natural evaporation from open water, bare soil, and grass. Proceedings of the Royal Society of London A, 193, 120-145.
REVELL, C. G. 1984. Annual and diurnal variation of thunderstorms in New Zealand and outlying islands. NZ Meteorological Service Scientific Report, 3.
TOMLINSON, A. I. 1975. Structure of the wind over New Zealand. NZ Meteorological Service Technical Report, 147.
UDDSTROM, M. J. & OIEN, N. A. 1999. On the use of high resolution satellite data to describe the spatial and temporal variability of sea surface temperatures in the New Zealand Region. Journal of Geophysical Research (Oceans), 104, 20729-20751.