The Clean Energy and Transport Transition
52
The Clean Energy and Transport Transition BusinessNZ Energy Council – Young Energy Professionals Network 21 June 2019 Michael Liebreich Founder and CEO Liebreich Associates
Transcript of The Clean Energy and Transport Transition
The Clean Energy and Transport Transition
BusinessNZ Energy Council
– Young Energy Professionals Network
21 June 2019
Michael Liebreich
Founder and CEO
Liebreich Associates

1 June 2019
LIEBREICHAssociates
@mliebreichZ Energy Speaking Tour, New Zealand
Source: Independent; Cleantechnica, Oilprice.com, Businessgreen; FT; Bloomberg; BBC
Clean energy news flow

2 June 2019
LIEBREICHAssociates
@mliebreichZ Energy Speaking Tour, New Zealand
Source: Telegraph; Oilprice; Bloomberg; Economist; Autocar; The Guardian
EV news flow
3 June 2019
LIEBREICHAssociates
@mliebreichZ Energy Speaking Tour, New Zealand
Image: Wikimedia Commons
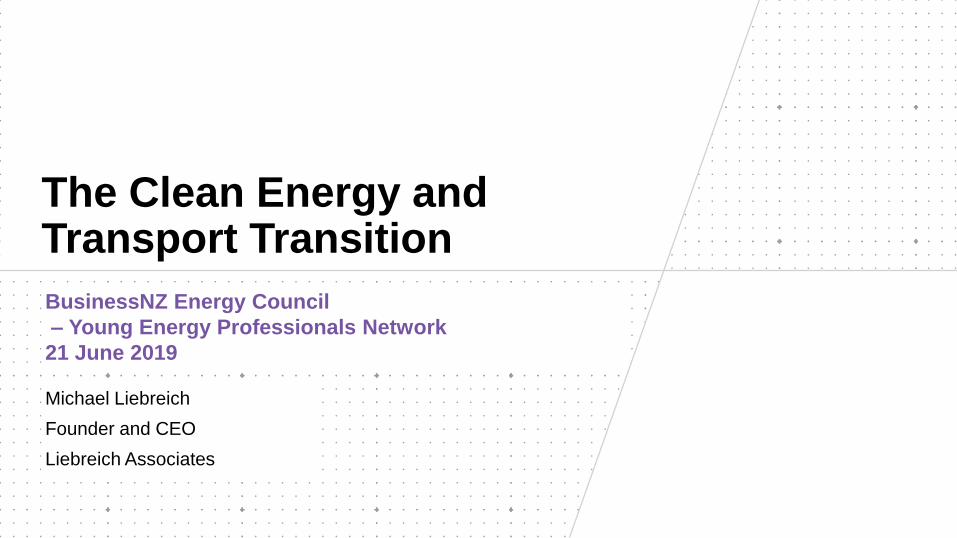
Solar and wind are not taking over the world
The great hope for a quick and
sweeping transition to renewable
energy is wishful thinking.
Vaclav Smil
Distinguished Professor Emeritus in the Faculty of Environment
at the University of Manitoba in Winnipeg, Manitoba, Canada

4 June 2019
LIEBREICHAssociates
@mliebreichZ Energy Speaking Tour, New Zealand
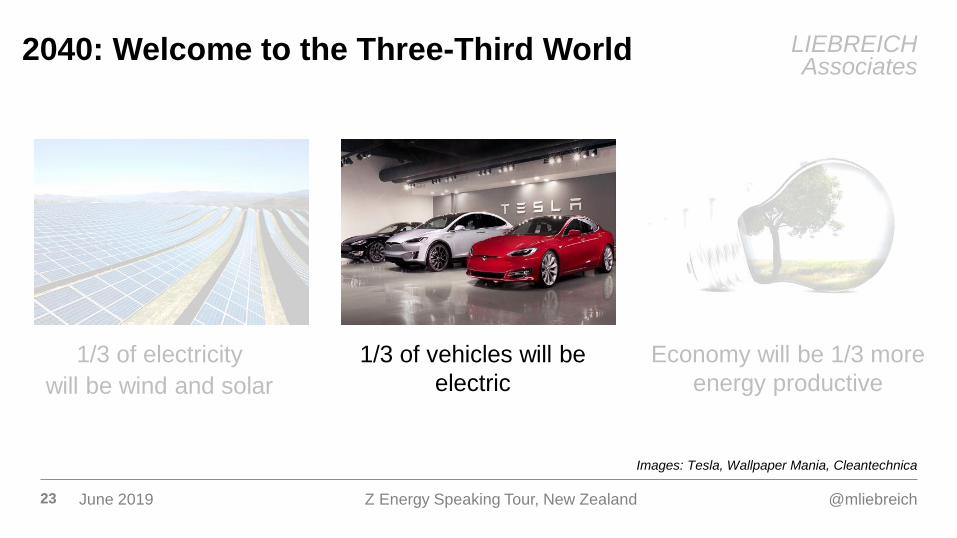
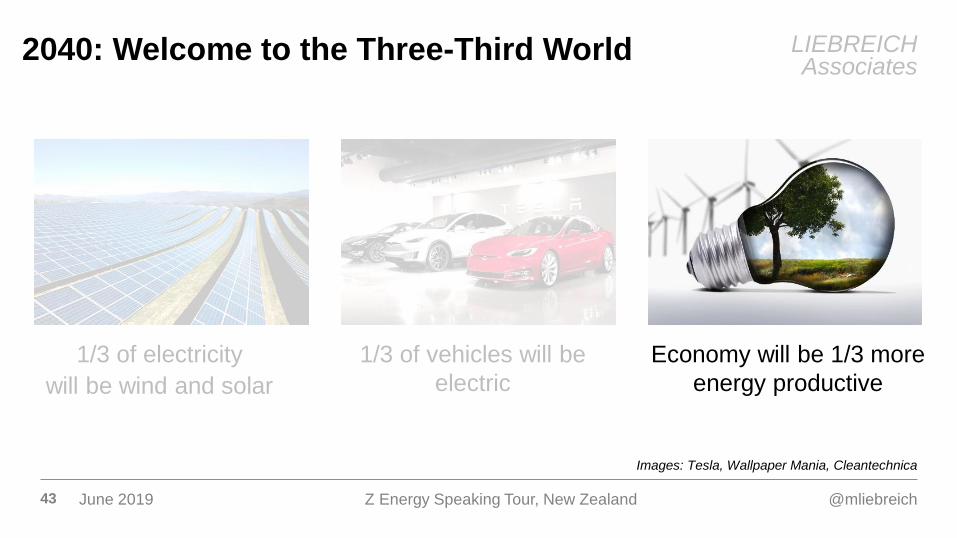
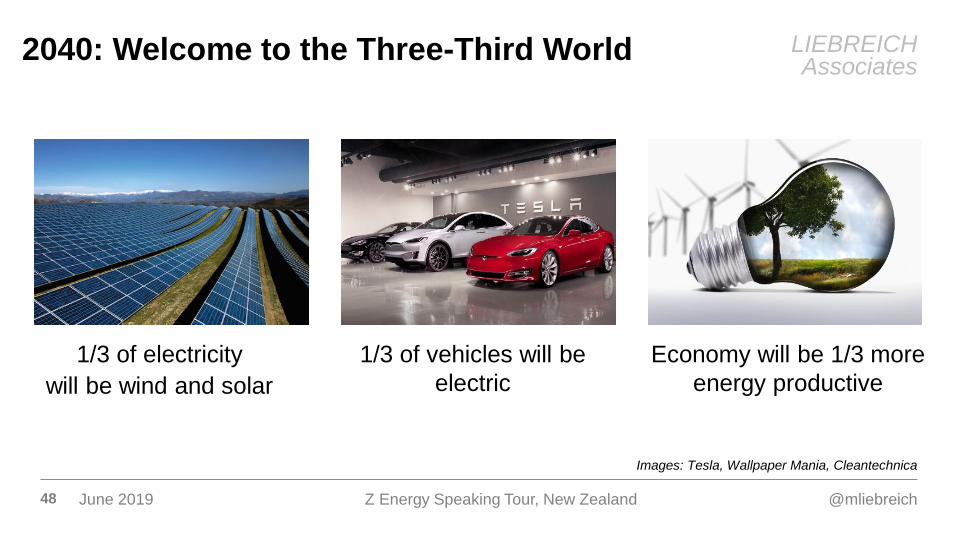
2040: Welcome to the Three-Third World
1/3 of electricity
will be wind and solar
1/3 of vehicles will be
electric
Economy will be 1/3 more
energy productive
Images: Tesla, Wallpaper Mania, Cleantechnica

5 June 2019
LIEBREICHAssociates
@mliebreichZ Energy Speaking Tour, New Zealand
1/3 of electricity
will be wind and solar
1/3 of vehicles will be
electric
Economy will be 1/3 more
energy productive
2040: Welcome to the Three-Third World
Images: Tesla, Wallpaper Mania, Cleantechnica

6 June 2019
LIEBREICHAssociates
@mliebreichZ Energy Speaking Tour, New Zealand
Global clean energy investment and capacity installations 2004 – 2018
$317 billion
Note: Total values include estimates for undisclosed deals. Includes corporate and government R&D, and spending for
digital energy and energy storage projects (not reported in quarterly statistics). Includes large hydro. Source: BNEF, IRENA
$95bn$121bn
$181bn
$228bn
$258bn$240bn
$320bn
$350bn$324bn
$302bn
$369bn
$413bn
$358bn
$402bn
$348bn
0
100
200
300
400
500
600
2004 2005 2006 2007 2008 2009 2010 2011 2012 2013 2014 2015 2016 2017 2018
$354 billion
36GW
91GW
179 GW
0
20
40
60
80
100
120
140
160
180
200
2004 2005 2006 2007 2008 2009 2010 2011 2012 2013 2014 2015 2016 2017 2018

7 June 2019
LIEBREICHAssociates
@mliebreichZ Energy Speaking Tour, New Zealand
10
100
1,000
10,000
100 10,000 1,000,000Cumulative capacity (MW)
€/MWh (real 2018)
2018
1985
Solar – learning rate 28.5% Wind – learning rate 15%
Experience curves
Source: BNEF
0
1
10
100
1,000
10,000
1 1,000 1,000,000
$/W (real 2018)
1976
Cumulative capacity (MW)
2018

8 June 2019
LIEBREICHAssociates
@mliebreichZ Energy Speaking Tour, New Zealand
Solar scale-up 2005 – 2018
Images: Nissan; Enel Villanueva solar plant
2005 2018
9 June 2019
LIEBREICHAssociates
@mliebreichZ Energy Speaking Tour, New Zealand
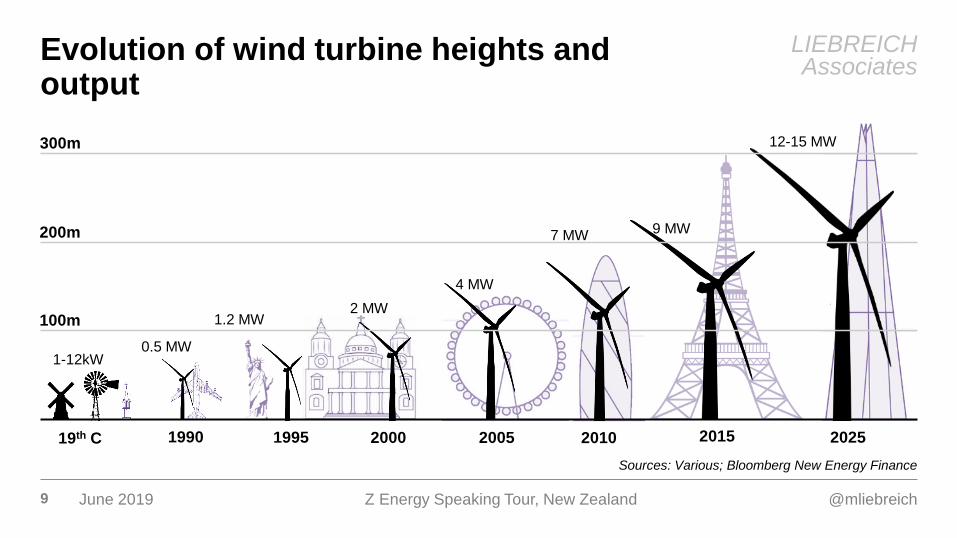
Evolution of wind turbine heights and output
20001995199019th C
300m
200m
100m
1-12kW0.5 MW
1.2 MW2 MW
2005
4 MW
2010
7 MW
2015
9 MW
2025
12-15 MW
Sources: Various; Bloomberg New Energy Finance
10 June 2019
LIEBREICHAssociates
@mliebreichZ Energy Speaking Tour, New Zealand
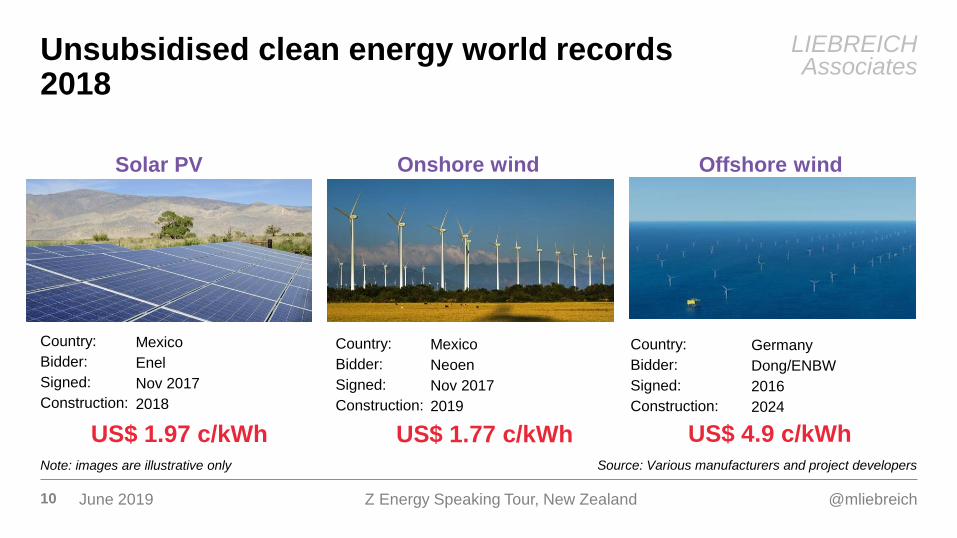
Unsubsidised clean energy world records 2018
Country:
Bidder:
Signed:
Construction:
Mexico
Neoen
Nov 2017
2019
Solar PV Onshore wind
Country:
Bidder:
Signed:
Construction:
Mexico
Enel
Nov 2017
2018
Offshore wind
US$ 1.77 c/kWhUS$ 1.97 c/kWhSource: Various manufacturers and project developersNote: images are illustrative only
Country:
Bidder:
Signed:
Construction:
Germany
Dong/ENBW
2016
2024
US$ 4.9 c/kWh

11 June 2019
LIEBREICHAssociates
@mliebreichZ Energy Speaking Tour, New Zealand
Source: Liebreich Associates; BPNote: Calculated as GWh renewable production / GWh consumption
RE proportion of power generation 2007 – 2018
8%20%
Australia
Wind & solar
Other renewables
61%66%
Canada
8%17%
U.S.
88%79%
Brazil
19%32%
Spain
16%
35%
Italy
5%
29%
U.K.
14%33%
Germany
15% 25%
China
9%17%
Japan
8% 15%
Australia
18% 16%
India
65%81%
New Zealand

12 June 2019
LIEBREICHAssociates
@mliebreichZ Energy Speaking Tour, New Zealand
Image: Twitter
Price of renewable energy in India
The cost of solar power is
now cheaper than coal in
this country.
Piyush Goyal
Minister of State for Power, Coal, New &
Renewable Energy and Mines, India

13 June 2019
LIEBREICHAssociates
@mliebreichZ Energy Speaking Tour, New Zealand
Source: Liebreich Associates; Coalswarm
Net new coal generation capacity 2006 – 2018
-100
-50
0
50
100
2006 2010 2015 2018
GW
RoW
India
China
Retirements
Net additions
14 June 2019
LIEBREICHAssociates
@mliebreichZ Energy Speaking Tour, New Zealand
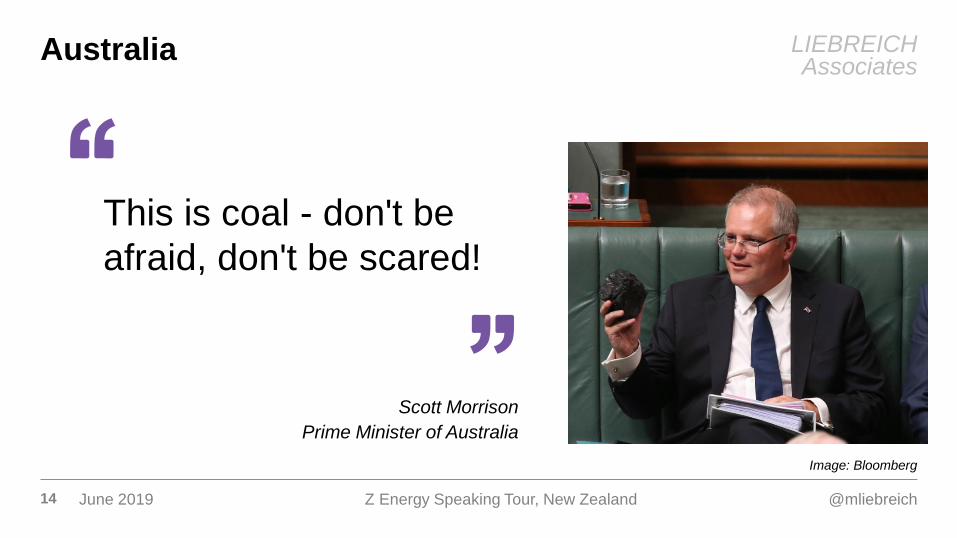
Image: Bloomberg
Australia
Scott Morrison
Prime Minister of Australia
This is coal - don't be
afraid, don't be scared!

15 June 2019
LIEBREICHAssociates
@mliebreichZ Energy Speaking Tour, New Zealand
Image: Mark Lyons/Getty Images
Trump digs coalJuly 2017
Everybody was saying, well, you won’t
get any mining jobs. We picked up
45,000 mining jobs
Donald Trump
US President

16 June 2019
LIEBREICHAssociates
@mliebreichZ Energy Speaking Tour, New Zealand
0
50
100
150
1995 2000 2005 2010 2015
Thousand employed
Source: U.S. Bureau of Labor Statistics
US coal mining monthly employmentJan 1995 – Mar 2019
President Obama President TrumpPresident GW BushPresident Clinton
17 June 2019
LIEBREICHAssociates
@mliebreichZ Energy Speaking Tour, New Zealand
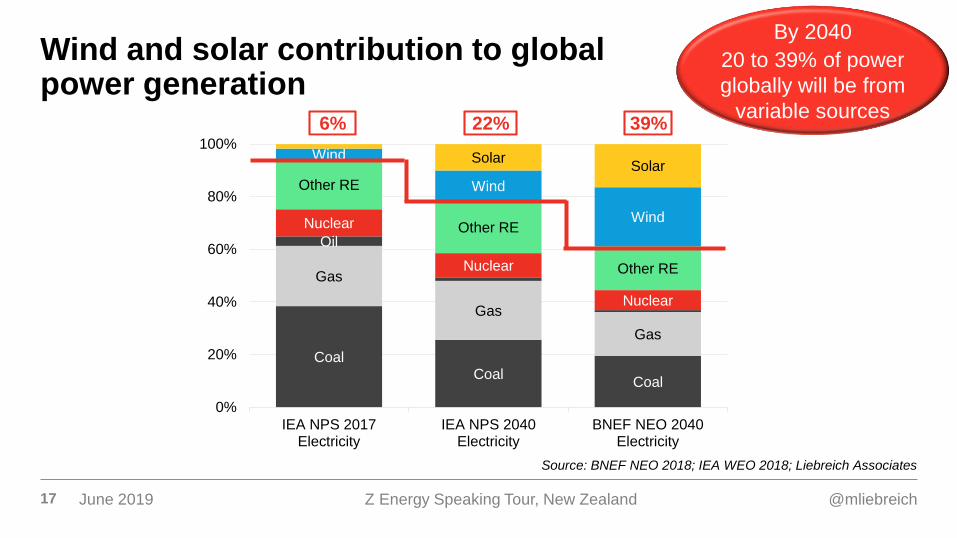
CoalCoal
Coal
Gas
Gas
Gas
Oil
Nuclear
Nuclear
Nuclear
Other RE
Other RE
Other RE
Wind
Wind
Wind
SolarSolar
0%
20%
40%
60%
80%
100%
IEA NPS 2017Electricity
IEA NPS 2040Electricity
BNEF NEO 2040Electricity
Source: BNEF NEO 2018; IEA WEO 2018; Liebreich Associates
Wind and solar contribution to global power generation
39%6%
By 2040
20 to 39% of power
globally will be from
variable sources
CoalCoal
Coal
Gas
Gas
Gas
Oil
Nuclear
Nuclear
Nuclear
Other RE
Other RE
Other RE
Wind
Wind
Wind
SolarSolar
0%
20%
40%
60%
80%
100%
IEA NPS 2017Electricity
IEA NPS 2040Electricity
BNEF NEO 2040Electricity
22%
CoalCoal
Coal
Gas
Gas
Gas
Oil
Nuclear
Nuclear
Nuclear
Other RE
Other RE
Other RE
Wind
Wind
Wind
SolarSolar
0%
20%
40%
60%
80%
100%
IEA NPS 2017Electricity
IEA NPS 2040Electricity
BNEF NEO 2040Electricity
18 June 2019
LIEBREICHAssociates
@mliebreichZ Energy Speaking Tour, New Zealand
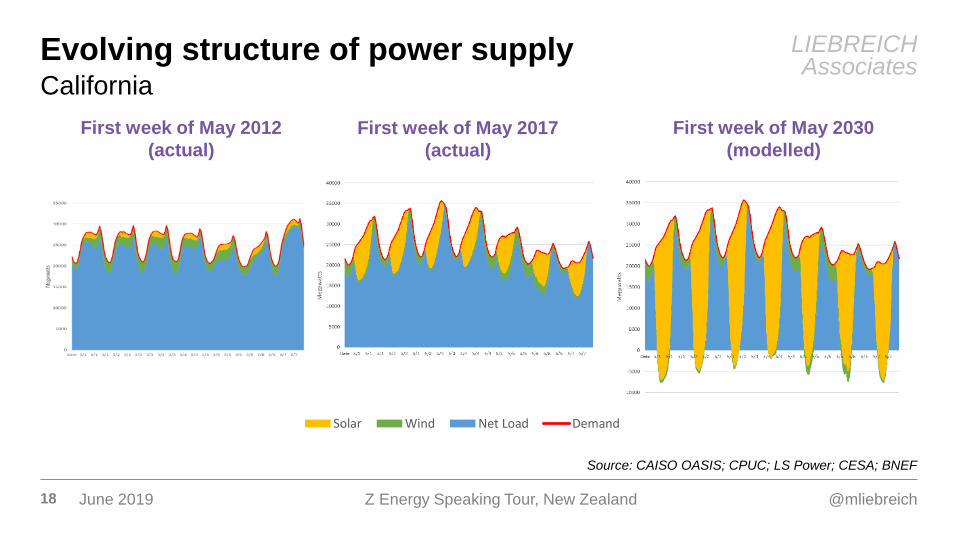
Source: CAISO OASIS; CPUC; LS Power; CESA; BNEF
Evolving structure of power supply California
First week of May 2012
(actual)
First week of May 2017
(actual)
First week of May 2030
(modelled)
0
2
4
6
8
10
12
14
0
10
20
30
40
50
60
70
80
1 2
Chart Title
Solar Wind Net Load Demand

19 June 2019
LIEBREICHAssociates
@mliebreichZ Energy Speaking Tour, New Zealand
Source: BNEF
Evolving structure of power supply Northern Europe
Past – summer
Past – winter
-40
-20
0
20
40
60
80
Monday Tuesday Wednesday Thursday Friday Saturday Sunday
-40
-20
0
20
40
60
80
Monday Tuesday Wednesday Thursday Friday Saturday Sunday
Current – summer
Current – winter
-40
-20
0
20
40
60
80
Monday Tuesday Wednesday Thursday Friday Saturday Sunday
-40
-20
0
20
40
60
80
Monday Tuesday Wednesday Thursday Friday Saturday Sunday
Future – summer
Future – winter
-40
-20
0
20
40
60
80
Monday Tuesday Wednesday Thursday Friday Saturday Sunday
-40
-20
0
20
40
60
80
Monday Tuesday Wednesday Thursday Friday Saturday Sunday
-30.0
-10.0
10.0
30.0
50.0
70.0
90.0
Monday Tuesday Wednesday Thursday Friday Saturday Sunday
GW
Peaking fossil Baseload fossil Nuclear CHP Hydro Baseload RE Solar Wind Pumped hydro generation/Storage Imports Exports/curtailment/DR

20 June 2019
LIEBREICHAssociates
@mliebreichZ Energy Speaking Tour, New Zealand
Source: BNEF
Balancing the grid
II. CONTINUOUS
BALANCING
III. CONTROLLING
FREQUENCY
I. PLANNING FOR
EXTREMES
Demand
Variable supply
Months to weeks Days to hours Minutes to seconds
Power to methane
Pumped storage
Ammonia
H2
Flywheels
Compressed air
Biogas Electric vehiclesDemand response
Flowbatteries
Synthetic fuels
Batteries
Solar CSP
Interconnectors
Smart heating & cooling
Seasonal thermal storage
Biomass
Digitisation

21 June 2019
LIEBREICHAssociates
@mliebreichZ Energy Speaking Tour, New Zealand
Source: BNEF; Liebreich Associates
Digitisation of infrastructure
Ubiquitous
Artificial
intelligence and
machine
learning
Ubiquitous
processing and
storage
(cloud to
network edge)
Ubiquitous
chips and
sensors
Ubiquitous
communications
Ubiquitous
Blockchain
(distributed
ledgers and
smart contracts)
22 June 2019
LIEBREICHAssociates
@mliebreichZ Energy Speaking Tour, New Zealand
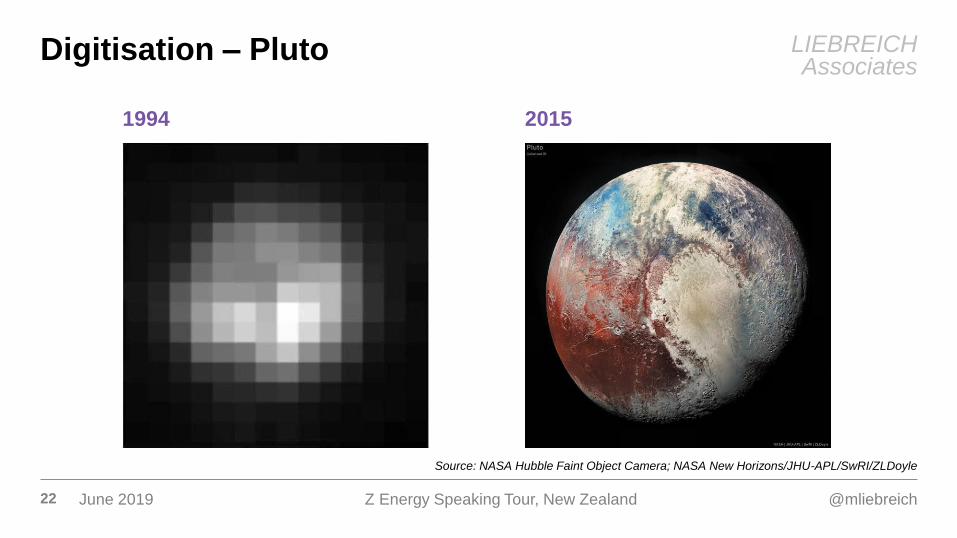
Source: NASA Hubble Faint Object Camera; NASA New Horizons/JHU-APL/SwRI/ZLDoyle
1994 2015
Digitisation – Pluto
23 June 2019
LIEBREICHAssociates
@mliebreichZ Energy Speaking Tour, New Zealand
1/3 of electricity
will be wind and solar
1/3 of vehicles will be
electric
Economy will be 1/3 more
energy productive
2040: Welcome to the Three-Third World
Images: Tesla, Wallpaper Mania, Cleantechnica

24 June 2019
LIEBREICHAssociates
@mliebreichZ Energy Speaking Tour, New Zealand
Image: Tesla; Detroit Electric, courtesy of EVASD
The future of transportation – EVs
Prices on electric cars will continue to drop until
they're within reach of the average family.
The Washington
Post , 1915

25 June 2019
LIEBREICHAssociates
@mliebreichZ Energy Speaking Tour, New Zealand
0
100
200
300
400
500
Q1
Q3
Q1
Q3
Q1
Q3
Q1
Q3
Q1
Q3
Q1
Q3
Q1
Q3
2012 2013 2014 2015 2016 2017 2018
thousand sold
0
100
200
300
400
500
Q1
Q3
Q1
Q3
Q1
Q3
Q1
Q3
Q1
Q3
Q1
Q3
Q1
Q3
2012 2013 2014 2015 2016 2017 2018
thousand sold
0
100
200
300
400
500
Q1
Q3
Q1
Q3
Q1
Q3
Q1
Q3
Q1
Q3
Q1
Q3
Q1
Q3
2012 2013 2014 2015 2016 2017 2018
thousand sold
APAC EMEA AMER
Quarterly EV sales by regionQ1 2012 – Q4 2018
CAGR 86% CAGR 62% CAGR 54%
Source: BNEF

26 June 2019
LIEBREICHAssociates
@mliebreichZ Energy Speaking Tour, New Zealand
49%
36%30%
25%22% 19% 17% 15%
0
10
20
30
40
50
2016 2018 2020 2022 2024 2026 2028 2030
Thousand 2018 $
Battery
Powertrain
Vehicle
ICE
Source: BNEF
US medium BEV price breakdown, share of battery costs and ICE price
Unsubsidised sticker
price crossover with ICEs
2022 – 2026
Unsubsidised
TCO crossover
with ICEs
2017 – 2020

27 June 2019
LIEBREICHAssociates
@mliebreichZ Energy Speaking Tour, New Zealand
Image: Jassen Todorov/National Geographic
Dieselgate
28 June 2019
LIEBREICHAssociates
@mliebreichZ Energy Speaking Tour, New Zealand
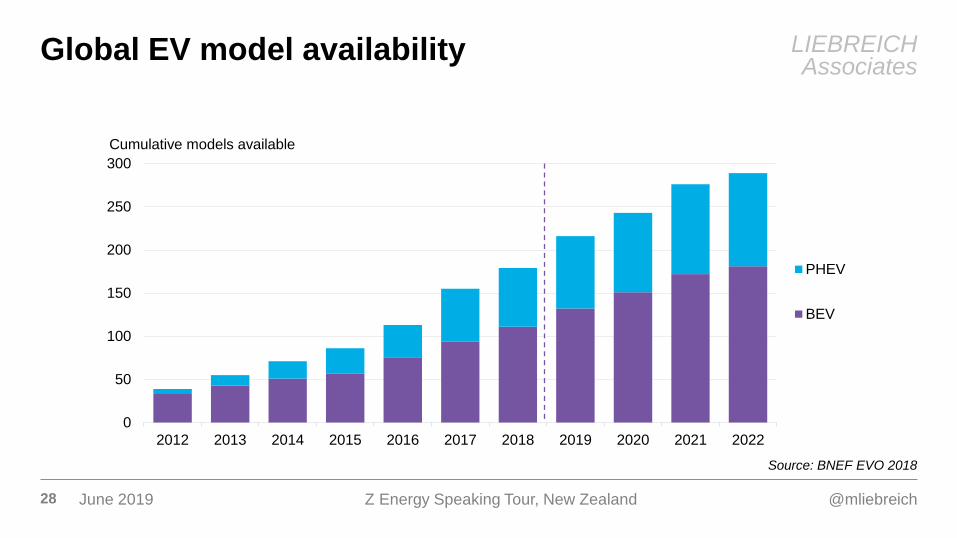
Source: BNEF EVO 2018
Global EV model availability
0
50
100
150
200
250
300
2012 2013 2014 2015 2016 2017 2018 2019 2020 2021 2022
Cumulative models available
PHEV
BEV
29 June 2019
LIEBREICHAssociates
@mliebreichZ Energy Speaking Tour, New Zealand
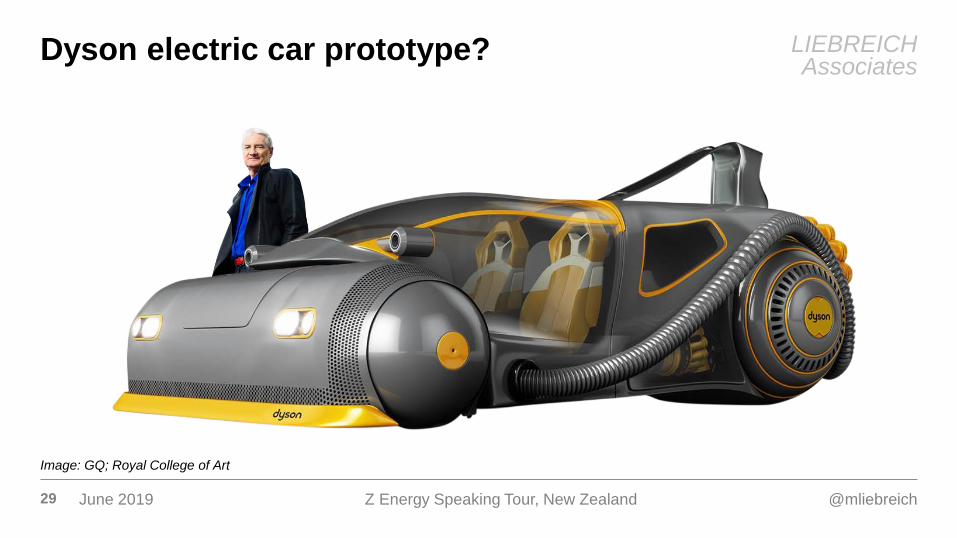
Dyson electric car prototype?
Image: GQ; Royal College of Art

30 June 2019
LIEBREICHAssociates
@mliebreichZ Energy Speaking Tour, New Zealand
0%
20%
40%
60%
80%
100%
0.0
0.5
1.0
1.5
2.0
2015 2020 2025 2030 2035 2040
Billion vehicles on the road % Share of global fleet
0
20
40
60
80
100
2015 2020 2025 2030 2035 2040
Million sales
Source: BNEF EVO 2019
Annual global passenger vehicle sales Global passenger vehicle fleet
BNEF electric vehicle outlook to 2040
0%
20%
40%
60%
80%
100%
0
500
1,000
1,500
2,000
2015 2020 2025 2030 2035 2040
Vehicles on the road
ICE PHEV BEV
Share
31 June 2019
LIEBREICHAssociates
@mliebreichZ Energy Speaking Tour, New Zealand
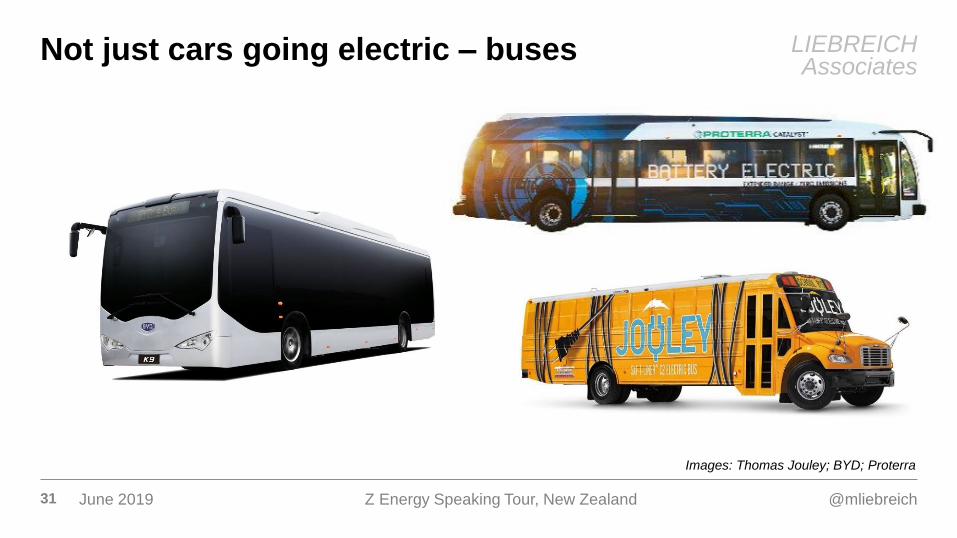
Not just cars going electric – buses
Images: Thomas Jouley; BYD; Proterra

32 June 2019
LIEBREICHAssociates
@mliebreichZ Energy Speaking Tour, New Zealand
Not just cars going electric – commercial vehicles
Images: Tesla; Starship Technologies; Ehang; Zunum; Daimler; Dpost; UPS/Arrival

33 June 2019
LIEBREICHAssociates
@mliebreichZ Energy Speaking Tour, New Zealand
Not just cars going electric – 2 & 3 wheelers
Images: Toyota; Omastar ; Kalkhoff; Jetson; Harley Davidson
34 June 2019
LIEBREICHAssociates
@mliebreichZ Energy Speaking Tour, New Zealand
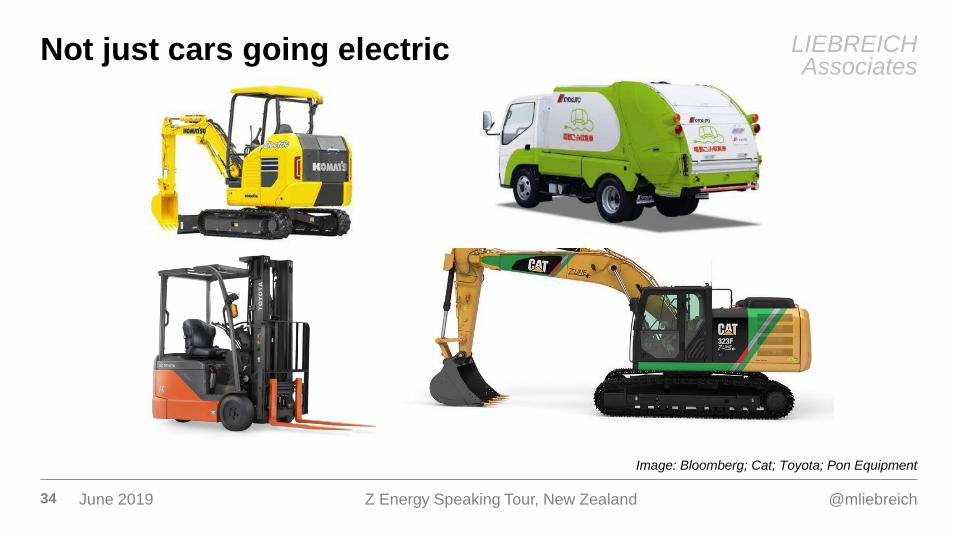
Image: Bloomberg; Cat; Toyota; Pon Equipment
Not just cars going electric

35 June 2019
LIEBREICHAssociates
@mliebreichZ Energy Speaking Tour, New Zealand
Images: Alf Kare Aesobo; Kongsberg; Enercon, ABB
Not just cars going electric – ships
36 June 2019
LIEBREICHAssociates
@mliebreichZ Energy Speaking Tour, New Zealand
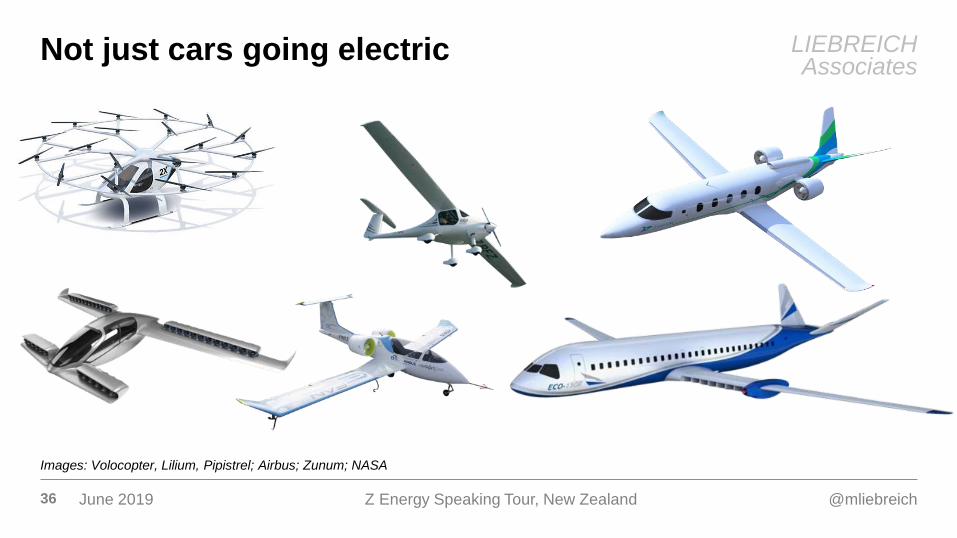
Not just cars going electric
Images: Volocopter, Lilium, Pipistrel; Airbus; Zunum; NASA

37 June 2019
LIEBREICHAssociates
@mliebreichZ Energy Speaking Tour, New Zealand
Image: Toyota
Hydrogen vehicles
38 June 2019
LIEBREICHAssociates
@mliebreichZ Energy Speaking Tour, New Zealand
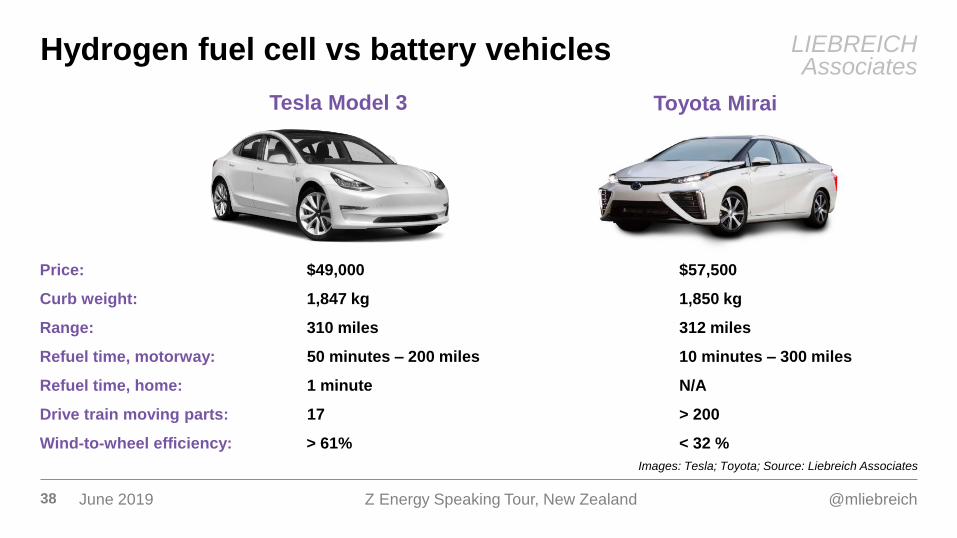
Images: Tesla; Toyota; Source: Liebreich Associates
Tesla Model 3
Hydrogen fuel cell vs battery vehicles
Toyota Mirai
Curb weight: 1,847 kg 1,850 kg
Range: 310 miles 312 miles
Refuel time, motorway: 50 minutes – 200 miles 10 minutes – 300 miles
Drive train moving parts: 17 > 200
Wind-to-wheel efficiency: > 61% < 32 %
Price: $49,000 $57,500
Refuel time, home: 1 minute N/A
39 June 2019
LIEBREICHAssociates
@mliebreichZ Energy Speaking Tour, New Zealand
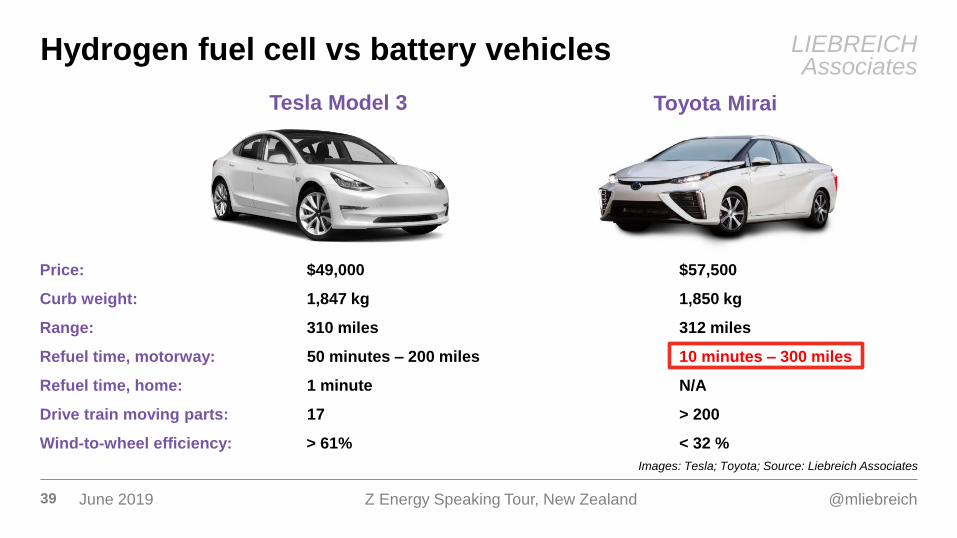
Images: Tesla; Toyota; Source: Liebreich Associates
Tesla Model 3
Hydrogen fuel cell vs battery vehicles
Toyota Mirai
Curb weight: 1,847 kg 1,850 kg
Range: 310 miles 312 miles
Refuel time, motorway: 50 minutes – 200 miles
Drive train moving parts: 17 > 200
Wind-to-wheel efficiency: > 61% < 32 %
Price: $49,000 $57,500
Refuel time, home: 1 minute N/A
10 minutes – 300 miles
40 June 2019
LIEBREICHAssociates
@mliebreichZ Energy Speaking Tour, New Zealand
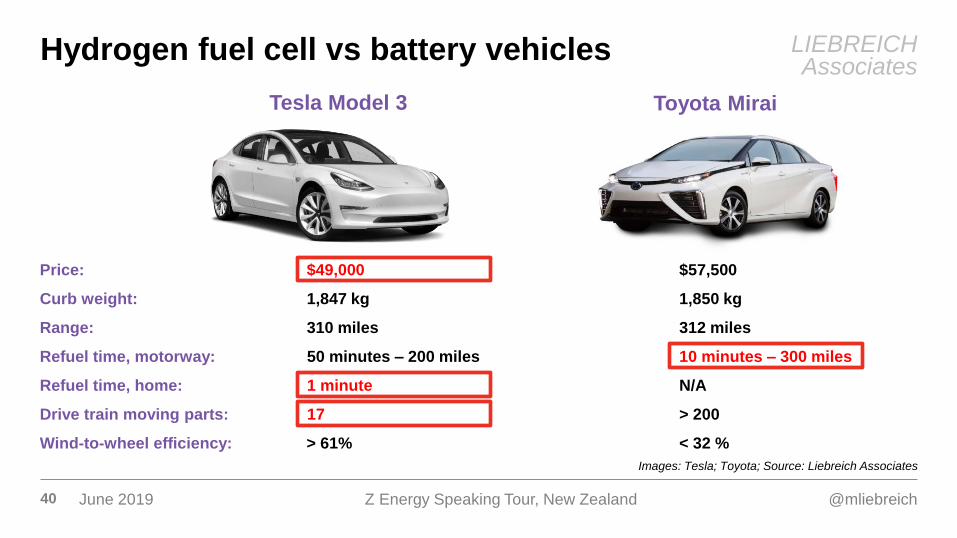
Images: Tesla; Toyota; Source: Liebreich Associates
Tesla Model 3
Hydrogen fuel cell vs battery vehicles
Toyota Mirai
Curb weight: 1,847 kg
Range: 310 miles 312 miles
Refuel time, motorway: 50 minutes – 200 miles 10 minutes – 300 miles
Drive train moving parts: 17 > 200
Wind-to-wheel efficiency: > 61% < 32 %
Price: $49,000 $57,500
Refuel time, home: 1 minute N/A
1,850 kg
41 June 2019
LIEBREICHAssociates
@mliebreichZ Energy Speaking Tour, New Zealand
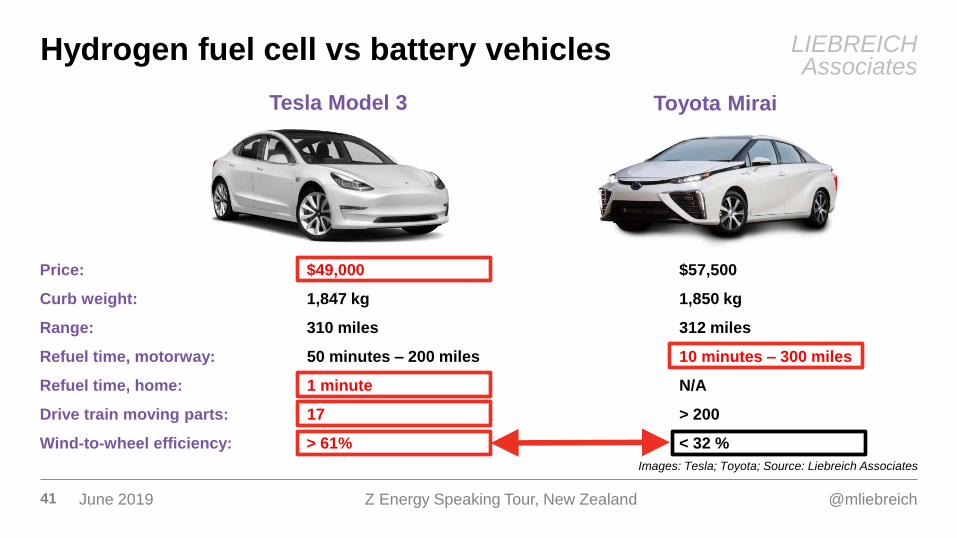
Images: Tesla; Toyota; Source: Liebreich Associates
Tesla Model 3
Hydrogen fuel cell vs battery vehicles
Toyota Mirai
Curb weight: 1,847 kg
Range: 310 miles 312 miles
Refuel time, motorway: 50 minutes – 200 miles 10 minutes – 300 miles
Drive train moving parts: 17 > 200
Wind-to-wheel efficiency: > 61% < 32 %
Price: $49,000 $57,500
Refuel time, home: 1 minute N/A
1,850 kg

42 June 2019
LIEBREICHAssociates
@mliebreichZ Energy Speaking Tour, New Zealand
BEV and H2FC energy input for a 100 km trip
Source: BNEF; Liebreich AssociatesNotes: Assuming 17.6kWh/km, average for Chevy Bolt
BEV
H2FCEV
BEV total
energy used
= 28 kWh
FCEV total
energy used
= 55 kWh
Drive system: 3 kWh
Battery: 2 kWh
Charging: 1 kWh
AC-DC conversion: 1 kWh
Transmission: 3 kWh
Road traction: 18 kWh
Road traction: 18 kWh
AC-DC conversion: 3 kWh
Electrolysis: 13 kWh
Compression: 3 kWh
Transport & storage: 2 kWh
Drive system: 3 kWh
Fuel-cell: 14 kWh
43 June 2019
LIEBREICHAssociates
@mliebreichZ Energy Speaking Tour, New Zealand
1/3 of electricity
will be wind and solar
1/3 of vehicles will be
electric
Economy will be 1/3 more
energy productive
2040: Welcome to the Three-Third World
Images: Tesla, Wallpaper Mania, Cleantechnica
44 June 2019
LIEBREICHAssociates
@mliebreichZ Energy Speaking Tour, New Zealand
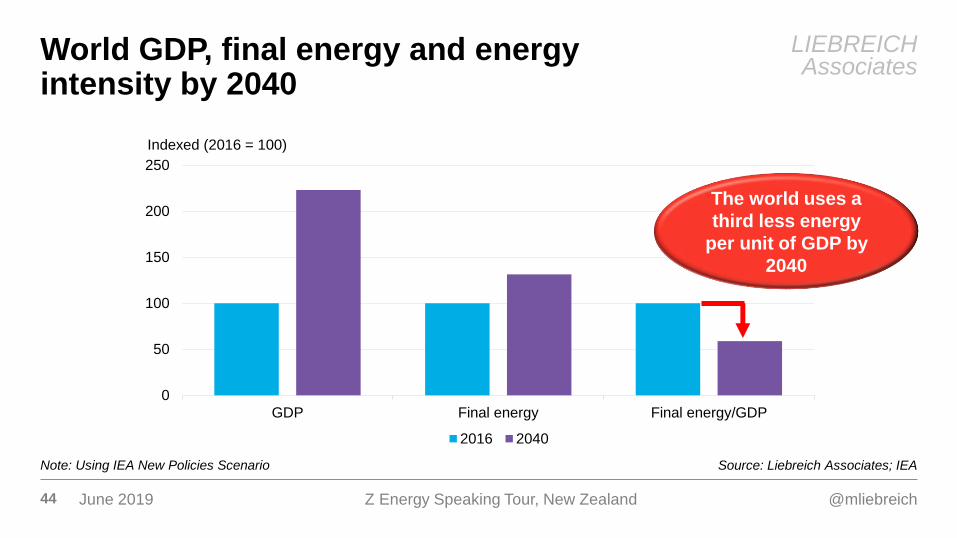
Source: Liebreich Associates; IEA
World GDP, final energy and energy intensity by 2040
Note: Using IEA New Policies Scenario
0
50
100
150
200
250
GDP Final energy Final energy/GDP
Indexed (2016 = 100)
2016 2040
0
50
100
150
200
250
GDP Final energy Final energy/GDP
Indexed (2016 = 100)
2016 2040
0
50
100
150
200
250
GDP Final energy Final energy/GDP
Indexed (2016 = 100)
2016 2040
The world uses a
third less energy
per unit of GDP by
2040
45 June 2019
LIEBREICHAssociates
@mliebreichZ Energy Speaking Tour, New Zealand
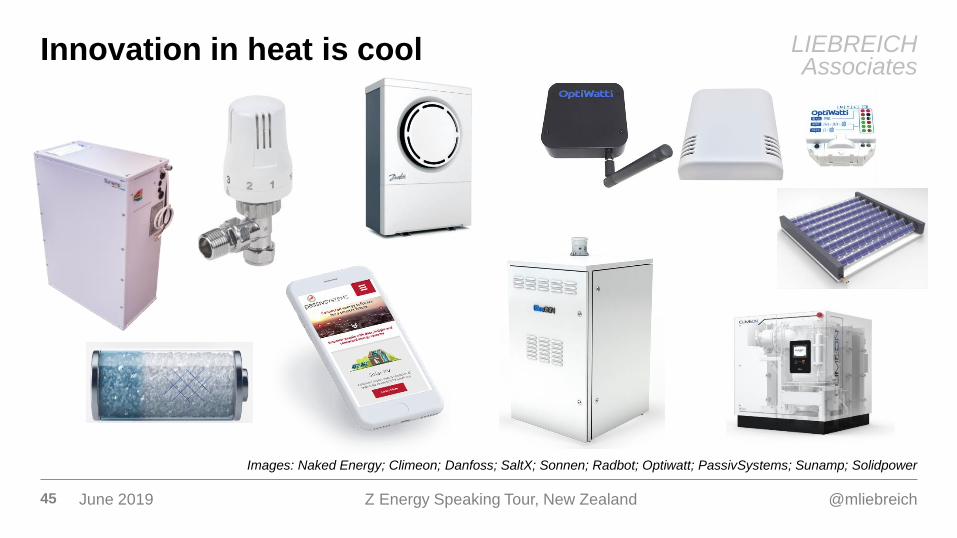
Images: Naked Energy; Climeon; Danfoss; SaltX; Sonnen; Radbot; Optiwatt; PassivSystems; Sunamp; Solidpower
Innovation in heat is cool
46 June 2019
LIEBREICHAssociates
@mliebreichZ Energy Speaking Tour, New Zealand
0 1,000 2,000 3,000 4,000
1
2
3
4
5
6
7
8
Wh/day 0 1,000 2,000 3,000 4,000
1
2
3
4
5
6
7
8
Wh/day
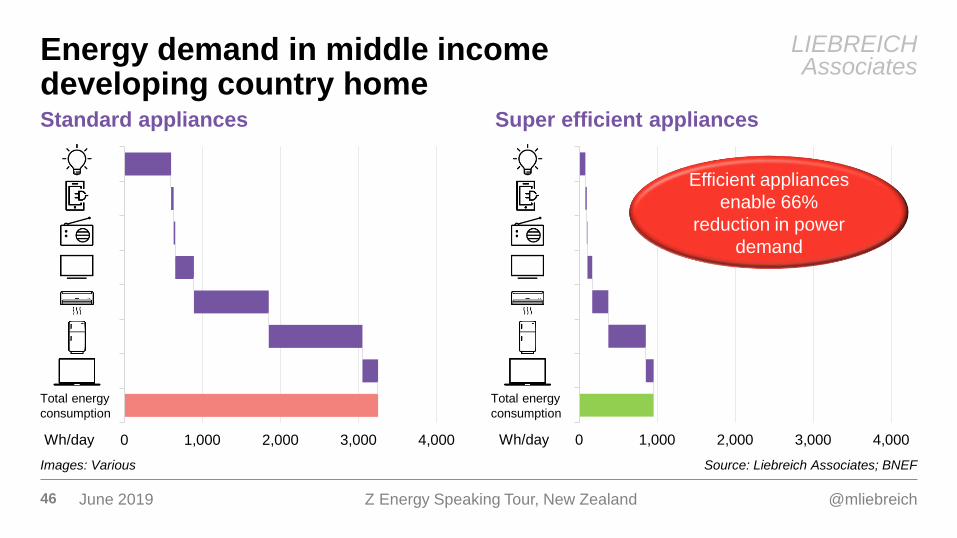
Source: Liebreich Associates; BNEFImages: Various
Standard appliances Super efficient appliances
Energy demand in middle income developing country home
Total energy
consumption
Total energy
consumption
Efficient appliances
enable 66%
reduction in power
demand

47 June 2019
LIEBREICHAssociates
@mliebreichZ Energy Speaking Tour, New Zealand
Source: IEA; Liebreich AssociatesNote: Heat pump sales are those for primary use in heating
Air conditioner sales Heat pump sales
Global sales of electrical equipment for building cooling and heating, 2010 – 2018
0
5
10
15
20
2010 2015 2018
Million units
0
50
100
150
200
2010 2015 2018
Million units
0
2
4
6
8
10
12
14
16
18
2010 2015 2018
Million units
China APAC (excl. China) North America Europe Other
CAGR
5.1%
CAGR
12.1%
48 June 2019
LIEBREICHAssociates
@mliebreichZ Energy Speaking Tour, New Zealand
2040: Welcome to the Three-Third World
1/3 of electricity
will be wind and solar
1/3 of vehicles will be
electric
Economy will be 1/3 more
energy productive
Images: Tesla, Wallpaper Mania, Cleantechnica

49 June 2019
LIEBREICHAssociates
@mliebreichZ Energy Speaking Tour, New Zealand
Image: UNFCCC
Paris
The world must achieve
greenhouse gas neutrality
some time in the second half of
the century
Paris Agreement
December 2015
50 June 2019
LIEBREICHAssociates
@mliebreichZ Energy Speaking Tour, New Zealand
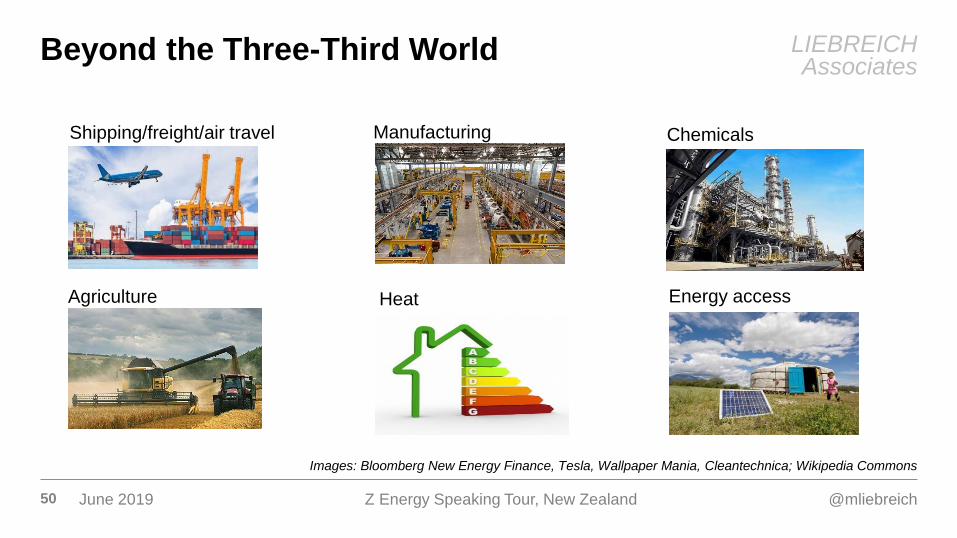
Images: Bloomberg New Energy Finance, Tesla, Wallpaper Mania, Cleantechnica; Wikipedia Commons
Beyond the Three-Third World
Shipping/freight/air travel Chemicals
Energy accessHeatAgriculture
Manufacturing
51 June 2019
LIEBREICHAssociates
@mliebreichZ Energy Speaking Tour, New Zealand
www.liebreich.com
@mliebreich
Thanks!