The City of New York Mayor’s Office of Management and …
22
The City of New York Mayor’s Office of Management and Budget 255 Greenwich Street - New York, New York 10007 - 2146 (212) 788-5900 Melanie Hartzog Director June 19, 2019 TO THE FINANCIAL CONTROL BOARD Pursuant to Section 8.3 of the Financial Emergency Act (the “Act”), the City hereby submits for review by the Financial Control Board, Modification No. 19-4 to the Financial Plan for the City and Covered Organizations for fiscal years 2019-2023 (the “Modification”) as such plan relates to fiscal year 2019. The fiscal year 2019 Financial Plan has been prepared in accordance with generally accepted accounting principles (“GAAP”) except for the application of Statement No. 49 of the Governmental Accounting Standards Board (“GASB 49”), and with the exception of that portion of the Modification related to Covered Organizations, which are prepared on a cash basis. The Modification as it relates to the City is attached hereto as Exhibit A. The Plans for the Covered Organizations which require modification will be forwarded to you under separate cover. The City hereby certifies that, in its judgment, the Modification is complete and complies with the standards set forth in Section 8.1 of the Act. Yours truly, Melanie Hartzog
Transcript of The City of New York Mayor’s Office of Management and …

The City of New York Mayor’s Office of Management and Budget 255 Greenwich Street - New York, New York 10007 - 2146 (212) 788-5900 Melanie Hartzog Director
June 19, 2019 TO THE FINANCIAL CONTROL BOARD
Pursuant to Section 8.3 of the Financial Emergency Act (the “Act”), the City hereby submits for review by the Financial Control Board, Modification No. 19-4 to the Financial Plan for the City and Covered Organizations for fiscal years 2019-2023 (the “Modification”) as such plan relates to fiscal year 2019. The fiscal year 2019 Financial Plan has been prepared in accordance with generally accepted accounting principles (“GAAP”) except for the application of Statement No. 49 of the Governmental Accounting Standards Board (“GASB 49”), and with the exception of that portion of the Modification related to Covered Organizations, which are prepared on a cash basis. The Modification as it relates to the City is attached hereto as Exhibit A. The Plans for the Covered Organizations which require modification will be forwarded to you under separate cover. The City hereby certifies that, in its judgment, the Modification is complete and complies with the standards set forth in Section 8.1 of the Act. Yours truly,
Melanie Hartzog
chinchac
Rectangle

TABLE OF CONTENTS
EXHIBIT A CITY OF NEW YORK - FINANCIAL PLAN A-1 Projection of Revenues and Expenditures A-2 Projections of Cash Sources and Uses A-3 Capital Plan Funding Sources A-4 Borrowing Schedule A-5 Capital Plan

June 2019
FY 2019 Financial Plan Revenues and Expenditures
($ in millions)
Exhibit A-1
Revised Increase/
REVENUES Plan Plan (Decrease)
Taxes
General Property Tax 27,795$ 27,745$ (50)$
Other Taxes 32,030 32,521 491
Tax Audit Revenue 1,058 1,058 -
Subtotal: Taxes 60,883$ 61,324$ 441$
Miscellaneous Revenues 8,065 8,157 92
Unrestricted Intergovernmental Aid 201 201 -
(2,220) (2,261) (41)
Disallowances Against Categorical Grants 91 91 -
Subtotal: City Funds 67,020$ 67,512$ 492$
Other Categorical Grants 1,207 1,212 5
Inter-Fund Revenues 657 651 (6)
Federal Categorical Grants 8,494 8,563 69
State Categorical Grants 15,473 15,496 23
Total Revenues 92,851$ 93,434$ 583$
EXPENDITURES
Personal Service
Salaries and Wages 29,051$ 29,051$ -$
Pensions 9,936 9,945 9
Fringe Benefits 1
10,642 10,582 (60)
Retiree Health Benefits Trust - 100 100
Subtotal - Personal Service 49,629$ 49,678$ 49$
Other Than Personal Service
Medical Assistance 5,915 5,915 -
Public Assistance 1,595 1,595 -
All Other 1,2
32,312 32,407 95
Subtotal - Other Than Personal Service 39,822$ 39,917$ 95$
Debt Service 1,2
6,630 6,435 (195)
FY 2018 Budget Stabilization & Discretionary Transfers 1
(4,576) (4,576) -
FY 2019 Budget Stabilization & Discretionary Transfers 2
3,516 4,221 705
Capital Stabilization Reserve - - -
General Reserve 50 20 (30)
Less: Intra-City Expenses (2,220) (2,261) (41)
Total Expenditures 92,851$ 93,434$ 583$
Gap To Be Closed -$ -$ -$
1Fiscal Year 2018 Budget Stabilization and Discretionary Transfers total $4.576 billion, including GO of $1.902 billion, TFA-FTS of $2.174 billion,
Retiree Health Benefits of $300 million and subsidies of $200 million. 2
Fiscal Year 2019 Budget Stabilization and Discretionary Transfers totals $4.221 billion, including GO of $1.702 billion, TFA-FTS of $2.319 billion
and subsidies of $200 million.
Less: Intra-City Revenue

June 2019
New York City Financial Plan
FY 2019 Projections of Cash Sources and Uses
($ in millions)
Exhibit A-2
Revised Increase/
Sources of Cash Plan Plan (Decrease)
Funds Provided/(Used) from Operations 25$ (534)$ (559)$
Proceeds from Seasonal Borrowings - - - Capital Plan Funding Sources (see Exhibit A-3) 9,655 9,655 -
Total Sources of Cash 9,680$ 9,121$ (559)$
Uses of Cash
Capital Disbursements 9,655$ 9,655$ -$ Repayment of Seasonal Borrowings - - -
Total Uses of Cash 9,655$ 9,655$ -$
Net Sources/(Uses) of Cash 25$ (534)$ (559)$
Cash Balance - Beginning of Period 9,394$ 9,394$ -$ Cash Balance - End of Period 9,419$ 8,860$ (559)$
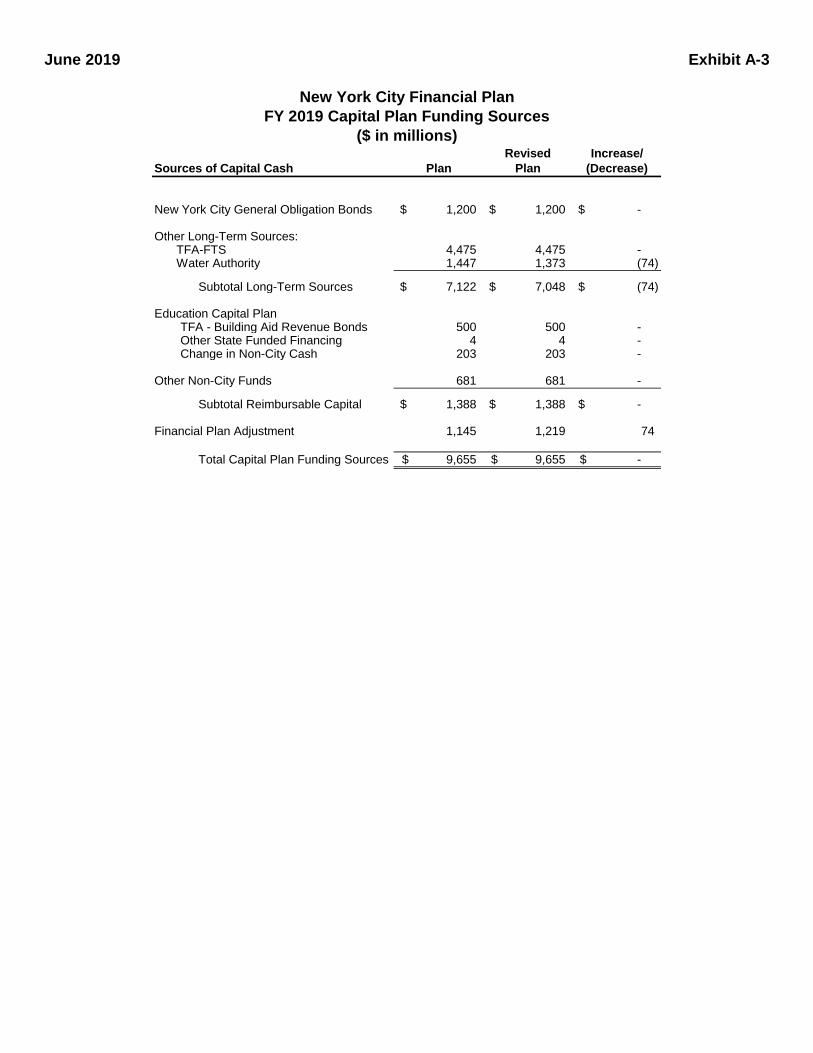
June 2019
New York City Financial Plan
FY 2019 Capital Plan Funding Sources
($ in millions)
Exhibit A-3
Revised Increase/
Sources of Capital Cash Plan Plan (Decrease)
New York City General Obligation Bonds 1,200$ 1,200$ -$
Other Long-Term Sources:TFA-FTS 4,475 4,475 - Water Authority 1,447 1,373 (74)
Subtotal Long-Term Sources 7,122$ 7,048$ (74)$
Education Capital PlanTFA - Building Aid Revenue Bonds 500 500 - Other State Funded Financing 4 4 - Change in Non-City Cash 203 203 -
Other Non-City Funds 681 681 -
Subtotal Reimbursable Capital 1,388$ 1,388$ -$
Financial Plan Adjustment 1,145 1,219 74
Total Capital Plan Funding Sources 9,655$ 9,655$ -$

June 2019
New York City Financial Plan
FY 2019 Borrowing Schedule
($ in millions)
Exhibit A-4
First Second Third Fourth Total
Quarter Quarter Quarter Quarter Financing
Short-Term Borrowing:
Borrowing -$ -$ -$ -$ -$
Repayment - - - - -
Total Short-Term
Borrowing (Repayment) -$ -$ -$ -$ -$
Capital Borrowing:
New York City General Obligation -$ 1,200$ -$ -$ 1,200$
Transitional Financial Authority (TFA-FTS) 2,875 - - 1,600 4,475
Water Authority 1
415 314 524 120 1,373
Total Borrowing to Finance
City Capital Program 3,290$ 1,514$ 524$ 1,720$ 7,048$
Notes:
1. Excludes costs of issuance and reserve fund allocations and reflects Water Authority Commercial Paper, Bond
Anticipation Notes, releases from debt service reserve funds, and revenue bonds issued to finance the water
and sewer system's capital program. Amounts do not include revenue bonds issued to permanently finance
previously issued commercial paper.

June 2019
New York City Financial Plan
FY 2019 Capital Plan
($ in millions)
Exhibit A-5
Revised
Plan Plan Change
City 10,358$ 10,358$ -$
Non-City 1
1,599 1,599 -
Total 11,957$ 11,957$ -$
Revised
Plan Plan Change
City 8,267$ 8,267$ -$
Non-City 1
1,388 1,388 -
Total 9,655$ 9,655$ -$
Notes:
1. Includes Federal, State and other Reimbursable Capital.
Projected Capital Commitments
Projected Capital Expenditures

The City of New York Mayor’s Office of Management and Budget 255 Greenwich Street - New York, New York 10007 - 2146 (212) 788-5900 Melanie Hartzog Director
June 19, 2019 TO THE FINANCIAL CONTROL BOARD
Pursuant to Section 8.3 of the Financial Emergency Act (the “Act”), the City hereby submits the Four Year Financial Plan for the City and Covered Organizations for fiscal years 2020-2023 (the “Plan”). The Plans for the Covered Organizations will be forwarded to you under separate cover. The Four Year Financial Plan has been prepared in accordance with generally accepted accounting principles (“GAAP”) except for the application of Statement No. 49 of the Governmental Accounting Standards Board (“GASB 49”), and with the exception of that portion of the plan related to Covered Organizations, which are prepared on a cash basis. The City hereby certifies that, in its judgment, the Plan is complete and complies with the standards set forth in Section 8.1 of the Act. Yours truly,
Melanie Hartzog
chinchac
Rectangle

TABLE OF CONTENTS
EXHIBIT A CITY OF NEW YORK - FINANCIAL PLAN A-1 Projection of Revenues and Expenditures A-2 Projections of Cash Sources and Uses A-3 Capital Plan Funding Sources A-4 Borrowing Schedule A-5 Capital Plan

June 2019
Four Year Financial Plan Revenues and Expenditures
($ in millions)
Exhibit A-1
REVENUES FY 2020 FY 2021 FY 2022 FY 2023
Taxes
General Property Tax 29,615$ 30,909$ 32,150$ 33,110$
Other Taxes 32,807 33,391 34,358 35,289
Tax Audit Revenue 999 721 721 721
Subtotal: Taxes 63,421$ 65,021$ 67,229$ 69,120$
Miscellaneous Revenues 6,957 6,909 6,882 6,876
Unrestricted Intergovernmental Aid - - - -
(1,820) (1,817) (1,815) (1,814)
Disallowances Against Categorical Grants (15) (15) (15) (15)
Subtotal: City Funds 68,543$ 70,098$ 72,281$ 74,167$
Other Categorical Grants 928 870 863 863
Inter-Fund Revenues 735 672 672 672
Federal Categorical Grants 7,228 7,071 6,998 6,967
State Categorical Grants 15,338 15,710 16,178 16,683
Total Revenues 92,772$ 94,421$ 96,992$ 99,352$
EXPENDITURES
Personal Service
Salaries and Wages 30,041$ 30,935$ 30,787$ 31,674$
Pensions 9,963 10,130 10,576 10,632
Fringe Benefits 1
11,342 11,854 12,527 13,228
Retiree Health Benefits Trust - - - -
Subtotal: Personal Service 51,346$ 52,919$ 53,890$ 55,534$
Other Than Personal Service
Medical Assistance 5,915 5,915 5,915 5,915
Public Assistance 1,651 1,651 1,651 1,650
All Other 1,2
31,272 30,476 30,787 31,020
Subtotal: Other Than Personal Service 38,838$ 38,042$ 38,353$ 38,585$
Debt Service 1,2
7,229 7,548 8,193 8,938
FY 2018 Budget Stabilization & Discretionary Transfers 1
- - - -
FY 2019 Budget Stabilization & Discretionary Transfers 2
(4,221) - - -
Capital Stabilization Reserve 250 250 250 250
General Reserve 1,150 1,000 1,000 1,000
Less: Intra-City Expenses (1,820) (1,817) (1,815) (1,814)
Total Expenditures 92,772$ 97,942$ 99,871$ 102,493$
Gap To Be Closed -$ (3,521)$ (2,879)$ (3,141)$
1Fiscal Year 2018 Budget Stabilization and Discretionary Transfers total $4.576 billion, including GO of $1.902 billion, TFA-FTS of $2.174 billion,
Retiree Health Benefits of $300 million and subsidies of $200 million. 2
Fiscal Year 2019 Budget Stabilization and Discretionary Transfers totals $4.221 billion, including GO of $1.702 billion, TFA-FTS of $2.319 billion
and subsidies of $200 million.
Less: Intra-City Revenue

June 2019
New York City Financial Plan
Four Year Projections of Cash Sources and Uses
($ in millions)
Exhibit A-2
Sources of Cash FY 2020 FY 2021 FY 2022 FY 2023
Funds Provided/(Used) from Operations -$ -$ -$ -$
Proceeds from Seasonal Borrowings - - - - Capital Plan Funding Sources (see Exhibit A-3) 10,566 12,191 13,689 15,054
Total Sources of Cash 10,566$ 12,191$ 13,689$ 15,054$
Uses of Cash
Capital Disbursements 10,566$ 12,191$ 13,689$ 15,054$ Repayment of Seasonal Borrowings - - - -
Total Uses of Cash 10,566$ 12,191$ 13,689$ 15,054$
Net Sources/(Uses) of Cash -$ -$ -$ -$
Cash Balance - Beginning of Period 8,860$ 8,860$ 8,860$ 8,860$ Cash Balance - End of Period 8,860$ 8,860$ 8,860$ 8,860$

June 2019
New York City Financial Plan
Four Year Capital Plan Funding Sources
($ in millions)
Exhibit A-3
Sources of Capital Cash FY 2020 FY 2021 FY 2022 FY 2023
New York City General Obligation Bonds 3,540$ 4,290$ 5,080$ 5,890$
Other Long-Term Sources:TFA-FTS 3,540 4,290 5,080 5,890 Water Authority 1,796 1,533 1,700 1,880
Subtotal Long-Term Sources 8,876$ 10,113$ 11,860$ 13,660$
Four Year Education Capital PlanTFA - Building Aid Revenue Bonds 103 31 78 25 Other State Funded Financing 209 203 104 65 Change in Non-City Cash (27) 36 30 2
Other Non-City Funds 863 1,367 1,213 929
Subtotal Reimbursable Capital 1,148$ 1,637$ 1,425$ 1,021$
Financial Plan Adjustment 542 441 404 373
Total Capital Plan Funding Sources 10,566$ 12,191$ 13,689$ 15,054$

June 2019
New York City Financial Plan
FY 2020 Borrowing Schedule
($ in millions)
Exhibit A-4
First Second Third Fourth Total
Quarter Quarter Quarter Quarter Financing
Short-Term Borrowing:
Borrowing -$ -$ -$ -$ -$
Repayment - - - - -
Total Short-Term
Borrowing (Repayment) -$ -$ -$ -$ -$
Capital Borrowing:
New York City General Obligation 2,360$ -$ 1,180$ -$ 3,540$
Transitional Financial Authority (TFA-FTS) 1,180 - 1,180 1,180 3,540
Water Authority 1
449 449 449 449 1,796
Total Borrowing to Finance
City Capital Program 3,989$ 449$ 2,809$ 1,629$ 8,876$
Notes:
1. Excludes costs of issuance and reserve fund allocations and reflects Water Authority Commercial Paper, Bond
Anticipation Notes, releases from debt service reserve funds, and revenue bonds issued to finance the water
and sewer system's capital program. Amounts do not include revenue bonds issued to permanently finance
previously issued commercial paper.

June 2019
New York City Financial Plan
Four Year Capital Plan
($ in millions)
Exhibit A-5
FY 2020 FY 2021 FY 2022 FY 2023 Total
City 14,617$ 13,583$ 16,215$ 16,324$ 60,739$
Non-City 1
1,778 1,769 655 476 4,678
Total 16,395$ 15,352$ 16,870$ 16,800$ 65,417$
FY 2020 FY 2021 FY 2022 FY 2023 Total
City 9,418$ 10,554$ 12,264$ 14,033$ 46,269$
Non-City 1
1,148 1,637 1,425 1,021 5,231
Total 10,566$ 12,191$ 13,689$ 15,054$ 51,500$
Notes:
1. Includes Federal, State and other Reimbursable Capital.
Projected Capital Commitments
Projected Capital Expenditures


TABLE OF CONTENTS
EXHIBIT B COVERED ORGANIZATIONS - FINANCIAL PLAN B-1 New York City Health + Hospitals B-2 New York City Transit Authority B-3 Staten Island Rapid Transit Operating Authority B-4 New York City Housing Authority B-5 Housing Development Corporation B-6 City University Construction Fund

Projected Projected Projected Projected Projected
2019 2020 2021 2022 2023
OPERATING REVENUES
Third Party Revenue
Medicaid 2,143.7 2,211.9 2,216.9 2,216.9 2,216.9
Medicare 1,071.9 1,121.6 1,132.0 1,142.5 1,152.7
Other Managed Care 359.0 359.0 359.0 359.0 359.0
Supplemental Medicaid 2,723.0 1,760.1 1,508.0 1,457.7 1,464.1
Disproportionate Share Hospital (DSH) 1,714.5 1,052.1 823.1 787.2 793.7
Other Supplemental Payments 1,008.5 708.0 684.9 670.5 670.5
Subtotal: Third Party Revenue 6,297.6 5,452.6 5,216.0 5,176.1 5,192.8
Other Revenue
City Services 793.9 1,001.0 1,038.4 1,087.0 1,088.2
Grants and Other 723.0 559.0 537.0 537.0 537.0
Subtotal: Other Revenue 1,516.9 1,560.0 1,575.4 1,624.0 1,625.2
Revenue-Generating Initiatives
Medicaid Waiver Program 347.0 164.5 120.0 120.0 120.0
Federal & State Charity Care - 120.0 85.0 62.0 62.0
Health Insurance Initiatives 355.0 530.0 685.0 710.0 710.0
Growth Initiatives 10.0 75.4 125.0 135.0 135.0
Subtotal: Revenue-Generating Initiatives 712.0 889.9 1,015.0 1,027.0 1,027.0
TOTAL REVENUES 8,526.5 7,902.5 7,806.4 7,827.2 7,845.0
EXPENSES
Personal Services 3,112.5 3,163.2 3,224.9 3,264.2 3,295.7
Fringe Benefits 1,677.5 1,598.9 1,654.6 1,740.5 1,790.9
Affiliations 1,135.1 1,149.3 1,166.8 1,181.3 1,192.9
Other Than Personal Services 2,952.1 2,448.3 2,444.2 2,498.9 2,549.3
Subtotal: Expenses 8,877.3 8,359.7 8,490.5 8,685.0 8,828.8
Expense-Reducing Initiatives
Procurement Efficiencies 125.0 145.0 155.0 155.0 155.0
Restructuring and Personnel Initiatives 269.4 385.0 430.0 430.0 430.0
Subtotal: Expense-Reducing Initiatives 394.4 530.0 585.0 585.0 585.0
TOTAL EXPENSES 8,482.9 7,829.7 7,905.5 8,100.0 8,243.8
INCOME/(LOSS) 43.6 72.8 (99.2) (272.8) (398.8)
OPENING CASH BALANCE 737.8 781.4 854.2 755.1 482.2
CLOSING CASH BALANCE 781.4 854.2 755.1 482.2 83.4
NYC Health + HospitalsFY 2020 Executive Financial Plan
Cash Basis ($ in millions)
EXHIBIT B-1

EXHIBIT B-2
DESCRIPTION 2019 2020 2021 2022
Cash Surplus from Previous Year 53.7$ 7.3$ -$ -$
REVENUE:
Farebox Revenue 4,391.6$ 4,404.4$ 4,394.1$ 4,397.6$
Other Operating Revenue 372.1 380.8 391.5 396.9
Capital & Other Reimbursement 1,578.6 1,364.9 1,252.1 1,230.4
TOTAL REVENUE 6,342.3$ 6,150.2$ 6,037.7$ 6,024.9$
SUBSIDIES:
Bridges & Tunnels Surplus Transfer 237.3$ 262.0$ 271.4$ 268.3$
18B Operating Assistance 316.2 316.2 316.2 316.2
Tax-Supported Subsidies 3,661.5 3,692.9 3,610.7 3,769.1
Taxi and FHV Surcharge Funds (1) 342.0 359.8 359.5 359.5
Other Subsidy Adjustments (139.2) (217.1) (260.2) (214.9)
TOTAL SUBSIDIES 4,417.8$ 4,413.8$ 4,297.6$ 4,498.1$
TOTAL REVENUE & SUBSIDIES 10,760.1$ 10,564.0$ 10,335.3$ 10,523.0$
EXPENSES:
Salaries and Wages 4,682.1$ 4,719.0$ 4,709.7$ 4,793.8$
Fringe Benefits 3,068.4 3,169.8 3,287.4 3,431.8
Other than Personal Services (2) 2,130.0 2,130.8 2,161.4 2,210.8 Subtotal Operating Expenses 9,880.6$ 10,019.6$ 10,158.5$ 10,436.4$
Debt Service 1,265.0$ 1,308.8$ 1,385.2$ 1,433.2$
TOTAL EXPENSES 11,145.6$ 11,328.4$ 11,543.7$ 11,869.6$
SURPLUS (DEFICIT) (385.5)$ (764.4)$ (1,208.4)$ (1,346.6)$
Below-the-Line Adjustments - Favorable (3) 339.1 438.6 651.0 676.9
CLOSING CASH BALANCE 7.3$ (318.5)$ (557.4)$ (669.7)$
(3) Assumes 4% fare increase in April 2019 and 4% increase in March 2021.
New York City Transit (NYCT)
2019-2022 FEBRUARY FINANCIAL PLAN CASH STATEMENT
(Calendar Years; $ in Millions)
(1) Includes baselined funding for the Subway Action Plan. Excludes $50M for the Outer Borough Transportation Account, assuming the funding will be used for capital
projects or tie to new projects.
(2) Other than Personal Services includes electric power, fuel, insurance, claims, paratransit service contracts, maintenance & other operating contracts, professional
service contracts, materials & supplies, and other business expenses.

EXHIBIT B-3
DESCRIPTION 2019 2020 2021 2022
Cash Deficit from Previous Year (51.0)$ (53.8)$ (53.2)$ (59.2)$
REVENUE:
Farebox Revenue 7.0$ 7.1$ 7.1$ 7.1$
Other Operating Revenue 2.5$ 2.5$ 2.5$ 2.5$
Capital & Other Reimbursement 4.6$ 4.6$ 4.7$ 4.8$
TOTAL REVENUE 14.1$ 14.1$ 14.2$ 14.3$
SUBSIDIES:
18B Operating Assistance 1.1$ 1.1$ 1.1$ 1.1$
Tax-Supported Subsidies 4.3$ 4.4$ 4.6$ 4.8$
City Subsidy 51.0$ 54.0$ 53.5$ 59.7$
TOTAL SUBSIDIES 56.5$ 59.6$ 59.3$ 65.7$
TOTAL REVENUE & SUBSIDIES 70.5$ 73.7$ 73.4$ 80.0$
EXPENSES:
Salaries and Wages 30.7$ 29.4$ 29.8$ 30.3$
Fringe Benefits 23.1$ 22.6$ 22.8$ 22.7$
Other than Personal Services (1) 16.0$ 12.3$ 11.2$ 11.5$ Subtotal Operating Expenses 69.8$ 64.2$ 63.8$ 64.5$
Debt Service 3.7$ 8.9$ 15.9$ 20.5$
TOTAL EXPENSES 73.5$ 73.2$ 79.7$ 84.9$
SURPLUS (DEFICIT) (3.0)$ 0.5$ (6.2)$ (5.0)$
Below-the-Line Adjustments - Favorable (2) 0.2$ 0.0$ 0.2$ 0.0$
CLOSING CASH BALANCE (3) (53.8)$ (53.2)$ (59.2)$ (64.1)$
(3) SIRTOA cash deficits shown above are due to the billing schedule for the City subsidy. The MTA finalizes the SIRTOA deficit in July for the previous year, and bills the City in
August.
Staten Island Railway (SIR)
2019-2022 FEBRUARY FINANCIAL PLAN CASH STATEMENT
(Calendar Years; $ in Millions)
(1) Other than Personal Services includes electric power, fuel, insurance, claims, maintenance & other operating contracts, professional service contracts, materials &
supplies, and other business expenses.
(2) Assumes 4% fare increase in April 2019 and 4% increase in March 2021.

New York City Housing Authority
2019 Five Year Operating Plan
2019-2023 Operating Plan by FundsAll Funds
2019 2020 2021 2022 2023RevenuesRevenue from Operations:Tenant Rental Revenue 1,046,534 1,044,863 1,045,590 1,054,023 1,062,551Other Revenue from Operations 20,345 20,161 20,045 20,045 20,045Total Revenue from Operations 1,066,879 1,065,025 1,065,635 1,074,068 1,082,595
Other RevenuesFederal Subsidies 944,026 975,293 986,331 1,014,394 1,047,113Debt Services Subsidy 230 180 131 81 40Section 8 Phased Conversion 54,889 51,516 52,238 52,926 53,582Section 8 Management Fees - - - - - Capital Fund Reimbursements 4,697 4,697 4,697 4,697 4,697Interest on Investments 10,519 11,834 11,834 11,834 11,834Other 24,948 23,512 24,069 24,439 24,816Categorical Grants 2,665 1,383 883 883 883Section 8 Subsidy 1,037,497 1,019,251 1,101,347 1,097,872 1,097,217Section 8 Admin 75,333 76,141 75,614 74,992 74,992City Funds 288,310 197,992 199,982 190,153 177,173Total Other Revenues 2,443,115 2,361,800 2,457,127 2,472,274 2,492,348Total Revenues 3,509,995 3,426,825 3,522,761 3,546,342 3,574,943
ExpendituresPersonal Service:Salary F/T 649,601 669,331 681,563 683,694 685,127Salary P/T 1,020 789 298 149 - Seasonal 26,026 26,026 26,026 26,026 26,026Overtime 85,534 85,042 84,706 84,705 84,705Shift Differential 1,477 1,477 1,476 1,476 1,476Retro 286 286 286 286 286Fringe 568,552 586,563 604,364 618,827 631,380Other Salary 12,882 12,889 12,827 12,819 12,819Total Personal Service 1,345,378 1,382,403 1,411,545 1,427,983 1,441,820
Other Than Personal Service:Leases 43,317 46,537 47,288 48,366 49,469Supplies 78,934 71,805 71,165 70,678 70,191Equipment 17,129 16,401 15,667 15,871 16,365Utilities 542,755 546,678 555,039 561,618 567,354Contracts 374,591 357,242 305,160 304,509 303,802Debt Services 2,205 6,008 9,852 9,485 9,137Insurance 13,453 15,380 66,606 71,004 75,938OTPS Other 31,438 23,046 22,974 22,821 22,669Housing Assistance Payments 1,027,419 1,028,480 1,109,789 1,106,282 1,105,626Total Other Than Personal Service 2,131,241 2,111,577 2,203,539 2,210,635 2,220,551
Total Expenditures 3,476,620 3,493,980 3,615,084 3,638,618 3,662,370
Surplus/(Deficit) 33,375 (67,155) (92,323) (92,277) (87,427)
HAP Reserve (HUD-HELD) - 9,229 8,441 8,410 3,371Admin Reserve - 2,249 10,962 12,099 17,906Surplus from Prior year - 33,375 - - - Surplus/(Deficit) net of Reserves 33,375 (22,302) (72,919) (71,768) (66,150)

EXHIBIT B-5
Reporting Categories 2019 2020 2021 2022 2023
Operating Revenues
Interest on Loans 434,428 473,527 516,144 562,597 613,231
Fees and Charges 63,738 65,013 66,313 67,639 68,992
Income on Loan Participation Interests 5,000 5,000 5,000 5,000 5,000
Other Operating Revenues 2,000 2,000 2,000 2,000 2,000
Subtotal, Operating Revenues 505,166 545,539 589,457 637,236 689,223
Operating Expenses
Interest, Amortization of Bond Discount/Premium 349,788 376,022 404,224 434,540 467,131
Salaries and Related Expense (1)
27,070 27,883 28,719 29,581 30,468
Trustee and Other Fees 9,161 9,344 9,531 9,721 9,916
Debt Issuance Costs 13,117 13,511 13,916 14,333 14,763
Corporate Operating Expenses 7,165 7,523 7,900 8,295 8,709
Subtotal, Operating Expenses 406,301 434,282 464,289 496,470 530,987
Non-Operating Revenues (Expenses)
Earnings on Investments (2)
56,538 62,192 68,411 75,252 82,777
Non-Operating Revenues (Grant Income and others) (3)
- - - - -
Non-Operating Revenues (Expenses), Net 2,000 1,000 1,000 1,000 1,000
Subtotal, Non-Operating Revenues 58,538 63,192 69,411 76,252 83,777
Transfers 568 585 602 620 639
Special Item (4) - - - - -
Change in Net Assets 157,970 175,033 195,181 217,638 242,651
Net Assets, Beginning of Year (5)
2,703,758 2,861,728 3,036,761 3,231,942 3,449,580
Net Assets, End of Year (5)
2,861,728 3,036,761 3,231,942 3,449,580 3,692,231
New York City Housing Development Corporation
Five Year Financial Plan -- Schedule of Revenues, Expenditures and Fund Balances
HDC Fiscal Years 2019 through 2023
Accrual Basis, Dollars in Thousands
HDC Programs Only
(1) As of October 31, 2018, the total OPEB Liability (Other Post Employment Benefits) was $22,224,000 and the Total Pension Liability was $42,483,000. A
Portion of each amounts are included in the plan annual salaries expense.
(5)Net Assets of the Corporation consist principally of loan assets (notes and mortgages) and restricted and dedicated invested funds. The assets are
reserved by bond covenant, contract and/or HDC policy.
(3)In 2018, this amount was primarily the result of the Corporation receiving a 421A Trust grant funds from the Battery Park City Authority.
(2)Earnings on Investments includes fair value depreciation of $10.88 million for FY 2018.
(4)As a result of 2018 B-1 and B-2 securitization of City assests in FY 2018.
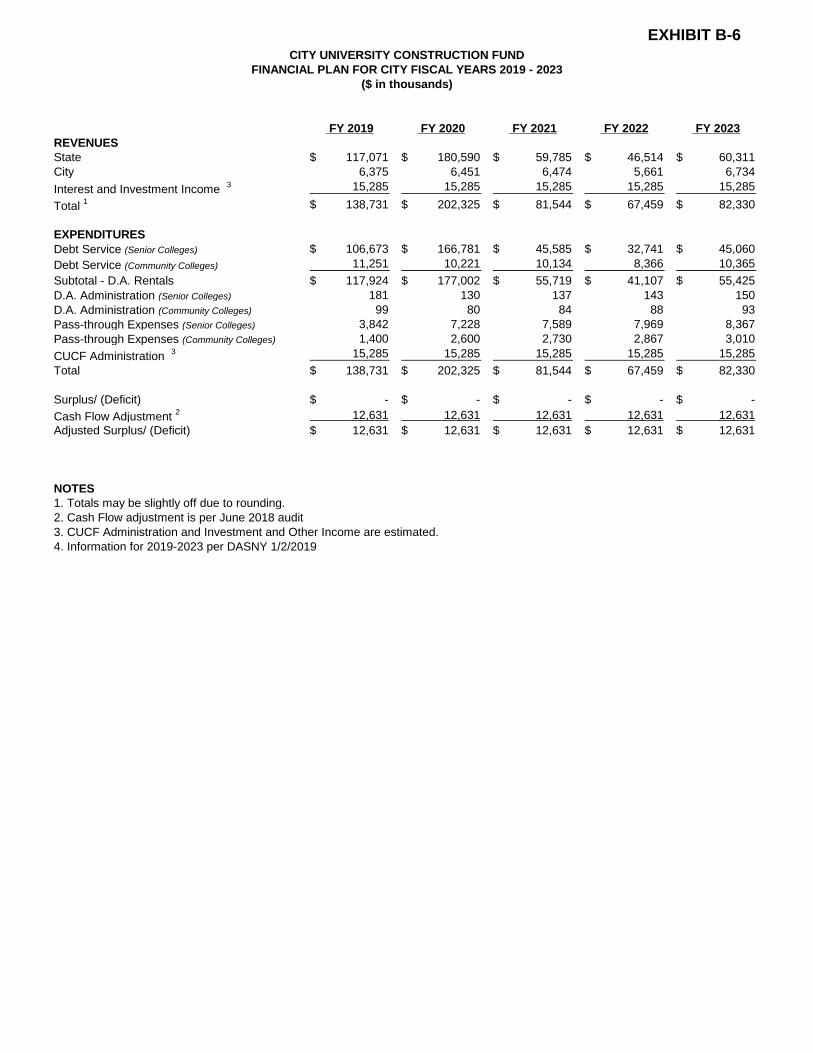
EXHIBIT B-6
FY 2019 FY 2020 FY 2021 FY 2022 FY 2023
REVENUES
State 117,071$ 180,590$ 59,785$ 46,514$ 60,311$
City 6,375 6,451 6,474 5,661 6,734
Interest and Investment Income 3 15,285 15,285 15,285 15,285 15,285
Total 1 138,731$ 202,325$ 81,544$ 67,459$ 82,330$
EXPENDITURES
Debt Service (Senior Colleges) 106,673$ 166,781$ 45,585$ 32,741$ 45,060$
Debt Service (Community Colleges) 11,251 10,221 10,134 8,366 10,365
Subtotal - D.A. Rentals 117,924$ 177,002$ 55,719$ 41,107$ 55,425$
D.A. Administration (Senior Colleges) 181 130 137 143 150
D.A. Administration (Community Colleges) 99 80 84 88 93
Pass-through Expenses (Senior Colleges) 3,842 7,228 7,589 7,969 8,367
Pass-through Expenses (Community Colleges) 1,400 2,600 2,730 2,867 3,010
CUCF Administration3 15,285 15,285 15,285 15,285 15,285
Total 138,731$ 202,325$ 81,544$ 67,459$ 82,330$
Surplus/ (Deficit) -$ -$ -$ -$ -$
Cash Flow Adjustment 2 12,631 12,631 12,631 12,631 12,631
Adjusted Surplus/ (Deficit) 12,631$ 12,631$ 12,631$ 12,631$ 12,631$
NOTES
1. Totals may be slightly off due to rounding.
2. Cash Flow adjustment is per June 2018 audit
3. CUCF Administration and Investment and Other Income are estimated.
4. Information for 2019-2023 per DASNY 1/2/2019
CITY UNIVERSITY CONSTRUCTION FUND
FINANCIAL PLAN FOR CITY FISCAL YEARS 2019 - 2023
($ in thousands)