
The City of Grimes Comprehensive Plan... · The City of Grimes PREPARED WITH THE ... Kristin Haar...
102
The City of Grimes PREPARED WITH THE CITY OF GRIMES BY RDG PLANNING & DESIGN SEPTEMBER, 2010 COMPREHENSIVE PLAN A COMPREHENSIVE DEVELOPMENT PLAN FOR GRIMES, IOWA
Transcript of The City of Grimes Comprehensive Plan... · The City of Grimes PREPARED WITH THE ... Kristin Haar...

The City of Grimes
PREPARED WITH THE CITY OF GRIMES BY RDG PLANNING & DESIGN SEPTEMBER, 2010
COMPREHENSIVE PLAN
A COMPREHENSIVE DEVELOPMENT PLAN FOR GRIMES, IOWA

AcknowledgementsThe authors gratefully acknowledge the friendship, support and cooperation of the residents of the City of Grimes. It is to
them that we dedicate this plan. We would like to express special gratitude to city staff, Grimes Chamber and Economic
Development, and the Grimes Comprehensive Plan Steering Committee whose leadership was a critical part of a success-
ful planning process.
MayorTom Armstrong ◦
City Council MembersTom Shatava ◦
Mathew Tapper ◦
Tami Evans ◦
Jill Altringer ◦
Craig Patterson ◦
Planning and Zoning CommissionWayne Chizek ◦
William Bohan ◦
Kristin Haar ◦
Steve Reneker ◦
Steve Valline ◦
City AdministratorKelley Brown ◦
Grimes Chamber and Economic Development
Brian Buethe ◦
Steering CommitteeTom Armstrong ◦
Kelley Brown ◦
Brian Buethe ◦
Aaron Chittenden ◦
Mitzi Chizek ◦
John Feltner ◦
Kristin Haar ◦
Mike Martin ◦
Craig Patterson ◦
Donald Rice ◦
Gary Sinclair ◦
Planning Team, RDG Planning & Design
Martin Shukert, FAICP ◦
Amy Haase, AICP ◦
Gary Lozano, AICP ◦
Isha Bhattarai ◦
Christopher Stara ◦
Lea Schuster ◦
Ben Iwen ◦
Mike Bell, ASLA ◦

Table of ContentsIntroduction 7
Section One: A Profile of Grimes 9Chapter 1: A Demographic and Economic Profile of Grimes 11
Chapter 2: A Land Use Profile 21
Map 2.1 Existing Land Use 23
Map 2.2 Natural Features 25
Map 2.3 Contours 26
Chapter 3: Public Facilities and Infrastructure 33
Map 3.1 Existing Parks and Recreation 34
Map 3.2 Parks Service Area 39
Map 3.3 Sanitary Sewer System 47
Map 3.4 Storm Sewer System 48
Map 3.5 Water System 50
Map 3.6 Existing Street Classification 53
Section Two: A Community Vision 57Chapter 4: A Vision For Grimes 59
Section Three: A Community Plan 65Chapter 5: Development Vision 67
Map 5.1 Development Concept 70
Map 5.2 Future Land Use 74
Map 5.3 Future Transportation Plan 81
Map 5.4 Future Park, Greenways, and Trails 84
Map 5.5 Governors District Concept 92
Chapter 6: Implementing the Grimes Plan 101
Map 6.1 Phased Annexation 106

Introduction : Page 7
The Grimes Plan
Introduction
Grimes is a vibrant community in a strategic location for future growth. The city’s prospects present both exciting challenges and opportunities. Grimes’ history began as a small farming community in the northwest corner of Polk County. As Polk County’s urban population has grown, Des Moines’ development demand has created new opportunities for the city. The region’s agricultural base plays less of a role in the city’s future which is now impacted more by economic demand created from the larger metropolitan area and the pressure of state-wide agricultural interests.
The Grimes Plan is designed to provide a comprehensive vision of the city’s future, based on taking actions that will improve the lives of residents and make the city uniquely attractive for potential growth.
The Role of a Comprehensive Plan
The comprehensive development plan for Grimes has two fundamental purposes. The first provides an essential le-gal basis for land use regulation such as zoning and sub-division control. Secondly, a modern comprehensive plan presents a unified and compelling vision for a community, derived from the aspirations of its citizens; and establishes the specific actions necessary to fulfill that vision.
LEGAL ROLE
Communities prepare and adopt comprehensive plans for legal purposes. Section 414 of the Code of Iowa enables cities to adopt zoning and subdivision ordinances to pro-mote the “health, safety, morals, and general welfare of the community.” Such regulations are required by Iowa Code to be in conformance with a comprehensive plan. Land use regulations, such as zoning ordinances, recog-nize that people in a community live cooperatively and have certain responsibilities to one another. These regu-lations establish rules that govern how land is developed within a municipality and its extra-territorial jurisdiction.
The comprehensive plan creates a vision for how a com-munity should develop and thus should guide land use decisions.
THE COMMUNITY BUILDING ROLE
A comprehensive development plan has an even more significant role in the growth of a community. Based on the participation of residents in the planning of their com-munity, the plan establishes a picture of Grimes’ future. This vision continues to be crucial, as challenges related to population growth and economic changes affect the char-acter of Grimes. The plan is designed as a working docu-ment that both defines the future and provides a working program for realizing the city’s great potential.
The Comprehensive Plan: Approach and Format
The comprehensive plan takes a goal-oriented approach to the future development of Grimes. The plan is laid out in three sections identifying the city’s existing conditions and growth need, establishing a community vision, and
Introduction

Introduction : Page 8
The Grimes Plan
Introduction
formation of a plan that fulfills the first two sections. The traditional sections of a comprehensive plan, such as land use, housing, infrastructure, and transportation, are orga-nized as leading components of the city’s vision. This en-ables the plan to tell the story of the city’s existing op-portunities and challenges while weaving those into the future vision and development of the community.
PLAN SECTIONS
Section 1: A Profile of Grimes
This section of the plan reviews the city’s existing condi-tions and growth needs and is divided into three chap-ters:
Grimes’ Demographic and Economic Profile1.
Land Use Profile2.
Public Facilities and Infrastructure Profile covering 3. transportation, parks, public buildings, and infrastruc-ture systems.
Section 2: A Community Vision
The residents and stakeholders of Grimes play an impor-tant role in establishing and realizing the vision for a fu-
ture Grimes. This section summarizes the findings of the community participation process and identifies key issues and perspectives. Based on this process and the city Pro-file the plan’s goals and guiding principles are established. The section identifies the Plan’s Policy Statements, the general principles and ideas that guide the overall Com-munity Plan.
Section 3: Community Plan
This section considers Grimes’ most critical issues – how to accommodate growth and in what direction that growth should occur. It provides a detailed strategy to guide fu-ture growth in new development areas and the traditional community core. The city’s development strategy is ho-listic incorporating all the necessary components for a strong and vibrant community, including parks, transpor-tation, public facilities, and infrastructure. The final chap-ter of this section draws together the analysis and policies of the plan into a program for implementation. It summa-rizes the recommendations and development policies of the plan, and presents an Implementation Schedule, list-ing proposed projects and the time frame for their com-pletion.

section one A PROFILE OF GRIMES
Section 1 : Page 9

Chapter 1 : Page 11
Section One: A Profile of Grimes The Grimes Plan
This chapter examines demographic and economic trends that will affect Grimes. The analysis examines population and demographic dynamics, including future population, and important regional issues that will affect the quality of the city’s environment.
Population History and Characteristics
This discussion presents important changes in the char-acteristics and dynamics of Grimes’ population. Table 1.1 summarizes the historical population change in Grimes and includes comparisons with Johnston, Ankeny, Pella, Carlisle, Polk City, Urbandale, and Waverly, Nebraska (Wa-verly is a similarly situated community along Interstate 80 northeast of Lincoln, NE ). Table 1.1 indicates:
Grimes has experienced significant growth over the • last forty years.
The construction boom that was seen between 2005 • and 2007 contributed significantly to a 65.1% gain in population between 2000 and 2009.
Table 1.1: Population Change for Grimes and Other Iowa Cities, 1960-2009
1960 1970 1980 1990 20002009
Estimate% Change 1960-2000
% Change 2000-2009
Grimes 697 834 1,973 2,653 5,098 8,419 631.4% 65.1%
Johnston - 222 2,526 4,702 8,649 15,691 3,795.9% 81.4%
Ankeny 2,964 9,151 15,429 18,482 27,117 42,287 814.9% 55.9%
Pella 5,198 6,668 8,349 9,270 9,832 10,208 89.1% 3.8%
Carlisle 1,317 2,246 3,073 3,241 3,497 3,693 165.5% 5.6%
Polk City 567 715 1,658 1,908 2,344 3,201 313.4% 36.6%
Urbandale 5,821 14,434 17,869 23,500 29,072 38,369 399.4% 32.0%
Waverly, Nebraska 511 1,152 1,726 1,869 2,448 2,649 379.1% 8.2%
Source: US Census Bureau, 2000
Chapter 1A DEMOGRAPHIC & ECONOMIC PROFILE OF GRIMES
Over the past 50 years significant growth has occurred • in all of the Des Moines Metropolitan Area suburbs, in-cluding Ankeny, Johnston and Urbandale. Significant growth within these cities began much earlier, given their closer proximity to Des Moines.
To better understand the city’s future population dynamics it is important to look at the composition of the city’s pop-ulation. Chart 1.1 examines the city’s population divided into 5 year age increments or cohorts. Table 1.2 compares the actual 2000 population with a predicted population for 2000. Average birth and death rates are applied to cohort data from 1990 to determine the 2000 predicted population. The comparison between actual and predict-ed provides an indication of which cohorts experienced growth (or decline) beyond natural population change.

Chapter 1 : Page 12
Section One: A Profile of GrimesThe Grimes Plan
Grimes, attracted to projects such as Glenstone Vil-lage. Grimes’ image as a small town close to services and amenities of the larger metropolitan area make it attractive to many older adults.
The decline in population over the age of 85 could be • caused by a higher than normal death rate, or older residents leaving the city for services and amenities that cannot be found in Grimes, such as assisted living and nursing home care.
Population Projections
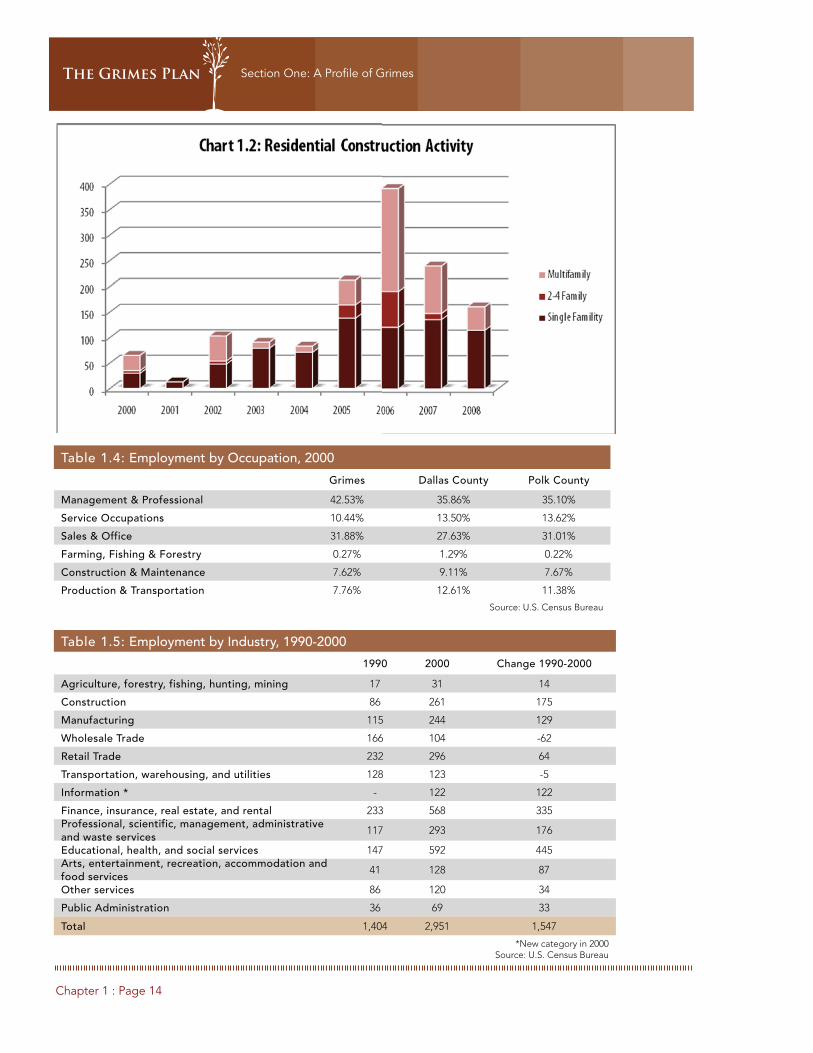
Projecting Grimes’ population is the first step in under-standing the future demographic character of the commu-nity and the city’s future land use and community service needs and policies. By evaluating Grimes’ historic popula-tion and economic trends, along with construction activ-ity, a projected future population can be formulated. Ta-bles 1.3 and Chart 1.2 provide insight into the city’s natu-ral population change, population growth scenarios, and recent construction activity.
Residents between the ages of 35 and 39 made up • the largest cohort in 2000. Young adults aged 25 to 44 comprise the overall largest group. This is a reflec-tion of the increasing popularity of Grimes as a place to raise families, and therefore a growing population of residents under the age of 14.
Overall Grimes has a fairly young population. The city’s • median age in 2000 was 30.7 and 49% of the popula-tion was under the age of 30. For the State of Iowa as a whole the median age is 38.07.
Grimes’ population under the age of ten grew at a rate • similar to that of their parents’ cohorts (25-34). This in-dicates an increased interest in the development of Grimes as a community for families with young children within the Des Moines Metropolitan Area.
The growth among residents in cohorts 60-84 is the • result or combination of two possible scenarios. One scenario would be that death rates were much low-er than would have been predicted and second, that older professionals and retirees are also migrating to

Chapter 1 : Page 13
Section One: A Profile of Grimes The Grimes Plan
Table 1.2:Predicted and Actual Age Cohort Change
Age Group
2000 Predicted
2000 Actual
Difference (Actual–
Predicted)
% Variance 1990-2000
Under 5 190 546 356 188%
5 to 9 218 517 299 137%
10 to14 265 384 119 45%
15-19 276 324 48 17%
20-24 216 255 39 18%
25-29 171 452 281 165%
30-34 155 524 369 239%
35-39 307 610 303 99%
40-44 292 412 120 41%
45-49 261 304 43 16%
50-54 199 239 40 20%
55-59 97 125 28 29%
60-64 81 126 45 55%
65-69 51 71 20 40%
70-74 51 75 24 48%
75-79 37 56 19 50%
80-84 31 52 21 67%
85+ 31 26 -5 -17%
Total 2,929 5,098 2,169 74%
Based on natural population change, which calculates • the number of births to deaths, the city’s population would increase moderately.
During the 1990s the city’s population grew by 9.48% • annually. This rate slowed during the last decade to 6.4% annually.
Construction activity since 2000 would indicate that • the city’s population has grown at about 7.9% annu-ally, driven by a construction spike between 2005 and 2007. Since 2008 the national residential housing mar-kets have experienced a significant downturn that has slowed development.
Grimes’ location and strong growth throughout the last • twenty years, coupled with the availability of numerous large tracts of developable farmland, support contin-ued growth for the city.
Although recent and near-future growth may not be • as strong, the city’s goals should lay the ground work for continued population increases of 6.4% annually through 2015 before moderating to a 5% rate that ac-counts for overall growth in total population. This will result in a 2030 estimated population of 27,030.
Table 1.3: Projected Population
2000 2009 2010 2015 2020 2025 2030
Natural Pop Change 5,098 5,423 5,534 5,689 5,852 6,002 6,101
6.7% Annual Growth 5,098 8,597 10,458 14,496 20,095 27,856 38,615
6.4% Annual Growth 5,098 8,419 9,517 13,002 17,764 24,270 33,158
6.4% Annual Growth, adjusted to 5% in 2020
16,594 21,179 27,030
5.1% Annual Growth 5,098 7,590 8,811 11,300 14,491 18,583 23,830
7.9% Annual Growth 5,098 8,791 11,051 16,183 23,697 34,700 50,812
Source: City of Grimes, U.S. Census Bureau, RDG Planning & Design; 2008
Chapter 1 : Page 14
Section One: A Profile of GrimesThe Grimes Plan
Table 1.4: Employment by Occupation, 2000
Grimes Dallas County Polk County
Management & Professional 42.53% 35.86% 35.10%
Service Occupations 10.44% 13.50% 13.62%
Sales & Office 31.88% 27.63% 31.01%
Farming, Fishing & Forestry 0.27% 1.29% 0.22%
Construction & Maintenance 7.62% 9.11% 7.67%
Production & Transportation 7.76% 12.61% 11.38%
Source: U.S. Census Bureau
Table 1.5: Employment by Industry, 1990-2000
1990 2000 Change 1990-2000
Agriculture, forestry, fishing, hunting, mining 17 31 14
Construction 86 261 175
Manufacturing 115 244 129
Wholesale Trade 166 104 -62
Retail Trade 232 296 64
Transportation, warehousing, and utilities 128 123 -5
Information * - 122 122
Finance, insurance, real estate, and rental 233 568 335Professional, scientific, management, administrative and waste services
117 293 176
Educational, health, and social services 147 592 445Arts, entertainment, recreation, accommodation and food services
41 128 87
Other services 86 120 34
Public Administration 36 69 33
Total 1,404 2,951 1,547
*New category in 2000Source: U.S. Census Bureau

Chapter 1 : Page 15
Section One: A Profile of Grimes The Grimes Plan
Economic Factors
Historically Grimes’ economy was independent from the Des Moines Metro Area, focused primarily in the agricul-tural economy of rural Iowa. Over the last thirty years how-ever, an economic transition has occurred in the city with residents moving to Grimes because of its good schools, quality of life, and proximity to major employment cen-ters in Des Moines and surrounding suburban cities. The following text reviews the city’s employment and income trends.
EMPLOYMENT
Employment within a community can be assessed in two different ways. One is based on the resident’s employ-ment by occupation, while the other is based on a resi-dent’s employment by industry. Employment by occupa-tion describes the kind of work a person does on the job, as opposed to the type of industry an individual works in, which relates to the kind of business conducted by a per-son’s employer. For example, a person might be an ac-countant (their occupation) for a major manufacturer (the industry).
Tables 1.4 and 1.5 examine Grimes’ employment trends.
Over 42% of Grimes’ residents are employed in man-• agement and professional occupations, while another 32% are employed in sales and office occupations.
Unlike Dallas County and Polk County, Grimes ◦has a lower percentage of its population em-ployed in so called “blue collar” professions, such as manufacturing and transportation.
These employment patterns have an important ◦impact on household incomes in the city.
During the 1990s Grimes was attracting residents em-• ployed in education, health, and social services sec-tors.
Over the next fifteen years the Metropolitan Planning • Organization estimates that the fastest growing indus-try sectors in Grimes will be information technology, fi-nance, insurance, and real estate, and professional and business services.
INCOME AND RETAIL SALES
Table 1.6 describes the income distribution for Grimes, Dallas County, Polk County, the State of Iowa and Waver-ly, Nebraska.
With more residents employed in higher paying man-• agement and professional oriented occupations the city’s median household income is 11% and 25% great-er than that of Dallas and Polk Counties respectively.
Over 66% of the city households earn more than the • state’s median income.
Income distribution trends for Grimes are similar to • those seen in Ankeny and Waverly, Nebraska, but has the largest percentage of households earning over $75,000.
Table 1.7 compares the city’s consumer expenditures with retail sales. The gap or surplus between these two identi-fies areas where the city is an importer or exporter of retail dollars. If sales are greater than consumer expenditures the city is an importer and vice versa.
Residents in Grimes fill the majority of their consum-• er needs in neighboring markets, such as Urbandale, Johnston, and West Des Moines. This is due to the lim-ited amount of commercial retail that has been devel-oped within the city.
Table 1.6: Income Distribution for Households by Percentage Under
$15,000$15,000-24,999
$25,000-34,999
$35,000-49,999
$50,000-74,999
Over $75,000
2009 Median Income
Grimes 6.26 4.30 7.54 15.23 21.26 45.42 $69,602
Dallas County 6.95 7.8 10.13 14.77 20.41 39.96 $62,698
Polk County 9.10 9.02 10.90 16.00 21.95 33.02 $55,664
Iowa 11.31 11.35 12.24 17.29 22.13 25.67 $48,098
Ankeny, Iowa 6.02 6.72 8.81 13.33 22.14 42.98 $67,076
Waverly, Nebraska 5.42 6.83 9.76 14.75 27.11 36.11 $62,201
Source: Claritas, Inc. 2007

Chapter 1 : Page 16
Section One: A Profile of GrimesThe Grimes Plan
Table 1.7: Retail Analysis, 2008 (In Millions of $)
Total Retail SalesConsumer Demand
Retail Sales
Gap/Surplus
Grimes 91.2 75.1 16.0
Johnston 244.6 132.6 111.9
Urbandale 603.6 502.4 101.4
Ankeny 595.0 436.5 158.5
Carlisle 47.4 25.1 22.3
Pella 134.5 120.6 13.9
Polk City 43.8 17.0 26.8
Waverly, Nebraska 33.2 16.8 16.4
Source: Claritas, Inc. 2009
Table 1.8: Change in Key Housing Occupancy Indicators
1990 20002009
EstimateChange
1990-2000Change
2000-2009% Change 1990-2000
Total Housing Units 1,005 1,958 2,763 953 805 94.8%
Owner Occupied Units 715 1,531 2,174 816 643 114.1%
% Owner Occupied 73% 81% 82%
Renter Occupied Units 266 356 479 90 123 33.8%
% Renter Occupied 27% 19% 18%
Vacant Units 24 71 110 47 39 195.8%
Vacancy Rate 2.4% 3.6% 4.0%
Median Value $60,300 $119,500 $153,433 59,200 33,933 98.2%
Median Contract Rent $403 $467 64 15.9%
Source: U.S. Census Bureau; Claritas, Inc. 2009
Table 1.9: Comparative Housing Trends, Grimes and Other Communities, 2009
% Owner-Occupied Median Value Average Length of Residency – All Occupied Units
Grimes 82% $153,433 6
Johnston 73% $251,451 5
Urbandale 79% $178,304 7
Ankeny 74% $169,081 6
Carlisle 76% $124,882 11
Pella 69% $159,663 9
Polk City 82% $163,934 8
Waverly, Nebraska
76% $136,269 10
State of Iowa 73% $111,844 11
Source: Claritas Inc., 2009

Chapter 1 : Page 17
Section One: A Profile of Grimes The Grimes Plan
Grimes attracts retail spending in:•
Automotive Dealers ◦
Building Materials and Gardening Equipment ◦
Gasoline Stations ◦
Grimes is an exporter of consumer spending in:•
Electronic and Appliance Stores ◦
Food and Beverage Stores ◦
Food Service and Drinking Places ◦
Health and Personal Care Stores ◦
Clothing and Clothing Accessories Stores ◦
Sporting Goods, Hobby, Book, Music Stores ◦
General Merchandise Stores (Wal-Mart, Target, ◦etc.)
Analysis of the city’s retail spending brings to light oppor-tunities for the city. Areas where the city exports dollars identify opportunities to tap into local consumer dollars, while areas that the city imports dollars are possible niche markets for the city to build upon. The city should see a substantial increase in General Merchandise sales with the opening of the Wal-Mart Super Center in 2010.
HOUSING ASSESSMENTS
There is an interconnection between such demographic and economic factors as population trends, income, and employment and a community’s housing stock. Table 1.8 compares changes in housing occupancy from 1990 to 2009.
Overall housing numbers have increased substantially • over the nearly 20 year time period but only 13% of all new occupied-units have been for renters. .
The percentage of renter-occupied units in the market • has decreased to 18%, much lower than what is con-sidered a balanced market at 30% to 35% renter oc-cupancy.
The city’s vacancy rate has also increased to a healthier • 4%. Low vacancy rates limit the amount of choice that potential buyers have in the market. Construction activ-ity through 2007 was very strong and remained strong during the downturn in 2008 and 2009, likely indicating that construction activity was marginally keeping pace with demand.
Table 1.9 presents a comparison of housing values in Grimes, Johnston, Urbandale, Carlisle, Pella, Polk City, and Waverly, Nebraska.
The 2009 estimated home value in Grimes was lower • than most comparable cities but nearly $42,000 higher than the state-wide median.
Typically median income and housing values corre-• spond with one another; however, Grimes’ lower me-dian housing value may be a reflection of construction patterns from the 1990s. A substantial amount of the housing from this period was constructed for first time home buyers. Attracting many young families.
Grimes’ lower median values also reflect its later en-• try into the metropolitan construction boom, especially compared to communities like Johnston and Urban-dale.

Chapter 1 : Page 18
Section One: A Profile of GrimesThe Grimes Plan
COMMUTING PATTERNS
In 2000 the average commute for a Grimes resident was 21 minutes, indicating that a large number of residents work outside the community, likely in Des Moines and the surrounding suburbs. A tight development pattern and good pedestrian access and facilities influence the per-centage of residents walking to work and the opportuni-ty for a healthier lifestyle. Pella has these characteristics, along with a strong employment base, resulting in their very high percentage of people who walk to work. Grimes, Johnston, and many of the other communities surround-ing Des Moines have experienced more recent develop-ment that is less pedestrian friendly. The growth in these cities has also been related to regional job growth, often forcing residents to use cars to travel to work.
Table 1.10 Commuting Patterns for Grimes and Other Comparable Communities, 2008
Average Travel Time to Work % Who Walked to Work
Grimes 21.46 1.20%
Johnston 19.92 0.85%
Urbandale 20.47 1.26%
Ankeny 21.94 1.05%
Carlisle 28.13 1.52%
Pella 12.68 13.61%
Polk City 20.16 2.02%
Waverly, Nebraska 21.82 3.64%
Source: Claritas, Inc. 2009

Chapter 1 : Page 19
Section One: A Profile of Grimes The Grimes Plan
Chapter 2 : Page 21
Section One: A Profile of Grimes The Grimes Plan
Land use is typically the central element of a comprehensive plan because it establishes the overall physical configuration of the city – the mix and location of uses and the nature of community systems that support them. Because the land use plan is a statement of policy, public and private decision makers depend on it to guide individual actions such as land purchases, project design, and the review and approval process. This chapter reviews existing patterns of development, potential market needs, and the character of the natural environment.
Chapter 2
A LAND USE PROFILE OF GRIMES
Land Use Patterns in Grimes
Grimes’ land use patterns grew outward from the small farming community along a railroad spur. The early city had a much closer relationship between the commercial core and the residential development surrounding this core. By the 1960s and ‘70s the city began to grow but in a slightly more dispersed pattern. While industrial and commercial developments grew to the south adjacent to the new interstate, residential development grew to the north of the downtown. The railroad remained a central element in the community, often limiting east west access in both older and newer portions of the city. In the last ten years commercial development has accelerated on the east side of the city, away from the historic core. Resi-dential development has continued to grow incrementally with some dispersed developments on the east side of Highway 141. Map 2.1 illustrates Grimes current develop-ment patterns.
LAND USE CHARACTERISTICS
Table 2.1 shows how land is used in Grimes, while Tables 2.2 and 2.3 compare land use in Grimes to peer commu-nities.
Residential Uses
Like many suburban communities residential uses account for the majority of developed land in Grimes.
While the city has a mix of housing choices, varying • from single-family to townhomes and apartments, the majority of residential development (61%) is comprised of single family lots.
Grimes has a net density of about 6,700 people per • residential square mile or 2,100 people per developed square mile. Grimes’ newer development on larger lots has resulted in slightly lower residential densities than communities like Nevada and Papillion. Over the past 40 to 50 years, lot sizes have generally become larger, decreasing the overall compactness of commu-nities. This is supported by an evaluation of median construction year, for Grimes it is 1996 as compared to Nevada at 1967.
Commercial Uses
Compared to other Des Moines metro area communi-• ties, Grimes has double the amount of developed area dedicated to commercial uses. The majority of these

Chapter 2 : Page 22
Section One: A Profile of GrimesThe Grimes Plan
Table 2.1: Land Use in Grimes, 2008
Land Use Category City (Acres) Percent Acres per 100 People
Residential 812.30 32.1% 9.67
Rural Residential 136.14 5.4% 1.62
Single-Family 500.57 19.8% 5.96
2-4 Family 40.69 1.6% 0.48
Multi-Family 56.84 2.2% 0.68
Mobile Home 78.06 3.1% 0.93
Commercial 270.34 10.7% 3.22
Office 31.67 1.3% 0.38
Retail 17.29 0.7% 0.21
Restaurant/Entertainment 6.42 0.3% 0.08
Service 23.94 0.9% 0.29
Auto Services 83.28 3.3% 0.99
Business Park 25.35 1.0% 0.30
Commercial Rec. 82.39 3.3% 0.98
Industrial 477.83 18.9% 5.69
General Industrial 143.46 5.7% 1.71
Lt. Industrial/Warehousing 334.37 13.2% 3.98
Salvage - 0.0% -
Civic 305.25 12.1% 3.63
School - 0.0% -
Public-Semi Public 105.95 4.2% 1.26
Civic 133.79 5.3% 1.59
Parks & Rec. 65.51 2.6% 0.78
Transportation 661.49 26.2% 7.87
Total Developed Land 2,527.21 100.0% 30.09
Agriculture and Open Space 4,784.84 56.96
Vacant Urban Land 310.24 3.69
Total Area 7,622.29 90.74
Source: RDG Planning & Design, 2009
Table 2.2: Comparative Land Use by Percentage of Developed Area
Grimes, IA
Ankeny, IA
Papillion, NE
Plattsmouth, NE
Nevada, IA
Pella, IAWaverly,
NE
Residential 32.1% 38.0% 47.7% 47.0% 37.5% 26.8% 36.8%
Commercial 10.7% 5.6% 5.2% 5.0% 3.6% 4.3% 4.5%
Industrial 18.9% 8.5% 2.5% 2.0% 5.6% 18.0% 7.8%
Civic 12.1% 25.9% 24.8% 17.0% 20.3% 31.3% 27.1%
Transportation 26.2% 22.0% 19.8% 29.0% 33.0% 19.6% 23.7%
Total Developed Area 100.0% 100.0% 100.0% 100.0% 100.0% 100.0% 100.0%
Source: RDG Planning & Design, 2009

Chapter 2 : Page 23
Section One: A Profile of Grimes The Grimes Plan
Table 2.3: Comparative Land Use by Acres per 100 Residents
Grimes, IA Ankeny, IAPapillion,
NEPlattsmouth,
NENevada,
IAPella, IA
Waverly, NE
Residential 9.67 10.8 6.81 9.13 7.80 9.75 8.97
Commercial 3.22 1.6 0.74 0.98 0.80 1.56 1.12
Industrial 5.69 2.4 0.36 0.47 1.20 6.53 1.89
Civic 3.63 7.3 1.05 3.37 4.20 11.38 6.22
Transportation 7.87 6.2 5.33 5.62 6.80 7.12 5.78
Total Developed Area 30.09 28.4 14.29 19.57 20.80 36.34 23.99
Source: RDG Planning & Design, 2009
Urbandale
Johnston
UrbandaleURBANDALE
CLIVE
Cou
nty
Line
Rd.
1ST St.
23RD St. JAM
ES
13TH St.
8TH. St
BEAVERBROOKE
19TH St.
11TH St.
LITT
LE B
EAV
ER
KE
NN
YB
RO
OK
BEAVERBROOKE
3RD St
MA
PLE
WO
OD
Hig
hway
141
Hig
hway
141G
ATE
WAY
GLE
NS
TON
E D
r.
EN
TER
PR
ISE
DE
STI
NAT
ION
Dr.
DE
STIN
ATION
11TH St.
54TH St.
WEATHERSTONE
JAM
ES
Existing Land Use
Windsor Heights
NORTH
MARCH, 2010
Existing Land Use
2000’1000’0

Chapter 2 : Page 24
Section One: A Profile of GrimesThe Grimes Plan
commercial uses are concentrated along State High-ways 44 and 141. These routes serve as the primary arterials by which residents and regional travelers ac-cess Interstate 35/80 and the greater Des Moines met-ro area.
Over 61% of the city’s commercial uses are in auto • services and commercial recreation. Auto services are dominated by dealerships along Highway 141. Cutty’s makes up the majority of the commercial recreation uses.
Much of the city’s existing commercial base does not • generate traditional retail sales, as reflected in the re-tail analysis completed in Chapter 1. Wal-Mart’s new Super Center at the intersection of Highways 44 and 141 will improve the balance between commercial uses and retail sales.
Industrial Uses
Grimes’ industrial base has developed in relationship to the Interstate 35/80 and Highway 141 interchange south of Grimes. The city’s industrial uses vary from small flex spaces, to distribution centers, to heavy industrial uses, which have developed along the Norfolk Southern Rail-road spur. Recently, MidAmerican Energy has constructed an electrical transfer station at the intersection of County Line Road and SW 37th Street. Industrial development surrounding the transfer station has begun to take off as industries reliant on a steady flow of electricity have moved into the area.
Grimes has considerably larger industrial base than other suburban communities, with 18% of its developed land dedicated to industry and warehousing. The city’s proxim-ity to major highways and available land will likely contin-ue to fuel Grimes’ industrial base. Consideration will need to be given to the quality of the design and landscaping of new developments as the city grows. These new facilities make an important statement about a community and the quality of life the community supports.
Public and Semi-Public Uses
With no large public institution, Grimes has a lower per-centage of land dedicated to public uses than the com-parison communities. Much of this land is in semi-public uses with very little true public open space (parks and rec-reational facilities).
Major civic uses in Grimes include:
Grimes Sports Complex• . Located next to South Prai-rie Elementary School on S James Street, the Grimes Sports Complex is the newest addition to the city’s parks and recreation system. The complex is com-prised of four baseball fields, three softball fields, 1 sand volleyball court, two tennis courts, numerous practice fields, and five multi-use playing fields.
Grimes Community Center.• Located in the former Grimes Elementary School at the intersection of SE Main Street and SE 6th Street, the Grimes Community Center is used by various community groups and or-ganizations for meeting and event space. In addition to providing meeting and event space, the center also houses a local branch of the YMCA. The YMCA will be moving to a new facility to be constructed east of the Highway 44 and 141 interchange.
Dallas Center-Grimes Community Schools. • The school district has three schools located in Grimes, the high school, South Prairie Elementary, and North Ridge Elementary.
Community Churches.• Grimes is home to a number of congregations with facilities located throughout the city. These churches include:
St. Peter Lutheran ◦
Maranatha Baptist ◦
Grimes First Presbyterian ◦
Grimes United Methodist ◦
Crossroads Community Church ◦
Grimes Congregation of Jehovah Witnesses ◦
Grace Brethren Church of Grimes ◦

Chapter 2 : Page 25
Section One: A Profile of Grimes The Grimes Plan
Urbandale
Urbandale
Grimes
URBANDALE
CLIVE
Cou
nty
Line
Rd.
23RD St. JAM
ES
13TH St.
8TH. St
BEAVERBROOKE
19TH St.
11TH St.
LITT
LE B
EAV
ER
KE
NN
YB
RO
OK
BEAVERBROOKE
3RD St
MA
PLE
WO
OD
Hig
hway
141
Hig
hway
141G
ATE
WAY
GLE
NS
TON
E D
r.
EN
TER
PR
ISE
DE
STI
NAT
ION
Dr.
DE
STIN
ATION
11TH St.
54TH St.
WEATHERSTONE
JAM
ES
Cou
nty
Line
Rd.
23RD St. JAM
ES
13TH St.
8TH. St
BEAVERBROOKE
19TH St.
11TH St.
LITT
LE B
EAV
ER
KE
NN
YB
RO
OK
BEAVERBROOKE
3RD St
MA
PLE
WO
OD
Hig
hway
141
Hig
hway
141G
ATE
WAY
GLE
NS
TON
E D
r.
EN
TER
PR
ISE
DE
STI
NAT
ION
Dr.
DE
STIN
ATION
11TH St.
54TH St.
WEATHERSTONE
JAM
ES
Brenton Slough
Beaver CreekBeaver Creek
Beaver Creek
Brenton Slough
N Walnut Creek N Walnut Creek
Beaver Creek
NORTH
APRIL, 2010
Map 2.2
Natural FeaturesGrimes, Iowa
2000’1000’0
100 Year Floodplain500 Year FloodplainConservation/RecreationExisting GreenwaysExisting ParksWetlands/Ponds/LakesGrimes City LimitsRoadStreams/Rivers

Chapter 2 : Page 26
Section One: A Profile of GrimesThe Grimes Plan
280280
260
270
290
300
290
280
260
300
300
290290
280
280
290290
300
300
260
270270
280
290
300
290
270260260
260
Urbandale
Grimes
URBANDALE
CLIVE
Cou
nty
Line
Rd.
23RD St. JAM
ES
13TH St.
8TH. St
BEAVERBROOKE
19TH St.
11TH St.
LITT
LE B
EAV
ER
KE
NN
YB
RO
OK
BEAVERBROOKE
3RD St
MA
PLE
WO
OD
Hig
hway
141
Hig
hway
141
GAT
EW
AY
GLE
NS
TON
E D
r.EN
TER
PR
ISE
DE
STI
NAT
ION
Dr.
DE
STIN
ATION
11TH St.
54TH St.
WEATHER
JAM
ES
Cou
nty
Line
Rd.
23RD St. JAM
ES
13TH St.
8TH. St
BEAVERBROOKE
19TH St.
11TH St.
LITT
LE B
EAV
ER
KE
NN
YB
RO
OK
BEAVERBROOKE
3RD St
MA
PLE
WO
OD
Hig
hway
141
Hig
hway
141
GAT
EW
AY
GLE
NS
TON
E D
r.EN
TER
PR
ISE
DE
STI
NAT
ION
Dr.
DE
STIN
ATION
11TH St.
37TH St.
WEATHER
JAM
ES
300
28
30
3030
30
290290
28270270
300
290
290
2828
300300
280
280
290
NORTH
APRIL, 2010
Map 2.3
ContoursGrimes, Iowa
2000’1000’0
Grimes City Limits10 ft Contours

Chapter 2 : Page 27
Section One: A Profile of Grimes The Grimes Plan
Physical Character of Grimes
Each community has distinctive assets and features that can strengthen it if used to best advantage. A compre-hensive plan should consider the underlying structure and order of the community as well as its basic systems, such as land use and infrastructure. This environmental struc-ture helps define the town’s sense of place and inner har-mony, and can build a vision for the future that grows from its intrinsic character. In addition to satisfying the numbers of population forecasts and land needs, the Grimes land use plan is also designed to respond to the city and juris-diction’s physical character.
Grimes’ physical characteristics are defined by the roll-ing farm ground and drainage corridors that supported its early settlers. The corridors and their corresponding flood plains should be identified for preservation as both green-ways and links in the city’s parks and recreation system. Map 2.2 also identifies the large Brenton Slough to the
north of the city. This area, along with the rural residential development that has occurred between the city and the Slough creates a significant hurdle to future northern de-velopment.
Topography is less of an inhibitor to development for the city, but the change in drainage patterns to the south and west will increase development costs for the extension of water and sewer services into these areas. Storm water management will be a significant issue for both Grimes and the larger region in the coming years. Rapid develop-ment over the past twenty years in the region has creat-ed significant erosion and storm water management con-cerns for regional communities. New developments will need to effectively and efficiently address storm water to both protect the drainage corridors within developments and downstream.
Population And Growth Context
HOUSING PROJECTION
Population and development projections help to guide forecasts of land consumption needs during the planning period. Chapter 1 presented a population growth sce-nario that produces a 2030 population of 27,030 (Chapter 1, Table 1.3). Table 2.4 builds a 20 year housing demand model based on this projection and the following assump-tions:
Average people per household is expected to remain • constant at 2.70 over the next twenty years.
Unit demand at the end of the period is calculated by • dividing household population by the number of peo-ple per household. This equals the number of occu-pied housing units.
Table 2.4: Projected Housing Development Demand
2010 2015 2020 2025 2030 Total
Population at the End of Period 9,517 13,002 16,594 21,179 27,030
Household Population at End of Period 9,517 13,002 16,594 21,179 27,030
Average People/Household 2.70 2.70 2.70 2.70 2.70
Household demand at End of Period 3,525 4,816 6,146 7,844 10,011
Projected Vacancy Rate 4.60% 5.10% 5.60% 5.85% 6.10%
Unit Needs at End of Period 3,695 5,074 6,511 8,331 10,662
Replacement Need 5 5 5 5 20
Cumulative Need 1,385 1,441 1,826 2,335 6,987
Average Annual Construction 277 288 365 467 349
Source: RDG Planning & Design, 2009

Chapter 2 : Page 28
Section One: A Profile of GrimesThe Grimes Plan
The vacancy rate over the next twenty years will in-• crease from 3.60% in 2009 to 6.10% by 2030 due to the increased size of the community and the need to maintain a healthy level of vacancy. Manageable hous-ing vacancy provides housing choice for new residents moving to a community.
Unit needs at the end of each period are based ◦on the actual household demand plus the num-ber of projected vacant units.
Replacement need is the number of housing ◦units demolished or converted to other uses.
Table 2.5: Ten Year Pricing and Development Program
2010-2015 2015-2020 Total
Total Need 1,385 1,441 2,826
Total Owner Occupied 900 937 1,837
Affordable Low: 60-100,000 81 84 165
Affordable Moderate: 100-130,000 163 169 332
Moderate Market: 130-200,000 227 237 464
High Market: Over $200,000 429 447 876
Total Renter Occupied 485 504 989
Low: Less than 450 168 174 342
Affordable: 450-700 115 120 235
Market: Over $700 202 210 412
Source: RDG Planning & Design, 2009
Table 2.6: Required Residential Land 2008-2030
% of Demand
UnitsGross Density
(du/A)Land Needs Designated Land (x2)
2008-2020
Single Family Detached
65% 1837 3 612.3 1,225
Single Family Attached
15% 424 6 70.6 141
Multi-family 20% 565 12 47.1 94
Total 100% 2,826 730.0 1,460
2020-2030
Single Family Detached
65% 2,705 3 901.5 1,803
Single Family Attached
15% 624 6 104.0 208
Multi-family 20% 832 12 69.3 139
Total 100% 4,161 1,075 2,150
Total 2008-2030 6,987 1,805 3,610
Source: RDG Planning & Design, 2009
Homes in poor condition or that are obsolete should gradually be replaced in the city’s hous-ing supply.
Cumulative need shows the number of total units ◦needed between the base year of 2010 and the year indicated at the end of the period.
The projections in Table 2.4 indicate a cumulative need for 6,987 housing units in Grimes between 2010 and 2030. This assumes a gradual increase in production, as the economy recovers, returning and then surpassing the city’s peak years from 2005 to 2007.

Chapter 2 : Page 29
Section One: A Profile of Grimes The Grimes Plan
Development Program
Table 2.5 presents a ten-year housing development and pricing program for Grimes, based on the city’s relative in-come distribution. The program provides production tar-gets for various cost ranges of rental and owner-occupied units. The development program is based on the follow-ing assumptions:
New development in Grimes will be about 65% owner-• occupied and 35% renter-occupied housing. This is a lower percentage of owner-occupied then the city cur-rently has but begins to provide a better mix of hous-ing choices in the community.
Owner-occupied housing will be distributed generally • in proportion to the income distribution of households for whom ownership is a realistic strategy. Some of the market for lower-cost owner-occupancy may be shifted toward market rate rentals.
Households that cannot afford home ownership op-• tions will generally be accommodated in rental devel-opment.
The analysis indicates a need for about 497 owner-occu-pied units with prices below $130,000 and 577 units with effective rents below $700 in current dollars, a total of 1,074 “affordable” units. Therefore, to meet half this pro-jected need, a housing program for Grimes should estab-lish an average annual production target of about 107 af-fordable units.
It is important to note that affordable housing can be produced indirectly through a filtering process. Thus, a unit that meets the needs of a high-income, empty-nest-er household may encourage that household to sell their current home to a moderate-income family. Filtering pro-cesses rarely satisfy an affordable need on a one-to-one basis, but they do realistically address part of the market demand. The easy credit of the last 10 years could have also created a back log of demand for rental housing, as many households will no longer qualify for the once easy credit.
RESIDENTIAL LAND NEEDS
Sustainable community development will involve ongoing housing improvement (including replacement of substan-dard housing) and moderate, managed growth. During the economic downturn that started in 2008, residential construction declined dramatically. Lower construction rates will eventually produce unmet demands. However, the end of subprime mortgage instruments, tighter under-writing standards, and greater consumer conservatism are likely to increase the demand for both rental housing and smaller and more efficient ownership alternatives.
Table 2.6 calculates residential land demand based on the following factors:
New construction will be based on the following distri-• bution: 65% single-family detached; 15% single-family attached or townhome; 20% multi-family
Average gross residential densities will be 3 units/acre • for single-family detached; 6 units/acre for single-fami-ly attached or townhomes; and 12 units/acre for multi-family.
Land designated for residential development during • the planning period will be twice the area needed for actual construction to provide market choice and pre-vent artificial inflation of land cost.
This projection indicates a need for about 1,805 acres of residential land between 2010 and 2030. At two times the “hard demand,” the plan should designate approximately 3,610 acres (5.6 square miles) of residential development over the next 20 years. The development concept pre-sented in this document identifies areas where this poten-tial development should occur.

Chapter 2 : Page 30
Section One: A Profile of GrimesThe Grimes Plan
COMMERCIAL AND INDUSTRIAL LAND NEEDS
A growing population needs additional commercial ser-vices, and commercial growth is also a key part of Grimes’ economic development strategy. While this plan does not include a retail market analysis, adequate commer-cial space should be identified to meet market demands. However, designating too much commercial land can pro-duce inefficient land patterns, further scatter urban devel-opment, and require customers to travel excessive distanc-es, usually by private automobile. In contrast, sustainable land development patterns should locate commercial de-velopment closer to customers and be designed to en-courage active transportation modes such as pedestrian, bicycle, and potentially public transportation.
Table 2.7: Required Commercial Land, 2009-2030
2009 2020 2030Conversion
NeedDesignated Land (x1.5)
Population Proportion Method
Projected Population 8,400 16,594 27,030
Commercial Use/100 res. 3.22 2.50 2.50
Projected Commercial Use (acres) 270.34 414.86 675.76 405.42 608.13
Residential Use Proportion Method
Residential Land (acres) 812.30 1,542.34 2,617.26
Commercial/Residential Ratio 0.33 0.33 0.33
Projected Commercial Use (acres) 270.34 513.30 871.05 600.71 901.06
Source: RDG Planning & Design, 2009
TABLE 2.8: Estimated Industrial/Business Park Land Requirements, 2009-2025
2009 2020 2030Conversion
NeedDesignated Land (x1.5)
Population Proportion Method
Projected Population 8,400 16,594 27,030
Industrial Use/100 res. 5.69 4.69 3.69
Projected Industrial Use (acres) 477.83 778.27 997.42 519.59 779.39
Residential Use Proportion Method
Residential Land (acres) 812.30 1,542.34 2,617.26
Industrial/Residential Ratio 0.59 0.59 0.59
Projected Industrial Use (acres) 477.83 907.27 1,539.59 1,061.76 1,592.63
Source: RDG Planning & Design, 2009
The demand for future industrial land is linked to opportu-nity and recruitment, rather than exclusively to population growth. A single major corporate decision can dramat-ically increase (or decrease) the projected industrial de-mand in a community. In addition, a decision by the city to pursue industrial development aggressively can affect industrial land needs.
Despite these differences, similar projection methods are used to predict future commercial and industrial land needs. For Grimes the two methods used are:

Chapter 2 : Page 31
Section One: A Profile of Grimes The Grimes Plan
Population proportion.• This method relates land needs to population projections. It assumes that the absolute amount of commercial or industrial land per 100 peo-ple will remain relatively constant and that new devel-opment will grow in proportion to population growth. Grimes has a comparatively high proportion of com-mercial and industrial land than other regional cities. This proportion is often difficult to maintain, as the city gains more regional population. For this reason the proportion of population to both commercial and in-dustrial uses will begin to slowly decline.
Residential use proportion.• This assumes a constant relationship between the amount of land used for res-idential and commercial purposes, thereby relating commercial and industrial growth rates to residential development rates.
Table 2.7 compares the results of these methods for com-mercial uses and suggests a hard demand for 400 and 600 acres of commercial land during the next 20 years. This does not take into account the 96 acres of vacant land that is already zoned for commercial uses. This land should ini-tially meet the city’s future demand. To provide alterna-tives sites, the land use plan often designates 1.5 times the “hard demand” for commercial land. Thus, for plan-ning proposes the city should designate approximately 800 acres of land for future commercial development.
Table 2.8 calculates additional industrial land needs within the city. Based on increasing population and residential use proportion methods described above, Grimes should absorb between 520 to 1,062 acres of new industrial land. In order to provide maximum flexibility, the land use plan should designate about 1.5 times this demand or 780 to 1,500 acres for industrial and business park uses. At the present moment there are 58 acres of vacant industrial land available in Grimes.

Chapter 3 : Page 33
Section One: A Profile of Grimes The Grimes Plan
The City of Grimes provides key services through a variety of city-owned buildings and facilities. In addition, the city also maintains a network of parks and trail corridors that provide a variety of recreational opportunities. Parks are a vital component of community life; therefore, it is essential that the city provide additional facilities as the community grows in order to maintain a high level of park and recreational services.
The following section presents an inventory and general evaluation of these various facilities. The assessment of each facility is based on existing conditions and potential community needs. Proposed or desirable changes in facilities and services are noted.
Chapter 3
PUBLIC FACILITIES & INFRASTRUCTURE
Park Facility Analysis
This chapter examines Grimes’ existing park and recre-ation system. It covers all city-owned and operated rec-reation areas and any other park with public access. It considers:
Current levels of service in the existing system.•
Service coverage to identify park and facility develop-• ment needs.
Condition inventory of existing parks.•
The adequacy of park facilities is evaluated in three ways.
Facilities by Classification. Parks are classified into dif-
ferent categories to determine the level and area they
serve.
Facilities by Geographic Distribution. The service radius
of each facility is analyzed to identify geographical gaps
in service.
Facilities in Relation to Population Service Standards.
National standards for the provision of park and recreation
facilities are applied to Grimes’ present system.
FACILITIES BY CLASSIFICATION
In order to systematically analyze the park system, Grimes’ major recreation and open space areas are classified ac-cording to the National Recreation and Park Association system. Table 3.1 lists Grimes’ park facilities by category.
Overall Park Space.
Park land in the Grimes planning area covers about 77 • acres.
Traditional park area standards set by the National Rec-• reation and Park Association (NRPA) suggest 10 acres of park land per 1,000 residents.
At present, Grimes contains about 9.1 acres per ◦1,000 residents.
This does not include the facilities at the high ◦school as they are not part of the city’s park sys-tem and they are a very specialized use. (Map 3.1)

Chapter 3 : Page 34
Section One: A Profile of GrimesThe Grimes Plan
GlenstonePark
ShawversPark
LionsPark
North PointePark
Grimes SportsComplex
WaterworksPark
BeaverbrookePark
Future SportsComplex (2010)
Future Beaverbrooke Park (2015)
Future KennybrookPark (2015)
GlenstonePark
ShawversPark
LionsPark
North PointePark
Grimes SportsComplex
WaterworksPark
BeaverbrookePark
Future SportsComplex (2010)
Future Beaverbrooke Park (2015)
Future KennybrookPark (2015)
Johnston
GRIMES
Cou
nty
Line
Rd.
Cou
nty
Line
Rd.
1ST St.
JAM
ES
JAC
OB
HA
RE
VY
JAM
ES
MA
IN
JAC
OB
PAR
K
PO
LK
112T
H
VALL
EY
VIE
W
13TH St.
BEAVERBROOKE
19TH St. 62ND St.
11TH St.
11TH St.
17TH St.
12TH St.
13TH St.
9TH St.
7TH St.
LITT
LE B
EAV
ER
LITT
LE B
EAV
ER
KE
NN
YB
RO
OK
BR
OO
KS
IDE
3RD St
3RD St2ND St
DOLAN
4TH St4TH St
4TH St
5TH St
Hig
hway
141
Hig
hway
141
GAT
EW
AY
SE
R
GAT
EW
AY
GLE
NS
TON
E D
r.EN
TER
PR
ISE
BR
OO
KS
IDE
DE
STI
NAT
ION
Dr.
54TH St. TH
1ST St. 70TH St.
Cou
nty
Line
Rd.
Cou
nty
Line
Rd.
1ST St.
27th St.
18th St.
1ST St.
JAM
ES
JAC
OB
HA
RE
VY
JAM
ES
MA
IN
JAC
OB
PAR
K
PO
LK
112T
H
VALL
EY
VIE
W
13TH St.
BEAVERBROOKE
19TH St. 62ND St.
70TH St.
11TH St.
11TH St.
26th St.
17TH St.
12TH St.
13TH St.
9TH St.
7TH St.
LITT
LE B
EAV
ER
LITT
LE B
EAV
ER
KE
NN
YB
RO
OK
BR
OO
KS
IDE
3RD St
3RD St2ND St
DOLAN
4TH St4TH St
4TH St
5TH St
Hig
hway
141
Hig
hway
141
GAT
EW
AY
SE
R
GAT
EW
AY
GLE
NS
TON
E D
r.EN
TER
PR
ISE
BR
OO
KS
IDE
DE
STI
NAT
ION
Dr.
37TH St. TH
Mini-Parks.
Mini-parks generally address specific recreation or • open space needs.
These parks typically cover less than one acre and have • a service radius of less than ¼ mile.
Because of maintenance difficulties with multiple • smaller sites and their small service area, most cities discourage the development of mini-parks. Parks of less than three acres provide limited services and nu-merous mini-parks create higher maintenance costs for the Parks Department.
Grimes has no mini-parks•
Neighborhood Parks.
Neighborhood parks are considered the basic unit of • a community’s park system and provide a recreational and social focus for residential areas.
These parks desirably provide space for informal active • and passive recreational activities.
The typical service radius for neighborhood parks is • between ¼ and ½ mile, easy walking distance.
Neighborhood parks adequate in size to accommodate • the requisite facilities often contain at least 5 acres; be-tween 5 and 10 acres is considered optimal.
Elementary schools can also serve as neighbor- ◦hood parks, however, they are not considered in this analysis.
neighborhood parkland per 1,000 residents.
Grimes currently has 22.3 acres of neighborhood ◦parks, which translates into 2.6 acres per 1,000 residents.
MAY, 2010
Parks & RecreationGreenwaysCivic/SchoolsFuture ParksCity LimitsRoadRailroad
Map 3.1
Existing Parks & RecreationGrimes, Iowa
2000’1000’0

Chapter 3 : Page 35
Section One: A Profile of Grimes The Grimes Plan
Table 3.1: Park System Analysis, Grimes Planning Area
Facility Location Total AcresPlayground
AreasPlaying Fields Courts
Special Facilities
COMMUNITY PARKS
Sports Complex 6th & S. James 46 13 softball 4
baseball; 12 soccer
5 tennis; 2 basketball;
Landscaped parking;
concessions; restrooms
Waterworks Park 1st & James 8.5 1 3 ball fields Tennis Library
Total Community Parks 54.5
NEIGHBORHOOD PARKS
North Pointe Park NE 18th St. 3.5 Undeveloped
Glenstone ParkGlenstone & Stone Ridge
3.6 no no no Gazebo
Beaverbrook ParkEast of 8th &
N. James6.4 1 no no Trail
Lions ParkN. Park & 6th
St.4.8 2 2 1 basketball Trail
Shawvers Park SE Shawver Dr. 4.0 1 no no Gazebo
Total Neighborhood Parks 22.3
SCHOOL FACILITIES PROVIDING COMMUNITY PARK AMENITIES
High SchoolWest Highway
44Football field
& track
South Prairie 500 S. James 2 Hard surfaced
play areas
North Ridge400 NW 27th St.
1
Total Parks 76.8
Source: RDG Planning & Design, 2009
Chapter 3 : Page 36
Section One: A Profile of GrimesThe Grimes Plan
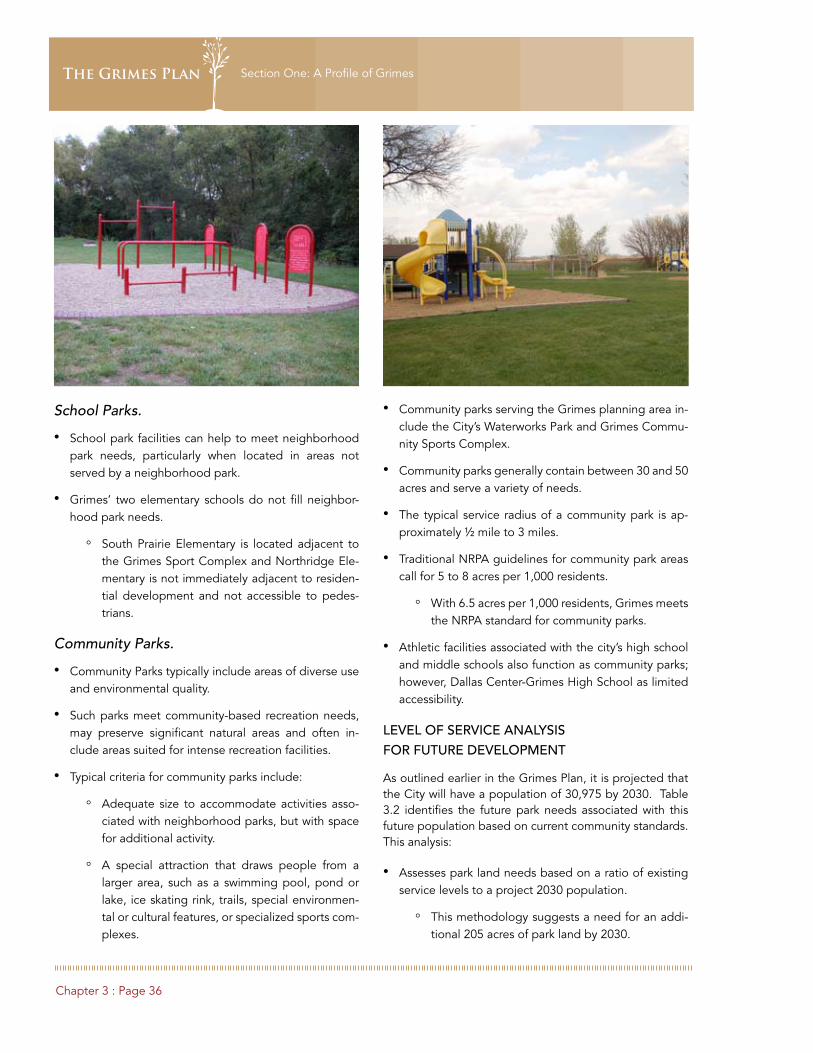
School Parks.
School park facilities can help to meet neighborhood • park needs, particularly when located in areas not served by a neighborhood park.
Grimes’ two elementary schools do not fill neighbor-• hood park needs.
South Prairie Elementary is located adjacent to ◦the Grimes Sport Complex and Northridge Ele-mentary is not immediately adjacent to residen-tial development and not accessible to pedes-trians.
Community Parks.
Community Parks typically include areas of diverse use • and environmental quality.
Such parks meet community-based recreation needs, • may preserve significant natural areas and often in-clude areas suited for intense recreation facilities.
Typical criteria for community parks include:•
Adequate size to accommodate activities asso- ◦ciated with neighborhood parks, but with space for additional activity.
A special attraction that draws people from a ◦larger area, such as a swimming pool, pond or lake, ice skating rink, trails, special environmen-tal or cultural features, or specialized sports com-plexes.
Community parks serving the Grimes planning area in-• clude the City’s Waterworks Park and Grimes Commu-nity Sports Complex.
Community parks generally contain between 30 and 50 • acres and serve a variety of needs.
The typical service radius of a community park is ap-• proximately ½ mile to 3 miles.
Traditional NRPA guidelines for community park areas • call for 5 to 8 acres per 1,000 residents.
With 6.5 acres per 1,000 residents, Grimes meets ◦the NRPA standard for community parks.
Athletic facilities associated with the city’s high school • and middle schools also function as community parks; however, Dallas Center-Grimes High School as limited accessibility.
LEVEL OF SERVICE ANALYSIS FOR FUTURE DEVELOPMENT
As outlined earlier in the Grimes Plan, it is projected that the City will have a population of 30,975 by 2030. Table 3.2 identifies the future park needs associated with this future population based on current community standards. This analysis:
Assesses park land needs based on a ratio of existing • service levels to a project 2030 population.
This methodology suggests a need for an addi- ◦tional 205 acres of park land by 2030.

Chapter 3 : Page 37
Section One: A Profile of Grimes The Grimes Plan
Assesses park land needs based on an elevated level of • service that improves recreation opportunities for resi-dents.
Based on a slightly elevated level of service the ◦city would need 71 acres of additional Neighbor-hood Parks, 193 acres of Community Parks, and 233 acres of additional park and recreation space in the overall park system.
Several factors must be considered when determining a community’s future park land needs. Some of these in-clude gaps in services coverage and community demands. These factors are discussed further in subsequent sections of this chapter.
TABLE 3.2: Future Parkland Needs
Park TypeExisting Acreage
Existing Acres
per 1,000 Residents
2030 Acreage Need (Existing level of service)
Additional Parkland Needed
Elevated Level of Service
2030 Acreage Need (Elevated
Level of Service)
Additional Parkland Needed
Neighborhood Parks 22.3 2.6 71.6 49.3 3 81.09 58.79
Community Parks 54.5 6.5 175.0 120.5 8 216.24 161.74
Mini & Specialty Parks 0.0 0.0 0.0
Total Park and Recreation Area 76.8 9.1 246.6 169.8 10 270.30 193.50
* 2030 need based on a population of 30,975Source: RDG Planning & Design
FACILITIES BY GEOGRAPHICAL DISTRIBUTION
As previously noted, neighborhood parks comprise the basic unit of a park system. Distribution of neighborhood park service can be evaluated using a standard ¼ and ½ mile service radius. These tend to be considered comfort-able walking distances; however, large community parks pull in much larger areas often requiring the use of a car. Map 3.2 illustrates the location of Grimes’ recreation fa-cilities, as well as the service radius of each park. Nearly all of the developed areas of Grimes are served by exist-ing parks. Newer developments like Kennybrook Estates and James Pointe are outside of the city’s existing service areas.
Table 3.3: Park and Recreation Services in Relation to Population, Grimes Planning Area
Facility Type NRPA StandardExisting Quantity
NRPA Present Need
2030 Need Based on NRPA Standard
2030 Need Based on Local
Standard2030
Deficit
Baseball Fields 1 per 3,000 7 3 22 15
Softball Fields 1 per 3,000 5 3 16 11
Basketball Courts 1 per 5,000 3 2 10 7
Football Fields 1 per 20,000 1 0 3 2
Golf Courses* 1 9 - hole standard per 25,000 0 0 0 0
1 18 - hole standard per 50,000 0 0 0 0
1 driving range per 50,000 0 0 0 0
Picnic Shelter 1 per 2,000 3 4 14 11
Playgrounds 1 per 2,000 9 4 29 20
Running Track 1 per 20,000 1 0 3 2
Soccer Fields 1 per 10,000 3 1 10 7
Swimming Pools 1 per 20,000 0 0 0 0
Tennis Courts 1 per 2,000 6 4 19 13
Sand Volleyball Courts 1 per 5,000 0 2 5 5
Source: RDG Planning & Design, 2009* Golf Courses in the region easily serve Grimes residents needs.

Chapter 3 : Page 38
Section One: A Profile of GrimesThe Grimes Plan
FACILITIES IN RELATION TO POPULATION SERVICE STANDARDS
An evaluation of Grimes’ recreational facilities based on quantitative national standards is summarized in Table 3.3. Projections for future demand are also presented, based on a 2030 population of 27,030. The 2030 demand for each type of facility is determined based on present levels of service in Grimes if the existing standard is higher than the NRPA standard. Major findings of this analysis include the following:
Based on national standards city has an existing sur-• plus of baseball, softball, and soccer fields. However, these are heavily used and an economic draw for the community.
If the city wishes to maintain its current level of service • new recreation facilities will need to be constructed over the next 20 years. This will require the develop-ment of the north sports complex to accommodate ad-ditional fields and courts.
This analysis does not take into consideration the de-• mand for practice space or the growing interest in soc-cer. One soccer field per 10,000 often does not accom-modate current demand within communities and the growing popularity of the sport will likely push the city to maintain its current level of service.
The city has no swimming or water features, there are • facilities in the region but as the city grows this will be a growing demand.
It is important to note that these standards are only a starting point for the city and that new facilities must be weighed against resident demand and interest. Require-ments for new neighborhood park land will also result in the addition of more than just these minimum require-ments. Any new neighborhood park will require standard facilities such as playgrounds, shelters, and basketball courts. Also, the demand for these facilities should not just be added to existing parks, making them overcrowd-ed and out of reach for residents in newer developments.
PARK SITE ASSESSMENT
Continued investment in Grimes’ existing park system will ensure its status as a major community asset. While a de-tailed park analysis would be based on user surveys and is beyond the scope of this plan, this section identifies preliminary needs at each park. Any improvement pro-
gram should identify priority parks for improvement and a general budget to be spent every year on one or more of these parks. This should be done through a participato-ry process in the development of a community wide park and recreation plan.
Park Site Assessment & Improvement Program
Grimes Sports Complex
The complex is in excellent condition and heavily used•
It is at capacity and expansion will require land acquisi-• tion to the south

Chapter 3 : Page 39
Section One: A Profile of Grimes The Grimes Plan
Relocation of the skate park should improve visibility • and allow for expansion
Beaverbrook Park
Visibility and access to the park from the west is poor•
There is an opportunity to expand to the east•
Play structures are not handicap accessible•
Additional landscaping for shade and landscaping • structure should be added to the park
GlenstonePark
ShawversPark
LionsPark
North PointePark
Grimes SportsComplex
WaterworksPark
BeaverbrookePark
Future SportsComplex (2010)
Future Beaverbrooke Park (2015)
Future KennybrookPark (2015)
GlenstonePark
ShawversPark
LionsPark
North PointePark
Grimes SportsComplex
WaterworksPark
BeaverbrookePark
Future SportsComplex (2010)
Future Beaverbrooke Park (2015)
Future KennybrookPark (2015)
Urbandale
Johnston
GRIMES
Cou
nty
Line
Rd.
Cou
nty
Line
Rd.
1ST St.
JAM
ES
JAC
OB
HA
RE
VY
JAM
ES
MA
IN
JAC
OB
PAR
K
PO
LK
112T
H
VALL
EY
VIE
W
13TH St.
BEAVERBROOKE
19TH St. 62ND St.
11TH St.
11TH St.
17TH St.
12TH St.
13TH St.
9TH St.
7TH St.
LITT
LE B
EAV
ER
LITT
LE B
EAV
ER
KE
NN
YB
RO
OK
BR
OO
KS
IDE
3RD St
3RD St2ND St
DOLAN
4TH St4TH St
4TH St
5TH St
Hig
hway
141
Hig
hway
141
GAT
EW
AY
BE
ISS
ER
GAT
EW
AY
GLE
NS
TON
E D
r.EN
TER
PR
ISE
BR
OO
KS
IDE
DE
STI
NAT
ION
Dr.
54TH St.
52NDJAM
ES 11
1 TH
1ST St. 70TH St.
Cou
nty
Line
Rd.
Cou
nty
Line
Rd.
1ST St.
27th St.
18th St.
1ST St.
JAM
ES
JAC
OB
HA
RE
VY
JAM
ES
MA
IN
JAC
OB
PAR
K
PO
LK
112T
H
VALL
EY
VIE
W
13TH St.
BEAVERBROOKE
19TH St. 62ND St.
70TH St.
11TH St.
11TH St.
26th St.
17TH St.
12TH St.
13TH St.
9TH St.
7TH St.
LITT
LE B
EAV
ER
LITT
LE B
EAV
ER
KE
NN
YB
RO
OK
BR
OO
KS
IDE
3RD St
3RD St2ND St
DOLAN
4TH St4TH St
4TH St
5TH St
Hig
hway
141
Hig
hway
141
GAT
EW
AY
BE
ISS
ER
GAT
EW
AY
GLE
NS
TON
E D
r.EN
TER
PR
ISE
BR
OO
KS
IDE
DE
STI
NAT
ION
Dr.
37TH St.
52NDJAM
ES 11
1 TH
Lions Park
The park is in excellent condition•
Play structures are not handicap accessible•
Additional landscaping would elevate the quality of • the park
Shawver Park
The park has limited sidewalk access with no sidewalks • leading directly to park amenities
Strengthen the drainage swales as natural and educa-• tional landscapes
MAY, 2010
Parks & RecreationQuarter Mile RadiusHalf Mile RadiusFuture Park Half Mile RadiusCity LimitsRoadRailroad
Map 3.2
Park Service AreaGrimes, Iowa
2000’1000’0
Chapter 3 : Page 40
Section One: A Profile of GrimesThe Grimes Plan
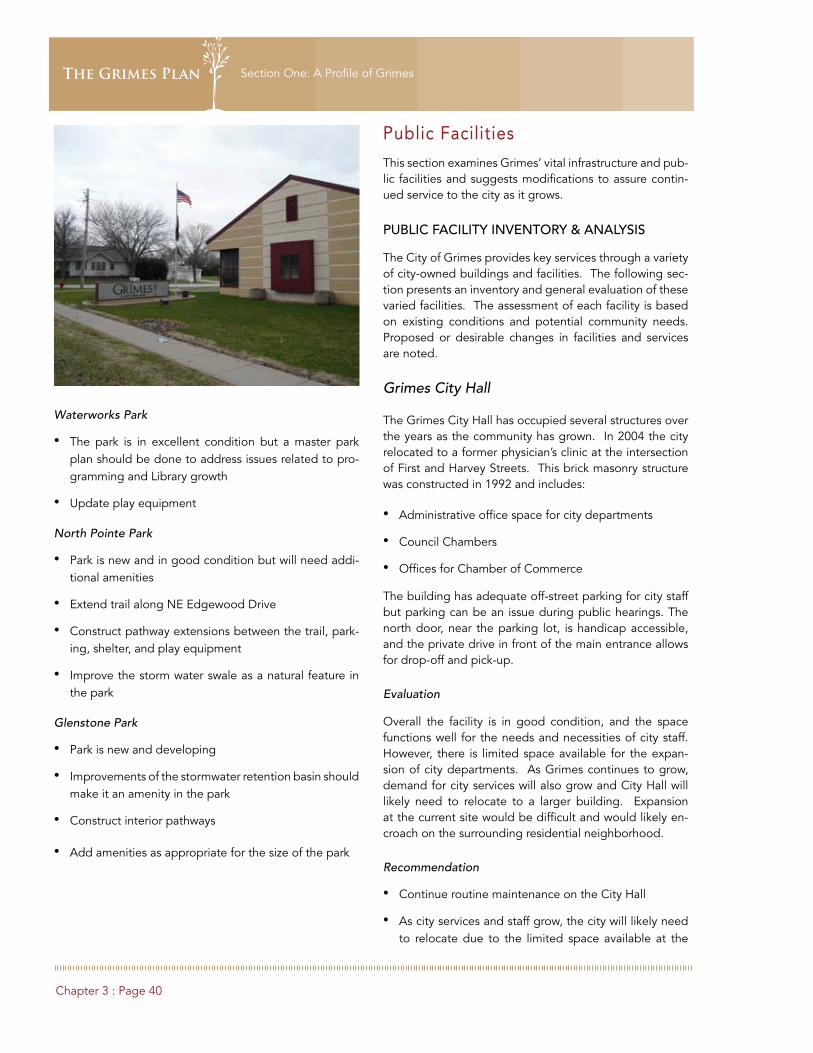
Waterworks Park
The park is in excellent condition but a master park • plan should be done to address issues related to pro-gramming and Library growth
Update play equipment•
North Pointe Park
Park is new and in good condition but will need addi-• tional amenities
Extend trail along NE Edgewood Drive•
Construct pathway extensions between the trail, park-• ing, shelter, and play equipment
Improve the storm water swale as a natural feature in • the park
Glenstone Park
Park is new and developing•
Improvements of the stormwater retention basin should • make it an amenity in the park
Construct interior pathways•
Add amenities as appropriate for the size of the park•
Public Facilities
This section examines Grimes’ vital infrastructure and pub-lic facilities and suggests modifications to assure contin-ued service to the city as it grows.
PUBLIC FACILITY INVENTORY & ANALYSIS
The City of Grimes provides key services through a variety of city-owned buildings and facilities. The following sec-tion presents an inventory and general evaluation of these varied facilities. The assessment of each facility is based on existing conditions and potential community needs. Proposed or desirable changes in facilities and services are noted.
Grimes City Hall
The Grimes City Hall has occupied several structures over the years as the community has grown. In 2004 the city relocated to a former physician’s clinic at the intersection of First and Harvey Streets. This brick masonry structure was constructed in 1992 and includes:
Administrative office space for city departments•
Council Chambers•
Offices for Chamber of Commerce•
The building has adequate off-street parking for city staff but parking can be an issue during public hearings. The north door, near the parking lot, is handicap accessible, and the private drive in front of the main entrance allows for drop-off and pick-up.
Evaluation
Overall the facility is in good condition, and the space functions well for the needs and necessities of city staff. However, there is limited space available for the expan-sion of city departments. As Grimes continues to grow, demand for city services will also grow and City Hall will likely need to relocate to a larger building. Expansion at the current site would be difficult and would likely en-croach on the surrounding residential neighborhood.
Recommendation
Continue routine maintenance on the City Hall•
As city services and staff grow, the city will likely need • to relocate due to the limited space available at the

Chapter 3 : Page 41
Section One: A Profile of Grimes The Grimes Plan
current site. A building consultant should be hired to evaluate the needs and priorities of the city for a new facility that will meet all of the community’s long term needs.
Fire Department
The Grimes Fire Department is located at the intersec-tion of S James and Second Streets. The 13,680 square foot masonry structure was constructed in 1980 for the department, with a 2,400 square foot addition added in 2000. The building is handicap accessible. Equipment bays include 4 drive-through bays and 2 single-entrance bays that are accessible off of S James Street. Addition-ally, the garage bays where the department’s fire appara-tus are kept have radiant floor heating. The department has 5 full-time members that work Monday through Friday from 6:00 am to 6:00pm. In addition, there are 30 part-time volunteer firemen working weekend shifts, and on an as-need basis. Currently, the Fire Chief for the depart-ment is a shared position between the fire departments of Grimes and Johnston. This arrangement has created a close working relationship between the two communities for emergency management services.
The fire department serves a 40 square-mile area that serves the City of Grimes and rural areas primarily to the north and west. Emergency calls are dispatched via the Polk County Dispatch Center, which handles all 911calls for Police and Fire Departments in Polk County. The Fire Department personnel also provide ambulance services to the city. Allowing for patient choice, the department will transport a patient to any hospital in the metro area, unless the patient’s condition dictates otherwise.
Evaluation
Structurally the building is in sound condition, however, there have been some problems with water leaks in the roof of the original structure. The garage area is ade-quately sized for the current needs of the department but as the force has grown the office and washroom space has become too small. Currently, the only shower facili-ties are located in the men’s washroom, and there are also no sleeping facilities. An additional fire station is needed in both Grimes and Johnston, particularly in the south-eastern portion of Grimes. The department’s equipment and apparatus are in good condition and meet the cur-rent needs of the community. Older water lines that are less than five inches can create capacity issues for the fire department.
Chapter 3 : Page 42
Section One: A Profile of GrimesThe Grimes Plan
Recommendation
Identify a location for an additional shared fire sta-• tion in either the southeast quadrant of Grimes, or the southwest quadrant of Johnston.
Upgrade water mains with any significant street or sew-• er project in order to ensure that there will be enough capacity to meet the needs of emergency services.
Expand the city’s primary fire station in order to pro-• vide the department with additional office training, and sleeping space.
Public Works Facilities
The Public Works Department’s shop and yard are located along South Main Street. The facility covers 1.25 acres and includes:
10,349 square foot building that contains office, shop, • and maintenance facility space that has been expand-ed three times over the last twenty years.
4,000 square foot building for storage of salt and rock.•
Storage yard for gravel, equipment and materials.•
All of the structures at the public works yard have been constructed in the last 25 years. The storage building for rock and salt is the newest structure on the site, added in 2009. All of the structures at the yard are steel frame con-struction with steel siding.
Evaluation
The newest building is in excellent condition, while the main facility building is in fair condition but has developed some leaks. The main facility building has seven work bays for servicing equipment. The parking lot and fueling area are in poor condition and will need to be replaced. The overall facility is meeting the needs of the Department. As Grimes continues to grow the Public Works Depart-ment may need to expand once more, but does not have the necessary space at the current location.
Recommendation
Continue routine maintenance on the facility grounds • and structure
Replace the parking lot in front of the main facility • building
Grimes Community Center
Constructed over the course of a twenty year period be-ginning in 1940, the center originally housed Grimes Ele-mentary and Middle School. The building has over 35,000 square feet, divided between recreational and community activity spaces, including a gym, fitness facilities, banquet hall, meeting rooms, park and recreation department of-fices, and a full-service kitchen.
Evaluation
The building is in very good condition following a recent renovation. In the coming years some minor renovation work will need to be completed. Windows on the south and west facades and minor roof leaks are also scheduled to be repaired. The building currently has enough capac-ity for all of the events and activities that it hosts except for a need for additional gym space. The current gym is un-dersized for many activities, and additional space would allow for more activities to be scheduled at any one time.
Recommendations
Continue routine maintenance.•
Provide additional sidewalk space by the entrance to • the banquet hall.
Improve parking and outdoor facilities.•
Evaluate the long-term use of the building following • construction of a new YMCA facility at the intersection of First Street and Destination Drive.

Chapter 3 : Page 43
Section One: A Profile of Grimes The Grimes Plan
Grimes Community School District
Facilities in the Dallas Center – Grimes Community School District within the Grimes planning jurisdiction include two elementary schools, and one high school. Students in grades 5 – 8 attend class in Dallas Center, however the district has plans for the construction of a new grade 8 – 9 facility near the existing high school.
South Prairie Elementary School. South Prairie Ele-
mentary is 20 years old and was constructed to accom-
modate the quickly growing elementary school popula-
tion in Grimes. The one-story building now houses pre-
Kindergarten, Kindergarten, first and second Grades. It
is in good condition and is well maintained; however, the
building is beginning to show its age and is in need of
upgrades and renovations. A renovation and expansion
project is planned to begin in 2013 that will include the
new computer labs, additional support facilities, and new
mechanical systems that operate off of geothermal ener-
gy.
North Ridge Elementary School. North Ridge is the
newest facility within the school district, constructed in
2008. Built for third and fourth grades, the classrooms
have been designed with maximum flexibility in mind.
Several of the classrooms are equipped with in-suite rest
rooms for transition to pre kindergarten or kindergarten
classes. The school’s gymnasium is regulation size, and
is utilized by the district for high school practices and ju-
nior varsity indoor sporting events. In addition, the facility
also offers before and after school day care service that is
operated out of the cafeteria. A separate entrance to the
cafeteria allows for children to be dropped off and picked
up directly from the cafeteria. Overall, the buildings cam-
pus is in excellent condition, with adequate parking and
space for outdoor play and activities. The city has pur-
chased land adjacent to the school for construction of an
additional sports complex which, if constructed, will pro-
vide the school with additional outdoor space and park-
ing facilities.
Dallas Center – Grimes High School. Dallas Center –
Grimes High School is located one mile west of central
Grimes on Highway 44. The school serves the students
and families of Grimes and Dallas County. The one-story
building was completed in 2001, with the addition of a
3,000 square foot auditorium in 2005. A sports complex
that includes an all-weather track and football/soccer field
was added to the buildings facility complex in 2006. Ad-
ditional facilities include 1,300 seat gymnasium, wrestling
facility, weight room, media center and three computer
labs. While there is enough classroom space available,
the schools wrestling and weight rooms have reached
their capacity. As part of the district’s ten-year plan, a new
8th and 9th grade school is planned at a site adjacent to
the high school. With the construction of this new facil-
ity, the district will also work to renovate the weight and
wrestling room facilities in order to provide for additional
capacity.

Chapter 3 : Page 44
Section One: A Profile of GrimesThe Grimes Plan
Evaluation
Overall the district’s facilities are in excellent to good con-dition. The district is continuing to make significant in-vestments in maintenance, upgrades and expansion of its facilities, and maintains a ten-year action plan in order to guide the districts growth and allocation of resources.
Recommendations
Continue routine maintenance and upkeep at all facili-• ties.
Expand Middle School facility as needed at the current • High School campus.
Evaluate the need for additional entrances/exits for the • high school off of Highway 44 as part of the districts planned expansion for the school site.
Upgrade and expand the facilities at Prairie Ridge El-• ementary as part of the district’s ten-year plan for future growth.
Continue efforts to improve the energy efficiency of all • district schools by investing in geothermal energy sys-tems, and other green building techniques.
Sunny Hill Cemetery
Sunny Hill Cemetery, located on South Sixth Street be-tween Main and Jacob Streets, has long served the resi-dents of Grimes. Originally located on the southern edge of the city limits, it has become encircled by residential development over the last ten years. The cemetery cur-rently covers 6.5 acres of land, with a total of 3,442 plots that are enclosed by a chain-linked fence. An expansion has recently been approved to meet the city’s long term needs.
Evaluation
The cemetery is in good condition overall, with sodding and settling issues being addressed each spring by the Public Works Department. A recent audit of the ceme-tery’s available plots revealed that there are only 100 plots still available within the confines of the cemetery’s board-ers. These plots are located sporadically throughout the cemetery as individual or double plots but the site cannot provide larger family plots. The city owns eleven acres of land to the south for future expansion of the cemetery grounds.
Recommendation
Continue regular maintenance of the Cemetery.•
Open a new section of the cemetery in order to in-• crease the number of available plots.

Chapter 3 : Page 45
Section One: A Profile of Grimes The Grimes Plan
Grimes Public Library
Located at the intersection of Highway 44 and James Street, the Grimes Public Library is centrally located for many of Grimes’ residents. Constructed in 1994, the li-brary is a 6,439 square foot concrete block building with brick facing. In addition to the more that 41,000 resource materials that are available, the library also has six worksta-tions, two library catalog computers, a website, Facebook page, and Wi-Fi internet service for use by its patrons. The library staff is comprised of three full-time librarians, one part-time (30 hours a week) staffer, and five additional part-time staffers that work on an as-needed basis.
Evaluation
The building is in good condition, however, there has been some cracking occurring to the structure’s founda-tion. In addition, the buildings HVAC system will likely need to be replaced in the near future. With regards to the library grounds, the sidewalks and parking lot have degraded and are in need of major repairs. While the building is in good condition, it no longer fully meets the needs of the community. The growth in library collections and the expansion of library staff has drastically limited the amount of space that the library has available for fu-ture growth. The library has begun planning for either the expansion of the current library, or the construction of an entirely new facility.
Recommendation
Continue regular maintenance of the current facility.•
Repair the sidewalks and parking lots servicing the li-• brary.
Proceed with plans for the expansion of the city’s cur-• rent library facilities, by contracting with a building con-sultant to help in the process of programming for a new facility, and in the selection of a project architect.
Complete Waterworks Park Master Plan to address ex-• pansion or relocation of the library.
Public Facility Priorities
Expand the city’s current library facility to provide the • space and services need for a growing community.
Work with Johnston to identify the location of an addi-• tional fire station in eastern Grimes.
Closely monitor the needs of all public facilities in rela-• tion to the city’s growing population.
Expansion of the school facilities to maintain the dis-• trict’s current level of service/quality

Chapter 3 : Page 46
Section One: A Profile of GrimesThe Grimes Plan
Infrastructure Inventory & Analysis
This section presents an inventory and evaluation of the city’s existing infrastructure systems. It includes water dis-tribution and storage, sanitary sewer collection and treat-ment, stormwater conveyance, and transportation. The city’s wastewater treatment and water treatment are con-tracted out to People’s Service.
SANITARY SEWER
Wastewater Collection
Grimes’ wastewater collection system has lines ranging in size from 4 to 30 inches in diameter. The majority of lines within the system are 10 to 12 inches. All new installations are PVC, with clay pipe existing in the oldest sections of the city. Any repair work to the original system of clay pipes in being replaced with PVC pipe. The system serves only the City of Grimes, except for the portion of the city located north of NW 27th Street. Properties in this portion of the city are on domestic well and septic systems.
Evaluation
The collection system is in good condition. There is a preventative maintenance plan in place, with lines being cleaned and jetted once every four years. In areas with root problems lines are cleaned and jetted annually. In-filtration and inflow is an issue, with the majority of infil-tration originating within the city’s oldest neighborhoods and from poorly sealed manholes. Continued repair and replacement of lines, and the proper sealing of manhole covers are long term solutions to the problem.
Recommendations
Continue regular maintenance of sanitary sewer lines•
Replace obsolete clay pipes as required. •
Lift Stations
There are three city-owned lift stations and no private sta-tions in the city. All three stations are relatively new hav-ing been constructed in the last eight years, and are in ex-cellent condition. Two of the three stations are equipped with transmitters that transmit current operational condi-tions to the sewage treatment plant 24 hours a day. The system has been designed for future capacities. In the short-term People’s Service is planning to install a trans-mitter on the third lift station.
Wastewater Treatment Plant
Grimes’ Wastewater Treatment Plant is located near the geographic center of the city at 1801 North James Street. The plant has a design capacity of 2.9 million gallons a day (mgd) and averages 1.3 mgd. The plant was last ex-panded in 2001 with plans to increase capacity by another 40% within the next 5 to 10 to address growth needs. The site will allow for further expansions as needed. The facil-ity is in good condition, preventative maintenance prac-tices have ensured that the plant continues to work at its optimal capacity. Stormwater runoff from surrounding properties remains an issue at the plant. Addressing this problem with “green” solutions could provide a model for how to address stormwater throughout the city.
Stormwater Collection System
Grimes lies within the Beaver Creek and Walnut Creek drainage basins. There are few enclosed storm sewer lines in the oldest sections of the city but a series of drain-age swales that convey stormwater. As growth quickened during the 1990s, many newer neighborhoods through-out the city were equipped with closed storm sewer lines that drain into storm channels and creeks. Commercial and Industrial developments along Highway 141 use open drainage systems that drain towards tributaries.
Evaluation
Overall the city’s stormwater collection system is in fair condition, with much of the system’s infrastructure con-structed in the last 20 to 30 years. There are problems with the system, primarily in older districts and along Highway 141. In the downtown, along Main Street, trunk lines lead-

Chapter 3 : Page 47
Section One: A Profile of Grimes The Grimes Plan
ing towards the Little Beaver Creek are undersized and in poor condition. Often, during major rain events water pools along the street, and in some instances has even backed up into businesses. More minor problems also exist along primary stormwater and conveyance channels where cattails have taken hold. During rain events these cattail stands can slow the flow of water, leading to local-ized flooding. The problem has been most prevalent by the Post Office at Grimes Crossing and within the Grimes Business Park. The city is actively working with these de-velopments to clear channels.
Recently, the city council adopted new standards for de-velopers to follow in the mitigation of stormwater runoff.
These new standards further reinforce the creation of a citywide greenway system in which open space and trail networks can be developed, as well as address erosion issues. Problems with erosion exist throughout the city’s stormwater system. As the city continues to develop, more steps will need to be taken to ensure that stormwa-ter is treated on site rather than discharged directly into streams.
Recommendations
Continue regular maintenance of conveyance and • stormwater channels to prevent localized flooding
Upgrade Trunk lines along Main Street in order to stop •
MAY, 2010
Grimes City Limits24” and Up21”18”15”12”10”8”Service LinesManhole
Map 3.3
Sanitary Sewer LinesGrimes, Iowa
2000’1000’0
!
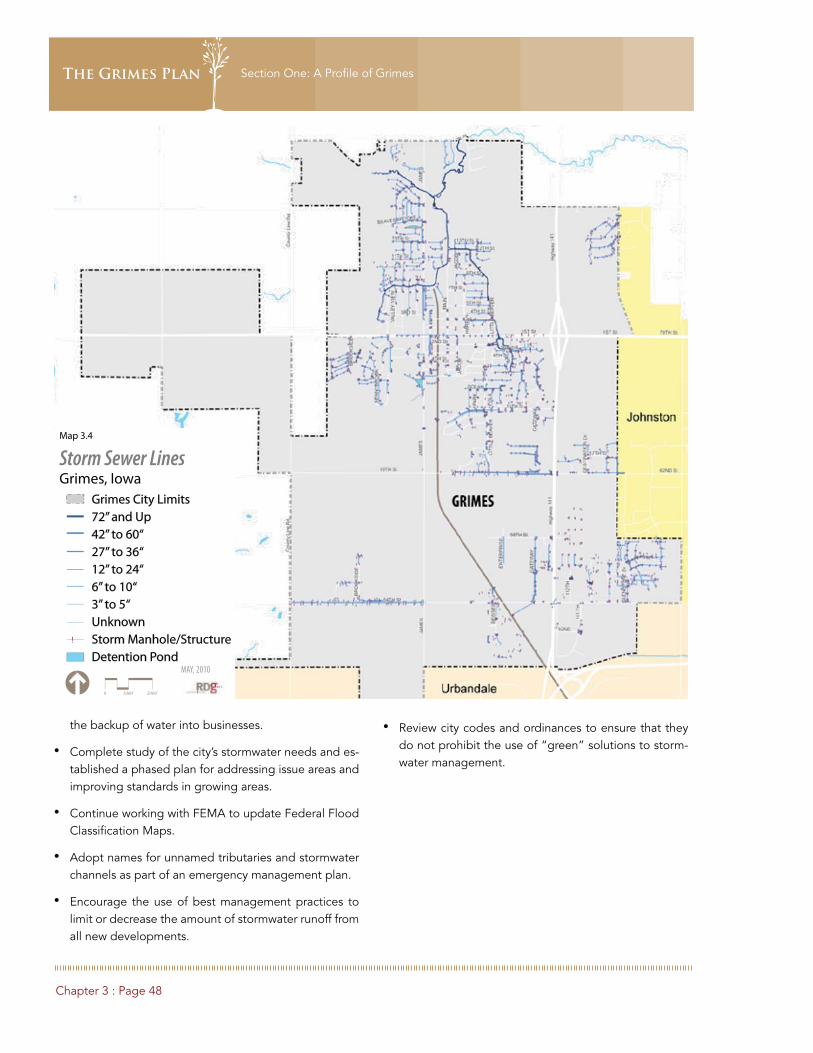
Chapter 3 : Page 48
Section One: A Profile of GrimesThe Grimes Plan
the backup of water into businesses.
Complete study of the city’s stormwater needs and es-• tablished a phased plan for addressing issue areas and improving standards in growing areas.
Continue working with FEMA to update Federal Flood • Classification Maps.
Adopt names for unnamed tributaries and stormwater • channels as part of an emergency management plan.
Encourage the use of best management practices to • limit or decrease the amount of stormwater runoff from all new developments.
MAY, 2010
Grimes City Limits72” and Up42” to 60“27” to 36“12” to 24“6” to 10“3” to 5“UnknownStorm Manhole/StructureDetention Pond
Map 3.4
Storm Sewer LinesGrimes, Iowa
2000’1000’0
!
Review city codes and ordinances to ensure that they • do not prohibit the use of “green” solutions to storm-water management.

Chapter 3 : Page 49
Section One: A Profile of Grimes The Grimes Plan
WATER SYSTEM
Water Supply
The City of Grimes relies on three wells located to the north of the city limits for its source water. These wells are between 50 to 80 feet in depth and are about one mile from the city’s water treatment facility, located at 1801 N James. The well field was constructed in 2001, and aver-ages 1.9mgd. People Service inspects the wells once ev-ery three years, and performs other regular maintenance on an as need basis.
Evaluation
The wells are in excellent condition with no indication of reduced capacity. The city will need to construct a fourth well within the next five years in order to keep ahead of increasing demands.
Recommendations
Establish a water conservation program in the city that • promotes wise water use, decreasing demand on the system.
Water Treatment Plant
Grimes’ Water Treatment Plant is located adjacent to its wastewater treatment facility at 1801 North James Street. Plant capacity is 1.9 mgd and averages 870,000 gallons per day. Its maximum daily demand has been 1.4 mgd, close to the facilities maximum capacity. People Service intends to increase the plant’s capacity by 40% in the next ten years to address city growth needs.
Evaluation
The plant is in very good condition and has received nec-essary upgrades over the years. While the facility is con-sidered small, it has been designed to allow for future ex-pansions as the city grows.

Chapter 3 : Page 50
Section One: A Profile of GrimesThe Grimes Plan
Water Storage
Grimes has two storage reservoirs providing 1.35 million gallons of storage capacity. A concrete underground res-ervoir located at the water treatment facility has a 350,000 gallon capacity, and a standpipe located at 104 South James Street has a capacity of 1 million gallons. Water is treated before it is pumped into the storage facilities.
Evaluation
The storage facilities are in very good condition, with the standpipe being refurbished in 2008. There is a need for increased capacity, and a third storage tank is planned for the southern portion of the city.
Recommendations
Continue routine maintenance•
Construct a new standpipe in southern Grimes in order • to increase the system’s capacity.
Continue to evaluate the city’s water storage needs as • the city grows.
!( !(
!(
!(!(
!(
!(
!( !(
!(
!(
!(
!(!( !(
!(!(
!( !(!(
!(!(
!(
!(
!(!(!(!(
!(!(
!(!(!(!(
!( !(
!(
!(
!(!(!(!(
!(
!( !(
!(
!(
!(
!(
!(!(!(!( !(
!(
!(!(!(!(!(
!(
!(!(
!(
!(
!(
!(
!(
!(
!( !(
!(
!(
!(
!(
!(!(
!(!(
!(
!(
!(
!(
!( !(
!(
!(
!(
!(!(
!(
!( !( !(
!(!(!(
!( !( !(
!(!(!(
!(
!(!(
!(
!(
!(
!(!(
!(
!(
!(
!( !( !(
!( !(
!(
!(!(!(
!(
!(
!(
!(
!( !( !(!(
!(
!(
!(
!(!(
!(!(
!(
!( !( !( !( !( !( !(
!(!(!(
!(
!(
!(!(
!(!(!(!(
!(
!( !(
!(!(!(
!( !( !(!(
!( !( !( !(
!(
!(
!(
!(!(
!(!(
!( !(!(
!(!(
!(
!(!(
!(
!(
!(
!( !(!(!(
!(!(
!(!(!(
!(
!(
!( !( !(!(
!(!(
!(
!(
!(!(
!(!(
!(!(!( !(
!(
!(!(!(!(!(
!( !(
!( !( !(
!(
!(
!( !( !( !(
!(
!(!( !( !(
!(!(!(!(
!(
!(!( !(
!(
!(!(!(
!(!( !(
!(!(!(!(
!( !( !( !(
!( !( !( !(!(!(!(
!(
!(
!( !(!(
!(!(
!(!(
!(
!( !(
!(
!(
!( !( !(!(
!(
!( !(
!(
!( !(
!(!( !(
!(
!(
!(
!(
!(!(!(
!(
!(!( !(
!(
!(!(
!(!(
!(!(!(!(
!(
!(
!(
!( !( !( !(!(
!(
!(!(
!(
!(
!( !(
!(
!(!(!(!(!(!(!(!(
!(!(
!( !(
!( !( !(!(!(
!(
!(
!(
!(
!( !( !(!(
!(
!(
!(
!(
!(
!( !(!(
!(
!(
!( !(
!( !(
!(
!(
!(
!(!(
!(!(
!(!(
!(
!(
!( !( !(
!(!(
!(
!(
!(!(
!(!(
!(
!(
!(!(
!(
!(
!(!(
!(!(!(
!( !(!(!(
!(
!(!(!(!(!( !( !(
!(!(!(
!(!( !(
!(
!(
!(!( !( !(
!(
!(!( !(
!(
!(!(!(!(
!(
!( !(
!( !(!(
!(
!(!(!(
!(
!(!(!(!( !(
!(
!( !(!( !(
!(!(!(
!(
!(
!(
!(
!(!(
!(
!(!( !(
!(
!(!(
!( !(!(
!(!(
!(!( !( !(
!(!(!(
!( !(
!(
!(!(!(
!(
!( !( !(!(
!(!(
!(!(!(!(!(!(!(
!( !( !(!(!(
!(!(!( !(!(!(
!( !(
!(
!(
!(
!(
!(!(
!(
!(!(!(!(!(
!(!(
!(
!(
!( !(
!( !(!(
!(!(
!(!(!( !(
!(!( !(!(!(!(
!(
!(
!(
!(!( !(!(!(
!(
!( !(
!(
!(
!(
!(
!(
!(
!(
!(
!(!(!(!(!(!(
!(
!(
!(!(!(
!(!( !(
!(
!(!(
!(
!(
!(
!(
!(!(!(
!(!( !( !( !( !( !( !(
!(
!(
!(!(!(
!(!(
!(
!(
!(
!(
!(
!(
!(
!(
!(!(
!(!(
!(
!(
!( !(!(!(
!(
!( !(
!(
!(
!(
!(
!(
!( !(!(
!(
!(
!(
!(!( !(
!(
!(
!(!(!( !( !(
!(
!(
!(
!(
!(!(!(
!(!(
!(
!(!(!(!(
!( !( !(!(
!(!(
!(!( !( !(
!(!(
!(
!(!(!(
!( !(
!(!( !(!(
!( !(
!(
!(
!(!(
!(
!(!(!(
!( !(
!(
!(!(
!(!(
!(!(
!(!(
!( !(
!(
!(!(
!(
!(
!(
!(!(!(
!(
!(
!(
Map 3.5
Urbandale
Johnston
GRIMES
Cou
nty
Line
Rd.
Cou
nty
Line
Rd.
1ST St.
JAM
ES
JAC
OB
HA
RE
VY
JAM
ES
MA
IN
JAC
OB
PAR
K
PO
LK
112T
H
VALL
EY
VIE
W
13TH St.
BEAVERBROOKE
19TH St. 62ND St.
11TH St.
11TH St.
17TH St.
12TH St.
13TH St.
9TH St.
7TH St.
LITT
LE B
EAV
ER
LITT
LE B
EAV
ER
KE
NN
YB
RO
OK
BR
OO
KS
IDE
3RD St
3RD St2ND St
DOLAN
4TH St4TH St
4TH St
5TH St
Hig
hway
141
Hig
hway
141
GAT
EW
AY
BE
ISS
ER
GAT
EW
AY
GLE
NS
TON
E D
r.EN
TER
PR
ISE
BR
OO
KS
IDE
DE
STI
NAT
ION
Dr.
54TH St.
52NDJAM
ES 11
1 TH
1ST St. 70TH St.
Cou
nty
Line
Rd.
Cou
nty
Line
Rd.
1ST St. 1ST St.
JAM
ES
JAC
OB
HA
RE
VY
JAM
ES
MA
IN
JAC
OB
PAR
K
PO
LK
112T
H
VALL
EY
VIE
W
13TH St.
BEAVERBROOKE
19TH St. 62ND St.
70TH St.
11TH St.
11TH St.
58TH St.
17TH St.
12TH St.
13TH St.
9TH St.
7TH St.
LITT
LE B
EAV
ER
LITT
LE B
EAV
ER
KE
NN
YB
RO
OK
BR
OO
KS
IDE
3RD St
3RD St2ND St
DOLAN
4TH St4TH St
4TH St
5TH St
Hig
hway
141
Hig
hway
141
GAT
EW
AY
BE
ISS
ER
GAT
EW
AY
GLE
NS
TON
E D
r.EN
TER
PR
ISE
BR
OO
KS
IDE
DE
STI
NAT
ION
Dr.
54TH St.
52NDJAM
ES 11
1 TH
MAY, 2010
Grimes City Limits12”10“8”6“4”2”Service LinesWater ValvesWater Hydrants
Map 3.5
Water LinesGrimes, Iowa
2000’1000’0
!
!
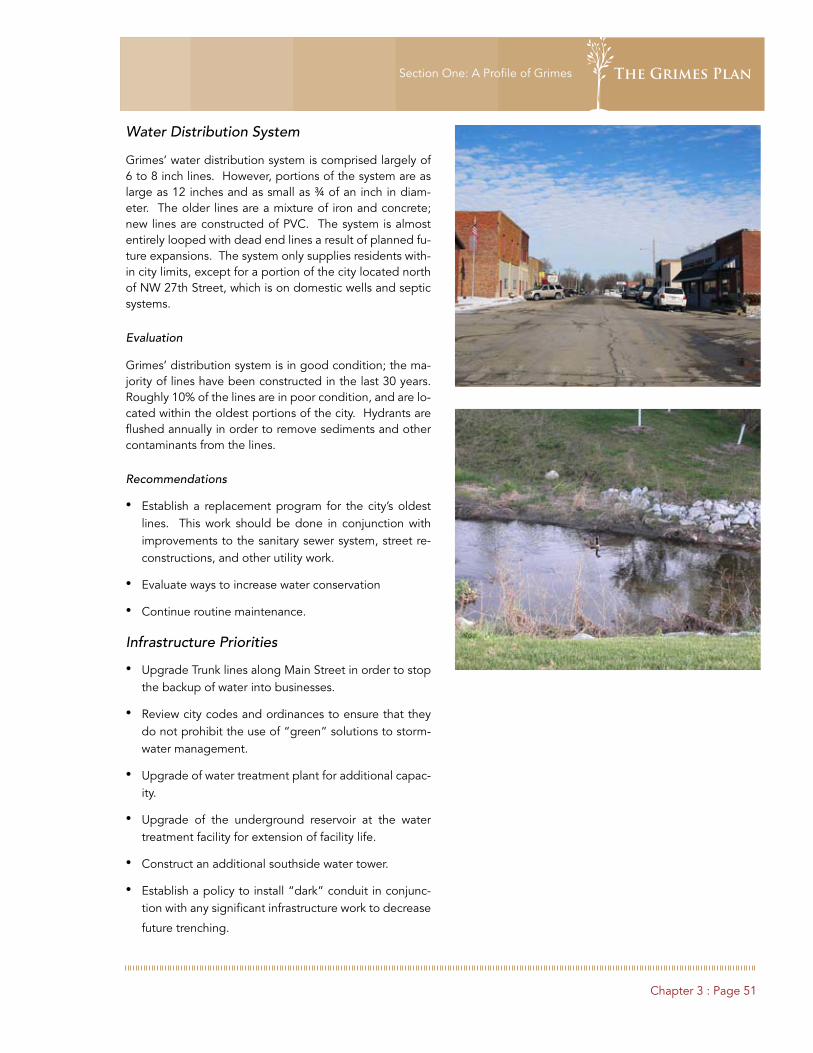
Chapter 3 : Page 51
Section One: A Profile of Grimes The Grimes Plan
Water Distribution System
Grimes’ water distribution system is comprised largely of 6 to 8 inch lines. However, portions of the system are as large as 12 inches and as small as ¾ of an inch in diam-eter. The older lines are a mixture of iron and concrete; new lines are constructed of PVC. The system is almost entirely looped with dead end lines a result of planned fu-ture expansions. The system only supplies residents with-in city limits, except for a portion of the city located north of NW 27th Street, which is on domestic wells and septic systems.
Evaluation
Grimes’ distribution system is in good condition; the ma-jority of lines have been constructed in the last 30 years. Roughly 10% of the lines are in poor condition, and are lo-cated within the oldest portions of the city. Hydrants are flushed annually in order to remove sediments and other contaminants from the lines.
Recommendations
Establish a replacement program for the city’s oldest • lines. This work should be done in conjunction with improvements to the sanitary sewer system, street re-constructions, and other utility work.
Evaluate ways to increase water conservation•
Continue routine maintenance.•
Infrastructure Priorities
Upgrade Trunk lines along Main Street in order to stop • the backup of water into businesses.
Review city codes and ordinances to ensure that they • do not prohibit the use of “green” solutions to storm-water management.
Upgrade of water treatment plant for additional capac-• ity.
Upgrade of the underground reservoir at the water • treatment facility for extension of facility life.
Construct an additional southside water tower.•
Establish a policy to install “dark” conduit in conjunc-• tion with any significant infrastructure work to decrease
future trenching.

Chapter 3 : Page 52
Section One: A Profile of GrimesThe Grimes Plan
Transportation
EXISTING STREET CLASSIFICATION
Principal Arterials. These roads serve regional needs and
connect important activity centers. They include:
Highway 141•
Highway 44•
Minor Arterials. These streets connect with and comple-
ment the principal arterial system by linking activity cen-
ters and connecting various parts of the city together. As
a general rule, these streets are spaced at 0.5 to 1.0 mile
intervals in developed urban areas. Streets currently in
this classification include:
First Street•
19th Street/62nd Avenue•
Collector. The collector system links neighborhoods to-
gether and connects them to arterials and activity cen-
ters. Collectors are designed for relatively low speeds (35
miles per hour and below). Collectors in Grimes’ system
include:
James Street/NW 128th Avenue•
19th Street•
37th Street •
Local Streets. Local streets serve individual properties
within residential or commercial areas. They provide di-
rect, low-speed access for relatively short trips.
TRAFFIC CAPACITY ANALYSIS (LOS)
A capacity analysis compares the traffic volumes on a street segment with the design capacity of that segment. The ratio of volume over capacity (V/C) corresponds to a “level of service” (LOS), which describes the quality of traffic flow.
Measures of Level of Service (LOS)
System performance of a street is evaluated using a criteri-on called the “level of service” (LOS). LOS is a qualitative measure that generally focuses on speed and smoothness of traffic flow under specific volume conditions. A ratio of volume to capacity (how much traffic the street carries divided by how much traffic the street was designed to carry) provides a short method for determining LOS. LOS categories are described as follows:
LOS A: Free-flowing operation. Vehicles face few impedi-
ments to maneuvering. The driver has a high level of
physical and psychological comfort. Minor accidents or
breakdowns cause little interruption in the traffic stream.
LOS A corresponds to a volume-capacity (V/C0 score of
0 to 0.60.
LOS B: A reasonably free-flowing operation. Maneuvering
ability is slightly restricted, but ease of movement remains
high. LOS B corresponds to a V/C score of 0.60 to 0.70.
LOS C: Stable operation. Traffic flows approach the range
in which traffic increases will degrade service. Minor inci-
dents can be absorbed, but a local slowdown will result.
LOS C corresponds to a V/C score of 0.70 to 0.80.
LOS D: Borders on unstable traffic flow. Small traffic in-
creases produce substantial service deterioration. Ma-
neuverability is limited and comfort reduced. LOS D rep-
resents a V/C score of 0.80 to 0.90.
LOS E: Typical operation at full design capacity of street.
Operations are extremely unstable because there is little
margin of error in the traffic stream. LOS E corresponds to
a V/C score of 0.90 to 1.00.
LOS F: A breakdown in the system. Such conditions ex-
ist when queues form behind a breakdown or congestion
point. This condition occurs when traffic exceeds the de-
sign capacity of the street.

Chapter 3 : Page 53
Section One: A Profile of Grimes The Grimes Plan
MAY, 2010
Grimes City LimitsInterstatePrincipal ArterialMinor ArterialCollectorLocal
Map 3.6
Existing Street ClassificationGrimes, Iowa
2000’1000’0
Data Source: Federal Functional Classification System For The Urban Area of Des Moines, IAIowa Department of TransportationApril 2, 2009
Urbandale
Johnston
GRIMES
Cou
nty
Line
Rd.
Cou
nty
Line
Rd.
1ST St.
JAM
ES
JAC
OB
HA
RE
VY
JAM
ES
MA
IN
JAC
OB
PAR
K
PO
LK
112T
H
VALL
EY
VIE
W
13TH St.
BEAVERBROOKE
19TH St. 62ND St.
11TH St.
11TH St.
17TH St.
12TH St.
13TH St.
9TH St.
7TH St.
LITT
LE B
EAV
ER
LITT
LE B
EAV
ER
KE
NN
YB
RO
OK
BR
OO
KS
IDE
3RD St
3RD St2ND St
DOLAN
4TH St4TH St
4TH St
5TH St
Hig
hway
141
Hig
hway
141
GAT
EW
AY
BE
ISS
ER
GAT
EW
AY
GLE
NS
TON
E D
r.EN
TER
PR
ISE
BR
OO
KS
IDE
DE
STI
NAT
ION
Dr.
54TH St.
52NDJAM
ES 11
1 TH
1ST St. 70TH St.
DOUGLAS
MEREDITH
Cou
nty
Line
Rd.
Cou
nty
Line
Rd.
1ST St. 1ST St.
JAM
ES
JAC
OB
HA
RE
VY
JAM
ES
MA
IN
JAC
OB
PAR
K
PO
LK
112T
H
VALL
EY
VIE
W
13TH St.
BEAVERBROOKE
19TH St. 62ND St.
70TH St.
11TH St.
11TH St.
58TH St.
17TH St.
12TH St.
13TH St.
9TH St.
7TH St.
LITT
LE B
EAV
ER
LITT
LE B
EAV
ER
KE
NN
YB
RO
OK
BR
OO
KS
IDE
3RD St
3RD St2ND St
DOLAN
4TH St4TH St
4TH St
5TH St
Hig
hway
141
Hig
hway
141
GAT
EW
AY
BE
ISS
ER
GAT
EW
AY
GLE
NS
TON
E D
r.EN
TER
PR
ISE
BR
OO
KS
IDE
DE
STI
NAT
ION
Dr.
54TH St.
52NDJAM
ES 11
1 TH
DOUGLAS
MEREDITH

Chapter 3 : Page 54
Section One: A Profile of GrimesThe Grimes Plan
Table 3.4 presents the capacity of various street sections at LOS D, the point at which congestion problems begin to occur.
Cautions about the LOS System
The LOS measure is ultimately a measure of traffic speed. Clearly, LOS is an important measure because the funda-mental purpose of streets is to move traffic. However, LOS does not measure other important values including:
Neighborhood preservation•
Environmental quality•
Economic vitality and access•
Energy conservation•
Efficient development patterns•
Pedestrian environment•
Table 3.4: Typical Traffic Capacity by Facility Type
Capacity at LOS D (VPD)
2-Lane 3-Lane 4-Lane
Minimal Access 12,500 16,500 25,400
Residential 12,300 16,250 25,300
Mixed Zoning 11,200 14,850 23,600
Central Business District 9,400 12,650 20,500
Table 3.5: Performance of Key Street Segments, 2004 & 2008 Street Name Section Description Capacity
(VPD) 2008 Volume V/C Ratio 2008
Estimate LOS
First St NW 107th Street to Highway 141 25,400 2,660 5,800 0.23 A
First St Highway 141 to Gateway Drive 25,400 12,400 12,200 0.48 A
First St Gateway Drive to end of 4 lane 25,400 11,600 12,700 0.50 A
First St End of 4 lane to Railroad Street 11,200 9,500 12,700 1.13 F
First St Railroad St to James St 11,200 8,700 9,900 0.88 D
First St James St to City Library 11,200 6,900 7,600 0.68 B
First St City Library to Maplewood 11,200 6,600 6,800 0.61 B
First St First St to city limits 12,500 5,800 5,900 0.47 A
Maplewood Dr
First St to NW Prairie 12,300 430 430 0.03 A
Maplewood Dr
First St to Hickory Glen 12,300 1,070 1,140 0.09 A
James Street 82nd Ave intersection 12,500 - 1,360 0.11 A
James Street 82nd Ave to 2nd St 12,300 1,240 2,530 0.21 A
James Street N 2nd St to 1st St 11,200 4,240 5,300 0.47 A
James Street 1st to S 2nd St 11,200 3,580 3,750 0.33 A
James Street 19th Street Intersection 12,500 - 3,680 0.29 A
James Street 6th Street Intersection 11,200 4,190 - 0.37 A
James Street 54th Ave Intersection 12,500 - 4,080 0.33 A

Chapter 3 : Page 55
Section One: A Profile of Grimes The Grimes Plan
A development pattern that improves LOS, can involve driving longer distances. This ultimately increases the amount of traffic and the total number and length of ve-hicle trips. Thus, while LOS is a useful tool, it should not be used to the exclusion of other values. The transporta-tion system should serve, rather than dominate, the over-all environment.
Although measures to improve LOS, such as widening roadways and adding lanes, can improve the flow of traf-fic, they can also diminish the quality of the pedestrian environment. These measures can also increase traffic speeds, which can in turn decrease pedestrian safety.
Operational Analysis
Table 3.5 illustrates the performance of Grimes’ streets and compares traffic volumes between 2004 and 2008 for roads providing regional access. Presently, drivers in Grimes experience LOS “A” on most local arterials, how-ever, sections of major regional arterials and collectors (First and James Streets) are at their operational capaci-ties. Based on the traffic counts provided by the Iowa De-partment of Transportation, Grimes’ traffic volumes have continued to rise over that last four years. The tremen-dous growth that has occurred around Grimes has led to increased traffic flows. A major road widening project is scheduled to begin in 2010 along First Street. This will greatly improve the flow of traffic by widening drive lanes,
and incorporating a center turn lane.
Table 3.5: Performance of Key Street Segments, 2004 & 2008 Street Name Section Description Capacity
(VPD) 2008 Volume V/C Ratio 2008
Estimate LOS
S. James St 54th Ave to Meridith Dr 12,500 3,880 5,300 0.42 A
NW 82nd St East of James St intersection 12,500 - 1,250 0.10 A
NW 107th St At NW 70th 12,500 - 540 0.04 A
Gateway Dr 1st St to Gateway Circle 11,200 6,600 7,300 0.65 B
Highway 141 First Street south to S 19th St 25,400 27,600 28,700 1.13 F
Highway 141 S 19th St to 54th Ave 25,400 26,800 31,600 1.24 F
Highway 141 54th Ave to Interstate 35/80 25,400 31,800 39,000 1.54 F
SE 19th St Divided section west of highway 141
14,850 1,850 2,310 0.16 A
SE 19th St East of highway 141 to city limit 11,200 5,300 6,400 0.57 A
NW 54th Ave Beisser Dr to Gateway Dr 11,200 4,700 0.42 A
NW 54th Ave Gateway Dr to Highway 141 14,850 5,100 6,100 0.41 A
NW 54th Ave Highway 141 to NW 114th St 23,600 7,600 10,300 0.44 A
NW 54th Ave NW 114 St to 100th St 11,200 5,100 8,600 0.77 C
TRANSPORTATION PRIORITIES
Improve access to the downtown and to residential dis-• tricts along First Street.
Improve pedestrian access around the city, especially • across Highway 141
Improvements to James Street including new curb and • gutter, sidewalks and landscaping
Improve access around and through the city, by creat-• ing new transportation corridors.

section twoA COMMUNITY VISION
Section 2 : Page 57

Chapter 4 : Page 59
Section Two: A Community Vision The Grimes Plan
Grimes’ residents and business owners are critical assets and their participation was essential to the planning process. The Grimes Comprehensive Plan includes a thorough public participation program, giving stakeholders the opportunity to frame the goals and directions of the Plan. This chapter of the Plan presents the vision for the community, from community members.
Public Participation Process
A STEERING COMMITTEE
A Comprehensive Plan Steering Committee, represent-ing a wide variety of community interests, was the prima-ry contributor to this process. Committee members met regularly to assist in identifying issues, developing vision statements, and prioritizing the community’s goals. They also reviewed the progress of the overall plan.
COMMUNITY QUESTIONNAIRE
To begin the planning process, a community question-naire was completed by 168 residents. The survey pro-vided insight on important community services and facili-ties. The results helped to frame the issues and goals for the community, and were addressed in more detail during focus group meetings.
FOCUS GROUP MEETINGS
Focus group meetings were held in September 2009. Residents, business and property owners, financial institu-tions, and public officials participated in roundtable dis-cussions to share their opinions of the community and its future opportunities.
COMMUNITY STRATEGIC PLANNING WORKSHOP
A community wide workshop was also held in Septem-ber 2009. Interested residents were invited to share their thoughts on the issues and opportunities for Grimes over the next 20 years.
Chapter 4
A VISION FOR GRIMES
COMMUNITY PRESENTATION
Community presentations were held in September and October of 2009 where the Plan’s Policy Statements were presented to residents. A summary of the public input pro-cess and Community Profile (Section 1) were outlined to the public as the building blocks for the Policy Statements or guiding goals for the Plan and the future of Grimes.
DESIGN WORKSHOPS
Two public design workshops were used to engage res-idents, business owners, and other stakeholders in the planning process. The first workshop, held in November 2009 focused on the entire city. The second workshop, held in February of 2010, focused on opportunities for the downtown. Participants shared their ideas, issues, and

Chapter 4 : Page 60
Section Two: A Community VisionThe Grimes Plan
concerns informally with planners and designers, while ideas were illustrated for their reactions. The results of the workshops are the basis of the Development Plan outlined in Section 3.
OPEN HOUSE
A Community Open House was held in May 2010, offer-ing the public an overview of the Plan and opportunities to provide feedback on the Plan.
Issue Identification
During the initial stages of the planning process, a com-munity survey was available to the public to express their thoughts about Grimes’ services and facilities. The survey consisted of questions, both multiple-choice and short-an-swer. Survey responses help measure perceptions about the City, examining potential priorities and the applicabil-ity of various general actions. Survey participants could respond by completing an internet-based survey or sub-mitting a hardcopy. A total of 168 surveys were collected from the community. The results of the survey act as a base for the sessions with the steering committee, focus groups, and design workshops.
Survey participants completed a “report card” question-naire that asked participants to rank various features of Grimes on a one to five scale, with five representing excel-lent and one representing poor. Attributes with average
scores of 3.0 or above are perceived strengths and those with scores below 2.5 represent areas of perceived weak-nesses.
Survey respondents identified the following as perceived strengths of Grimes:
Elementary Education (4.35) ◦
Secondary Education (4.24) ◦
Recycling Program (4.12) ◦
Garbage Collection (3.98) ◦
Overall Quality of Life (3.97) ◦
Availability of Housing (3.85) ◦
Survey respondents identified the following as perceived weaknesses of Grimes:
Downtown Grimes (1.82) ◦
Tourism Potential (2.27) ◦
Historic Buildings and Resources (2.29) ◦
Regional Trail Connections (2.40) ◦
The Highway 44 Corridor (2.50) ◦
Design/Appearance of Grimes (2.53) ◦
0.0%
10.0%
20.0%
30.0%
40.0%
50.0%
60.0%
70.0%
Stre
et Im
pro
vem
ents
to
H
WYs
44
& 1
41
Go
vern
ors
Dis
tric
t R
evita
lizat
ion
Pro
ject
Imp
rove
d p
edes
tria
n &
b
icyc
le a
cces
s al
ong
H
WY
44
Trai
l net
wo
rk
imp
rove
men
ts
Tran
spo
rtat
ion
Imp
rove
men
ts
Cre
atio
n o
f bet
ter
pub
lic s
pac
es
Co
mp
letio
n o
f Sp
ort
s C
om
ple
x
Ann
exat
ion
Incr
ease
City
Ser
vice
sSpecific Actions or Projects to Accomplish in the Next Ten Years

Chapter 4 : Page 61
Section Two: A Community Vision The Grimes Plan
The survey also asked participants, what specific actions or projects they would like to see Grimes accomplish dur-ing the next 10 years. Nearly 60% of respondents replied that they would like to see the city address needed street improvements along Highways 44 and 141, followed by downtown revitalization, and improvements to pedestrian facilities along highway corridors. Figure 2.1 further illus-trates the projects and actions that participants selected as being important to undertake.
Policy Statements
The Policy Statements are the guiding principles of the Grimes Comprehensive Plan. Formulating and adopting policies as part of the comprehensive planning process are important for a number of reasons. Some of these include:
Providing advance notice to private decision-makers, • including developers, builders, and property owners, about basic principles that will guide Grimes’ public decisions. This helps these groups make decisions more efficiently, avoiding conflicts and wasting time and money.
Providing a framework for consistent decision-making, • while providing flexibility for review of individual situ-ations.
Keeping decisions oriented to overall community • goals.
Increasing interagency communication and coopera-• tion, assuring that different bodies act in accord with similar assumptions.
Providing a firmer basis for evaluating the costs and • benefits of public investments, and their consistency with overall policy objectives.
Providing for public participation in local government, • helping to implement ideas that grow from citizens of the area.
Providing a general basis for interpreting and applying • the comprehensive plan, maintaining the flexibility to respond to individual situations.
Giving staff a context for developing recommendations • for action by local government.
In developing this section, input from the Steering Com-mittee, residents, and city staff was integrated with the demographic, economic, and land use information de-tailed in Section 1. Policy statements should be broad pro-posals of what a community hopes to accomplish, while strategies are identify the approach or task necessary to achieve goals. The committee evaluated preliminary poli-cy statements and strategies, and clarified them as need-ed. These were then presented to the public for further comment.
The subsequent section of the Grimes Comprehensive Plan provide more detailed directions toward implement-ing these policies and, in some ways, illustrate the physical outcome of their application. Decisions by public officials should be grounded in these concepts and directions. However, policies are guidelines rather than laws. Situa-tions arise that require a flexible rather than literal applica-tion of these statements. Sometimes, a new or changed policy can create substantial benefits to the city and its residents, and still remain consistent with overall commu-nity goals.

Chapter 4 : Page 62
Section Two: A Community VisionThe Grimes Plan
GROWTH AND LAND USE
Grimes will grow as a unified community through attrac-tive and sustainable land development.
The city should develop in a format that will preserve • the small town feel, forming neighborhoods, not sub-divisions.
Streets should be interconnected, providing a quality • transportation system and a small town feel.
Industrial development should be oriented towards ex-• isting infrastructure on the south side of the city.
Establish long-term annexation agreements with sur-• rounding cities.
Develop a strategy for expanding city services and staff • in conjunction with city growth, including the need for local police force.
Establish policies that encourage a range of housing • styles for different stages of life.
TRANSPORTATION
Grimes future transportation system will be accessible to all residents, conveniently and effectively move traffic in and around the city; and support the continued economic growth of the city.
Increase the number of entrances into the city includ-• ing the extension of streets like Gabus Boulevard and Highway 141.
Specific streets, like James and County Line Road, • should be improved to support existing and future de-velopment.
Pedestrian and trail amenities should be included in all • transportation projects.
Consider and evaluate a bypass for both Highway 141 • and 44.
Remove the railroad north of 54th Avenue and utilize • the corridor in the city’s trail network.
PARKS RECREATION & COMMUNITY WELLNESS
Grimes will be a healthier city by providing attractive rec-reation resources to residents and visitors, and construct-ing infrastructure that encourages physical activity.
Parks should grow with the city, at a minimum maintain-• ing the city existing level of service.
All residents should be within walking distance of • neighborhood parks.
Park and recreation facilities should provide a variety of • recreational opportunities.
Trails should encircle the city and connect to the re-• gional trail system.
Pedestrian and trail amenities should be included in all • transportation projects.

Chapter 4 : Page 63
Section Two: A Community Vision The Grimes Plan
CENTRAL GRIMES/GOVERNORS DISTRICT
Policies and improvements for Central Grimes will create a vibrant center that is attractive to businesses, residents, and visitors.
Develop a master plan for the Governors District and el-• evator area that creates a community gathering place.
Create a walkable district that retains small town at-• tributes.
Identify a niche market and then work to attract those • types of businesses.
Establish design standards that create a small town at-• mosphere.
Address infrastructure issues and create reinvestment • opportunities
Connect the district to the trail system.•
COMMUNITY IMAGE & CHARACTER
Grimes will build on community assets to create a distinct image and positive environment for doing business, living and playing in the community.
Entrance features should be developed that distinguish • Grimes and welcome visitors to the city.
Design regulations should be developed and imple-• mented that project a high quality city.
Clarify city theme and use to market the community.•

section threeCOMMUNITY PLAN
Section 3 : Page 65

Chapter 5 : Page 67
Section Three: Community Plan The Grimes Plan
Grimes’ land use plan should establish a development vision, identify directions for future growth, maintain and enhance the quality of existing development, and provide a sound basis for public and private decisions. This section of the document outlines the land use principles that guided the preparation of a development framework and specific plan elements.
Land Use & Growth Principles
The analysis and calculations presented in Section One estimate how much new land the city will need to serve potential growth. However, this new development should use land efficiently, be environmentally and economical-ly sustainable, and reinforce the quality and character of Grimes. “Smart growth” principles, applied to overall city development policy, can combine the desire of the city and its builders to take advantage of opportunities and the public benefits of environmental sensitivity, economic efficiency and enhancement of community and civic life. These principles, adapted to Grimes, establish patterns that should guide the city’s overall development. Grimes will grow smart if it:
Chapter 5
DEVELOPMENT VISION
Encourages Community Design that Uses Land Effectively.
Grimes future land use plan illustrates the development of approximately six square miles of potential development to meet the estimated twenty-year demand. Much of this land will be within the existing city limits, but outside the perimeter of existing development. To avoid stretching city services over wide areas, which increases both the cost of government and the distance that people must travel to their destinations, new growth should generally be adjacent to existing development, or take maximum advantage of underutilized “infill” areas to produce a uni-fied, economically efficient, and attractive city.
Encourages Project and Building Design that Balance Compactness and Efficiency
Contemporary urban development, framed by automobile transportation, frequently spreads out over the land, and lacks the human scale and detail often found in traditional neighborhoods. For example, places like Valley Junction have an intimate human scale in contrast to newer high-way oriented developments like the Target on Urbandale Drive. While these new developments provide valuable services, the large building scale, dominance of parking lots, traffic noise, distance between buildings, and lack of pedestrian access and public spaces create a far less sat-isfactory environment. Compact and efficient project and building design use land and resources effectively, pre-serves more open space, and can provide memorable set-tings and experiences. Well-planned large-scale develop-

Chapter 5 : Page 68
Section Three: Community PlanThe Grimes Plan
ments have an important place in a community’s economy and can have a level of detail and scale that take on some of the virtues of traditional town environments.
Mixes Land Uses
In the center of Grimes, radiating out from the 1st and Main intersection, residential, retail, and recreation are located closely together. On the other hand, more con-temporary growth tends to “zone” different land uses away from one another. The concept of single-use zoning grew out of a need to separate living places from major industries to protect the health of residents, and this is still good policy in some cases. But mixing compatible but different uses in a modern setting creates more in-teresting and efficient communities. Providing uses that are closer and linked to one another can also reduce the number of miles that people must travel by car to conduct their daily lives. Plans and land development policies that provide appropriate use mixing also provide greater flex-ibility for those who build communities, and avoid unnec-essary regulation.
Creates Housing Opportunities and Choices
Most of Grimes’ residential development is in the form of single-family detached units on 7,200 square foot lots. Yet, more diverse housing types will be needed to meet changing housing needs and preferences. Consequences of the mortgage crisis and subsequent economic down-turn of 2008-2009 and demographic change include greater eventual demand for multi-family development because of tighter mortgage financing; smaller lot single-family development in innovative design settings, and at-
tached housing for empty-nesters. Residential develop-ment should be incorporated into mixed use projects to reduce the separation between living places and activity centers. Grimes should provide opportunities for people at all stages of life to find their place in the city.
Promotes Walkability and Community Health through Routine Physical Activity
Iowa’s older small communities tended to have tighter de-velopment patterns clustered around the traditional down-town. This “small town feel” naturally creates a pedestri-an-friendly environment. However, new developments across the country have more discontinuous streets, lack of sidewalks, and spreading developments that together make walking or cycling difficult. Land use patterns and new investments that promote “active transportation” will create a better city. Local commercial services, schools, and major activity centers should have safe and comfort-able routes to most neighborhoods. This expands trans-portation options and increases opportunities for social in-teraction. Equally important, incorporating physical activ-ity into the daily routine of citizens creates a healthier and more physically fit community.
Encourages Identifiable Development Areas with a Sense of Place
Newer residential areas often occur in defined and some-times isolated pods, largely caused by incremental de-velopment. However, these areas do not appear to have strong identities and rarely provide community space. A smart growth concept for Grimes should increase the highly desirable pattern of neighborhood identification and a larger sense of belonging to Grimes.
Preserves Open Space and Important Environmental Areas
Grimes’ surrounding open space is defined by the agricul-tural history of the state and the drainageways that pro-vided life to the regions earliest inhabitants. By preserv-ing open spaces, the city balances the built and natural environment and provides habitat for plants and animals, recreational opportunities, and places of natural beauty. Open spaces also add real property value to adjacent development. While passive in use, these environments should not be absent of use. The structure of Grimes’ drainageways should connect neighborhoods and the city’s park system.

Chapter 5 : Page 69
Section Three: Community Plan The Grimes Plan
Diversifies Transportation Modes
Many communities have begun to realize the need to pro-vide a wider range of transportation options. A complete-ly auto-dependent city limits access of such groups as young people and seniors. In addition, many of Grimes’ residents work outside the city. An increase in the city’s physical size should not reduce access. Techniques that increase the ability of all residents to move freely around the city include better coordination between land use and transportation, increasing connectivity within the street network, developing multi-modal (or complete) streets that accommodate all forms of transportation, and work-ing to expand regional bus service in the city.
Achieves Community and Stakeholder Collaboration in Development Decisions
Grimes should be a great place to live, work and play – a “small town in the city.” City government should stay close to its constituents through techniques that measure the priorities of residents. Ideas developed by the com-munity cannot be considered and the implementation of the smart growth principles cannot occur without the col-laboration of citizens. Partnerships between neighbor-hoods, adjoining communities, developers, nonprofit or-ganizations, and the city will support and accelerate im-plementation of the Grimes Plan.
Development Framework
The Framework for the Grimes Plan emerges from a pro-gram based on markets, existing projects and priorities, and community-wide goals. The Framework establishes the overall structure for the Plan and includes:
Balanced Residential Neighborhoods•
Commercial and Industrial Growth•
Transportation Connectivity•
Recreation Amenities•
A Strong Core•
The Framework elements are illustrated in Map 5.1 Grimes Development Concept.
BALANCED RESIDENTIAL NEIGHBORHOODS
Grimes’ new residential areas should provide a mix of housing types, developed around neighborhood parks
and greenways, and well-connected to the surrounding city by streets and pathways. Numerous factors impact the geographic location of development within Grimes includ-ing the boundaries of surrounding communities, the exist-ing large lot developments on to the north, and slightly further north the large Brenton Slough. Easy access to mu-nicipal services and adjoining residential developments make areas to the north and west more appropriate for residential development. The city’s land use concept (Map 5.1) suggests that primary residential areas will be north of SE 28th Street with some new developments occurring adjacent to existing residential areas south of 28th Street.
Proposed Land Use and Development Policies include:
Provide mixed residential styles and densities to accom-• modate a range of housing preferences and needs.
Include neighborhood parks/commons serving new • growth areas, with locations based on drainageways and expanding sites to incorporate a menu of neigh-borhood park facilities.
Incorporate neighborhood greenways into the city-• wide trail and greenway system.
Provide an interconnected street system between • neighborhoods and accommodate all modes of trans-portation.
Develop a north/south collector street between James • and County Line Road from 27th Street to Doug-las Parkway in Urbandale, providing an alternative to James and County Line Road.

Chapter 5 : Page 70
Section Three: Community PlanThe Grimes Plan
City Limits
City Limits
City Limits
City Limits
City Limits
Existing ArterialsProposed ArterialsExisting CollectorsProposed CollectorsExisting Local Streets
Low Density Residential (LDR) Urban Village (UV)Urban Reserve(UR)Medium Density Residential (MDR)High Density Residential (HDR)
Map 5.1
Development ConceptGrimes, Iowa
Downtown/Governors DistrBusiness Parks (BP)Light Industrial (LI)General Industrial (GI)Civic (CIV)
GAT
EWAY
DR
COU
NTY
LIN
E RO
AD
N H
ARV
EY S
TREE
T
GAT
EWAY
DR
HIG
HW
AY 1
41
S JA
MES
STR
EET
N J
AM
ES S
TREE
T
N M
AIN
STR
EET
S M
AIN
STR
EET
S LI
TTLE
BEA
VER
DRI
VE
S JA
MES
STR
EET
NW
128
th S
TREE
T
NW
142
nd S
TREE
T
NW
121
st S
TREE
T
HIG
HW
AY 1
41H
IGH
WAY
141
NW 1st STREET
NW 3rd STREET
NW 8th STREET
NW 11th STREET
NW 70th AVENUE
NW 78th AVENUE
S 3rd STREET
S 19th STREET
NW 54th AVENUE
MEREDITH DRIVEMEREDITH DRIVE MEREDITH DRIVE
S 11th STREET
S 19th STREET
BEAVERBROKE BLVD
HIG
HW
AY 1
41
HIG
HW
AY 8
0/35
HIG
HW
AY 1
41
S JA
MES
STR
EET
N J
AM
ES S
TREE
T
N H
ARV
EY S
TREE
T
N M
AIN
STR
EET
S M
AIN
STR
EET
S LI
TTLE
BEA
VER
DRI
VE
S JA
MES
STR
EET
NW
128
th S
TREE
T
NW
100
th S
TREE
TN
W 1
00th
STR
EET
NW
100
th S
TREE
T
GAT
EWAY
DR
GAT
EWAY
DR
NW
111
th D
RN
W 1
11th
DR
NW
128
th S
TREE
T
NW
142
nd S
TREE
T
NW
121
st S
TREE
T
COU
NTY
LIN
E RO
AD
JAZZ
WO
OD
RO
AD
HIG
HW
AY 1
41H
IGH
WAY
141
NW 1st STREET
NE 18th STREET
NW 3rd STREET
NW 8th STREET
NW 11th STREET
NW 70th AVENUE
NW 78th AVENUE
NW 27th STREET
S 3rd STREET
S 19th STREET
NW 54th AVENUE SE 37th STREETSE 37th STREETSE 37th STREETSE 37th STREET
SE 28th STREETSE 28th STREET
MEREDITH DRIVEMEREDITH DRIVE
DOUGLAS AVEDOUGLAS PARKWAYDOUGLAS PARKWAY
INTERSTATE 80/35
S 11th STREET
S 19th STREET
BEAVERBROKE BLVD
Existing ArterialsProposed ArterialsExisting CollectorsProposed CollectorsExisting Local StreetsProposed Local StreetsExisting TrailsProposed Trails
Low Density Residential (LDR) Urban Village (UV)Urban Reserve(UR)Medium Density Residential (MDR)High Density Residential (HDR)Mixed Use 1 (MU-1)Mixed Use 2 (MU-1)Neighborhood Commercial (NCOM)General Commercial (COM)
Downtown/Governors DistrictBusiness Parks (BP)Light Industrial (LI)General Industrial (GI)Civic (CIV)Future Parks & Rec (FPARKS)Greenway/Preserve/OS (GWY)Public Facility (PF)Broadwalk (Railroad ROW)
Map 5.1
Development ConceptGrimes, Iowa
JUNE, 2010
2000’1000’0
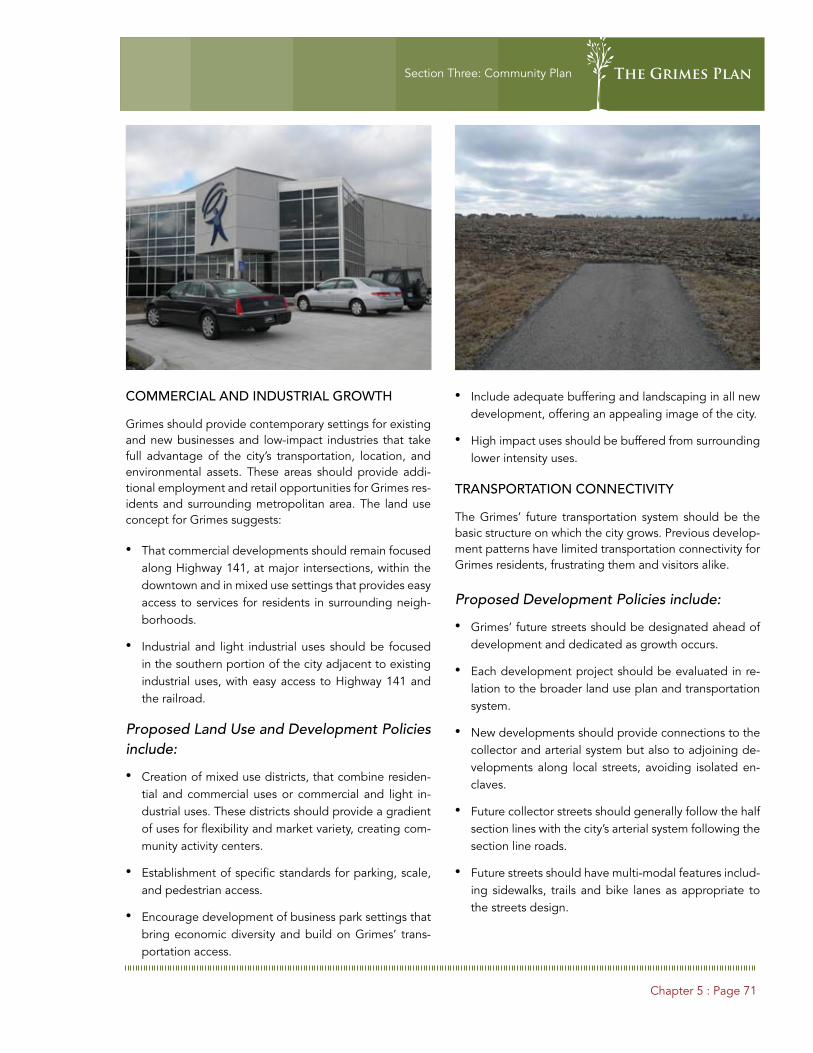
Chapter 5 : Page 71
Section Three: Community Plan The Grimes Plan
COMMERCIAL AND INDUSTRIAL GROWTH
Grimes should provide contemporary settings for existing and new businesses and low-impact industries that take full advantage of the city’s transportation, location, and environmental assets. These areas should provide addi-tional employment and retail opportunities for Grimes res-idents and surrounding metropolitan area. The land use concept for Grimes suggests:
That commercial developments should remain focused • along Highway 141, at major intersections, within the downtown and in mixed use settings that provides easy access to services for residents in surrounding neigh-borhoods.
Industrial and light industrial uses should be focused • in the southern portion of the city adjacent to existing industrial uses, with easy access to Highway 141 and the railroad.
Proposed Land Use and Development Policies include:
Creation of mixed use districts, that combine residen-• tial and commercial uses or commercial and light in-dustrial uses. These districts should provide a gradient of uses for flexibility and market variety, creating com-munity activity centers.
Establishment of specific standards for parking, scale, • and pedestrian access.
Encourage development of business park settings that • bring economic diversity and build on Grimes’ trans-portation access.
Include adequate buffering and landscaping in all new • development, offering an appealing image of the city.
High impact uses should be buffered from surrounding • lower intensity uses.
TRANSPORTATION CONNECTIVITY
The Grimes’ future transportation system should be the basic structure on which the city grows. Previous develop-ment patterns have limited transportation connectivity for Grimes residents, frustrating them and visitors alike.
Proposed Development Policies include:
Grimes’ future streets should be designated ahead of • development and dedicated as growth occurs.
Each development project should be evaluated in re-• lation to the broader land use plan and transportation system.
New developments should provide connections to the • collector and arterial system but also to adjoining de-velopments along local streets, avoiding isolated en-claves.
Future collector streets should generally follow the half • section lines with the city’s arterial system following the section line roads.
Future streets should have multi-modal features includ-• ing sidewalks, trails and bike lanes as appropriate to the streets design.

Chapter 5 : Page 72
Section Three: Community PlanThe Grimes Plan
RECREATION AMENITIES
An essential component to Grimes’ future quality of life will be development of a strong parks and trails system. The system should provide a green web within the com-munity, connecting recreation features, neighborhoods, and community destinations.
Proposed Land Use and Development Policies include:
Offer neighborhood park services within a comfort-• able walking distance of approximately 0.5 miles for all Grimes residents.
Preserve environmentally sensitive areas including • drainage swales, native prairie, and wetlands.
Permeate the city, connecting relatively separated • neighborhoods with each other and major features in-cluding new commercial development on the east side of Highway 141 and the High School west of County Line Road.
Identify the Grimes park and recreation system as a sig-• nature feature for the community.
Secure public access to trails and pathways through • easements and charitable donations rather than out-right property purchases to the greatest degree pos-sible.
Provide clear wayfinding graphics and trail makers. •
A STRONG CORE
The historic core of Grimes is centered on the downtown, the railroad, and surrounding residential areas. While the city continues to rapidly grow around this area, appropri-ate polices must maintain its health and vitality, for the benefit of all Grimes residents. Revitalization efforts in this area, specifically in the downtown or Governors District, should create a rejuvenated image center and regional destination, with renewed urban residential development surrounding and reinforcing the historic commercial dis-trict. Although, the core of Grimes will never be the cen-tral hub of large scale commercial development it should be an economically strong center for business enterprise, the arts, and tourism.
Proposed Land Use and Development Policies include:
Appropriate policies for this area are based on neigh-• borhood conservation and include housing rehabilita-tion, infill development on vacant sites, and redevelop-ment of underused sites.
Completion of supporting public projects that improve • aging infrastructure along Main Street and in the sur-rounding neighborhood.
Identify and implement strategic reuse projects in the • Governors District, with a focus on highly visible build-ings that adapt to market-based reuse programs.
Improve the function, safety, and appearance of the • transportation system. Make gateways to the district clear and safe for motorists and pedestrians crossing arterials.
Establish development design guidelines consistent • with the scale and proportion of the core district.
Encourage dense or small-scale developments consis-• tent with the area’s scale.
Increase pedestrian and bicycle access across both • First Street and James Street.

Chapter 5 : Page 73
Section Three: Community Plan The Grimes Plan
Plan Elements
The community plan for Grimes should build on the De-velopment Framework and knit it together, into a com-munity network that permeates the city. Elements of the plan include:
Future Land Use Characteristics •
Transportation: Access For All•
Parks and Recreation•
Housing•
The Governors District•
FUTURE LAND USE CHARACTERISTICS
Decision Making Framework
Grimes’ future land use map (Map 5.2) and policies should provide both guidance and flexibility to decision makers in the land use process. A Land Use Plan provides a devel-opment vision for the city that guides participants in the process of community building. However, it cannot antici-pate the design or specific situation of every rezoning ap-plication. Therefore, the plan should not be taken as an inflexible prescription of how land must be used. Rather, it provides a context that helps decision-makers, including city administrative officials, the Planning Commission, and
C
S JA
MES
STR
EET
S M
AIN
STR
EET
S JA
MES
STR
EET
NW 1st STREET
S 19th STREET
S JA
MES
STR
EET
S M
AIN
STR
EET
S JA
MES
STR
EET
C
JAZZ
WO
OD
RO
AD
NW 1st STREET
S 19th STREET
the City Council, make logical decisions which implement the plan’s overall principles.
The Land Use Plan establishes a number of categories of land uses, some of which provide for single primary uses while others encourage mixed uses. The discussion below identifies various use categories and establishes criteria for their application. This forms a framework for land use decisions by the Planning Commission and City Council that provides both needed flexibility and consistency with the plan’s overall objectives.
Table 5.1: Plan Categories and Use Criteria
Land Use Category Use Characteristics Features and Location Criteria
Agriculture, Open Space
- Generally in agricultural or open space use.
- Agriculture or open space uses will remain the principal use during the planning period.
- Extension of urban services is unlikely during the foreseeable future, and may not be feasible.
- Extremely low residential densities, typically below 1 unit per 20 acres, may be permitted.
-These areas should remain in primary open space, grasslands, or agricultural use. Urban encroachment, including large lot subdivisions, should be discouraged.
- Applies to areas designated for conservation, including floodplains and steep topography.
-Primary uses through the planning period will remain open or agricultural.
Urban Reserve (UR) - Generally in agricultural or open space use.
- Reserve areas can eventually be served with municipal water and sewer and may be in the path of future urban development. However, development will likely occur after the planning horizon contained in this plan.
- These areas should be reserved for long-term urban development.
- Primary uses through the planning period will remain in open land uses.
- Any interim large lot residential development should accommodate future development with urban services.

Chapter 5 : Page 74
Section Three: Community PlanThe Grimes Plan
HDR
HDR
HDR
HDR
HDR HDR
HDR
HDR
HDR
MU-1
MU-1
MU-1MU-1
MU-1 MU-1
MU-1
MU-1
MU-1MU-1MU-1
MU-1
MU-1 MU-1
MU-1
MU-1
MU-1MU-1MU-1MU-1MU-1
MU-1
MU-1CIV
CIV
MDR
MDR
MDR
MDR
MDR
GWY
GWY
GWY
GWY
GWY
GWY
GWY
GWY
MDR
MDR
MDR
MDR
LDR
MDRMDR
MDR
HDR
HDR
MDR
MDR
MDR MDR
MDRMDR
MDR
MDR
MDR
MDR
MDR
LDR
LDR
LDR
LDR
UV
UV
UV
UV
UV
LDR
LDR
LDR
LDR
LDR
LDR
LDR
LDR
LDR
LDR
LDR
LDR
MU
MU-2 MU-2
MU-2
MU-2
MU-2
MU-2
MU-2
MU-2
MU-2MHR
MU-2
GI
GI
BP
BP
BPBP BP
BPBP
BPLI
LI
LI
LI
LILI
LI
LDR
LDR
LDR
UR
UR
UR
UR
UR
UR
URUR
UR
LDRLDR
LDR
LDR
LDR
MDRLDR
COMCOM
COM
COM
COM
NCOM
NCOM
NCOM
NCOM
NCOM
COM
COM COM
COM
COM
LDR
LDR
HDR
HDR
SCHOOL
CIV
MDR
GWY
CIV
Existing ArterialsProposed ArterialsExisting CollectorsProposed CollectorsExisting Local Streets
Low Density Residential (LDR) Urban Village (UV)Urban Reserve(UR)Mobile Home Residential (MHR)Medium Density Residential (MDR)
General Commercial (COM)Downtown/Governors DistrBusiness Parks (BP)Light Industrial (LI)General Industrial (GI)
Map 5.2
Future Land UseGrimes, Iowa
GAT
EWAY
DR
COU
NTY
LIN
E RO
AD
N H
ARV
EY S
TREE
T
GAT
EWAY
DR
HIG
HW
AY 1
41
S JA
MES
STR
EET
N J
AM
ES S
TREE
T
N M
AIN
STR
EET
S M
AIN
STR
EET
S LI
TTLE
BEA
VER
DRI
VE
S JA
MES
STR
EET
NW
128
th S
TREE
T
NW
142
nd S
TREE
T
NW
121
st S
TREE
T
HIG
HW
AY 1
41H
IGH
WAY
141
NW 1st STREET
NW 3rd STREET
NW 8th STREET
NW 11th STREET
NW 70th AVENUE
NW 78th AVENUE
S 3rd STREET
S 19th STREET
NW 54th AVENUE
MEREDITH DRIVEMEREDITH DRIVE MEREDITH DRIVE
S 11th STREET
S 19th STREET
BEAVERBROKE BLVD
HIG
HW
AY 1
41
HIG
HW
AY 8
0/35
HIG
HW
AY 1
41
S JA
MES
STR
EET
N J
AM
ES S
TREE
T
N H
ARV
EY S
TREE
T
N M
AIN
STR
EET
S M
AIN
STR
EET
S LI
TTLE
BEA
VER
DRI
VE
S JA
MES
STR
EET
NW
128
th S
TREE
T
NW
100
th S
TREE
TN
W 1
00th
STR
EET
NW
100
th S
TREE
T
GAT
EWAY
DR
GAT
EWAY
DR
NW
111
th D
RN
W 1
11th
DR
NW
128
th S
TREE
T
NW
142
nd S
TREE
T
NW
121
st S
TREE
T
COU
NTY
LIN
E RO
AD
JAZZ
WO
OD
RO
AD
HIG
HW
AY 1
41H
IGH
WAY
141
NW 1st STREET
NE 18th STREET
NW 3rd STREET
NW 8th STREET
NW 11th STREET
NW 70th AVENUE
NW 78th AVENUE
NW 27th STREET
S 3rd STREET
S 19th STREET
NW 54th AVENUE SE 37th STREETSE 37th STREETSE 37th STREETSE 37th STREET
SE 28th STREETSE 28th STREET
MEREDITH DRIVEMEREDITH DRIVE
DOUGLAS AVEDOUGLAS PARKWAYDOUGLAS PARKWAY
INTERSTATE 80/35
S 11th STREET
S 19th STREET
BEAVERBROKE BLVD
Pedes-
DOWN-DOWN-
Park
Park
Park
Park
Park
Park
Park
Future Kennybrook
GrimesCity Hall Pedes-
Hopital / Business Park
FutureSportsComplex
School
Existing ArterialsProposed ArterialsExisting CollectorsProposed CollectorsExisting Local StreetsProposed Local StreetsExisting TrailsProposed Trails
Low Density Residential (LDR) Urban Village (UV)Urban Reserve(UR)Mobile Home Residential (MHR)Medium Density Residential (MDR)High Density Residential (HDR)Mixed Use 1 (MU)Mixed Use 2Neighborhood Commercial (NCOM)
General Commercial (COM)Downtown/Governors DistrictBusiness Parks (BP)Light Industrial (LI)General Industrial (GI)Civic (CIV)Future Parks & Rec (FPARKS)Greenway/Preserve/OS (GWY)Public Facility (PF)Broadwalk (Railroad ROW)
Map 5.2
Future Land UseGrimes, Iowa
JULY, 2010
2000’1000’0
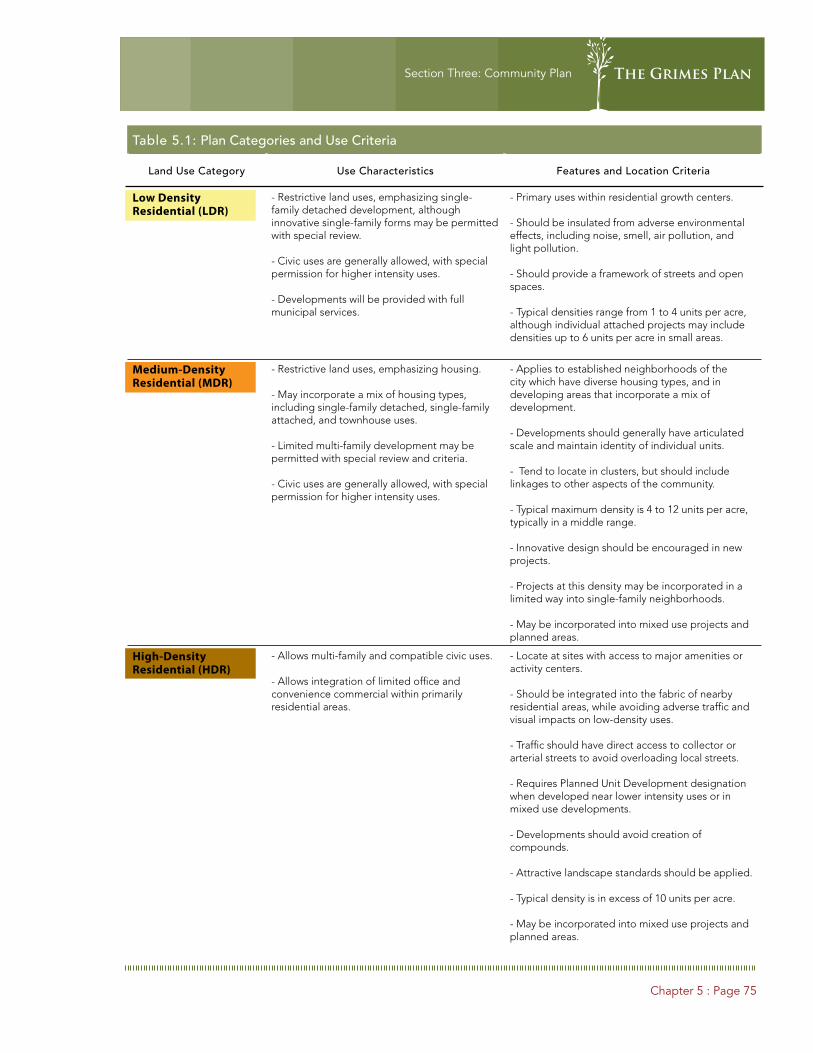
Chapter 5 : Page 75
Section Three: Community Plan The Grimes Plan
Table 5.1: Plan Categories and Use Criteria
Land Use Category Use Characteristics Features and Location Criteria
Low Density Residential (LDR)
- Restrictive land uses, emphasizing single-family detached development, although innovative single-family forms may be permitted with special review.
- Civic uses are generally allowed, with special permission for higher intensity uses.
- Developments will be provided with full municipal services.
- Primary uses within residential growth centers.
- Should be insulated from adverse environmental effects, including noise, smell, air pollution, and light pollution.
- Should provide a framework of streets and open spaces.
- Typical densities range from 1 to 4 units per acre, although individual attached projects may include densities up to 6 units per acre in small areas.
Medium-Density Residential (MDR)
- Restrictive land uses, emphasizing housing.
- May incorporate a mix of housing types, including single-family detached, single-family attached, and townhouse uses.
- Limited multi-family development may be permitted with special review and criteria.
- Civic uses are generally allowed, with special permission for higher intensity uses.
- Applies to established neighborhoods of the city which have diverse housing types, and in developing areas that incorporate a mix of development.
- Developments should generally have articulated scale and maintain identity of individual units.
- Tend to locate in clusters, but should include linkages to other aspects of the community.
- Typical maximum density is 4 to 12 units per acre, typically in a middle range.
- Innovative design should be encouraged in new projects.
- Projects at this density may be incorporated in a limited way into single-family neighborhoods.
- May be incorporated into mixed use projects and planned areas.
High-Density Residential (HDR)
- Allows multi-family and compatible civic uses.
- Allows integration of limited office and convenience commercial within primarily residential areas.
- Locate at sites with access to major amenities or activity centers.
- Should be integrated into the fabric of nearby residential areas, while avoiding adverse traffic and visual impacts on low-density uses.
- Traffic should have direct access to collector or arterial streets to avoid overloading local streets.
- Requires Planned Unit Development designation when developed near lower intensity uses or in mixed use developments.
- Developments should avoid creation of compounds.
- Attractive landscape standards should be applied.
- Typical density is in excess of 10 units per acre.
- May be incorporated into mixed use projects and planned areas.

Chapter 5 : Page 76
Section Three: Community PlanThe Grimes Plan
Table 5.1: Plan Categories and Use Criteria
Land Use Category Use Characteristics Features and Location Criteria
Mobile Home Residential (MHR)
- Accommodates mobile homes that are not classified under State law as “manufactured housing.”
- May include single-family, small lot settings within planned mobile home parks.
- Manufactured units with HUD certification that comply with other criteria in State statute may be treated as conventional construction.
- Develop in projects with adequate size to provide full services.
- Generally locate in complexes, but should include linkages to other aspects of the community.
- Typical maximum density is 8 units per acre.
Mixed Use (MU-1) -Incorporates a mix of residential, office, and limited commercial uses.
- Includes a variety of mixed use contexts including:
Residential/office/commercial (MU-1)Urban Village (UV)Neighborhood commercial (NCOM)Office/Financial Services (OFF)
- Developments should emphasize relationships among parts.
- Pedestrian traffic should be encouraged and neighborhood scale retained when applicable.
- Projects should avoid large expanses of parking visible from major streets .
- Signage and site features should respect neighborhood scale in appropriate areas.
- Commercial and office development in mixed-use areas should minimize impact on housing. Should be located at intersections of major or collector streets.
- For the Urban Village (UV) area projects should provide a higher density and be oriented to the Governors District Promenade.
Mixed Use (MU-2) - Includes a variety of commercial uses, including large-scale buildings and parking areas.
- Includes major retailers, multi-use centers, restaurants, and other services.
- Permits light industrial uses that do not generate noticeable external effects.
- Often accommodates flex spaces that can be used for commercial, warehousing, or low impact maintenance uses.
- High density residential uses, with appropriate development standards may be included.
- Should be located adjacent to existing industrial uses in the southern portion of the city.
- Similar in character to existing flex uses along 37th Street.
- Traffic systems should provide alternative routes and good traffic flow, including safe pedestrian routes.
- Negative effects on surrounding residential areas should be limited by buffering and project design.
- Good landscaping and restrictive sign standards should apply.
- Good pedestrian and bicycle links should be provided, including non-motorized access to surrounding residential areas, connecting residents to jobs.

Chapter 5 : Page 77
Section Three: Community Plan The Grimes Plan
Table 5.1: Plan Categories and Use Criteria
Land Use Category Use Characteristics Features and Location Criteria
General Commercial (COM)
- Includes a variety of commercial uses, including auto-oriented commercial development.
- Includes major retailers, multi-use centers, restaurants, and other services.
- Commercial may also be accommodated in MU areas.
- Should be located along arterials or other major streets, and in areas that are relatively isolated from residential, parks, and other vulnerable uses.
- Traffic systems should provide alternative routes and good internal traffic flow.
- Negative effects on surrounding residential areas should be limited by location and buffering.
- Activities with potentially negative visual effects should occur within buildings.
- Development should maintain good landscaping, focused in front setbacks and common boundaries with lower-intensity uses.
- Pedestrian/bicycle connections should be provided for consumer-oriented uses.
Neighborhood Commercial (NCOM)
- Includes a range of low impact commercial uses, providing a variety of neighborhood services.
- Accommodates service related commercial uses.
- Includes low to moderate building and impervious coverage.
- Should be located along major streets and in areas close to residential growth centers.
-Should emphasize pedestrian scale and relationships among businesses.
-Traffic systems should provide good internal traffic flow.
-Negative effects on surrounding residential areas should be limited by location and buffering.
-Good landscaping and restrictive signage standards should be maintained.
-Good pedestrian/bicycle connections should be provided into surrounding areas.
-The dominance of automobiles should be moderated by project design.
Downtown Mixed Use - Traditional downtown district of Grimes, also known as the Governors District.
- Includes mix of uses, primarily commercial, office, and limited upper level residential.
- Should be the primary focus of major civic uses, including government, cultural services, and other civic facilities.
- Developments outside the center of the city should be encouraged to have “downtown” characteristics, including mixed use buildings and an emphasis on pedestrian scale.
- Establishes mixed use pattern in the traditional city center. May also apply to planned mixed use areas.
- Recognizes downtown development patterns without permitting undesirable land uses.
- District may expand with development of appropriately designed adjacent projects.
- New projects should respect pedestrian scale and design patterns and setbacks within the overall district.
- Historic preservation is a significant value.
- Good pedestrian and bicycle links should be provided, including non-motorized access to surrounding residential areas.
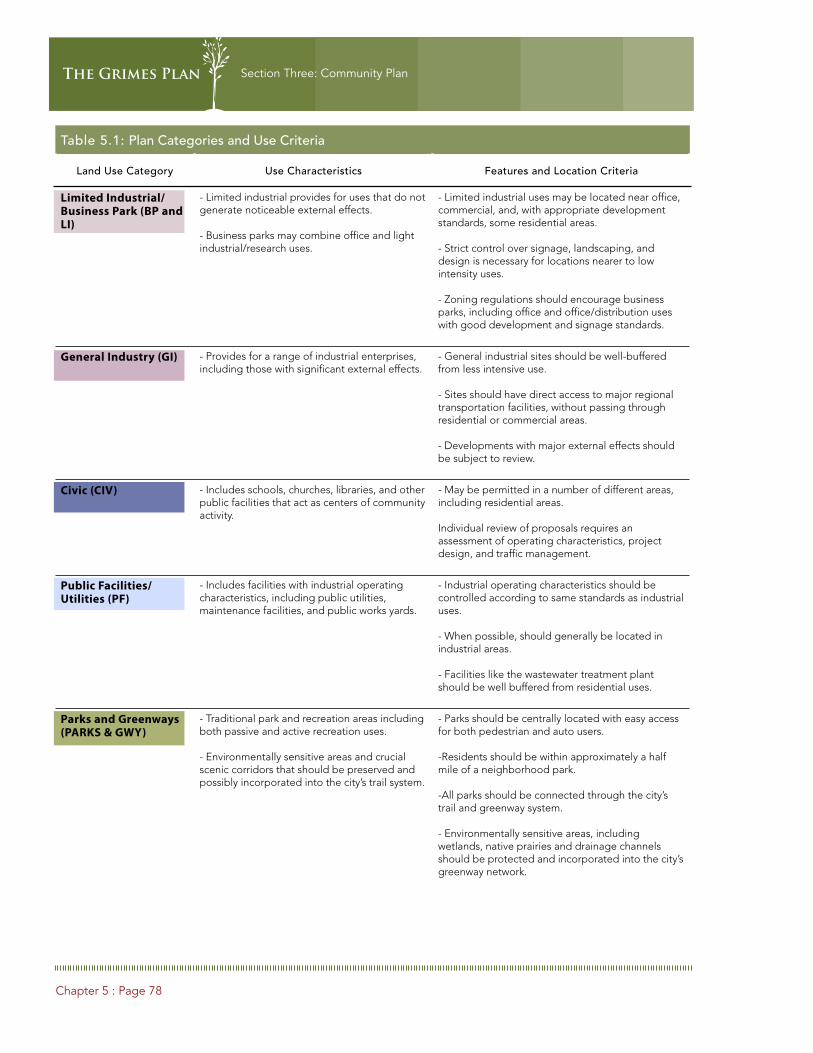
Chapter 5 : Page 78
Section Three: Community PlanThe Grimes Plan
Table 5.1: Plan Categories and Use Criteria
Land Use Category Use Characteristics Features and Location Criteria
Limited Industrial/Business Park (BP and LI)
- Limited industrial provides for uses that do not generate noticeable external effects.
- Business parks may combine office and light industrial/research uses.
- Limited industrial uses may be located near office, commercial, and, with appropriate development standards, some residential areas.
- Strict control over signage, landscaping, and design is necessary for locations nearer to low intensity uses.
- Zoning regulations should encourage business parks, including office and office/distribution uses with good development and signage standards.
General Industry (GI) - Provides for a range of industrial enterprises, including those with significant external effects.
- General industrial sites should be well-buffered from less intensive use.
- Sites should have direct access to major regional transportation facilities, without passing through residential or commercial areas.
- Developments with major external effects should be subject to review.
Civic (CIV) - Includes schools, churches, libraries, and other public facilities that act as centers of community activity.
- May be permitted in a number of different areas, including residential areas.
Individual review of proposals requires an assessment of operating characteristics, project design, and traffic management.
Public Facilities/Utilities (PF)
- Includes facilities with industrial operating characteristics, including public utilities, maintenance facilities, and public works yards.
- Industrial operating characteristics should be controlled according to same standards as industrial uses.
- When possible, should generally be located in industrial areas.
- Facilities like the wastewater treatment plant should be well buffered from residential uses.
Parks and Greenways (PARKS & GWY)
- Traditional park and recreation areas including both passive and active recreation uses.
- Environmentally sensitive areas and crucial scenic corridors that should be preserved and possibly incorporated into the city’s trail system.
- Parks should be centrally located with easy access for both pedestrian and auto users.
-Residents should be within approximately a half mile of a neighborhood park.
-All parks should be connected through the city’s trail and greenway system.
- Environmentally sensitive areas, including wetlands, native prairies and drainage channels should be protected and incorporated into the city’s greenway network.

Chapter 5 : Page 79
Section Three: Community Plan The Grimes Plan
Land Use Compatibility
Some of the most difficult issues in plan implementation arise at boundaries where more intensive uses are pro-posed adjacent to less intensive uses. Table 5.2 provides a land use compatibility guide, assessing the relationships between existing land uses and providing a basis for re-view of proposals based on their geographic context.
Compatibility Rating Key
5: The proposed use is completely compatible with exist-ing land uses. Development should be designed consis-tent with good planning practice.
4: The proposed use is basically compatible with the exist-ing adjacent use. Traffic from higher intensity uses should be directed away from lower intensity uses. Building el-ements and scale should be consistent with surrounding development.
3: The proposed use may have potential conflicts with ex-isting adjacent uses that may be resolved or minimized through project design. Traffic and other external effects should be directed away from lower-intensity uses. Land-scaping, buffering, and screening should be employed to minimize negative effects. A Planned Unit Development may be advisable.
2: The proposed use has significant conflicts with the pre-existing adjacent use. Major effects must be strongly miti-gated to prevent impact on adjacent uses. A Planned Unit Development is required in all cases to assess project im-pact and define development design.
1: The proposed use is incompatible with adjacent land uses. Any development proposal requires a Planned Unit Development and extensive documentation to prove that external effects are fully mitigated. In general, proposed uses with this level of conflict will not be permitted.
Table 5.2: Compatibility Matrix
Urb
an R
eser
ve
Low
Den
sity
Res
iden
tial
Med
ium
Den
sity
Res
iden
tial
Hig
h D
ensi
ty R
esid
enti
al
Mo
bile
Ho
me
Mix
ed U
se 1
Mix
ed U
se 2
Gen
eral
Co
mm
erci
al
Nei
ghb
orh
oo
d C
om
mer
cial
Do
wnt
ow
n M
ixed
Use
Lim
ited
Ind
ustr
ial B
usin
ess
Par
k
Gen
eral
Ind
ustr
y
Civ
ic (
CIV
)
Pub
lic F
acili
ties
/Uti
litie
s
Urban Reserve - 3 3 3 3 3 3 3 3 3 3 3 3 3
Low Density Residential (LDR) - 4 3 3 3 3 2 2 3 1 1 4 2
Medium Density Residential (MDR) - 5 4 5 3 2 4 4 2 1 4 2
High Density Residential (HDR) - 5 5 4 2 4 5 2 1 4 2
Mobile Home (MHR) - 4 3 3 4 3 2 2 4 2
Mixed Use (MU-1) - 4 4 4 5 3 2 4 3
Mixed Use (MU-2) - 4 4 4 4 3 4 3
General Commercial (COM) - 5 4 4 3 3 4
Neighborhood Commercial (NCOM) - 5 4 3 4 4
Downtown Mixed Use - 3 2 4 2
Limited Industrial Business Park (BP & LI) - 4 2 4
General Industry (GI) - 1 5
Civic (CIV) - 2

Chapter 5 : Page 80
Section Three: Community PlanThe Grimes Plan
Transportation: Access for All
The transportation program for Grimes should meet cur-rent and future mobility needs while enhancing the char-acter of the city’s small-town environment. Grimes’ exist-ing street system has functional problems and increased demand associated with growth will require improve-ments to the system. Map 5.3 illustrates various transpor-tation improvements needed in Grimes through the 20-year planning period. The following actions are part of this transportation improvement plan:
A WEB OF COLLECTOR AND ARTERIAL STREETS
Grimes should establish a collector street and parkway system for developing areas that is designated ahead of development and dedicated as growth takes place. For a community like Grimes where growth is happening at a fast rate it is easy for new projects to address their own internal circulation needs, and ignore cross connections and linkages necessary to create an integrated transporta-tion network. This creates a “pod” type of development pattern by which most traffic exits a development through only one or two streets, where it comes into conflict with through and regional traffic.
Avoiding this pattern of development will be especially important as development opens new areas to the north and west. As projects develop, their design should incor-porate a network of connecting streets, reserving these re-quired collector routes and dedicating their rights-of-way. The actual alignment of the collector network may differ somewhat from those proposed in the plan. However, the general network of collector streets should be maintained. In some cases, the city may pre-develop a street segment to create necessary linkages. Planned links and improve-ments in the street system include:
Completion of Beaverbrook Boulevard as an arterial • street from Highway 141 to County Line Road, con-necting to 230th Street in Dallas County.
Destination Drive as a collector street from 37th Street • north to Beaverbrook Boulevard.
Gateway Drive from 37th Street to north of Beaver-• brook Boulevard.
A collector street generally following the half section • line between James Street and County Line Road. This street should connect Douglas Parkway in Urbandale with NW 27th Street on Grimes northern edge.
Extension of 11th Street west across the city’s planning • jurisdiction.
A north south collector street between County Line • Road and Jazzwood Road.
Improvements to Highway 141 should improve the • safety of the corridor. Possible improvements include conversion of Highway 141 and 1st Street intersection to an at-grade intersection and installation of lights and turn lanes at other major intersections.
The city should closely monitor and work with the DOT • on other regional projects such as improvements to the Highway 141 interchange on Interstate 80/35 and a possible regional bypass for the northwest portion of Des Moines.
The city should also work with the Department of Trans-portation to evaluate roads that should be reclassified as arterials over time. These include James Street, County Line Road, Jazzwood Road, and other section line roads.
Local Streets
The local street network in Grimes’ developing areas should be designed with multiple connections and rela-tively direct routes. A city’s neighborhood street system should preserve quiet quality of local streets while provid-ing residents, visitors, and public safety and service ve-hicles access which is comprehensible and direct. This can be done by incorporating the following standards into lo-cal street design:

Chapter 5 : Page 81
Section Three: Community Plan The Grimes Plan
GAT
EWAY
DR
COU
NTY
LIN
E RO
AD
N H
ARV
EY S
TREE
T
GAT
EWAY
DR
HIG
HW
AY 1
41
S JA
MES
STR
EET
N J
AM
ES S
TREE
T
N M
AIN
STR
EET
S M
AIN
STR
EET
S LI
TTLE
BEA
VER
DRI
VE
S JA
MES
STR
EET
NW
128
th S
TREE
T
NW
142
nd S
TREE
T
NW
121
st S
TREE
T
HIG
HW
AY 1
41H
IGH
WAY
141
NW 1st STREET
NW 3rd STREET
NW 8th STREET
NW 11th STREET
NW 70th AVENUE
NW 78th AVENUE
S 3rd STREET
S 19th STREET
NW 54th AVENUE
MEREDITH DRIVEMEREDITH DRIVE MEREDITH DRIVE
S 11th STREET
S 19th STREET
BEAVERBROKE BLVD
HIG
HW
AY 1
41
HIG
HW
AY 8
0/35
HIG
HW
AY 1
41
S JA
MES
STR
EET
N J
AM
ES S
TREE
T
N H
ARV
EY S
TREE
T
N M
AIN
STR
EET
S M
AIN
STR
EET
S LI
TTLE
BEA
VER
DRI
VE
S JA
MES
STR
EET
NW
128
th S
TREE
T
NW
100
th S
TREE
TN
W 1
00th
STR
EET
NW
100
th S
TREE
T
GAT
EWAY
DR
GAT
EWAY
DR
NW
111
th D
RN
W 1
11th
DR
NW
128
th S
TREE
T
NW
142
nd S
TREE
T
NW
121
st S
TREE
T
COU
NTY
LIN
E RO
AD
JAZZ
WO
OD
RO
AD
HIG
HW
AY 1
41H
IGH
WAY
141
NW 1st STREET
NE 18th STREET
NW 3rd STREET
NW 8th STREET
NW 11th STREET
NW 70th AVENUE
NW 78th AVENUE
NW 27th STREET
S 3rd STREET
S 19th STREET
NW 54th AVENUE SE 37th STREETSE 37th STREETSE 37th STREETSE 37th STREET
SE 28th STREETSE 28th STREET
MEREDITH DRIVEMEREDITH DRIVE
DOUGLAS AVEDOUGLAS PARKWAYDOUGLAS PARKWAY
INTERSTATE 80/35
S 11th STREET
S 19th STREET
BEAVERBROKE BLVD
Pedestrian Overpass
DOWNTOWN
GlenstoneParkGlenstonePark
GrimesCity Hall
BeaverbrookeSouth Park
ShawversPark
DOWNTOWN
ShawversPark
North PointePark
GlenstonePark
Future Park
Future Park
Future Park
Future Park
Future Park
Future Park
Future Park
WaterWorks Park
Future Kennybrook Park
GrimesCity Hall
Future Park
Future Park
Future Park
Pedestrian Overpass
LionsParkLionsPark
GrimesSportsComplex
Sports Complex Expansion
Hopital / Business Park
BeaverbrookeSouth Park
FutureSportsComplex
School
City Limits
City Limits
City Limits
City Limits
City Limits
Existing ArterialsProposed ArterialsExisting CollectorsProposed CollectorsExisting Local StreetsProposed Local StreetsExisting TrailsProposed Trails
Map 5.3
Future Transportation PlanGrimes, Iowa
MAY, 2010
2000’1000’0
Existing ArterialsProposed ArterialsExisting CollectorsProposed CollectorsExisting Local StreetsProposed Local StreetsExisting TrailsProposed TrailsBroadwalk

Chapter 5 : Page 82
Section Three: Community PlanThe Grimes Plan
Hierarchy and Order. Local street networks should have a
natural order to them, leading residents and visitors natu-
rally to their destinations in a manner that is not confusing.
Quality street networks combine the ease of a grid with
privacy in residential areas.
Connectivity. The street network should have segments
which connect to one another internally and to collector
streets.
Alternatives to Cul-de-Sacs. Alternatives should be consid-
ered that maintain the positive characteristics while lim-
iting some of the difficulties and expenses of providing
public safety and maintenance. These include:
Access loops, which provide two points of access•
Circles and bulbs at corners to streets or access loops•
T-intersections, which reduce the number of traffic/pe-• destrian conflicts
Short cul-de-sacs, shorter than 300 feet in length. •
Grimes should also require street trees along local streets for traffic-calming and aesthetic purposes. These trees should be located between the sidewalk and the curb, enhancing the pedestrian environment, slowing vehicular traffic, and improving the perceived quality of the neigh-borhood.
Green Streets and Complete Streets
Grimes should have an established network of green streets or complete streets that connect significant areas of town. These streets are:
Multi-modal streets that accommodate vehicular traf-• fic, bicycles, and pedestrians in an attractive public en-vironment.
Both arterial and collector streets and should be inte-• grated into the transportation and park and pathways network of the city.
Treated with special street landscape plantings and • maintenance requirements.
This network should be “green” in the plantings along them, in the transportation modes they offer that reduce use of fossil fuels, and in the cost savings they provide by reducing congestion.
PEDESTRIAN AND BICYCLE FACILITIES
Grimes’ pedestrian and trail system should be functional as well as recreational, providing access to major centers of activity. The system should also have the added ben-efit of increasing opportunities for community health and wellness. Grimes’ has an established Trail Master Plan that should be connected to a defined sidewalk system and the regional trail system. In addition to the existing sys-tem the city should consider alternatives to crossing major arterials, specifically Highway 141 and 1st Street.
Highway 141. The traffic volumes and width of the road make an at-grade crossing of Highway 141 very difficult. The city may need to consider a pedestrian overpass of the highway. The likely location of this overpass would be north of the 1st Street intersection. This location would provide better access to the growing residential popula-tion on the north side and easily connect to the city’s exist-ing trail system. The exact location of the overpass would need to be studied and engineered.
1st Street Crossing. Improvements to the 1st Street cor-ridor in 2010 are improving the pedestrian quality with a continuous sidewalk and crosswalks. Crossing the corridor is still difficult and the creation of a promenade along the railroad right-of-way, as described under the Governors District section, will increase pedestrian traffic in the area. For these reasons an overpass in this area should also be evaluated.
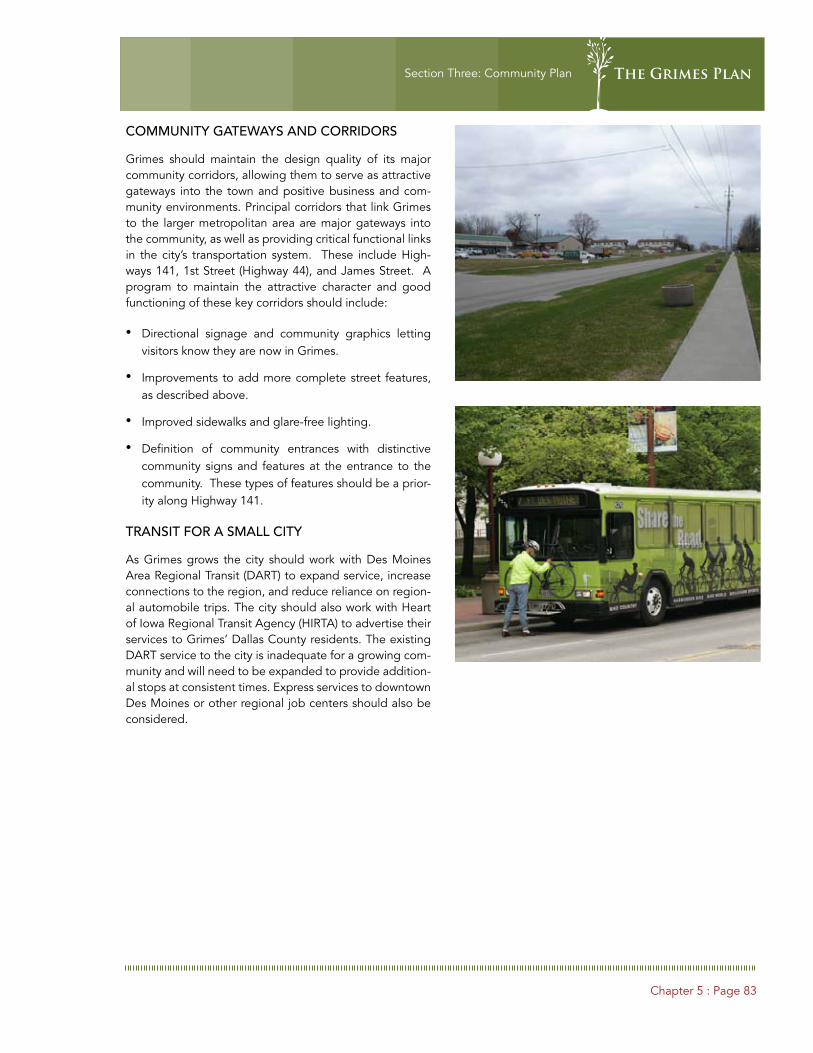
Chapter 5 : Page 83
Section Three: Community Plan The Grimes Plan
COMMUNITY GATEWAYS AND CORRIDORS
Grimes should maintain the design quality of its major community corridors, allowing them to serve as attractive gateways into the town and positive business and com-munity environments. Principal corridors that link Grimes to the larger metropolitan area are major gateways into the community, as well as providing critical functional links in the city’s transportation system. These include High-ways 141, 1st Street (Highway 44), and James Street. A program to maintain the attractive character and good functioning of these key corridors should include:
Directional signage and community graphics letting • visitors know they are now in Grimes.
Improvements to add more complete street features, • as described above.
Improved sidewalks and glare-free lighting. •
Definition of community entrances with distinctive • community signs and features at the entrance to the community. These types of features should be a prior-ity along Highway 141.
TRANSIT FOR A SMALL CITY
As Grimes grows the city should work with Des Moines Area Regional Transit (DART) to expand service, increase connections to the region, and reduce reliance on region-al automobile trips. The city should also work with Heart of Iowa Regional Transit Agency (HIRTA) to advertise their services to Grimes’ Dallas County residents. The existing DART service to the city is inadequate for a growing com-munity and will need to be expanded to provide addition-al stops at consistent times. Express services to downtown Des Moines or other regional job centers should also be considered.

Chapter 5 : Page 84
Section Three: Community PlanThe Grimes Plan
GAT
EWAY
DR
COU
NTY
LIN
E RO
AD
N H
ARV
EY S
TREE
T
GAT
EWAY
DR
HIG
HW
AY 1
41
S JA
MES
STR
EET
N J
AM
ES S
TREE
T
N M
AIN
STR
EET
S M
AIN
STR
EET
S LI
TTLE
BEA
VER
DRI
VE
S JA
MES
STR
EET
NW
128
th S
TREE
T
NW
142
nd S
TREE
T
NW
121
st S
TREE
T
HIG
HW
AY 1
41H
IGH
WAY
141
NW 1st STREET
NW 3rd STREET
NW 8th STREET
NW 11th STREET
NW 70th AVENUE
NW 78th AVENUE
S 3rd STREET
S 19th STREET
NW 54th AVENUE
MEREDITH DRIVEMEREDITH DRIVE MEREDITH DRIVE
S 11th STREET
S 19th STREET
BEAVERBROKE BLVD
HIG
HW
AY 1
41H
IGH
WAY
141
S JA
MES
STR
EET
N J
AM
ES S
TREE
T
N H
ARV
EY S
TREE
T
N M
AIN
STR
EET
S M
AIN
STR
EET
S LI
TTLE
BEA
VER
DRI
VE
S JA
MES
STR
EET
NW
128
th S
TREE
T
NW
100
th S
TREE
TN
W 1
00th
STR
EET
NW
100
th S
TREE
T
GAT
EWAY
DR
GAT
EWAY
DR
NW
111
th D
RN
W 1
11th
DR
T
NW
142
nd S
TREE
T
NW
121
st S
TREE
T
COU
NTY
LIN
E RO
AD
JAZZ
WO
OD
RO
AD
HIG
HW
AY 1
41H
IGH
WAY
141
NW 1st STREET
NE 18th STREET
NW 3rd STREET
NW 8th STREET
NW 11th STREET
NW 70th AVENUE
NW 78th AVENUE
NW 27th STREET
S 3rd STREET
S 19th STREET
NW 54th AVENUE SE 37th STREETSE 37th STREETSE 37th STREETSE 37th STREET
SE 28th STREETSE 28th STREET
MEREDITH DRIVEMEREDITH DRIVE
INTERSTATE 80/35
S 11th STREET
S 19th STREET
BEAVERBROKE BLVD
Pedestrian Overpass
DOWNTOWN
GlenstoneParkGlenstonePark
GrimesCity Hall
BeaverbrookeSouth Park
ShawversPark
DOWNTOWN
ShawversPark
North PointePark
GlenstonePark
Future Park
Future Park
Future Park
Future Park
Future Park
Future Park
Future Park
WaterWorks Park
Future Kennybrook Park
GrimesCity Hall
Future Park
Future Park
Future Park
Pedestrian Overpass
LionsParkLionsPark
GrimesSportsComplex
Sports Complex Expansion
Hopital / Business Park
BeaverbrookeSouth Park
FutureSportsComplex
School
City Limits
City Limits
City Limits
City Limits
Future Parks and RecreationExisting Parks and RecreationFuture GreenwayExisting GreenwayFuture Civic/Public FacilityExisting Civic/Public FacilityDowntownBroadwalk
Existing ArterialsProposed ArterialsExisting CollectorsProposed CollectorsExisting Local StreetsProposed Local StreetsExisting TrailsProposed Trails
Map 5.4
Future Parks, Greenway & TrailsGrimes, Iowa
MAY, 2010
2000’1000’0

Chapter 5 : Page 85
Section Three: Community Plan The Grimes Plan
Parks and Recreation
Grimes’ residents enjoy access to a variety of park and recreation facilities, including the excellent Grimes Sports Complex. Parks and recreation are a vital component of community life; therefore, it is essential that the city pro-vide additional facilities as the community grows. This ex-pansion is necessary to maintain a high level of park and recreational services and to remain competitive within the larger metropolitan area.
The overall concept for Grimes’ future park and greenway system:
Allows the park system to grow with the city;•
Proposes new centers for recreation, which are inte-• grated into the greenway system;
Provides recreational facilities needed to meet commu-• nity priorities;
Envisions a linked park system, molding Grimes’ future • open space system into a green network that unites the community;
Establishes a trail system linking major community fea-• tures; and
Provides an equitable mechanism for financing of new • park facilities.
Grimes’ Future Park and Recreation system (Map 5.4) il-lustrates approximately 300 acres of park and open space land or about 12 acres per 1,000 residents. This elevates the city’s existing level of service (9 acres per 1,000) and will make Grimes comparable to other Des Moines area cities. The following sections address actions and policies integral to attaining this goal.
EXPAND THE PARK AND OPEN SPACE SYSTEM
Grimes will need to provide new park and open space ar-eas as growth occurs in order to maintain a high level of park and recreation service. All areas of the community should be served by a neighborhood park, establishing adequate service to all of the city’s neighborhoods.
The majority of Grimes’ future growth will occur to the north and west. In order to serve residential growth cen-ters, the Grimes Plan proposes new neighborhood parks within a quarter to half mile walking distance from all new residential growth areas. This should include an expand-
ed Kenneybrook Park, development of the north side sports complex, and a new community park along 19th Street. The plan also calls for preservation of the farm site south of downtown as part of the city’s history and future park system.
A high quality neighborhood park is determined by both size and features. New neighborhood parks should in-clude at least the following features/amenities:
Picnic area with shelter•
Restroom with drinking fountain•
Toddler’s playground (ages 2 to 5)•
Children’s playground (ages 5 to 12)•
Informal ballfield•
Flat open practice area of 1 acre•
Two basketball courts•
Walking paths and sidewalks•
Lighting•
Tree planting and landscaping•
Site furnishings•
Any floodplain or drainage swales should continue to be protected from development and utilized as community greenways. These greenways should not substitute for neighborhood parks but be quality amenities within the parks and links in the city’s trail system. Expansion of the city’s park and recreation amenities is important to meet
COU
NTY
S JA
MES
STR
EET
S M
AIN
STR
EET
S JA
MES
STR
EET
NW 1st STREET
S 19th STREET
S JA
MES
STR
EET
S M
AIN
STR
EET
S JA
MES
STR
EET
COU
NTY
NW 1st STREET
S 19th STREET
DOWNTOWNDOWNTOWN
Future Park
Future Park
ure k
Future Park
WaterWorks Park
Future Kennybrook Park
GrimesSportsComplex
Sports Complex Expansion
School

Chapter 5 : Page 86
Section Three: Community PlanThe Grimes Plan
the recreational needs of residents but is also has impor-tant economic benefits. Facilities like the sports complex are regional draws that bring visitors and thus consumer spending that comes with the visitors.
NEIGHBORHOOD PARK FINANCING
Grimes should implement a park financing mechanism to fund park acquisition and ensure the reservation of well-located and appropriately sized open spaces. A mecha-nism to finance community park acquisition is necessary to assure the reservation of well-located and appropriately sized open spaces. Without an appropriate plan, devel-opers are more likely to only provide the undevelopable parcel or drainage area for park land. The City of Grimes should establish a park land dedication policy for all new developments. Neighborhood Park dedication can be cal-culated through one of two approaches: dedication based on park land need per person or as a percentage of the total development area. In addition to requiring a quan-tity of land, the Grimes park land dedication policy must take into account the quality of the land. The city’s policy should require that the land be appropriate for neighbor-hood park development, including at least 1 acre of flat ground and a limited percentage of the area utilized for stormwater drainage.
Approach I: Parkland per Person
Step 1. Determine persons per household averages, usu-
ally by dwelling type. In 2000 Grimes’s average was 2.87
persons per owner occupied unit and 1.99 per renter oc-
cupied unit.
Step 2. Establish Parkland Acre per 1,000 population stan-
dard. Grimes’s existing standard is 9 acres per 1,000 for
overall park land and 2.6 acres for neighborhood parks.
Step 3, Alternate A. Count actual lots in proposed sub-
division/development, determine total population, and
multiply by Parkland Acre/1,000 population standard to
determine required dedication.
Step 3, Alternate B. Use the minimum lot size in the
applicable zoning district to arrive at a project Net Den-
sity, determine total population, and multiply by Parkland
Acre/1000 population standard to determine required
dedication.
Approach II: Parkland as a percentage of total development area
Under this approach the city ordinance establishes the amount of parkland as a percentage of the total develop-ment area, varying the percentage in accordance with the minimum lot area per Unit. The follow provides an exam-ple of this approach.
Other Funding Alternatives
Other park and trail funding techniques include:
General Obligation (GO) Bonds. GO bonds obligate gen-
eral tax revenues toward retirement, and represent the
highest level of security to bondholders. Issuance of GO
bonds requires voter approval. These bonds typically
form the core of park financing mechanisms, with pro-
ceeds used for a variety of rehabilitation and development
purposes.
Residential Uses: Min. Lot Area Percentage of Total Land Area
25,000 – 40,000 sq. ft. or greater 3%
8,000 – 24,999 sq. ft 5%
2,499 – 7,999 sq. ft. 10%
N H
ARV
EY S
TREE
T
N J
AM
ES S
TREE
T
N M
AIN
STR
EET
T
HIG
HW
AY 1
41
NW 1st STREET
NW 3rd STREET
NW 8th STREET
NW 11th STREET
S 3rd STREET
BEAVERBROKE BLVD
N J
AM
ES S
TREE
T
N H
ARV
EY S
TREE
T
N M
AIN
STR
EET
T
HIG
HW
AY 1
41
NW 1st STREET
NE 18th STREET
NW 3rd STREET
NW 8th STREET
NW 11th STREET
S 3rd STREET
BEAVERBROKE BLVD
Pedestrian Overpass
DOWNTOWN
GrimesCity Hall
BeaverbrookeSouth Park
DOWNTOWN
WaterWorks Park
GrimesCity Hall
Future Park
Future Park
Future Park
Pedestrian Overpass
LionsParkLionsPark
BeaverbrookeSouth Park
SportsComplex
City Limits

Chapter 5 : Page 87
Section Three: Community Plan The Grimes Plan
Transportation Enhancements (TE). TE funds are appro-
priated through federal transportation legislation (cur-
rently SAFETEA-LU) for trails, corridor beautification, and
enhancement. This program is administered through
the Des Moines Area Metropolitan Planning Organiza-
tion (DMAMPO) and provides 80-percent funding for ap-
proved projects. Matching funds are typically provided
through general obligation park bonds.
Surface Transportation Program (STP). This is the prima-
ry federal road financing program, also appropriated
through SAFETEA-LU and successor programs. STP funds
may be used for trail facilities that are developed as part
of a major transportation corridor.
Private Foundations and Contributions. Foundations and
private donors can be significant contributors to park de-
velopment, especially for unique facilities or for major
community quality of life features.

Chapter 5 : Page 88
Section Three: Community PlanThe Grimes Plan
GREENWAYS AND TRAILS
Grimes should continue to expand the trail system that links destinations within the city and provides a quality amenity. Trail development has become a significant ame-nity to communities and a feature that many people seek out when moving to any size community. The benefits to trail development not only include recreation but also:
Health and physical activity•
Transportation•
Economic and community development•
Improved community image and quality•
Historical interpretation and linkages•
Environmental education and preservation•
Corridor conservation for multiple uses•
Grimes has completed important trail segments and ex-pansion and connection of this system should be a priority of the city, including connections to community destina-tions, neighborhoods, and the city’s green spaces. The city’s disconnected transportation system makes the utili-zation of greenways and railroad right-of-way even more important.
A multi-purpose trail system should follow six basic prin-ciples:
The system should be community wide. Grimes’ commu-
nity destinations are spread out throughout the city, in-
cluding the city’s parks, schools, shopping, and recreation
destinations. A city wide system not only provides access
to all of these destinations, but fosters contact among all
Grimes neighborhoods and helps visitors appreciate the
city and its unique qualities.
The system should benefit a wide variety of users. Pedes-
trians and bicyclists are, and probably will continue to be,
the dominate users of trails. Yet, trails can serve all types
of people with many different interests and capabilities
– seniors, children, families, people with disabilities, and
visitors to the area. Indeed, new user groups and require-
ments are likely to emerge in the future.
The system should have multiple benefits. Recreation and
physical activity continue to be the fundamental values of
trail development. We have become increasingly aware
that health and physical activity benefits are no longer just
“amenities.” Yet, trails have benefits beyond recreation
and health. These benefits include community transpor-
tation, education, family experience, safety, and economic
development.
The system should create economic opportunities. Trails
are increasingly important to the effort of attracting resi-
dents and investments. The success of the national trail
movement has caused people to expect their own com-
munities to provide a quality trail system.
The system must be strategic and sustainable. In today’s
economy, governments at all levels face serious financial
limitations. While these limits affect capital development,
the operational costs of trails must also be considered.
Trails that are neglected or deteriorated do not serve the
needs of the community and waste community resources.
Grimes’ system must be strategic and focused on areas
that will most efficiently meet both user needs and the
overall goals of the city.
The system should build on and enhance existing efforts.
The city has completed important links in the trail system
and larger master plan exists. Future trail development
should utilize and build off of these corridors.

Chapter 5 : Page 89
Section Three: Community Plan The Grimes Plan
NATURAL RESOURCE AREAS AND OTHER OPEN SPACES
Grimes should protect identified wetlands and address storm water management issues that can be incorporat-ed into the city’s green network. Communities across Iowa are beginning to think about stormwater runoff in a more regional context. Stormwater management can no longer be site specific but the impact of that runoff on down-stream areas is the right thing to do for the environment and as a resident of a larger drainage basin. Addressing stormwater runoff through what is often referred to as “Best Management Practices” (BMPs) provides amenities, controls run-off volumes into area drainage corridors, and improves the quality of the water that is discharged into public water ways. The use of bioswales, porous pave-ments, green roofs, and rain gardens also provide site spe-cific amenities and add to the city’s green network. Pres-ervation of wetlands and native prairie also add to a city’s biodiversity and open space system. The city may need to consider the development of a stormwater utility fund to fund better practices and mandated improvements.
URBAN REFORESTATION
The City should work with residents to preserve and ex-pand on the city’s existing street canopy. A good tree can-opy provides aesthetic, economical, and environmental benefits to a community. It creates attractive neighbor-hoods and an appealing community to future residents and businesses. It also provides shade in the summer and wind breaks in the winter, lowering energy costs to resi-dents. The city should develop a program that invento-ries and protects existing tree canopy and provides op-portunity for new plantings. Through the development of a small city owned nursery, the city could establish a tree replacement program for all city owned property and provide trees to residents at reduced cost. The residen-tial program would be specifically for street trees or trees planted in the right-of-way. Residents could select from a specified list of trees and the city would than plant the tree for the resident at a minimal cost to the homeowner.

Chapter 5 : Page 90
Section Three: Community PlanThe Grimes Plan
Housing and Neighborhoods
Preservation of existing housing and development of new housing to support new growth are vital elements of Grimes’ community development strategy. While land use and community investment strategies are important to housing planning, specific efforts are needed to ad-dress housing priorities. This section considers initiatives, which, if combined with existing programs, can help ad-dress these major priorities.
The city’s primary housing challenges include:
Maintaining the structural integrity of older homes and • the quality of Grimes’ existing housing supply.
Developing an effective, multi-faceted neighborhood • conservation and rehabilitation program.
Increasing the diversity of housing choices in Grimes, • including rental, for present and prospective residents.
Grimes should consider polices that include:
A VARIETY OF HOUSING TYPES
Grimes should provide a variety of housing for residents at all stages of their lives, including young adults and seniors. Housing variety should be integrated into new growth ar-eas and the city’s land development ordinances should provide adequate flexibility to accommodate innovative or economical designs within traditional town patterns. Some of these configurations may include:
Single-Family Attached Development. This is a housing
type already seen in Grimes where single-family units
comply with the minimum lot sizes of the zoning district,
but have a common wall. The opposite side yard is ordi-
narily larger than normal. This housing type provides con-
struction economies and more useful side yards. The lot
areas can be privately owned or governed through a con-
dominium association. Grimes should work with develop-
ers to ensure these projects have site features and ameni-
ties that make them distinctive from other similar projects
in the Des Moines area.
Townhouses. Townhouses are another housing configu-
ration that has been used in Grimes and extensively in
the metropolitan area. These tend to be three or more
attached units that can be developed as owner-occupied
or rental housing. They provide construction and land use
efficiencies, while continuing the sense of a single-family
neighborhood. This housing type has been heavily used
throughout the Des Moines area, making distinctive styl-
ing and site amenities important in a competitive market.
Multi-Family Development. Multi-family development
should be integrated into the structure of new neighbor-
hoods, rather than developed as isolated “pods” on pe-
ripheral sites. This level of density will have strategic im-
portance for mixed use areas that cater to a pedestrian
environment, especially in the Governors District. Design
standards should provide a residential scale and prevent
creating a “project” look.

Chapter 5 : Page 91
Section Three: Community Plan The Grimes Plan
Small Lot Subdivisions. Single-family attached and de-
tached housing on smaller lots is gaining popularity across
the country. This is occurring for multiple reasons:
An economic shift towards smaller spaces, that are • more affordable to maintain.
An aging baby boom population looking to downsize. •
An interest in non-traditional housing styles that pro-• vide a more urban feel and a strong sense of neigh-borhood.
Smaller lots provide more cost effective use of urban ser-vices, lower maintenance costs to homeowners, and a greater return on the developer’s investment. To maintain an attractive urban scale, front-yard setbacks are often shorter and porches and other exterior features may ex-tend into the setback while garages are set back from the front façade wall of the house or even alley loaded.
Cluster Subdivisions. In clusters, the overall density of a
single-family project, including open space, must comply
with the maximum density requirement of the zoning dis-
trict. However, individual lots have smaller area and set-
back requirements. Clusters are useful when infrastructure
cost should be minimized or environmental features exist
which should be protected.
NEIGHBORHOOD CONSERVATION
Grimes should implement neighborhood conservation programs, including rehabilitation programs to preserve the city’s oldest housing stock. The preservation of existing neighborhoods and housing stock is important to any city and is essential to maintain an affordable housing stock. Much of Grimes’ affordable housing supply is already in place. Indeed, rehabilitation and preventive maintenance are the city’s most cost-effective way to assure a continued supply of good entry level housing. Neighborhood con-servation strategies include:
Land Use Policies. Grimes should maintain zoning and
land use policies that protect the integrity of its neigh-
borhoods. New zoning proposals should be evaluated
with a view toward their effect on surrounding neighbor-
hoods. The zoning ordinance should encourage project
design that reduces land use conflicts between residential
and other uses; and should establish buffering and screen-
ing standards to minimize external effects on neighbor-
hoods.
Rehabilitation. Grimes should develop rehabilitation pro-
grams (including the use of private loans leveraged by
Community Development Block Grant and HOME funds)
to promote the stabilization of housing stock that is in
need of significant rehabilitation. These programs should
emphasize the leveraging of private funds to extend the
use of scarce public resources.
Infill Development. Grimes should encourage the devel-
opment and redevelopment of vacant and under used lots
within the existing city. Access to existing infrastructure
creates the opportunity to construct new affordable units
and uses city services in a more cost effective manner than
development on greenfield areas.

Chapter 5 : Page 92
Section Three: Community PlanThe Grimes Plan
Map 5.5
Governors District ConceptGrimes, Iowa

Chapter 5 : Page 93
Section Three: Community Plan The Grimes Plan
A Strong Core
Downtown Grimes should be an important activity cen-ter for the city and the region. Downtowns occupy a par-ticular place of importance within cities and towns. They are unique to their individual communities – no downtown looks exactly like any other downtown. Because of this re-lationship, people often measure the health of their city by the health of their traditional business center. This how-ever, has not been the case for Grimes. While the city has flourished and commercial development has grown rap-idly around the Highway 141 corridor, downtown Grimes has stagnated. The district’s small size and lack of iden-tity often means that many new residents have little to no sense of the district as a destination place.
Despite a growing retail base outside of the downtown, the district should be a critical mixed use center of busi-ness, civic and residential uses. Concern over the dis-trict led to a 2008 Downtown Assessment from the Iowa Downtown Resource Center. One of the main issues for the district was a lack of identity, inspiring many to support the creation of the Governors District Alliance. The Gov-ernors District is based on the idea of building an identify for the downtown around the city’s designation as the only Iowa city named after a governor of Iowa. The purpose of the Alliance is to promote development and growth of the downtown “for the common good and general welfare of the community in cooperation with the Grimes Area Chamber of Commerce, Inc.”
Assets and Opportunities
A downtown development program should establish con-ditions that increase the customer base and expand busi-ness and property investment. Accomplishing this objec-tive will require a carefully orchestrated effort to enhance experience, create incentives for investment, assemble and redevelop underutilized land, and improve the dis-trict’s image and ease of customer use. The district has a variety of assets that provide a basis for this strategy and other issues that it must address, including:
City owned land. In recent years the City of Grimes pur-
chased the vacant silos that lined the railroad in the down-
town. In 2009 the city removed these structures, opening
sites for redevelopment in the downtown.
Vacant railroad right-of-way. The railroad line running
through most of Grimes is no longer used and has been
removed north of 1st Street. The section still remaining
from 19th Street north provides an excellent opportunity
to use the Rail Bank program to reuse the right-of-way as a
pedestrian amenity in the downtown and larger area.
A good inventory of sound buildings, suitable for rehabilita-
tion. The building stock of Main Street provides excellent
opportunities for rehabilitation or adaptive reuse. Gener-
ally the vacant building stock is in fairly good condition.
Although the majority of buildings are single story there
is a growing interest in conversion of upper levels to resi-
dential.
A highly accessible location. The district access to 1st
Street (Highway 44) and James Street means a signifi-
cant amount of traffic moves parallel to the district. This
should provide visibility to the district without having a
large amount of traffic moving directly through the heart
of the district.
Community Icons. The 2008 Assessment noted that the
Governors District needed to take advantage of the old
water tower as a marketing advantage, turning a negative
into a positive. The water towers prominent location at 1st
and James Streets makes it a visible feature that could be-
come a true community icon.

Chapter 5 : Page 94
Section Three: Community PlanThe Grimes Plan
A VISION FOR THE GOVERNORS DISTRICT
The Governors District has enormous potential to grow by serving its local and regional markets in specific ways. For local audiences, it should become a civic, commercial, activity, and increasingly residential neighborhood, grow-ing in importance to residents of Grimes. For regional markets, it should focus on unique or niche retail, service, tourism, and recreation from surrounding metropolitan ar-eas. A strategy designed to take advantage of these mar-ket opportunities is based on establishment of a strong boundary for the District, creating a unified area with a distinct sense of space.
During the Governors District visioning process the district was defined by North 3rd Street, Jacob Street, South 6th, and James Street but also including Waterworks Park and Brookeridge Plaza. Components of the Governors District Program are identified in Map 5.5 and include:
Reconstruction of Main Street1. to address infrastruc-ture issues, including stormwater drainage and water service.
Parking Improvements2. behind buildings and alleys that will provide the necessary parking for revitalized district.
Switching station improvements3. with new mixed-use
building on S. 2nd Street that will anchor the corner and offer more retail and service oriented space.
Creation of a Promenade4. or linear park along former Railroad with Governor’s District themeing. Develop-ment of the right-of-way as an amenity should be a cat-alyst for development around it and for the larger Gov-ernors District. The linear park will function as a spine connecting parks of the district but also connecting the district to the larger city through the city’s existing trail system.
Development of a new mixed-use building5. with parking along the Promenade.
Conservation programs,6. like those described under the Neighborhood Conservation portion of this plan that preserve a stable single-family neighborhood.
Continued investment in the existing Communi-7. ty Center. Even with the possible development of a YMCA at 1st Street and Highway 141 there will con-tinue to be a need for the services and recreation and meeting spaces provided at the Community Center.
Construction of a new city hall 8. to meet the needs of a growing city. The city will soon be out of space at its existing facility and a location in the Governors Dis-
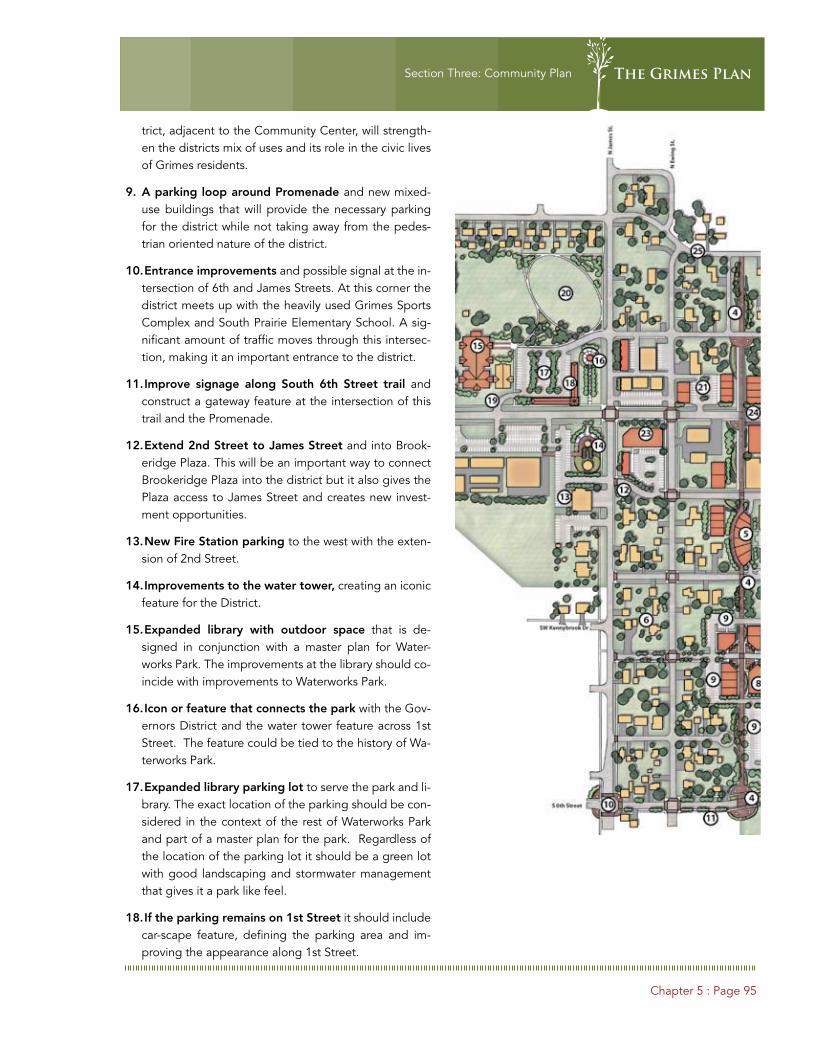
Chapter 5 : Page 95
Section Three: Community Plan The Grimes Plan
trict, adjacent to the Community Center, will strength-en the districts mix of uses and its role in the civic lives of Grimes residents.
A parking loop around Promenade 9. and new mixed-use buildings that will provide the necessary parking for the district while not taking away from the pedes-trian oriented nature of the district.
Entrance improvements 10. and possible signal at the in-tersection of 6th and James Streets. At this corner the district meets up with the heavily used Grimes Sports Complex and South Prairie Elementary School. A sig-nificant amount of traffic moves through this intersec-tion, making it an important entrance to the district.
Improve signage along South 6th Street trail 11. and construct a gateway feature at the intersection of this trail and the Promenade.
Extend 2nd Street to James Street12. and into Brook-eridge Plaza. This will be an important way to connect Brookeridge Plaza into the district but it also gives the Plaza access to James Street and creates new invest-ment opportunities.
New Fire Station parking 13. to the west with the exten-sion of 2nd Street.
Improvements to the water tower,14. creating an iconic feature for the District.
Expanded library with outdoor space15. that is de-signed in conjunction with a master plan for Water-works Park. The improvements at the library should co-incide with improvements to Waterworks Park.
Icon or feature that connects the park16. with the Gov-ernors District and the water tower feature across 1st Street. The feature could be tied to the history of Wa-terworks Park.
Expanded library parking lot 17. to serve the park and li-brary. The exact location of the parking should be con-sidered in the context of the rest of Waterworks Park and part of a master plan for the park. Regardless of the location of the parking lot it should be a green lot with good landscaping and stormwater management that gives it a park like feel.
If the parking remains on 1st Street18. it should include car-scape feature, defining the parking area and im-proving the appearance along 1st Street.
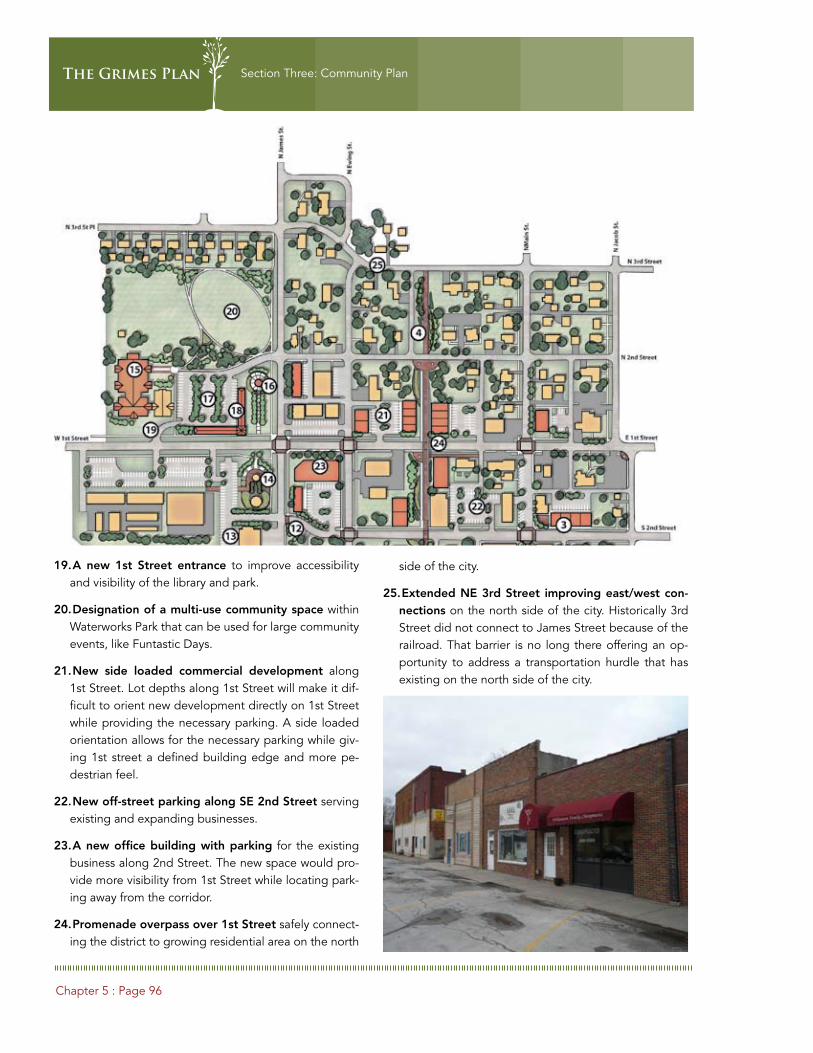
Chapter 5 : Page 96
Section Three: Community PlanThe Grimes Plan
A new 1st Street entrance19. to improve accessibility and visibility of the library and park.
Designation of a multi-use community space20. within Waterworks Park that can be used for large community events, like Funtastic Days.
New side loaded commercial development21. along 1st Street. Lot depths along 1st Street will make it dif-ficult to orient new development directly on 1st Street while providing the necessary parking. A side loaded orientation allows for the necessary parking while giv-ing 1st street a defined building edge and more pe-destrian feel.
New off-street parking along SE 2nd Street22. serving existing and expanding businesses.
A new office building with parking23. for the existing business along 2nd Street. The new space would pro-vide more visibility from 1st Street while locating park-ing away from the corridor.
Promenade overpass over 1st Street24. safely connect-ing the district to growing residential area on the north
side of the city.
Extended NE 3rd Street improving east/west con-25. nections on the north side of the city. Historically 3rd Street did not connect to James Street because of the railroad. That barrier is no long there offering an op-portunity to address a transportation hurdle that has existing on the north side of the city.
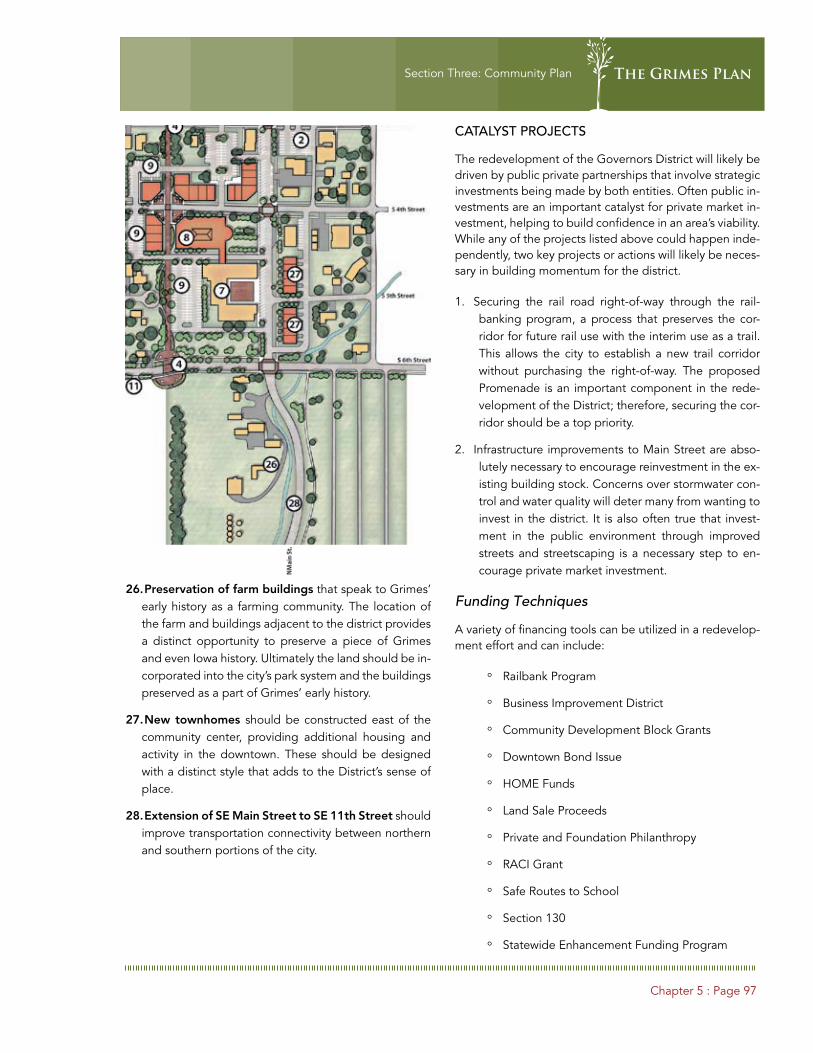
Chapter 5 : Page 97
Section Three: Community Plan The Grimes Plan
Preservation of farm buildings26. that speak to Grimes’ early history as a farming community. The location of the farm and buildings adjacent to the district provides a distinct opportunity to preserve a piece of Grimes and even Iowa history. Ultimately the land should be in-corporated into the city’s park system and the buildings preserved as a part of Grimes’ early history.
New townhomes 27. should be constructed east of the community center, providing additional housing and activity in the downtown. These should be designed with a distinct style that adds to the District’s sense of place.
Extension of SE Main Street to SE 11th Street 28. should improve transportation connectivity between northern and southern portions of the city.
CATALYST PROJECTS
The redevelopment of the Governors District will likely be driven by public private partnerships that involve strategic investments being made by both entities. Often public in-vestments are an important catalyst for private market in-vestment, helping to build confidence in an area’s viability. While any of the projects listed above could happen inde-pendently, two key projects or actions will likely be neces-sary in building momentum for the district.
Securing the rail road right-of-way through the rail-1. banking program, a process that preserves the cor-ridor for future rail use with the interim use as a trail. This allows the city to establish a new trail corridor without purchasing the right-of-way. The proposed Promenade is an important component in the rede-velopment of the District; therefore, securing the cor-ridor should be a top priority.
Infrastructure improvements to Main Street are abso-2. lutely necessary to encourage reinvestment in the ex-isting building stock. Concerns over stormwater con-trol and water quality will deter many from wanting to invest in the district. It is also often true that invest-ment in the public environment through improved streets and streetscaping is a necessary step to en-courage private market investment.
Funding Techniques
A variety of financing tools can be utilized in a redevelop-ment effort and can include:
Railbank Program ◦
Business Improvement District ◦
Community Development Block Grants ◦
Downtown Bond Issue ◦
HOME Funds ◦
Land Sale Proceeds ◦
Private and Foundation Philanthropy ◦
RACI Grant ◦
Safe Routes to School ◦
Section 130 ◦
Statewide Enhancement Funding Program ◦

Chapter 5 : Page 98
Section Three: Community PlanThe Grimes Plan
Tax Abatement ◦
Tax Increment Financing ◦
Transportation Enhancement (TE) Program ◦
Safe, Accountable, Flexible, and Efficient Trans- ◦portation Equity Act – A Legacy for Users (SAF-ETEA-LU)
Trees Forever ◦
Vision Iowa ◦
Community Action and Tourism ◦
Main Street Before Improvement

Chapter 5 : Page 99
Section Three: Community Plan The Grimes Plan
Main Street Potential Improvement
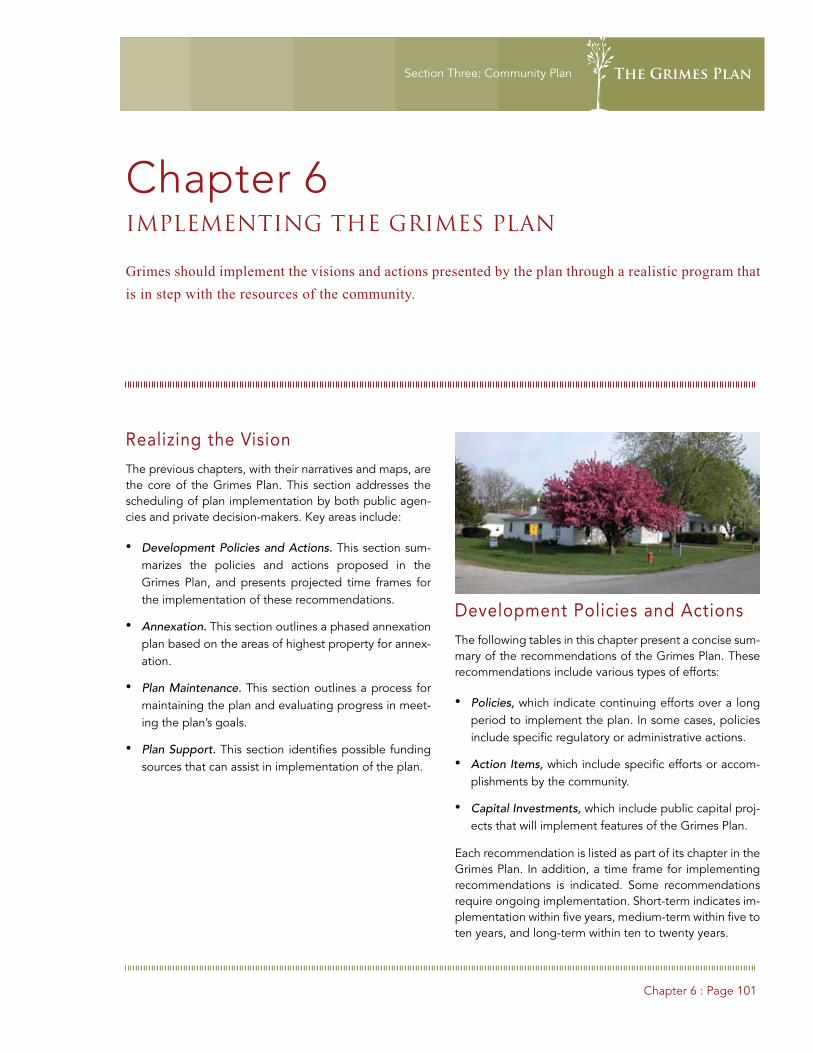
Chapter 6 : Page 101
The Grimes Plan
Section Three: Community Plan
Grimes should implement the visions and actions presented by the plan through a realistic program that is in step with the resources of the community.
Realizing the Vision
The previous chapters, with their narratives and maps, are the core of the Grimes Plan. This section addresses the scheduling of plan implementation by both public agen-cies and private decision-makers. Key areas include:
Development Policies and Actions.• This section sum-marizes the policies and actions proposed in the Grimes Plan, and presents projected time frames for the implementation of these recommendations.
Annexation.• This section outlines a phased annexation plan based on the areas of highest property for annex-ation.
Plan Maintenance.• This section outlines a process for maintaining the plan and evaluating progress in meet-ing the plan’s goals.
Plan Support.• This section identifies possible funding sources that can assist in implementation of the plan.
Chapter 6
IMPLEMENTING THE GRIMES PLAN
Development Policies and Actions
The following tables in this chapter present a concise sum-mary of the recommendations of the Grimes Plan. These recommendations include various types of efforts:
Policies,• which indicate continuing efforts over a long period to implement the plan. In some cases, policies include specific regulatory or administrative actions.
Action Items,• which include specific efforts or accom-plishments by the community.
Capital Investments,• which include public capital proj-ects that will implement features of the Grimes Plan.
Each recommendation is listed as part of its chapter in the Grimes Plan. In addition, a time frame for implementing recommendations is indicated. Some recommendations require ongoing implementation. Short-term indicates im-plementation within five years, medium-term within five to ten years, and long-term within ten to twenty years.

Chapter 6 : Page 102
The Grimes Plan
Section Three: Community Plan
Map 6.1: Implementation Schedule
Type On-going
Short Medium Long
Balanced Residential NeighborhoodsGrimes’ new residential areas should provide a mix of housing types, developed around neighborhood parks and greenways, and well-connected to the surrounding city by streets and pathways.
Policy X
Commercial and Industrial GrowthGrimes should provide contemporary settings for existing and new businesses and low-impact industries that take full advantage of the city’s transportation, location, and environmental assets.
Policy X
Transportation ConnectivityThe Grimes’ future transportation system should be the basic structure on which the city grows with connectivity between neighborhoods and community destinations.
PolicyCapital
X
Recreation AmenitiesGrimes’ park and recreation system should provide a green web within the community, connecting recreation features, neighborhoods, and community destinations.
Action Capital
X
A Strong CoreRevitalization efforts in the historic core of Grimes, specifically in the downtown or Governors District, should create a rejuvenated image center and regional destination, with renewed urban residential development surrounding and reinforcing the historic commercial district.
Action X
Transportation: Access for AllThe transportation program for Grimes should meet current and future mobility needs while enhancing the character of the city’s small-town environment.
Policy X
A Web of Collector and Arterial StreetsGrimes should establish a collector street and parkway system for developing areas that is designated ahead of development and dedicated as growth takes place. Transportation system Improvements should include:
Policy X
Completion of Beaverbrooke Boulevard as an arterial street from Highway 141 to County Line Road, connecting to 230th Street in Dallas County.
PolicyCapital
X X
Destination Drive as a collector street from SE 37th Street north to NE Beaverbrooke Boulevard.
Capital X
Gateway Drive from SE 37th Street to north of NE Beaverbrooke Boulevard. Capital X
A collector street generally following the half section line between James Street and County Line Road. This street should connect Douglas Parkway in Urbandale with NW 27th Street on Grimes northern edge.
PolicyCapital
X X
Extension of 11th Street west across the city’s planning jurisdiction. Capital X
A north south collector street between County Line Road and Jazzwood Road. PolicyCapital
X
Improvements to Highway 141 should improve the safety of the corridor. Possible improvements include conversion of Highway 141 and 1st Street intersection to an at-grade intersection and installation of lights and turn lanes at other major intersections.
Capital X
The city should closely monitor and work with the DOT on other regional projects such as improvements to the Highway 141 interchange on Interstate 80/35 and a possible regional bypass for the northwest portion of Des Moines.
PolicyAction
X

Chapter 6 : Page 103
The Grimes Plan
Section Three: Community Plan
Map 6.1: Implementation Schedule
Type On-going
Short Medium Long
Local StreetsThe local street network in Grimes’ developing areas should be designed with multiple connections and relatively direct routes.
Policy X
Green Streets and Complete StreetsGrimes should have an established network of green streets or complete streets that connect significant areas of town.
Policy X
Pedestrian and Bicycle FacilitiesGrimes’ pedestrian and trail system should be functional as well as recreational, providing access to major centers of activity. Specific projects should include:
Policy X
Highway 141 pedestrian overpass. Capital X
1st Street pedestrian improvements. Capital X
Completion of a looped trail system connected to the regional trail system. Capital X
Community Gateways and CorridorsGrimes should maintain the design quality of its major community corridors, allowing them to serve as attractive gateways into the town and positive business and community environments.
Policy X
Transit for a Small CityAs Grimes grows the city should work with Des Moines Area Regional Transit (DART) to expand service, increase connections to the region, and reduce reliance on regional automobile trips.
Action X
Expand the Park and Open Space SystemGrimes will need to provide new park and open space areas as growth occurs in order to maintain a high level of park and recreation service.
PolicyCapital
X
Neighborhood Park FinancingGrimes should implement a park financing mechanism to fund park acquisition and ensure the reservation of well-located and appropriately sized open spaces.
Action X
Park Site ImprovementsGrimes should establish a Park Site Improvement program for upgrades and improvements to existing parks.
CapitalPolicy
X
Natural Resource Areas and Other Open SpacesGrime should protect identified wetlands and address storm water management issues that can be incorporated into the city’s green network. Action
PolicyX
Urban ReforestationThe City should work with residents to preserve and expand on the city’s existing street canopy. Action X X

Chapter 6 : Page 104
The Grimes Plan
Section Three: Community Plan
Map 6.1: Implementation Schedule
Type On-going
Short Medium Long
Public Facility PrioritiesExpand the city’s current library facility to provide the space and services needed for a growing community. Work with Johnston to identify the location of an additional fire station in eastern Grimes. Closely monitor the needs of all public facilities in relation to the city’s growing population. Expansion of the school facilities to maintain the district’s current level of service/quality
Capital Policy X
X
X
X
Infrastructure PrioritiesUpgrade trunk lines along Main Street in order to stop the backup of water into businesses.Review city codes and ordinances to ensure that they do not prohibit the use of “green” solutions to stormwater management.Upgrade of water treatment plant for additional capacity.Upgrade of the underground reservoir at the water treatment facility for extension of facility life. Construct an additional southside water tower
Capital X
X
X
X
X
Transportation Priorities- Improve access to the downtown and to residential districts along First Street.- Improve pedestrian access around the city, especially across Highway 141- Improvements to James Street including new curb and gutter, sidewalks and landscaping- Improve access around and through the city, by creating new transportation corridors.
CapitalPolicy
x
x
xx
A Variety of Housing TypesGrimes should provide a variety of housing for residents at all stages of their lives, including young adults and seniors.
Policy X
Neighborhood ConservationGrimes should implement neighborhood conservation programs, including rehabilitation programs to preserve the city’s oldest housing stock.
ActionCapital
x
Governors District RedevelopmentA downtown development program should establish conditions that increase the customer base and expand business and property investment. Key projects include:
Policy x
Reconstruction of Main Street. Capital X
Secure Railroad right-of-way through the Rails to Trails program. Action X
Creation of a Promenade or linear park along former Railroad. Capital X
Construction of a new library and a master plan for Waterworks Park. Capital X
Plan ImplementationReview and revise the city’s zoning and subdivision ordinance to address conflicts between the Comprehensive Plan’s policy recommendations and implementation of the plan.
Policy X

Chapter 6 : Page 105
The Grimes Plan
Section Three: Community Plan
Phased Annexation
Grimes should implement an annexation policy that incor-porates future development area and meets state statu-tory requirements. The city should work with surrounding communities and counties to establish annexation agree-ments and ensure consistent development patterns.
The Grimes Development Concept is predicated on signif-icant community growth, generated by the region’s strong economy and attractiveness as a living environment. The projected land needs exceed the amount of available, un-developed land within existing corporate limits. As a re-sult, sound community growth will require annexations to accommodate land needs during the planning period.
Voluntary annexation of developments should occur be-fore extension of city services. Grimes should also adopt an annexation policy that establishes objective criteria for annexation and identifies candidate areas for incorpora-tion into the city. Areas considered for annexation should meet at least one of the following criteria:
Areas with Significant pre-existing development.• Ar-eas outside the city that already have substantial com-mercial, office, or industrial development are logical candidates for annexation. In addition, existing resi-dential areas developed to urban densities (generally higher than 2 units per acre) should be considered for potential annexation.
Protection of Future Growth Areas.• In order to allow the city to guide its growth and development more ef-fectively, future growth areas will need to be managed through annexation and annexation agreements with surrounding communities. Annexation will allow the city to extend its zoning jurisdiction to adjacent areas, thus guiding development in a direction that will pro-vide safe and healthy environments.
Public Services.• In many cases, public service issues can provide compelling reasons for annexation. Areas for consideration should include:
Parcels that are surrounded by the city but re- ◦main outside of its corporate limits. In these situ-ations, city services may provide enhanced pub-lic safety with improved emergency response times.
Areas that are served by municipal infrastructure. ◦Grimes’ existing sewer and water system is ad-jacent to areas outside the city. The city should review its existing annexation agreement with Urbandale and evaluate areas that can best be served by the respective communities.
Areas to be served in the short-term by planned ◦improvements, including trunk sewer lines and lift stations.
Community Unification. While difficult to quantify, a • split between people who live inside and outside the corporate limits can be harmful to the town’s critical sense of community and identity. Establishing unified transportation and open space systems and maintain-ing a common commitment to the city’s future can be important factors in considering annexation.

Chapter 6 : Page 106
The Grimes Plan
Section Three: Community Plan
GAT
EWAY
DR
COU
NTY
LIN
E RO
AD
N H
ARV
EY S
TREE
T
GAT
EWAY
DR
HIG
HW
AY 1
41
S JA
MES
STR
EET
N J
AM
ES S
TREE
T
N M
AIN
STR
EET
S M
AIN
STR
EET
S LI
TTLE
BEA
VER
DRI
VE
S JA
MES
STR
EET
NW
128
th S
TREE
T
NW
142
nd S
TREE
T
NW
121
st S
TREE
T
HIG
HW
AY 1
41H
IGH
WAY
141
NW 1st STREET
NW 3rd STREET
NW 8th STREET
NW 11th STREET
NW 70th AVENUE
NW 78th AVENUE
S 3rd STREET
S 19th STREET
NW 54th AVENUE
MEREDITH DRIVEMEREDITH DRIVE MEREDITH DRIVE
S 11th STREET
S 19th STREET
BEAVERBROKE BLVD
HIG
HW
AY 1
41
HIG
HW
AY 8
0/35
HIG
HW
AY 1
41
S JA
MES
STR
EET
N J
AM
ES S
TREE
T
N H
ARV
EY S
TREE
T
N M
AIN
STR
EET
S M
AIN
STR
EET
S LI
TTLE
BEA
VER
DRI
VE
S JA
MES
STR
EET
NW
128
th S
TREE
T
NW
100
th S
TREE
TN
W 1
00th
STR
EET
NW
100
th S
TREE
T
GAT
EWAY
DR
GAT
EWAY
DR
NW
111
th D
RN
W 1
11th
DR
NW
128
th S
TREE
T
NW
142
nd S
TREE
T
NW
121
st S
TREE
T
COU
NTY
LIN
E RO
AD
JAZZ
WO
OD
RO
AD
HIG
HW
AY 1
41H
IGH
WAY
141
NW 1st STREET
NE 18th STREET
NW 3rd STREET
NW 8th STREET
NW 11th STREET
NW 70th AVENUE
NW 78th AVENUE
NW 27th STREET
S 3rd STREET
S 19th STREET
NW 54th AVENUE SE 37th STREETSE 37th STREETSE 37th STREETSE 37th STREET
SE 28th STREETSE 28th STREET
MEREDITH DRIVEMEREDITH DRIVE
DOUGLAS AVEDOUGLAS PARKWAYDOUGLAS PARKWAY
INTERSTATE 80/35
S 11th STREET
S 19th STREET
BEAVERBROKE BLVD
Phase One Short TermPhase Two Long TermExisting StreetsProposed Proposed
Map 6.1
Phased AnnexationGrimes, Iowa
JUNE, 2010
2000’1000’0

Chapter 6 : Page 107
The Grimes Plan
Section Three: Community Plan
The Annexation Plan map (Map 6.1) illustrates those areas around Grimes that should be considered for annexation. The areas are categorized into two phases based on the estimated likeliness for incorporation into the city. Within each phase, sections are delineated by their relevance re-garding the need for annexation and the services the city will need to provide. The need for annexation should be determined by each area’s unique situation.
Phase One – Short Term.• Location and associated is-sues will likely warrant consideration for annexation in the next ten years. These areas are adjacent to city lim-its and may already have access to city services. Some of these areas, specifically along the County Line Road corridor have significant potential for development. Water and sewer services to these areas will need to be closely managed to ensure system capacity.
Phase Two – Long Term. • Conditions exist that may bring about the need for annexation of these sections. Annexation will not be likely during the early stages of the plan. Therefore, these areas should be reevaluated within six to ten years. Areas north of the city may have access to city services but larger lot development in this area may limit extension of services into this area. Within 10 years areas to the west should be closer to city services but these areas are outside the city’s waste water drainage basin. The city will want to closely mon-itor the impact that future development would have on the capacity of the sewer treatment plant. Develop-ment of areas to the west should only occur following development contiguous to the city.
Plan Maintenance and Support
Because the scope of the Grimes Plan is both ambitious and long-range, its recommendations may appear daunting. Thus, the City should implement an ongoing planning process that uses the Plan to develop year-by-year improvement programs. In addition, this process should evaluate the plan on an annual basis in consideration of the development events of that particular year.
Such a process should include the following features:
ANNUAL ACTION AND CAPITAL IMPROVEMENT PROGRAM
A key feature of this process is an annual action and capi-tal improvement program. In such a program, the Plan-ning and Zoning Commission and City Council use the Plan to define annual strategic work programs of policies, actions, and capital investments. This program should be coordinated with Grimes’ existing capital improvement planning and budgeting process, even though many of the Plan’s recommendations are not capital items. This an-nual process should be completed before the beginning of each budget year and should include:
A specific work program for the upcoming year. This • program should be specific and related to the City’s fi-nancial resources. The work program will establish the specific plan recommendations that the City will ac-complish during that year.
A three year strategic program. This component pro-• vides for a multi-year perspective, aiding the prepara-tion of the annual work program. It provides a middle-term implementation plan for the City.
A six year capital improvement program. This is merged • into Grimes’ current capital improvement program.

Chapter 6 : Page 108
The Grimes Plan
Section Three: Community Plan
ANNUAL EVALUATION
In addition, this process should include an annual evalu-ation of the Comprehensive Plan. This evaluation should occur at the end of each calendar year. Desirably, this eval-uation should include a written report that:
Summarizes key land use developments and decisions • during the past year and relate them to the Compre-hensive Plan.
Review actions taken by the City during the past year • to implement Plan recommendations.
Defines any changes that should be made in the Com-• prehensive Plan.
The Plan should be viewed as a dynamic changing docu-ment that is used actively by the City.
Plan Support
In order to implement many of the objectives described in the Plan, the City will need to consider outside funding sources. Table 6.2 on the following pages present possi-ble funding sources available to the City of Grimes for var-ious projects recommended in the Comprehensive Plan.
This should not be viewed as a complete list, but rath-er one that should be reviewed and modified each fiscal year.

Chapter 6 : Page 109
The Grimes Plan
Section Three: Community Plan
Table 6.2 Potential Funding Sources
SOURCEFUND
ADMINISTRATORDESCRIPTION POSSIBLE USES DEADLINES
AVAILABLE FUNDS
REQUIRED MATCH
Community Attraction and Tourism Program
Vision Iowa, Iowa DED
Funding for the development and creation of multiple purpose attraction or tourism facilities.
Creation of a major recreation facility in the city.
NA TBD Encouraged
Community Development Block Grant (CDBG)
HUD/State of Iowa
Federal funding for housing and economic development to benefit low-and moderate income residents.
Rehabilitation and infill projects, directed to projects that benefit low-and-moderate-income households or eliminate blighted areas.
NA NA NA
DOT/DNR Fund Iowa DOT
State funds for roadside beautification of primary system corridors with plant materials.
Landscaping improvements along key corridors in the city.
Open $300,000 Encouraged
Federal Transportation Enhancement Program
Iowa DOT or RPA/MPO
Funding for enhancement or preservation activities of transportation related projects.
Projects must fit at least one of the following: facilities for pedestrians and bicyclists; acquisition of scenic or historic sites; scenic beautification; historic preservation; rehabilitation and operation of historic transportation facilities; preservation of abandoned railway corridors; control and removal or outdoor advertising; archaeological planning and research; mitigation of water pollution due to highway runoff; safety and educational activities for pedestrians and bicyclists; historical displays at tourist and welcome centers; or transportation museums.
1-Oct
$4,500,000 each for
statewide and regional
projects
30%
Federal Recreation Trails Program
Iowa DOT
Provides funding for motorized and non-motorized recreational trails and trail related projects.
Local, regional or statewide trails plans.
1-Oct $1,000,000 20%

Chapter 6 : Page 110
The Grimes Plan
Section Three: Community Plan
Table 6.2 Potential Funding Sources
SOURCEFUND
ADMINISTRATORDESCRIPTION POSSIBLE USES DEADLINES
AVAILABLE FUNDS
REQUIRED MATCH
Highway Bridge Replacement and Rehabilitation Program
Iowa DOT
Funds for replacement or rehabilitation of structurally deficient or functionally obsolete public roadway bridges.
Bridge rehabilitation or replacement
1-Oct$ 1 Million per
bridge20%
HOME IDED
Funds administered by the State to provide leverage financing for new or rehabilitated rental development.
New and rehabilitated rental projects. HOME funds may be used in conjunction with Section 42 Low Income Housing Tax Credits. They may also be used for innovative project approaches, such as rent-to-own development.
NA NA NA
Iowa Clean Air Attainment
Iowa DOT
Funding for highway-street, transit, bicycle/pedestrian or freight projects or programs which help maintain Iowa’s clean air quality by reducing transportation related emissions.
Upgrades to arterial and major collector streets.
1-Oct TBD 20%
Land and Water Conservation Fund
Iowa DNRFunding for park and trail improvements and land acquisition.
Improvements to existing recreation facilities and development of new facilities.
15-Mar TBD 50%
Living Roadway Trust Fund
Iowa DOT
State funds to implement integrated Roadside Vegetation Management programs (IRVM) on city, county, or state rights-of-way or areas adjacent to traveled roads.
Roadside inventories, gateways, education, research, roadside enhancement, seed propagation, and special equipment.
31-Aug TBD NA
Pedestrian Curb Ramp Construction
Iowa DOT
To assist cities in complying with the Americans with Disabilities Action primary roads.
Construct curb ramps to ADA standards.
Accepted all year
$250,000 per city per year
45%

Chapter 6 : Page 111
The Grimes Plan
Section Three: Community Plan
Table 6.2 Potential Funding Sources
SOURCEFUND
ADMINISTRATORDESCRIPTION POSSIBLE USES DEADLINES
AVAILABLE FUNDS
REQUIRED MATCH
Public Facilities Set-Aside Program (PFSA)
IDED
Financial assistance to cities and counties to provide infrastructure improvements for businesses which require such improvements in order to create new job opportunities.
Provision or improvement to sanitary sewer systems, water systems, streets, storm sewers, rail lines, and airports. For Iowa Cities under 50,000 populations, CDBG benefit requirements.
NA NA 50%
Resource Enhancement and Protection (REAP)
Iowa DNR
Available for projects that enhance and protect natural and cultural resources.
Available for parkland expansion, multi-purpose recreation developments, soil and water conservation, DNR acquisition, and DNR land management.
Applications not currently
being accepted
$125,000 NA
Revitalization Assistance for Community Improvement (RACI)
IDED
Funding for various economic and community development projects.
Neighborhood revitalization, historic preservation, upper story restoration of downtown buildings.
7-Nov $15,000 Encouraged
Revitalize Iowa’s Sound Economy (RISE)
Iowa DOT
DOT administered funds used to promote economic development through construction or improvement or roads and streets.
Construction or improvement of roadways that will facilitate job creation or retention. Potential uses include a street system for additional business or industrial development.
2/1 and 9/1 $30,000,000 20/50%
Safe Route to Schools
Iowa DOT
Competitive grant program for infrastructure improvements within a 2 miles radius of K-8 Schools.
Sidewalk installation and improvements, and downtown pedestrian safety improvements.
1-Oct $1,000,000 NA
Section 42 Low Income Housing Tax Credit
HUD
The allocation of tax credits to affordable housing developers through the State. Developments can utilize either a 4% or 9% credit, depending on the mix of low-income residents.
Multi-family housing development for low and moderate-income families.
NA NA NA
Self-Supported Business Improvement District
Business Association
Contributions by business owners used for various business district enhancements.
Physical improvements to business district, upper-story restoration of downtown buildings.
NA NA NA

Chapter 6 : Page 112
The Grimes Plan
Section Three: Community Plan
Table 6.2 Potential Funding Sources
SOURCEFUND
ADMINISTRATORDESCRIPTION POSSIBLE USES DEADLINES
AVAILABLE FUNDS
REQUIRED MATCH
State Recreational Trails Program
Iowa DOTProvides funding for public recreational trails.
Local, regional or statewide trails plans.
1/2 and 7/1 $2,000,000 25%
Surface Transportation Program (STP)
Regional Planning Affiliation or Metropolitan Planning Organization (RPA/MPO)
Funding for road or bridge projects on the federal aid system.
Road or bridge projects. Trails improvements. Bicycle facilities.
Vary by RPA/MPO
$43,000,000 for all RPA/
MPO’s20%
Tax Abatement City
Reduction or elimination of property taxes for set period of time on new improvements to property granted as an incentive to do such projects.
Available for commercial, industrial, or residential developments.
NA NA NA
Tax Increment Financing (TIF)
City
Used added property tax revenues created by growth and development to finance improvements within the boundaries of a redevelopment district.
New residential, commercial, or industrial developments, including public improvement, land acquisition, and some development costs.
NA NA NA
Traffic Safety Improvement Program (TSIP)
Iowa DOT
Traffic safety improvements or studies on any public road.
Traffic safety and operations at specific site with an accident history. New traffic control devices. Research, studies or public information initiatives.
15-Aug$500,000 per
projectNA
Transportation and Community and System Preservation Program
Iowa DOT
Funding for planning and implementing strategies that improve the efficiency of the transportation system, reduce the environmental impacts of transportation, reduce the need for costly future public infrastructure investments, ensure efficient access to jobs, services and centers of trade, and examine private sector development patterns and investments that support these goals.
Innovative transportation improvements that address stated goals.
Established yearly
$61,250,000 NA
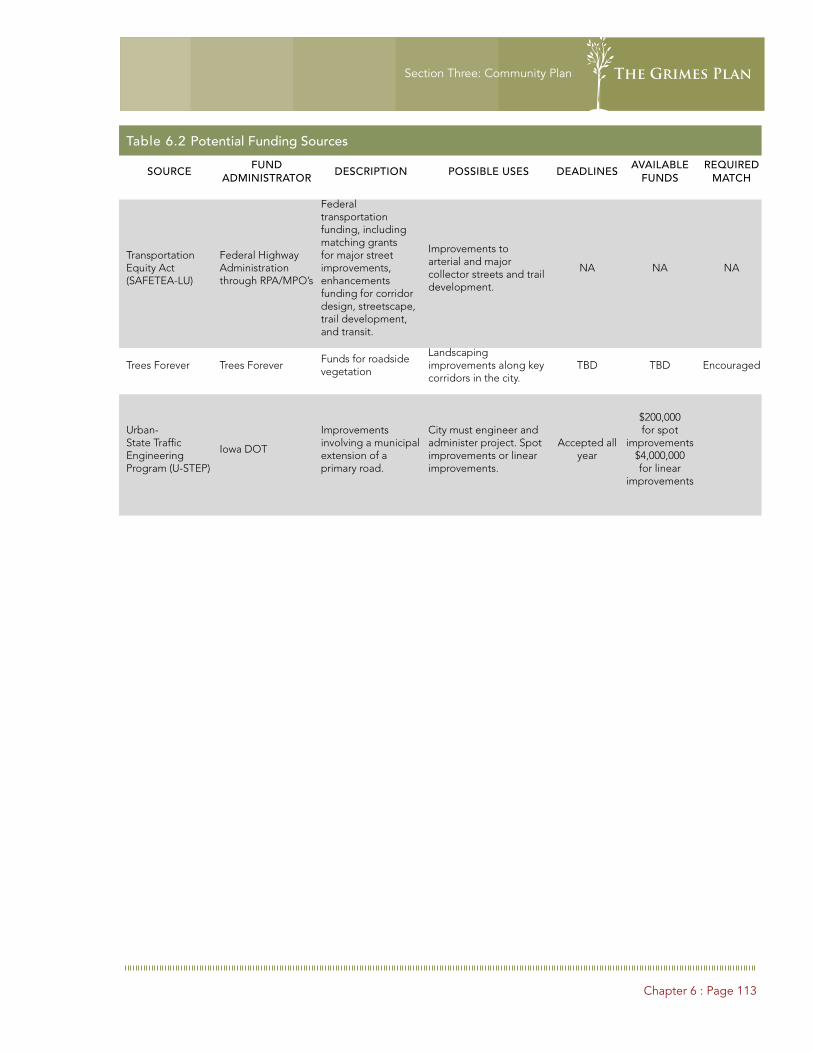
Chapter 6 : Page 113
The Grimes Plan
Section Three: Community Plan
Table 6.2 Potential Funding Sources
SOURCEFUND
ADMINISTRATORDESCRIPTION POSSIBLE USES DEADLINES
AVAILABLE FUNDS
REQUIRED MATCH
Transportation Equity Act (SAFETEA-LU)
Federal Highway Administration through RPA/MPO’s
Federal transportation funding, including matching grants for major street improvements, enhancements funding for corridor design, streetscape, trail development, and transit.
Improvements to arterial and major collector streets and trail development.
NA NA NA
Trees Forever Trees ForeverFunds for roadside vegetation
Landscaping improvements along key corridors in the city.
TBD TBD Encouraged
Urban-State Traffic Engineering Program (U-STEP)
Iowa DOT
Improvements involving a municipal extension of a primary road.
City must engineer and administer project. Spot improvements or linear improvements.
Accepted all year
$200,000 for spot
improvements $4,000,000 for linear
improvements