The City and Innovation
35
The City and Innovation Patrick Adler, Martin Prosperity Institute Richard Florida, University of Toronto Karen King, Martin Prosperity Institute Charlotta Mellander, Jönköping International Business School * Names are listed alphabetically December 2017 REF. 2017-MPIWP-003 Working Paper Series Martin Prosperity Research
Transcript of The City and Innovation

The City and Innovation
Patrick Adler, Martin Prosperity Institute Richard Florida, University of Toronto Karen King, Martin Prosperity Institute
Charlotta Mellander, Jönköping International Business School
* Names are listed alphabetically
December 2017 REF. 2017-MPIWP-003
Working Paper Series Martin Prosperity Research

Abstract Theory and research on innovation and entrepreneurship focus on the firm as a unit of analysis. We argue that the city, or place and space, has emerged as a key organizing unit for both innovation and entrepreneurship. The city organizes the key inputs for the processes of innovation and entrepreneurship, by concentrating human capital, firms, knowledge, knowledge-based institutions and other key inputs. We advance this framework by exploring the geographic clustering of a key indicator of commercially-relevant innovation and entrepreneurship - venture capital investment in high-tech companies. We chart the geography of innovation both across and within cities, at both the metro level and the district or neighborhood level for all venture-capital backed startups and for startups in digital industries. Our findings indicate that such commercially relevant innovation is concentrated at two key geographic scales. At the macro-level, it is highly clustered and concentrated in a relatively small number of global cities or metro areas. At the micro-level, it is highly concentrated at tight neighborhood level micro-clusters within these leading cities and metro areas.
Key Words: Innovation, entrepreneurship, venture capital, clustering, cities, density, urbanization

MPI Working Paper Series: The City and Innovation (Adler, Florida, King & Mellander) 3
Introduction The extensive literature on innovation and entrepreneurship has long privileged the firm as the unit of analysis. Our basic argument is that the city has emerged as an organizational platform for both innovation and entrepreneurship. In doing so, we draw from and build upon the original theory of the city as an innovative unit advanced by Jacobs (1969; 1985) who argued that cities bring together and organize the key inputs required for the processes of innovation and entrepreneurship – a diverse array of talent and human skill; a wide range of firms that take on varied roles as customers, suppliers and end-users; a diverse knowledge and set of knowledge institutions and other key inputs. The Nobel-prize winning economist Robert Lucas (1988) notes that Jacobs insights into the human capital externalities that drive from place-based clustering provide fundamental insight into the basic mechanisms of innovation and economic growth.
A wide body of research documents the geographic clustering of innovation across space (Acs et al., 1992; Jaffe et al., 1993; Anselin et al., 1997; Carlino and Kerr, 2012; Murata et al., 2014), and identifies the importance and characteristics of geographically delimited ecosystems in organizing and propelling innovation and entrepreneurial firm formation (Porter, 2000; Florida and Kenney, 1992; 1993; Saxenian, 1994; Scott and Storper, 2003). This broad body of research establishes that the processes of innovation and entrepreneurship are both geographically clustered and concentrated in space and organized by spatially-delimited and embedded systems of skill, networks and institutions.
Building from this literature on the geography and clustering of innovation, this article suggests that the city itself functions as a key organizing unit for both innovation and entrepreneurship. Our aim is to put place and space front and center in the theory of innovation and entrepreneurship, and to put cities at the focal point of that effort.
The geographic nature of innovation is fractal and occurs on multiple scales. Indeed, innovation and entrepreneurial activity are not uniformly spread across metros. Just as they are concentrated and clustered across global metros, so too are the concentrated and clustered within these leading metropolitan areas. Innovation and entrepreneurial activity take place – and require – organization in distinct micro-clusters at the district or neighborhood level within metropolitan regions.

MPI Working Paper Series: The City and Innovation (Adler, Florida, King & Mellander) 4
We lay out the spatial clustering and organization of innovation and entrepreneurship at the macro- and micro-geographic scales. We show how the geographic clustering and concentration of innovative and entrepreneurial activity occurs at a macro-level across space, being highly concentrated in a limited number of cities and metropolitan regions across the world, and also at a micro-level occurring in dense, tightly networked micro-clusters at the district or neighborhood level within those leading cities and regions.
In order to understand this, we use detailed, micro-data on venture capital investment in high-tech startup firms. The data from Thomson Reuters cover the entire universe of venture capital investment in high tech companies. We code the data at both the metropolitan level and the zip code or postal code level using this dataset to examine the geographic distribution and clustering of venture capital investment across the world’s cities or metro areas and at the neighborhood or district level within these leading cities and metro areas. These data allow us to overcome a key limitation of previous studies by providing a more robust measure of commercially-relevant innovation and entrepreneurial firm formation. The extant literature tends to use two key measures for innovation and entrepreneurial activities, patents and concentrations of high-tech or newly established firms. Both types of indicators tend to be organized and collected nationally and thus do not lend themselves to cross national comparison. They are also at best broad proxy measures of innovation and entrepreneurial activity. Our data on venture capital in investment in high-tech companies covers the entire universe of such transactions and can be organized and compared across each and every geographic scale of interest to the geography of innovation – the nation, the metropolitan area and the neighborhood or district level. The data are for the years 2012 and 2013 and cover more than $35 billion in venture capital investments in metro areas across the world. This data includes the name of the recipient company, the total dollar value of the investment, the number of deals completed, and geographic location information, including metro, city and postal code. These data are also coded by broad industry sector and we use these data to examine the patterns of macro- and micro-level geographic clustering for all venture capital-backed startups and for venture capital backed startups in the digital industries of software, media and entertainment and information technology.
This rest of this paper proceeds in four main parts. We begin by contextualizing our contribution in light of the extensive literatures on innovation and entrepreneurship, seeking to connect that work with theorizing and research on the geography and clustering of innovation and on the characteristics of innovative and entrepreneurial ecosystems. We illustrate the central role of place in organizing innovation and entrepreneurship by examining the
MPI Working Paper Series: The City and Innovation (Adler, Florida, King & Mellander) 5
concentration of clustering of a key form of commercially relevant innovation – venture capital investment in high tech companies - across global cities on the one hand, and in distinct micro-clusters within these global cities. The concluding section highlights our key takeaways and relevance for research and theorizing on innovation and entrepreneurship.
Innovation and Cities Dating back to Marx (orig. 1867, 2012) and Schumpeter (1934a, 1934b, 1954), the theory of innovation and of entrepreneurship has long privileged the individual innovator or entrepreneur, and the firm. Indeed, modern innovation theory views the firm as the central organizing input for these joint processes. Marx saw innovation as something that was driven by the constant quest for capital accumulation. Although much of his theorizing is on the exploitation and extraction of value from physical laborers (see Capital orig. 1867, 2012), in The Grundrisse (orig. 1861, 1993) he argues that science and knowledge increasingly act as direct forces of production. Schumpeter’s early work (1934a, 1934b) attempted in part to revise Marx by emphasizing the role of the visionary entrepreneur in marshalling new technological innovations and in creating new firms which disrupt and creatively destroy incumbent firms and industries. Later, Schumpeter revised this view (1954), pointing to the increasing internalization and bureaucratization of innovation via the research and development laboratories of large vertically integrated corporations.
The extensive literature on innovation and entrepreneurship that has evolved since Schumpeter continues to privilege the firm as the unit of analysis. Firms are at the center of Solow’s (1956) theory of technological change and economic growth. Griliches (1957) and Schmookler (1966) also empirically link firm inventiveness to growth. Arrow (1971) and Nelson (1996) advanced the basic theory of how firms undertake to internalize R&D. Aghion and Howitt (1992) and Grossman and Helpman (1993) model growth as an outcome of firm innovations. Klein (1977), Klepper (1996) and Vernon (1966) link fluctuation in the growth rate to firm and industry innovation cycles. Nelson and Winter (1982) and descendants describe economic history in evolutionary terms, seeing firms as dominant actors in the evolutionary processes of innovation and economic growth imagining firms as the key technological actors. Levinthal and March (1993) Cohen and Levinthal (1990) and (Peltokorpi, 2017) show that the ability of a firm to innovate depends on its routines and prior level of knowledge. Others show that firms acquire new capabilities by re-combining current assets (Kogut and Zander, 1992). There is a wide body of research which shows that that an increasing amount of research is being performed collaboratively, across the firm boundaries (D’Aspremont and Jacquemin, 1988; Caloghirou et al., 2003).

MPI Working Paper Series: The City and Innovation (Adler, Florida, King & Mellander) 6
In fact, the great bulk of the traditional academic literature on innovation and entrepreneurship can be said to be “aspatial” in its neglect for geography and urbanization. Indeed, the conventional wisdom is that the rise of new digital technologies such as computerization, the internet and social media would relieve or eliminate the constraints of geography, reduce the frictions associated with physical distances (Caincross, 2001) and render the world “flat” (Friedman, 2005). Digital technologies, according to this view, would enable firms and talent to locate at further remove, spreading out the spatial division of labor, and rendering geographic clustering less important. However, there is growing evidence that highly innovative activity is in fact increasingly clustered and concentrated within nations and across the global economy (Audretsch and Feldman, 1996; Porter, 2000; Florida, 2005; Florida et al., 2008).
Our argument here is that the city has emerged as a central organizing platform for innovation and entrepreneurship in modern economies. Geography, and geographic clustering, is not just the container of innovative and entrepreneurial activity, but their very enabler. Our argument is informed by the large and substantial literature on the importance of place, space and geography to innovation and entrepreneurship dating back to Alfred Marshall (1890) and Jane Jacobs (1969).
Marshall’s canonical studies of Midland industrial districts (1890) were among the first to suggest that firms can do better by locating near their competitors (see Belussi and Caldari, 2008 for an intellectual history). A century of research, neatly summarized by Duranton and Puga (2004) formalizes his initial intuition that there are three types of benefits to the localization of activity: greater sharing of inputs, better matching of firms to inputs, and greater knowledge spillovers. Indeed, Krugman’s neo-Marshallian models of agglomeration (1991, 1998) were recognized with the Nobel Prize in Economics. The key role of localization is documented by Ellison and Glaeser (1997) who distinguish Marshallian agglomeration from mechanical agglomeration and find that almost all manufacturing industries exhibit at least some degree of clustering.
Empirical research into the geography of innovation shows that it is considerably more clustered than manufacturing (Feldman and Florida, 1994; Audretsch and Feldman, 1996; Kelly and Hageman, 1999) and even more concentrated than population or economic output (Chatterji et al., 2014; Bettencourt et al., 2007; Florida, 2005). This uneven geography of innovation has been documented in studies using a wide range of variables and indicators, including patents (Jaffe, 1989; Jaffe et al., 1993; Acs et al., 1994), new product innovations (Acs et al., 2002; Feldman and Audretsch, 1999), venture capital (Florida and Kenney, 1988;

MPI Working Paper Series: The City and Innovation (Adler, Florida, King & Mellander) 7
Chen et al., 2010) and research and development laboratories (Carlino et al., 2012).
The focus of the innovation geography research has been on understanding the economic micro-foundations of agglomeration. More innovative firms have been found to benefit from the dense supplier networks found in industrial clusters (Helsley and Strange, 2002). Rama et al. (2003) find a high incidence of subcontracting among small and large firms in Madrid’s electronics technology district. Antonietti and Canelli (2008) find that knowledge intensive services (i.e. more innovative intermediate products) tend to be contracted out more from within clusters.
Spatial clustering has also been found to improve the quality of input matching, particularly in the labor market (Helsley and Strange, 2002). Job mobility between firms in places like Silicon Valley enables better matching of employees to firms (Saxenian, 1994; Fallick et al., 2006; Gerlach et al., 2009). Geographic clustering also raises worker incentives to acquire industry-specific human capital (Rotemberg and Saloner, 2000), thereby lowering adverse selection problems for employers with regard to skill. These effects would obviously be more pronounced in skill-intensive, innovative sectors.
Geographic concentration and clustering is further premised on the ability for knowledge to spill-over between and among firms. Knowledge is not fully excludable and is subject to increasing returns in the aggregate (Lucas, 1988; Romer, 1990). Knowledge also has a tacit dimension, so that only the most codified knowledge can be instantaneously transmitted across distance without incurring significant transactions costs. Thus, clustering is required to mobilize this knowledge between and among firms. This has been dubbed “MAR” externalities – for the contributions of Marshall, Arrow and Romer - and highlight how proximity in physical space is required to facilitate more and better sharing of complex knowledge. Indeed, there is ample empirical evidence that similar firms co-produce a common stock of knowledge and know-how when they agglomerate and that this provides a key foundation of innovative spatial clusters. Firms in clusters tend to cite local knowledge at much higher rates when they apply for patents (Jaffe et al., 1993; Thomson and Fox-Kean, 2005).
Perhaps, the most common, and central, element of innovative and entrepreneurial ecosystems is the research university. The university is not only a source of quasi-excludable knowledge but a magnet for and trainer of talent, a provider of facilities and numerous other more material support (Bramwell and Wolfe, 2008). Universities themselves have a degree of indivisibility- a university campus cannot be scaled down until it is affordable for a single firm. It behooves firms to concentrate together around universities with relevant infrastructure.

MPI Working Paper Series: The City and Innovation (Adler, Florida, King & Mellander) 8
Universities seem to be heavily involved in spillovers; there is a higher rate of local patenting around universities even when firm localization is controlled for. The ability of clusters to make productive use of local knowledge, what Cohen and Levinthal (1990) dub “absorptive capacity,” seems to be improved when universities act as anchors (Agrawal and Cockburn, 2003). The localization of knowledge plays a key role in the spinoff and creation of new biotechnology firms (Zucker and Darby, 1996, 2014).
The non-excludability of knowledge applies to industries as much as it does individual firms. Individual innovations are often forged through the binding of intellectual strands that had previously been understood as separate. Jacobs (1969) points out that the brassiere was not invented by someone in the lingerie industry but by a dressmaker who was dissatisfied with how the female form accommodated her products. In the same way, innovative regions may rely on diverse knowledge bases. Jacobs herself is credited with originating this argument and it has had an enduring effect on spatial innovation studies. Duranton and Puga (2001) formalize this intuition in a model that shows how cities with diverse industrial bases are superior for firms as they experiment with new products, while specialized regions are better when products have matured.
A raft of empirical studies has established a relationship between urban diversity and knowledge spillovers, based on various measures of industrial composition (Feldman and Audretsch, 1999), urban size (Ó hUallicháin, 1999), cultural diversity (Florida and Gates, 2001) and density (Carlino et al., 2007). Part of this seems to be related to the faster ‘metabolism’ of bigger cities. Bettencourt et al. (2007) draw out this biological metaphor, showing that urban innovation exhibits increasing returns to scale that are common in natural systems. Similarly, Packalen and Bhattacharya (2015) show that inventions in large cities cite newer knowledge than inventions in small cities, but also that this differential has become less pronounced over time.
Generally speaking, then, research on the geography of innovation identifies two main drivers for the clustering of innovative and entrepreneurial activity: specialization à la Marshall and diversity à la Jacobs. Kemeny and Storper (2015) contend that further progress on this issue appears to have been held back by a lack of conceptual precision around what constitutes diversity and specialization.
Furthermore, this literature on the geography of innovation tends to focus on the distribution and organization of innovation across cities or metropolitan regions. One can think of this as the macro-geographic scale. This scale is useful because the metropolitan region is a scale that corresponds with the broad organization

MPI Working Paper Series: The City and Innovation (Adler, Florida, King & Mellander) 9
of economic activity in space, notably the size of the geographic market or commuting shed for the labor market.
Significantly, the metropolitan region is not the only meaningful scale at which innovative and entrepreneurial activity occur. Both Jacobs and Marshall thought of innovation occurring at a much smaller, fine-grained scale of the district or neighborhood level. This can be thought of as the micro-geography of innovation. And it is an area where far less empirical research has been done. Ellison and Glaeser (1997) point out that the tendency of firms and networks to bunch themselves within in urban regions may lead some observers to exaggerate the benefits of regional agglomeration. A growing body of empirical studies find that the geography of innovation occurs and benefits from clustering at smaller scales. Rosenthal and Strange (2008) show that human capital spillovers tend to decay after just five miles. High-tech sectors like software tend to exhibit even greater sensitivity to such clustering (Rosenthal and Strange, 2004). Significant information spillovers among advertising agencies in New York appear to be limited to roughly a kilometer (Arzaghi and Henderson, 2008). Experimental research finds clear evidence that productive collaboration is much more fruitful when participants are within thirty meters of one another (see Olson and Olson, 2003). The San Francisco Bay Area technology complex has been found to be made up of several distinctive technology spillover zones which only somewhat overlap (Kerr and Kominers, 2015). Research on the location of R&D laboratories finds that labs are located in a series of nested clusters across the Bay Area and Boston-New York-Washington corridor with laboratories clustered in tightly networked districts which do not exceed five miles (Carlino and Kerr, 2015). Research has also identified significant clustering of R&D labs and skilled science and technology workers in 5 and 10 mile clusters in leading metros in Northern California, Southern California and The Northeast (Buzard et al 2017). Research on patents finds them to be distributed within metro areas in both suburban and urban locations, but that the most novel and commercially important innovations are produced in dense urban clusters. Guzman and Stern (2015) find high-quality entrepreneurial activity to be highly clustered and increasingly concentrated in urban districts in San Francisco and Boston, two areas with among the highest innovation and entrepreneurial activity.
While the literature on the clustering and geography of innovation has dealt with these two geographic scales – the macro-geography of innovation at the metropolitan scale and the micro-geography of innovation at the district or neighborhood scale – it does not fully integrate the two, or more precisely, distinguish their roles, and how the two scales work together to shape the processes of innovation and entrepreneurship. This also leads to ambiguity over

MPI Working Paper Series: The City and Innovation (Adler, Florida, King & Mellander) 10
whether spatial diversity or specialization is more important to the clustering of innovative activity. We seek to integrate these two perspectives on the macro- and micro-geography of innovation and to lay out how the city broadly construed organized both levels and in doing so serves as a fundamental organizing unit for innovative and entrepreneurial activity.
Drawing from this broad literature on the geography of innovation, our central argument is that cities provide a fundamental organizing unit for the processes of innovation and entrepreneurial firm formation. We suggest that cities broadly organize these processes at multiple scales. At the macro-geographic scale, the metropolitan level brings together and organizes the labor market and talent; a wide array of firms that function as customers, end-users and suppliers; universities and knowledge institutions; and other key inputs. At the micro-geographic scale, the processes of innovation and entrepreneurship are shaped by much denser and more compact micro-clusters that operate at the district or neighborhood level, and harness the benefits of a deeper spatial divisions of labor. The density of clustering activity at this level is associated with a deepening of knowledge spillovers, input sharing, as well as superior labor market matching.
The Macro-Geography of Innovation We now turn to our findings. We begin at the macro-geographic scale, detailing the geographic distribution of innovative activities across global cities or metro areas.

MPI Working Paper Series: The City and Innovation (Adler, Florida, King & Mellander) 11
Figure 1: Venture Capital Investment across Global Cities and Metropolitan Areas
Source: Thomson Reuters, 2012.
Figure 1 charts the distribution of venture capital investment across the world’s leading cities or metropolitan areas. Our data identify 170 global metropolitan areas that had venture capital investment in high-tech startups in 2012.
San Francisco tops the list with nearly a fifth of the global total. And nearby, San Jose in the heart of Silicon Valley is second with more than 10 percent. Boston is third with 8.6 percent; New York is fourth (5.8 percent); and Los Angeles is fifth (3.9 percent). San Diego, London, Washington, D.C. Beijing, and Seattle round out the top ten.
Innovation, as measured by venture capital investment, is far more concentrated and clustered on a global scale than is population or economic output. The five leading global metros for venture capital investment account for nearly half (47.6 percent) of such investment compared to 3.3 percent of global economic output and just 0.8 percent of population. The top ten leading global metros for venture investment account for 56 percent of the global venture investment compared to 5 percent of global economic output and just 1.4 percent of population. And the top twenty global metros for venture capital investment account for roughly three quarters (73.5 percent) of such investment
MPI Working Paper Series: The City and Innovation (Adler, Florida, King & Mellander) 12
compared to roughly 8 percent of global economic output and just 3 percent of population.
There is some overlap with venture capital investment centers and broader rankings of global cities, though the connection is not one to one (Florida and King, 2016). New York, the world’s most economically powerful global city, is fourth for venture-capital investment. London, the world’s second leading global city has the seventh largest amount of venture capital investment. And, Paris, which is the fifth leading global city ranks sixth for venture capital investment. But, Greater San Francisco—which is far and away the world’s leading venture-capital center—only ranks as the world’s 23rd leading global city. Furthermore, Tokyo which is the third leading global city ranks just 54th in venture capital investment, while Hong Kong which is the fourth most significant global city ranks 107th in venture capital investment. Overall, 12 of the world’s 25 leading cities rank among the top 25 centers for venture capital investment; and 15 of the top 25 global cities rank among the world’s top 60 venture-capital centers. The global leaders in innovation and entrepreneurship benefit from a combination of size, significant knowledge-based institutions, and dense innovative and entrepreneurial ecosystems.
We now turn to the geographic distribution of venture capital investment across US metropolitan areas. Nearly half of US metros (49 percent) received venture capital investment in 2013, according to our data. Figure 2 shows the distribution of venture capital investment across US metros.

MPI Working Paper Series: The City and Innovation (Adler, Florida, King & Mellander) 13
Figure 2: Venture Capital Investment across US Metros
Source: Thomson Reuters, 2013.
The San Francisco metro accounts for far and away the largest concentration venture capital investment with approximately a quarter of the national total. Nearby San Jose is second with 15 percent of national total. New York is third with 10 percent, Boston is fourth with 9.5 percent, and Los Angeles is fifth with 5 percent. Overall, venture capital investment is highly concentrated in a small number of metros across the United States, with the top ten metros accounting for more than three-quarters (77.6 percent) of it and just the top five accounting for almost two-thirds (64.3 percent).
We now turn to the metro-level geography of venture capital investment in digital industries. These industries, which span software, media and entertainment, and information technology accounted for more than half (51.8 percent) of all US venture capital investment in 2013.
Venture capital investment in digital industries is even more concentrated and clustered at the metro level. The San Francisco metro accounts for almost 30 percent of all digital venture capital investment (compared to 25 percent for all industries), amounting to 60 percent of all venture capital investment in the San Francisco metro. The San Jose metro is second with 17.5 percent of all digital

MPI Working Paper Series: The City and Innovation (Adler, Florida, King & Mellander) 14
investment (compared to 14.5 percent for all industries), which represents more than 60 percent of the metro’s total venture capital investment. Overall, venture capital investment in digital industries is even more concentrated than venture capital investment in all industries. The top ten metros account for more than 80 percent of investment in digital industries (compared to roughly 75 percent for all industries), and the top twenty metros account for more than 90 percent of investment in digital industries (compared to 87 percent of all venture capital investment).
Table 1: Leading US Metros for Digital Venture Capital Investment
Rank Metro* Digital Venture Capital ** All Venture Capital **
Amount Share of Metro
Share of All Digital Amount Share of Total
1 San Francisco $5,083 60.0% 29.7% $8,468 25.3% 2 San Jose $2,983 61.3% 17.5% $4,865 14.5% 3 New York $1,780 53.4% 10.4% $3,335 10.0% 4 Boston $1,063 33.2% 6.2% $3,199 9.5% 5 Los Angeles $918 54.2% 5.4% $1,695 5.1%
6 Washington DC $597 47.1% 3.5% $1,268 3.8%
7 Seattle $499 57.1% 2.9% $873 2.6% 8 Atlanta $412 80.2% 2.4% $514 1.5% 9 Austin $295 62.0% 1.7% $475 1.4%
10 Miami $271 82.4% 1.6% $329 1.0% 11 Chicago $269 41.3% 1.6% $650 1.9% 12 Philadelphia $190 38.4% 1.1% $495 1.5% 13 San Diego $189 20.0% 1.1% $944 2.8% 14 Denver $189 49.6% 1.1% $380 1.1% 15 Dallas $183 25.0% 1.1% $734 2.2%
16 Santa Barbara $178 71.1% 1.0% $250 0.8%
17 Phoenix $127 86.3% 0.7% $147 0.4% 18 Baltimore $106 44.8% 0.6% $237 0.7% 19 Portland $103 58.4% 0.6% $177 0.5%
20 Minneapolis-St. Paul $93 30.1% 0.5% $309 0.9%
Top 10 Metros $13,901 55.6% 81.3% $25,021 74.6% Top 20 Metros $15,527 52.9% 90.8% $29,344 87.5%
Notes: Metro names are abbreviated, *Millions of US dollars. Source: Thomson Reuters 2013.

MPI Working Paper Series: The City and Innovation (Adler, Florida, King & Mellander) 15
The Micro-Geography of Innovation
We now turn to the second scale of the geography of innovation, its micro-geography. Indeed, innovative and entrepreneurial activity not only requires the spatial organization of inputs at the broad metropolitan level, but are organized and shaped by the spatial organization of key inputs at the micro-level as well. As we have seen, unban theory dating back to Marshall and Jacobs notes that it occurs in denser, more tightly linked and connected micro-clusters of innovative and entrepreneurial activity.
To understand this we examine the distribution of venture capital investment in high-tech startup companies across US postal codes or zip codes. Our data identify such venture capital investment in less than four percent (3.9 percent) of all US zip codes (1,339 of 33,144 zip codes). Zip codes delineate neighborhoods or districts that encompass clusters of business, industrial, commercial and residential activity, and as such provide the best available unit of analysis for examining the micro-clustering of innovative and entrepreneurial activity.
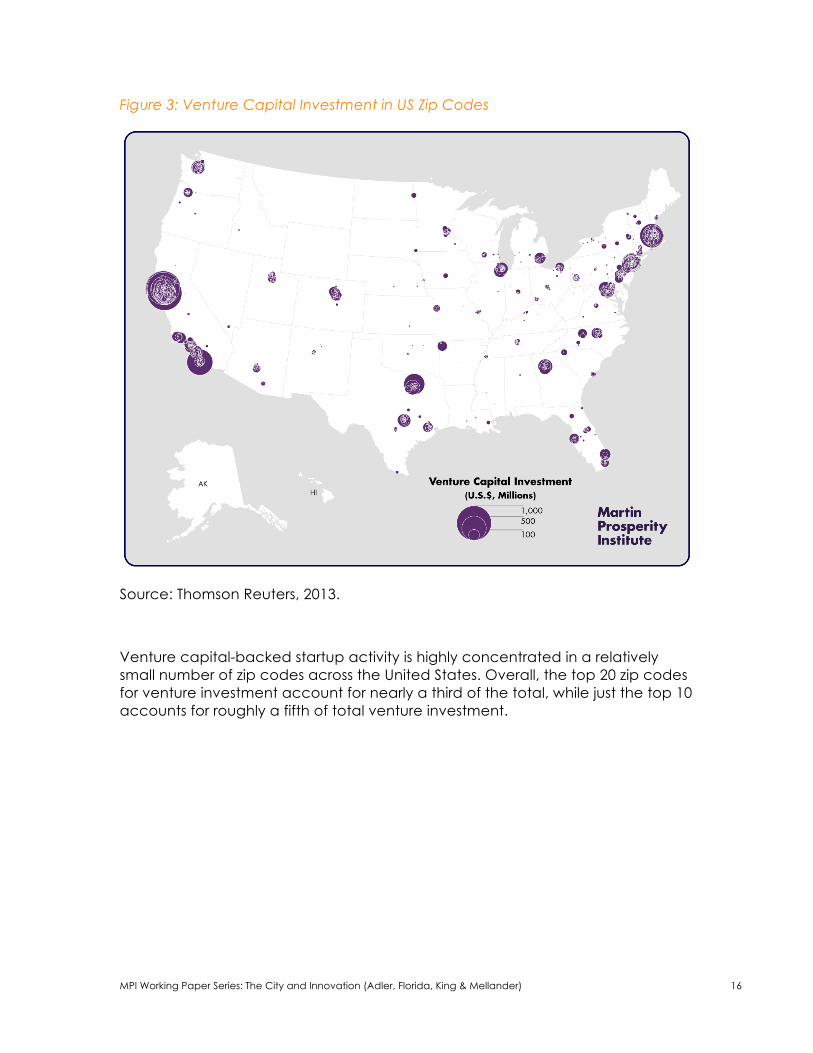
Figure 3 maps the location of capital investment by zip code across the United States in 2013. Large levels of investment are in the San Francisco Bay Area, around Los Angeles and San Diego in Southern California, and in the East Coast along the New York-Boston-Washington Corridor.
MPI Working Paper Series: The City and Innovation (Adler, Florida, King & Mellander) 16
Figure 3: Venture Capital Investment in US Zip Codes
Source: Thomson Reuters, 2013.
Venture capital-backed startup activity is highly concentrated in a relatively small number of zip codes across the United States. Overall, the top 20 zip codes for venture investment account for nearly a third of the total, while just the top 10 accounts for roughly a fifth of total venture investment.

MPI Working Paper Series: The City and Innovation (Adler, Florida, King & Mellander) 17
Figure 4: Venture Capital Investment in the Three Leading Metro Regions

MPI Working Paper Series: The City and Innovation (Adler, Florida, King & Mellander) 18
Source: Thomson Reuters, 2013.

MPI Working Paper Series: The City and Innovation (Adler, Florida, King & Mellander) 19
Figure 4 maps the micro-clustering of venture capital investment within the three metros which account for the largest shares of venture capital investment in the United States: the San Francisco Bay Area, the New York metro and the Boston-Cambridge metro. Note the significant micro-level clustering of innovative and entrepreneurial activity within each of these metros.
In the San Francisco Bay Area, there are distinct clusters of venture capital investment in and around downtown San Francisco and around the University of California San Francisco and in Silicon Valley, particularly in and around Palo Alto, close to Stanford University. In the Boston-Cambridge metro there are significant clusters of venture capital investment in and around downtown Boston and in Cambridge in close proximity to MIT and Harvard. In the New York metro, we find substantial clustering of venture capital investment and startup activity around Lower Manhattan.
We also compare the locations of venture capital investment to two measures of urbanity– household density and commute to work. We classify zip codes using household density based on a methodology devised by Kolko (2015) which classifies urban areas as those with 2,213.2 households per square mile; suburban areas have between 101.6 and 2,213.2 households per square mile and rural areas have less than 101.6 households per square mile. Of the 1,301 zip codes that receive venture capital investment roughly 40 percent (38.6 percent or 501) are urban, 44.3 percent (718) are suburban, and just four percent (49) are rural.
We also compare the density of zip codes with venture capital investment to zip codes without venture capital investment and to all US zip codes in 2013. The zip codes with venture capital investment have significantly higher densities and higher shares of commuters who bike, walk or transit to get to work. All zip codes with venture investment have a density of 3,065 households per square mile compared to a density of 401 households per square mile for zip codes without venture capital investment. The top fifty zip codes for venture capital investment have a household density of 3,379 households per square mile. The top ten zip codes for venture capital investment have a density of 3,890.
A similar urbanized pattern can be seen in looking at the data on commuting. Using data from the American Community Survey’s 2013 five-year estimate, we examine zip codes by the share of commuters who walk, bike, or use transit to get to work versus those who drive to work (American Community Survey 2013). Zip codes where more people walk or bike to work are by definition located closer to central business districts and commercial areas, while zip codes where more people use transit to get to work are located around transit hubs, which also by definition require greater density. Conversely, zip codes where people use cars to get to work are less dense, more sprawling and more suburban.
In zip codes with venture capital investment, 16.6 percent of commuters walk, bike, or use transit to get to work, compared to 8.4 percent in all zip codes and 4.9 percent in zip codes without venture capital. In the top fifty zip codes with venture capital, 17.9 percent of commuters walk, bike or take transit to work. In

MPI Working Paper Series: The City and Innovation (Adler, Florida, King & Mellander) 20
the top ten, 33.9 percent do so. The differences between zip codes with venture capital investment and those without are statistically significant based on T-tests.
Taken together, our zip code level data provide clear evidence of the micro-clustering of innovative and entrepreneurial activity within metros, as well as its macro-level clustering across metros. We now turn to the micro-clustering of digital industries at the neighborhood or district level. Table 2 lists the top 20 zip codes for venture capital investment in digital industries.
Table 2: Leading Zip Codes for Digital Venture Capital Investment
Rank Zip Code Neighborhood* Metro** Density*** Digital Venture Capital Investment
Amount****
As Share of All Venture Capital in Zip Code
As Share of All Digital Venture
Capital
1 94105 Rincon Hill San Francisco 9,718 $904 90.1% 5.3%
2 94103 South of
Market/Mission District
San Francisco 9,659 $899 85.1% 5.3%
3 94301 Palo Alto San Jose 3,194 $881 88.2% 5.2%
4 94107 Potrero Hill/
Dogpatch/South Beach
San Francisco 7,665 $707 79.9% 4.1%
5 94104 Financial District San Francisco 2,654 $357 74.3% 2.1%
6 2451 Waltham Boston-Cambridge 1,359 $333 68.8% 2.0%
7 94108 Chinatown San Francisco 28,252 $261 100.0% 1.5%
8 94111 Embarcadero / Financial District
San Francisco 6,875 $236 77.0% 1.4%
9 94041 Old Mountain View San Jose 3,899 $230 58.5% 1.3%
10 10010 Gramercy/Flatiron New York 42,343 $211 80.8% 1.2%
11 94022 Los Altos Hills San Jose 405 $211 94.8% 1.2%
12 94065 Redwood Shores San Francisco 1,946 $210 56.8% 1.2%

MPI Working Paper Series: The City and Innovation (Adler, Florida, King & Mellander) 21
Note: * Neighborhoods in italics are suburban based on household density. **Metro names are abbreviated. *** In households per square mile. **** Millions of US dollars.
Source: Thomson Reuters, 2013.
Venture capital investment in digital industries is even more concentrated at the zip code or neighborhood level. Top ten zip codes for digital venture capital account for 30 percent of investment (compared to 20 percent for the top ten zip codes for overall venture capital investment); the top twenty zip codes for digital venture capital investment account for more than 40 percent of the total (compared to less than a third for the top twenty for all venture capital investment). The two leading zip codes for digital venture capital investment are located in dense, highly urbanized neighborhoods of San Francisco. Indeed, so are ten of the top twenty zip codes with seven mainly in around its downtown, and New York City, which has three all in Lower Manhattan. Our data on venture capital investment in digitally related industries suggest that it is even more concentrated in micro-clusters in and around dense urban areas.
We now look at the micro-clustering of venture capital investment in Sweden. Sweden has a high level of innovative and entrepreneurial activity, ranking second on the Global Innovation Index (World Intellectual Property Organization
13 94085 Sunnyvale San Jose 2,199 $206 58.8% 1.2%
14 94043 Mountain View San Jose 1,158 $206 51.2% 1.2%
15 10012 SoHo/NYU New York 41,294 $205 66.0% 1.2%
16 10001 Chelsea New York 17,763 $204 83.6% 1.2%
17 94404 Foster City San Francisco 3,223 $204 91.8% 1.2%
18 94040 Cuesta
Park/Blossom Valley
San Jose 3,735 $189 75.8% 1.1%
19 95054 Santa Clara (North) San Jose 1,348 $187 59.7% 1.10%
20 30338 Dunwoody Atlanta 1,463 $179 100.0% 1.1%
Top 10 Zip Codes $5,018 29.4%
Top 20 Zip Codes $7,019 41.1%

MPI Working Paper Series: The City and Innovation (Adler, Florida, King & Mellander) 22
2017), and is home to a number of leading digital innovation start-ups In total, 100 registered venture capital investments were made in Swedish firms distributed across 91 companies (in nine of the cases, the company received an investment both in 2012 and 2013). The primary industry of investment was software publishers which accounted for approximately 57 percent of the investments.
We track Swedish venture capital investments across three geographic scales: (1) 72 metro areas based on labor market areas, (2) 290 municipalities which are essentially subdivisions within these metro areas, and (3) 9,700 postal codes across the 290 municipalities. Out of the 72 metros, only 19 were home to a company that received venture capital investment.
Table 3 shows the breakdown of venture capital investment across Swedish metro areas
Table 3: Venture Capital Investment in Swedish Metros
Metro Venture Capital Investment Digital Venture Capital
Investment Amount* Share Amount* Share Stockholm $572.04 75.9% $493.15 83.2% Malmö/Lund $70.13 9.3% $47.12 7.9% Göteborg $40.99 5.4% $6.33 1.1% Total for 3 metros $683.16 90.6% $546.60 92.2%
Total $754.21 100% $593.01 100%
Note: *millions of US dollars. Source: Thomson Reuters, 2013.
Stockholm is the leading center for venture capital investment by far, accounting for more than three-fourths of all investments compared to just 26 percent of the population. Stockholm is home to several globally successful digital startups, including Skype, Minecraft and Candy Crush. Stockholm is also home to Kista – the number one ICT cluster in Sweden. Kista also hosts departments related to Stockholm University and The Royal Institute of Technology. The Stockholm region also includes Uppsala, a major university town.
The Malmö-Lund region is second with 9.3 percent of venture capital investment, which is a smaller share of the population (11.5 percent). It is worth noting here that the labor market is extensive and also covers fewer municipalities. The core of the Malmö region is closely connected by bridge to the Copenhagen region, which is itself the size of Stockholm. It is a high-tech region, which includes the city of Lund, home to Lund University, one of the biggest universities in the Nordic countries and founded in 1666. The university is the location of e.g. MAX IV

MPI Working Paper Series: The City and Innovation (Adler, Florida, King & Mellander) 23
Laboratory which is world leading in synchrotron radiation. Near Lund University we also find IDEON Science Park and Medicon Village - both with strong university ties. Lund is also the future home for the European Spallation Source, a collaboration among more than 10 EU countries spanning bio-technology, information technology, telecommunication and more.
Gothenburg is third with roughly five percent of Swedish venture capital investments. It is an advanced manufacturing region and home to Volvo, but also the location of Chalmers University of Technology, one of the most recognized technical universities in the country.
These three regions account for 90 percent of venture capital investment in Sweden compared to 57 percent of economic output or GDP, and 48 percent of the population. The remaining 16 labor metros account for less than 10 percent of venture capital investment, while being home to the remaining 52 percent of the population.
The pattern is even more clustered and concentrated when for venture capital-backed startups in digital innovation industries. Roughly 80 percent of all Swedish venture capital investment was in digital industries. Two regions – Stockholm and Malmö/Lund - account for more than 90 percent of venture capital investment in digital startups in Sweden, Stockholm with more than 80 percent and Malmö/Lund with roughly 8 percent.
Venture capital investment is even more concentrated within metros at the city or municipal levels. Table 4 shows the distribution of venture capital investments in municipalities for the Stockholm and Malmö-Lund metros. Stockholm and Lund municipality together account for 10 percent of the population but more than three-quarters of venture capital investment.
Table 4: Venture Capital Investment Municipalities in the Stockholm and Malmö/Lund Metros
Metro
Municipality
Venture Capital Investment Digital Venture
Capital Investment Amount* Share Amount* Share
Stockholm Stockholm $515.47 90.1% $463.92 94.1%
Danderyd $21.00 3.7% $21.00 4.3% Solna $17.95 3.1% $0 0% Uppsala $13.64 2.4% $4.25 0.9% Täby $2.14 0.4% $2.14 0.4% Lidingö $1.84 0.3% $1.84 0.4% Total $572.04 100% $493.15 100%
Malmö/Lund Lund $58.57 83.5% $40.79 86.6%

MPI Working Paper Series: The City and Innovation (Adler, Florida, King & Mellander) 24
Malmö $6.33 9.0% $6.33 13.4% Eslöv $3.86 5.5% $0 0% Helsingborg $1.37 2.0% $0 0% Total $70.13 100% $47.12 100%
Note: *in millions of US dollars. Source: Thomson Reuters, 2013. Venture capital investment is not only concentrated in Stockholm and Malmo-Lund, it is concentrated within them. Across the two metros, just 10 of a total of 64 municipalities are home to firms that received venture capital investment. In Stockholm, just six of 36 municipalities have venture capital investment; and Malmö/Lund the figure is four in 28.
This investment is massively concentrated in micro-clusters within these two regions. Ninety percent of all venture capital investment in the Stockholm metro went to the city of Stockholm. More than eighty percent of venture capital investment in the Malmö/Lund metro are concentrated in Lund while 9 percent goes to Malmö.
Again, we find the pattern to be even more clustered and concentrated for digital startups. In the Stockholm metro, nearly 95 percent of venture capital investments in digitally related startups went to the city of Stockholm; and Malmö/Lund region, almost 85 percent went to Lund.
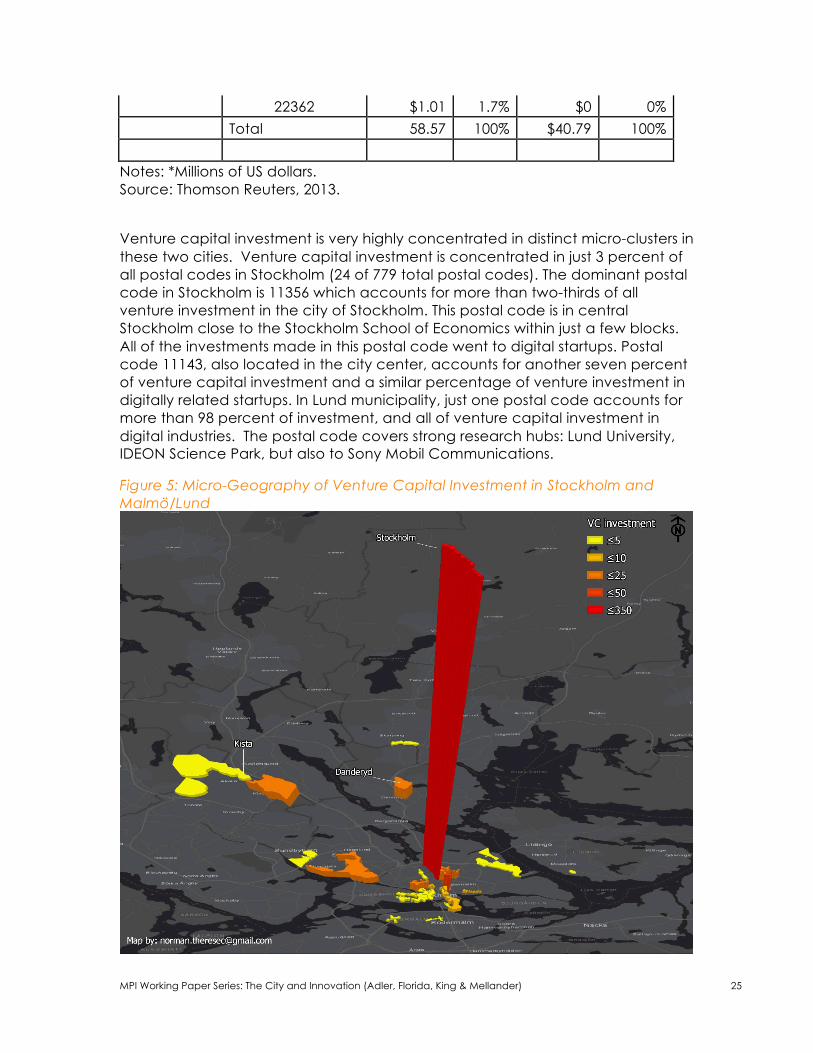
Venture capital investment is once again concentered at the neighborhood or postal code level as Table 5 Illustrates. Figures 5 charts this, mapping the extreme micro-clustering of venture capital investment in these two regions.
Table 5: Venture Capital Investment by Postal Codes in Stockholm and Lund
Municipality
Postal Code
Venture Capital Investment
Digital Venture Capital Investment
Amount* Share Amount* Share
Stockholm 11356 $350.00 67.9% $350.00 75.6%
11143 $37.80 7.3% $37.80 8.2% 11426 $20.10 3.9% $0.00 0% 11123 $19.30 3.7% $19.30 4.2% 16440 $15.80 3.1% $10.30 2.20% 11130 $8.70 1.7% $8.70 1.9% 11144 $6.70 1.3% $0.0 0%
Total of 7 postal codes $458.40 89.0% $426.10 92.0%
Total $515.50 100% $463.20 100%
Lund 22363 $57.56 98.3% $40.79 100%
MPI Working Paper Series: The City and Innovation (Adler, Florida, King & Mellander) 25
22362 $1.01 1.7% $0 0% Total 58.57 100% $40.79 100%
Notes: *Millions of US dollars. Source: Thomson Reuters, 2013.
Venture capital investment is very highly concentrated in distinct micro-clusters in these two cities. Venture capital investment is concentrated in just 3 percent of all postal codes in Stockholm (24 of 779 total postal codes). The dominant postal code in Stockholm is 11356 which accounts for more than two-thirds of all venture investment in the city of Stockholm. This postal code is in central Stockholm close to the Stockholm School of Economics within just a few blocks. All of the investments made in this postal code went to digital startups. Postal code 11143, also located in the city center, accounts for another seven percent of venture capital investment and a similar percentage of venture investment in digitally related startups. In Lund municipality, just one postal code accounts for more than 98 percent of investment, and all of venture capital investment in digital industries. The postal code covers strong research hubs: Lund University, IDEON Science Park, but also to Sony Mobil Communications.
Figure 5: Micro-Geography of Venture Capital Investment in Stockholm and Malmö/Lund

MPI Working Paper Series: The City and Innovation (Adler, Florida, King & Mellander) 26
Source: Thomson Reuters, 2013.
Our analysis of the Swedish case not only provides additional evidence of the micro-geographic clustering of venture capital investment, but provides even clearer evidence of the clustering of these activities at the macro-level (across metros) as well as the micro-level (at the district or neighborhood scale within metros) and of how these two types of geographic scale work together to shape innovative and entrepreneurial activity.
Discussion and Conclusion We started from the basic contention that the city has emerged as a key organizing unit for innovation and entrepreneurship. The innovation literature has typically privileged the firm as the unit of analysis. And as geography has been brought into the picture it has typically been posed as a container for innovative and entrepreneurial firms. We argued that the city should be viewed not only as a container for clusters of innovative and entrepreneurial activity, but increasingly as the fundamental organizing unit or platform for these activities.

MPI Working Paper Series: The City and Innovation (Adler, Florida, King & Mellander) 27
We argued that the geography or clustering is relevant at two scales of innovative and entrepreneurial activity. At the macro level, across the world and within nations, highly innovative and entrepreneurial activity is heavily concentrated among metros that provide assets and capacity in form of diverse pools of talent, diverse groups of firms, leading-edge research universities and knowledge institutions and other factors. At the micro-level, within these leading metro regions, innovative and entrepreneurial activity is clustered and concentrated in considerably denser and more tightly-woven micro-clusters at the district or neighborhood scale.
We examined these questions and hypotheses using unique data on commercially relevant innovative and entrepreneurial activity based on venture capital investments in startup companies. We looked at investments in all high-tech startups and investments in digital industries. We examined the pattern of macro-level clustering across global cities and metros, and across US and Swedish cities and metro areas. We then examined the pattern of micro-level clustering at the zip code or postal code level for the US and Sweden.
Our findings document the clustering of innovative and entrepreneurial activities at both scales and suggest that each of these scales is important to innovative and entrepreneurial activity. Although both academic writing and the conventional wisdom suggest that digital technologies and digital industries would overcome the constraints of distance and enable firms and talent to spread over larger distances, our analysis of digital startups find them to be extremely clustered at both the macro- and micro-geographic scales. Indeed, we find the digitally related industries to be even more concentered and clustered than venture capital-backed startups per se.
Furthermore, our findings document the critical role of micro-level clustering, which is in line with economic and urban theorizing, but which has not been the subject of a great deal of previous empirical research, which has focused mainly on metro-level patterns. But, as Jacobs and Marshall long ago theorized and as Kerr and Kominers (2014) more recently point out, the actual mechanism that motivate and shape clustering operate at a far smaller and more localized scale than the city or metro region.
We observe clustering at two levels, pointing to different underlying mechanisms. At the macro-level, certain subset of metros provide more of the key inputs - like talent, research universities and knowledge institutions, global gateway airports that connect to other key global cities, a diverse array of end-user, related and supplier companies, and other factors - that are broadly required for innovative and entrepreneurial activities. At the micro-level, however, innovative and entrepreneurial activities are then extremely clustered and concentrated in

MPI Working Paper Series: The City and Innovation (Adler, Florida, King & Mellander) 28
particular neighborhoods or districts that enable the proximity, density, knowledge-sharing, networking, face-to-face communication, combination and recombination of knowledge, and talent and ideas, which are required for innovation. To some extent, it can be said that macro-level clustering reflects Jacobs-like mechanisms, while micro-geographic clustering reflects Marshallian dynamics. In any event, rather than emphasize one over the other, the two seem to work together across these two geographic scales. Our work suggests that these mechanisms are not opposed, but that they work in conjunction with one another to constitute an urban innovation platform.
Ultimately, our findings suggest that the city is a key factor in the organization of both innovative and entrepreneurial research. Indeed, it’s time to put the city – that is place and space – at the center of research on innovation and entrepreneurship. That said, our research is just a start. We encourage more and further research to look at the centrality of space and place to innovative and entrepreneurial activity and the ways that different scales of geography act on and condition innovation and entrepreneurship. In particular, we encourage more research into the micro-geography of innovation and entrepreneurship focusing on the factors and mechanisms that stand behind and shape their continued clustering at this micro-geographic scale.

MPI Working Paper Series: The City and Innovation (Adler, Florida, King & Mellander) 29
Bibliography Acs, Z. J., Anselin, L., Varga, A. (2002) “Patents and Innovation Counts as Measures of Regional Production of New Knowledge,” Research Policy, 31(7), 1069-1085. Aghion and Howitt (1992) “A Model of Growth through Creative Destruction,”, Econometrica, 60, 323-351 Agrawal, A., Cockburn, I. (2003) The Anchor Tenant Hypothesis: Exploring the Role of Large, Local, R&D-Intensive Firms in Regional Innovation Systems, International Journal of Industrial Organization, 21(9), 1227-1253. Antonietti, R., Cainelli, G. (2011) “Spatial Agglomeration and Vertical Disintegration of Knowledge Intensive Business Services in Lombardy,” Paper presented at the DIME Final Conference, 2, 8. Arrow, K. J. (1971) General Competitive Analysis, San Francisco: Holden-Day. Arzaghi, M., Henderson, J. V. (2008) “Networking Off Madison Avenue,” The Review of Economic Studies, 75(4), 1011-1038. Audretsch, D. B., Feldman, M. P. (1996) “R&D Spillovers and the Geography of Innovation and Production,” The American Economic Review, 86(3), 630-640. Belussi, F., Caldari, K. (2008) “At the Origin of the Industrial District: Alfred Marshall and the Cambridge School,” Cambridge Journal of Economics, 33(2), 335-355. Bettencourt, L. M., Lobo, J., Helbing, D., Kühnert, C., West, G. B. (2007) “Growth, Innovation, Scaling, and the Pace of Life in Cities,” Proceedings of the national academy of sciences, 104(17), 7301-7306. Bramwell, A., Wolfe, D. A. (2008) “Universities and Regional Economic Development: The entrepreneurial University of Waterloo,” Research policy, 37(8), 1175-1187. Buzard, K., Carlino, G. A., Hunt, R. M., Carr, J. K., Smith, T. E. (2017) “The Agglomeration of American R&D Labs,” forthcoming in Journal of Urban Economics. Caloghirou, Y., Ioannides, S., Vonortas, N. S. (2003) “Research Joint Ventures,” Journal of Economic Surveys, 17(4), 541-570. Carlino, G. A., Chatterjee, S., Hunt, R. M. (2007) “Urban Density and the Rate of Invention,” Journal of Urban Economics, 61(3), 389-419.

MPI Working Paper Series: The City and Innovation (Adler, Florida, King & Mellander) 30
Carlino, G. A., Carr, J., Hunt, R. M., Smith, T. E. (2012) “The Agglomeration of R & D Labs (No. 12-22),” Federal Reserve Bank of Philadelphia, Available at: https://www.philadelphiafed.org/-/media/research-and-data/publications/working-papers/2012/wp12-22.pdf?la=en Carlino, G., Kerr, W. R. (2015) “Agglomeration and Innovation”, in Duranton, G., Henderson, J. V., Strange, W. C. (eds) Handbook of Regional and Urban Economics, Vol. 5, 349-404. Chatterji, A., Glaeser, E., Kerr, W. (2014) “Clusters of Entrepreneurship and Innovation,” Innovation Policy and the Economy, 14(1), 129-166. Chen, H., Gompers, P., Kovner, A., Lerner, J. (2010) “Buy Local? The Geography of Venture Capital,” Journal of Urban Economics, 67(1), 90-102. Cohen, W. M., Levinthal, D. A. (1990) “Absorptive capacity: A New Perspective on Learning and Innovation,” Administrative Science Quarterly, 35(1), 128-152. D’Aspremont, C., Jacquemin, A. (1988) “Cooperative and Noncooperative R&D in Duopoly Spillovers,” The American Economic Review, 78(5), 113-1137. Duranton, G., Puga, D. (2001) “Nursery Cities: Urban Diversity, Process Innovation, and the Life Cycle of Products,” American Economic Review, 91(5), 1454-1477. Duranton, G., Puga, D. (2004) Micro-Foundations of Urban Agglomeration Economies, in Henderson, J.V. Thisse, J-F. (eds) Handbook of regional and urban economics, 4, 2063-2117. Ellison, G., Glaeser, E. L. (1997) “Geographic Concentration in US Manufacturing Industries: A Dartboard Approach,” Journal of political economy, 105(5), 889-927.. Fallick, B., Fleischman, C. A., Rebitzer, J. B. (2006) “Job-hopping in Silicon Valley: Some Evidence Concerning the Microfoundations of a High-Technology Cluster,” The Review of Economics and Statistics, 88(3), 472-481. Feldman, M. P., Florida, R. (1994) “The Geographic Sources of Innovation: Technological Infrastructure and Product Innovation in the United States”, Annals of the Association of American Geographers, 84(2), 210-229. Feldman, M. P., Audretsch, D. B. (1999) “Innovation in Cities: Science-Based Diversity, Specialization and Localized Competition”, European Economic Review, 43(2), 409-429. Florida, R. L., Kenney, M. (1988) “Venture Capital-Financed Innovation and Technological Change in the USA,” Research Policy, 17(3), 119-137. Florida, R., Gates, G. (2001) “Technology and Tolerance: The Importance of Diversity to High-Tech Growth,” Brookings Institution, Center for Urban and

MPI Working Paper Series: The City and Innovation (Adler, Florida, King & Mellander) 31
Metropolitan Policy, Washington, DC, Available at: https://www.brookings.edu/wp-content/uploads/2016/06/techtol.pdf Florida, R. (2005) “The World is Spiky,” Atlantic Monthly, 296(3), 48-51. Florida, R., Gulden, T., Mellander, C. (2008) “The Rise of the Mega-Region,” Cambridge Journal of Regions, Economy and Society, 1(3), 459-476. Florida, R., King, K. (2016) “Rise of the Global Startup City: The Geography of the Venture Capital Investments in Cities and Metros across the Globe”, Martin Prosperity Institute Report, Available at: http://martinprosperity.org/content/rise-of-the-global-startup-city/ Gaetani, R., Berkes, E. (2015) “The Geography of Unconventional Innovation,” 2015 Meeting Papers (No. 896), Society for Economic Dynamics. Gerlach, H., Rønde, T., Stahl, K. (2009) “Labor Pooling in R&D Intensive Industries,” Journal of Urban Economics, 65(1), 99-111. Griliches, Z. (1957) “Hybrid Corn: An Exploration in the Economics of Technological Change,” Journal of the Econometric Society, 25(4), 501-522. Grossman, G., M., Helpman, E. (1993) Innovation amd Growth in the Global Economy, Cambridge, MA: MIT Press. Guzman, J., Stern, S. (2015) “Where is Silicon Vally?,” Science, 347(6222), 606-609. Helsley, R. W., Strange, W. C. (2002) “Innovation and Input Sharing,” Journal of Urban Economics, 51(1), 25-45. Jacobs, J. (1969) The Economy of Cities, New York: Random House. Jacobs, J. (1984) Cities and the Wealth of Nations, New York: Random House. Jaffe, A. B., Trajtenberg, M., Henderson, R. (1993) “Geographic Localization of Knowledge Spillovers as Evidenced by Patent Citations,” The Quarterly Journal of Economics, 108(3), 577-598. Kemeny, T., Storper, M. (2015) “Is Specialization Good for Regional Economic Development?. Regional Studies,” 49(6), 1003-1018. Kelly, M., Hageman, A. (1999) “Marshallian Externalities in Innovation,” Journal of Economic Growth, 4(1), 39-54. Kerr, W. R., Kominers, S. D. (2015) “Agglomerative Forces and Cluster Shapes,” Review of Economics and Statistics, 97(4), 877-899. Klein, B. H. (1977) Dynamic Economics, Cambridge, MA: Harvard University Press.

MPI Working Paper Series: The City and Innovation (Adler, Florida, King & Mellander) 32
Klepper, S. (1996) “Entry, Exit, Growth, and Innovation over the Product Life Cycle,” The American Economic Review, 86(3), 562-583. Kogut, B., Zander, U. (1992) “Knowledge of the Firm, Combinative Capabilities, and the Replication of Technology,” Organizational Science, 3(3), 383-397. Krugman, P. (1991) “History and Industry Location: The Case of the Manufacturing Belt,” The American Economic Review, 81(2), 80-83. Krugman, P. (1998) “What's New About the New Economic Geography?,” Oxford Review of Economic Policy, 14(2), 7-17. Levinthal, D. A., March, J. G. (1993) “The Myopia of Learning,” Strategic Management Journal, 14(S2), 95-112. Lucas, R. E. (1988) “On the Mechanics of Economic Development,” Journal of Monetary Economics, 22(1), 3-42. Marshall, A. (1890) Principles of Economics, 8th ed., Macmillan, London. Marx, K. (1867/2012) Das Kapital: A Critique of Political Economy, New York: Regnery. Marx, K. (1939/1993) The Grundrisse, London: Penguin. Nelson, R. R., Winter, S. G. (1982) An Evolutionary Theory of Economic Change, Cambridge, MA: Harvard University Press. Nelson, R. R. (1996) The Sources of Economic Growth, Cambridge, MA: Harvard University Press. Olson, G., Olson, J. (2003) “Mitigating the Effects of Distance on Collaborative Intellectual Work,” Economics of Innovation and New Technology, 12(1), 27-42. Ó hUallicháin, B. (1999) “Patent Places: Size Matters,” Journal of Regional Science, 39(4), 613-636. Packalen, M., Bhattacharya, J. (2015) “Cities and Ideas,” National Bureau of Economic Research Working Paper No 20921, Available at: http://www.nber.org/papers/w20921. Peltokorpi, V. (2017) “Absorptive capacity in foreign subsidiaries: The effects of language-sensitive recruitment, language training, and interunit knowledge transfer,” International Business Review, 26(1), 119-129. Porter, M. E. (2000) “Location, Competition, and Economic Development: Local Clusters in a Global Economy”, Economic Development Quarterly, 14(1), 15-34.

MPI Working Paper Series: The City and Innovation (Adler, Florida, King & Mellander) 33
Rama, R., Ferguson, D., Melero, A. (2003) “Subcontracting Networks in Industrial Districts: The Electronics Industries of Madrid,” Regional Studies, 37(1), 71-88. Romer, P. M. (1990) “Endogenous technological change,” Journal of Political Economy, 98(5, Part 2), S71-S102. Rosenthal, S. S., Strange, W. C. (2008) “The Attenuation of Human Capital Spillovers,” Journal of Urban Economics, 64(2), 373-389. Rosenthal, S. S., Strange, W. C. (2004) “Evidence on the Nature and Sources of Agglomeration Economies,” in Henderson, J. V., Thisse, J-F. (eds) Handbook of Regional and Urban Economics, Vol 4, 2119-2171. Rotemberg, J. J., Saloner, G. (2000) Competition and Human Capital Accumulation: A Theory of Interregional Specialization and Trade,” Regional Science and Urban Economics, 30(4), 373-404. Saxenian, A. (1994) Regional Networks: Industrial Adaptation in Silicon Valley and Route 128, Cambridge: Harvard University Press. Schumpeter, J. A. (1934a) Capitalism, Socialism, and Democracy, London: Allen and Unwin. Schumpeter, J. A. (1934b) The Theory of Economic Development: An Inquiry Into Profits, Capital, Credit, Interest, and the Business Cycle, Cambridge, MA: Harvard University Press. Schumpeter, J. A. (1954) History of Economic Analysis, New York: Psychology Press. Scott, A.Storper, M. (2003) “Regions, Globalization, Development”, Regional Studies, 37(6-7), 579-593. Solow, R. M. (1956) “A Contribution to the Theory of Economic Growth,” The Quarterly Journal of Economics, 70(1), 65-94. Thomson, P., Fox-Kean, M. (2005) “Patent Citations and the Geography of Knowledge Spillovers: A Reassessment,” American Economic Review, 95(1), 450-460. Vernon, R. (1966) “International Investments and International Trade in the Product Life Cycle,” Quarterly Journal of Economics, 80(2), 190-207. World Intellectual Property Organization (2017) The Global Innovation Index: Innovation Feeding the World”, Available at: http://www.wipo.int/edocs/pubdocs/en/wipo_pub_gii_2017.pdf Zucker, L. G., Darby, M. R. (1996) “Star Scientists and Institutional Transformation: Patterns of Invention and Innovation in the Formation of the Biotechnology

MPI Working Paper Series: The City and Innovation (Adler, Florida, King & Mellander) 34
Industry,” Proceedings of the National Academy of Sciences, 93(23), 12709-12716. Zucker, L. G., Darby, M. R. (2014) “Movement of Star Scientists and Engineers and High-Tech Firm Entry,” Annals of Economics and Statistics/Annales d'Économie et de Statistique, 115-116, 125-175.

MPI Working Paper Series: The City and Innovation (Adler, Florida, King & Mellander) 35
Author Bio
Patrick Adler is a Doctoral Candidate in the Department of Urban Planning at the University of California, Los Angeles ([email protected]).
Richard Florida is Director at the Martin Prosperity Institute in the University of Toronto’s Rotman School of Management and Research Professor at NYU ([email protected]).
Karen King is a Senior Research Associate and Research Manager on the Cities Team at the Martin Prosperity Institute ([email protected]).
Mellander is Professor of Economics, Jönköping International Business School, Jönköping University ([email protected]).
The authors thank Therese Norman for mapping support.
Working Paper Series
The MPI is dedicated to producing research that engages individuals, organizations and governments. We strive to make as much research as possible publicly available.
Our research focuses on developing data and new insight about the underlying forces that power economic prosperity. It is oriented around three main themes: economic performance, place, and creativity.
Disclaimer
The views represented in this paper are those of the author and may not necessarily reflect the views of the Martin Prosperity Institute, its affiliates or its funding partners.
Any omissions or errors remain the sole responsibility of the author. Any comments or questions regarding the content of this report may be directed to the author.