The Citric Acid-MnIII,IVO (Birnessite) Reaction. Electron
44
16 CHAPTER 2 The Citric Acid-Mn III,IV O 2 (Birnessite) Reaction. Electron Transfer, Complex Formation, and Autocatalytic Feedback 2.1 Abstract A synthetic MnO 2 (birnessite) oxidizes citrate to 3-ketoglutarate and acetoacetate. Plots of citrate loss as a function of time, and plots of dissolved Mn II and citrate oxidation product formation, all yield S-shaped curves, indicating autocatalysis. Increasing the citrate concentration decreases the induction period. The maximum rate (r max ) along the reaction coordinate follows a Langmuir-Hinshelwood dependence on citrate concentration. Increases in pH decrease r max and increase the induction time. Adding Mn II , Zn II , orthophosphate, or pyrophosphate at the onset of reaction decreases r max . Mn II addition eliminates the induction period, while orthophosphate and pyrophosphate addition increase the induction period. Our findings indicate that two parallel processes are responsible. The first, relatively slow process involves the oxidation of free citrate by surface Mn III,IV , yielding Mn II and citrate oxidation products. The second process, which is subject to strong positive feedback, involves concerted reaction of Mn II and citrate with surface Mn III,IV , yielding citrate oxidation products and two equivalents of Mn II .
Transcript of The Citric Acid-MnIII,IVO (Birnessite) Reaction. Electron

16
CHAPTER 2
The Citric Acid-MnIII,IVO2(Birnessite) Reaction. Electron Transfer,
Complex Formation, and Autocatalytic Feedback
2.1 Abstract
A synthetic MnO2(birnessite) oxidizes citrate to 3-ketoglutarate and acetoacetate. Plots
of citrate loss as a function of time, and plots of dissolved MnII and citrate oxidation
product formation, all yield S-shaped curves, indicating autocatalysis. Increasing the
citrate concentration decreases the induction period. The maximum rate (rmax) along the
reaction coordinate follows a Langmuir-Hinshelwood dependence on citrate
concentration. Increases in pH decrease rmax and increase the induction time. Adding
MnII, ZnII, orthophosphate, or pyrophosphate at the onset of reaction decreases rmax. MnII
addition eliminates the induction period, while orthophosphate and pyrophosphate
addition increase the induction period. Our findings indicate that two parallel processes
are responsible. The first, relatively slow process involves the oxidation of free citrate by
surface MnIII,IV, yielding MnII and citrate oxidation products. The second process, which
is subject to strong positive feedback, involves concerted reaction of MnII and citrate with
surface MnIII,IV, yielding citrate oxidation products and two equivalents of MnII.

17
2.2 Introduction
Citrate is a biological chelating agent that is released by the roots of all vascular plants
(1-5). Whole-soil citrate concentrations as high as 50 µM have been reported (1, 2). In
the rhizosphere, the zone of soil in direct contact with roots, citrate concentrations are
believed to reach millimolar levels (3). Putative biogeochemical roles for citrate reflect
its ability to chelate metal ions. In homogeneous solutions, citrate addition alleviates
aluminum toxicity to biota by forming less toxic complexed species (5-7). In
heterogeneous systems, ligand-assisted dissolution by citrate yields dissolved metal ion-
citrate complexes. This is undesirable in the case of toxic metal ions, but beneficial in the
case of nutrient metal ions like iron (5, 8). Ligand-assisted dissolution also solubilizes
anionic mineral constituents. Hence, dissolution by citrate can release nutrient anions
such as phosphate (9-11). Citrate is a component of many foods and pharmaceuticals
(12), and is used in technological applications requiring an environmentally-benign
chelating agent or dissolution agent, for example, for cleaning circuit boards (13, 14).
Up to 400,000 tons of citrate and its derivatives are produced per year world-wide, with
an annual 2-3 percent increase (15).
The overall abundance of manganese in the earth’s crust is only one-fiftieth that
of iron (16). MnIII,IV (hydr)oxides, like FeIII (hydr)oxides, are much less soluble than
(hydr)oxides comprised of the +II oxidation state. MnII diffusing out of reducing zones
and into O2-containing zones becomes oxidized, causing localized accumulation of MnIII-
and MnIV-containing (hydr)oxide solids (17, 18). Relative amounts of MnIII and MnIV in
such solids depend upon conditions present during their formation, and subsequent aging
and chemical reaction. Natural samples invariably contain a mixture of the two oxidation

18
states. MnIII,IV (hydr)oxides are stronger oxidants than FeIII (hydr)oxides, which explains
their importance as oxidants of inorganic species (19, 20) and organic compounds (21-
27), including chelating agents (24-27).
Citrate behavior in heterogeneous systems where adsorption (28-31) and ligand-
assisted dissolution (32, 33) reactions are predominant have received the most attention.
When a strong oxidant is present, e.g., MnIII,IV (hydr)oxides, the possibility that citrate
serves as a reductant must also be considered. Godtfredsen and Stone (34) monitored the
production of dissolved Mn (presumed to be MnII) during reaction of citrate with
synthetic MnO2(birnessite), and observed an induction period that decreased in duration
as the citrate concentration was increased. Klewicki and Morgan (26) observed dissolved
MnIII, but no induction period, when a 20- to 30-fold excess of citrate was brought into
contact with a (hydr)oxide preparation consisting primarily of MnIII.
This study examines the reaction of citrate with a synthetic MnO2(birnessite).
Citrate oxidation products are identified, and the effects of pH and increasing citrate
concentrations are explored. Additive effects (MnII, ZnII, orthophosphate, and
pyrophosphate) help us draw connections between solution speciation, surface speciation,
and reaction rates. Dissolved MnIII concentrations during reaction are quantified. S-
shaped plots for citrate loss, MnII formation, and citrate oxidation-product formation as a
function of time indicate that autocatalysis takes place. Our findings, supported by
earlier observations (26, 34), indicate that two parallel processes are responsible. The
first, relatively slow process involves the oxidation of free citrate by surface MnIII,IV,
yielding MnII and citrate oxidation products. The second process, which is subject to

19
strong positive feedback, involves concerted reaction of MnII and citrate with surface
MnIII,IV, again yielding MnII and citrate oxidation products.
2.3 Materials and Methods
All solutions were prepared from reagent grade chemicals without further purification
and distilled, deionized water (DDW) with a resistivity of 18 MΩ-cm (Millipore Corp.,
Milford, MA). Filter holders (Whatman Scientific, Maidstone, England) were soaked in
1 M ascorbic acid (Aldrich, Milwaukee, WI) and rinsed with distilled water and DDW.
All bottles and glassware used to contain MnO2(birnessite) suspensions were soaked in 1
M ascorbic acid, rinsed with distilled water, soaked in a 4 M nitric acid (J. T. Baker,
Phillipsburg, NJ) bath overnight, rinsed with distilled water, and then rinsed with DDW
water prior to use.
2.3.1 Chemicals. Citric acid, ZnCl2, and NaCl were purchased from Aldrich. 3-
Ketoglutaric acid was purchased from Lancaster Synthesis (Windham, NH). Lithium
acetoacetate was purchased from Fluka (Buchs, Switzerland). NaH2PO4, Na2HPO4 and
MnCl2·4H2O were purchased from J. T. Baker. Sodium butyrate (Aldrich), 2-
morpholinoethansulfonic acid monohydrate (MES; Fluka, Buchs, Switzerland), and 3-[N-
morpholino]propanesulfonic acid (MOPS; Sigma, St. Louis, MO) were used as pH
buffers.
Our MnIII-pyrophosphate stock solution contained a 20-fold excess of
pyrophosphate. 13.4 mg MnIII(acetate)3·2H2O (Aldrich) was dissolved in 50 mLs of a 20
mM disodium pyrophosphate (Fluka) solution that had been previously adjusted to pH 7
using NaOH (J. T. Baker) addition. After dissolution was complete, the pH was again

20
adjusted to pH 7. The solution was then filtered using a 0.1 µm pore size etch-tracked
polycarbonate membrane (Whatman Scientific). Total dissolved Mn was determined in
the filtered solution using flame atomic absorption spectrophotometry (AAS: Aanalyst
100, Perkin Elmer, Norwalk, CT). Following the method of Kostka et al. (35), dissolved
MnIII was determined in this solution by UV-visible spectrophotometry (model UV-160U,
Shimadzu Instrument Co., Kyoto, Japan) at a wavelength of 480 nm (molar absorptivity
= 110 cm-1 M-1). The MnIII-pyrophosphate solution was stable enough to serve as a
capillary electrophoresis (CE) standard for dissolved MnIII. The solution was stored in a
4 oC refrigerator and remade every two weeks.
2.3.2 MnO2 Synthesis and Characterization. MnO2 herein refers to particles
synthesized by precipitation of MnII(OH)2(pyrochroite), followed by oxidation to
MnIIIOOH(feitknechtite), and finally to MnIII,IVO2(birnessite) according to the method of
Luo et al. (36). A 750 mL solution of 5.0 M KOH (Aldrich) was placed in an ice bath,
stirred vigorously, and sparged with Ar for 30 minutes to eliminate O2. Slow addition of
a sparged 600 mL solution of 0.5 mM MnII(acetate)2·4H2O (Aldrich) yielded a white
suspension. Next, dropwise addition of 3000 mLs of a 4.4 M H2O2 (Aldrich) / 3.1 M
KOH solution yielded a black suspension, along with bubbles and steam. Synthesis was
complete when further addition of the H2O2 / KOH solution failed to generate bubbles
and steam.
The synthesized particles were allowed to settle. The supernatant solution was
removed and replaced with DDW. The particles were resuspended using sonication.
This rinse procedure was repeated 5 times, in order to make the highly basic suspension
less basic. 0.01 M HCl (J. T. Baker) was added dropwise to further decrease the pH to

21
approximately 7. At this point, the suspension pH was low enough for a centrifuge-based
washing procedure. Centrifugation (RC5-B Sorvall/Kendro, Asheville, NC) at 7000 rpm
for increasing periods of time (10 minutes to 6 hours) was performed. After 15 washing
times, the specific conductivity of the supernatant solution was less than that of a 1 × 10⁻⁴
M KCl (Aldrich) solution. Dissolved manganese in the supernatant solution was less
than the AAS detection limit (1.0 µM). The washed suspension was stored in a 4 oC
refrigerator prior to use.
Particles from the original synthesized suspension were characterized by powder
x-ray diffraction (XRD) and transmission electron microscopy (TEM). Freeze-dried
particles (Lanconco Corp., Kansas City, MO) were also characterized and gave the same
results as the particles from the original suspension. XRD yielded diffraction lines with
the following d-spacings: 7.22, 3.59, 2.47, 2.36, 2.05, 1.74, and 1.42 Å. The d-spacings
are consistent with the distorted hexagonal layered structure of MnO2(birnessite)
proposed by Manceau’s group (37). The well-defined 7 Å basal d-spacing reflects the
characteristic interlayer spacing of MnO2(birnessite) (37, 38). TEM reveals that many of
the MnO2 sheets are curled. Curling of MnO2(birnessite) sheets has been observed
previously (39), and attributed to edge sections that are thicker than middle sections. The
freeze-dried particles weigh 97.10 grams per mole of manganese. The BET multipoint
N2 adsorption method (Coulter 3100 BET Instrument, Miami, FL) was performed on a
freeze-dried sample, and yielded a specific surface area of 174.3 m2/g.
The average oxidation state of manganese was determined by iodometric titration
(40). Prior to sampling, the MnO2 suspension was rigorously stirred. The sample was
reduced by an excess of KI (Fisher Chemical, Pittsburgh, PA) in 0.01 M HCl solution,

22
yielding a brown I2 solution. Soluble starch indicator (Fisher Chemical) was then added,
and the brown I2 solution was back-titrated using Na2S2O3. The endpoint was reached
when the suspension was colorless. The average oxidation state was found to be +3.78.
If we assume that MnII is not present, then this average oxidation state corresponds to 22
% MnIII and 78 % MnIV.
2.3.3 Experimental Setup. Degradation Experiments. All batch experiments
were conducted in 100 mL polypropylene bottles in a constant temperature circulating
bath at 25 ± 0.2 oC and stirred with Teflon-coated stir bars. 10 mM butyrate (5.0 ≤ pH ≤
5.6), MES (6.0 ≤ pH ≤ 6.6), or MOPS (pH 7.1) were employed to maintain constant pH.
pH stability was verified by periodic measurement (Fisher Accumet 825MP meter with
Orion Combination semi-micro probe; NIST-traceable standards). pH buffer
concentrations were high enough to serve an additional purpose, maintenance of constant
ionic strength conditions. No additional electrolyte was added.
Solutions containing organic substrate and pH buffer (plus additional constituents,
as appropriate) were sparged with Ar (BOC gases, Baltimore, MD) for one hour prior to
MnO2 addition. Sparging was continued during the duration of the experiments. 4mL
reaction suspension aliquots were collected at periodic intervals. Reactions were
quenched by immediately filtering through 0.1 µm pore diameter track-etched
polycarbonate filter membranes (Whatman). Filtered solutions were analyzed by AAS
for total Mn and by capillary electrophoresis for additional species (see later section).
Inorganic carbonate was not monitored because of possible losses arising from sparging.
MnII Adsorption Experiments. All experiments began by adding MnO2 stock
suspension, MnCl2 solution, and DDW into 15 mL polypropylene bottles. Some

23
experiments employed HCl or NaOH addition to set the pH. In this instance, the ionic
strength was low, near 0.04 mM. In other experiments, a 10 mM MOPS buffer (pH 7.1)
was employed, yielding an ionic strength of approximately 5 mM. In a limited number of
experiments, the ionic strength was raised by added 10 mM NaCl. A circulating constant
temperature bath maintained the temperature at 25.0 ± 0.2 oC. Stirring was performed
using teflon-coated stir bars. Suspensions were equilibrated for four hours prior to
filtration through 0.1 µm pore diameter track-etched polycarbonate filter membranes
(Whatman). Filtered solutions were analyzed for total dissolved Mn using AAS.
2.3.4 Capillary Electrophoresis. A capillary electrophoresis unit from Beckman
Coulter (P/ACE MDQ, Fullerton, CA) with diode-array UV-visible detector was used for
all determinations. Detector bandwidth was set at 6 nm for 190 nm wavelength detection
and 10 nm for all other wavelengths. Bare fused silica capillaries (Polymicro
Technologies, Phoenix, AZ) with 75 µm ID × 60 cm total length were used for all
separations. The effective length defined as the length from the inlet to the detector was
52 cm. Capillary and sample board temperature was thermostatted to 10 oC during
operation. Between separations, the capillary was sequentially rinsed by flushing DDW
for 0.5 minute, 0.1 M NaOH for 1 minute, DDW again for 1 minute, and capillary
electrolyte for 2 minutes. Sample injection employed 0.5 psi of positive pressure for 15
seconds. Anion mode with constant applied voltage (-22 kV) was employed for all
separations.
In previous efforts to obtain metal ion and chelating agent speciation information
(41) a non-complexing CE electrolyte such as 50 mM MOPS (pH 7.0) and 0.5 mM
TTAB was employed. Using this CE electrolyte with MnIII-pyrophosphate solutions,

24
however, yielded a baseline increase and a broad, unusable peak. When MnII-containing
stock solutions were injected, no peak was obtained. Measured currents declined with
successive injections, which we conclude was caused by formation of inorganic
precipitates, leading to column clogging. The unusable or undetectable peaks are likely
caused by ligand exchange during electromigration, which is reasonable based upon the
fact that MnIII is more substitution-labile than other +III metal ions and MnII is more
substitution-labile than other +II metal ions that we have worked with in the past (41, 42).
Since the CE electrolyte does not contain ligands capable of solubilizing MnIII, any
electric field-induced dissociation will lead to MnIII precipitation within the column.
Precipitation of MnII within the column is harder to explain, but may involve
precipitation with inorganic carbonate, inadvertently added to the CE electrolyte through
contact with air.
We elected to use a CE electrolyte consisting of 20 mM pyrophosphate, 0.4 mM
TTAB, and 2 mM orthophosphate (pH 9.5) for our CE determinations. Pyrophosphate is
a strong enough chelating agent for MnIII and present in a high enough concentration to
capture all the MnIII in our samples during electromigration. A sharp, symmetrical peak,
easily discernable at a detection wavelength of 235 nm, provided the means of measuring
MnIII(aq) (total dissolved MnIII). logK values for MnII complexes with pyrophosphate are
significantly lower than those for MnIII (43, 44). The sharpest, most symmetrical peak
for MnII is obtained when a CE electrolyte with a pH of 9.5 is employed. Lowering the
pH of the CE electrolyte causes more and more peak broadening and tailing, and an
increase in the baseline. The MnII(aq) peak is more discernable at 214 nm than at 235 nm,
consistent with its known spectral qualities (43). Although no attempt was made to

25
quantify MnII using CE, the pyrophosphate-TTAB-orthophosphate CE electrolyte did
succeed in preventing measured current decline and increasing column life, especially at
pH 9.5.
Citrate and its oxidation products only absorb light at wavelengths less than 210
nm. Pyrophosphate does not adsorb light in this region. Indeed, the pyrophosphate-
TTAB-orthophosphate CE electrolyte allowed simultaneous determination of MnIII(aq),
un-reacted citrate, and citrate oxidation products.
2.4 Results and Discussion
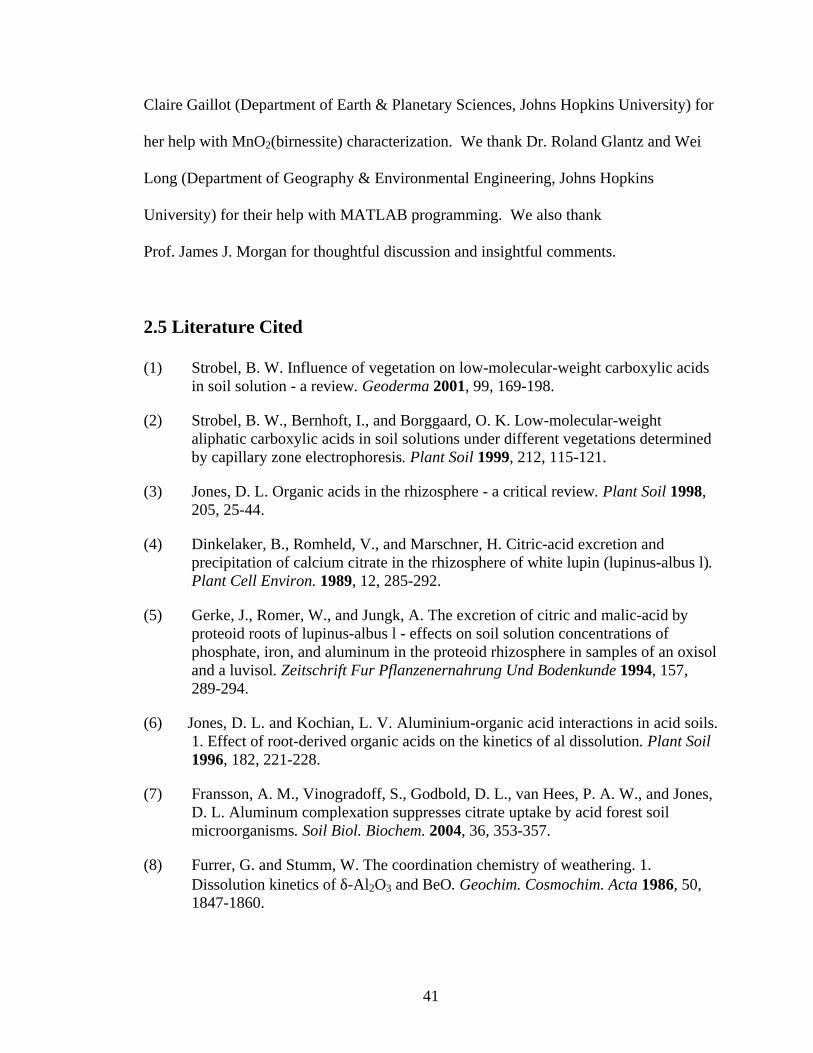
2.4.1 MnII Adsorption onto MnO2. In suspensions containing 20 µM MnCl2 and 200
µM MnO2, the extent of MnII adsorption increased from nearly negligible levels at pH
values below 5.7 to nearly 100 % for pH values above 7.7 (Figure 2.1a). Adding 10 mM
NaCl did not perceptibly affect the extent of adsorption.
Adsorption as a function of total added MnII (TOTMnII) at fixed MnO2 loading
(200 µM) (Figure 2.1b) was investigated at a fixed pH of 7.1 using a 10 mM MOPS
buffer. The data were fitted using a Langmuir Adsorption Isotherm:
II II
IIII
[Mn (ads, max)]K[Mn (aq)][Mn (ads)] =
1 + K[Mn (aq)]
[MnII(ads,max)] (9.4 µM), which corresponds to the maximum extent of adsorption, and
the adsorption constant K (9.0 × 10⁵ M-1) were obtained using the Marquardt-Levenberg
Algorithm (45).
2.4.2 Citrate Oxidation Products. Filtered reaction solutions from citrate-
containing MnO2 suspensions yielded new CE peaks at 2.50, 2.58, 2.64, 2.89, and 3.58

26
minutes, regardless of the reaction conditions employed. The first, second and fifth peaks
are assigned to citrate, 3-ketoglutarate and acetoacetate, respectively, based on peak
growth following injection of authentic samples. Similarly, the third and fourth peaks are
assigned to MnIII(aq) and MnII(aq), respectively, based upon peak growth following
injection of MnIII-pyrophosphate and MnII standard solutions.
Carboxylate and carbonyl groups only absorb light in the far UV, and hence it is
reasonable that a low wavelength (190 nm) provided the best quantifications of organic
analytes. Citrate and 3-ketoglutarate, each possessing three C=O chromophoric groups,
yield detection limits of 2 µM. Acetoacetate, with two such groups, has a slightly higher
detection limit (5 µM). Molecules with a greater charge yield a shorter electromigration
time, i.e., citrate (-3) < 3-ketoglutarate (-2) < acetoacetate (-1).
In previous experiments performed in homogeneous solutions, 3-ketoglutarate has
been identified as a product of citrate oxidation by MnII plus O2 (46), by CrVI (47), and by
HOCl (48). Photolysis of FeIII-citrate complexes also yields 3-ketoglutarate (49).
Acetoacetate is mentioned as a second product in some of these studies (48, 49).
The oxidative decarboxylation reaction responsible for the conversion of citrate
into 3-ketoglutarate (48) is shown in Figure 2.2a. It is well established that carboxylates
with both an α-hydroxyl group and an α-hydrogen atom undergo two-electron oxidation
to corresponding aldehydes or ketones (49, 50). Citrate does not possess the α-hydrogen
group, but CO2 exit accompanying electron abstraction and hydrogen bonding within the
3-ketoglutarate product facilitate the oxidation reaction (48).
As shown in Figure 2.2b, 3-ketoglutarate is converted into acetoacetate by a non-
redox decarboxylation rearrangement reaction (51). The electron-withdrawing property

27
of the β-carbonyl group is responsible; it serves as an "electron sink" for the two
electrons constituting the C-C bond undergoing cleavage. Hydrogen-bonding and the
formation of a 6-membered ring transition state are believed responsible for the observed
acid catalysis exhibited by this reaction (51). Divalent metal ions including Mn2+(aq)
catalyze decarboxylation (51). The reaction is driven by the stabilized enol tautomer via
formation of a 6-membered ring metal chelate (51).
2.4.3 Illustrative Time Course Plot – Autocatalysis. MnO2 suspensions, at pH
7.1 in the absence of citrate, yielded dissolved Mn concentrations that were slightly
above the detection limit (1.0 µM), but only after three days. Citrate loss was not
observed in MnO2-free solutions, regardless of pH.
Figure 2.3 presents an illustrative time course plot for reaction of 200 µM citrate
with 200 µM MnO2 at pH 7.1. Citrate loss, total dissolved manganese (Mn(aq))
production, and 3-ketoglutarate production all yield S-shaped curves. CE peaks
corresponding to acetoacetate are only discernable after 16 hours of reaction. At the last
sampling point, [acetoacetate] is only 6 % of [3-ketoglutarate]. The sum [citrate] + [3-
ketoglutarate] + [acetoacetate] remains constant as the reaction progresses, indicating that
mass balance is obeyed.
Total dissolved manganese (Mn(aq)) determined by AAS is comparable to [3-
ketoglutarate] before the inflection point in the S-shaped curves, but slightly higher
afterwards. Dissolved MnIII (MnIII(aq)) determined using CE rise and then fall. At its
highest point, MnIII(aq) is only 4 % of Mn(aq). Hence, total dissolved manganese is
primarily MnII. The time course plot for MnIII(aq) should be interpreted with caution,
however, since all the data points are within a factor of 3 of the detection limit (about 1.5

28
µM). It is interesting to note that the maximum in MnIII(aq) lies close to the inflection
points of the three S-shaped curves.
Three reaction stages are marked in Figure 2.3, which are useful in making run-
to-run comparisons. Stage 1 corresponds to the induction period seen in the S-shaped
curve. Stage 2 corresponds to a time interval bracketing the inflection point, where the
highest rate of change is observed. Stage 3 is the final change, during which a significant
decline in reaction rate is observed.
The predominance of MnII(aq) over MnIII(aq) and the appearance of citrate
oxidation products are reminiscent of reductive dissolution reactions (52). The simplest
representation of a reductive dissolution reaction involves surface sites (S) reacting with
reductant (A) to yield reduced metal ions (C) and oxidation products (P):
1A + S C + P k→ (1)
This reaction is not, however, sufficient to explain Godtfredsen and Stone's (34)
observation of an induction period in Mn(aq). At minimum, two reactions in series are
required. (One possible scheme involves exponential decay of reactant A followed by
increases in the concentrations of one or more intermediates. After a time delay set by
the magnitude of a second (or third) rate constant, final products appear.)
The S-shaped curve with induction period appearance of the time course plot for
citrate is important, because it cannot be explained by simple reactions in series. Positive
feedback, i.e., acceleration of the forward reaction by at least one reaction product, must
be invoked. We retain Reaction 1, but add a second reaction in parallel:
2A + S + C 2C + P k→ (2)

29
Reactions 1 and 2 constitute a complete autocatalysis scheme. Reaction 1 generates C to
initiate Reaction 2, and Reaction 2 introduces positive feedback (53, 54). Autocatalytic
reactions of this kind have been extensively investigated in solution (54, 55), but
relatively little is known about heterogeneous autocatalytic reactions (56). It is necessary
to account for changes in surface site concentration. Our experimental system probably
lies somewhere between the following two cases: (i) All surface sites are accessible at the
onset of reaction. The "concentration" of sites decreases in proportion to the amount of
dissolution that has taken place, i.e., [S] = [S]o - [P]. (ii) The fraction of surface sites
accessible at the onset of the reaction is low, and consumption of an accessible site
exposes a new accessible site. Hence, the concentration of sites remains the same, i.e.,
[S] = [S]0.
We will employ Case (ii), the mathematically simplest. Since the concentration
of accessible surface sites is considered constant, we can write k1* = k1[S]0 and k2
* =
k2[S]0. Rate r, corresponding to production of organic oxidation products P, is the sum of
the rates of Reactions 1 and 2:
1 2 1 2
d[P]r = = r + r = k *[A] + k *[A][C]
dt (3)
Setting x = ([A]0 - [A]) = [P] = [C] yields:
1 0 2 0
dx = k *([A] - x) + k *([A] - x)x
dt (4)
Integration yields:
1 2 01 2 0
1 0
(k * + k *x)[A]ln = (k * + k *[A] )t
k *([A] - x)
(5)

30
To serve as illustration, values of k1* and k2* have been selected for goodness-of-fit to an
experiment (not shown) performed under the following conditions: 50 µM citrate, 200
µM MnO2, and 10 mM MOPS buffer (pH 7.1). Figure 2.4a represents our best fit to
Equation 4; the upper plot shows the simulated time course plot, and the lower plot shows
r1, r2, and r as a function of time.
The highest value of r1 is found at the onset of reaction, where x = 0. It decreases
over time owing to decreases in [A]. Setting dr2/dx equal to zero and solving the
resulting equation tells us that the maximum value of r2 is achieved when x = [P] = [C] =
(1/2)[A]o. This conclusion makes sense since r2 is proportional to the product [A][C].
Reaction progress accelerates reaction by yielding C, but decelerates reaction by
decreasing [A]; the highest rate corresponds to the midpoint.
To explore how the value of k1* affects time course plots, its value is decreased by a
factor of ten in Figure 2.4b, and increased by a factor of ten in Figure 2.4c. In a similar
manner, Figures 4d and 4e explore the effect of lowering and raising k2*. Inspection of
the x-axis scales needed to display the entire time course is informative. A decrease in
either k1* or k2
* increases the time required to reach a particular reaction progress goal.
The ratio k1*/k2
* is also very informative. No induction period is observed when the ratio
is high, and a low value of the ratio insures that an induction period will exist.
For practical reasons, we will take a different approach towards making
quantitative run-to-run comparisons. Rates corresponding to the Stage 2 portion of each
run (rmax, in units of µM/h) will be obtained from slopes of [3-ketoglutarate] versus time
plots (Figure 2.3). Four or more points in the vicinity of the inflection point defining a
straight line (as indicated by an r2 value greater than 0.99) will be used to calculate this

31
slope. No attempt will be made to quantify the duration of Stage 1, which corresponds to
the induction period, but trends in increasing or decreasing induction period will be
pointed out. Whenever an induction period is observed, we can conclude, based upon our
model, that Reaction 2 is the predominant contributor to the measured value of rmax.
2.4.4 Reaction Stoichiometry. The identification of 3-ketoglutarate and
acetoacetate as the sole oxidation products of citrate provides an opportunity to check the
redox stoichiometry of the reaction. We will represent citrate as R2C(OH)COO- and 3-
ketoglutarate as RC(O)R. Note that the conversion of 3-ketoglutarate into acetoacetate is
not a redox reaction, and hence the sum of their concentrations is the true reflection of
reaction progress. A pure MnIV (hydr)oxide (represented by MnIVO2(s)) would yield one
mole of MnII per mole of citrate oxidized:
- IV + - 2+2 2 3 2R C(OH)COO + Mn O (s) + 2H = RC(O)R + HCO + Mn + H O (6)
A pure MnIII (hydr)oxide (represented by MnIIIOOH(s)) would yield two moles of MnII
per mole of citrate oxidized:
- III + - 2+2 3 2R C(OH)COO + 2Mn OOH(s) + 4H = RC(O)R + HCO + 2Mn + 3H O (7)
As noted earlier, the average oxidation state of the MnO2 preparation used in our
experiments was 3.78. Representing this reaction as Mn(OH)3.78(s) leads to the following
redox stoichiometry:
- + - 2+2 3.78 3 2R C(OH)COO + 1.12Mn(OH) (s) + 2.25H = RC(O)R + HCO + 1.12Mn + 3.24H O
(8)
Hence, the (hydr)oxide employed in our experiments should yield 1.12 moles of MnII per
mole of citrate oxidized.

32
The yield of MnII per mole of citrate oxidized, which we can call n, requires that
dissolved plus adsorbed concentrations of the three products be known:
IITOTMn
n = [TOT 3-ketoglutarate] + [TOT acetoacetate]
(9)
Total concentrations are not experimentally measurable quantities. We can,
however, calculate an “apparent” yield n’, using dissolved concentration measurements:
II[Mn (aq)]
n' = [3-ketoglutarate(aq)] + [acetoacetate(aq)]
(10)
At the MnO2 loadings employed here, adsorption of 3-ketoglutarate and
acetoacetate is believed to be negligibly low, while adsorption of MnII is expected to be
significant. For this reason, n’ should be less than or equal to n.
Figure 2.5 shows values of n’ as a function of time for the experiment presented
in Figure 2.3. Values of n' rise from 0.93 to 1.19 during the first 5 hours of reaction. The
eight data points collected between 5 and 21 hours of the reaction yield a mean value of
1.20 for n' with a 95 % confidence interval of ±0.08. The expected value for n (1.12)
falls within this confidence interval.
Initially low values of n' can arise from either MnII retention by the MnO2 surface
and/or preferential reaction of MnIV in comparison to MnIII. Both postulated phenomena
should diminish in importance as the reaction progresses. MnII retention should diminish
because more and more MnII must compete for fewer and fewer adsorption sites.
Preferential consumption of MnIV will eventually deplete the surface and shift reaction
towards MnIII.
2.4.5 Effect of ZnII and MnII Addition. Adding 200 µM ZnIICl2 in the absence
of citrate results in the release of a small amount of dissolved Mn (approximately 2.5

33
µM), presumably through a cation exchange mechanism. Adding 10 µM ZnIICl2 at the
onset of reaction of 200 µM citrate with 200 µM MnO2 at pH 7.1 (Figure 2.6a) yields a
slight increase in 3-ketoglutarate production during Stage 1, and a slight decrease in
production during Stage 3. The induction period is slightly shortened, and rmax decreases
by 13 % (Table 2.1). Adding 200 µM ZnIICl2 effectively shuts off 3-ketoglutarate
production.
As shown in Figure 2.6b, 10, 200, 500, and 1000 µM added MnIICl2 all eliminate
the induction period. It is interesting to note that rmax obtained when 10 µM MnIICl2 is
added is the same as the value obtained when no MnIICl2 is added (Table 2.1). Increasing
the added MnIICl2 concentration 100-fold causes only a 3.4-fold decrease in rmax.
Reactions 1 and 2 presented earlier are simplistic in that they do not explicitly
account for adsorption (either inner sphere or outer sphere), which is a prerequisite for
electron transfer. To provide the basis for evaluating metal ion addition effects, the
following mass balance equations are informative:
MnIIT = [MnII(aq)] + [MnII-Citrate(aq)] + [S-MnII] + [(S, MnII, Citrate)] (11)
ZnIIT = [ZnII(aq)] + [ZnII-Citrate(aq)] + [S-ZnII] + [(S, ZnII, Citrate)] (12)
CitrateT = [Citrate(free, aq)] + [MnII-Citrate(aq)] + [ZnII-Citrate(aq)] + [S-Citrate]
+ [(S, MnII, Citrate)] + [(S, ZnII, Citrate)] (13)
ST = [S(free)] + [S-MnII] + [S-ZnII] + [S-Citrate] + [(S, MnII, Citrate)]
+ [(S, ZnII, Citrate)] (14)
MnIII,IV surface sites are denoted as "S". For each component, both dissolved and
adsorbed species are included in the mass balance. No attempt is made to denote
protonation level or bonding arrangement. (S, ZnII, Citrate) and (S, MnII, Citrate) denote
34
surface ternary complexes that may be inner-sphere, ligand-like complexes where citrate
serves as a bridge, inner-sphere, metal-like complexes where ZnII or MnII serve as a
bridge, or outer sphere complexes where ZnIICitrate or MnIICitrate complexes are
associated with surface sites, yet maintain their hydration shells. 3-Ketoglutarate and
acetoacetate production can potentially arise from any of the underlined species.
When redox-inert ZnII is added, [ZnII-Citrate(aq)], [S-ZnII], and [(S, ZnII, Citrate)]
increase at the expense of citrate species and surface site species that do not contain ZnII.
Table 2.2 presents equilibrium calculations for MnO2-free solutions, based upon logK
values available in the literature (57). 10 µM ZnII has only a slight effect on [MnII-
Citrate(aq)], while 200 µM ZnII causes a 42 % decrease in [MnII-Citrate(aq)]. The
surface species S-ZnII is redox inert. If we assume that all surface species denoted as (S,
ZnII, Citrate) are either redox-inert or present at insignificantly low concentrations, the
inhibitory effects arising from ZnII addition are easily explained.
What can we say about MnII speciation with respect to the MnIICl2 addition
experiments? Langmuir adsorption constants derived from Figure 2.1 indicate that 73 %
of MnII is adsorbed in citrate-free suspensions containing 10 µM MnII and 200 µM MnO2
at pH 7.1. Equilibrium calculations presented in Table 2.2 indicate that 85 % of MnII is
complexed in MnO2-free solutions containing 10 µM MnII and 200 µM citrate at pH 7.1.
If for the moment we ignore citrate adsorption, then a Langmuir-type description of
adsorption and the MnII-citrate solution speciation model can be combined into a simple
"complete system" equilibrium model. Calculations indicate that for suspensions
containing 10 µM MnII, 200 µM citrate, and 200 µM MnO2, 40 % of the MnII is adsorbed
and 51 % is coordinated to citrate in solution.

35
2.4.6 Effect of Citrate Concentration. As shown in Figure 2.7a, citrate
concentrations ranging from 50 µM to 5.0 mM at pH 7.1 all yield S-shaped curves. The
100-fold increase in citrate concentration shortens the induction period from
approximately 10 hours to 40 minutes. A slight increase in the Stage 1 reaction rate is
discernible from changes in the initial slope, but the 3-ketoglutarate concentrations during
this stage are too low to provide quantitative estimates of rate. Changes in rmax, the
highest rate of reaction within the Stage 2 portion of the time course plot, are readily
quantified. The 100-fold increase in citrate concentration yields a 25-fold increase in rmax,
and saturation kinetics are apparent (Figure 2.7b).
According to Reactions 1 and 2, raising [citrate]0 increases both r1 and r2, which
decreases the induction period and increases the overall rate r. Since an induction period
is observed at all five citrate concentrations, we can conclude that r2 is the predominant
contributor to rmax. Although we cannot yet identify the species responsible for
autocatalysis, a Langmuir-Hinshelwood rate expression (58, 59) can provide information
about its relative abundance:
max, sat 0max
0
r K[citrate]r =
1 + K[citrate] (15)
[citrate]0 represents initial the citrate concentration, rmax, sat represents the value rmax when
saturation of the surface with citrate has been achieved, and K represents the citrate
adsorption constant. The parameters rmax,sat = 85 µM/h and K = 7.2 × 10² M-1 were
obtained from the data in Figure 2.6b using the same nonlinear least squares method
employed earlier with the Langmuir Adsorption Isotherm. Most of our experiments
employed 200 µM citrate, 200 µM MnO2, and 10 mM MOPS buffer (pH 7.1). Under

36
these conditions, rmax/rmax,sat is equal to 0.16, indicating that the species responsible for
autocatalysis is present at 16 % of its maximum value.
2.4.7 Effect of Orthophosphate and Pyrophosphate Addition. As shown in
Figure 2.8, 5.0 mM orthophosphate and 0.2 mM pyrophosphate approximately doubled
the induction period and decreased rmax by half.
Lewis Base additives may interfere with the reaction by (i) adsorbing onto MnIII,IV
surface sites and (ii) forming complexes with MnII in solution. The first possibility is
quite real yet difficult to evaluate since, for both Lewis Bases, loss from solution is not
high enough to detect under the reaction conditions considered (200 µM MnO2, pH 7.1).
The second possibility can be evaluated by performing equilibrium calculations which
employ complex formation constants reported in the literature (57), as we have done in
Table 2.2. The two additive concentrations employed (5.0 mM orthophosphate, and 0.2
mM pyrophosphate) decrease Σ[MnIIHx(citrate)] in roughly comparable amounts (32 %
and 27 %, respectively.)
In Figure 2.9, results from three addition experiments are compared with results
from an additive-free experiment. Adding MnII alone or MnII plus pyrophosphate
eliminates the induction period entirely. Adding pyrophosphate alone causes the
induction period to increase. Pyrophosphate-only and MnII plus pyrophosphate
experiments yielded similar rmax values (7.0 and 6.1 µM/h, respectively) that are two-
times lower than rmax values measured in additive-free and MnII-only experiments.
As far as the induction period is concerned, MnII and pyrophosphate additives
work at cross-purposes, with MnII exerting the slightly stronger effect at the
concentrations employed. Adding MnII allows Reaction 2 to predominate throughout the

37
entire time course; there is no need to wait for Reaction 1 to generate enough MnII to
form the autocatalytic reagent. The lowering effect of pyrophosphate on rmax is especially
noteworthy, since it is observed whether or not MnII is added. The effect of
orthophosphate on the autocatalytic mechanism appears similar to that of pyrophosphate,
but much weaker.
2.4.8 Effect of pH. S-shaped time course plots are obtained throughout the range
5.1 < pH < 7.1 (Figure 2.10). Decreasing the pH from 7.1 to 6.0 causes the induction
period to decrease from approx. 2 hours to approximately 15 minutes. Further decreasing
the pH to 5.1 does not significantly alter the duration of the induction period. Decreasing
the pH from 7.1 to 5.1 causes an 8-fold increase in rmax (Figure 2.10b). Connecting
successive pairs of points in a log-log plot (Figure 2.10b) yields an apparent order with
respect to [H+] that is nearly zeroth-order between pH 5.1 and 5.6, but becomes more
sensitive to [H+] as the pH is increased.
For a MnO2-free solution containing 10 µM MnII and 200 µM citrate, an
equilibrium calculation performed for pH 5.1 in the manner of Table 2.2 yields 2.72 µM
MnIIcit-, 6.67 µM Mn2+, and 0.61 µM MnIIHcit0. The sum of the concentrations of all
MnII-citrate complexes is therefore 2.5-times lower at pH 5.1 than at 7.1. Figure 2.1
indicates that the amount of MnII adsorbed in citrate-free MnO2 suspensions at pH 5.1 is
substantially less than at pH 7.1.
What do we know about citrate adsorption as a function of pH? Anion adsorption
onto MnO2(birnessite), a cation-exchange phase with a low pHzpc, is low, and not well
understood (60). If adsorption onto conventional (hydr)oxide phases such as FeOOH(s,
goethite) (30) or AlOOH(s, pseudoboehmite) (61) in an appropriate analogy, then a

38
substantial increase in adsorption with decreasing pH is expected (62). Unlike dissolved
MnII-citrate complexes and unlike adsorbed MnII, expected trends in adsorbed citrate as a
function of pH actually follow the same trend as the rate data shown in Figure 2.10.
2.4.9 The Autocatalytic Step. Redox reactions involving (hydr)oxide surfaces
are notoriously complex. Our experimental findings are sufficient, however, to clarify
some details regarding the molecular-level mechanism of the citrate-MnO2 reaction.
Equilibrium constants for MnIII-citrate complexes are not available in the
literature. Observed MnIII(aq) concentrations as high as 4.8 µM (Figure 2.3) point to the
existence of such complexes, since aquo and hydroxo MnIII species are sparingly soluble
with respect to MnIIIOOH(see Supporting Information) and since 3-ketoglutarate and
acetylacetate are considerably weaker chelating agents than citrate. An appraisal of
MnIII-citrate complexes based on analogies with the FeIII system (see Supporting
Information) suggests that MnIII(OH)CIT- is the predominant dissolved MnIII species
under the conditions employed in our experiments. Using the MnIII(aq) measurements
reported in Figure 2.3, a lower estimate of K = 1014.67 for the reaction Mn3+ + citrate3- +
H2O = MnIII (OH)(citrate)- + H+ is obtained (see Supporting Information).
Dissolved MnIII-citrate complexes may arise from (i) ligand-assisted dissolution
of the 22 % of manganese atoms within the MnO2 preparation that was originally in the
+III oxidation state; (ii) ligand-assisted dissolution of MnIV atoms that have been reduced
to MnIII and (iii) oxidation of MnII-citrate complexes by the remaining MnO2 reactant.
Mechanism i has been previously confirmed by Klewicki and Morgan (26) in their study
of the citric acid-assisted dissolution of a MnOOH(feithnecktite)/Mn3O4(hausmannite)

39
mixture. In order to evaluate Mechanism iii, three half reactions from the Supporting
Information are pertinent:
MnIVO2(s) + 3H+ + 2e- = Mn2+ + 2H2O Eo = 1.29 volts E = 1.00 volts (16)
MnIIIOOH(s) + 3H+ + e- = Mn2+ + 2H2O Eo = 1.50 volts E = 0.834 volts (17)
MnIII(OH)(citrate)- + H+ + e- = MnII(citrate)- + H2O
Eo = 1.00 volts E = 0.568 volts (18)
Eo for Reactions 16 and 17 are obtained from the literature, while Eo for Reaction 18 is an
estimate. To calculate E values relevant to Figure 2.3, we employed 1.51x10⁻⁶ M Mn2+,
8.46x10⁻⁶ M MnII(citrate)-, 4.6x10⁻⁶ M MnIII(OH)(citrate)-, and pH 7.1 (based upon
calculations in Table 2.2 and in Supporting Information.) A comparison of reduction
potentials indicates that surface-bound MnIII/IV is thermodynamically capable of oxidizing
MnII(citrate)- to MnIII(OH)(citrate)-. Mechanistically, the metal-to-metal electron transfer
could occur via a ligand-like, inner-sphere ternary precursor complex, metal-like, inner-
sphere ternary precursor complex, or outer-sphere precursor complex. Irrespective of the
nature of the precursor complex, metal-to-metal electron transfer is likely to be fast.
Oxidation of CoII(EDTA)- (63) and a variety of CrIII-aminocarboxylate complexes
(64) by manganese(III,IV) (hydr)oxides has been reported. Although there are no prior
reports of interfacial manganese-to-manganese electron transfer, analogous iron-to-iron
reactions have been extensively investigated. FeII-chelating agent complexes and their
subsequent reaction with surface-bound FeIII are key aspects of the dissolution of
Fe3O4(magnetite) by oxalate (65, 66), Fe2O3(hematite) by ascorbate/EDTA (67), and
Fe2O3(hematite) by ascorbate/oxalate (67). Similar mechanisms are operative in the

40
dissolution of FeOOH(goethite) by oxalate/FeII (68), EDTA/FeII (69), malonate/FeII (70)
and citrate/FeII (70).
MnIII(OH)(citrate)- decomposes by intramolecular electron transfer. A half life in
the range of 4 to 10 hours was reported by Klewicki and Morgan (71) for a solution
consisting of 0.30 mM MnIII-citrate, 0.20 mM MnII-citrate, and 25 mM total dissolved
citrate at pH 7.4. Extrapolation to a new set of conditions can not be made. In both
Klewicki and Morgan's experiments and our own, bimolecular reactions between
MnIII(OH)(citrate)- and free citrate ions cannot be ruled out. When MnIII,IV (hydr)oxides
are present, as in our experiments, it is also conceivable that MnIII,IV surface sites
somehow catalyze the decomposition of MnIII(OH)(citrate)-.
Source and sink terms for MnIII-citrate, and a generalized scheme for Reaction 2,
the autocatalytic step, are shown in Figure 2.11. This MnIII/II citrate autocatalytic cycle is
the first of its kind proposed for a manganese-based redox system. Previously
investigated organic reductants (23, 72) did not yield autocatalysis because, unlike citrate,
they were unable to form appreciable concentrations of dissolved MnII and MnIII
complexes. Intramolecular electron transfer within MnIII-citrate complexes, which
releases MnII to repeat the cycle, is also essential for autocatalysis.
AcknowledgementsThis work was supported by Grant NumberR-82935601 from the
U.S. Environmental Protection Agency's Science to Achieve Results (STAR) program.
Although the research described in this article has been funded wholly by this grant, it
has not been subject to EPA review and therefore does not necessarily reflect the views
of the Agency, and no official endorsement should be inferred. We thank Dr. Anne-
41
Claire Gaillot (Department of Earth & Planetary Sciences, Johns Hopkins University) for
her help with MnO2(birnessite) characterization. We thank Dr. Roland Glantz and Wei
Long (Department of Geography & Environmental Engineering, Johns Hopkins
University) for their help with MATLAB programming. We also thank
Prof. James J. Morgan for thoughtful discussion and insightful comments.
2.5 Literature Cited (1) Strobel, B. W. Influence of vegetation on low-molecular-weight carboxylic acids
in soil solution - a review. Geoderma 2001, 99, 169-198.
(2) Strobel, B. W., Bernhoft, I., and Borggaard, O. K. Low-molecular-weight aliphatic carboxylic acids in soil solutions under different vegetations determined by capillary zone electrophoresis. Plant Soil 1999, 212, 115-121.
(3) Jones, D. L. Organic acids in the rhizosphere - a critical review. Plant Soil 1998, 205, 25-44.
(4) Dinkelaker, B., Romheld, V., and Marschner, H. Citric-acid excretion and precipitation of calcium citrate in the rhizosphere of white lupin (lupinus-albus l). Plant Cell Environ. 1989, 12, 285-292.
(5) Gerke, J., Romer, W., and Jungk, A. The excretion of citric and malic-acid by proteoid roots of lupinus-albus l - effects on soil solution concentrations of phosphate, iron, and aluminum in the proteoid rhizosphere in samples of an oxisol and a luvisol. Zeitschrift Fur Pflanzenernahrung Und Bodenkunde 1994, 157, 289-294.
(6) Jones, D. L. and Kochian, L. V. Aluminium-organic acid interactions in acid soils. 1. Effect of root-derived organic acids on the kinetics of al dissolution. Plant Soil 1996, 182, 221-228.
(7) Fransson, A. M., Vinogradoff, S., Godbold, D. L., van Hees, P. A. W., and Jones, D. L. Aluminum complexation suppresses citrate uptake by acid forest soil microorganisms. Soil Biol. Biochem. 2004, 36, 353-357.
(8) Furrer, G. and Stumm, W. The coordination chemistry of weathering. 1. Dissolution kinetics of δ-Al2O3 and BeO. Geochim. Cosmochim. Acta 1986, 50, 1847-1860.

42
(9) Veneklaas, E. J., Stevens, J., Cawthray, G. R., Turner, S., Grigg, A. M., and Lambers, H. Chickpea and white lupin rhizosphere carboxylates vary with soil properties and enhance phosphorus uptake. Plant Soil 2003, 248, 187-197.
(10) Ae, N., Arihara, J., Okada, K., Yoshihara, T., and Johansen, C. Phosphorus uptake by pigeon pea and its role in cropping systems of the Indian subcontinent. Science 1990, 248, 477-480.
(11) Geelhoed, J. S., Van Riemsdijk, W. H., and Findenegg, G. R. Simulation of the effect of citrate exudation from roots on the plant availability of phosphate adsorbed on goethite. Eur. J. Soil Sci. 1999, 50, 379-390.
(12) Kirk, R. E. and Othmer, D. F. Kirk-Othmer Encyclopedia of Chemical Technology. 2004, New York: John Wiley.
(13) Rehim, S. S. A., Sayyah, S. M., and El Deeb, M. M. Corrosion of tin in citric acid solution and the effect of some inorganic anions. Mater. Chem. Phys. 2003, 80, 696-703.
(14) Seruga, M. and Hasenay, D. Electrochemical and surface properties of aluminium in citric acid solutions. J. Appl. Electrochem. 2001, 31, 961-967.
(15) Kristiansen, B., Mattey, M., and Linden, J. Citric Acid and Biotechnology. 1999, Philadelphia, PA: Taylor & Francis Inc.
(16) Krauskopf, K. Introduction to Geochemistry. 3rd ed. 1995, New York: McGraw-Hill.
(17) Morgan, J. J. Manganese in natural waters and earth's crust: Its availability to organisms. In Metal Ions in Biological Systems, H. Sigel, Editor. 2000, Dekker: New York. 1-34.
(18) Davison, W. Iron and manganese in lakes. Earth-Sci. Rev. 1993, 34, 119-163.
(19) Tournassat, C., Charlet, L., Bosbach, D., and Manceau, A. Arsenic(III) oxidation by birnessite and precipitation of manganese(II) arsenate. Environ. Sci. Technol. 2002, 36, 493-500.
(20) Eary, L. E. and Rai, D. Kinetics of chromium(III) oxidation to chromium(VI) by reaction with manganese-dioxide. Environ. Sci. Technol. 1987, 21, 1187-1193.
(21) Stone, A. T. and Morgan, J. J. Reduction and dissolution of manganese (III) and manganese (IV) oxides by organics. 1. Reaction with hydroquinone. Environ. Sci. Technol. 1984, 18, 450-456.
(22) Stone, A. T. and Morgan, J. J. Reduction and dissolution of manganese (III) and manganese (IV) oxides by organics: 2. Survey of the reactivity of organics. Environ. Sci. Technol. 1984, 18, 617-624.

43
(23) Stone, A. T. Reductive dissolution of manganese(III/IV) oxides by substituted phenols. Environ. Sci. Technol. 1987, 21, 979-988.
(24) Xyla, A. G., Sulzberger, B., Luther, G. W., Hering, J. G., Vancappellen, P., and Stumm, W. Reductive dissolution of manganese(III,IV) (hydr)oxides by oxalate - the effect of pH and light. Langmuir 1992, 8, 95-103.
(25) McArdell, C. S., Stone, A. T., and Tian, J. Reaction of EDTA and related aminocarboxylate chelating agents with CoIIIOOH (heterogenite) and MnIIIOOH (manganite). Environ. Sci. Technol. 1998, 32, 2923-2930.
(26) Klewicki, J. K. and Morgan, J. J. Dissolution of β−MnOOH particles by ligands: Pyrophosphate, ethylenediaminetetraacetate, and citrate. Geochim. Cosmochim. Acta 1999, 63, 3017-3024.
(27) Nowack, B. and Stone, A. T. Homogeneous and heterogeneous oxidation of nitrilotrismethylenephosphonic acid (NTMP) in the presence of manganese (II, III) and molecular oxygen. J. Phys. Chem. B 2002, 106, 6227-6233.
(28) Filius, J. D., Hiemstra, T., and Van Riemsdijk, W. H. Adsorption of small weak organic acids on goethite: Modeling of mechanisms. J. Colloid Interf. Sci. 1997, 195, 368-380.
(29) Cornell, R. M. and Schindler, P. W. Infrared study of the adsorption of hydroxycarboxylic acids on α-FeOOH and amorphous Fe (III)hydroxide. Colloid Polym. Sci. 1980, 258, 1171-1175.
(30) Geelhoed, J. S., Hiemstra, T., and Van Riemsdijk, W. H. Competitive interaction between phosphate and citrate on goethite. Environ. Sci. Technol. 1998, 32, 2119-2123.
(31) Lackovic, K., Johnson, B. B., Angove, M. J., and Wells, J. D. Modeling the adsorption of citric acid onto muloorina illite and related clay minerals. J. Colloid Interf. Sci. 2003, 267, 49-59.
(32) Whitehead, C. F. Speciation of Carboxylate-Containing Chelating Agent in The Presence of Iron (Hydr)oxide Minerals and Metal Ions. Ph.D. dissertation, 2003, The Johns Hopkins University: Baltimore, MD.
(33) Zhang, Y., Kallay, N., and Matijevic, E. Interactions of metal hydrous oxides with chelating-agents .7. Hematite-oxalic acid and hematite-citric acid systems. Langmuir 1985, 1, 201-206.
(34) Godtfredsen, K. L. and Stone, A. T. Solubilization of manganese dioxide-bound copper by naturally occurring organic compounds. Environ. Sci. Technol. 1994, 28, 1450-1458.

44
(35) Kostka, J. E., Luther, G. W., and Nealson, K. H. Chemical and biological reduction of Mn(III)-pyrophosphate complexes - potential importance of dissolved Mn(III) as an environmental oxidant. Geochim. Cosmochim. Acta 1995, 59, 885-894.
(36) Luo, J. A., Zhang, Q. H., and Suib, S. L. Mechanistic and kinetic studies of crystallization of birnessite. Inorg. Chem. 2000, 39, 741-747.
(37) Silvester, E., Manceau, A., and Drits, V. A. Structure of synthetic monoclinic Na-rich birnessite and hexagonal birnessite .2. Results from chemical studies and exafs spectroscopy. Am. Mineral. 1997, 82, 962-978.
(38) Post, J. E. Manganese oxide minerals: Crystal structures and economic and environmental significance. P. Natl Acad. Sci. USA 1999, 96, 3447-3454.
(39) Wang, X. and Li, Y. D. Synthesis and formation mechanism of manganese dioxide nanowires/nanorods. Chem.-Eur. J. 2003, 9, 300-306.
(40) Clesceri, L. S., Eaton, A. D., and Greenberg, A. E., eds. Standard Methods for the Examination of Water and Wastewater. 20th ed. 2000, American Public Health Association; American Water Works Association; Water Pollution Control Federation: Washington, DC.
(41) Carbonaro, R. F. and Stone, A. T. Speciation of chromium(III) and cobalt(III) (amino)carboxylate complexes using capillary electrophoresis. Anal. Chem. 2005, 77, 155-164.
(42) Burgisser, C. S. and Stone, A. T. Determination of EDTA, NTA, and other amino carboxylic acids and their Co(II) and Co(III) complexes by capillary electrophoresis. Environ. Sci. Technol. 1997, 31, 2656-2664.
(43) Cotton, F. A., Wilkinson, G., Murillo, C. A., and Bochmann, M. Advanced Inorganic Chemistry. 6th ed. 1999, New York: Wiley Interscience. 757-775.
(44) Shriver, D., and Atkins, P. Inorganic Chemistry. 3rd ed. 1999, New York: W.H. Freeman and Company.
(45) Press, W. H., Flannery, B. P., Teukolsky, S. A., and Vetterling, W. T. Numerical Recipes. 1986, Cambridge: Cambridge University Press.
(46) Datta, S. P., Grzybows.Ak, and Tate, S. S. Metal-catalysed decomposition of α-hydroxypolycarboxylic acids. Nature 1965, 207, 1047-1049.
(47) Khan, Z., Akram, M., and Kabir Ud, D. A kinetic study of the one-step three-electron oxidation of citric acid by chromium(VI). Oxid. Commun. 2001, 24, 257-267.

45
(48) Larson, R. A. and Rockwell, A. L. Chloroform and chlorophenol production by decarboxylation of natural acids during aqueous chlorination. Environ. Sci. Technol. 1979, 13, 325-329.
(49) Abrahamson, H. B., Rezvani, A. B., and Brushmiller, J. G. Photochemical and spectroscopic studies of complexes of iron(III) with citric acid and other carboxylicacids. Inorg. Chim. Acta 1994, 226, 117-127.
(50) Stone, A. T., Godtfredsen, K. L., and Deng, B. L. Sources and reactivity of reductants encountered in aquatic environments. In Chemistry of Aquatic Systems: Local and Global Perspectives, G. Bidoglio and W. Stumm, Editors. 1994, Kluwer: Dordrecht, the Netherlands. 337-374.
(51) Houghton, R. P. Metal Complexes in Organic Chemistry. Cambridge texts in chemistry and biochemistry, ed. D.T. Elmore, et al. 1979, London: Cambridge University Press.
(52) Stone, A. T. and Morgan, J. J. Chapter 9: Reductive dissolution of metal oxides. In Aquatic surface chemistry: Chemical Processes at the Particle-Water Interface, W. Stumm, Editor. 1987, John Wiley: New York. 221-254.
(53) Logan, S. R. Fundamentals of Chemical Kinetics. 1996, Essex, England: Longman Group Limited.
(54) Epstein, I. R. and Pojman, J. A. An Introduction to Nonlinear Chemical Dynamics: Oscillations, Waves, Patterns, and Chaos. 1998, New York: Oxford University Press.
(55) Bazsa, G., Nagy, I. P., and Lengyel, I. The nitric-acid nitrous-acid and ferroin ferriin system - a reaction that demonstrates autocatalysis, reversibility, pseudo orders, chemical waves, and concentration jump. J. Chem. Educ. 1991, 68, 863-868.
(56) Kurin-Csorgei, K., Epstein, I. R., and Orban, M. New heterogeneous chemical oscillators: Reduction of manganese species by hypophosphite on a Pt surface. J. Phys. Chem. B 2004, 108, 7352-7358.
(57) Martell, A. E., Smith, R. M., and Motekaitis, R. J. NIST Critically Selected Stability Constants of Metal Complexes Database. 2004, US Department of Commerce, National Institute of Standards and Technology: Gaithersburg, MD.
(58) Carberry, J. J. Chemical and Catalytic Reaction Engineering. 1976, New York: McGraw-Hill.
(59) Fogler, S. Elements of Chemical Reaction Engineering. 2nd ed. 1992, Englewood Cliffs, NJ: Prentice Hall.

46
(60) Yao, W. S. and Millero, F. J. Adsorption of phosphate on manganese dioxide in seawater. Environ. Sci. Technol. 1996, 30, 536-541.
(61) Cambier, P. and Sposito, G. Adsorption of citric-acid by synthetic pseudoboehmite. Clay Clay Miner. 1991, 39, 369-374.
(62) Kummert, R. and Stumm, W. The surface complexation of organic-acids on hydrous γ-Al2O3. J. Colloid Interf. Sci. 1980, 75, 373-385.
(63) Jardine, P. M. and Taylor, D. L. Kinetics and mechanisms of Co(II)EDTA oxidation by pyrolusite. Geochim. Cosmochim. Acta 1995, 59, 4193-4203.
(64) Carbonaro, R. F. Sources, Sinks, and Speciation of Chromium(III) (Amino)carboxylate Complexes in Heterogeneous Aqueous Media, in Department of Geography and Environmental Engineering. Ph.D. dissertation, 2004, The Johns Hopkins University: Baltimore. Chapter 3.
(65) Baumgartner, E., Blesa, M. A., Marinovich, H. A., and Maroto, A. J. G. Heterogeneous electron-transfer as a pathway in the dissolution of magnetite in oxalic-acid solutions. Inorg. Chem. 1983, 22, 2224-2226.
(66) Blesa, M. A., Marinovich, H. A., Baumgartner, E. C., and Maroto, A. J. G. Mechanism of dissolution of magnetite by oxalic acid-ferrous ion solutions. Inorg. Chem. 1987, 26, 3713-3717.
(67) Afonso, M. D., Morando, P. J., Blesa, M. A., Banwart, S., and Stumm, W. The reductive dissolution of iron-oxides by ascorbate - the role of carboxylate anions in accelerating reductive dissolution. J. Colloid Interf. Sci. 1990, 138, 74-82.
(68) Suter, D., Banwart, S., and Stumm, W. Dissolution of hydrous iron(III) oxides by reductive mechanisms. Langmuir 1991, 7, 809-813.
(69) Ballesteros, M. C., Rueda, E. H., and Blesa, M. A. The influence of iron (II) and (III) on the kinetics of goethite dissolution by EDTA. J. Colloid Interf. Sci. 1998, 201, 13-19.
(70) Sulzberger, B., Suter, D., Siffert, C., Banwart, S., and Stumm, W. Dissolution of Fe(III)(hydr)oxides in natural-waters - laboratory assessment on the kinetics controlled by surface coordination. Mar. Chem. 1989, 28, 127-144.
(71) Klewicki, J. K. and Morgan, J. J. Kinetic behavior of Mn(III) complexes of pyrophosphate, EDTA, and citrate. Environ. Sci. Technol. 1998, 32, 2916-2922.
(72) Laha, S. and Luthy, R. G. Oxidation of aniline and other primary aromatic-amines by manganese-dioxide. Environ. Sci. Technol. 1990, 24, 363-373.

47
Table 2.1. Effect of Additives on Rates of 3-Ketoglutarate Production (rmax) for 200 µM MnO2 Suspensions Containing 200 µM Citrate, and 10 mM MOPS buffer (pH 7.1). Additive
rmax (µM/h)
Normalized rate
-
13.6
1.0
10 µM ZnII 11.8 0.87 200 µM ZnII 0.9 0.066 10 µM MnII 13.7 1.0 200 µM MnII 11.3 0.83 500 µM MnII 6.6 0.49 1000 µM MnII 4.0 0.29

48
Table 2.2. MnII Aqueous Phase Speciation Calculations in Support of Additive Experiments. Conditions: 10 µM MnII, 200 µM Citrate, pH 7.1, 10 mM Ionic Strength. (Citrate Ligand is Abbreviated as Cit.) No Additive 8.46 µM MnIIcit- 1.51 µM Mn2+ 0.022 µM MnIIHcit0
10 µM ZnII 8.48 µM MnIIcit- 1.50 µM Mn2+ 0.022 µM MnIIHcit0
200 µM ZnII 3.59 µM MnIIcit- 6.39 µM Mn2+ 0.0092 µM MnIIHcit0
5.0 mM Orthophosphate 5.78 µM MnIIcit- 1.02 µM Mn2+ 0.015 µM MnIIHcit0 3.18 µM MnIIHPO4
0
0.20 mM Pyrophosphate (PP) 6.21 µM MnIIcit- 1.09 µM Mn2+ 0.016 µM MnIIHcit0 2.68 µM MnIIPP2-
49
pH
4 5 6 7 8 9
Mn
II (ad
s) (
µM)
0
4
8
12
16
20(a)
MnII(aq) (µM)
0 20 40 60 80 100
Mn
II (ad
s) (
µM)
0
2
4
6
8
10
12(b)
no NaCl10.0 mM NaCl
Figure 2.1. MnII adsorption onto 200 µM MnO2 as a function of (a) pH and (b) [MnII(aq)]. In (a), 20 µM MnII was employed, and the pH was fixed using HCl and NaOH additions. In (b), the pH was set using 10 mM MOPS buffer (pH 7.1); the fitted line corresponds to a fit to the Langmuir Equation (see text).

50
(a) From citrate to 3-ketoglutarate: oxidative decarboxylation
3-ketoglutaratecitrate
+ H+ + CO2 + 2e-
(b) From 3-ketoglutarate to acetoacetate: nonredox decarboxylation
Case 1: decarboxylation without metal ion participation
+ CO2
3-ketoglutarate
Case 2: metal ion-catalyzed decarboxylation
+ Me(n+1)+ + CO2
+ H+ + Me(n+1)+
3-ketoglutarate
rapid tautomerization:
enol form keto form (acetoacetate) Figure 2.2. Mechanisms for (a) the oxidative decarboxylation of citrate, yielding 3-ketoglutarate, and (b) the non-redox rearrangement of 3-ketoglutarate, yielding acetoacetate (51).

51
Time (h)
0 4 8 12 16 20 24
[Mn
III(a
q)]
(µM
)
0
1
2
3
4
5
[i]
( µM
)
0
40
80
120
160
200
240citrate(aq)Mn(aq)3-ketoglutarate(aq)acetoacetate(aq)mass balance-organics
1 2 3
Stage:
Time (h)
2 3 4 5 6 7
[3-K
eto
glu
tara
te]
( µM
)
0
20
40
60
80Stage 2 data
rmax = slope
Figure 2.3. Illustrative time course for the reaction of 200 µM citrate with 200 µM MnO2 in suspensions containing 10 mM MOPS buffer (pH 7.1) and 10 mM NaCl. The mass balance refers to the sum [citrate(aq)] + [3-ketoglutarate(aq)] + [acetoacetate(aq)]. An initial induction period (Stage 1) is followed by an acceleratory stage (Stage 2) and eventual deceleration (Stage 3) as reactants become depleted.

52
[i] (
µM)
0
10
20
30
40
50
Time (h)0 6 12 18 24
Rat
e ( µ
M/h
)
0
1
2
3
4
50
10
20
30
40
50
Time (h)0 10 20 30 40
0
1
2
3
4
Time (h)0 40 80 120 160
0.0
0.2
0.4
0.6
0
10
20
30
40
50
Time (h)0 4 8 12 16
0
2
4
6
0
10
20
30
40
50
Time (h)0 1 2 3 4
0
10
20
30
400
10
20
30
40
50
2.2 × 10⁻⁶
1.7 × 101k1* (s-1): 2.2 × 10⁻⁶
k2* (M-1 s-1): 1.72.2 × 10-7
1.72.2 × 10-5
1.72.2 × 10-6
1.7 × 10⁻¹
(a) (b) (c) (d) (e)
rr2
r1
r2
r1
r
[A] [P]
(tin, rmax)
rr2
r1
r2
r1
r
r2r1
r
Figure 2.4. Simulated time course plots (upper) and rates as a function of time (lower, corresponding to the first derivative) based upon Reactions 1 and 2 presented in the text. (a) represents the best fit to an experiment employing [Citrate]o = 50 µM and [MnO2]o = 200 µM, pH 7.1.

53
Time (h)
0 4 8 12 16 20 24
n' (
or
n)
0.9
1.1
1.3
1.5
1.7
1.9
2.1MnIII
MnIV
Mn3.78
experimental
Figure 2.5. Yield of MnII per mole of citrate oxidized (see text) for a suspension containing 200 µM citrate, 200 µM MnO2, and 10 mM MOPS buffer (pH 7.1). Experimental values (n') were obtained from the experiment presented in Figure 2.3. Theoretical values (n) are shown as straight lines for a (hydr)oxide consisting solely of MnIII, for one consisting solely of MnIV, and for one where the average manganese oxidation state is +3.78.

54
Time (h)
0 2 4 6 8 10 12
[3-K
eto
glu
tara
te]
( µM
)
0
20
40
60
80
100
120
[3-K
eto
glu
tara
te]
( µM
)
0
20
40
60
80
100
120
Mn
(aq
) ( µ
M)
0
20
40
60
80
100
120
(a)
(b)
no metal ion10 µM ZnII
200 µM ZnII
10 µM MnII
200 µM MnII
500 µM MnII
1000 µM MnII
Figure 2.6. The effect of adding (a) ZnII and (b) MnII at the onset of the reaction. In the upper plot, the symbol -◊- corresponds to Mn(aq) released when 200 µM ZnII is added without citrate. Reaction conditions: 200 µM citrate, 200 µM MnO2, and 10 mM MOPS buffer (pH 7.1).

55
Time (h)
0 4 8 12 16 20 24 28
[3-K
eto
glu
tara
te]
( µM
)
0
20
40
60
80
100
120
140
[Citrate]0 (mM)
0 1 2 3 4 5
r max
(µM
/ h
)
0
10
20
30
40
50
60
70
(a)
(b)
5.0 mM1.0 mM200 µM100 µM50 µM
Figure 2.7. Effect of increasing citrate concentration on (a) 3-ketoglutarate production; (b) rmax, the fitted line corresponds to a fit to the Langmuir-Hinshelwood rate expression (see text). All suspensions contained 200 µM MnO2 and 10 mM MOPS (pH 7.1).

56
Time (h)
0 4 8 12 16 20 24
[3-K
eto
glu
tara
te]
( µM
)
0
20
40
60
80
100
120
140
no additives0.2 mM pyrophosphate5.0 mM orthophosphate
Figure 2.8. Effects of adding pyrophosphate and orthophosphate at the onset of reaction. Reaction conditions: 200 µM citrate, 200 µM MnO2, and 10 mM MOPS buffer (pH 7.1).

57
Time (h)
0 4 8 12 16 20 24
[3-K
eto
glu
tara
te]
( µM
)
0
20
40
60
80
100
120
140
No additives10 µM MnII
200 µM pyrophosphate10 µM MnII + 200 µM pyrophosphate
Figure 2.9. Effects of adding MnII and pyrophosphate, alone or together, at the onset of reaction. Reaction conditions: 200 µM citrate, 200 µM MnO2, and 10 mM MOPS buffer (pH 7.1).

58
Time (h)
0 2 4 6 8 10 12
[3-K
eto
glu
tara
te]
( µM
)
0
30
60
90
120
150
180
(b)
(a)
pH
5.0 5.5 6.0 6.5 7.0 7.5
r max
(µM
/ h
)
0
20
40
60
80
100
120
140
pH
5.0 5.5 6.0 6.5 7.0 7.5
log
(r m
ax)
1.0
1.2
1.4
1.6
1.8
2.0
2.2
0.02 0.58
0.58
0.74
pH 5.6pH 6.0pH 6.6pH 7.1
pH 5.1
Figure 2.10. (a) Time course plots for 3-ketoglutarate production as a function of pH. (b) rmax as a function of pH (semi-log plot is shown on the left. The log-log plot on the right shows the order with respect to [H+] as the slope for lines connecting successive pairs of points.) All suspensions contained 200 µM MnO2, and 10 mM pH buffer. (Butyrate buffer was used for pH 5.1 and 5.6; MES for pH 6.0 and 6.6; MOPS for pH 7.1.)

59
>MnIII/IV
MnII-Citrate
MnIII-CitrateMn2+ +
Mn2+
3-Ketoglutarate and Acetoacetate
Citrate
Figure 2.11. Interfacial MnIII/II citrate reactions responsible for autocatalysis.