The CIS area corporate credit universe in early 2016 ... · The CIS area corporate credit universe...
34
1 The CIS area corporate credit universe in early 2016: priced to perfection? 12 May 2016 When we took a close look at the CIS area corporate credit space six months ago, our conclusion was that the harsh business environment was forcing many borrowers (particularly, in Russia’s mining sector) to deleverage and strengthen free cash flow generation, paving way to spread compression in future. However, the swift turnaround in sentiment on the back of a recovery in commodity prices and a distinctly more dovish outlook for monetary policy globally have resulted in a euphoria that took spreads back to levels last seen at much higher levels of economic growth, commodity prices and profits. While many companies have used the abundant local market liquidity for further deleveraging, there were notable exceptions. The hunt for yield has driven corporate spreads in the CIS to 12-month lows, often ignoring fundamentals and benefiting the weakest credits disproportionately. We doubt the sustainability of the recent increases in commodity prices and struggle to find value in this environment. Our top picks at present are the strongest credits in this pool that should suffer least once market views on either China’s recovery or US interest rates shift again, in particular Alrosa and Phosagro. In this report we present an overview of the non-financial credit space in the CIS, with a particular focus on Russia’s metals and mining sector, alongside two non-Russian issuers (from Georgia and Ukraine). See inside cover for analyst contacts and disclosures
Transcript of The CIS area corporate credit universe in early 2016 ... · The CIS area corporate credit universe...

1
The CIS area corporate credit universe in early 2016: priced to perfection?
12 May 2016
When we took a close look at the CIS area corporate credit space six months ago, our conclusion was that
the harsh business environment was forcing many borrowers (particularly, in Russia’s mining sector) to
deleverage and strengthen free cash flow generation, paving way to spread compression in future.
However, the swift turnaround in sentiment on the back of a recovery in commodity prices and a
distinctly more dovish outlook for monetary policy globally have resulted in a euphoria that took
spreads back to levels last seen at much higher levels of economic growth, commodity prices and
profits.
While many companies have used the abundant local market liquidity for further deleveraging, there
were notable exceptions. The hunt for yield has driven corporate spreads in the CIS to 12-month lows,
often ignoring fundamentals and benefiting the weakest credits disproportionately. We doubt the
sustainability of the recent increases in commodity prices and struggle to find value in this
environment. Our top picks at present are the strongest credits in this pool that should suffer least once
market views on either China’s recovery or US interest rates shift again, in particular Alrosa and
Phosagro.
In this report we present an overview of the non-financial credit space in the CIS, with a particular focus
on Russia’s metals and mining sector, alongside two non-Russian issuers (from Georgia and Ukraine).
See inside cover for analyst contacts and disclosures

2
TABLE OF CONTENTS
Overview of the CIS area non-financial corporate credits 3
Recent performance of select CIS corporate credits in 2015 4
Severstal 6
NLMK 8
EVRAZ 10
Metalloinvest 12
Norilsk Nickel 14
TMK 16
Polyus Gold 18
Nordgold 20
Alrosa 22
Uralkali 24
Phosagro 26
Eurochem 28
MHP 30
Georgian Oil and Gas Corporation 32
Disclosures 34
All charts data are as of 12 May 2016. Sources for all market charts are Bloomberg and for all company-specific
graphs are corresponding company data.
Norvik Banka Research Sergei Voloboev, Head of Research (London) +44 20 7259 8854
Research contacts: Pavel Specivtsev, Economist (Moscow) [email protected]
We would like to acknowledge the substantial input of Maxim Serous CFA, a consultant for Norvik Banka UK, into
the preparation of this report
Norvik Banka Research is a Trading Name of Norvik Banka UK Ltd, which is Authorised and Regulated by the Financial Conduct
Authority, FRN: 681329. Registered in England and Wales with number 08940522. Registered Office: 46/48 Grosvenor Gardens 1st
Floor, London, SW1W 0EB.

3
Overview of the CIS area non-financial corporate credits in late 2015 and early 2016
We highlight below the key factors influencing non-financial sector credits in Russia and the CIS in 2015-2016.
Abundant liquidity in the local market. The turnaround in commodities in Q1, most notably oil, has led to
sustained currency appreciation in Russia and, to a lesser extent, other CIS states. The ensuing strong rally in
local fixed income markets has helped drive sovereign yields lower, thus boosting demand for corporate debt.
Excess liquidity spilled over to Russia’s local money market, with Sberbank slashing short-term USD deposit
rates to near-zero amid lack of reinvestment opportunities and high quality borrowers. We think this trend
also reflects general lack of demand for foreign currency funding, especially among companies without FX
revenues. A number of companies with large FX mismatch between revenues and liabilities (Evraz, TMK) have
been working to reduce this gap by raising funds in the local bond market and using proceeds to repay FX
debt. Another trend, driven by improved access to liquidity, was to push out debt maturities though Eurobond
buybacks. Both Evraz and TMK have pursued this strategy helping to lift short-term liquidity pressures and
gaining time for dealing with the challenges of high leverage.
Primary Eurobond market has reopend for corporate issuers. This window closed over the winter months
during the period of acute risk off mode triggered by falling commodity prices and uncertainty over FOMC
intentions. However, a rebound in oil and improved investor sentiment have helped to reopen market access
leading to placement of several new issues by Russian borrowers, including Global Ports ($350 mn), Gazprom
(CHF 500 mn), Vimpelcom ($1.2 bn) and B&N Bank ($150 mn). Western sanctions against Russia have
prevented a return to the market by the Russian sovereign and continue to restrict issuance by Russia’s quasi-
sovereign entities. While an early return to the market by the entities affected by the sanctions is unlikely, we
expect to see more Eurobond placements by private sector borrowers provided the current favourable
condiditons persist.
Rapid compression of credit spreads. The abundant liquidity and aggressive hunt for yields have resulted in a
rapid compression of credit spread in the Russian corporate Eurobond space, especially in the riskier segment.
Notably, the spread of Evraz-2020 to Russia-2020 reached a historic minimum in May despite further
increases in the company’s leverage. The spread of Polyus Gold to Russia-2020 was close to a historic average
despite accumulation of significant debt at the parent company’s level following completion of the share
buyback. Given the current tight corporate spreads by historic standards, we see little upside for bond prices
from current levels. Any further spread tightening would require additional increases in oil prices, or lifting of
Western sanctions, in our view.
Divergence in deleveraging trends. Although many companies in our sample continued to pay down debt in
H2 2015, others chose to halt this process (Metalloinvest). Furthemore, Norilsk Nickel announced changes to
its dividend policy which imply an increase in leverage. We also note that during 2015 companies were been
increasingly turning to dividend payments as a key use of their cash flows. This was primarily the result of
scarcity of reinvestment opportunities against the backdrop of weak commodity prices and completion of
modernization programs. We see such a trend in the Metal and Mining sector (NLMK, Severstal) and among
fertilizer producers (Phosagro, Eurochem). At the same time, some companies targeting lower leverage ratios
continued to implement their deleveraging strategy (Evraz, TMK, Alrosa), with varying degrees of success. We
expect deleveraging among the non-financial sector borrowers to continue in 2016 (with certain exceptions),
albeit at a significantly slower pace compared to 2014 and 2015. This should provide support to bond prices in
the current volatile environment (including for commodity prices), in our view.

4
The charts below illustrate spread performance of these issuers over the past 12 months, against UST and CIS sovereigns.

5
RUB flexibility cushioned commodity price declines
The second half of 2015 was marked by significant
declines in commodity prices and an increase in risk
aversion among investors. To make things worse for
many export-oriented companies in the CIS, the pace
of exchange rate adjustment typically lagged those
of commodity price declines. This was particularly
relevant for companies in Kazahstan and Azerbaijan
where the central bank decisions to delay exchange
rate liberalization in the face of falling oil prices have
led to significant deterioration in external accounts
and corporate profitability.
Conversely, for Russia-based exporters, the rapid
pace of RUB depreciation has cushioned the impact
on profits, by supporting the commodity prices in
rouble terms (iron ore prices in RUB are currently in
line with their levels in early 2014, while gold prices
in RUB have effecively doubled).
Despite the strong rebound in commodity prices
since the beginning of the year we see some of the
credits as increasingly vulnerable to further
deterioration in credit quality. We question the
sustainability of the recent recovery in commodity
prices, especially in iron ore and steel segments.
The hunt for yield has driven corporate spreads in
Russian space to 12-month lows, sometimes
ignoring deteriorating fundamentals. Key
beneficiaries of this improved market sentiment
have been the weakest corporate credits. We find it
hard to locate value in this environment and prefer
to focus on the strongest credits (from the BBB-/BB+
category), in particular Alrosa and Phosagro.
Further corporate yield compression in Russia
would require a material repricing of Russia’s
sovereign risk, which we find unlikely without either
lifting of the sanctions, a much higher level of oil
prices, or a proactive structural reform effort (hardly
a realistic possibility before the end of the current
polical cycle in 2018).

6
SEVERSTAL
Credit ratings (S&P/Moody’s/Fitch): BB+/Ba1/BB+
Industry: Metals and Mining
Summary
The company remained one of the strongest credits in
Russia’s Metals and Mining space in 2015. Severstal’s credit
profile is supported by low debt, positive free cash flow
generation in the challenging environment, flexible dividend
policy and a comfortable liquidity position. The risks come
mainly from overproduction in global steel markets. Due to
its low cost asset base, we find Severstal to be well
positioned to overcome the industry’s current headwinds.
Company profile
Severstal is a vertically integrated steel producer with assets
based primarily in Russia. The company is 110% self-
sufficient in iron ore and 96% in coking coal (based on 2015
data). With steel production at 11.5 mn t in 2015, the
company is among Russia’s top three steel producers after
NLMK and Evraz. Severstal is controlled by Alexey
Mordashov (79.2%); the remaining shares are in free float.
Debt/financial/liquidity profile
Revenue followed steel prices in H2, declining to $3,059 mn
(H1 2015: $3,337 mn) while sales volumes of steel products
increased by 4.5% YoY. In Q1 2016 sales of steel products
declined by 4% (production was down 2% YoY) as a result of
subdued domestic demand.
EBITDA declined by 21% in H2 2015 to $925 mn from $1,166
mn in H1 2015 as the positive effect of rouble depreciation
was outweighed by a slump in steel prices and inflation
pressures on the cost position. The Q1 2016 financial results
were even weaker, with revenue and EBITDA down 28% YoY
and 55% YoY respectively, due to a decline in sales volumes,
a lower share of high value-added products and weakness in
steel prices. At the same time, Q2 2016 is likely to show and
improvement in QoQ terms thanks to a rebound in steel
prices from multi-year lows in March.
A strong cash flow from operations at $1,093 mn (H1 2015:
$760 mn) was mainly the result of a working capital release
in Q3 2015. Capex remained low at $225 mn, which
supported free cash flow. Apart from debt reduction, the
key use of cash flow remained payment of dividends ($313
mn in H2 2015). The company maintained its dividend policy
which assumes paying 50% of net income as long as net
debt/EBITDA remains below 1.0x and 25% of net income if
net debt/EBITDA exceeds 1.0x.
The company continued to decrease leverage in 2015 as net
debt/EBITDA improved to 0.4x from 0.6x at end-H1 2015 and
0.7x at end-2014. Net debt repayment in H2 was $421 mn
(H1 2015: $558 mn), EBITDA/net interest expense improved
to an impressive 17.2x from 8.6x at end-2014. We expect the
company to maintain a strong credit profile in the next 12
months despite continuing headwinds in the industry.
Severstal’s available liquidity at the end of 2015 amounted
to $2,330 mn, including $1,647 mn of cash and $683 mn in
credit lines, versus short-term debt of $508 mn. 90.1% of
total debt is public and USD-denominated.
On 25 February 2016, 31 miners and 5 rescuers died as a
result of several gas explosions at the Severnaya coal mine in
the town of Vorkuta, in Russia’s Komi Republic. Following
the accident, Severstal paid RUB 163mn ($2.2 mn) to the
affected families and committed to spend another RUB 2 bn
in 2016 to increase safety at Vorkutaugol coal mines. On 6
March 2016, the company decided to flood the mine to stop
the underground fire. Severnaya mine accounted for 27% of
total coal concentrate production of Severstal in 2015.
RISKS
Prolonged weakness in steel prices and demand
Increased protectionism in external markets
Rouble appreciation
Production incidents
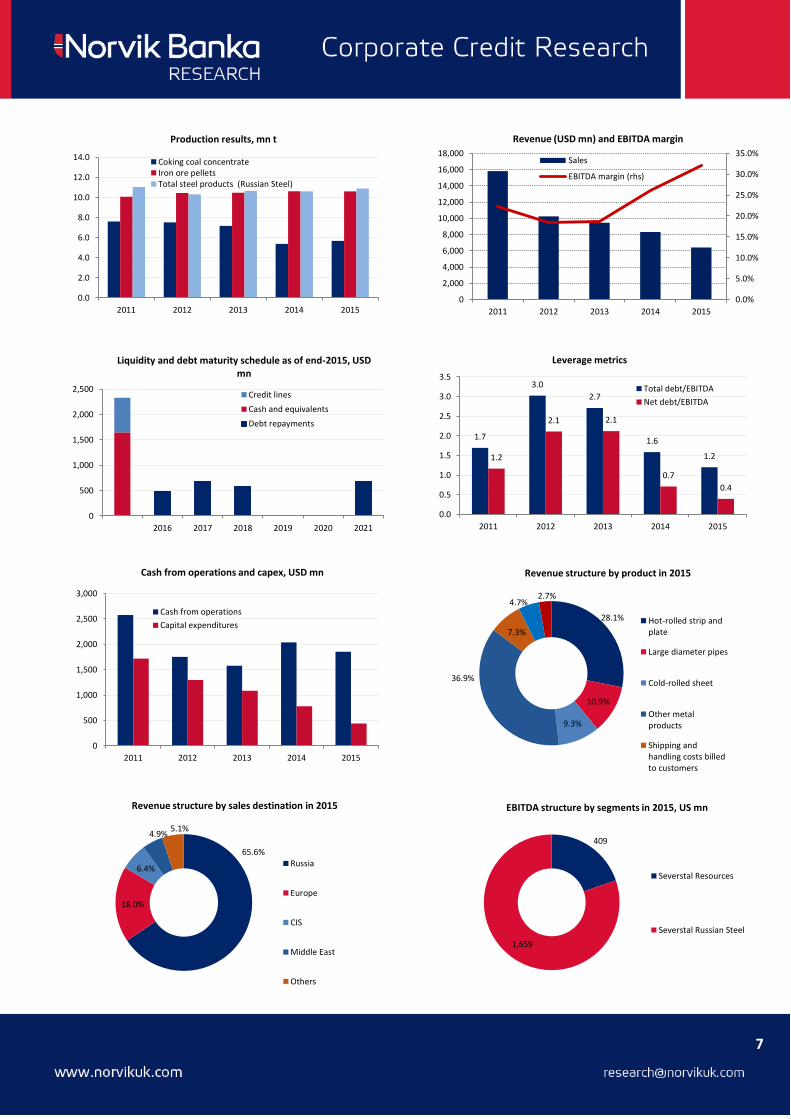
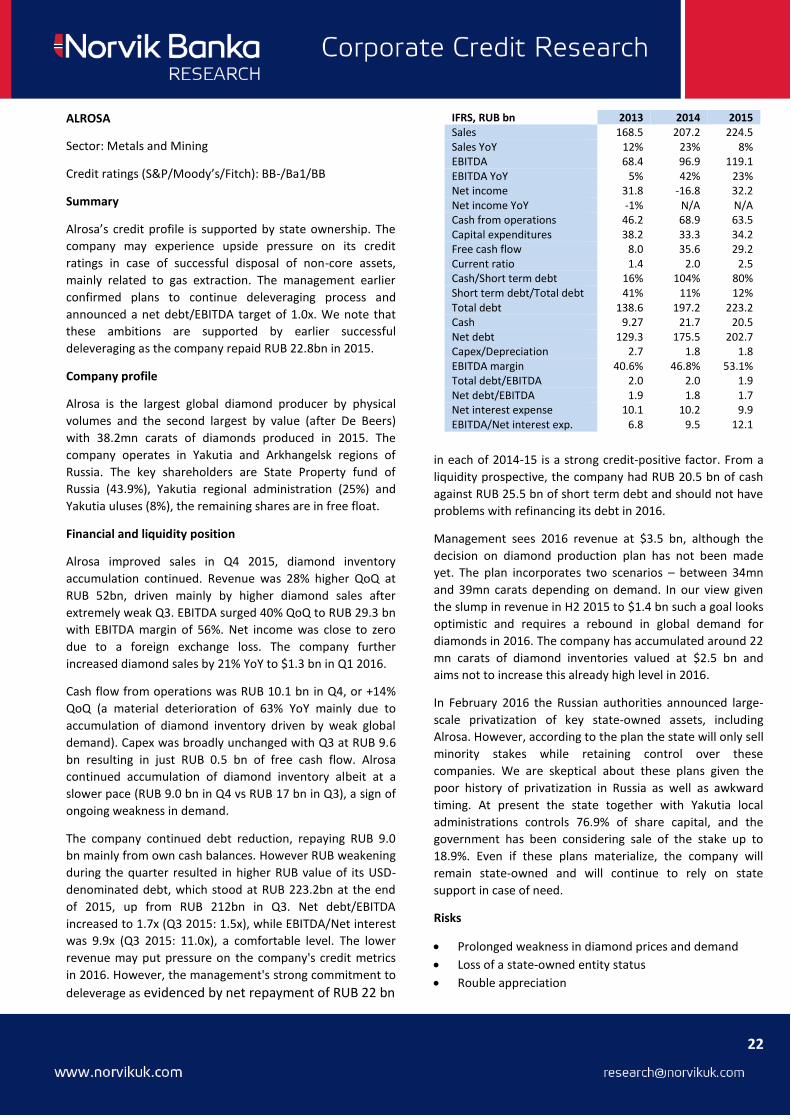
IFRS, USD mn 2013 2014 2015 Sales 9,434 8,296 6,396 Sales YoY -8% -12% -23% EBITDA 1,753 2,162 2,048 EBITDA YoY -8% 23% -5% Net income 89 -1,603 603 Net income YoY -89% NA NA Cash from operations 1,578 2,038 1,853 Capital expenditures 1,084 779 439 Free cash flow 494 1,259 1,414 Current ratio 1.9 2.1 2.3 Cash/Short term debt 1.7 2.4 3.2 Short term debt/Total debt 0.13 0.23 0.21 Total debt 4,754 3,429 2,452 Cash 1,036 1,897 1,647 Net debt 3,718 1,532 805 Capex/Depreciation 1.8 1.4 1.2 EBITDA margin 18.4% 24.9% 31.6% Total debt/EBITDA 2.7 1.7 1.2 Net debt/EBITDA 2.1 0.7 0.4 Net interest expense 300 239 117 EBITDA/Net int. expense 5.8 8.6 17.2
7
0.0
2.0
4.0
6.0
8.0
10.0
12.0
14.0
2011 2012 2013 2014 2015
Production results, mn t
Coking coal concentrateIron ore pelletsTotal steel products (Russian Steel)
0
500
1,000
1,500
2,000
2,500
2016 2017 2018 2019 2020 2021
Liquidity and debt maturity schedule as of end-2015, USD mn
Credit lines
Cash and equivalents
Debt repayments
0
500
1,000
1,500
2,000
2,500
3,000
2011 2012 2013 2014 2015
Cash from operations and capex, USD mn
Cash from operations
Capital expenditures
65.6%
18.0%
6.4%
4.9% 5.1%
Revenue structure by sales destination in 2015
Russia
Europe
CIS
Middle East
Others
0.0%
5.0%
10.0%
15.0%
20.0%
25.0%
30.0%
35.0%
0
2,000
4,000
6,000
8,000
10,000
12,000
14,000
16,000
18,000
2011 2012 2013 2014 2015
Revenue (USD mn) and EBITDA margin
Sales
EBITDA margin (rhs)
1.7
3.0
2.7
1.6
1.2 1.2
2.1 2.1
0.7
0.4
0.0
0.5
1.0
1.5
2.0
2.5
3.0
3.5
2011 2012 2013 2014 2015
Leverage metrics
Total debt/EBITDA
Net debt/EBITDA
28.1%
10.9%
9.3%
36.9%
7.3%
4.7% 2.7%
Revenue structure by product in 2015
Hot-rolled strip andplate
Large diameter pipes
Cold-rolled sheet
Other metalproducts
Shipping andhandling costs billedto customers
409
1,659
EBITDA structure by segments in 2015, US mn
Severstal Resources
Severstal Russian Steel
8
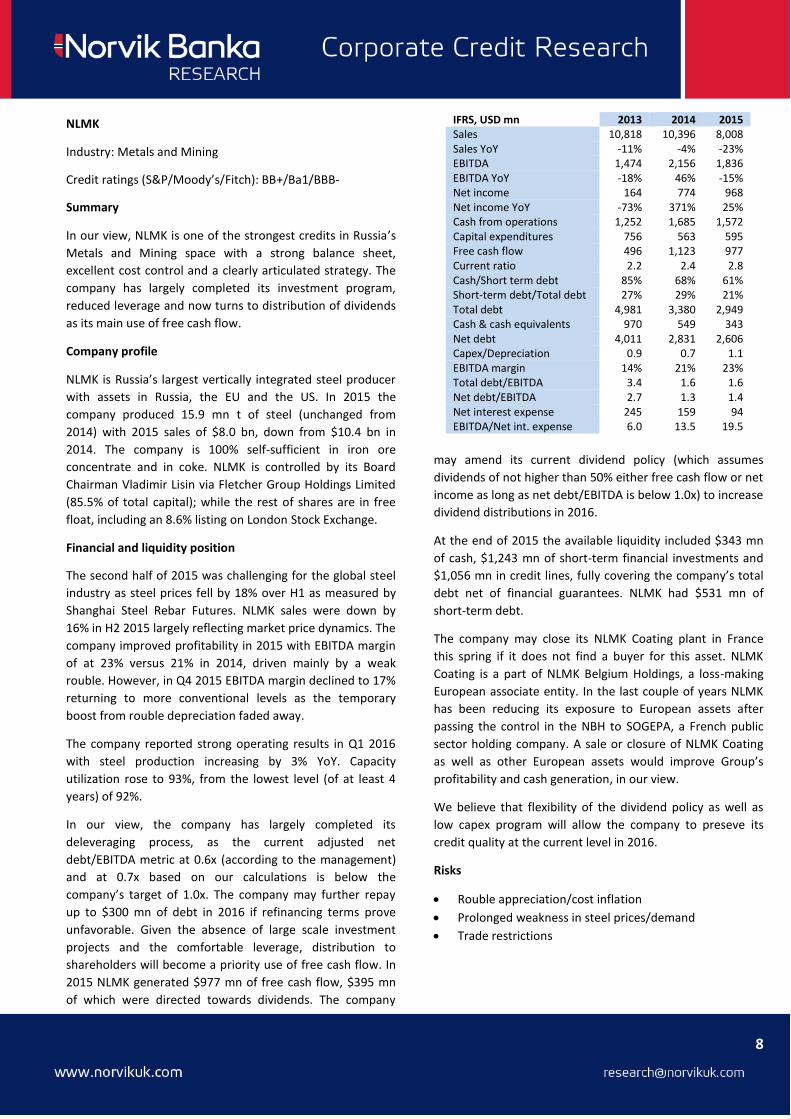
IFRS, USD mn 2013 2014 2015 Sales 10,818 10,396 8,008 Sales YoY -11% -4% -23% EBITDA 1,474 2,156 1,836 EBITDA YoY -18% 46% -15% Net income 164 774 968 Net income YoY -73% 371% 25% Cash from operations 1,252 1,685 1,572 Capital expenditures 756 563 595 Free cash flow 496 1,123 977 Current ratio 2.2 2.4 2.8 Cash/Short term debt 85% 68% 61% Short-term debt/Total debt 27% 29% 21% Total debt 4,981 3,380 2,949 Cash & cash equivalents 970 549 343 Net debt 4,011 2,831 2,606 Capex/Depreciation 0.9 0.7 1.1 EBITDA margin 14% 21% 23% Total debt/EBITDA 3.4 1.6 1.6 Net debt/EBITDA 2.7 1.3 1.4 Net interest expense 245 159 94 EBITDA/Net int. expense 6.0 13.5 19.5
NLMK
Industry: Metals and Mining
Credit ratings (S&P/Moody’s/Fitch): BB+/Ba1/BBB-
Summary
In our view, NLMK is one of the strongest credits in Russia’s
Metals and Mining space with a strong balance sheet,
excellent cost control and a clearly articulated strategy. The
company has largely completed its investment program,
reduced leverage and now turns to distribution of dividends
as its main use of free cash flow.
Company profile
NLMK is Russia’s largest vertically integrated steel producer
with assets in Russia, the EU and the US. In 2015 the
company produced 15.9 mn t of steel (unchanged from
2014) with 2015 sales of $8.0 bn, down from $10.4 bn in
2014. The company is 100% self-sufficient in iron ore
concentrate and in coke. NLMK is controlled by its Board
Chairman Vladimir Lisin via Fletcher Group Holdings Limited
(85.5% of total capital); while the rest of shares are in free
float, including an 8.6% listing on London Stock Exchange.
Financial and liquidity position
The second half of 2015 was challenging for the global steel
industry as steel prices fell by 18% over H1 as measured by
Shanghai Steel Rebar Futures. NLMK sales were down by
16% in H2 2015 largely reflecting market price dynamics. The
company improved profitability in 2015 with EBITDA margin
of at 23% versus 21% in 2014, driven mainly by a weak
rouble. However, in Q4 2015 EBITDA margin declined to 17%
returning to more conventional levels as the temporary
boost from rouble depreciation faded away.
The company reported strong operating results in Q1 2016
with steel production increasing by 3% YoY. Capacity
utilization rose to 93%, from the lowest level (of at least 4
years) of 92%.
In our view, the company has largely completed its
deleveraging process, as the current adjusted net
debt/EBITDA metric at 0.6x (according to the management)
and at 0.7x based on our calculations is below the
company’s target of 1.0x. The company may further repay
up to $300 mn of debt in 2016 if refinancing terms prove
unfavorable. Given the absence of large scale investment
projects and the comfortable leverage, distribution to
shareholders will become a priority use of free cash flow. In
2015 NLMK generated $977 mn of free cash flow, $395 mn
of which were directed towards dividends. The company
may amend its current dividend policy (which assumes
dividends of not higher than 50% either free cash flow or net
income as long as net debt/EBITDA is below 1.0x) to increase
dividend distributions in 2016.
At the end of 2015 the available liquidity included $343 mn
of cash, $1,243 mn of short-term financial investments and
$1,056 mn in credit lines, fully covering the company’s total
debt net of financial guarantees. NLMK had $531 mn of
short-term debt.
The company may close its NLMK Coating plant in France
this spring if it does not find a buyer for this asset. NLMK
Coating is a part of NLMK Belgium Holdings, a loss-making
European associate entity. In the last couple of years NLMK
has been reducing its exposure to European assets after
passing the control in the NBH to SOGEPA, a French public
sector holding company. A sale or closure of NLMK Coating
as well as other European assets would improve Group’s
profitability and cash generation, in our view.
We believe that flexibility of the dividend policy as well as
low capex program will allow the company to preseve its
credit quality at the current level in 2016.
Risks
Rouble appreciation/cost inflation
Prolonged weakness in steel prices/demand
Trade restrictions
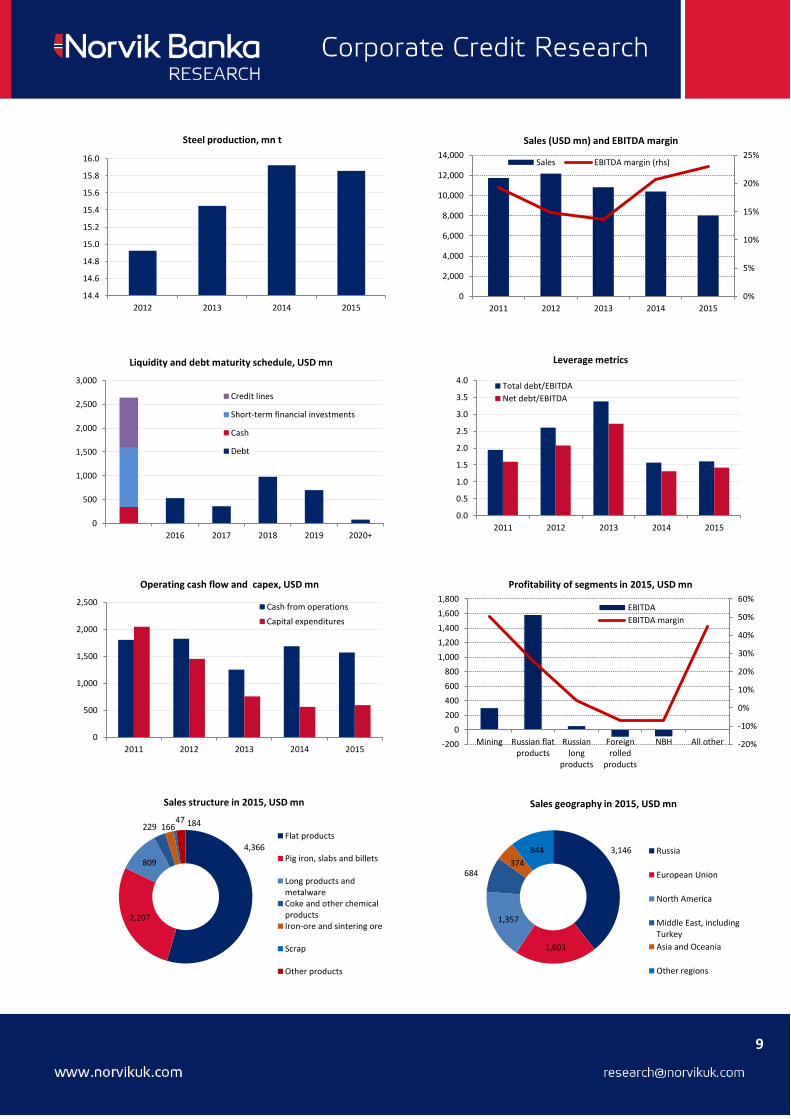
9
14.4
14.6
14.8
15.0
15.2
15.4
15.6
15.8
16.0
2012 2013 2014 2015
Steel production, mn t
0
500
1,000
1,500
2,000
2,500
3,000
2016 2017 2018 2019 2020+
Liquidity and debt maturity schedule, USD mn
Credit lines
Short-term financial investments
Cash
Debt
0
500
1,000
1,500
2,000
2,500
2011 2012 2013 2014 2015
Operating cash flow and capex, USD mn
Cash from operations
Capital expenditures
4,366
2,207
809
229 166 47 184
Sales structure in 2015, USD mn
Flat products
Pig iron, slabs and billets
Long products andmetalwareCoke and other chemicalproductsIron-ore and sintering ore
Scrap
Other products
0%
5%
10%
15%
20%
25%
0
2,000
4,000
6,000
8,000
10,000
12,000
14,000
2011 2012 2013 2014 2015
Sales (USD mn) and EBITDA margin
Sales EBITDA margin (rhs)
0.0
0.5
1.0
1.5
2.0
2.5
3.0
3.5
4.0
2011 2012 2013 2014 2015
Leverage metrics
Total debt/EBITDA
Net debt/EBITDA
-20%
-10%
0%
10%
20%
30%
40%
50%
60%
-200
0
200
400
600
800
1,000
1,200
1,400
1,600
1,800
Mining Russian flatproducts
Russianlong
products
Foreignrolled
products
NBH All other
Profitability of segments in 2015, USD mn
EBITDA
EBITDA margin
3,146
1,603
1,357
684 374
844
Sales geography in 2015, USD mn
Russia
European Union
North America
Middle East, includingTurkey
Asia and Oceania
Other regions
10
IFRS, USD mn 2013 2014 2015 Sales 14,411 13,061 8,767 Sales YoY -2% -9% -33% EBITDA 1,751 2,317 1,430 EBITDA YoY -17% 32% -38% Net income -551 -1,278 -719 Net income YoY 30% 132% -44% Cash from operations 1,314 1,440 1,179 Capital expenditures 902 612 423 Free cash flow 412 828 756 Current ratio 1.2 1.3 1.4 Cash/Short-term debt 87% 143% 277% Short-term debt/Total debt 23% 12% 8% Total debt 8,164 7,300 6,954 Cash 1,576 1,086 1,375 Net debt 6,588 6,214 5,579 Capex/Depreciation 0.9 0.7 0.7 EBITDA margin 12.2% 17.7% 16.3% Total debt/EBITDA 4.7 3.2 4.9 Net debt/EBITDA 3.8 2.7 3.9 Net interest expense 687 564 482 EBITDA/Net int. expense 2.5 4.1 3.0
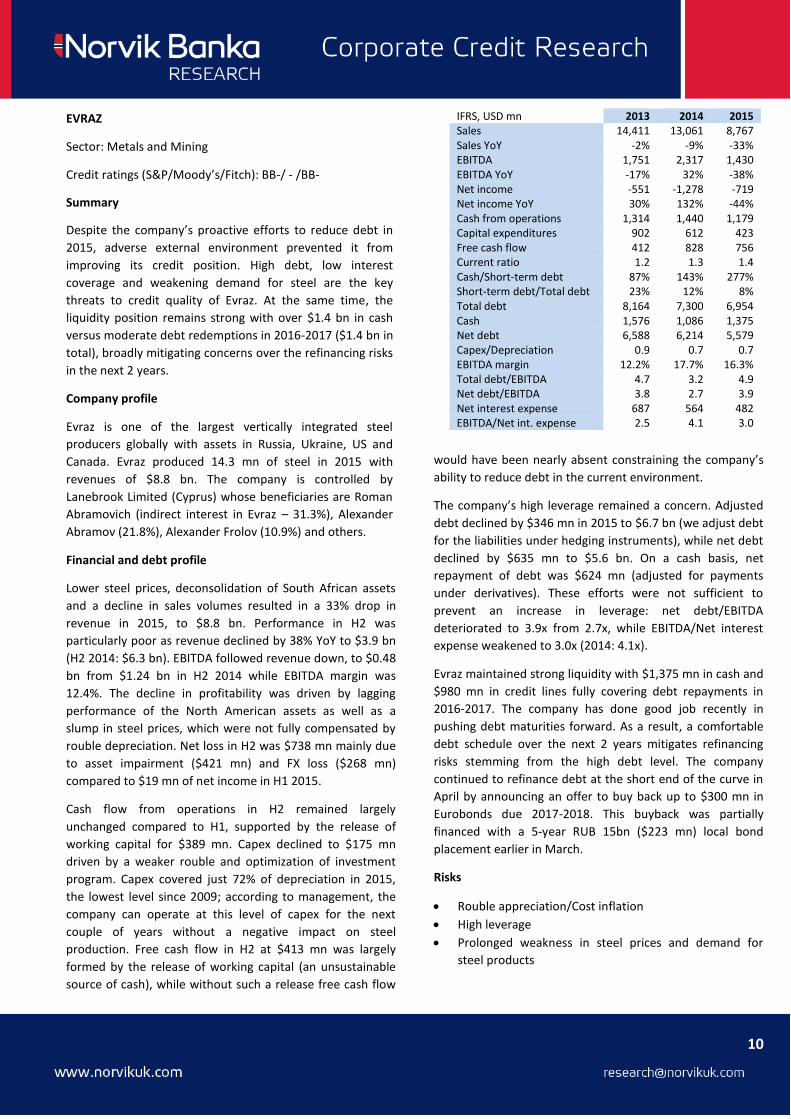
EVRAZ
Sector: Metals and Mining
Credit ratings (S&P/Moody’s/Fitch): BB-/ - /BB-
Summary
Despite the company’s proactive efforts to reduce debt in
2015, adverse external environment prevented it from
improving its credit position. High debt, low interest
coverage and weakening demand for steel are the key
threats to credit quality of Evraz. At the same time, the
liquidity position remains strong with over $1.4 bn in cash
versus moderate debt redemptions in 2016-2017 ($1.4 bn in
total), broadly mitigating concerns over the refinancing risks
in the next 2 years.
Company profile
Evraz is one of the largest vertically integrated steel
producers globally with assets in Russia, Ukraine, US and
Canada. Evraz produced 14.3 mn of steel in 2015 with
revenues of $8.8 bn. The company is controlled by
Lanebrook Limited (Cyprus) whose beneficiaries are Roman
Abramovich (indirect interest in Evraz – 31.3%), Alexander
Abramov (21.8%), Alexander Frolov (10.9%) and others.
Financial and debt profile
Lower steel prices, deconsolidation of South African assets
and a decline in sales volumes resulted in a 33% drop in
revenue in 2015, to $8.8 bn. Performance in H2 was
particularly poor as revenue declined by 38% YoY to $3.9 bn
(H2 2014: $6.3 bn). EBITDA followed revenue down, to $0.48
bn from $1.24 bn in H2 2014 while EBITDA margin was
12.4%. The decline in profitability was driven by lagging
performance of the North American assets as well as a
slump in steel prices, which were not fully compensated by
rouble depreciation. Net loss in H2 was $738 mn mainly due
to asset impairment ($421 mn) and FX loss ($268 mn)
compared to $19 mn of net income in H1 2015.
Cash flow from operations in H2 remained largely
unchanged compared to H1, supported by the release of
working capital for $389 mn. Capex declined to $175 mn
driven by a weaker rouble and optimization of investment
program. Capex covered just 72% of depreciation in 2015,
the lowest level since 2009; according to management, the
company can operate at this level of capex for the next
couple of years without a negative impact on steel
production. Free cash flow in H2 at $413 mn was largely
formed by the release of working capital (an unsustainable
source of cash), while without such a release free cash flow
would have been nearly absent constraining the company’s
ability to reduce debt in the current environment.
The company’s high leverage remained a concern. Adjusted
debt declined by $346 mn in 2015 to $6.7 bn (we adjust debt
for the liabilities under hedging instruments), while net debt
declined by $635 mn to $5.6 bn. On a cash basis, net
repayment of debt was $624 mn (adjusted for payments
under derivatives). These efforts were not sufficient to
prevent an increase in leverage: net debt/EBITDA
deteriorated to 3.9x from 2.7x, while EBITDA/Net interest
expense weakened to 3.0x (2014: 4.1x).
Evraz maintained strong liquidity with $1,375 mn in cash and
$980 mn in credit lines fully covering debt repayments in
2016-2017. The company has done good job recently in
pushing debt maturities forward. As a result, a comfortable
debt schedule over the next 2 years mitigates refinancing
risks stemming from the high debt level. The company
continued to refinance debt at the short end of the curve in
April by announcing an offer to buy back up to $300 mn in
Eurobonds due 2017-2018. This buyback was partially
financed with a 5-year RUB 15bn ($223 mn) local bond
placement earlier in March.
Risks
Rouble appreciation/Cost inflation
High leverage
Prolonged weakness in steel prices and demand for
steel products

11
13.0
13.5
14.0
14.5
15.0
15.5
16.0
16.5
17.0
2011 2012 2012 2013 2013
Crude steel production, mn t
0.0
1.0
2.0
3.0
4.0
5.0
6.0
2011 2012 2013 2014 2015
Leverage metrics
Total debt/EBITDA
Net debt/EBITDA
0
500
1,000
1,500
2,000
2,500
2011 2012 2013 2014 2015
Cash flow from operations and capex, USD mn
Cash from operations
Capital expenditures
5,987
2,270
1,068
433
Structure of sales by segments in 2015, USD mn
Steel
Steel, North America
Coal
Other operations
0%
2%
4%
6%
8%
10%
12%
14%
16%
18%
20%
0
2,000
4,000
6,000
8,000
10,000
12,000
14,000
16,000
18,000
2011 2012 2013 2014 2015
Sales (USD mn) and profitability
Sales EBITDA margin (rhs)
0
500
1000
1500
2000
2500
2016 2017 2018 2019 2020 2021 2022+
Liquidity and debt maturity schedule, as of end-2015, USD mn
Credit lines Cash Debt
-200
0
200
400
600
800
1,000
1,200
Steel Steel, NorthAmerica
Coal Other Unallocated Eliminations
EBITDA structure by segments in 2015, USD mn
3,104
2,566
1,354
664 815
264
Geography of sales in 2015, USD mn
Russia
Americas
Asia
CIS
Europe
Africa and others

12
IFRS, USD mn 2013 2014 2015 Sales 7,324 6,367 4,393 Sales YoY -11% -13% -31% EBITDA 2,247 2,152 1,434 EBITDA YoY -25% -4% -33% Net income 1,080 66 218 Net income YoY -37% -94% 229% Cash from operations 1,312 1,348 952 Capital expenditures 531 596 417 Free cash flow 781 753 535 Current ratio 3.1 2.5 1.8 Cash/Short term debt 2.75 0.85 0.60 Short term debt/Total debt 3% 14% 16% Total debt 5,965 4,734 4,387 Cash 523 550 824 Net debt 5,443 4,185 3,564 Capex/Depreciation 1.2 1.5 1.7 EBITDA margin 30.7% 33.8% 32.7% Total debt/EBITDA 2.7 2.2 3.1 Net debt/EBITDA 2.4 1.9 2.5 Net interest expense 430 305 191 EBITDA/Net int. expense 5.2 7.1 7.5
METALLOINVEST
Sector: Metals and Mining
Credit ratings (S&P/Moody’s/Fitch): BB/Ba2/BB
Summary
The company’s record in terms of deleveraging in H2 2015
was unsatisfactory, in our view. As a result, net debt/EBITDA
increased from 2.0x to 2.5x and will likely increase further to
around 3.0x in H1 2016 which we consider to be a high level
given the numerous risks the company faces. Based on our
interpretation of the recent rebound in iron ore and steel
prices as a temporary phenomenon, Metalloinvest’s
financial results are unlikely to materially improve in 2016
on 2015. The management reiterated a commitment to
reduce debt in 2016, mainly though repayment of $750 mn
due in July. However in absence of a material sustainable
rebound in iron ore prices, the company is unlikely to
generate enough free cash flow to improve its credit profile
compared to end-2015. Thus we see only limited upside for
Metalloinvest-2020s.
Company profile
Metalloinvest is the largest producer of iron ore and one of
the leading steel companies in Russia. Core assets are based
in Kursk, Belgorod and the Orenburg regions of Russia. The
company is controlled by Alisher Usmanov (48%), Vladimir
Skoch (30%) and Farhad Moshiri (10%).
Financial and liquidity position
2015 was a challenging year for mining companies globally
and especially for iron ore producers, as prices fell 40%
during the year. The decline in the company’s revenue was
slightly lower – 31% YoY, to $1,956 mn – supported by
performance of the Steel division. EBITDA followed revenue
lower, declining 49% YoY to $538 mn, while EBITDA margin
in H2 was 27.5%, the lowest level since 2009 as decline in
iron ore price outpaced rouble depreciation. Net loss
amounted to $299 mn driven by a $784 mn FX loss.
The company reported mixed production results in Q1 2016
with the production of iron ore up 4% YoY while the output
of steel declined by 3% YoY. We note the decline in
shipments of steel to the local market by 18% YoY, driven by
increased attractiveness of export destinations alongside
weak local demand.
The cash flow from operations was $319 mn; with $218 mn
of capex this resulted in $101 mn of free cash flow.
Management opted not to reduce debt in H2 by advancing
$321 mn of related party loans (we treat these transactions
as dividend payments), while net proceeds from borrowings
were $487 mn, almost fully reversing the positive trend seen
in H1 2015 (with a net debt repayment of $510 mn).
Such an aggressive debt policy resulted in increased leverage
measured by net debt/EBITDA metric, which rose to 2.5x
from 2.0x at the end of H1 2015. EBITDA/Net interest
expense picked up from 7.1x in 2014 to 7.5x. If iron ore
prices remain at current levels, average iron ore price in H1
16 should be close to the level of H2 15. Under such
assumption Net debt/EBITDA will likely exceed 3.0x.
The company retains a 3.2% stake in Norilsk Nickel, which
could potentially be used to generate additional liquidity. At
the time of writing, these shares were worth around $690
mn. Adjusted for this investment, net debt/EBITDA at end-
2015 would have been 2.0x.
In September 2015 Metalloinvest launched a pellet plant #3
which should increase the Group’s annual EBITDA by some
$25mn according to our estimates. During 2015 the
company continued construction of HBI plant which it plans
to launch in late 2016 – early 2017.
Risks
Prolonged weakness in steel and iron ore prices
Increasing leverage
Rouble appreciation/cost inflation

13
0
2,000
4,000
6,000
8,000
10,000
12,000
14,000
2011 2012 2013 2014 2015
Production of key products, 000 mt
Iron ore Steel
0.0
0.5
1.0
1.5
2.0
2.5
3.0
3.5
2011 2012 2013 2014 2015
Financial leverage metrics
Total debt/EBITDA
Net debt/EBITDA
0
500
1,000
1,500
2,000
2,500
3,000
3,500
2011 2012 2013 2014
Operating cash flow and capex, USD mn
Cash from operations
Capital expenditures
43%
3% 2%
3%
16%
22%
10%
Geography of sales in 2015
Russia
Rest of CIS
China
Rest of Asia
Middle East
Europe
Other countries
0%
5%
10%
15%
20%
25%
30%
35%
40%
45%
0
2,000
4,000
6,000
8,000
10,000
12,000
2011 2012 2013 2014 2015
Sales (USDmn) and EBITDA margin, USD mn
Sales
EBITDA margin (rhs)
0
200
400
600
800
1,000
1,200
1,400
1,600
2016 2017 2018 2019 2020 2021
Liquidity and debt maturity as of end-2015, USD mn
Credit linesShort-term deposits
CashDebt
0%
20%
40%
60%
80%
100%
120%
140%
160%
0
200
400
600
800
1,000
Mining Steel Trading All othersegments
EBITDA (USD mn) and EBITDA margin by segments in 2015
Adjusted EBITDA
EBITDA margin
41%
19%
12%
12%
11%
3%
Sales structure by product in 2015
Steel and rolledproducts
Iron ore pellets
Iron ore
Hot briquetted iron
Pig iron
Other revenue

14
NORILSK NICKEL
Industry: Metals and Mining
Credit ratings (S&P/Moody’s/Fitch): BBB-/Ba1/BBB-
Summary
Norilsk Nickel has the highest credit rating in Russia’s
corporate Eurobond space. However, the recent
amendments to its dividend policy indicate that the
management may be targeting materially higher financial
leverage than historical average. The new dividend policy
targets net debt/EBITDA in the range of 1.8-2.2x compared
to the average of 0.9x in the last four years. We see a risk
that the company may lose its investment grade rating from
one or two agencies. Conversely, the company’s credit
profile is supported by its industry-leading position, a low
cost asset base, ample liquidity and positive free cash flow.
Company profile
Norilsk Nickel is a leading global producer of nickel, copper
and platinum group metals. The company recorded sales of
$8.5 bn in 2014 and EBITDA of $4.3 bn. The largest
shareholders are Interros (30%), UC Rusal (28%), Crispian
Investments Limited (6%) controlled by Vladimir Potanin,
Oleg Deripaska and Roman Abramovich respectively.
Metalloinvest holds a further 3% stake, while the rest are in
free float. Key operations are located in Krasnoyarsk and
Murmansk regions of Russia, as well as in Finland
(Harjavalta nickel refinery).
Financial/debt/liquidity profile
H2 financial results were hit by a slump in prices of key
metals: nickel prices declined by 27% versus H1, copper by
17%, platinum by 18% while palladium lost 21%. As a result,
revenue declined by 26% over H1 and by 41% YoY to $3.6
bn. EBITDA was $1.9 bn (-42% H2 over H1) with EBITDA
margin declining to 43.3% after a spike to 55.3% in H1 2015.
Net income was $243mn versus $1,493mn in H1, the decline
was driven by lower revenue and an FX loss of $743mn.
Cash flow from operations in H2 declined by 62% over H1, to
$912 mn (H1 2015: 2,417 mn) driven by lower sales and
profitability as well as large-scale investment in working
capital. However, capex surged 94% in H2 over H1, to $1,091
mn, following implementation of the downstream
reconfiguration program, accelerated development of
Skalisty underground mine and Bystrinsky project entering
final phase of construction. The negative trends in cash flow
and capex resulted in negative free cash flow of $179 mn.
Norilsk increased debt by $2.4 bn in H2 after a relatively
neutral H1 (+$68 mn on a cash flow basis). The surge in debt
and a decline in revenue resulted in weakening of net
debt/EBITDA which increased to 1.0x from 0.6x at the end of
H1 2015. We expect credit quality of the company to
weaken further in 2016 (see below).
The company had comfortable liquidity at the end of 2015:
cash and equivalents of $4.1 bn coupled with $2.0 bn in
credit lines covering debt repayments till 2020.
Following the decline in revenue and EBITDA, the previous
dividend policy assuming payment of 50% EBITDA but not
less than $2bn became unsustainable. The company
introduced a new dividend policy (in April 2016) envisaging
payment of 60% of EBITDA with net debt/EBITDA below 1.8x
and 30% EBITDA with net debt/EBITDA above 2.2x. The
company plans to pay at least $1.3 bn in dividends in 2017
(for 2016 results) not including additional payments from
sales of non-core assets and not less than $1.0 bn in the
following years, up to 2021. In our view these amendments
may result in net debt/EBITDA moving towards a 1.8-2.2x
range. At the same time, despite the changes in dividend
policy, the management reiterated commitment to preserve
the company’s investment grade credit rating.
Risks
An increase in leverage
Declines in key metal prices
Rouble appreciation
IFRS, USD mn 2013 2014 2015 Sales 11,489 11,869 8,542 Sales YoY -7% 3% -28% EBITDA 4,167 5,634 4,285 EBITDA YoY -17% 35% -24% Net income 765 2,000 1,716 Net income YoY -64% 161% -14% Cash from operations 4,115 5,688 3,329 Capital expenditures 1,989 1,298 1,654 Free cash flow 2,126 4,390 1,675 Current ratio 4.5 3.4 2.0 Cash/Short term debt 1.6 4.3 3.6 Short term debt/Total debt 0.20 0.11 0.16 Total debt 6,205 6,330 8,266 Cash 1,621 2,793 4,054 Net debt 4,584 3,537 4,212 Capex/Depreciation 2.3 1.6 3.3 EBITDA margin 36% 47% 50% Total debt/EBITDA 1.5 1.1 1.9 Net debt/EBITDA 1.1 0.6 1.0 Net interest expense 329 233 339 EBITDA/Net interest exp. 12.7 24.2 12.6
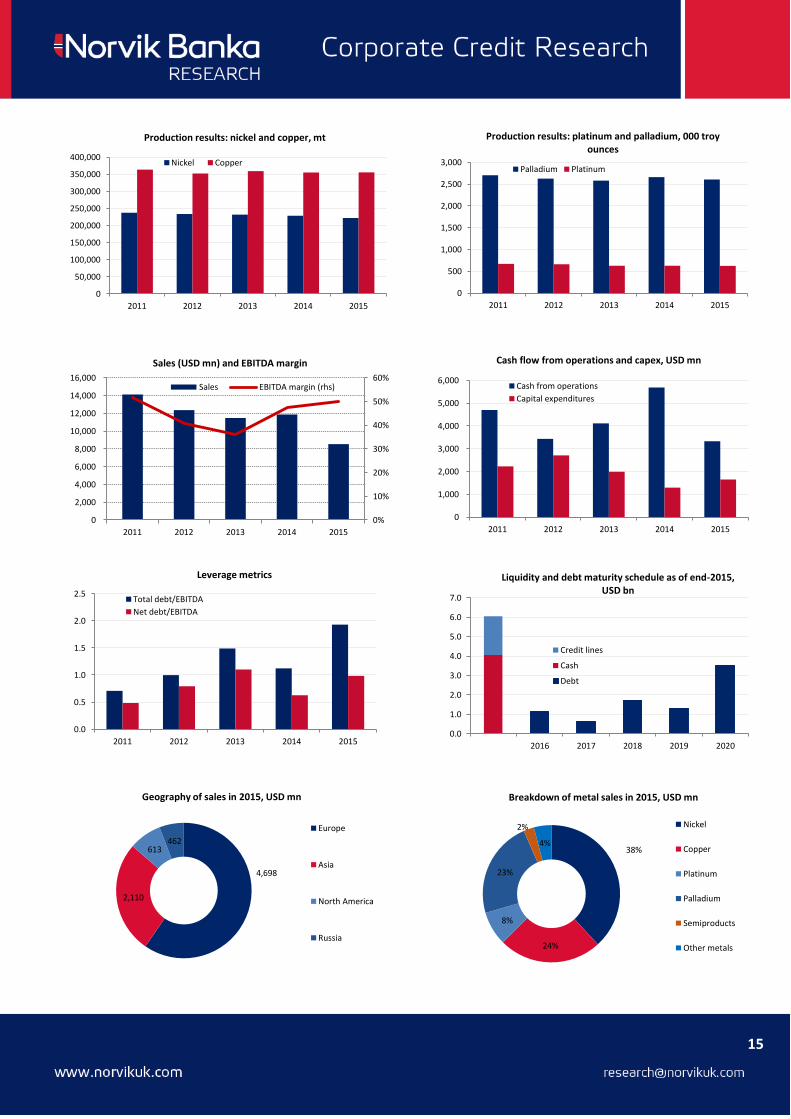
15
0
50,000
100,000
150,000
200,000
250,000
300,000
350,000
400,000
2011 2012 2013 2014 2015
Production results: nickel and copper, mt
Nickel Copper
0%
10%
20%
30%
40%
50%
60%
0
2,000
4,000
6,000
8,000
10,000
12,000
14,000
16,000
2011 2012 2013 2014 2015
Sales (USD mn) and EBITDA margin
Sales EBITDA margin (rhs)
0.0
0.5
1.0
1.5
2.0
2.5
2011 2012 2013 2014 2015
Leverage metrics
Total debt/EBITDA
Net debt/EBITDA
4,698
2,110
613 462
Geography of sales in 2015, USD mn
Europe
Asia
North America
Russia
0
500
1,000
1,500
2,000
2,500
3,000
2011 2012 2013 2014 2015
Production results: platinum and palladium, 000 troy ounces
Palladium Platinum
0
1,000
2,000
3,000
4,000
5,000
6,000
2011 2012 2013 2014 2015
Cash flow from operations and capex, USD mn
Cash from operations
Capital expenditures
0.0
1.0
2.0
3.0
4.0
5.0
6.0
7.0
2016 2017 2018 2019 2020
Liquidity and debt maturity schedule as of end-2015, USD bn
Credit lines
Cash
Debt
38%
24%
8%
23%
2%
4%
Breakdown of metal sales in 2015, USD mn
Nickel
Copper
Platinum
Palladium
Semiproducts
Other metals

16
IFRS, USD mn 2013 2014 2015 Sales 6,432 6,009 4,127 Sales YoY -4% -7% -31% EBITDA 927 780 572 EBITDA YoY -8% -16% -27% Net income 433 52 -368 Net income YoY 8% -88% N/A Cash from operations 703 595 684 Capital expenditures 397 293 208 Free cash flow 45 50 205 Current ratio 1.6 1.3 1.3 Cash/Short-term debt 24% 33% 52% Short-term debt/Total debt 11% 24% 21% Total debt 3,694 3,223 2,801 Cash 93 253 305 Net debt 3,600 2,970 2,496 Capex/Depreciation 1.2 1.0 0.8 EBITDA margin 14% 13% 14% Total debt/EBITDA 4.0 4.1 4.9 Net debt/EBITDA 3.9 3.8 4.4 Net interest expense 262 252 271 EBITDA/Net interest exp. 3.5 3.1 2.1
TMK
Sector: Metals and Mining
Credit ratings: (S&P/Moody’s/Fitch): B+/B1 / -
Summary
The company’s credit quality deteriorated in H2 2015 driven
by rouble depreciation, a slump in the US market, increase
in cost of borrowing. At the same time, near-term outlook
looks comfortable with liquidity enough to cover debt
maturities of the next 12 months. However, the company
will have to be more proactive in cost optimization and
capex reduction to reverse the negative trends in credit
quality.
Company profile
TMK is a diversified global steel pipe producer with assets in
Russia, US, Europe, Kazakhstan and the UAE. The company
is the largest steel pipe producer in Russia with
approximately a 25% market share. Around ¾ of total pipe
sales go to the Oil and Gas industry, while the rest are sold
to industrial and construction companies. The company is
controlled by Dmitriy Pumpyanskiy (68% at end-Jan 2016).
Financial and debt profile
A combination of negative factors resulted in a very weak
H2 2015 financial results. Revenue declined 20% over H1 to
$1,830 mn on the back of rouble depreciation and falling
sales volumes by the American segment. EBITDA was 33%
lower YoY at $234 mn (H1 2015: $348 mn) as the company
struggled to keep prices in the Russian market up with
rouble depreciation, while losses in the American segment
remained a drag on the overall Group’s performance (Q4
2015 EBITDA margin was a negative 21%). TMK posted net
loss of $445 mn in H2 mainly due to an FX loss of $147 mn
and impairment of goodwill for $328 mn. Following rouble’s
appreciation and a rebound in oil prices since March,
financial results are likely to improve in Q2 2016,
Cash flow from operations tracked EBITDA lower, down 43%
to $148 mn (H1 2015: $261 mn), however unlike in H1 this
was not supported by the release of working capital. Capex
increased 13% to $110mn remaining at minimum levels
after the completion of the modernization program. Free
cash flow declined to a modest $38 mn (H1 2015: $163 mn)
constraining the company’s ability to deleverage.
The decline in EBITDA has significantly weakened credit
metrics of the company: Net debt/EBITDA increased to 4.4x
(H1 2015: 3.8x), while EBITDA/Net interest expense declined
to 2.1x. (H1 2015: 2.9x). The company did not reduce debt
on a cash flow basis in H2: net debt proceeds were $35mn
versus net debt repayment of $228mn in H1 2015. At the
end of 2015, TMK raised RUB 10bn ($141 mn) from VTB by
selling around 13.2% of share capital. The company
delivered 8% of share capital (treasury shares) with the
commitment to deliver the remaining part in 2016. In our
view the share sale highlights the limited ability of the
company to reduce debt from internally generated cash
flow. Sources of additional cash flow generation remain
constrained: the ability to reduce capex or release working
capital are limited, asset sales are unlikely to improve
leverage, while further sales of shares cannot be a
sustainable source of financing.
Sale of shares to VTB supported liquidity: at the end of 2015
the company had $305 mn of cash and equivalents and
another $528 mn in credit lines versus $575 mn of short-
term debt. The company is unlikely to have any problems
with the refinancing of debt in the next 12 months due to
liquidity surplus in the local market. At the beginning of
April TMK issued RUB 5bn of 5-year local bonds and
simultaneously announced buyback for its Eurobond due
2018 for the total of $200 mn. This should help push
maturities further and to smooth out the debt schedule for
2018, however this will likely increase cost of borrowings.
Risks
FX mismatch between revenue and debt
Increase in cost of borrowings
Rouble depreciation
Refinancing risk

17
0
500
1,000
1,500
2,000
2,500
3,000
2011 2012 2013 2014 2015
Pipe production, 000 mt
Seamless Pipe Welded Pipe
0
100
200
300
400
500
600
700
800
900
2016 2017 2018 2019 2020 2021+
Liquidity and debt maturity schedule as of end-2015, USD mn
Credit facilitiesCashDebt repayment
0
100
200
300
400
500
600
700
2011 2012 2013 2014 2015
Cash flow from operations and capex, USD mn
Cash from operations
Capital expenditures
-25%
-20%
-15%
-10%
-5%
0%
5%
10%
15%
20%
25%
Adjusted EBITDA margins of the segments
Russia
America
Europe
11.5%
12.0%
12.5%
13.0%
13.5%
14.0%
14.5%
15.0%
15.5%
0
1,000
2,000
3,000
4,000
5,000
6,000
7,000
8,000
2011 2012 2013 2014 2015
Revenue (USD mn) and EBITDA margin
Sales
EBITDA margin (rhs)
0.0
1.0
2.0
3.0
4.0
5.0
6.0
2011 2012 2013 2014 2015
Leverage metrics
Total debt/EBITDA
Net debt/EBITDA
3,190 742
196
Revenue by division in 2015, USD mn
Russia
America
Europe
628
-22
31
-100
0
100
200
300
400
500
600
700
Russia America Europe
Adjusted EBITDA by segments in 2015, USD mn

18
IFRS, USD mn 2013 2014 2015 Sales 2,259 2,197 2,159 Sales YoY -14% -3% -2% EBITDA 907 1,011 1,247 EBITDA YoY -31% 11% 23% Net income 143 -182 1119 Net income YoY -85% -227% -715% Cash from operations 422 809 954 Capital expenditures 1384 570 327 Free cash flow -962 239 627 Current ratio 3.2 2.4 11.4 Cash/Short term debt 3.0 13.5 53.7 Short term debt/Total debt 22% 5% 2% Total debt 1,206 2,207 2,683 Cash 809 1,217 2,039 Net debt 397 990 4,294 Capex/Depreciation 6.5 3.1 2.6 EBITDA margin 40% 46% 58% Total debt/EBITDA 1.3 2.2 5.1 Net debt/EBITDA 0.4 1.0 0.5 Net interest expense 48 86 88 EBITDA/Net int. expense 18.9 11.8 14.2
POLYUS
Sector: Metals and Mining
Credit ratings (S&P/Moody’s/Fitch): BB-/ - /BB-
Summary
After the completion of a share buyback by entities
controlled by the Kerimov family, Polyus became one of the
most leveraged public companies in Russia. Part of the debt
raised to finance the share buyback remains at parental
level, however we acknowledge that the single source of
cash flow to service and repay this debt is Polyus itself, thus
any deleveraging will be a lengthy process. This means little
upside for company’s credit quality while downside is
relatively high and depends mainly on gold price.
Company profile
Polyus Gold is the largest gold producer in Russia producing
1.75 mn oz of gold in 2015. The company operates 5 mines
and one production site in Siberia and the Far East regions
of Russia, and is the 4th
largest gold company globally by
proven and probable reserves. The company’s operations
are located in Krasnoyarsk, Irkutsk, Magadan regions and
Yakutia. Polyus recorded $2.2bn of sales and $1.2 bn EBITDA
in 2015. The key shareholder is Said Kerimov (over 95%).
Financial and debt profile
Weak gold price performance in H2 2015 was partly offset
by increased gold production which was at 968 Koz (+2.7%
YoY). Revenue declined by 5% YoY to $1’154 mn, while
EBITDA increased by 6.5% YoY to $658 mn with record
EBITDA margin of 58%.
The company’s high profitability was driven by its low cost
position: in 2015 Polyus remained one of the lowest cost
gold producers globally with total cash costs at $424/oz
(2014: $585/oz) and all-in sustaining costs at $610/oz (2014:
$825/oz). As a result the company is highly resilient to
volatility in gold prices.
At the end of 2015, Wandle Holdings and Sacturino Limited
controlled by Said Kerimov, the son of Suleiman Kermov,
completed a share buyback of Polyus Gold International
Limited (Jersey), a former holding company for the group’s
assets. According to public sources, the companies financed
buyback with a loan from VTB for the total of $5.5bn,
virtually all shares bought back were pledged to VTB as a
collateral under the loan. In our view Polyus Gold is the
single asset which will service the debt at the parental level,
thus we adjust Polyus’s debt for the debt held by Sacturino
and Wandle. This transaction transformed Polyus to one of
the most leveraged public corporate borrowers in Russian
corporate eurobond space.
On 11 March 2015 the new holding company JSC Polyus
Gold (Russia) announced share buyback for the total of RUB
255.3 bn buying back shares mainly from parent companies,
which effectively transferred part of the debt accumulated
by parent companies to the balance sheet of Polyus. The
buyback was financed with a US$2.5 bn loan from Sberbank.
We estimate net debt/EBITDA below 3.5x post buyback, the
level set by a covenant in the Eurobond prospectus. Total
adjusted debt of Polyus (including around $8.5 bn of debt at
the parent level) at the end of 2015 was around $11.2 bn,
while adjusted net debt/EBITDA was 7.4x. Given the high
amount of debt relative to cash flow generated by the
company and the lack of transparency regarding the total
amount of debt we consider Polyus to be a very risky play.
The company actively hedges its exposure to gold price risk
by using options which partly mitigates the effects of gold
price volatility on revenue. At the end of 2015 around 48%
of future production was hedged with collars (combination
of call and put options).
Risks
High leverage
Rouble appreciation
Lack of transparency regarding debt held at parent’s
level
Deterioration in corporate governance after delisting
from London Stock Exchange

19
0
200
400
600
800
1,000
1,200
1,400
1,600
1,800
2,000
2011 2012 2013 2014 2015
Refined gold production, koz
0%
10%
20%
30%
40%
50%
60%
70%
0
500
1,000
1,500
2,000
2,500
3,000
2011 2012 2013 2014 2015
Sales (USD mn) and EBITDA margin
Sales EBITDA margin
0
500
1,000
1,500
2,000
2,500
3,000
Liquidity 2016 2017 2018 2019 2020 2020+
Liquidity and debt maturity as of end-2015, USD mn
Undrawn facilities
Cash
Debt repayments
0%
10%
20%
30%
40%
50%
60%
70%
80%
90%
0
200
400
600
800
1,000
1,200
Krasnoyarsk Irkutsk alluvial Irkutsk ore YakutiaKuranakh
EBITDA (USD mn) and EBITDA margin of segments in 2015
Adjusted EBITDA
EBITDA margin (rhs)
0
100
200
300
400
500
600
700
800
Gold production by mine in 2015, koz
0
200
400
600
800
1,000
1,200
1,400
1,600
2010 2011 2012 2013 2014 2015
Cash flow from operations and capex, USD mn
Cash from operations
Capital expenditures
-1.0
-0.5
0.0
0.5
1.0
1.5
2.0
2.5
2011 2012 2013 2014 2015
Leverage metrics
Total debt/EBITDA
Net debt/EBITDA
0
200
400
600
800
1,000
1,200
2012 2013 2014 2015
Total cash cost and all-in sustaining cost, USD/oz
Total cash cost All-in sustaining cash cost

20
IFRS, USD mn 2013 2014 2015 Sales 1,271 1,216 1,129 Sales YoY 6% -4% -7% EBITDA 365 510 493 EBITDA YoY -18% 40% -3% Net income -199 123 189 Net income YoY NA NA 53% Cash from operations 311 328 418 Capital expenditures 248 148 267 Free cash flow 63 180 151 Current ratio 1.4 3.6 2.0 Cash/Short term debt 0.7 26.3 2.2 Short term debt/Total debt 34% 1% 14% Total debt 968 944 946 Cash 244 318 364 Net debt 724 627 582 Capex/Depreciation 1.1 0.7 1.3 EBITDA margin 29% 42% 44% Total debt/EBITDA 2.7 1.9 1.9 Net debt/EBITDA 2.0 1.2 1.2 Net interest expense 67 67 45 EBITDA/Net int. expense 5.5 7.6 11.0
NORDGOLD
Sector: Metals and Mining
Credit ratings (S&P/Moody’s/Fitch): -/Ba3/BB-
Summary
In our view the credit position of Nordgold is supported by
its low cost asset base, geographic diversification as well as a
moderate debt level. The company has a proven track record
of successful commissioning of new mining assets and plans
to launch the new Bouly mine which should increase the
company’s gold production by 12% from 2017. On the other
hand, the company is relatively small and has a highly
concentrated debt maturity schedule (around 60% of its
total debt comes due in 2018). We expect Nordgold to
address this issue in 2016-2017.
Company profile
Nordgold is a gold producer with nine operating mines in
Russia, Kazakhstan, Burkina Faso and Guinea. Nordgold has
proven and probable reserves of 13.0 Moz and produced
950 Koz of gold in 2015. The company is controlled by
Aleksey Mordashov (90%), while the rest of the shares are
listed on the London Stock Exchange.
Financial/debt/liquidity position
Nordgold increased gold output by 2% YoY in Q4: the
company produced 242 thousand ounces (Koz) of gold, total
gold production in 2015 was 950 Koz, in line with production
guidance of 925-985 Koz. Gold production in 2016 is
expected to be in the range of 950-1’010 Koz or 0-4% higher
versus 2015. Q4 revenue was $264 mn or 4% higher YoY
while full-year revenue for 2015 was $1,129 mn or 7% lower
versus 2014. The company reported weak production results
for Q1 2016 with gold production lower by 21% YoY, while
revenue declined by 30% YoY driven by lower production
volumes and weak gold prices. At the current level of
production, total gold output in 2016 should be closer to the
lower bound of the guidance.
The increase in net debt to $584 mn (Q3 2015: $573 mn)
was driven by payment of $13 mn dividend, $3 mn share
buyback and capex related to Bouly mine (Burkina Faso). The
company reiterated plans to start Bouly on schedule in H2
2016 and expects that all-in sustainable cost (AISC) of gold
production at the mine will be around $730/oz. AISC for the
whole company was around $790/oz in 2015 and Nordgold
expects growth to $800-850/oz in 2016 mainly due to cost
pressures.
The company reported $264 mn of revenue (+4% YoY) in the
last quarter of 2015 driven by increased gold sales. However
EBITDA was relatively weak at $69 mn with EBITDA margin
at 26% due to a non-cash impairment of inventory.
Cash flow from operations was at $88 mn with capex at $87
mn driving free cash flow to a modest $1 mn. Net
debt/EBITDA slightly increased to 1.2x from 1.1x at the end
of Q3 2015, while EBITDA/Net interest expense was at a
healthy 11.0x level.
From a liquidity standpoint the company will have to repay
$125 mn in 2016 out of $500 mn loan received from
Sberbank in 2014 which looks easily manageable given the
comfortable liquidity including cash and short-term deposits
for the total of $364 mn. Company debt repayments peak in
2018 at $575 mn when the Eurobond comes due.
The company plans to launch Bouly mine in H2 2016 with
capacity of 120k ounces of gold per year and expects all-in
sustainable cost of $730/oz (Q4 2015: $892/oz for the
company) which should improve cash flow generation and
profitability and will support credit position.
Risks
Exposure to emerging African economies
Concentrated debt schedule in 2018
Prolonged weakness in gold price
Appreciation of local currencies (RUB, KZT, GHS, XOF)
versus USD
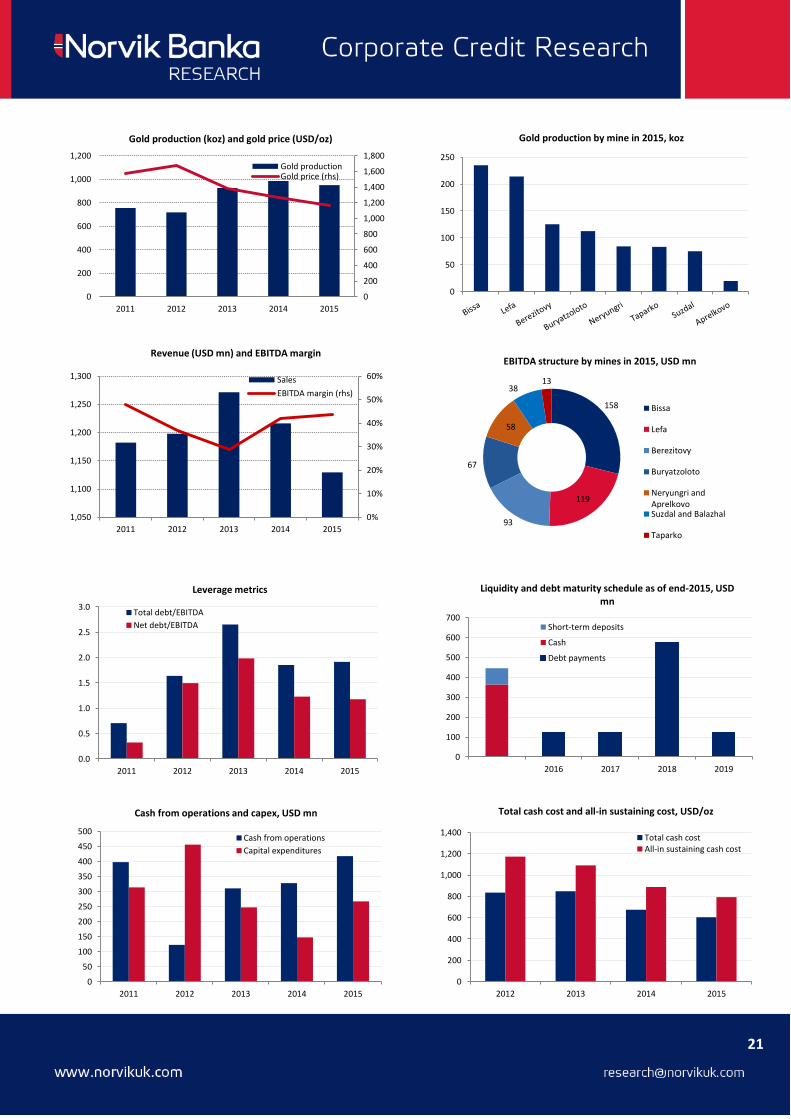
21
0
200
400
600
800
1,000
1,200
1,400
1,600
1,800
0
200
400
600
800
1,000
1,200
2011 2012 2013 2014 2015
Gold production (koz) and gold price (USD/oz)
Gold productionGold price (rhs)
0%
10%
20%
30%
40%
50%
60%
1,050
1,100
1,150
1,200
1,250
1,300
2011 2012 2013 2014 2015
Revenue (USD mn) and EBITDA margin
Sales
EBITDA margin (rhs)
0.0
0.5
1.0
1.5
2.0
2.5
3.0
2011 2012 2013 2014 2015
Leverage metrics
Total debt/EBITDA
Net debt/EBITDA
0
50
100
150
200
250
300
350
400
450
500
2011 2012 2013 2014 2015
Cash from operations and capex, USD mn
Cash from operations
Capital expenditures
0
50
100
150
200
250
Gold production by mine in 2015, koz
158
119
93
67
58
38 13
EBITDA structure by mines in 2015, USD mn
Bissa
Lefa
Berezitovy
Buryatzoloto
Neryungri andAprelkovoSuzdal and Balazhal
Taparko
0
100
200
300
400
500
600
700
2016 2017 2018 2019
Liquidity and debt maturity schedule as of end-2015, USD mn
Short-term deposits
Cash
Debt payments
0
200
400
600
800
1,000
1,200
1,400
2012 2013 2014 2015
Total cash cost and all-in sustaining cost, USD/oz
Total cash costAll-in sustaining cash cost
22
IFRS, RUB bn 2013 2014 2015 Sales 168.5 207.2 224.5 Sales YoY 12% 23% 8% EBITDA 68.4 96.9 119.1 EBITDA YoY 5% 42% 23% Net income 31.8 -16.8 32.2 Net income YoY -1% N/A N/A Cash from operations 46.2 68.9 63.5 Capital expenditures 38.2 33.3 34.2 Free cash flow 8.0 35.6 29.2 Current ratio 1.4 2.0 2.5 Cash/Short term debt 16% 104% 80% Short term debt/Total debt 41% 11% 12% Total debt 138.6 197.2 223.2 Cash 9.27 21.7 20.5 Net debt 129.3 175.5 202.7 Capex/Depreciation 2.7 1.8 1.8 EBITDA margin 40.6% 46.8% 53.1% Total debt/EBITDA 2.0 2.0 1.9 Net debt/EBITDA 1.9 1.8 1.7 Net interest expense 10.1 10.2 9.9 EBITDA/Net interest exp. 6.8 9.5 12.1
ALROSA
Sector: Metals and Mining
Credit ratings (S&P/Moody’s/Fitch): BB-/Ba1/BB
Summary
Alrosa’s credit profile is supported by state ownership. The
company may experience upside pressure on its credit
ratings in case of successful disposal of non-core assets,
mainly related to gas extraction. The management earlier
confirmed plans to continue deleveraging process and
announced a net debt/EBITDA target of 1.0x. We note that
these ambitions are supported by earlier successful
deleveraging as the company repaid RUB 22.8bn in 2015.
Company profile
Alrosa is the largest global diamond producer by physical
volumes and the second largest by value (after De Beers)
with 38.2mn carats of diamonds produced in 2015. The
company operates in Yakutia and Arkhangelsk regions of
Russia. The key shareholders are State Property fund of
Russia (43.9%), Yakutia regional administration (25%) and
Yakutia uluses (8%), the remaining shares are in free float.
Financial and liquidity position
Alrosa improved sales in Q4 2015, diamond inventory
accumulation continued. Revenue was 28% higher QoQ at
RUB 52bn, driven mainly by higher diamond sales after
extremely weak Q3. EBITDA surged 40% QoQ to RUB 29.3 bn
with EBITDA margin of 56%. Net income was close to zero
due to a foreign exchange loss. The company further
increased diamond sales by 21% YoY to $1.3 bn in Q1 2016.
Cash flow from operations was RUB 10.1 bn in Q4, or +14%
QoQ (a material deterioration of 63% YoY mainly due to
accumulation of diamond inventory driven by weak global
demand). Capex was broadly unchanged with Q3 at RUB 9.6
bn resulting in just RUB 0.5 bn of free cash flow. Alrosa
continued accumulation of diamond inventory albeit at a
slower pace (RUB 9.0 bn in Q4 vs RUB 17 bn in Q3), a sign of
ongoing weakness in demand.
The company continued debt reduction, repaying RUB 9.0
bn mainly from own cash balances. However RUB weakening
during the quarter resulted in higher RUB value of its USD-
denominated debt, which stood at RUB 223.2bn at the end
of 2015, up from RUB 212bn in Q3. Net debt/EBITDA
increased to 1.7x (Q3 2015: 1.5x), while EBITDA/Net interest
was 9.9x (Q3 2015: 11.0x), a comfortable level. The lower
revenue may put pressure on the company's credit metrics
in 2016. However, the management's strong commitment to
deleverage as evidenced by net repayment of RUB 22 bn
in each of 2014-15 is a strong credit-positive factor. From a
liquidity prospective, the company had RUB 20.5 bn of cash
against RUB 25.5 bn of short term debt and should not have
problems with refinancing its debt in 2016.
Management sees 2016 revenue at $3.5 bn, although the
decision on diamond production plan has not been made
yet. The plan incorporates two scenarios – between 34mn
and 39mn carats depending on demand. In our view given
the slump in revenue in H2 2015 to $1.4 bn such a goal looks
optimistic and requires a rebound in global demand for
diamonds in 2016. The company has accumulated around 22
mn carats of diamond inventories valued at $2.5 bn and
aims not to increase this already high level in 2016.
In February 2016 the Russian authorities announced large-
scale privatization of key state-owned assets, including
Alrosa. However, according to the plan the state will only sell
minority stakes while retaining control over these
companies. We are skeptical about these plans given the
poor history of privatization in Russia as well as awkward
timing. At present the state together with Yakutia local
administrations controls 76.9% of share capital, and the
government has been considering sale of the stake up to
18.9%. Even if these plans materialize, the company will
remain state-owned and will continue to rely on state
support in case of need.
Risks
Prolonged weakness in diamond prices and demand
Loss of a state-owned entity status
Rouble appreciation

23
0
5
10
15
20
25
30
35
40
45
2011 2012 2013 2014 2015
Production and sales of diamonds, mn carats
Production Sales
0.0
0.5
1.0
1.5
2.0
2.5
3.0
2011 2012 2013 2014 2015
Leverage metrics
Total debt/EBITDA
Net debt/EBITDA
0
10
20
30
40
50
60
70
80
2011 2012 2013 2014 2015
Cash from operations and capital expenditures, RUB bn
Cash from operations
Capital expenditures
90%
3% 8%
Sales structure by product in 2015
Diamonds
Gas
Other
0%
5%
10%
15%
20%
25%
30%
35%
40%
45%
50%
0
50
100
150
200
250
2011 2012 2013 2014 2015
Sales and profitability
Sales
EBITDA margin
0
200
400
600
800
1,000
1,200
2016 2017 2018 2019 2020
Liquidity and debt maturity (USD mn)
Credit lines
Cash
Debt payments
0
10
20
30
40
50
60
70
Dec-13 Mar-14 Jun-14 Sep-14 Dec-14 Mar-15 Jun-15 Sep-15 Dec-15
Diamond inventories, RUB bn
98
43
34
24 10
8 7
Geography of sales in 2015, RUB bn
Belgium Russia
India Israel
China UAE
Others
24
URALKALI
Industry: Chemicals
Credit ratings (S&P/Moody’s/Fitch): BB-/Ba2/BB-
Summary
The credit quality of the company has substantially
deteriorated following the three share buybacks conducted
in 2015-Q1 2016 while prospects for 2016 are clouded due
to weaker global demand. However at the end of March,
Uralkali signed loan agreements with Sberbank of Russia for
the total of $3.9 bn which effectively removed refinancing
risks related to the $650 mn Eurobond due 2018. At this
point we see the repayment of this debt as virtually certain.
Company profile
Uralkali is one of the largest global producers of potash
fertilizers based in Perm Krai, Russia. The company sold 11.2
mn tons of KCl (potash fertilizer) in 2015 with the global
market share of 18%. The largest shareholders of the
company are ONEXIM Group (20%), Uralchem (19.99%),
8.96% are in free float, the rest are treasury shares.
Financial/debt/liquidity profile
The company recorded $1.56 bn of sales in H2, unchanged
from H1 and down 15% YoY. Global potash demand is
expected to continue shrinking in 2016 which should put
pressure on prices and sales volumes. EBITDA increased by
2% over H1 to $974 mn with EBITDA margin at a record
62.4% driven by a weak rouble and cost optimization
measures. According to management, this high profitability
is not sustainable and will come under pressure later in
2016 due to cost inflation and declining potash prices. H2
net loss was $372 mn mainly as a result of $1.0 bn FX loss.
Capex was positively influenced by RUB depreciation as
around 80% of it is in roubles. Free cash flow declined by 5%
vs H1 to $703 mn remaining at a very comfortable level.
Despite the significant increase in debt, the company retains
the ability to deleverage relatively quickly.
Total debt adjusted for liabilities under the swaps reached
$7,075 mn (June 2015: $6,538 mn), while net debt
increased to $5,963 mn (June 2015: $4,033 mn). The
increase in net debt was mainly attributable to share
buybacks during the H2 for the total of $2.28 bn. As a result
net debt/EBITDA increased to 3.1x from 2.2x at the end of
H1 2015. We expect further deterioration of credit metrics
in H1 2016 due to lower profitability and an increase in debt
from the open-market share buyback.
During H2 RUB depreciation triggered covenants on the
company’s debt linked to balance sheet metrics, as a result
around $1.5 bn of long-term debt was reclassified as short-
term. According to the company, lenders did not request
accelerated repayment of these loans. Our understanding is
that the classification of these loans as short-term is
temporary until the company renegotiates them with banks
and should not affect the company’s liquidity.
From a liquidity view, the company retains high levels of
cash on balance and a portfolio of committed and
uncommitted credit lines. At the end of 2015, total liquidity
sources consisted of $1.1 bn of cash, $1.7 bn committed
credit lines and $1.0 bn of uncommitted credit lines. Short
term debt adjusted for liabilities under the triggered
covenants was $1.0 bn, comfortably covered by available
liquidity.
On March 24 Uralkali signed agreements on two credit lines
with Sberbank for the total of $3.9 bn to refinance existing
borrowings. The credit lines will be available from the end
of 2017 until the beginning of 2020. The news is positive for
Uralkali 2018s due in April 2018 however we see little
potential for further upside from the current levels.
The company finished its open market share buyback on
March 31 buying 4.89% of share capital. As a result, free
float declined to 8.96%.
Risks
Increase in leverage
Decline in potash prices/demand
Rouble appreciation
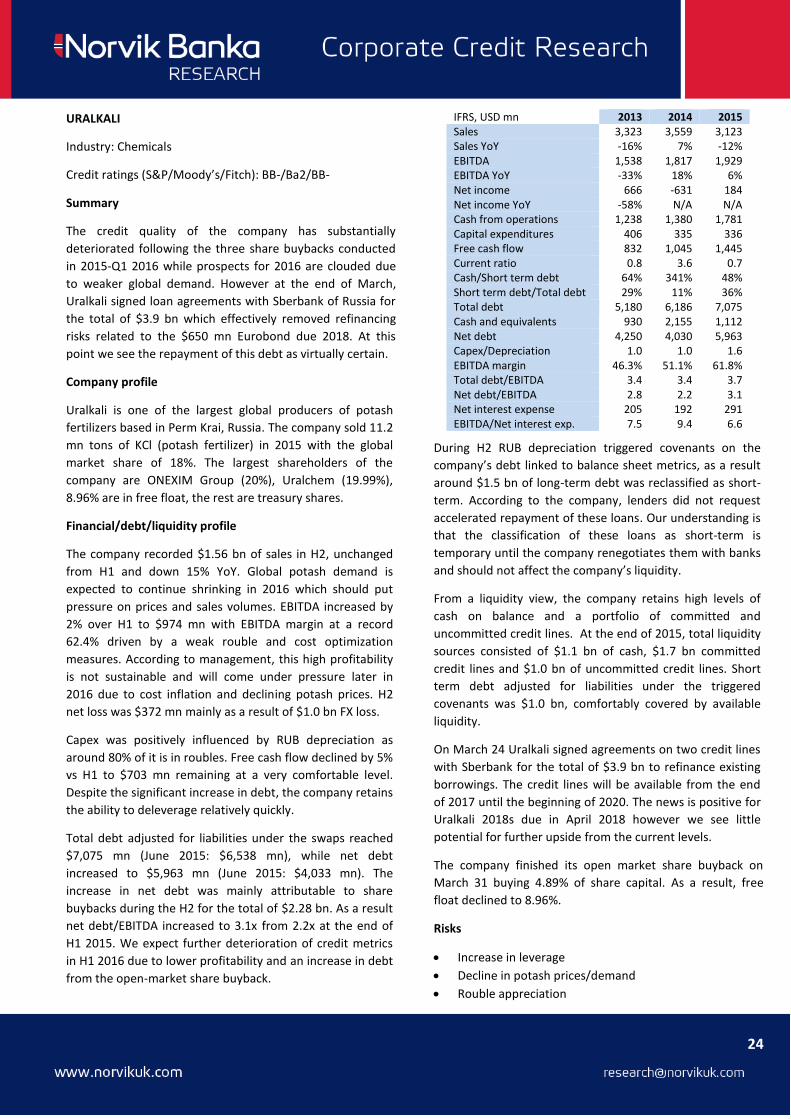
IFRS, USD mn 2013 2014 2015 Sales 3,323 3,559 3,123 Sales YoY -16% 7% -12% EBITDA 1,538 1,817 1,929 EBITDA YoY -33% 18% 6% Net income 666 -631 184 Net income YoY -58% N/A N/A Cash from operations 1,238 1,380 1,781 Capital expenditures 406 335 336 Free cash flow 832 1,045 1,445 Current ratio 0.8 3.6 0.7 Cash/Short term debt 64% 341% 48% Short term debt/Total debt 29% 11% 36% Total debt 5,180 6,186 7,075 Cash and equivalents 930 2,155 1,112 Net debt 4,250 4,030 5,963 Capex/Depreciation 1.0 1.0 1.6 EBITDA margin 46.3% 51.1% 61.8% Total debt/EBITDA 3.4 3.4 3.7 Net debt/EBITDA 2.8 2.2 3.1 Net interest expense 205 192 291 EBITDA/Net interest exp. 7.5 9.4 6.6

25
0
2
4
6
8
10
12
14
2011 2012 2013 2014 2015
Production of KCl fertilizer, mn t
0
500
1,000
1,500
2,000
2,500
3,000
3,500
4,000
2016 2017 2018 2019 2020+
Liquidity and debt maturity schedule as of end-2015
Uncommitted credit lines
Committed credit lines
Cash
Debt payments
0
200
400
600
800
1,000
1,200
1,400
1,600
1,800
2,000
2011 2012 2013 2014 2015
Cash flow from operations and capex, USD mn
Cash from operations
Capital expenditures
406
2,008
628
81
Geography of sales in 2015, USD mn
Russia
Latin America, China,India, South East Asia
USA, Europe
Other countries
0%
10%
20%
30%
40%
50%
60%
70%
0
500
1,000
1,500
2,000
2,500
3,000
3,500
4,000
4,500
2011 2012 2013 2014 2015
Sales and EBITDA margin, USD mn
Sales EBITDA margin
0.0
0.5
1.0
1.5
2.0
2.5
3.0
3.5
4.0
2011 2012 2013 2014 2015
Leverage metrics
Total debt/EBITDA
Net debt/EBITDA
0
50
100
150
200
250
300
350
400
2012 2013 2014 2015
Cash cost of potash and selling price, USD/mt
Cash costs
Average export potash price, FCA
0
2
4
6
8
10
12
2011 2012 2013 2014 2015
Geography of potash sales, mn t
Domestic
External

26
IFRS, RUB bn 2013 2014 2015 Sales 104.6 123.1 189.7 Sales YoY -1% 18% 54% EBITDA 24.0 37.1 83.3 EBITDA YoY -32% 54% 124% Net income 8.6 -13.4 36.4 Net income YoY -65% -256% -372% Cash from operations 17.9 27.5 63.3 Capital expenditures 17.6 20.4 42.4 Free cash flow 0.3 7.1 20.8 Current ratio 1.5 1.4 1.7 Cash/Short term debt 68% 100% 101% Short-term debt/Total debt 25% 25% 22% Total debt 54.9 124.0 134.6 Cash 8.9 30.7 29.3 Net debt 46.0 93.3 105.3 Capex/Depreciation 2.3 2.6 4.7 EBITDA margin 23% 30% 44% Total debt/EBITDA 2.3 3.3 1.6 Net debt/EBITDA 1.9 2.5 1.3 Net interest expense 1.9 2.7 5.5 EBITDA/Net interest exp. 12.6 13.8 15.3
PHOSAGRO
Industry: Chemicals
Credit ratings (S&P/Moody’s/Fitch): BBB-/Ba1/BB+
Summary
We see Phosagro as the strongest credit in Russia’s
chemicals credit space due to its low leverage, strong
positive free cash flow and a demonstrated commitment to
deleveraging. We see minimal risks to the current credit
position of the company, which are mainly related to the
weakening global demand for fertilizers.
Company profile
Phosagro is the leading vertically integrated producer of
phosphate-based and other mineral fertilizers in Russia. Key
production facilities are located in Vologda, Murmansk,
Saratov and Leningrad regions of Russia. Phosagro produced
5.4 mn t of phosphate-based fertilizers in 2015 with revenue
at $3.1 bn. Company’s ore reserves allow it to keep
production for 70+ years at the current rate. The company is
controlled by Andrey Guryev and his family.
Financial and debt profile
Rouble depreciation resulted in an exceptionally strong year
for the company. Revenue increased by 54% YoY in 2015 to
RUB 190bn, on higher sales volumes and a weaker ruble.
EBITDA surged 124% with EBITDA margin at record 44%
(2014: 30%). Net income for the full year was RUB 36.4 bn
although H2 net income at RUB 8.8 bn was strongly affected
by an FX loss. The company continued to reduce cash cost
of DAP (diammonium phosphate) production in 2016: it was
$133/mt in February 2016 vs $177/mt in 2015, which should
provide support to profitability in H1 2016 despite the
recent decline in DAP prices. At the same time the company
maintains a wide margin of safety in terms of costs as DAP
price in March was at $360/mt. Overall we expect financial
results in 2016 to be weaker compared to 2015 as cost
inflation kicks in while DAP prices in January-February
declined to lows last seen in 2013.
Cash flow from operations declined to RUB 30.2 bn in H2
after RUB 32.7 bn in H1 amid a seasonal increase in working
capital. At the same time capex surged 81% on H1 to RUB
27.4bn and were driven by such projects as construction of
Main Shaft 2 at the Kirovsky underground mine,
construction of a new 760 Kt per annum ammonia plant,
construction of a new 500 Kt per annum urea plant. Free
cash flow improved to RUB 20.8bn for the full year (2014:
RUB 7.1 bn). The main source of free cash flow utilization
was payment of dividends: Phosagro paid RUB 18.1bn to
shareholders versus RUB 5.7bn in 2014.
The company improved its leverage during 2015 after
deterioration in 2014 following RUB depreciation. The
increase in the nominal level of debt to RUB 134.6bn came
from revaluation of FX debt, while on cash flow basis
Phosagro repaid RUB 1.9 bn to its creditors in H2 and RUB
15.7bn during the whole of 2015. Net debt/EBITDA declined
to 1.3x from 2.5x at the end of 2014 while EBITDA/Net
interest expense strengthened to 15.3x from 13.8x. The
company aims to reduce net debt/EBITDA to 1.0x by the
end of 2016.
Liquidity remained strong with cash on balance at RUB
29.3bn fully covering short-term debt of RUB 29.0bn. The
company’s debt repayments peak in 2018 with $731mn
(RUB 53.3bn) coming due including $500mn Eurobond,
however given the strong credit metrics we do not expect
the company to face any problems with refinancing of these
maturities even in an adverse global scenario.
To summarize, we see virtually no refinancing risk in
Phosagro 2018s, however these expectations are already
priced in by the market given the tight spreads.
Risks
Rouble appreciation/cost inflation
Prolonged weakness in phosphate fertilizer prices
A prolonged decline in global demand for fertilizers
Intensive capex program

27
0
1,000
2,000
3,000
4,000
5,000
6,000
2011 2012 2013 2014 2015
Sales of fertilizers, 000' mt
Phosphate-based fertilizers
Nitrogen-based fertilizers
0.0
0.5
1.0
1.5
2.0
2.5
3.0
3.5
4.0
2011 2012 2013 2014 2015
Leverage metrics
Total debt/EBITDA
Net debt/EBITDA
0%
10%
20%
30%
40%
50%
60%
70%
0
20
40
60
80
100
120
Phosphate-based products Nitrogen-based products
Gross profit (RUB bn) and gross profit margins by segment in 2015
Gross profit
Gross profit margin (rhs)
73% 27%
Sales structure in 2015
Export
Domestic
0%
5%
10%
15%
20%
25%
30%
35%
40%
45%
50%
0
20
40
60
80
100
120
140
160
180
200
2011 2012 2013 2014 2015
Sales (RUB bn) and profitability
Sales
EBITDA margin (rhs)
0
100
200
300
400
500
600
700
800
2016 2017 2018 2019 2020 2021+
Liquidity and debt maturiry schedule as of the end-2015, USD mn
Cash
Debt payments
154.3 19.2
5.8 10.5
Structure of 2015 sales by products, RUB bn
Chemical fertilisers
Apatite concentrate
Sodiumtripolyphosphate
Other sales
50.9
47.3 44.4
18.2
12.5 10.7
5.7
Geography of sales in 2015, RUB bn
Russia
Europe
North and South America
India
Africa
CIS
Asia

28
IFRS, USD mn 2013 2014 2015 Sales 5,556 5,088 4,540 Sales YoY 4% -8% -11% EBITDA 1,298 1,343 1,422 EBITDA YoY -17% 4% 6% Net income 385 -578 756 Net income YoY -63% NA -231% Cash from operations 977 803 900 Capital expenditures 1,024 1,102 976 Free cash flow -47 -299 -75 Current ratio 2.2 1.0 1.1 Cash/Short term debt 198% 43% 32% Short-term debt/Total debt 8% 27% 30% Total debt 3,288 3,448 4,007 Cash 506 363 330 Net debt 2,782 3,084 3,677 Capex/Depreciation 3.3 4.0 4.8 EBITDA margin 23.4% 26.4% 31.3% Total debt/EBITDA 2.5 2.6 2.8 Net debt/EBITDA 2.1 2.3 2.6 Net interest expense 167 175 157 EBITDA/Net interest exp. 7.8 7.7 9.0
EUROCHEM
Industry: Chemicals
Credit ratings (S&P/Moody’s/Fitch): BB-/ - /BB
Summary
In our view, the credit quality of Eurochem is weaker than
Phosagro and comparable with that of Uralkali. The credit’s
strong points are vertical integration, its low cost raw
material base, and moderate leverage. At the same time the
company has an intensive capex program amid declining
fertilizer prices and cooling demand while the free cash flow
in the last three years was negative.
Company profile
Eurochem is one of the largest Russian vertically integrated
fertilizer producers with assets in Russia, Kazakhstan,
Lithuania, Belgium and China. The main products produced
are MAP/DAP fertilizers, ammonia and nitrogen fertilizers.
Eurochem has assets in gas production (c. 25% of needs)
and is a large producer of iron ore, a by-product of apatite
ores. On top of that, Eurochem operates a number of
export-oriented logistical assets including port terminals,
railway stock, construction/repair works, and European/CIS
distribution capacity. In 2015 the Company recorded sales
of $4.5 bn and EBITDA of $1.4 bn. The company is controlled
by Andrey Melnichenko (90%) and Dmitry Strezhnev (10%).
Financials and debt profile
H2 2015 revenue declined 8% over H1 to $2,169 mn as an
increase in selling volumes did not fully offset the effect of a
decline in key products prices, including phosphate and
nitrogen fertilizers and iron ore. EBITDA in the second half
of 2016 was $629 mn or 21% lower vs H1, EBITDA margin
was 29% after a peak in H1 at 33.5%. Net income at $238mn
fell short of $518mn seen in H1. We expect profitability in
2016 to normalize by returning to levels seen in 2013-2014
prior to the period of RUB depreciation.
Cash flow from operations slumped by 45% over H1 to $379
mn as a result of lower sales and large seasonal investments
in working capital in Q4. At the same time, capex surged 72%
resulting in negative free cash flow of $235mn in H2.
Eurochem continued to invest heavily in its two potash
projects – Usolsky and VolgaKali projects, as well as in other
projects including construction of an ammonium plant.
Total debt increased to $4.0 bn (end-June 2015: $3.5 bn) as
net proceeds from debt issuance amounted to $664 mn in
H2, while rouble depreciation positively affected the RUB
part of debt. Net debt followed total debt reaching $3,671
mn, lifting net debt/EBITDA to 2.6x versus 2.3x at end-2014
(all ratios are adjusted). Eurochem targets net debt/EBITDA
in the range of 1.5-2.5x in the long-term. Taking into account
that the company is in an active expansion phase, leverage
should remain elevated until the completion of key
investment projects, expected in 2017-2018.
Liquidity is another source of concern as the company had
just $624 mn in cash and credit lines against $1,037 mn of
short-term debt. Given the weak free cash flow amid
elevated capex, the company will be increasingly relying on
its ability to refinance its maturing debt in the next couple of
years, when the main part of debt comes due. At the
beginning of April the company placed a 3-year RUB 15 bn
($225 mn) local bond which should support liquidity in the
short-term.
RISKS
Prolonged weakness in fertilizer prices and demand
Rouble appreciation
Cost inflation
Cost overruns in capex program
Risks related to debt refinancing

29
200
400
600
800
1,000
1,200
Fertilisers Mining Other
EBITDA by segments in 2015, USD mn
0
200
400
600
800
1,000
1,200
1,400
2016 2017 2018 2019 2020 2021+
Liquidity and debt maturity schedule as of the end-2015, USD mn
Credit lines
Cash and equivalents
Debt payments
0
200
400
600
800
1,000
1,200
1,400
2011 2012 2013 2014 2015
Cash from operations and capex, USD mn
Cash from operations
Capital expenditures
44%
39%
5%
12%
Sales structure by products in 2015
Nitrogen products
Phosphate and complexfertilisers
Iron ore concentrate
Other products
0%
5%
10%
15%
20%
25%
30%
35%
40%
0
1,000
2,000
3,000
4,000
5,000
6,000
2011 2012 2013 2014 2015
Sales (USD mn) and EBITDA margin
SalesEBITDA margin (rhs)
0.0
0.5
1.0
1.5
2.0
2.5
3.0
2011 2012 2013 2014 2015
Leverage metrics
Total debt/EBITDA
Net debt/EBITDA
100
200
300
400
500
600
700
800
900
1,000
Nitrogen Phosphates Others
EBITDA by product groups in 2015, USD mn
38%
20%
12%
12%
8%
10%
Geography of sales in 2015
Europe
Russia
Asia Pacific
North America
Latin America
Other

30
IFRS, USD mn 2013 2014 2015 Sales 1,496 1,379 1,183 Sales YoY 6% -8% -14% EBITDA 391 555 459 EBITDA YoY -16% 42% -17% Net income 162 -416 -126 Net income YoY -48% -356% -70% Cash from operations 332 254 110 Capital expenditures 162 119 152 Free cash flow 169 135 -42 Current ratio 3.4 1.7 2.0 Cash/Short-term debt 124% 29% 21% Short-term debt/Total debt 11% 27% 22% Total debt 1,323 1,237 1,303 Cash 172 100 59 Net debt 1,151 1,137 1,243 Capex/Depreciation 1.39 1.33 1.62 EBITDA margin 26.1% 40.2% 38.8% Total debt/EBITDA 3.4 2.2 2.8 Net debt/EBITDA 2.9 2.1 2.7 Net interest expense 105 103 99 EBITDA/Net interest exp. 3.7 5.4 4.6
Myronivsky Hliboproduct (MHP)
Industry: Agriculture
Credit ratings (S&P/Moody’s/Fitch): B-/Caa2/CCC
Summary: MHP remains the strongest name in the
Ukrainian corporate Eurobond space. MHP operates a
vertically integrated business model, controls around a third
of the poultry meat market in Ukraine and is one of the
most efficient grain producers with the largest land bank in
the country of 360K hectares. At the same time we note
growing financial leverage, weak purchasing power of the
local population, and reduction of government subsidies.
Company profile: MHP is the largest poultry meat producer
in Ukraine with a 35% market share. The company produces
chicken meat, sunflower oil, grain, other food products.
MHP operates the largest land bank in Ukraine and
generated around 44% of revenue from exports in 2015.
The key shareholder of MHP is Yuriy Kosyuk (66%), other
shares are traded on the London Stock Exchange.
Financial and debt profile
Following the start of operations at the Vinnitsa complex for
the full capacity, the company increased chicken meat
production to 567 Kt in 2015 versus 545 Kt in 2014. The
company expects to increase production in 2016 to 600Kt.
Positive dynamics in operational metrics did not suffice to
offset a slump in poultry prices in the local market in USD
terms driven by large scale depreciation of hrivnya: 2015
sales were $1.2 bn or 14% lower YoY. EBITDA declined to
$459mn (2014: $555mn), while EBITDA margin was 38.8%
(2014: 40.2%) as a decline in poultry meat prices outpaced
the decline in operating costs, squeezing margins. MHP
recorded a net loss for the second consecutive year: $126
mn vs $416 mn in 2014. Adjusted for the FX loss the
company net profit would have been $293mn (2014: $362
mn). Revenue in 2016 should be supported by an increase in
poultry meat production to 600kt. Management guided for
$400-420mn of EBITDA in 2016 and noticed that EBITDA
margin should decline to a more normal 30-35% range after
a temporary boost from UAH depreciation and taking into
account cost-side pressures.
Cash flow from operations was under pressure due to a
decline in EBITDA and large investments in working capital.
According to the company, such investments were driven by
an opportunity to increase sunflower seed inventory at low
prices and this investment is not expected to reverse in 2016
as the company projects additional contributions of $60 mn
in working capital in 2016.
At the same time, capex increased to $152 mn (2014: $119
mn) due to the construction of a hatchery and soya oil plant.
MHP guided for $100-110mn of capex in 2016 as the
construction of the second phase of Vinnitsya poultry
project was postponed given the uncertainty with the
distribution channels for the additional volumes of meat.
The company seeks opportunities to acquire production or
meat processing facilities in the EU to increase exports to
the single market, which could also raise leverage.
MHP turned free cash flow negative in 2015 for the first time
since 2012 which increased pressure on its credit profile.
MHP continued to accumulate debt with net debt increasing
by $106 mn compared to the end of 2014. Net debt/EBITDA
increased to 2.7x (effective Eurobond covenant level is 3.3x),
while EBITDA/Net interest deteriorated to 4.6x from 5.4x in
2015. Notably, liquidity remained weak: at the end of 2015
the company had $59 mn of cash and further $84 mn in
credit lines which covered less than half of $286 mn in short-
term debt. Around half of this debt is financing of working
capital and should be easily rolled over, according to the
management. Taking into account dividends of around $80
mn to be paid in May we do not expect any material
improvement in company’s credit profile in 2016.
Risks
UAH depreciation/cost inflation
Aggressive expansion strategy
Modest liquidity
Exposure to the volatile economy of Ukraine

31
0
100
200
300
400
500
600
2011 2012 2013 2014 2015
Sales of key products to third parties, 000 mt
Chicken meat
Sunflower oil
0.0
0.5
1.0
1.5
2.0
2.5
3.0
3.5
4.0
2011 2012 2013 2014 2015
Leverage metrics
Total debt/EBITDA
Net debt/EBITDA
0
50
100
150
200
250
300
350
2011 2012 2013 2014 2015
Cash flow from operations and capex, USD mn
Cash from operations
Capital expenditures
979
263
117
Revenue structure by segments in 2015, USD mn
Poultry and relatedoperations
Grain growingoperations
Otner agriculturaloperations
0%
5%
10%
15%
20%
25%
30%
35%
40%
45%
0
200
400
600
800
1,000
1,200
1,400
1,600
1,800
2011 2012 2013 2014 2015
Sales (USD mn) and EBITDA margin
Sales EBITDA margin (rhs)
0
100
200
300
400
500
600
700
800
900
1,000
2016 2017 2018-2020 2021+
Liquidity and debt maturity schedule as of end-2015, USD mn
Credit lines
Cash and equivalents
Debt
0%
5%
10%
15%
20%
25%
30%
35%
40%
0
50
100
150
200
250
300
350
400
Poultry and relatedoperations
Grain growingoperations
Otner agriculturaloperations
EBITDA structure by segments in 2015, USD mn
EBITDA
EBITDA margin (rhs)
659
524
Geography of sales in 2015, USD mn
Local revenue
Export revenue

32
IFRS, GEL mn 2013 2014 2015 Sales 326 358 495 Sales YoY 9% 10% 38% EBITDA 109 112 123 EBITDA YoY 0% 3% 10% Net income 94 84 36 Net income YoY 16% -11% -57% Cash from operations 152 80 4 Capex 118 137 102 Free cash flow 35 -57 -98 Current ratio 9.3 3.7 5.1 Cash/Short-term debt 31.7 21.9 14.6 Short-term debt/total debt 1% 2% 2% Total debt 432 465 600 Cash 195 182 191 Net debt 237 283 409 Capex/Depreciation 6.4 6.8 3.8 EBITDA margin 34% 31% 25% Total debt/EBITDA 4.0 4.2 4.9 Net debt/EBITDA 2.2 2.5 3.3 Net interest expense 16 4 7 EBITDA/Net interest expense 6.9 31.2 18.6
Georgian Oil and Gas Corporation
Sector: Oil and Gas
Credit ratings (S&P/Moody’s/Fitch): B+/-/BB-
Summary: We expect the company’s credit quality to
improve in the next 12-18 months due to repayment of
related party loans following the completion of the
Gardabani Power station project. In April GOGC raised
$250mn by issuing notes due 2021. The funds were used to
finance buyback of outstanding bond issue due 2017.
Company profile
The principal activities of the Georgian Oil and Gas
Corporation are the importation and sale of gas, rental of
gas pipelines, production of electricity, oil and gas
exploration and extraction in the territory of Georgia. The
company is fully owned by the government of Georgia via
the Partnership fund, the operator of state-owned assets.
The company recorded revenue of $218 mn in 2015, mainly
from gas distribution. In July 2015 the company
commissioned the Gardabani gas-fuelled electric power
station, diversifying its concentrated business profile. In our
view the proven track record in implementing large capital
projects should positively impact the company’s perception
among investors thus supporting its ability to tap external
capital markets.
Financial and debt profile
Revenue in 2015 increased by 38% YoY to GEL 495mn,
supported by an increase in selling volumes of gas,
depreciation of Lari and the launch of Gardabani Combined
Cycle Thermal Power Plant in July last year. EBITDA
increased by 10% YoY to GEL 123mn, while EBITDA margin
declined to 25% from 31%, as the company was not able to
fully pass on increased costs of imported gas to its
customers, while personnel costs increased due to the
construction works at Gardabani TPP. Net income was GEL
36mn, declining by 57% YoY mainly due to an FX loss. We
note that GEL depreciation positively affected the
company’s credit quality.
Cash flow from operations was just GEL 4mn in 2015, while
capex declined to GEL 102mn. However, the resulting
negative free cash flow was supported by the repayment of
loans provided to shareholder, which generated GEL 118
mn, fully covering free cash flow deficit. GOGC earlier
reported plans to sell the newly constructed power plant to
investors, although these plans did not progress. As of the
new investment projects, the company has completed the
feasibility study on the construction of the underground gas
storage and has plans to construct the second thermal plant
in Gardabani. Part of the raised funds from the new
Eurobond may be used for these projects however no final
decision regarding their implementation has been made.
Net debt/EBITDA increased to 3.3x from 2.5x at the end of
2014 but was lower than 4.2x at the end of H1 2015, we
expect the company to gradually reduce its leverage
following the repayment of loans provided earlier to
shareholder.
Despite signing a new $30mn loan agreement with VTB
Bank Georgia in H2 2015, the company had insufficient
liquidity to repay notes due 2017. However following the
successful placement of the 5-year $250 mn notes at the
end of April, the GOGC announced a buyback for its
outstanding notes due 2017. The placement of new notes
and subsequent buyback has shifted refinancing risks for the
company to 2021.
Risks
Exposure to emerging Georgian economy
Regulatory risks
Concentration risks/exposure to local banking system
33
150
170
190
210
230
250
270
290
310
330
2008 2009 2010 2011 2012 2013 2014 2015
Oil transportation, mn bbl
0%
5%
10%
15%
20%
25%
30%
35%
40%
45%
50%
0
100
200
300
400
500
600
2011 2012 2013 2014 2015
Sales (GEL mn) and EBITDA margin
Sales
EBITDA margin (rhs)
0
100
200
300
400
500
600
700
2016 2017
Liquidity and debt maturity as of end-2015, GEL mn
Term deposits Loans givenCredit lines Cash and equivalentsDebt repayment
350
69
10
18 49
Revenue structure in 2015, GEL mn
Gas supply
Pipeline rental
Upstream activities
Oil transportation
Electricitygeneration
30
35
40
45
50
55
60
2008 2009 2010 2011 2012 2013 2014 2015
Oil production, 000 tons
0
20
40
60
80
100
120
140
160
2011 2012 2013 2014 2015
Cash flow from operations and capex, GEL mn
Cash from operations
Capital expenditures
-1.0
0.0
1.0
2.0
3.0
4.0
5.0
6.0
2011 2012 2013 2014 2015
Leverage metrics
Total debt/EBITDA
Net debt/EBITDA
31
57
9
15
20
Structure of gross profit in 2015, GEL mn
Gas supply
Pipeline rental
Upstream activities
Oil transportation
Electricity

34
Disclaimer
This report is prepared by Norvik Banka UK Limted, of 46-48 Grosvenor Gardens, London, SW1W 0EB, United Kingdom (hereinafter referred
to as the Company) as a marketing communication for information purposes only. Neither the information nor any opinion contained in this
report (notwithstanding the source) is intended to be, or should be construed as an offer, a recommendation, an advice or an invitation to
make an offer, to buy or sell any financial instrument. Information contained in this report constitutes neither investment nor tax advice and it
does not take into account the specific investment objectives, risk appetite and financial situation of anyone who may receive this report.
Investors should seek their own advice regarding the appropriateness of investing in any financial instrument discussed in this report and
carefully evaluate the risks and eventual losses that are related to the investment services and its compliance with their investment goals.
Investors should note that any income derived from investments in financial instruments may fluctuate and that the price or value of securities
and investments may rise or fall. Accordingly, investors may lose their investment or receive back less than originally invested. Past
performance and income is not a guide to future performance and income. Foreign currency exchange rates may adversely affect the value,
price or income of any security or related investment mentioned in this report. Investing in the Russian or CIS economies and securities
involves a high degree of risk and requires appropriate knowledge and experience.
The information contained in this report have been obtained from such public sources what are believed to be reliable, but no representation
or warranty is made by the Company with regard to accuracy. Therefore the information contained herein is subject to change without prior
notice.
This report should not be viewed as the only source of information, and neither the Company, nor the companies within the NORVIK group
and/or any affiliates or employees thereof accept any responsibility or liability whatsoever for any direct or indirect damage arising out of or in
any way connected with the use of information contained herein, nor for its authenticity.
This report may not be distributed, copied, reproduced or changed without prior written consent from the Company. Further information, which
for the avoidance of doubt cannot be treated as the recommendations and/or advice either, may be obtained from the Company upon request.
This report has not been prepared on the basis of the requirements of regulatory provisions promoting independence of investment research
and is not subject to the prohibition from making transactions before disseminating investment research.
Norvik Banka Research is a Trading Name of Norvik Banka UK Ltd, which is Authorised and Regulated by the Financial Conduct Authority,
FRN: 681329. Registered in England and Wales with number 08940522. Registered Office: 46/48 Grosvenor Gardens 1st Floor, London,
SW1W 0EB.