The Circular-Flow Diagram Firms Households Market for Factors of Production Market for Goods and...
46
The Circular-Flow Diagram Firms Households Market for Factors of Production Market for Goods and Services Spending Revenue Wages, rent, and profit Income Goods & Services sold Goods & Services bought Labor, land, and capital Inputs for production
-
Upload
emmeline-newman -
Category
Documents
-
view
226 -
download
1
Transcript of The Circular-Flow Diagram Firms Households Market for Factors of Production Market for Goods and...

The Circular-Flow Diagram
Firms Households
Market for Factors
of Production
Market for Goods
and Services
SpendingRevenue
Wages, rent, and
profit
Income
Goods & Services
sold
Goods & Services bought
Labor, land, and capital
Inputs for production

Markets
A market is a group of buyers and sellers who interact to buy and sell a particular good or service.

Market Types: Competitive and Otherwise
Products are the same Numerous buyers and sellers so that each
has no influence over price Buyers and Sellers are price takers
Perfect Competition

Market Types: Competitive and Otherwise
Monopoly One seller who controls price
Oligopoly Few sellers Not always aggressive competition
Monopolistic Competition Many sellers Slightly differentiated products Each seller may set price for its own product
The Circular-Flow Diagram
Firms Households
Market for Factors
of Production
Market for Goods
and Services
SpendingRevenue
Wages, rent, and
profit
Income
Goods & Services
sold
Goods & Services bought
Labor, land, and capital
Inputs for production
The quantity demanded is the amount of a good that a buyer is (buyers are)
willing and able to buy during a specified period of time.
Quantity demanded refers to a particular number of units.

The quantity demanded by a consumer will depend upon the following factors:
The good’s own price. The consumer’s income. Prices of related goods. The consumer’s tastes and and preferences. Expectations and other special influences.
2 4 6 8 12 14
2
4
6
8
10
12
10
14
price
quantity
dv
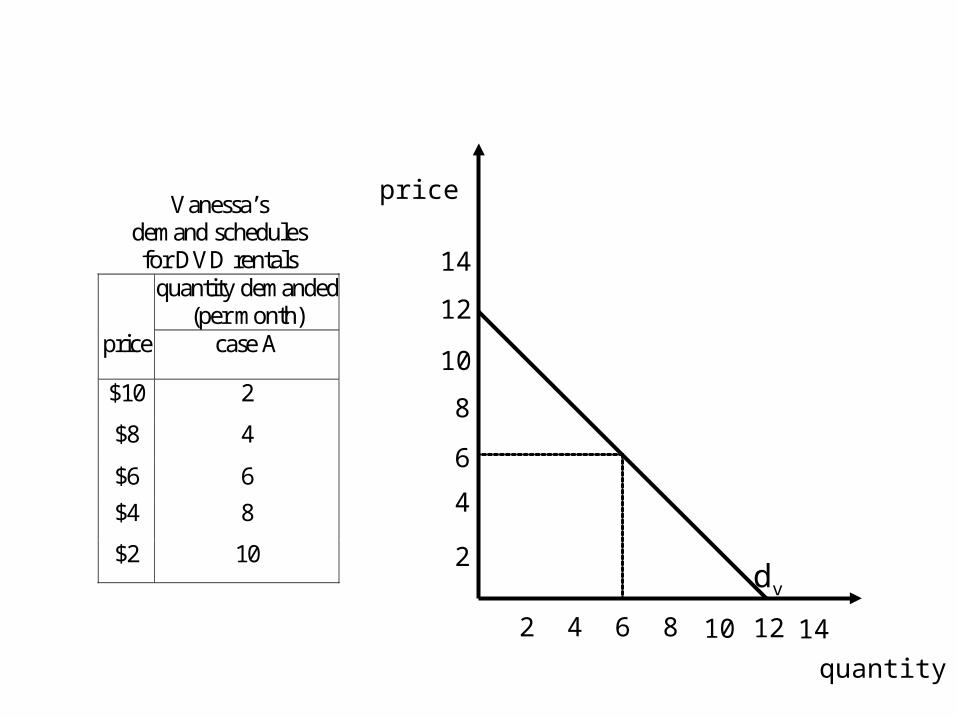
Vanessa’s demand schedules for DVD rentals
quantity demanded (per month)
price case A
$10 2
$8 4
$6 6
$4 8
$2 10
Demand is the relationship between the price of a good or service and the
quantity demanded, ceteris paribus.
Market demand is the relationship between the price of a good or service and the quantity demanded by all buyers in the market, ceteris paribus.

2 4 6 8 12 14 16
2
4
6
8
10
12
10
14
price
quantity
D
dkdD dv
a b c e
m n q r s
Demand Schedulesfor Video Rentals
quantity demanded(per month)
price Kim Derrek Van-essa
total
$10 1 0 2 3
$8 2 0 4 6
$6 3 1 6 10
$4 4 2 8 14
$2 5 3 10 18
The market demand curve is obtained by horizontally summing the demand curves for all buyers in the market.
Implication: An increase in the number of buyers will result in an increase in market demand, ceteris paribus.

Changes in Quantity Demanded
0
D1
Price of Cigarettes per Pack
Number of Cigarettes Smoked per Day
The price of cigarettes increases.
A
C
20
2.00
$4.00
12

Change in Quantity Demanded Movement along the demand curve. Caused by a change in the price of
the product.

Demand is the relationship between the quantity demanded and the good’s own
price, ceteris paribus.
Other factors being held constant: Income. Prices of related goods. Tastes and and preferences. Expectations and other special influences.
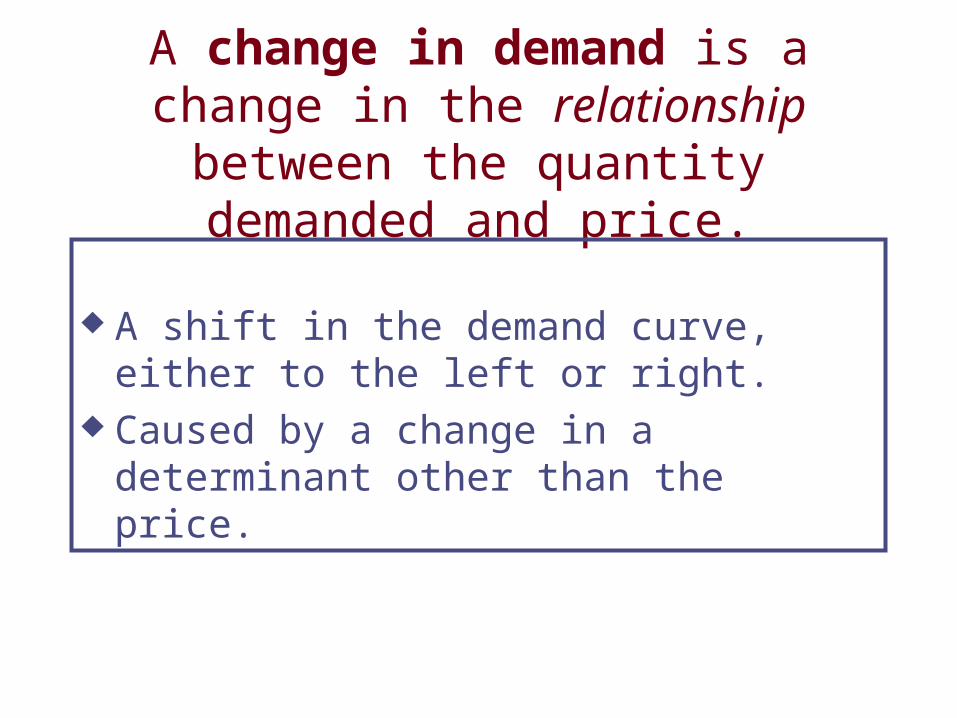
A change in demand is a change in the relationship between the quantity
demanded and price.
A shift in the demand curve, either to the left or right.
Caused by a change in a determinant other than the price.
2 4 6 8 12 14
2
4
6
8
10
12
10
14
price
quantity
dv
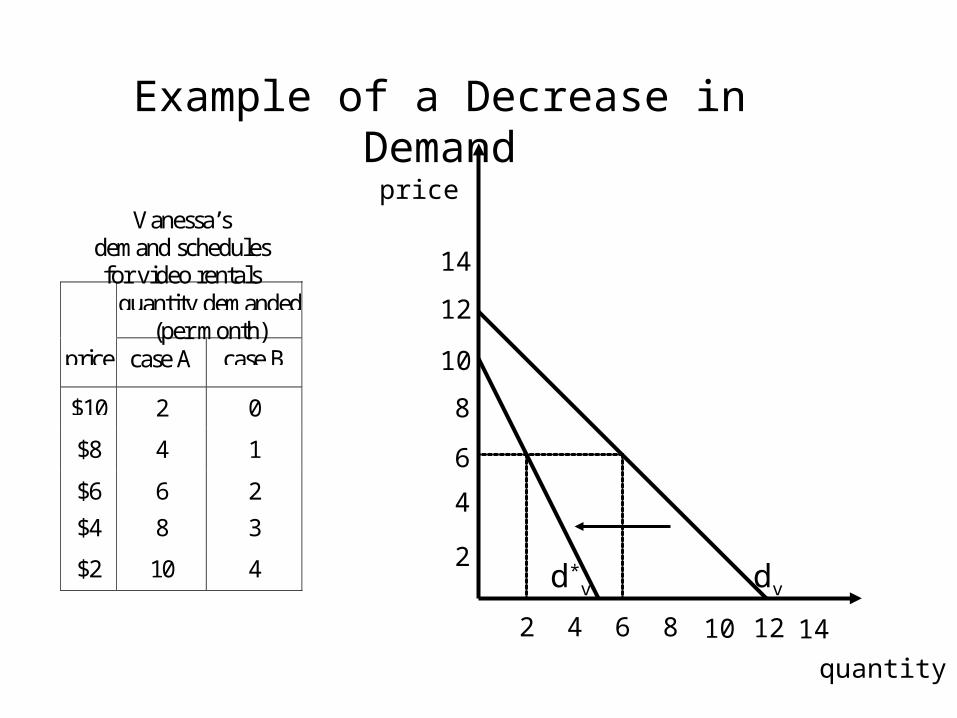
Vanessa’sdemand schedulesfor video rentals
quantity demanded(per month)
price case A case B
$10 2 0
$8 4 1
$6 6 2
$4 8 3
$2 10 4 d*v
Example of a Decrease in Demand

Changes in Demand
0
D1
Price of Ice-Cream Cone
Quantity of Ice-Cream Cones
D3
D2
Increase in demand
Decrease in demand
Consumer Income
As income increases the demand for a normal good will increase.
As income increases the demand for an inferior good will decrease.

Consumer IncomeNormal Good
$3.002.50
2.001.501.00
0.50
21 3 4 5 6 7 8 9 10
12
11
Price of Ice-Cream Cone
Quantity of Ice-Cream Cones
0
Increasein demand
An increase
in income...
D1
D2

Consumer IncomeInferior Good
$3.002.50
2.001.501.00
0.50
21 3 4 5 6 7 8 9 10
12
11
Price of Ice-Cream Cone
Quantity of Ice-Cream Cones
0
Decreasein demand
An increase
in income...
D1D2

Prices of Related GoodsSubstitutes & Complements
When a fall in the price of one good reduces the demand for another good, the two goods are called substitutes.
When a fall in the price of one good increases the demand for another good, the two goods are called complements.

Show graphically and explain what will happen to the demand for gasoline
when:
The price of air travel increases. Automobile prices fall. Incomes rise. Highway tolls rise. The price of gasoline rises.
Quantity supplied is the quantity of a good a seller is (sellers are) willing and
able to make available in the market over a given period of time.
Quantity supplied refers to a particular number of units.
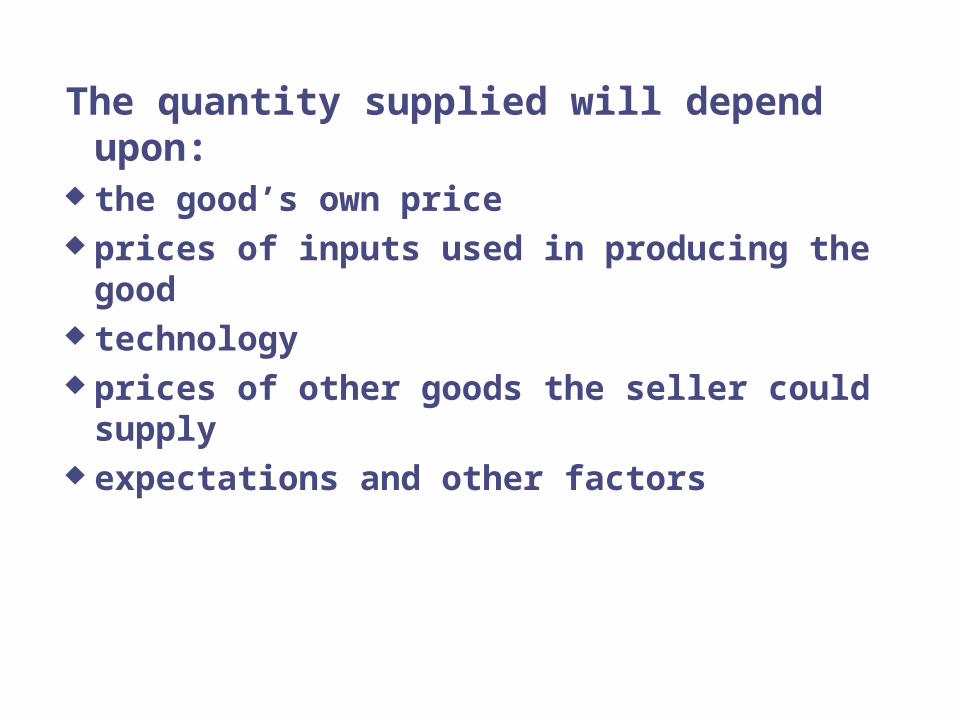
The quantity supplied will depend upon: the good’s own price prices of inputs used in producing the good technology prices of other goods the seller could supply expectations and other factors
Supply is the relationship between the price of a good or service and the quantity supplied, ceteris paribus.
The law of supply states that there is a direct (positive) relationship between price and quantity supplied.

Supply Curve
$3.002.502.00
1.501.00
0.50
21 3 4 5 6 7 8 9 10
12
11
Price of Ice-Cream Cone
Quantity of Ice-Cream Cones
0
Price Quantity$0.00 00.50 01.00 11.50 22.00 32.50 43.00 5

Market Supply
Market supply refers to the sum of all individual supplies for all sellers in a market for a particular good or service.
Graphically, individual supply curves are summed horizontally to obtain the market supply curve.

Change in Quantity Supplied
1 5
Price of Ice-Cream Cone
Quantity of Ice-Cream Cones
0
S
1.00A
C$3.00
The price increases from $1.00 to $3.00
Change in Quantity Supplied
Movement along the supply curve.
Caused by a change in the market price of the product.
Change in Supply
Price of Ice-Cream Cone
Quantity of Ice-Cream Cones
0
S1 S2
S3
Increase in Supply
Decrease in Supply
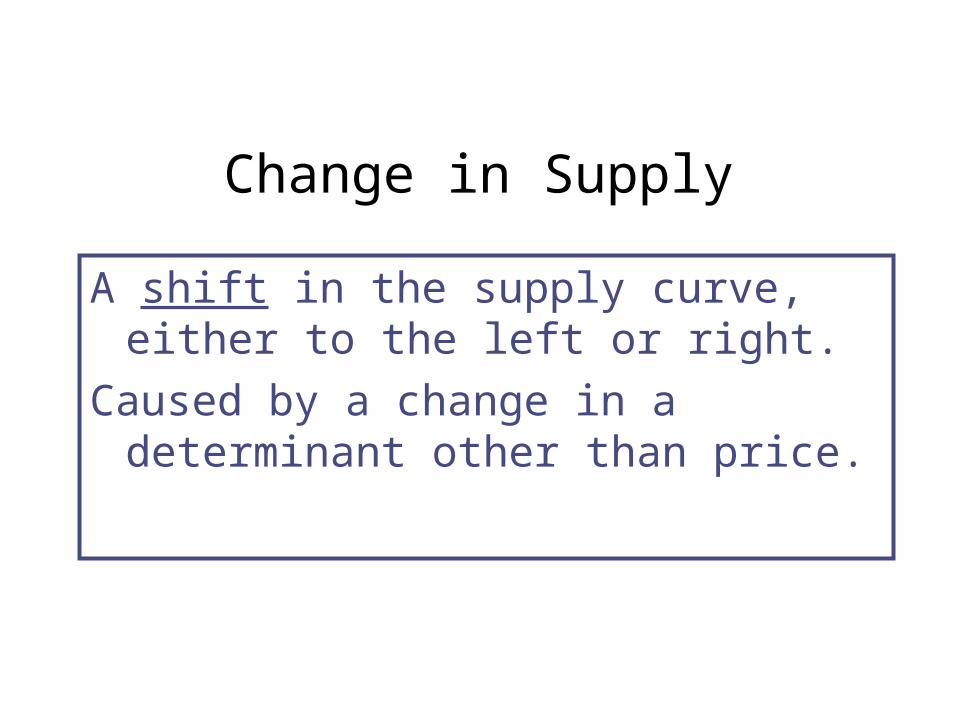
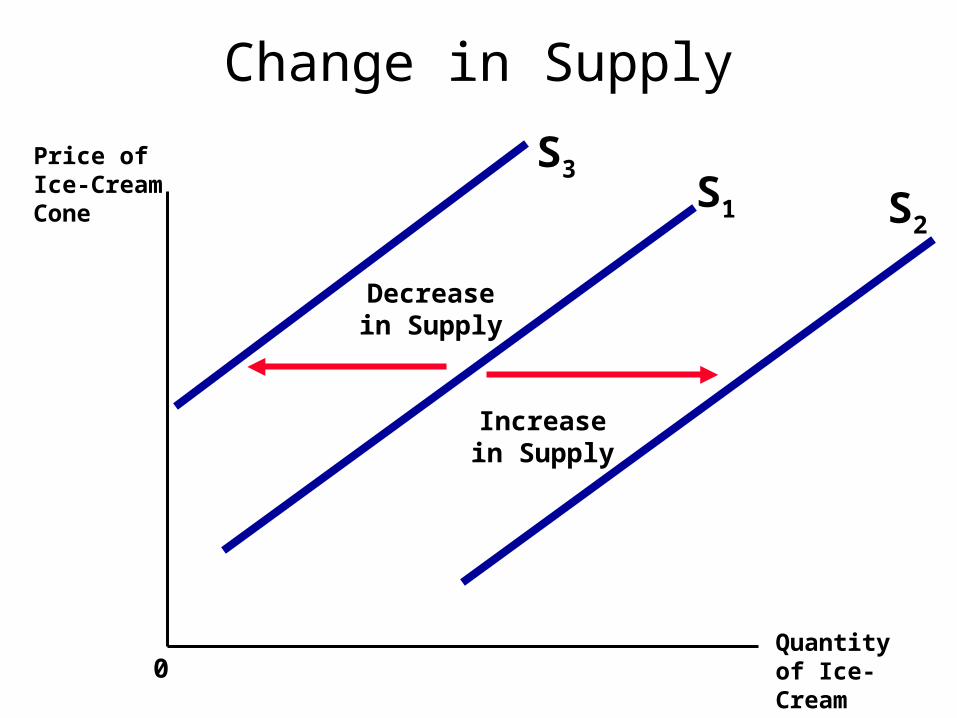
Change in Supply
A shift in the supply curve, either to the left or right.
Caused by a change in a determinant other than price.
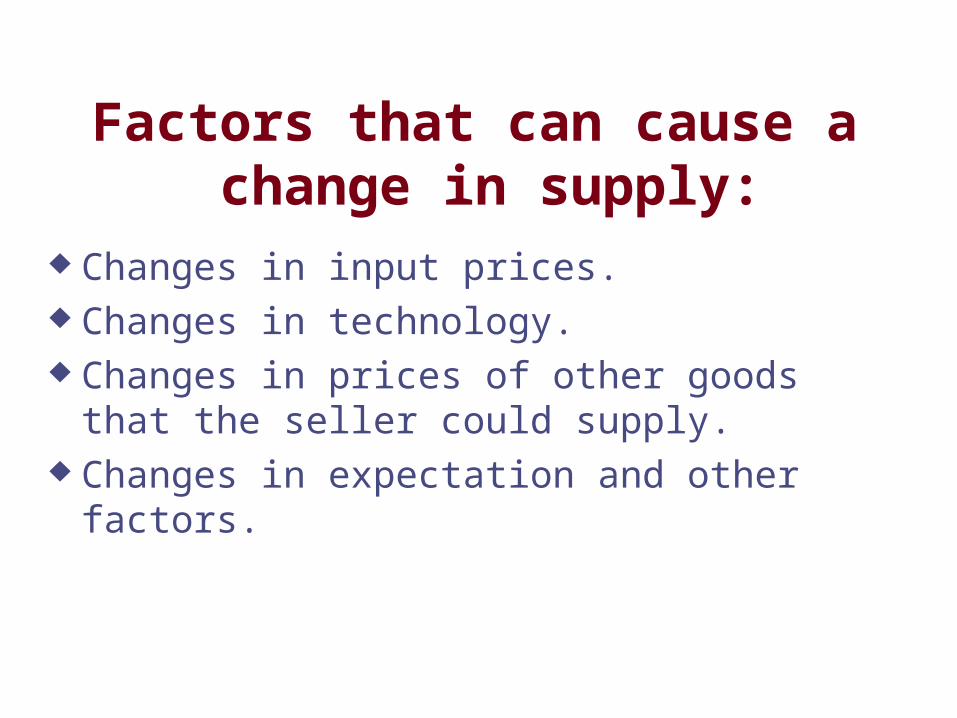
Factors that can cause a change in supply:
Changes in input prices. Changes in technology. Changes in prices of other goods that the seller
could supply. Changes in expectation and other factors.

How would the supply of personal computers be affected by:
A decline in the prices of a computer component. A faster method for assembling computers is
developed. Dell Corporation goes out of business. The price of personal computers declines.

Equilibrium Equilibrium is the state of balance between
opposing forces. In equilibrium, the system is in a state of rest
in that there is no tendency for change. In economics, there is an equilibrium when
economic forces are in balance so that economic variables have no tendency to change.
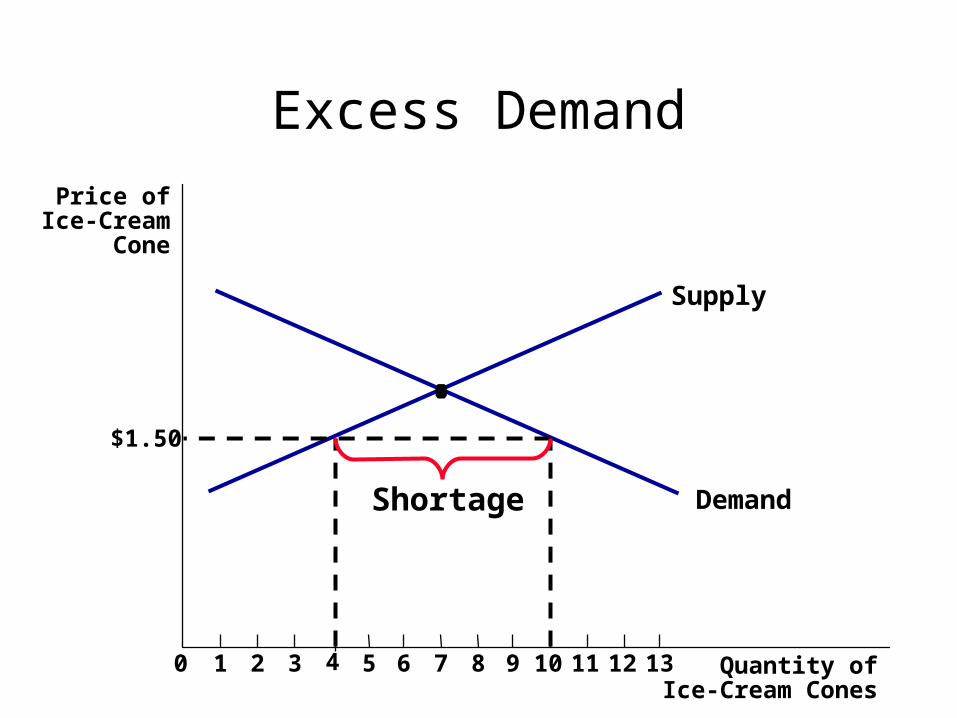
Excess Demand
Quantity ofIce-Cream Cones
Price ofIce-Cream
Cone
0 1 2 3 4 5 6 7 8 9 10 11 12 13
Supply
Demand
$1.50
Shortage

There is a shortage (excess demand) when the quantity demanded exceeds the quantity supplied.
A shortage will result in upward pressure on price.
Price of Ice-Cream Cone
Quantity of Ice-Cream Cones
21 3 4 5 6 7 8 9 10
12110
$3.002.50
2.00
1.501.00
0.50
Supply
Demand
Surplus
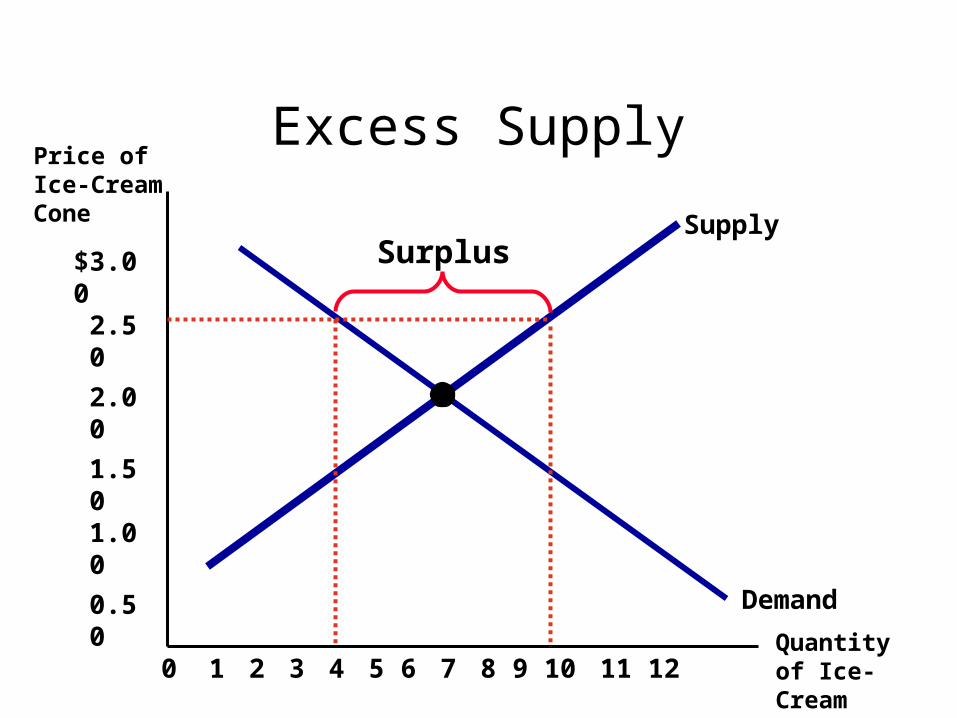
Excess Supply

There is a surplus (excess supply) when the quantity demanded is less than the quantity supplied.
A surplus will result in downward pressure on price.

Supply
Demand
Price of Ice-Cream Cone
Quantity of Ice-Cream Cones
Equilibrium of Supply and Demand
21 3 4 5 6 7 8 9 10 12110
$3.002.502.00
1.501.00
0.50
Equilibrium
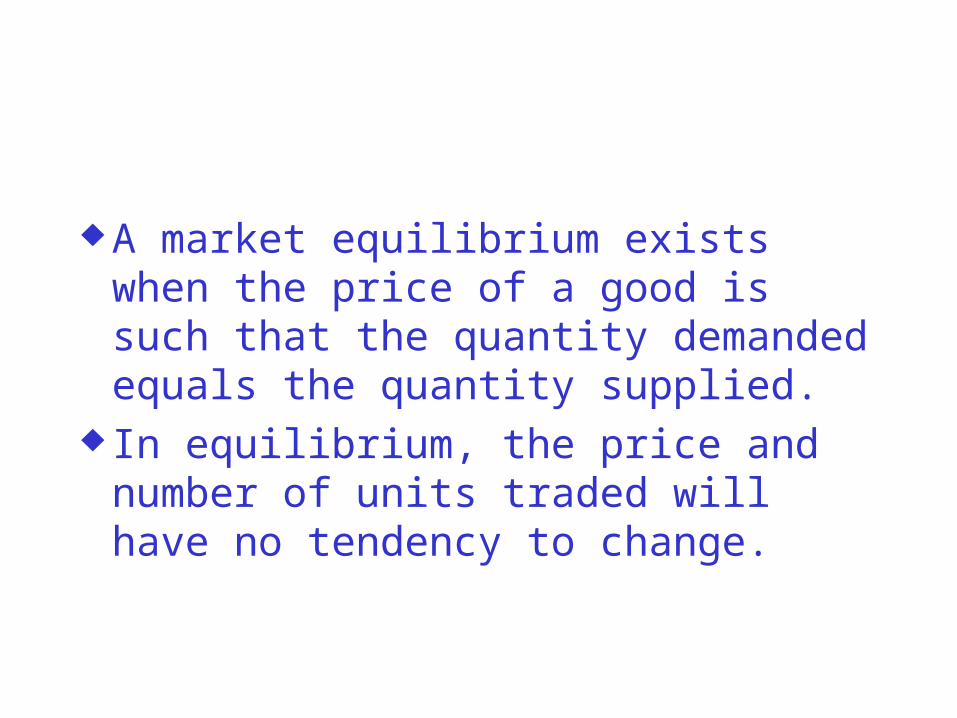
A market equilibrium exists when the price of a good is such that the quantity demanded equals the quantity supplied.
In equilibrium, the price and number of units traded will have no tendency to change.

Market EquilibriumSupply
Demand
P
QQe
Pe
Factors affecting demand: income prices of related goods tastes expectations
Factors affecting supply: input prices technology prices of other goods that could be produced expectations

How an Increase in Demand Affects the Equilibrium
Price ofIce-Cream
Cone
2.00
0 7 Quantity ofIce-Cream Cones
Supply
Initialequilibrium
D1
D2
$2.50
10
New equilibrium
Harcourt, Inc. items and derived items copyright © 2001 by Harcourt, Inc.
Q
PD1 S
P1
Q1
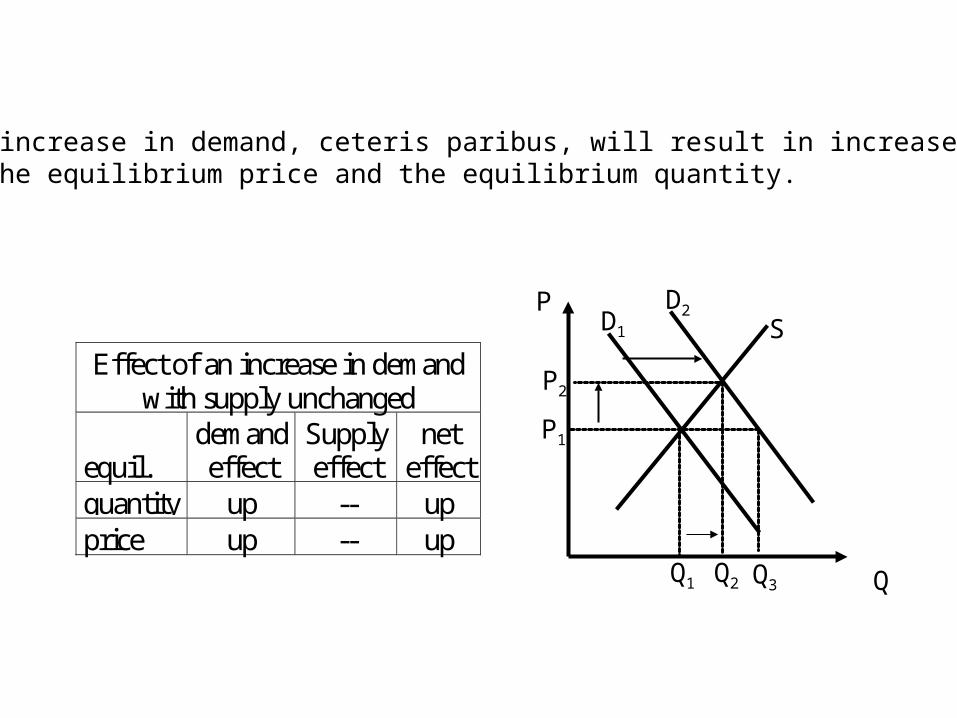
Effect of an increase in demandwith supply unchanged
equil.demandeffect
Supplyeffect
neteffect
quantity up -- upprice up -- up
D2
P2
Q2 Q3
A. An increase in demand, ceteris paribus, will result in increases in both the equilibrium price and the equilibrium quantity.

Q
PD1 S
P1
Q1
Effect of an decrease in demandwith supply unchanged
equil.demandeffect
Supplyeffect
neteffect
quantity down -- downprice down -- down D5
P4
Q4Q5

Q
PD Sa
P1
Q1 Q2
P2
Sb
C. An increase in supply, ceteris paribus, will result in a reductionin the equilibrium price and an increase in the equilibrium quantity.
Q
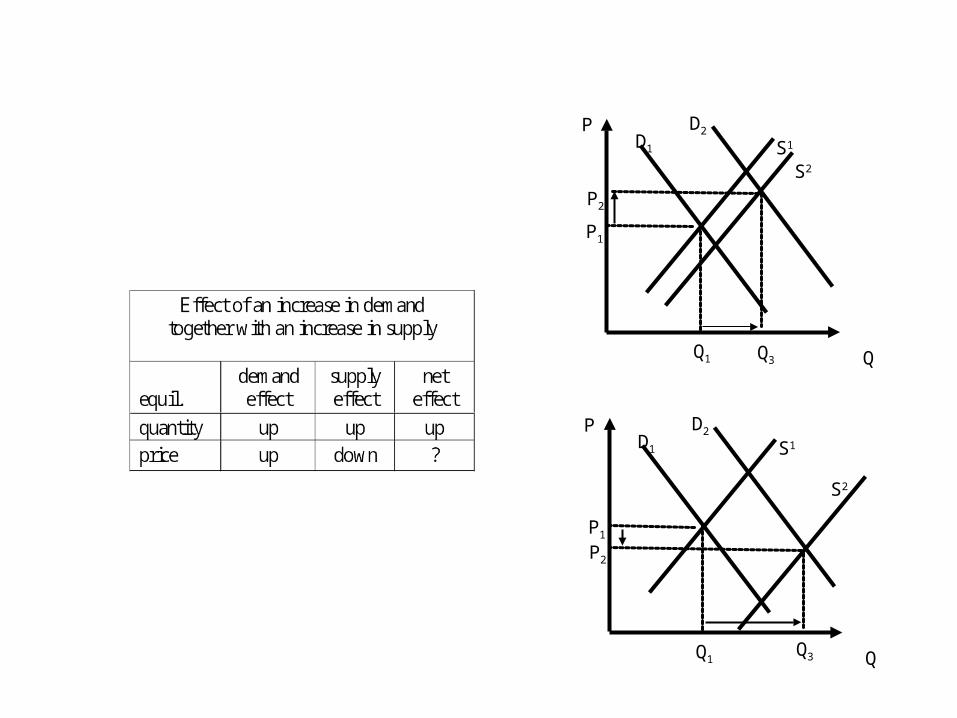
PD1 S1
P1
Q1
D2
P2
Q3
S2
Q
PD1 S1
P1
Q1
D2
P2
Q3
S2