The Chinese Conundrum - Platts · B 236 8.40 Colour order (left to right, top to bottom) R 59 G 110...
20
Rabobank Food & Agribusiness Research and Advisory September 2016 The Chinese Conundrum Self Sufficiency or Imports?
-
Upload
truongxuyen -
Category
Documents
-
view
215 -
download
0
Transcript of The Chinese Conundrum - Platts · B 236 8.40 Colour order (left to right, top to bottom) R 59 G 110...

12.40
6.40
6.80
5.80
0.80
1.20
7.80
8.80
9.00
0.20
0.20
12.40 7.90
7.50
Guides for gutter
Text colours
R 27 G 66 B 152
R 0 G 0 B 0
R 127 G 127 B 127
Background shading
R 242 G 242 B 242
R 225 G 235 B 244
R 227 G 244 B 236
8.40
Colour order (left to right, top to bottom)
R 59 G 110 B 143
R 251 G 193 B 119
R 115 G 198 B 161
R 103 G 153 B 200
R 186 G 163 B 171
R 191 G 191 B 191
R 127 G 127 B 127
R 201 G 48 B 146
R 27 G 66 B 152
R 84 G 7 B 91
R 248 G 152 B 29
R 241 G 237 B 238
R 254 G 234 B 210
R 211 G 227 B 237 Rabobank
Food & Agribusiness Research and Advisory September 2016
The Chinese Conundrum
Self Sufficiency or Imports?

2
Our approach to client relationships
Driven by sector knowledge & supported by product capabilities
Sectors covered:
Dairy
Ingredients & Sugar
Grains & Oilseeds
Value-added Processing
Beverages
Animal Protein
Farm Inputs
Broader sub sector coverage
Sub sector specialists involved in both origination and execution for financing and advisory products
Sub sector coverage bankers cover an entire region (Europe, Americas or Asia)
M&A bankers specialised into 11 sub sectors of the food, drinks and agri spectrum
Access to deeper research
Rabobank has its own unique group of dedicated and highly specialised Food and Agri Research analysts (FAR)
FAR comprises 80 analysts in 13 countries around the globe
Fundamental research covering the entire food and drinks chain
Output in the form of tailored presentations for internal and external clients, World Maps, Industry Notes, F&A Reviews, Commodity Notes and Regional Banking Reports

3
Leading global financial institution for Sugar sector
9/10 9 of the Top 10 Global Sugar companies are Rabobank clients
70 clients around the globe 70 $2.8 billion
in commitments to the global sugar industry
4
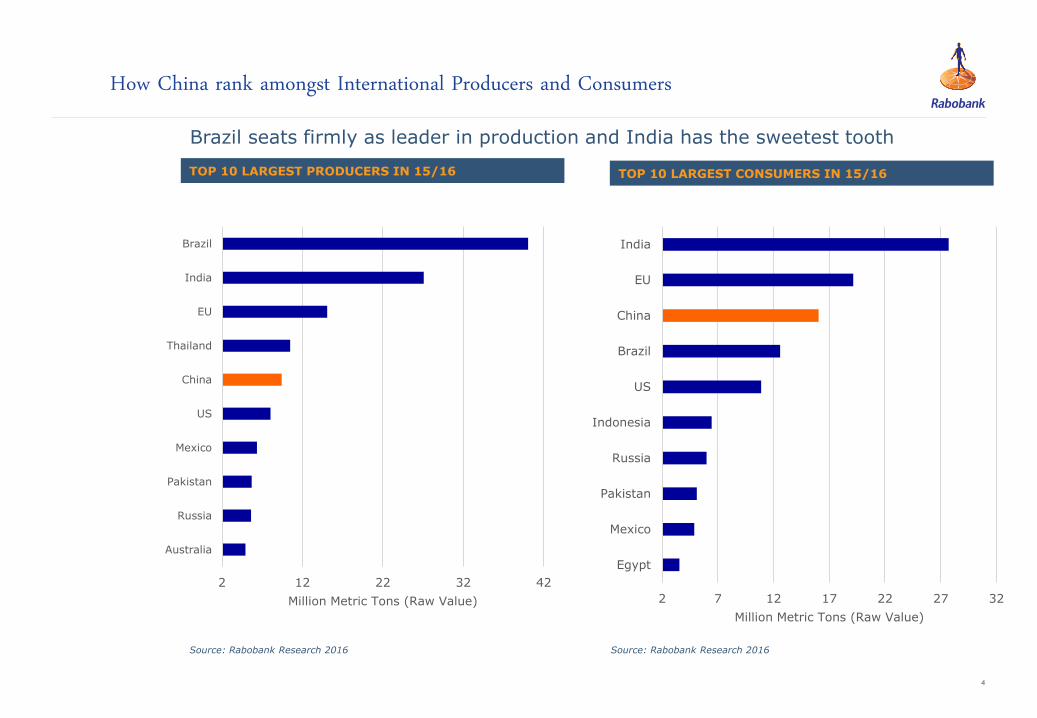
Brazil seats firmly as leader in production and India has the sweetest tooth
Source: Rabobank Research 2016
TOP 10 LARGEST PRODUCERS IN 15/16 TOP 10 LARGEST CONSUMERS IN 15/16
How China rank amongst International Producers and Consumers
Source: Rabobank Research 2016
2 12 22 32 42
Australia
Russia
Pakistan
Mexico
US
China
Thailand
EU
India
Brazil
Million Metric Tons (Raw Value) 2 7 12 17 22 27 32
Egypt
Mexico
Pakistan
Russia
Indonesia
US
Brazil
China
EU
India
Million Metric Tons (Raw Value)

5
China per-capita-consumption vs the region
Source: Chinese National Bureau of Statitiscs, Rabobank
Reseach World Bank/IMF/China Bureau of Statistics
Prospects of consumption sweetens
0
10
20
30
40
50
60
70
Kg-P
er-
Capita
2014/15 2015/16 (f) World Ave Asia Ave
5
10
15
20
25
30
35
1.26
1.28
1.3
1.32
1.34
1.36
1.38
1.4
1.42
Thousands
Billions
Total Population (LHS)
Disposable Income per capita (RMB) (RHS)

6
China’s sugar consumption still to grow by 2% in the next few years
Source: China Sugar Association, Rabobank Estimates 2016
5
7
9
11
13
15
17
19
21
2006/07 2007/08 2008/09 2009/10 2010/11 2011/12 2012/13 2013/14 2014/15 2015/16(f)
2016/17(f)
2020/21(f)
Million m
t (r
aw
valu
e)

7
China’s sugar balance sheet – a deficit structure
Source: China Sugar Association, Rabobank estimates
0
1
1
2
2
3
3
4
4
5
5
2
4
6
8
10
12
14
16
18
2006/07 2007/08 2008/09 2009/10 2010/11 2011/12 2012/13 2013/14 2014/15 2015/16 2016/17(F)
Raw
Valu
e M
illion M
T
Raw
Valu
e M
illion M
T
Production Consumption Imports (RHS)

8
Henan Gansu
Heilongjiang
Jilin
Liaoning
Hebei
Shandong
Fujian
Jiangxi
Hubei
Hunan
Guangdong Guangxi
Shanxi
Hainan
Inner Mongolia
Shaanxi
Ningxia Qinghai
Guizhou
Yunnan
Tibet
Xinjiang
Jiangsu
Tianjin
Beijing
Taiwan
Anhui
Zhejiang
Shanghai
Sichuan Chongqing
Production 10000-50000
Production>50000
Production 1000-10000
Production 500-1000
Production <500
Unit: Thousand Metric Tonnes of cane
China’s Main Cane Growing Area
Source: China Statistics Yearbook 2014
9
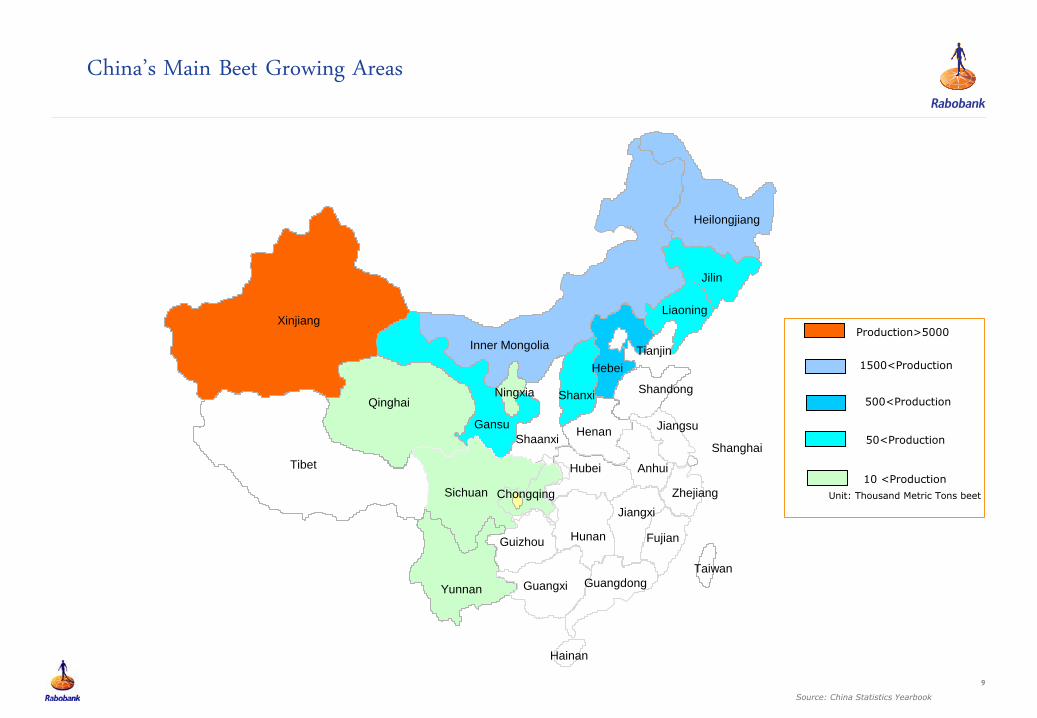
Henan Gansu
Heilongjiang
Jilin
Liaoning
Hebei
Shandong
Fujian
Jiangxi
Hubei
Hunan
Guangdong Guangxi
Shanxi
Inner Mongolia
Shaanxi
Ningxia Qinghai
Guizhou
Yunnan
Tibet
Xinjiang
Jiangsu
Tianjin
Taiwan
Anhui
Zhejiang
Shanghai
Sichuan Chongqing
Hainan
1500<Production
Production>5000
500<Production
50<Production
10 <Production
Unit: Thousand Metric Tons beet
China’s Main Beet Growing Areas
Source: China Statistics Yearbook

10
• Growth in planted acreage erratic, farmers switched to competing crops especially eucalyptus, which grows faster
and generate more income.
• Planted area plummeted after 2014/15 season, when the Chinese Government removed the state reserves
purchase program in 2013/14, removing one of the largest domestic offtaker.
• Agricultural investments growth slowed down in the recent years while rural farm-hands declined as urbanization
rate increases.
Issues that the Chinese sugar industry is facing…
Source: China National Bureau of Statistics, China Sugar Association
0.0
10.0
20.0
30.0
40.0
50.0
60.0
-2.0%
0.0%
2.0%
4.0%
6.0%
8.0%
10.0%
12.0%
2006 2007 2008 2009 2010 2011 2012 2013 2014
Agricultural Machinery Chemical Fertilizer Usage
Urban Population % (RHS)
Growth % declining
-20%
-15%
-10%
-5%
0%
5%
10%
800
1,000
1,200
1,400
1,600
1,800
2,000
2006
2007
2008
2009
2010
2011
2012
2013
2014
2015
2016
Thousands h
ecta
res
Cane Planted Area Beet Planted Area
% Growth (RHS)

11
• Plenty of room for improvement in terms of yields. Modernization of farming technology, educating farmers on
better farming techniques and further research and development will no doubt help farmers achieve better yield.
Comparison of Sugar Crop Yields
Source: LMC, F.o.Licht, Chinese National Bureau of Statistics
Average Cane Yield Comparison (Tonnes/Ha) Average Beet Yield Comparison (Tonnes/Ha)
0
10
20
30
40
50
60
70
USA China Ukraine Russia
0
10
20
30
40
50
60
70
80
90

12
Chinese Domestic Prices vs Imported Prices
Source: Bloomberg, GMSN
100
300
500
700
900
1100
1300
#11 USD/MT Physical Spot (Ex-Guangxi) USD/MT
Removal of State Reserves Sugar Purchase program

13
Brazil is now the top exporter of sugar to China
Source: China Customs
Top Import Origins for China in 1999/2000 Top Import Origins for China in 2014/15
China Sugar Imports, where do they come from now?
Source: China Customs
Thailand Cuba Australia Brazil
Guatemala Costa Rica Others
Brazil Thailand Cuba Guatamela
Australia S.Korea Others

LIAONING
JILIN
HEILONGJIANG
SHANDONG XIAXI
GANSU
GUANGDONG GUANGXI
HUNAN JIANGXI
ANWEI
HENAN
HUBEI
SHANXI
HEBEI
GUIZHOU
SICHUAN
CHIFENG 800 / day
50,000-80,000
FUXIN 800 / day 50,000- 60,000
JINZHOU 700 / day 200,000 / yr
YINGKOU 1000 / day 250,000-300,000 / yr
YINGKOU 2,000 / day 500,000 / yr
DALIAN 5,000 / day 300,000 / yr
LELING 1,600 / day 500,000 / yr
RIZHAO 1,500 / day 2,400,000 / yr
HUAI’AN 500-600 / day 150,000 / yr
ZHANGZHOU 600 / day 100,000-150,000 / yr
ZHANGZHOU 1,200 / day 300,000 /yr
DONGGUAN 2,000-2,200 / day 120,000 / yr
ZHANJIANG 2,000 / day 200,000-300,000 / yr
FANGCHENGGANG
1,000 / day 200,000 / yr
CHONGZUO 1,000 / day
190,000 / yr
TANGSHAN 1,500 / day
500,000 / yr
CITY (Refineries) Production (MT) per day Production (MT) per year
Legend
Refineries in China
BEIJING
TIANJIN
Port of calls
concentrated in NE
China (~14,000/mt/day)

15
How does China handle its imports?
Import Quotas
Out-of-Quota
imports have
higher tariffs
Crop Tender for
State reserves
Increase cane
purchase price
Consolidate the
sugar industry
• China allocates 1.945 million tonnes (tel quell) of in quota licenses to its importers. These
imports are subjected to 15% tariff. China also imports 400,000 annually from Cuba, as per
WTO agreement.
• For importers not being issued with the quota licenses, they can still import but will be subjected at 50%
tax tariff, which in general erodes most the margins compared to in quota imports.
• At current high prices, out of quota imports makes no sense as domestic prices are not high enough to
offset the tariff of 50%. Higher duty tariffs might be used to discourage imports
• Previously, this effectively brought down domestic prices, which made out of quota imports unprofitable.
This is also to discourage smuggling, which is detrimental to the entire Chinese sugar industry.
• Cane purchase price for Guangxi region increased from RMB 400/ton to RMB440/ton, so as to encourage
farmers to plant more cane.
• The Chinese Government recently asked 28 sugar companies in the biggest producing region, Guangxi, to
merge into 6 major groups. This is to strengthen the sector and ensure farmers get paid. The plan is to
complete the consolidation by 2020

16
Going forward, China will still have to import
Source: Rabobank Estimates CSA
China Balance Sheet (RV) 13/14 14/15 15/16 (e) 16/17 (f)
Opening Stocks 4,651 6,980 7,102 4,317
Production 14,476 11,474 9,200 10,050
Consumption 16,150 16,000 16,050 16,600
Import 4,054 4,700 4,100 4,200
Export 51 52 35 40
Closing Stocks 6,980 7,102 4,317 1,927
(2,000)
(1,500)
(1,000)
(500)
0
500
1,000
1,500
2,000
2,500
3,000
Jun-13 Sep-13 Dec-13 Mar-14 Jun-14 Sep-14 Dec-14 Mar-15 Jun-15 Sep-15 Dec-15 Mar-16 Jun-16
0
250
500
750
1,000
US/M
T
S/D (RHS) China Sugar Price (LHS)

17
What’s Next? Chinese Companies has been acquiring overseas assets
Source: Various State Media reports

18
2016/17 Asia production estimates El Nino is having a severe impact on production…
• Major countries experience a drop in
their sugar production, from the last peak
in 2012/13
• Number 2 sugar producer India is
expected to see a fall in production for
16/17 season due to droughts, thus
swinging into a net importer status
• Constrained production in Thailand will
not be able to help reduce the deficit gap
• Suppressed domestic Chinese prices is
not encouraging more sugar production
• Lack of innovation and farm inputs
combined with bad weather have caused
Vietnam to see a severe decline in
production
• Indonesia drive of self sufficiency is
laudable, but is still a net importer in the
near and mid term.
Source: LMC, Rabobank, 2016
1
3
9
1
0
CHINA
2.
4 2.
3 2.
2
PHILIPPINES
1
1 1
0
1
0
THAILAND
3 2 2
INDONESIA
1
. 1
.
1
.
VIETNAM
2
9
2
7
2
3
INDIA
12/13
15/16
16/17 (f)
*in Million Metric Tonnes
19
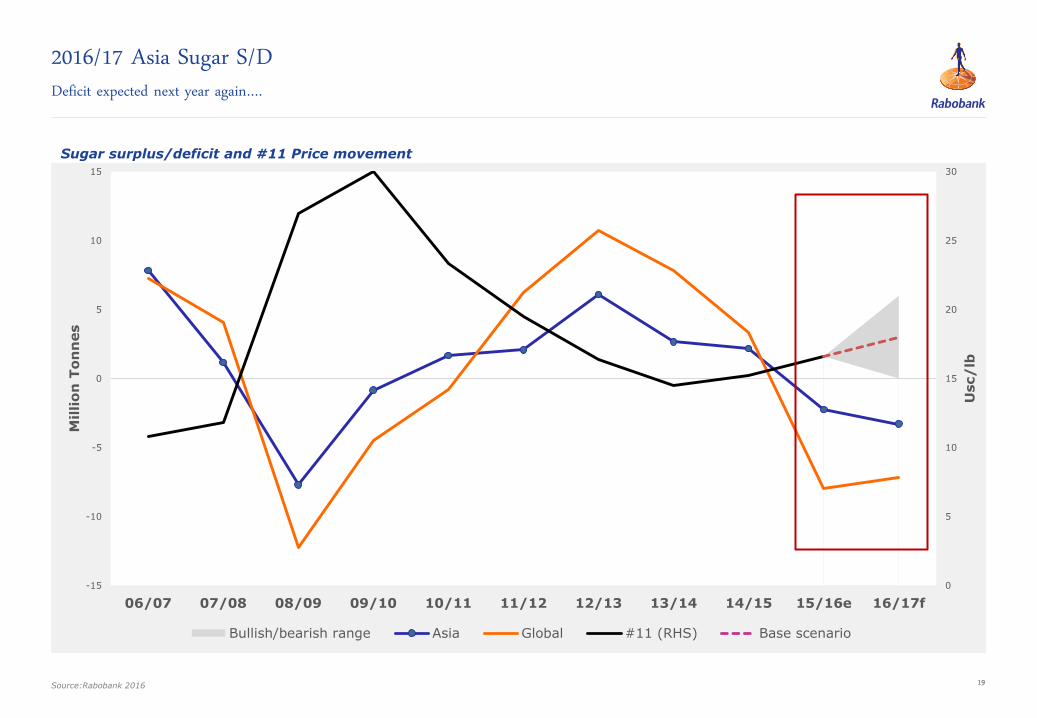
0
5
10
15
20
25
30
-15
-10
-5
0
5
10
15
06/07 07/08 08/09 09/10 10/11 11/12 12/13 13/14 14/15 15/16e 16/17f
Usc/
lb
Millio
n T
on
nes
Bullish/bearish range Asia Global #11 (RHS) Base scenario
2016/17 Asia Sugar S/D Deficit expected next year again….
Source:Rabobank 2016
Sugar surplus/deficit and #11 Price movement

20
Thank You!
The information contained in this presentation is based on sources which Rabobank considers reliable and which are regularly updated. However, Rabobank
assumes no liability or guarantee for the accuracy, completeness and current validity of the information. Opinions or recommendations reflect the views of the
relevant author and do not necessarily represent the opinion of Rabobank or its associated companies. They may be amended at any time without prior notice.
The information should not be understood as an offer or recommendation for any and/or certain investment products. This applies even in the event of
individual issuers or securities being mentioned. Such information cannot serve as a substitute for objective advice based on the individual situation of the
investor. The information contained in this presentation must not be amended, reproduced or communicated to third parties in any way without the prior
express permission of Rabobank.
Rabobank Singapore
38 Beach Road, #31-11
South Beach Tower
Singapore 189767
Telephone: (65) 6536 3363
Rabobank International Kelvin Chow Senior Commodities Analyst Food & Agribusiness Research & Advisory
Telephone +65 6230 6748 E-mail [email protected]