THE CHILEAN SULFURIC ACID MARKET …...Chilean Copper Commission – Research and Policy Planning...
29
Chilean Copper Commission Research and Policy Planning Department THE CHILEAN SULFURIC ACID MARKET Estimations Through 2020 (Revised to June 2011) DE/05/2011 Intellectual Property Registration No. 206666
Transcript of THE CHILEAN SULFURIC ACID MARKET …...Chilean Copper Commission – Research and Policy Planning...

Chilean Copper Commission
Research and Policy Planning Department
THE CHILEAN SULFURIC ACID MARKET
Estimations Through 2020
(Revised to June 2011)
DE/05/2011
Intellectual Property Registration No. 206666

Contents
Executive Summary ....................................................................................... 1
I. Introduction ............................................................................................. 4
1.1 Purpose and Contents..............................................................................4
1.2 Methodology ...........................................................................................5
II. The Chilean Sulfuric Acid Market ............................................................ 7
2.1 Behavior in 2001-2010 ............................................................................7
2.2 Leading Sulfuric Acid Producers and Consumers.........................................8
2.3 Production and Consumption in 2010 ......................................................10
2.4 The Sulfuric Acid Trade (2001-2010).......................................................11
2.5 Relevant World Prices ............................................................................20
III. Sulfuric Acid Balance Estimations (2011-2020) ................................... 21
3.1 Domestic Balance..................................................................................21
3.2 Regional Balance...................................................................................21
IV. The Chilean Sulfuric Acid Market: Estimations Through 2020.............. 23
4.1 Sulfuric Acid Consumption......................................................................23
4.2 Sulfuric Acid Production .........................................................................24
4.3 Chile’s Structural Sulfuric Acid Deficit......................................................25
4.4 Domestic Market Asymmetry..................................................................25
4.5 Dependence on Imports.........................................................................26

Chilean Copper Commission – Research and Policy Planning Department The Chilean Sulfuric Acid Market - Estimations Through 2020 (Revised to June 2011)
Traducido por Patricio Mason, M.A. / Translated by Patricio Mason, M.A.
1
Executive Summary
Sulfuric acid’s key role in hydrometallurgy has turned Chile’s thriving copper mining industry into the world’s most intensive user outside of the phosphate fertilizer industry.
In an exceptionally virtuous circle, copper hydrometallurgy is a natural user of the acid resulting from sulfuric gas abatement at Chilean copper smelters.
The rise of copper hydrometallurgy since the eighties –it boasted a 66.3 percent market share in 2010- has turned Chile into the world’s premier producer of SX-EW copper. Sulfuric acid use has closely tracked this development.
The Chilean Copper Commission closely tracks the domestic market for this strategic copper mining industry input. This report uses data supplied by leading producers and consumers to estimate market prospects through the year 2020.
Below is a summary of sulfuric acid market attributes and the conclusions drawn from estimates of market behavior through the year 2020.
1) The Chilean Sulfuric Acid Market
• Copper accounts for 96 percent of total sulfuric acid consumption, a total of 7.93 million tons in 2010. The balance is used by the industrial minerals, wood pulp, and chemical industries.
• Consumption is heaviest in northern Chile, notably Antofagasta with 72.6 percent, and Arica, Tarapacá, and Atacama with 21.7 percent. The balance is used south of Coquimbo.
• While most local consumers source their needs in the open market, some produce their own supplies. In 2010, 5.68 million tons were bought from third parties and 2.25 million were produced in-house.
• Sulfuric acid consumption rates in the copper mining industry are a key factor. These range from 1 to 12 tons per ton of SX-EW copper and have a direct impact on production costs. As leachable ore grades decline, average consumption has grown from 2.86 tons acid/ton of SX-EW copper in 2004 to 3.65 tons in 2010.
• Smelters accounted for 96 percent of the 5.13 million tons produced in 2010, with the balance coming from sulfur burners and molybdenum plants. Sulfur burners recently installed by Noracid and Cemin should increase these companies’ share in short order.
• While plants in northern Chile account for 60.8 percent of total sulfuric acid production -including Antofagasta with 42.3 percent- they are unable to meet local demand. The balance is produced in central Chile, requiring over 1.8 million tons a year to be shipped north, often by ocean freight. These asymmetries pose significant logistical problems.

Chilean Copper Commission – Research and Policy Planning Department The Chilean Sulfuric Acid Market - Estimations Through 2020 (Revised to June 2011)
Traducido por Patricio Mason, M.A. / Translated by Patricio Mason, M.A.
2
• In 2010, sulfuric acid producers destined 44 percent of their output to their own operations. The balance was sold in the open market, including a small quantity sold abroad.
• Inability to meet domestic demand has led to a structural deficit that must be offset by imports.
• Imports have risen from 500,000 to 600,000 tons in 2006 to 2.64 million tons in 2010. Peru (749,000 tons in 2010) has been a leading supplier since 2007. Other large suppliers include Japan, South Korea, and the Philippines.
• Mejillones, north of Antofagasta, is the main port of entry for sulfuric acid imports. Incoming supplies are shipped inland by train, truck, and intermodal transportation.
• As such, the Mejillones price is a domestic market yardstick for sulfuric acid pricing. Import prices reflect world prices, albeit with some lagtime.
• Sulfuric acid prices are determined by sulfur prices, in turn determined by the price of phosphate fertilizers, their main market. The phosphate market has rebounded as demand for foodstuffs and biofuels has increased following the crisis of late 2008. As phosphate prices have increased, so have the price of sulfur and sulfuric acid, most of which is produced involuntarily.
2) Chilean Market Prospects Through 2020
Based on acid producer and consumer data, the Chilean market should remain mostly unchanged. Market balance under various scenarios is shown below.1
Domestic Sulfuric Acid Balance, 2011-2020 (kMT)
Short Term Medium Term Long Term
Description 2011 2012 2013 2014 2015 2016 2017 2018 2019 2020
Baseline Production (1) 5,945 6,030 6,336 6,589 6,583 6,699 6,648 6,679 6,584 6,623
Potential Production (2) 0 0 70 140 170 170 170 170 170 170
Max. Production (3) 5,945 6,030 6,406 6,729 6,753 6,869 6,818 6,849 6,754 6,793
Baseline Consumption (4) 8,507 8,605 8,766 8,648 8,152 7,502 6,846 6,357 6,084 5,752
Potential Consumption (5) 0 150 372 1,158 1,576 1,748 1,958 2,138 2,168 1,988
Max. Consumption (6) 8,507 8,755 9,138 9,806 9,728 9,250 8,804 8,495 8,252 7,740
Balance Under Each Scenario
Baseline (1-4) (2,561) (2,576) (2,429) (2,059) (1,569) (803) (198) 322 500 871
Max. Production (3-4) (2,561) (2,576) (2,359) (1,919) (1,399) (633) (28) 492 670 1,041
Max. Consumption (1-6) (2,561) (2,726) (2,801) (3,217) (3,145) (2,551) (2,156) (1,816) (1,668) (1,117)
Potential (3-6) (2,561) (2,726) (2,731) (3,077) (2,975) (2,381) (1,986) (1,646) (1,498) (947)
1 Baseline: Operating + under construction. Maximum Production: Baseline + under review. Maximum Consumption: Baseline + under review. Potential: Baseline + production and consumption under review.

Chilean Copper Commission – Research and Policy Planning Department The Chilean Sulfuric Acid Market - Estimations Through 2020 (Revised to June 2011)
Traducido por Patricio Mason, M.A. / Translated by Patricio Mason, M.A.
3
Source: Chilean Copper Commission, based on producer and consumer company reports to May 2011.
Conclusions
• The most likely scenario is the Potential case, with an expected annual shortfall of 2.5 to 3 million tons through the middle of the decade, then easing to about 1 million tons by the end of the decade. Market asymmetries will mean shortfalls in northern Chile and surpluses in central Chile.
• Short-term consumption (through 2013) remains strong as SX-EW copper production remains above 2 million tons. Increased acid production is expected as the Mejillones sulfur burner starts to operate at capacity.
• Medium-term consumption (2014-2016) could rise to as high as 9.8 million tons as new leaching projects come on stream. Increased consumption is caused by higher unit consumption rates at both existing and new projects, keeping the market tight without increasing cathode production.
• Shortfalls in this period should be partly offset as a new concentrate roaster at the Ministro Hales Mine comes on stream.
• While the long-term (2017-2020) baseline case predicts a surplus by 2018, this is somewhat unlikely, as it makes no provision for a project portfolio requiring over 2 million tons of acid a year by the end of the decade. After allowing for the natural decline in existing operations, the shortfall by the end of the decade is still expected to stand at about one million tons.
• Albeit to a lesser degree, Chile is still expected to continue depending on imports.
Cochilco gratefully acknowledges leading sulfuric acid producers and consumers for the data supplied for this report.

Chilean Copper Commission – Research and Policy Planning Department The Chilean Sulfuric Acid Market - Estimations Through 2020 (Revised to June 2011)
Traducido por Patricio Mason, M.A. / Translated by Patricio Mason, M.A.
4
I. Introduction
1.1 Purpose and Contents
Sulfuric acid is a strategic input for the Chilean copper mining industry.
Copper smelter sulfur emissions must be abated for environmental reasons. Producing one ton of refined copper yields nearly 3 tons of sulfuric acid.
Copper hydrometallurgy produces SX-EW copper by leaching oxidized ores and secondary sulfide ores, using on average slightly over 3 tons of sulfuric acid per ton of copper cathodes obtained.
This production-consumption correlation results in a financially and environmentally virtuous cycle.
Strong demand for sulfuric acid creates significant value for a smelter byproduct and gives rise to a vigorous acid import and logistics market.
New facilities producing sulfuric acid from sulfur are being set up to serve the copper mining industry.
This review of the Chilean sulfuric acid market is a standing component of the Cochilco Research Department’s line of work. Its intent is to regularly report on markets of relevance to sustainable mining development in Chile.
This report reviews the Chilean sulfuric acid market through the year 2020, with special emphasis on events and trends that might emerge by the end of the decade.
Section I contains methodological notes.
Section II provides an overview of the Chilean sulfuric acid market, including key producers and consumers, historical industry data for 2001-2010, and relevant developments through 2010.
Section III estimates acid production and consumption and national and regional market balances through 2020, based on data provided by leading miners.
Section IV concludes with a review of projections, including the expected behavior of key sulfuric acid producers and consumers and the consequences thereof.
In addition to meeting the information needs of the public in general, the information in this report should prove relevant to sulfuric acid producers, consumers, traders, logistics service providers, and regulators.

Chilean Copper Commission – Research and Policy Planning Department The Chilean Sulfuric Acid Market - Estimations Through 2020 (Revised to June 2011)
Traducido por Patricio Mason, M.A. / Translated by Patricio Mason, M.A.
5
1.2 Methodology
1.2.1 Scope
This report reviews sulfuric acid production, consumption, and trade in Chile.
Leading producers and consumers were asked to estimate their production and consumption profiles from 2011 through 2020. Their responses were received and tabulated in early 2011.
While the sulfuric acid balance presented here does not include supplies from foreign competitors such as Peru, some details about this market are provided as part of a review of domestic market prospects.
As the rather broad timeframe used makes it hard for respondents to accurately predict production and consumption profiles, distant projections remain tentative.
Data on acid imports and exports was culled from public sources and Customs data.
1.2.2 Scenarios by Degree of Certainty
Scenarios reviewed are based on the degree of certainty assigned to available data. Projects under construction are considered highly certain. Projects under consideration are also shown, even if construction has not yet been approved. Potential projects, which may materialize partially or never, are less certain.
These scenarios are as follows:
a) Baseline: A balance for the period based on annual production and consumption profiles from operations either existing or under construction. This scenario underpins our projection, since the profiles involved depend only on the performance of activities now underway. Additional, yet less certain scenarios are built upon this foundation.
b) Maximum Production: An intermediate scenario based on factoring in sulfur roasting plants under consideration but not yet approved. The balance for each year is calculated based on maximum production and basic consumption profiles. This yields an estimate of available market room under the most adverse conditions, with demand only from existing operations.
c) Maximum Consumption: An additional intermediate scenario based on factoring in mining projects under consideration but not yet approved. The balance for each year is calculated based on maximum consumption and basic production profiles. As potential consumption profiles are highly likely to materialize, this scenario yields an estimate of the domestic acid situation under adverse conditions, with supply only from existing plants.

Chilean Copper Commission – Research and Policy Planning Department The Chilean Sulfuric Acid Market - Estimations Through 2020 (Revised to June 2011)
Traducido por Patricio Mason, M.A. / Translated by Patricio Mason, M.A.
6
d) Potential: An additional scenario based on factoring in potential production and consumption profiles from projects under consideration by mining industry acid producers and consumers. While potential profiles are less likely to materialize, this scenario provides insights into the overall sulfuric acid production and consumption potential in 2011-2020 and helps determine the likelihood of the Chilean acid market moving from shortage to surplus.
1.2.3 Timeframe
The period under review has been segmented into three parts, based on expected market behavior:
a) Short-Term (2011-2013): As it reflects existing operations, this is the most certain segment.
b) Medium-Term (2014-2016): By factoring in potential consumer and some production projects, this segment helps shed light on their impact but adds uncertainty to projections.
c) Long-Term (2017-2020): While projections for this segment are less reliable, they provide insights into the impact of both leaching operation decline and startup of new projects that might relieve the domestic shortage.
Chilean Copper Commission – Research and Policy Planning Department The Chilean Sulfuric Acid Market - Estimations Through 2020 (Revised to June 2011)
Traducido por Patricio Mason, M.A. / Translated by Patricio Mason, M.A.
7
II. The Chilean Sulfuric Acid Market
This section summarizes sulfuric acid market behavior over the past 10 years.
2.1 Behavior in 2001-2010
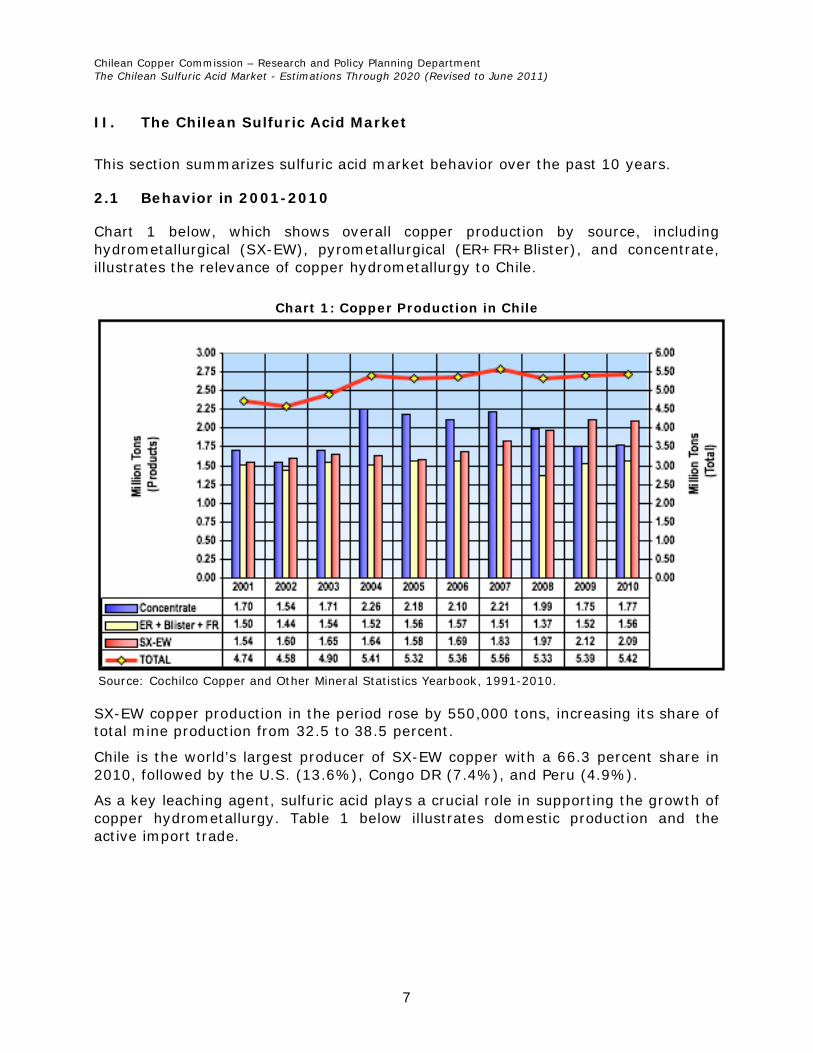
Chart 1 below, which shows overall copper production by source, including hydrometallurgical (SX-EW), pyrometallurgical (ER+FR+Blister), and concentrate, illustrates the relevance of copper hydrometallurgy to Chile.
Chart 1: Copper Production in Chile
Source: Cochilco Copper and Other Mineral Statistics Yearbook, 1991-2010.
SX-EW copper production in the period rose by 550,000 tons, increasing its share of total mine production from 32.5 to 38.5 percent.
Chile is the world’s largest producer of SX-EW copper with a 66.3 percent share in 2010, followed by the U.S. (13.6%), Congo DR (7.4%), and Peru (4.9%).
As a key leaching agent, sulfuric acid plays a crucial role in supporting the growth of copper hydrometallurgy. Table 1 below illustrates domestic production and the active import trade.
Chilean Copper Commission – Research and Policy Planning Department The Chilean Sulfuric Acid Market - Estimations Through 2020 (Revised to June 2011)
Traducido por Patricio Mason, M.A. / Translated by Patricio Mason, M.A.
8
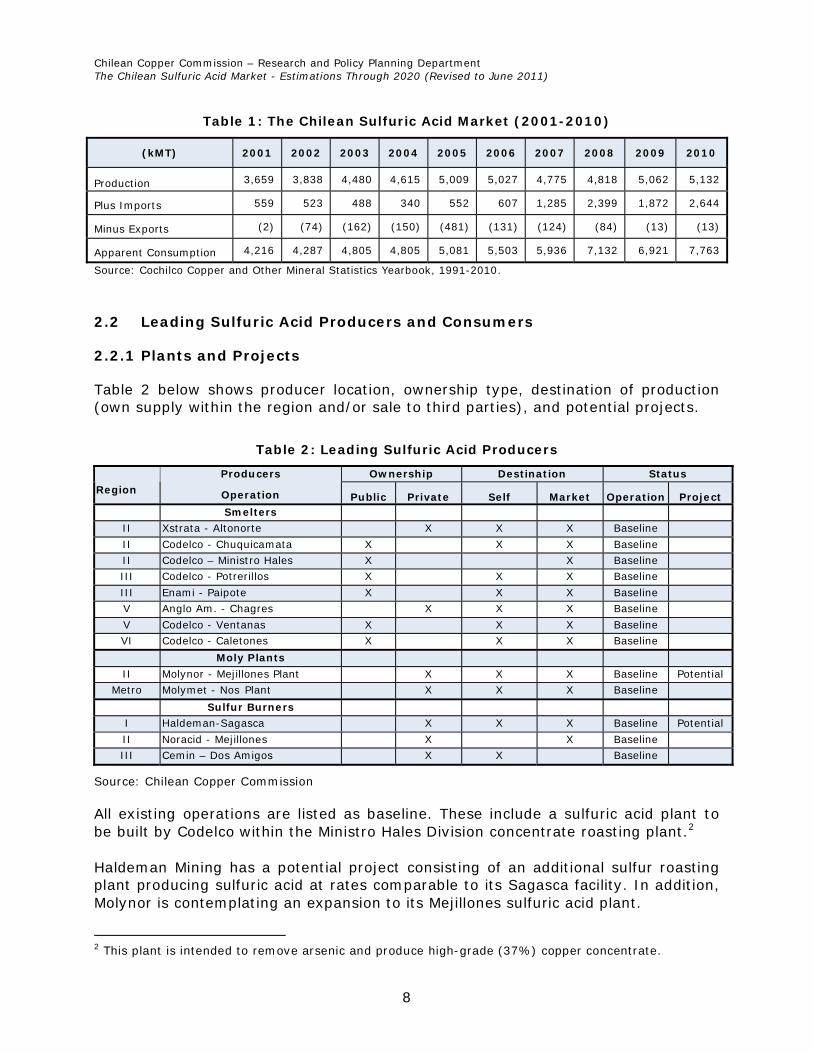
Table 1: The Chilean Sulfuric Acid Market (2001-2010)
(kMT) 2001 2002 2003 2004 2005 2006 2007 2008 2009 2010
Production 3,659 3,838 4,480 4,615 5,009 5,027 4,775 4,818 5,062 5,132
Plus Imports 559 523 488 340 552 607 1,285 2,399 1,872 2,644
Minus Exports (2) (74) (162) (150) (481) (131) (124) (84) (13) (13)
Apparent Consumption 4,216 4,287 4,805 4,805 5,081 5,503 5,936 7,132 6,921 7,763
Source: Cochilco Copper and Other Mineral Statistics Yearbook, 1991-2010.
2.2 Leading Sulfuric Acid Producers and Consumers
2.2.1 Plants and Projects
Table 2 below shows producer location, ownership type, destination of production (own supply within the region and/or sale to third parties), and potential projects.
Table 2: Leading Sulfuric Acid Producers
Ownership Destination Status
Region
Producers
Operation Public Private Self Market Operation Project
Smelters
II Xstrata - Altonorte X X X Baseline
II Codelco - Chuquicamata X X X Baseline
II Codelco – Ministro Hales X X Baseline
III Codelco - Potrerillos X X X Baseline
III Enami - Paipote X X X Baseline
V Anglo Am. - Chagres X X X Baseline
V Codelco - Ventanas X X X Baseline
VI Codelco - Caletones X X X Baseline
Moly Plants
II Molynor - Mejillones Plant X X X Baseline Potential
Metro Molymet - Nos Plant X X X Baseline
Sulfur Burners
I Haldeman-Sagasca X X X Baseline Potential
II Noracid - Mejillones X X Baseline
III Cemin – Dos Amigos X X Baseline
Source: Chilean Copper Commission
All existing operations are listed as baseline. These include a sulfuric acid plant to be built by Codelco within the Ministro Hales Division concentrate roasting plant.2 Haldeman Mining has a potential project consisting of an additional sulfur roasting plant producing sulfuric acid at rates comparable to its Sagasca facility. In addition, Molynor is contemplating an expansion to its Mejillones sulfuric acid plant.
2 This plant is intended to remove arsenic and produce high-grade (37%) copper concentrate.

Chilean Copper Commission – Research and Policy Planning Department The Chilean Sulfuric Acid Market - Estimations Through 2020 (Revised to June 2011)
Traducido por Patricio Mason, M.A. / Translated by Patricio Mason, M.A.
9
2.2.2 Leading Consumer Projects and Operations
Table 3: Leading Sulfuric Acid Consumers
Ownership Source Status Region
Consumer
Public Private Self External Baseline Potential
Self
I Haldeman - Sagasca X X X
II Codelco - Chuquicamata X X X X
II Codelco - Radomiro Tomic X X X
II Xstrata - Lomas Bayas X X X
III Codelco - Salvador X X X X
Several Enami - Plants X X X
III Cemin – Dos Amigos X X X
V Cemin – Amalia Catemu X X X
V Anglo Am. - El Soldado X X X
Met Anglo Am. - Los Bronces X X X
VI Codelco - El Teniente X X X
External
XV Quiborax3 X X X
I BHP - Cerro Colorado X X X
I Collahuasi X X X X
I Teck- Quebrada Blanca X X X
II Codelco - Gaby X X X X
II Freeport- El Abra X X X
II Antofagasta Mins.- El Tesoro X X X
II Antofagasta Mins.- Michilla X X X
II Antofagasta Mins.- Antucoya X X X
II BHP - Escondida X X X
II Milpo - Iván X X X
II Cerro Dominador X X X
II Anglo Am. - Mantos Blancos X X X X
II Sierra Miranda X X X
II Mantos de la Luna X X X
II BHP- Spence X X X
II Barrick - Zaldívar X X X
II Las Cenizas - Taltal X X X
III Can-Can - Diego de Almagro X X X
III Centenario- Franke X X X
III Punta del Cobre X X X X
III Anglo Am. - Manto Verde X X X
III P.P. Copper - Caserones X X X
IV Teck - Carmen de Andacollo X X X
IV Vale – Tres Valles X X X
Met Chemical industry X X X
South Wood pulp plants X X X
Source: Chilean Copper Commission
3 Boric acid producer in Arica-Parinacota.

Chilean Copper Commission – Research and Policy Planning Department The Chilean Sulfuric Acid Market - Estimations Through 2020 (Revised to June 2011)
Traducido por Patricio Mason, M.A. / Translated by Patricio Mason, M.A.
10
Table 3 above shows consumer location, ownership type and acid origin (own or third-party). Existing operations and planned leaching projects and/or expansions with a consumption potential of 30,000 tons a year and up are given baseline status. Smaller mining and industrial consumers are also shown. Potential cases include projects in the preliminary stage and therefore less certain to materialize before the end of the decade under review.
2.3 Production and Consumption in 2010
2.3.1 Regional Distribution Regional distribution of acid production and consumption in 2010 is shown below.
Table 4: Distribution of Sulfuric Acid Production and Consumption in 2010 (kMT)
Production Consumption4 (Shortfall)
Surplus
Country Total 5,132 % 7,933 % (2.801)
Region
Arica + Tarapacá Antofagasta Atacama Coquimbo Valparaíso Metropolitan O’Higgins Other
107 2,172
843 0
821 49
1,140 0
2.1 42.3 16.4 0.0
16.0 1.0
22.2 0.0
796 5,763
924 68
113 119 40
110
10.0 72.6 11.7 0.9 1.4 1.5 0.5 1.4
(689) (3.591)
(81) (68) 708 (70)
1.100 (110)
Supply Type
Self Commercial
2,256 2,876
44.0 56.0
2,256 5,677
28.4 71.6
0 (2.801)
Ownership
Public Private
3,574 1,558
69.6 30.4
2,068 5,865
27.6 72.4
1.506 (4.307)
Source: Chilean Copper Commission, with company data.
2.3.2 Production/Consumption Ratios
Sulfuric acid production in 2010 stood at 5.13 million tons. Only 210,000 tons came from sources other than copper smelters.5
Consumption in 2010 stood at 7.93 million tons. Some 7.64 million were used by copper mining operations to produce 2.09 million tons of SX-EW copper, an average consumption rate of 3.65 tons of acid per ton of copper.6
4 Estimates based on consumer company reports. May not match apparent consumption in Table 1 due to inventory changes and bias in data reported. 5 Copper smelters produce nearly 1 ton of acid per ton of concentrate treated. This equals 2.9-3 tons of acid per ton of refined copper, depending on concentrate type and rate of sulfur gas abatement. 6 As leachable ore quality varies greatly, mining operation consumption rates range from 1 to 12.

Chilean Copper Commission – Research and Policy Planning Department The Chilean Sulfuric Acid Market - Estimations Through 2020 (Revised to June 2011)
Traducido por Patricio Mason, M.A. / Translated by Patricio Mason, M.A.
11
Chart 2 below shows consumption rates by leading operators in ascending order. Segmenting total production by quintiles7 (418,000 tons copper in 2010 ea.) shows significant differences, notably a fifth quintile consisting of low-production, high-consumption operations.
Chart 2: SX-EW Copper Production by Rate of Sulfuric Acid Consumption (2010)
Source: Chilean Copper Commission
Rising acid consumption rates (3.65 tons in 2010 but 2.86 tons in 2004, 3.24 in 2006, and 3.45 in 2008) confirms a growing decline in leachable ore quality.
2.4 The Sulfuric Acid Trade (2001-2010)
2.4.1 Imports
Strong demand from the copper industry has made Chile a leading sulfuric acid buyer. As Mejillones in Antofagasta is the port of entry for most sulfuric acid imports, the CIF Mejillones price acts as a yardstick for domestic pricing.
Chart 3 below shows average sulfuric acid import prices and quarterly highs and lows since 2001.
7 Portion of a frequency distribution containing one fifth of total sample.

Chilean Copper Commission – Research and Policy Planning Department The Chilean Sulfuric Acid Market - Estimations Through 2020 (Revised to June 2011)
Traducido por Patricio Mason, M.A. / Translated by Patricio Mason, M.A.
12
Chart 3: Sulfuric Acid Import Prices, CIF Mejillones (US$/Ton) (Q1 2001-Q1 2011)
Source: Chilean Copper Commission, with Customs data.
Imports in Q1 2011 stood at 746,700 tons and were worth US$73.5 million. CIF prices averaged US$98.5/ton and ranged from US$20 to US$250/ton. Table 5 below provides additional details.

Chilean Copper Commission – Research and Policy Planning Department The Chilean Sulfuric Acid Market - Estimations Through 2020 (Revised to June 2011)
Traducido por Patricio Mason, M.A. / Translated by Patricio Mason, M.A.
13
Table 5: Sulfuric Acid Imports (Jan. 2001 – Dec. 2010)
Period Tons US$‘000 CIF8 US$/Ton Avg. US$/Ton
Q1 Q2 Q3 Q4
Total 2001
170,962 178,109 149,320 60,070
558,461
4,518,1 4,883,0 3,815,2 1,651,5
14,867,8
26.4 27.4 25.6 27.5 26.6
20.0 - 35.0 21.0 - 42.2 20.5 - 33.2 20.5 - 35.0
20.0 - 42.2
Q1 Q2 Q3 Q4
Total 2002
178,506 155,300 102,348 86,361
522,515
5,459,5 4,354,5 2,962,3 3,130,9
15,907,3
30.6 28.0 28.9 36.3 30.4
25.0 - 36.8 23.5 - 38.9 26.5 - 39.8 26.4 - 55.3
23.5 - 55.3
Q1 Q2 Q3 Q4
Total 2003
158,962 114,743 107,403 106,713
487,821
6,219,2 3,533,8 3,446,4 3,647,1
16,846,5
39.1 30.8 32.1 34.2 34.5
28.0 - 50.1 15.0 - 40.1 15.0 - 40.5 22.4 - 52.6
15.0 - 52.6
Q1 Q2 Q3 Q4
Total 2004
80,941 76,185 83,154 99,946
340,226
3,154,0 3,202,1 3,362,5 5,648,8
15,367,4
39.0 42.0 40.4 56.5 45.2
20.0 - 52.6 32.2 - 74.7 22.1 - 72.0 22.1 - 78.0
20.0 - 78.0
Q1 Q2 Q3 Q4
Total 2005
179,828 150,573 75,313
146,693 552,407
10,109,9 9,529,5 3,483,9 8,146,9
31,270,2
56.2 63.3 46.3 55.5 56.6
22.1 - 81.0 22.5 - 104.7 22.5 - 74.5 22.5 - 78.2
22.1 - 104.7
Q1 Q2 Q3 Q4
Total 2006
174,993 120,398 135,986 175,491
606,868
10,045,9 7,278,4 7,143,7
10,165,9 34,633,9
57.4 60.5 52.5 57.9 57.1
23.0 - 78.2 23.0 - 83.2 23.0 - 88.2 26.7 - 98.5
23.0 - 98.5
Q1 Q2 Q3 Q4
Total 2007
265,259 300,983 358,409 360,437
1,285,088
20,349,8 17,848,2 24,194,6 31,081,7
93,474,2
76.7 59.3 67.5 86.2 72.7
24.0 - 105.0 25.3 - 122.0 39.0 - 162.6 31.0 - 215.0
24.0 - 215.0
Q1 Q2 Q3 Q4
Total 2008
626,324 556,877 664,851 550,406
2,398,457
109,827,7 86,176,6
160,095,0 94,896,8
450,996,1
175.4 154.7 240.8 172.4 188.0
44.0 - 324.4 38.0 - 367.7 38.0 - 480.0 38.0 - 480.0
38.0 - 480.0
Q1 Q2 Q3 Q4
Total 2009
477,106 434,495 464,509 496,215
1,872,325
65,973,6 44,872,1 48,271,4 54,646,5
213,763,6
138.3 103.3 103.9 110.1 114.2
35.0 – 400.0 15.9 – 320.0 10.0 – 250.0 12.0 – 400.0
10.0 – 400.0
Q1 Q2 Q3 Q4
Total 2010
667,780 707,280 604,249 664,366
2,643,674
62,104,2 54,549,6 40,909,5 45,112,0
202,675,3
93.0 77.1 67.7 67.9 76.7
3.0 – 400.0 3.0 – 250.0
20.0 – 150.0 20.0 – 157.0 3.0 – 400.0
Source: Chilean Copper Commission, with Customs data.
8 Unit price is CIF for most imports except for Codelco, which uses a C+F variant that excludes insurance. Does not include sulfuric acid imports for use by laboratories and the explosives industry.

Chilean Copper Commission – Research and Policy Planning Department The Chilean Sulfuric Acid Market - Estimations Through 2020 (Revised to June 2011)
Traducido por Patricio Mason, M.A. / Translated by Patricio Mason, M.A.
14
Shown below is annual import data by country of origin, including amounts, global price, average unit price for each year, and the freight and insurance portions of the price. Tables 6.1 and 6.2 show figures for 2001-2006 and 2007-2010, respectively.
Table 6.1: Sulfuric Acid Imports by Country of Origin (2001-2006)
Country of Origin / Year
Amount (Tons)
CIF Price (US$‘000)
Average Price (US$/Ton CIF)
F + I (US$/Ton)
Japan Peru
Germany Australia
U.S. Mexico Korea
Philippines Canada
Total 2001
181,722 168,191 60,912 52,470 36,644 32,911 14,054 11,444
113 558,461
4,209,3 4,664,6 1,654,1 1,479,1 1,152,2 1,056,0
371,7 277,9
2,9 14,867,8
23.2 27.7 27.2 28.2 31.4 32.0 26.4 24.3 25.5 26.6
13.8 13.8 19.1 20.0 20.6 24.4 13.2 12.2 22.0
Japan Peru
Mexico Sweden
Philippines Canada
Switzerland Total 2002
220,034 108,981 82,238 74,488 18,207 10,183 8,383
522,514
5,950,6 3,621,2 3,074,5 2,112,7
582,6 271,9 293,8
15,907,3
27.0 33.1 37.4 28.4 32.0 26.7 35.0 30.2
10.5 13.8 26.6 27.9 25.8 20.0 27.5
Japan Peru
Sweden Korea
Australia Spain Algeria
Total 2003
191,846 105,717 96,899 49,487 25,190 12,637 6,045
487,821
6,846,4 3,248,6 2,763,5 2,461,7
933,7 353,8 238,8
16,846,5
35.7 30.7 28.5 49.7 37.1 28.0 39.5 34.5
3.4 14.2 24.9 30.1 30.1 26.0 12.5
Japan Peru
Sweden South Korea Philippines
Mexico Total 2004
122,618 97,631 78,819 21,988 16,000 3,170
340,226
4,413,5 3,605,6 4,328,7 1,583,1 1,201,5
235,0 15,367,4
36.0 36.9 54.9 72.0 75.1 74.1 45.2
4.4 14.2 37.5 43.5 50.1 37.1
Japan Mexico Peru
South Korea Sweden Bulgaria
Philippines Total 2005
161,270 150,880 107,412 68,504 41,935 19,024 3,382
552,407
5,617,2 11,071,9 4,362,2 5,181,7 3,018,4 1,764,8
254,0 31,270,2
34.8 73.4 40.6 75.6 72.0 92.8 75.1 56.6
1.7 42.2 15.8 45.4 53.3 66.2 50.1
Mexico Japan
South Korea Peru
Germany Finland Sweden Canada Bulgaria
Total 2006
184,012 102,105 96,389 89,615 49,741 31,648 30,697 16,155 6,506
606,868
12,485,3 4,592,9 6,290,9 3,831,0 2,801,4 1,507,9 1,627,0
856,6 640,9
34,633,9
67.9 45.0 65.3 42.7 56.3 47.6 53.0 53.0 98.5 57.1
40.3 2.2
44.6 16.8 48.2 38.3 52.7 52.0 64.2
Source: Chilean Copper Commission, with Customs data.

Chilean Copper Commission – Research and Policy Planning Department The Chilean Sulfuric Acid Market - Estimations Through 2020 (Revised to June 2011)
Traducido por Patricio Mason, M.A. / Translated by Patricio Mason, M.A.
15
Table 6.2: Sulfuric Acid Imports by Country of Origin (2007-2010)
Country of Origin / Year
Amount (Tons)
CIF Price (US$‘000)
Average Price (US$/Ton CIF)
F + I (US$/Ton)
Peru Japan
South Korea Philippines
Mexico Germany Bulgaria Poland Spain
Sweden U.S.
Total 2007
499,280 286,694 223,178 71,464 51,405 45,305 37,881 20,028 18,352 17,075 14,425
1,285,087
25,812,8 19,243,0 23,025,6 8,764,0 2,683,8 3,240,3 4,076,9 1,622,3 1,892,9 1,699,0 1,413,6
93,474,2
51.7 67.1
103.2 122.6 52.2 71.5
107.6 81.0
103.1 99.5 98.0 72.7
13.0 41.2 70.0 61.8 19.8 11.0 73.3 56.9 64.3 70.2 48.1
Peru South Korea
Japan India China
Philippines Spain Mexico
Indonesia Canada Sweden Bulgaria Poland Egypt
Total 2008
683,504 391,376 370,320 335,895 210,482 203,570 51,336 48,877 22,517 21,079 18,673 18,460 13,637 8,732
2,398,458
54,629,0 73,994,2 62,646,7 91,712,7 58,146,1 55,807,9 10,396,7 16,626,9 8,353,1 4,979,5 2,357,9 4,270,2 3,276,7 3,798,4
450,996,0
79.9 189.1 169.2 273.0 276.3 274.1 202.5 340.2 371.0 236.2 126.3 231.3 240.3 435.0 188.0
13.4 84.7 77.2
103.1 90.4 97.0 80.5 50.4
111.7 109.7 77.2 85.4 95.3
140.6
Peru Japan
Philippines South Korea
Spain Germany Mexico Brazil
Australia Bulgaria Poland Finland Italy India
Total 2009
635,796 335,189 203,202 189,645 143,286 121,150 51,334 47,333 38,910 36,530 34,006 15,407 10,600 9,937
1,872,325
53,502,5 48,687,6 30,030,8 32,568,8 16,692,1 11,815,9 3,991,7
906,3 684,6
6,717,9 4,635,6
585,5 1,583,0 1,361,3
213,763,6
84.2 145.3 147.8 171.7 116.5 97.5 77.8 19.1 17.6
183.9 136.3 38.0
149.3 137.0 114.2
14.6 69.9 67.8 62.7 52.4 59.0 41.2 15.0 14.2 63.2 71.5 36.1 82.5 91.0
---
Peru Japan
South Korea Philippines
China Spain India
Germany Bulgaria Finland
Australia Canada
Italy Total 2010
749,158 675,451 669,413 153,599 111,733 98,782 59,505 37,014 31,575 19,723 18,855 15,855 3,008
2,643,675
48,690,3 56,476,0 44,184,1 11,760,0 11,325,4 12,522,3 6,422,5 1,892,0 5,234,1
100,3 566,2
2,298,9 1,203,1
202,675,3
65.0 83.6 66.0 76.6
101.4 126.8 107.9 51.1
165.8 5.1
30.0 145.0 400.0 76.7
13.8 42.6 45.2 51.5 46.8 45.2 67.3 50.1 61.1 2.3
25.0 77.9 74.6
---
Source: Chilean Copper Commission, with Customs data.
Chilean Copper Commission – Research and Policy Planning Department The Chilean Sulfuric Acid Market - Estimations Through 2020 (Revised to June 2011)
Traducido por Patricio Mason, M.A. / Translated by Patricio Mason, M.A.
16
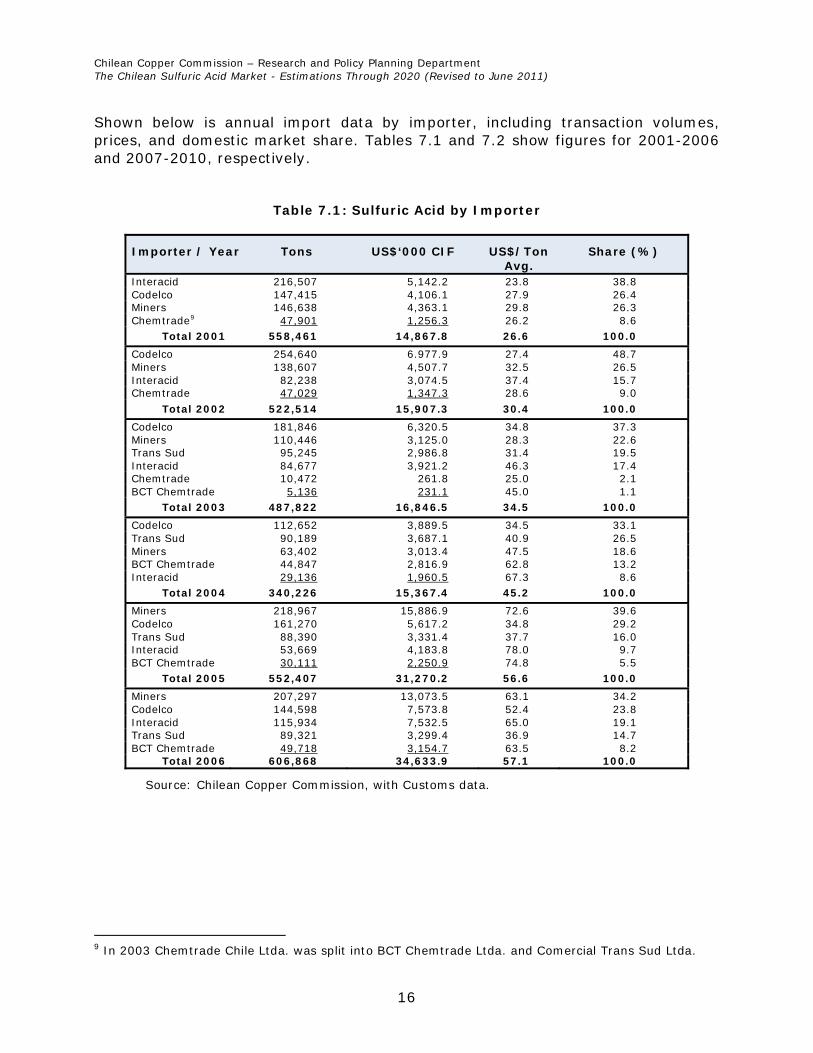
Shown below is annual import data by importer, including transaction volumes, prices, and domestic market share. Tables 7.1 and 7.2 show figures for 2001-2006 and 2007-2010, respectively.
Table 7.1: Sulfuric Acid by Importer
Importer / Year Tons US$‘000 CIF US$/Ton Avg.
Share (%)
Interacid 216,507 5,142.2 23.8 38.8 Codelco 147,415 4,106.1 27.9 26.4 Miners 146,638 4,363.1 29.8 26.3 Chemtrade9 47,901 1,256.3 26.2 8.6
Total 2001 558,461 14,867.8 26.6 100.0
Codelco 254,640 6.977.9 27.4 48.7 Miners 138,607 4,507.7 32.5 26.5 Interacid 82,238 3,074.5 37.4 15.7 Chemtrade 47,029 1,347.3 28.6 9.0
Total 2002 522,514 15,907.3 30.4 100.0
Codelco 181,846 6,320.5 34.8 37.3 Miners 110,446 3,125.0 28.3 22.6 Trans Sud 95,245 2,986.8 31.4 19.5 Interacid 84,677 3,921.2 46.3 17.4 Chemtrade 10,472 261.8 25.0 2.1 BCT Chemtrade 5,136 231.1 45.0 1.1
Total 2003 487,822 16,846.5 34.5 100.0
Codelco 112,652 3,889.5 34.5 33.1 Trans Sud 90,189 3,687.1 40.9 26.5 Miners 63,402 3,013.4 47.5 18.6 BCT Chemtrade 44,847 2,816.9 62.8 13.2 Interacid 29,136 1,960.5 67.3 8.6
Total 2004 340,226 15,367.4 45.2 100.0
Miners 218,967 15,886.9 72.6 39.6 Codelco 161,270 5,617.2 34.8 29.2 Trans Sud 88,390 3,331.4 37.7 16.0 Interacid 53,669 4,183.8 78.0 9.7 BCT Chemtrade 30,111 2,250.9 74.8 5.5
Total 2005 552,407 31,270.2 56.6 100.0
Miners 207,297 13,073.5 63.1 34.2 Codelco 144,598 7,573.8 52.4 23.8 Interacid 115,934 7,532.5 65.0 19.1 Trans Sud 89,321 3,299.4 36.9 14.7 BCT Chemtrade 49,718 3,154.7 63.5 8.2
Total 2006 606,868 34,633.9 57.1 100.0
Source: Chilean Copper Commission, with Customs data.
9 In 2003 Chemtrade Chile Ltda. was split into BCT Chemtrade Ltda. and Comercial Trans Sud Ltda.

Chilean Copper Commission – Research and Policy Planning Department The Chilean Sulfuric Acid Market - Estimations Through 2020 (Revised to June 2011)
Traducido por Patricio Mason, M.A. / Translated by Patricio Mason, M.A.
17
Table 7.2: Sulfuric Acid by Importer
Importer / Year Tons US$‘000 CIF US$/Ton Avg.
Share (%)
Miners 573,990 37,457.7 65.3 44.7 Interacid 212,878 18,473.1 86.8 16.6 Trans Sud 180,557 12,085.0 66.9 14.0 BCT Chemtrade 161,657 15,678.0 97.0 12.6 Codelco 156,005 9,780.3 62.7 12.1
Total 2007 1,285,087 93,474.2 72.7 100.0
Miners 1,266,840 229,451.4 181.1 52.8 Interacid 437,979 103,809.6 237.0 18.3 Trans Sud 287,189 37,719.2 131.3 12.0 Codelco 204,998 38,066.3 185.7 8.5 BCT Chemtrade 201,452 41,949.6 208.2 8.4
Total 2008 2,398,458 450,996.1 188.0 100.0
Miners 1,239,025 159,085.1 128.4 66.2 Interacid 363,674 38,650.5 106.3 19.4 Trans Sud 210,460 10,577.0 50.3 11.2 Codelco 43,770 2,217.8 50.7 2.3 BCT Chemtrade 15,396 3,233.2 210.0 0.8
Total 2009 1,872,325 213,763.6 114.2 100.0
Miners 1,536,480 136,982.1 89.2 58.1 Interacid 636,005 35,222.3 55.4 24.1 Trans Sud 413,345 26,722.1 64.6 15.6 Codelco 37,755 1,438.4 38.1 1.4 BCT Chemtrade 20,090 2,310.3 115.0 0.8
Total 2010 2,643,675 202,675.3 76.7 100.0
Source: Chilean Copper Commission, with Customs data.
2.4.2 Exports While Chile has an acknowledged structural deficit, some sulfuric acid is exported, notably to South American countries.
In addition to some local producers being required to fulfill standing supply contracts with neighboring countries, temporary excess production can lead to surpluses which cannot be stored or sold domestically. Such surpluses must be sold on the spot market at less advantageous prices.
Shown below is annual distribution by destination plus volume amount, global FOB amounts, and resulting unit price for 2001-2010.
Exports in Q1 2011 were an additional 3,488 tons worth US$335,086, for a unit price of US$96.1/ton.

Chilean Copper Commission – Research and Policy Planning Department The Chilean Sulfuric Acid Market - Estimations Through 2020 (Revised to June 2011)
Traducido por Patricio Mason, M.A. / Translated by Patricio Mason, M.A.
18
Table 8: Sulfuric Acid Exports by Destination (2001-2010)
Destination & Year Tons US$‘000 FOB US$/Ton
Argentina Bolivia
Total 2001
1,316 550
1,866
44.4 36.4 80.8
33.7 66.2 43.3
Peru Brazil Bolivia
Total 2002
57,417 10,314 5,949
73,680
1,477.9 350.7 303.4
2,132,0
25.7 34.0 51.0 28.9
Brazil Peru Bolivia Argentina Costa Rica
Total 2003
77,351 72,487 10,723 1,740
23 162,324
2,362.1 1,933.8
449.4 47.8 2.5
4,795.6
30.5 26.7 41.9 27.5
110.0 29.5
Peru Brazil Bolivia Argentina Costa Rica
Total 2004
107,926 26,098 13,615 2,394
259 150,292
4,618.8 950.1 772.7 99.6 31.5
6,472.7
42.8 36.4 56.8 41.6
121.6 43.1
USA Peru Brazil Cuba Bolivia Argentina Mexico Costa Rica
Total 2005
199,401 180,311 43,692 29,300 12,420 10,633 5,084
52 480,893
1,978.6 10,618.1
378.4 795.0 974.5 612.1 68.6 6.7
15,432.0
9.9 58.9 8.7
27.1 78.5 57.6 13.5
128.8 32.1
Brazil Peru Argentina Bolivia
Total 2006
55,921 48,192 14,501 12,699
131,313
1,048.6 2,163.9
521.6 954.5
4,688.6
18.8 44.9 36.0 75.2 35.7
Peru Brazil Cuba Bolivia Argentina
Total 2007
42,028 37,514 20,036 12,627 11,948
124,153
2,083.5 2,276.3 1,247.2
940.7 535.1
7,082.8
49.6 60.7 62.2 74.5 44.8 57.0
USA Cuba Bolivia Argentina Brazil Peru
Total 2008
33,261 17,812 10,596 9,095 8,149 5,000
83,913
6,269.3 2,986.7 2,588.8 2,304.2
559.1 245.1
14,953.2
188.5 167.7 244.3 253.4 68.6 49.0
178.2
Bolivia Argentina
Total 2009
10,594 2,865
13,459
1,581.9 480.0
2,061.9
149.4 167.4 153.4
Bolivia Argentina
Total 2010
11,687 1,696
13,383
801.1 121.0 922.1
68.5 71.3 68.9
Source: Chilean Copper Commission, with Customs data.

Chilean Copper Commission – Research and Policy Planning Department The Chilean Sulfuric Acid Market - Estimations Through 2020 (Revised to June 2011)
Traducido por Patricio Mason, M.A. / Translated by Patricio Mason, M.A.
19
Table 9 below shows sulfuric acid exports by exporter and share.
Table 9: Sulfuric Acid by Exporter (2001-2010)
Exporter / Year Tons US$‘000 FOB US$/Ton Avg. Share (%)
Enami 1,316 44.4 33.7 70.5
Codelco 550 36.4 66.2 29.5 Total 2001 1,866 80.8 43.3 100.0
Interacid 47,593 1,134.0 23.8 64.6
Codelco 26,087 998.0 38.3 35.4 Total 2002 73,680 2,132.0 28.9 100.0
Codelco 84,255 2,420.6 28.7 51.9
Trans Sud 60,550 1,904.3 31.4 37.3 Interacid 15,756 420.2 26.7 9.7
Enami 1,740 47.9 27.5 1.1 Other 23 2.6 113.0 0.0
Total 2003 162,324 4,795.6 29.5 100.0
Interacid 61,569 2,524.4 41.0 41.0
Trans Sud 47,130 1,809.5 38.4 31.4 Codelco 38,938 2,007.8 51.6 25.9
Enami 2,150 81.4 37.9 1.4 Other 503 49.6 98.7 0.3
Total 2004 150,292 6,472.7 43.1 100.0
Codelco 279,500 7,337.1 26.3 58.1 Interacid 101,798 3,824.6 37.6 21.2 Trans Sud 82,954 3,845.9 46.4 17.2
BCT Chemtrade 12,610 124.3 9.9 2.6 Enami 276 10.5 38.0 0.1 Other 3,755 289.7 77.2 0.8
Total 2005 480,893 15,432.1 32.1 100.0
Trans Sud 66,210 2,517.1 38.0 50.4 Codelco 65,103 2,171.5 33.4 49.6
Total 2006 131,313 4,688.6 35.7 100.0
Codelco 72,112 4,373.5 60.6 61.7 Trans Sud 42,028 2,083.5 49.6 29.4
BCT Chemtrade 10,013 625.8 62.5 8.8 Total 2007 124,153 7,082.8 57.0 100.0
Codelco 61,008 11,692.8 191.7 72.7
BCT Chemtrade 17,812 2,986.7 167.7 21.2 Trans Sud 5,001 245.1 49.0 6.0 Other 92 28.6 310.4 0.1
Total 2008 83,913 14,953.2 178.2 100.0
Codelco 12,927 1,986.6 153.7 96.0
Other 532 75.3 141.5 4.0 Total 2009 13,459 2,061,9 153.2 100.0
Codelco 13,134 897.2 68.3 98.1
Other 249 24.9 100.0 1.9 Total 2010 13,383 922.1 68.9 100.0
Source: Chilean Copper Commission, with Customs data.

Chilean Copper Commission – Research and Policy Planning Department The Chilean Sulfuric Acid Market - Estimations Through 2020 (Revised to June 2011)
Traducido por Patricio Mason, M.A. / Translated by Patricio Mason, M.A.
20
2.5 Relevant World Prices
Shown below are sulfuric acid prices at a key referential market (FOB Tampa, Gulf of Mexico) and the price of commodities directly or indirectly impacting the sulfuric acid market. These include Canadian and Middle Eastern sulfur, diammonium phosphate (DAP) at Tampa, and copper at the London Metal Exchange (LME).
Table 10: Sulfuric Acid, Sulfur, Phosphate and Copper Quarterly Price Comparison, June 2006-June 2011
Source: Chilean Copper Commission, with data from Sulphur (sulfuric acid and sulfur through 2009), Pentasul (DAP, sulfuric acid and sulfur since 2010), and Cochilco (copper).
A referential price index (December 2006=100) helps place subsequent price fluctuations in perspective.
Table 10 above also provides a useful comparison of Chile import and world prices.

Chilean Copper Commission – Research and Policy Planning Department The Chilean Sulfuric Acid Market - Estimations Through 2020 (Revised to June 2011)
Traducido por Patricio Mason, M.A. / Translated by Patricio Mason, M.A.
21
III. Sulfuric Acid Balance Estimations (2011-2020)
3.1 Domestic Balance
As explained in the methodology notes,10 the domestic sulfuric acid balance evaluates four scenarios (Baseline, Maximum Production, Maximum Consumption and Potential), each in turn projected over the short, medium, and long-term. Results are shown below.
Table 11: Domestic Sulfuric Acid Balance, 2011-2020 (kMT)
Short Term Medium Term Long Term
Description 2011 2012 2013 2014 2015 2016 2017 2018 2019 2020
Baseline Production (1) 5,945 6,030 6,336 6,589 6,583 6,699 6,648 6,679 6,584 6,623
Potential Production (2) 0 0 70 140 170 170 170 170 170 170
Max. Production (3) 5,945 6,030 6,406 6,729 6,753 6,869 6,818 6,849 6,754 6,793
Baseline Consumption (4) 8,507 8,605 8,766 8,648 8,152 7,502 6,846 6,357 6,084 5,752
Potential Consumption (5) 0 150 372 1,158 1,576 1,748 1,958 2,138 2,168 1,988
Max. Consumption (6) 8,507 8,755 9,138 9,806 9,728 9,250 8,804 8,495 8,252 7,740
Balance Under Each Scenario
Baseline (1-4) (2,561) (2,576) (2,429) (2,059) (1,569) (803) (198) 322 500 871
Max. Production (3-4) (2,561) (2,576) (2,359) (1,919) (1,399) (633) (28) 492 670 1,041
Max. Consumption (1-6) (2,561) (2,726) (2,801) (3,217) (3,145) (2,551) (2,156) (1,816) (1,668) (1,117)
Potential (3-6) (2,561) (2,726) (2,731) (3,077) (2,975) (2,381) (1,986) (1,646) (1,498) (947)
Source: Chilean Copper Commission, based on producer and consumer company reports to May 2011.
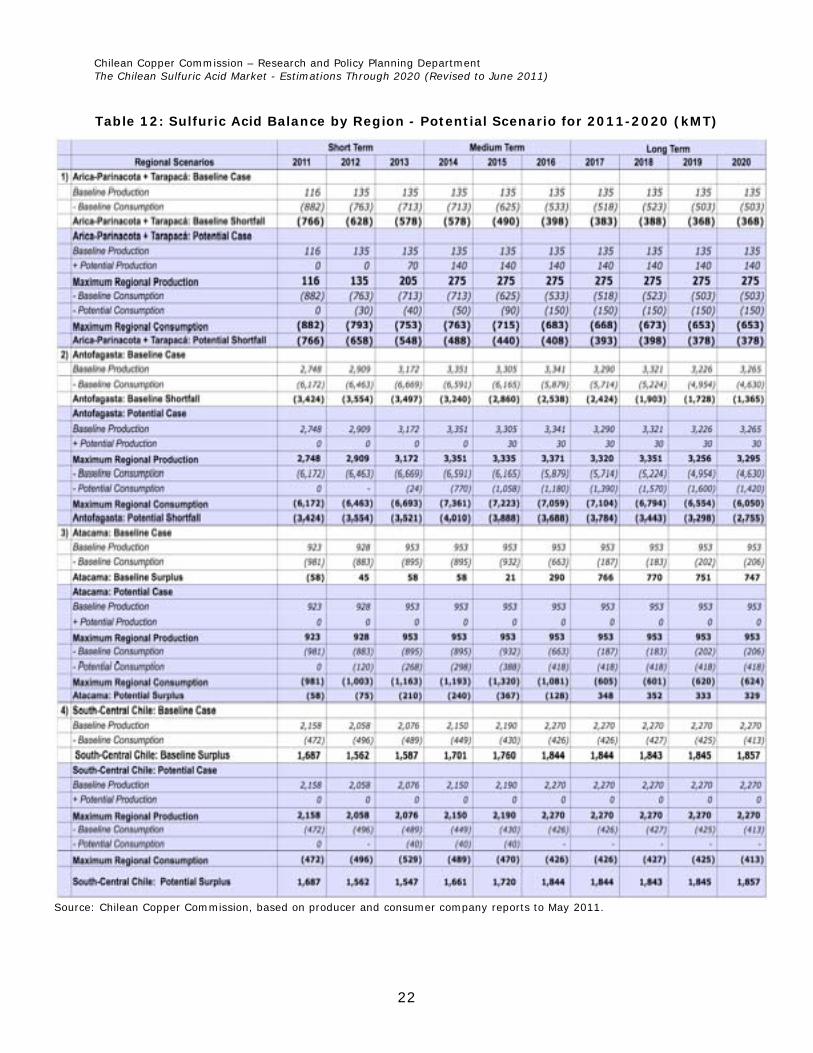
3.2 Regional Balance
Sulfuric acid production and consumption behavior is provided in regional balances under the maximum scenario. Table 12 below shows individual balances for leading consumer regions plus central and southern Chile (i.e., Coquimbo to Los Ríos). Shown for each region are baseline and potential production and consumption profiles and the resulting balance (shortfall or surplus).
10
See section 1.2 above.
Chilean Copper Commission – Research and Policy Planning Department The Chilean Sulfuric Acid Market - Estimations Through 2020 (Revised to June 2011)
Traducido por Patricio Mason, M.A. / Translated by Patricio Mason, M.A.
22
Table 12: Sulfuric Acid Balance by Region - Potential Scenario for 2011-2020 (kMT)
Source: Chilean Copper Commission, based on producer and consumer company reports to May 2011.

Chilean Copper Commission – Research and Policy Planning Department The Chilean Sulfuric Acid Market - Estimations Through 2020 (Revised to June 2011)
Traducido por Patricio Mason, M.A. / Translated by Patricio Mason, M.A.
23
IV. The Chilean Sulfuric Acid Market: Estimations Through 2020
Projected sulfuric acid consumption and production and the resulting balances are discussed below.
4.1 Sulfuric Acid Consumption
Baseline and potential profiles show consumption peaking at 9.8 million tons in 2014, then declining back to current levels by 2018.
With copper ore leaching accounting for 96 percent of Chilean sulfuric acid demand, SX-EW copper production and unit consumption rates are key to properly estimating future consumption.
4.1.1 SX-EW Production
Cochilco estimates to May 201111 for SX-EW production in 2011-2020 are presented below. Estimates are based on existing operation and new project profiles.12
Table 13: Expected SX-EW Copper Production, 2011-2020 (kMT)
Status 2010 2011 2012 2013 2014 2015 2016 2017 2018 2019 2020
Operating 2,089 2,114 2,113 2,064 2,005 1,875 1,740 1,670 1,544 1,478 1,399
Under Construction 0 0 8 13 22 21 24 17 20 18 27
Baseline Total 2,089 2,114 2,120 2,077 2,027 1,897 1,764 1,687 1,564 1,496 1,426
Probable Projects 0 0 0 0 0 0 0 0 0 0 0
Possible Projects 0 0 0 0 72 164 205 205 209 222 245
Total Projects 0 0 0 5 72 164 205 205 209 222 245
Total SX-EW 2,089 2,114 2,120 2,083 2,100 2,061 1,969 1,893 1,773 1,718 1,671
N.B.: Baseline = Operating + Under Construction Probable = Advanced studies + EIA approval Possible = Advanced (from prefeasibility underway on)
Source: Chilean Copper Commission
Baseline production should stay above 2 million tons through 2014. Subsequent declines will only be partly offset by projects currently under consideration.
4.1.2 Sulfuric Acid: Unit Consumption Rates
Sulfuric acid consumption per ton of SX-EW copper has been growing steadily. Chart 4 below illustrates expected annual unit consumption rates based on SX-EW production and reported mining company demand (about 96 percent of the total).
11 See report Copper and Gold Mining Investment in Chile, available from www.cochilco.cl. 12 See leading sulfuric acid consumers in Table 3.

Chilean Copper Commission – Research and Policy Planning Department The Chilean Sulfuric Acid Market - Estimations Through 2020 (Revised to June 2011)
Traducido por Patricio Mason, M.A. / Translated by Patricio Mason, M.A.
24
Chart 4: Copper Mining Industry - Sulfuric Acid Consumption Rates
Source: Chilean Copper Commission
Chart 4 above shows unit consumption growing 4.4 to 4.6 in the second half of the decade, helping delay the decline expected by the end of the decade.
Accounting for increased average unit consumption rates are lower grades in existing projects and higher consumption by new projects.
4.2 Sulfuric Acid Production
Baseline sulfuric acid production should rise sharply in 2011 as Noracid’s Mejillones plant comes on stream, followed by more moderate growth as smelters introduce operating improvements. The Ministro Hales’ planned acid plant in Antofagasta and Haldeman’s potential second plant in Sagasca, Tarapacá, should provide additional production.
Combined, these facilities are expected to produce some 6.8 million tons a year, about 1.7 million tons more than the amount produced in 2010.
Smelter production profiles are regarded as stable, as it is in the nature of the smelting business to maximize installed capacity use.
Eventual changes introduced by the smelter and refinery policy review underway at Codelco are not considered.

Chilean Copper Commission – Research and Policy Planning Department The Chilean Sulfuric Acid Market - Estimations Through 2020 (Revised to June 2011)
Traducido por Patricio Mason, M.A. / Translated by Patricio Mason, M.A.
25
4.3 Chile’s Structural Sulfuric Acid Deficit
Sulfuric acid consumption and production forecasts show the Chilean market remaining in a structural deficit condition. The extent of the shortfall depends on the actual behavior of profile estimates for each scenario. The resulting market balance by scenario is shown below.
Chart 5: Sulfuric Acid Market Balance By Scenario (2011-2020)
4.4 Domestic Market Asymmetry
Chile’s structural sulfuric acid deficit is a function of strong demand and insufficient local production in northern Chile, especially Antofagasta. In contrast, large surpluses are available in the south-central regions of Valparaíso and O’Higgins.
Distance between acid producer and consumer centers results in significant market asymmetry. This is evident in the national and regional market balances shown in Chart 6 below.

Chilean Copper Commission – Research and Policy Planning Department The Chilean Sulfuric Acid Market - Estimations Through 2020 (Revised to June 2011)
Traducido por Patricio Mason, M.A. / Translated by Patricio Mason, M.A.
26
Chart 6: National and Regional Sulfuric Acid Market Balances (Potential Scenario, 2011-2020)
Source: Chilean Copper Commission
The shortfall hits hardest in Antofagasta, where some 3.5 to 4 million tons of sulfuric acid from both domestic and foreign sources are required each year. This trade considerably taxes port facilities at Mejillones and may force an upgrade.
4.5 Dependence on Imports
The most likely scenario is the Potential case, with annual shortfalls of 2.5 to 3 million tons through 2015 followed by imports declining to about one million tons by the end of the decade. At present, Peru is Chile’s largest sulfuric acid supplier. Peruvian imports have grown from 500,000 tons in 2007 to 750,000 tons in 2010.
While proximity to northern Chile makes Peru a competitive supplier, the extent of its available surplus remains uncertain. While Peru’s sulfuric acid production potential is an estimated 2.5 million tons through 2015, this is contingent on settlement of the conflict affecting Doe Run Peru’s La Oroya Smelter, currently shut down by the government. Present production stands at about 1.6 million tons.
Sulfuric acid demand in Peru is expected to track the growth of new hydrometallurgical operations seeking to increase SX-EW copper production to 675,000 tons by the end of the decade. These projects could boost demand from 0.7 million tons at present to over 3.3 million tons.
An insecure supply and strong demand driven by high copper prices could cause Peru’s acid surpluses to shrink or even vanish in the second half of the decade.

Chilean Copper Commission – Research and Policy Planning Department The Chilean Sulfuric Acid Market - Estimations Through 2020 (Revised to June 2011)
Traducido por Patricio Mason, M.A. / Translated by Patricio Mason, M.A.
27
A Cochilco Research and Policy Planning Department Publication
Prepared By
Vicente Pérez Vidal
July 2011