THE CHEMICAL INVESTIGATION ON WATER POLLUTION OF KURNOOL …
9
THE CHEMICAL INVESTIGATION ON WATER POLLUTION OF KURNOOL DISTRICT BY WATER QUALITY ANALYSIS Mohemmad Rafi.K *, Ramachar.T, Umamahesh.M Dept.of Chemistry, R.G.M Engg.College(Autonoumous), Nandyal,Kurnool District, Andhra Pradesh-INDIA Dept.of Basic Sciences, G.P.R.Engg.College (Autonomous), Kurnool-INDIA Dept.of Chemistry, R.G.M Engg.College(Autonoumous), Nandyal,Kurnool District, Andhra Pradesh-INDIA e-mail: [email protected] Abstract: This study consisted of the determination of the trace metal ions and some physiochemical properties in drinking water samples from the neighboring villages of Nandyal region, Kurnool district, where drinking water samples are not treated before it is consumed. The purpose was to ascertain the quality of water from these sources. Samples were taken from ten sampling points and analyzed for the following parameters Fe, Cu, Mn, Zn, Al, pH,EC,NO3-, SO 4 , and F- using the procedure outline in the plain test photometer method. The data showed the variation of the investigated parameters in samples as follows: pH 5.47- 7.39, conductivity (EC) 49-1168 μs/cm, turbidity 4.68-73.34JTU, F - 0.54 to 1.29mg/L.NO 3 - 11.19 to 39.76 mg/L , SO 4 2- 41.2 to 73.0 mg/L Cu 1.25 to 2.96 mg/L. Fe 0.08-0.94mg/L, Zn 5-19 mg/L, Mn 0.004-0.016 mg/L and Al 0.07-0.18 mg/L , The concentrations of most of the investigated parameters in the drinking water samples from Nandyal region were within the permissible limits of the World Health Organization drinking water quality guidelines. Key words : drinking water, Nandyal Rural region areas, World Health Organization, Trace metals, physiochemical Properties. 1.INTRODUCTION Good drinking water quality is essential for the well being of all people. Unfortunately in many countries around the world, including India, some drinking water supplies have become contaminated, which has impacted on the health and economic status of the populations Contaminants such as bacteria, viruses, heavy metals, nitrates and salt have found their way into water supplies as a result of in adequate treatment and disposal of waste industrial discharges, and over-use of limited water resources Even other Chemicals to be harmful to human health. Unfortunately, this problem arose because the groundwater was extracted for drinking without a detailed chemical investigation. The natural water analyses for physical and chemical properties including trace element contents are very important for public health studies. These studies are also a main part of pollution studies in the environment (Kot., et al,. 2000; Soylak. et al., 2002 a). According to our literature review Some physical and chemical properties of the samples were determined by using standard analytical methods. 2.MATERIALS AND METHODS 2.1 Sample collection The drinking water samples were collected in prewashed (with detergent, diluted HNO3 and doubly de- ionized distilled water, respectively) polyethylene bottles. pH and conductivity of the samples were measured while collecting the samples. Each water sample was taken four times at four different sampling periods approximately three month apart. Samples were collected in January, April,July and October ;2009.The determinations of the physical and other chemical properties of the water samples were performed on the same day of sampling. For surface water sampling, the bottles and caps were rinsed three times with water to be sampled during sampling and TOJSAT TOJSAT : The Online Journal of Science and Technology- January 2012, Volume 2, Issue 1 Copyright © TOJSAT www.tojsat.net 1
Transcript of THE CHEMICAL INVESTIGATION ON WATER POLLUTION OF KURNOOL …

THE CHEMICAL INVESTIGATION ON WATER POLLUTION OF
KURNOOL DISTRICT BY WATER QUALITY ANALYSIS
Mohemmad Rafi.K *, Ramachar.T, Umamahesh.M
Dept.of Chemistry, R.G.M Engg.College(Autonoumous), Nandyal,Kurnool District, Andhra Pradesh-INDIA
Dept.of Basic Sciences, G.P.R.Engg.College (Autonomous), Kurnool-INDIA
Dept.of Chemistry, R.G.M Engg.College(Autonoumous), Nandyal,Kurnool District, Andhra Pradesh-INDIA
e-mail: [email protected]
Abstract: This study consisted of the determination of the trace metal ions and some
physiochemical properties in drinking water samples from the neighboring villages of Nandyal region, Kurnool district, where drinking water samples are not treated before it is consumed. The purpose was to ascertain the quality of water from these sources. Samples were taken from ten sampling points and analyzed for the following parameters Fe, Cu, Mn, Zn, Al, pH,EC,NO3-, SO4 , and F- using the procedure outline in the plain test photometer method.
The data showed the variation of the investigated parameters in samples as follows: pH 5.47-7.39, conductivity (EC) 49-1168 μs/cm, turbidity 4.68-73.34JTU, F - 0.54 to 1.29mg/L.NO3-
11.19 to 39.76 mg/L , SO42- 41.2 to 73.0 mg/L Cu 1.25 to 2.96 mg/L. Fe 0.08-0.94mg/L, Zn
5-19 mg/L, Mn 0.004-0.016 mg/L and Al 0.07-0.18 mg/L , The concentrations of most of the
investigated parameters in the drinking water samples from Nandyal region were within the permissible limits of the World Health Organization drinking water quality guidelines.
Key words : drinking water, Nandyal Rural region areas, World Health Organization, Trace
metals, physiochemical Properties.
1.INTRODUCTION
Good drinking water quality is essential for the well being of all people. Unfortunately in many countries around the
world, including India, some drinking water supplies have become contaminated, which has impacted on the health
and economic status of the populations Contaminants such as bacteria, viruses, heavy metals, nitrates and salt have
found their way into water supplies as a result of in adequate treatment and disposal of waste industrial discharges,
and over-use of limited water resources Even other Chemicals to be harmful to human health. Unfortunately, this
problem arose because the groundwater was extracted for drinking without a detailed chemical investigation. The
natural water analyses for physical and chemical properties including trace element contents are very important for
public health studies. These studies are also a main part of pollution studies in the environment (Kot., et al,. 2000;
Soylak. et al., 2002 a). According to our literature review Some physical and chemical properties of the samples
were determined by using standard analytical methods.
2.MATERIALS AND METHODS
2.1 Sample collection The drinking water samples were collected in prewashed (with detergent, diluted HNO3 and doubly de- ionized
distilled water, respectively) polyethylene bottles. pH and conductivity of the samples were measured while
collecting the samples. Each water sample was taken four times at four different sampling periods approximately
three month apart. Samples were collected in January, April,July and October ;2009.The determinations of the
physical and other chemical properties of the water samples were performed on the same day of sampling. For
surface water sampling, the bottles and caps were rinsed three times with water to be sampled during sampling and
TOJSAT
TOJSAT : The Online Journal of Science and Technology- January 2012, Volume 2, Issue 1
Copyright © TOJSAT www.tojsat.net 1

for ground water, the samples were obtained directly from the water pump after allowing the water to run for at least
five minutes and each sample bottle and its cap rinsed three times. These samples were subsequently stored at 4 °C
for as short a time as possible before analysis to minimize physicochemical changes (Anonymous, 1996).Because
very little particulate matter was present in the sample, filtration was not considered necessary.
2.2. Methodology
Analytical water test tablets (photometer grade) reagents for specific test were used for the preparation of all
solutions. Each sample was analysis for , Fe, Cu,Mn, Zn, Al, NO3- , SO4 2-, and F- using procedures outline in the
Palintest Photometer Method (Palintest Photometer 5000) for the examination of water and waste water.
3.RESULTS AND DISCUSSION
The average physical and chemical properties of the drinking water samples including pH, electrical conductivity,
turbidity, fluoride, nitrate ,sulphate from these sample points(1,2,3,4,5,6,7,8,9,10) were given in Table 1. The pH
values were in the range of 5.47 to 7.39. Minimum pH (5.47) was observed from an well in Panyam rural area(1)
and a maximum of (7.39) was observed from the Panyam stream(2) at Nandyal Rural area. The pH levels were lower
than permissible limit (6.5-8.5) in 10% villages, the rest were within optimum limit. The recommended permissible
limit for electrical conductivity (EC) is 300 μs/cm. By analyzing the results 80% villages showed EC lower than
permissible limit The value for EC ranged from 49 to 275 μs/cm, except that of the groundwater samples from
Konidedu(4) and Alamur(7) which recorded 963 μs/cm and 1168 μs/ cm respectively. Turbidity is a measure of the
cloudiness of water. It has no health effects. However,turbidity can interfere with disinfection and provide a medium
for microbial growth. Turbidity may indicate the presence of disease causing organisms. These organisms include
bacteria, viruses, and parasites that can cause symptoms such as nausea, cramps, diarrhea, and associated headaches .
All the samples have turbidity values greater than the WHO permissible value of 10 JTU except that of the
groundwater sample from Neravada(5) and Kowluru(6) villages which recorded values of 5.38 JTU and 4.68 JTU
respectively. Fluoride (F-) varied from 0.54 to 1.29 mg/L.Minimum (0.54 mg/L) and maximum (1.29 mg/L)
concentration of F- was observed from Odugandla(9) and Balapanuru(10) villages respectively (Table 1). Permissible
limit for F concentration is 1-1.5 mg/L according to WHO (2003).The data revealed that 50 % villages are with in
limit.. Nitrate in the investigated samples were found to be in a range of 11.19 to 39.76 mg/L .The range of sulphate
(SO42-) in the samples was 41.2 to 73.0 mg/L but was negligible at Maddur (8)throughout the area.
Table 1: The physical and chemical parameters of the drinking water samples
Sampling site Sample site code Water Type pH EC
μs/cm Panyam Rural area 1 Surface 6.78 67
Panyam Stream 2 Surface 7.37 129 Panyam Lake 3 Surface 7.17 184 Konidedu 4 Ground 5.47 963 Neravada 5 Ground 6.23 213 Kowlur 6 Ground 6.68 198 Alamur 7 Ground 7.12 1168 Maddur 8 Tap Water 7.43 95 Odiguntla 9 Tap Water 7.29 102 Balapanur 10 Tap Water 7.09 116
TOJSAT
TOJSAT : The Online Journal of Science and Technology- January 2012, Volume 2, Issue 1
Copyright © TOJSAT www.tojsat.net 2

Figure: 1: Graphical representation between Area Vs Observed pH
Figure: 2: Graphical representation between Area Vs Observed EC
Table 2: The physical and chemical parameters of the drinking water samples
Sampling site Sample site code Water Type Turb.
NTU F
(mg/l) Panyam Rural area 1 Surface 36.0 1.03
Panyam Stream 2 Surface 43.67 1.18 Panyam Lake 3 Surface 51.53 0.99 Konidedu 4 Ground 62.98 0.68 Neravada 5 Ground 5.35 0.92 Kowlur 6 Ground 4.68 0.74 Alamur 7 Ground 73.34 1.05 Maddur 8 Tap Water 32.76 1.23 Odiguntla 9 Tap Water 26.88 0.54 Balapanur 10 Tap Water 29.0 1.29
0
2
4
6
8
1 2 3 4 5 6 7 8 9 10
Ob
serv
ed
pH
Area
AREA Vs pH
0
200
400
600
800
1000
1200
1400
1 2 3 4 5 6 7 8 9 10
Ob
serv
ed
EC
Area Code
AREA vs EC
TOJSAT
TOJSAT : The Online Journal of Science and Technology- January 2012, Volume 2, Issue 1
Copyright © TOJSAT www.tojsat.net 3
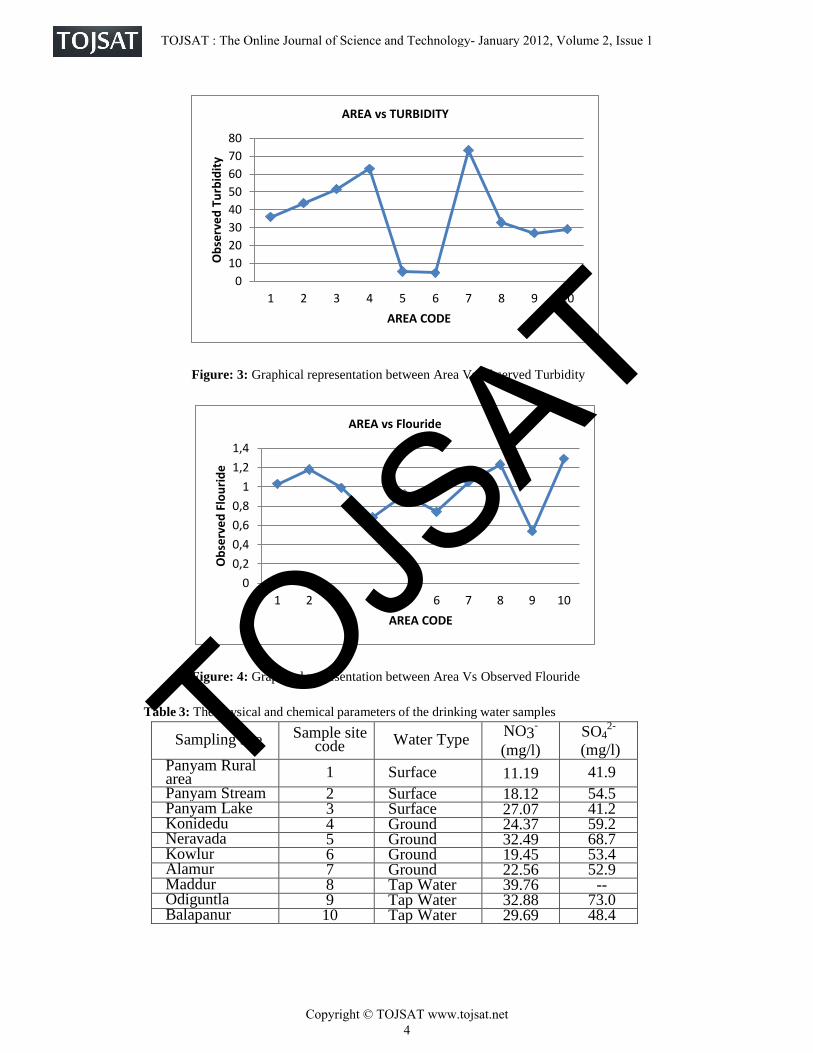
Figure: 3: Graphical representation between Area Vs Observed Turbidity
Figure: 4: Graphical representation between Area Vs Observed Flouride
Table 3: The physical and chemical parameters of the drinking water samples
Sampling site Sample site code Water Type
NO3-
(mg/l)
SO42-
(mg/l) Panyam Rural area 1 Surface 11.19 41.9
Panyam Stream 2 Surface 18.12 54.5 Panyam Lake 3 Surface 27.07 41.2 Konidedu 4 Ground 24.37 59.2 Neravada 5 Ground 32.49 68.7 Kowlur 6 Ground 19.45 53.4 Alamur 7 Ground 22.56 52.9 Maddur 8 Tap Water 39.76 -- Odiguntla 9 Tap Water 32.88 73.0 Balapanur 10 Tap Water 29.69 48.4
0
10
20
30
40
50
60
70
80
1 2 3 4 5 6 7 8 9 10
Ob
serv
ed
Tu
rbid
ity
AREA CODE
AREA vs TURBIDITY
0
0,2
0,4
0,6
0,8
1
1,2
1,4
1 2 3 4 5 6 7 8 9 10
Ob
serv
ed
Flo
uri
de
AREA CODE
AREA vs Flouride
TOJSAT
TOJSAT : The Online Journal of Science and Technology- January 2012, Volume 2, Issue 1
Copyright © TOJSAT www.tojsat.net 4

Figure: 5: Graphical representation between Area Vs Observed Nitrates
Figure: 6: Graphical representation between Area Vs Observed Sulphates
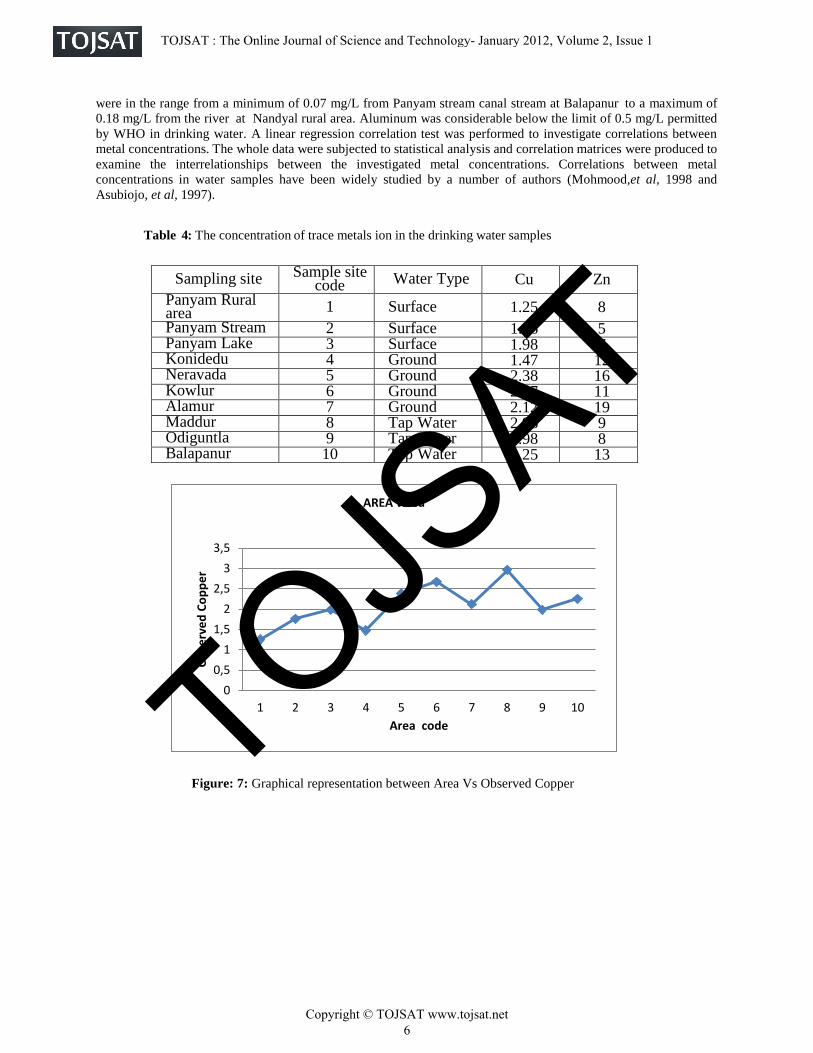
The concentrations of the major ions were below the permissible limits given by the WHO. The concentrations of
trace metals (Cu, Fe, Zn, Al and Mn) ions in the drinking water samples are presented in Table 2. The lowest and the
highest levels of trace metals detected ranged between 0.004 mg/L - 0.016mg/l for manganese in the sample from
Konidedu and 2.96 mg/L for copper from the K.c.canal at Maddur villages. The highest level of total trace metals
ions were found in the water sample from K.C Canal at Maddur Average copper concentrations in the drinking water
samples were in the range of 1.25 to 2.96 mg/L. The levels in all the stations were above the limit of 1.0 mg/L
permitted by WHO in drinking water. This indicates that the local mineral deposit in the catchment area studied may
have high levels of copper. Copper is an essential nutrient, but at high doses it has been shown to cause stomach and
intestinal distress, liver and kidney damage, and anemia (US EPA, 2003). The highest iron level was found in the
sample from Kowlur as 0.94 mg/L and the lowest in Panyam as 0.08 mg/L, almost all the samples contain higher
amount of iron except in Panyam where it was below the acceptance limit of iron which is 0.1 mg/ L permitted by
the WHO. The levels of zinc in the samples were in the range of 5 mg/L to 19 mg/L . 80% village are between limit
according to WHO . Average manganese levels were found to be in the range of 0.042 mg/L to 0.63 mg/L. 70%
villages water samples were with in the WHO permitted limit Aluminum concentration in the drinking water
samples were in the range from a limit which is 0.05 mg/L. Aluminum concentration in the drinking water samples
05
1015202530354045
1 2 3 4 5 6 7 8 9 10
Ob
serv
ed
nit
rate
Area code
AREA vs Nitrates
01020304050607080
1 2 3 4 5 6 7 8 9 10
Ob
serv
ed
Su
lph
ate
s
AREA CODE
Area VS Sulphates
TOJSAT
TOJSAT : The Online Journal of Science and Technology- January 2012, Volume 2, Issue 1
Copyright © TOJSAT www.tojsat.net 5
were in the range from a minimum of 0.07 mg/L from Panyam stream canal stream at Balapanur to a maximum of
0.18 mg/L from the river at Nandyal rural area. Aluminum was considerable below the limit of 0.5 mg/L permitted
by WHO in drinking water. A linear regression correlation test was performed to investigate correlations between
metal concentrations. The whole data were subjected to statistical analysis and correlation matrices were produced to
examine the interrelationships between the investigated metal concentrations. Correlations between metal
concentrations in water samples have been widely studied by a number of authors (Mohmood,et al, 1998 and
Asubiojo, et al, 1997).
Table 4: The concentration of trace metals ion in the drinking water samples
Sampling site Sample site code Water Type Cu Zn
Panyam Rural area 1 Surface 1.25 8
Panyam Stream 2 Surface 1.76 5 Panyam Lake 3 Surface 1.98 7 Konidedu 4 Ground 1.47 12 Neravada 5 Ground 2.38 16 Kowlur 6 Ground 2.67 11 Alamur 7 Ground 2.12 19 Maddur 8 Tap Water 2.96 9 Odiguntla 9 Tap Water 1.98 8 Balapanur 10 Tap Water 2.25 13
Figure: 7: Graphical representation between Area Vs Observed Copper
0
0,5
1
1,5
2
2,5
3
3,5
1 2 3 4 5 6 7 8 9 10
Ob
serv
ed
Co
pp
er
Area code
AREA vs Cu
TOJSAT
TOJSAT : The Online Journal of Science and Technology- January 2012, Volume 2, Issue 1
Copyright © TOJSAT www.tojsat.net 6
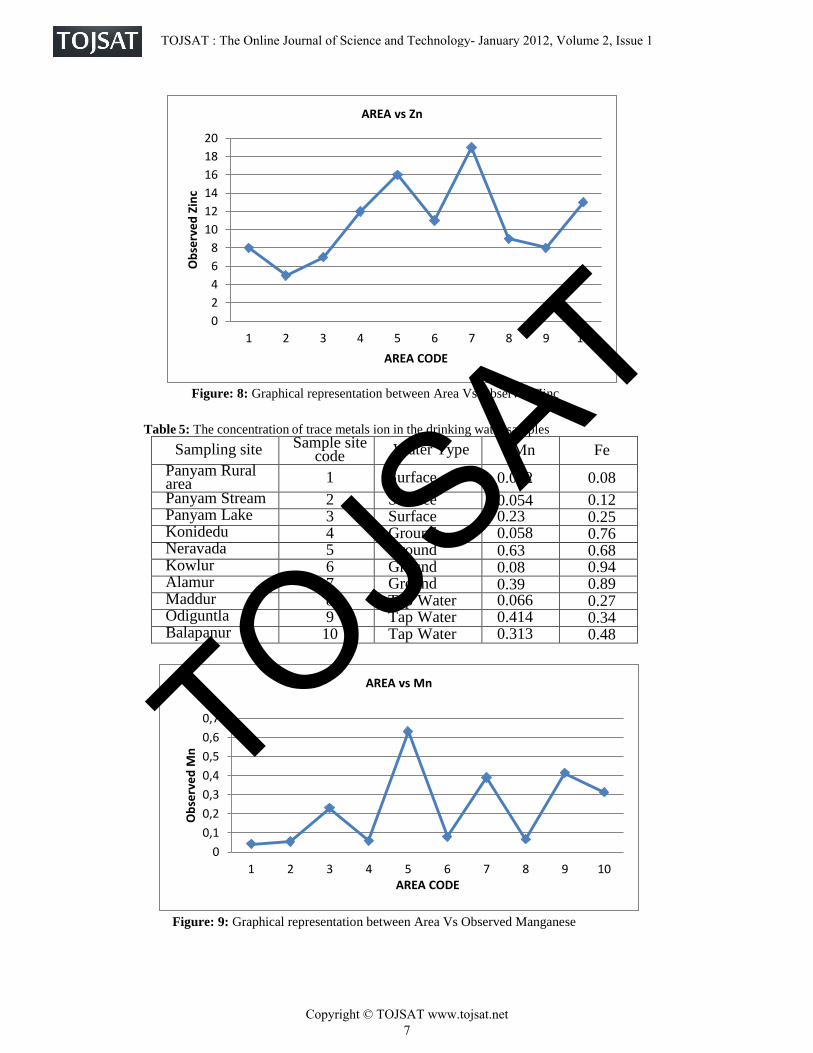
Figure: 8: Graphical representation between Area Vs Observed Zinc
Table 5: The concentration of trace metals ion in the drinking water samples
Sampling site Sample site code Water Type Mn Fe
Panyam Rural area 1 Surface 0.042 0.08
Panyam Stream 2 Surface 0.054 0.12 Panyam Lake 3 Surface 0.23 0.25 Konidedu 4 Ground 0.058 0.76 Neravada 5 Ground 0.63 0.68 Kowlur 6 Ground 0.08 0.94 Alamur 7 Ground 0.39 0.89 Maddur 8 Tap Water 0.066 0.27 Odiguntla 9 Tap Water 0.414 0.34 Balapanur 10 Tap Water 0.313 0.48
Figure: 9: Graphical representation between Area Vs Observed Manganese
0
2
4
6
8
10
12
14
16
18
20
1 2 3 4 5 6 7 8 9 10
Ob
serv
ed
Zin
c
AREA CODE
AREA vs Zn
0
0,1
0,2
0,3
0,4
0,5
0,6
0,7
1 2 3 4 5 6 7 8 9 10
Ob
serv
ed
Mn
AREA CODE
AREA vs Mn TOJSAT
TOJSAT : The Online Journal of Science and Technology- January 2012, Volume 2, Issue 1
Copyright © TOJSAT www.tojsat.net 7
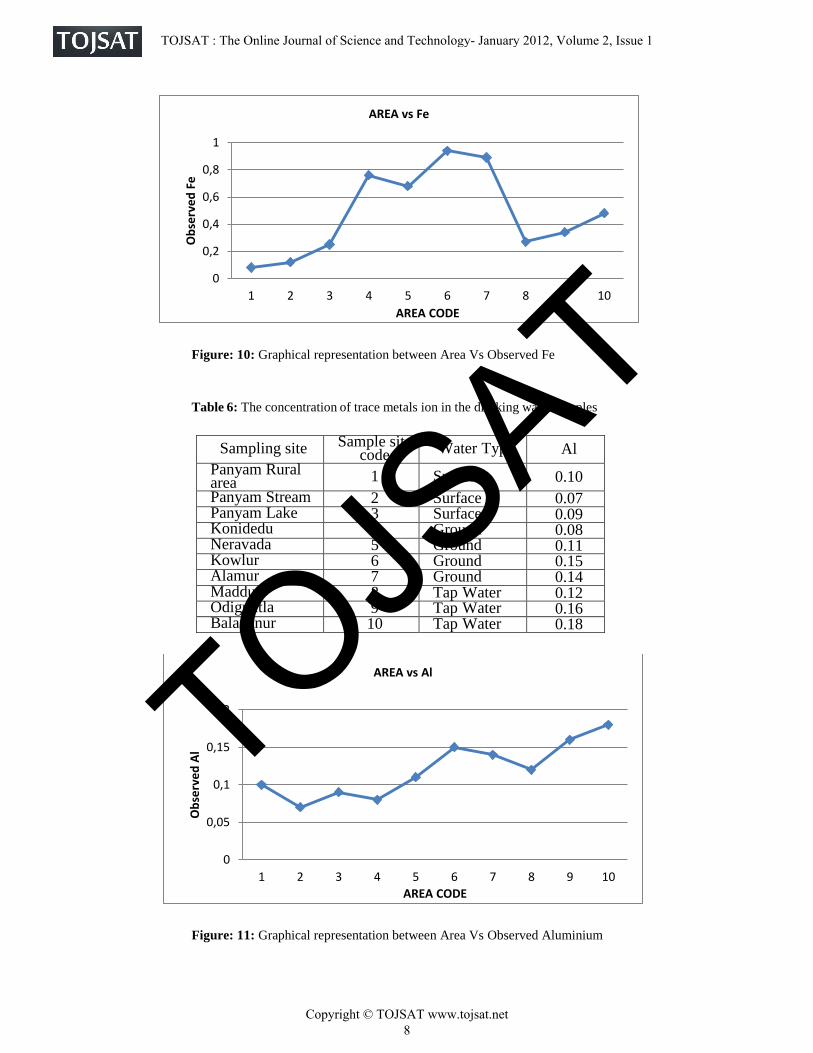
Figure: 10: Graphical representation between Area Vs Observed Fe
Table 6: The concentration of trace metals ion in the drinking water samples
Sampling site Sample site code Water Type Al
Panyam Rural area 1 Surface 0.10
Panyam Stream 2 Surface 0.07 Panyam Lake 3 Surface 0.09 Konidedu 4 Ground 0.08 Neravada 5 Ground 0.11 Kowlur 6 Ground 0.15 Alamur 7 Ground 0.14 Maddur 8 Tap Water 0.12 Odiguntla 9 Tap Water 0.16 Balapanur 10 Tap Water 0.18
Figure: 11: Graphical representation between Area Vs Observed Aluminium
0
0,2
0,4
0,6
0,8
1
1 2 3 4 5 6 7 8 9 10
Ob
serv
ed
Fe
AREA CODE
AREA vs Fe
0
0,05
0,1
0,15
0,2
1 2 3 4 5 6 7 8 9 10
Ob
serv
ed
Al
AREA CODE
AREA vs Al
TOJSAT
TOJSAT : The Online Journal of Science and Technology- January 2012, Volume 2, Issue 1
Copyright © TOJSAT www.tojsat.net 8
4. CONCLUSION
In conclusion, the concentrations of the investigated major ions and trace metal ions in the drinking water samples
from these communities in the Nandyal region, Iddia were found below the guidelines for drinking waters given by
the World Health Organization (WHO). Further research on other communities in this region for drinking water
analyses is required as levels of contaminants may vary due to different soil types, water chemistry and different
human activities. No correlations were found between metal concentrations in the drinking water samples. 5. ACKNOWLEDGEMENT
The authors are grateful for the financial support of the Environmental Research Area, Head Administrative Staff
college of India (ASCI). Hyderabad,A.P, and The Pincipal, RGM College of Engineering & Technology ,Nandyal for
providing the necessary facilities.
REFERENCES Anawara, H.M., Akaib, J., Mostofac, K.M.G., Safiullahd,S.Tareqd, S.M., (2002). Arsenic poisoning in
groundwaterhealthrisk and geochemical sources in Bangladesh. Environ.Int., 27, 597-604.
Traceelements in drinking and groundwater samples in Southern Nigeria, Sci.otal Environ,208,
Kot, B., Baranowski, R., Rybak, A., (2000). Analysis of mine waters using X-ray fluorescence spectrometry,
Polish Journal of Environmental Studies, 9, 429.
Mahmood, S.N., Naeem, S., Siddiqui, I., Khan, F.A., (1998).Metal contamination in ground water of Korangi
Industrial Area, Karachi. Journal of Chemical Society. Pakistan, 20, 125.
Trace metal levels in drinking water on Viti Levu, Fiji Islands. S. Pac. J. Nat. Sci., 21, 31-34. Soylak. M., Armagan
Aydin, F. Saracoglu, S. Elci, L. Dogan, M., (2002a). Chemical analysis of drinking water samples from Yozgat,
Turkey. Polish Journal of Environmental Studies. 11 (2), 151-156.
Soylak, M., Divrikli, U., Saracoglu, S., Elci, L., (2002 b).Monitoring trace metal levels in Yozgat- Turkey: Copper,
iron, nickel, cobalt, lead, cadmium, manganese and chromium levels in stream sediments, Polish Journal of
Environmental Studies., 11, 47.
International Reference Centre for Community Water Supply and Sanitation. 1986.
Langenegger . O (1987). Groundwater quality in rural areas of western Africa. Abidjan, Ivory Coast, World Bank
Regional Water and Sanitation Group.
Lewis, W.J., Farr, J.L., and Foster, S.S.D. (1980b). ’The pollution hazard to village water supplies in eastern
Botswana’. In: Proceedings of the Institute of Civil Engineers. Part2, vol.69.
Anonymous, (1992). Report on UN Conf. on Environ.& Development, A/CONF. 151/26., 1, 277
Anonymous, (1996), Guidelines for drinking water quality (2),231, World Health Organization (WHO Asubiojo,
O.I., Nkono, N.A., Ogunsua, O.A, Oluwole, A.F.,Ward, N.I, Akanle, O.A., Spyrou, N.M., (1997).
Miller, J.C, Miller, J.N., (1988). Statistics for analytical chemistry, Ellis Horwood Limited, Chichester. Singh1, S.,
Mosley, L.M., (2003).
Stumm, W., Morgan, J.J., (1996). Aquatic Chemistry, 3rd Ed. Wiley-Interscience Publication. Envieonmental
Protection Agency (USEPA), (2003). Chemical contaminants in drinking water. Technical fast sheet on microbes.
EPA 816-03-016.
World Health Organization, (WHO), (2003). Guidelines for drinking water quality. Geneva., (WHO/SDE/WSH 03.
04).
TOJSAT
TOJSAT : The Online Journal of Science and Technology- January 2012, Volume 2, Issue 1
Copyright © TOJSAT www.tojsat.net 9