THE CHARLES SCHWAB CORPORATION · PDF fileTHE CHARLES SCHWAB CORPORATION ... and certain...
129
UNITED STATES SECURITIES AND EXCHANGE COMMISSION Washington, D.C. 20549 FORM 10-K ANNUAL REPORT PURSUANT TO SECTION 13 OR 15(d) OF THE SECURITIES EXCHANGE ACT OF 1934 For the fiscal year ended December 31, 2015 Commission file number 1-9700 THE CHARLES SCHWAB CORPORATION (Exact name of registrant as specified in its charter) Delaware (State or other jurisdiction of incorporation or organization) 94-3025021 (I.R.S. Employer Identification No.) 211 Main Street, San Francisco, CA 94105 (Address of principal executive offices and zip code) Registrant’s telephone number, including area code: (415) 667-7000 Securities registered pursuant to Section 12(b) of the Act: Title of each class Name of each exchange on which registered Common Stock - $.01 par value per share New York Stock Exchange Depositary Shares, each representing a 1/40 th ownership interest in a share of 6.0% Non-Cumulative Preferred Stock, Series B New York Stock Exchange Depositary Shares, each representing a 1/40 th ownership interest in a share of 6.0% Non-Cumulative Preferred Stock, Series C New York Stock Exchange Securities registered pursuant to Section 12(g) of the Act: None Indicate by check mark if the registrant is a well-known seasoned issuer, as defined in Rule 405 of the Securities Act. Yes ⌧ No Indicate by check mark if the registrant is not required to file reports pursuant to Section 13 or Section 15(d) of the Exchange Act. Yes No ⌧ Indicate by check mark whether the registrant (1) has filed all reports required to be filed by Section 13 or 15(d) of the Securities Exchange Act of 1934 during the preceding 12 months (or for such shorter period that the registrant was required to file such reports), and (2) has been subject to such filing requirements for the past 90 days. Yes ⌧ No Indicate by check mark whether the registrant has submitted electronically and posted on its corporate Website, if any, every Interactive Data File required to be submitted and posted pursuant to Rule 405 of Regulation S-T during the preceding 12 months (or for such shorter period that the registrant was required to submit and post such files). Yes ⌧ No Indicate by check mark if disclosure of delinquent filers pursuant to Item 405 of Regulation S-K is not contained herein, and will not be contained, to the best of registrant’s knowledge, in definitive proxy or information statements incorporated by reference in Part III of this Form 10-K or any amendment to this Form 10-K. ⌧ Indicate by check mark whether the registrant is a large accelerated filer, an accelerated filer, a non-accelerated filer, or a smaller reporting company. See the definitions of “large accelerated filer,” “accelerated filer” and “smaller reporting company” in Rule 12b-2 of the Exchange Act. Large accelerated filer ⌧ Accelerated filer Non-accelerated filer (Do not check if a smaller reporting company) Smaller reporting company Indicate by check mark whether the registrant is a shell company (as defined in Rule 12b-2 of the Exchange Act). Yes No ⌧ As of June 30, 2015, the aggregate market value of the voting stock held by non-affiliates of the registrant was $38.0 billion. For purposes of this information, the outstanding shares of Common Stock owned by directors and executive officers of the registrant, and certain investment companies managed by Charles Schwab Investment Management, Inc. were deemed to be shares of the voting stock held by affiliates. The number of shares of Common Stock outstanding as of January 29, 2016, was 1,320,522,900. DOCUMENTS INCORPORATED BY REFERENCE Part III of this Form 10-K incorporates certain information contained in the registrant’s definitive proxy statement for its annual meeting of stockholders, to be held May 17, 2016, by reference to that document.
Transcript of THE CHARLES SCHWAB CORPORATION · PDF fileTHE CHARLES SCHWAB CORPORATION ... and certain...
UNITED STATES SECURITIES AND EXCHANGE COMMISSION
Washington, D.C. 20549
FORM 10-K
ANNUAL REPORT PURSUANT TO SECTION 13 OR 15(d) OF THE SECURITIES EXCHANGE ACT OF 1934
For the fiscal year ended December 31, 2015 Commission file number 1-9700
THE CHARLES SCHWAB CORPORATION (Exact name of registrant as specified in its charter)
Delaware
(State or other jurisdiction of incorporation or organization)
94-3025021 (I.R.S. Employer Identification No.)
211 Main Street, San Francisco, CA 94105 (Address of principal executive offices and zip code)
Registrant’s telephone number, including area code: (415) 667-7000
Securities registered pursuant to Section 12(b) of the Act:
Title of each class Name of each exchange on which registered Common Stock - $.01 par value per share New York Stock ExchangeDepositary Shares, each representing a 1/40th ownership interest in a
share of 6.0% Non-Cumulative Preferred Stock, Series B
New York Stock Exchange Depositary Shares, each representing a 1/40th ownership interest in a
share of 6.0% Non-Cumulative Preferred Stock, Series C
New York Stock Exchange
Securities registered pursuant to Section 12(g) of the Act: None
Indicate by check mark if the registrant is a well-known seasoned issuer, as defined in Rule 405 of the Securities Act. Yes ⌧ No
Indicate by check mark if the registrant is not required to file reports pursuant to Section 13 or Section 15(d) of the Exchange Act. Yes No ⌧
Indicate by check mark whether the registrant (1) has filed all reports required to be filed by Section 13 or 15(d) of the Securities Exchange Act of 1934
during the preceding 12 months (or for such shorter period that the registrant was required to file such reports), and (2) has been subject to such filing
requirements for the past 90 days. Yes ⌧ No
Indicate by check mark whether the registrant has submitted electronically and posted on its corporate Website, if any, every Interactive Data File required to
be submitted and posted pursuant to Rule 405 of Regulation S-T during the preceding 12 months (or for such shorter period that the registrant was required
to submit and post such files). Yes ⌧ No
Indicate by check mark if disclosure of delinquent filers pursuant to Item 405 of Regulation S-K is not contained herein, and will not be contained, to the
best of registrant’s knowledge, in definitive proxy or information statements incorporated by reference in Part III of this Form 10-K or any amendment to
this Form 10-K. ⌧
Indicate by check mark whether the registrant is a large accelerated filer, an accelerated filer, a non-accelerated filer, or a smaller reporting company. See the
definitions of “large accelerated filer,” “accelerated filer” and “smaller reporting company” in Rule 12b-2 of the Exchange Act.
Large accelerated filer ⌧ Accelerated filer
Non-accelerated filer (Do not check if a smaller reporting company) Smaller reporting company
Indicate by check mark whether the registrant is a shell company (as defined in Rule 12b-2 of the Exchange Act). Yes No ⌧
As of June 30, 2015, the aggregate market value of the voting stock held by non-affiliates of the registrant was $38.0 billion. For purposes of this information,
the outstanding shares of Common Stock owned by directors and executive officers of the registrant, and certain investment companies managed by Charles
Schwab Investment Management, Inc. were deemed to be shares of the voting stock held by affiliates.
The number of shares of Common Stock outstanding as of January 29, 2016, was 1,320,522,900.
DOCUMENTS INCORPORATED BY REFERENCE Part III of this Form 10-K incorporates certain information contained in the registrant’s definitive proxy statement for its annual meeting of stockholders, to be held May 17, 2016, by reference to that document.

THE CHARLES SCHWAB CORPORATION
Annual Report On Form 10-K For Fiscal Year Ended December 31, 2015
TABLE OF CONTENTS
Part I Item 1. Business 1 General Corporate Overview 1 Business Acquisitions 1 Business Strategy and Competitive Environment 1 Sources of Net Revenues 2 Products and Services 3 Regulation 5 Available Information 9 Item 1A. Risk Factors 9 Item 1B. Unresolved Securities and Exchange Commission Staff Comments 16 Item 2. Properties 16 Item 3. Legal Proceedings 17 Item 4. Mine Safety Disclosures 17 Part II Item 5. Market for Registrant’s Common Equity, Related Stockholder Matters and Issuer
Purchases of Equity Securities 18 Item 6. Selected Financial Data 20 Item 7. Management’s Discussion and Analysis of Financial Condition and Results of Operations 21 Forward-Looking Statements 21 Glossary of Terms 23 Overview 26 Current Regulatory Environment and Other Developments 28 Results of Operations 29 Risk Management 37 Liquidity 44 Fair Value of Financial Instruments 49 Critical Accounting Estimates 50 Item 7A. Quantitative and Qualitative Disclosures About Market Risk 52 Item 8. Financial Statements and Supplementary Data 54 Item 9. Changes in and Disagreements With Accountants on Accounting and Financial Disclosure 103 Item 9A. Controls and Procedures 103 Item 9B. Other Information 103 Part III Item 10. Directors, Executive Officers, and Corporate Governance 103 Item 11. Executive Compensation 105 Item 12. Security Ownership of Certain Beneficial Owners and Management and Related Stockholder Matters 105 Item 13. Certain Relationships and Related Transactions, and Director Independence 105 Item 14. Principal Accountant Fees and Services 105 Part IV Item 15. Exhibits and Financial Statement Schedule 106 Exhibit Index 107 Signatures 111 Index to Financial Statement Schedule F-1

THE CHARLES SCHWAB CORPORATION
- 1 -
PART I Item 1. Business
General Corporate Overview The Charles Schwab Corporation (CSC) is a savings and loan holding company, headquartered in San Francisco, California. CSC was incorporated in 1986 and engages, through its subsidiaries (collectively referred to as the Company), in wealth management, securities brokerage, banking, money management, custody, and financial advisory services. At December 31, 2015, the Company had $2.51 trillion in client assets, 9.8 million active brokerage accounts, 1.5 million corporate retirement plan participants, and 1.0 million banking accounts. Significant business subsidiaries of CSC include the following:
Charles Schwab & Co., Inc. (Schwab), which was incorporated in 1971, is a securities broker-dealer with over 325 domestic branch offices in 45 states, as well as a branch in each of the Commonwealth of Puerto Rico and London, England, and serves clients in Hong Kong through one of CSC’s subsidiaries;
Charles Schwab Bank (Schwab Bank), which commenced operations in 2003, is a federal savings bank located in Reno, Nevada; and
Charles Schwab Investment Management, Inc. (CSIM), which is the investment advisor for Schwab’s proprietary mutual funds, referred to as the Schwab Funds®, and Schwab’s exchange-traded funds (ETFs), referred to as the Schwab ETFs™.
The Company provides financial services to individuals and institutional clients through two segments – Investor Services and Advisor Services. The Investor Services segment provides retail brokerage and banking services, retirement plan services, and other corporate brokerage services. The Advisor Services segment provides custodial, trading, and support services as well as retirement business services. These services are further described in the segment discussion below. For financial information by segment for the three years ended December 31, 2015, see “Item 8 – Financial Statements and Supplementary Data – Notes to Consolidated Financial Statements – 24. Segment Information.” As of December 31, 2015, the Company had full-time, part-time and temporary employees, and persons employed on a contract basis that represented the equivalent of about 15,300 full-time employees. Business Acquisitions In December 2012, the Company acquired ThomasPartners®, Inc., a growth and dividend income-focused asset management firm. In September 2011, the Company acquired optionsXpress Holdings, Inc. (optionsXpress), an online brokerage firm primarily focused on equity options and futures. The optionsXpress® brokerage platform provides active investors and traders with trading tools, analytics and education to execute a variety of investment strategies. optionsXpress, Inc., a wholly-owned subsidiary of optionsXpress, is a securities broker-dealer. Business Strategy and Competitive Environment Recognizing the benefits of having a clear strategy, management has developed a framework that consists of a purpose, vision, and values guided by the Company’s “Through Clients’ Eyes” strategy. The Company’s stated purpose is to champion every client’s goals with passion and integrity, believing the best long-term strategy is one that puts clients’ perspectives, needs, and desires at the forefront. The Company’s vision is to be the most trusted leader in investment services. Because investing plays a fundamental role in building financial security, the Company strives to deliver a better investing experience for its clients – individual investors and the people and institutions who serve them – by disrupting longstanding industry practices on their behalf and providing superior service. The Company aims to offer a broad range of products and solutions to choose from, including relevant and actionable advice, with a focus on transparency and convenience. In addition, management works to leverage the Company’s scale and resources, as well as expense discipline, to help keep costs

THE CHARLES SCHWAB CORPORATION
- 2 -
low and ensure that client solutions are both affordable and responsive to needs. Finally, the Company works to be a good steward of stockholder capital and aims to maximize the Company’s value and returns over time. The Company’s competition in serving individual investors includes a wide range of brokerage, wealth management, and asset management firms, as well as banks and trust companies. In serving investors and competing for a growing percentage of the investable wealth in the United States (U.S.), the Company offers a multi-channel service delivery model, which includes online, mobile, telephone, and branch capabilities. Under this model, the Company can offer personalized service at competitive prices while giving clients the choice of where, when, and how they do business with the Company. Schwab’s branches and regional telephone service centers are staffed with trained and experienced financial consultants (FCs) focused on building and sustaining client relationships. The Company offers the ability to meet client investing needs through a single ongoing point of contact, even as those needs change over time. Management believes that the Company’s ability to provide those clients seeking help, guidance, or advice with an individually tailored solution – ranging from occasional consultations to an ongoing relationship with a Schwab FC or an independent investment advisor (IA) – is a competitive strength compared to the more fragmented or limited offerings of other firms. The Company’s online, mobile, telephone and branch channels provide quick and efficient access to an extensive array of information, research, tools, trade execution, and administrative services, which clients can access according to their needs. For example, clients that trade more actively can use these channels to access highly competitive pricing, expert tools, and extensive service capabilities – including experienced, knowledgeable teams of trading specialists and integrated product offerings. Individuals investing for retirement through 401(k) plans can take advantage of the Company’s bundled offering of multiple investment choices, education, and third-party advice. Management also believes the Company is able to compete with the wide variety of financial services firms striving to attract individual client relationships by complementing these capabilities with the extensive array of investment, banking, and lending products and services described in the section below. In the IA arena, the Company competes with institutional custodians, traditional and discount brokers, banks, investment advisory firms, and trust companies. Management believes that its Advisor Services segment can maintain its market leadership position primarily through the efforts of its sales and support teams, which are dedicated to helping IAs grow, compete, and succeed in serving their clients. In addition to focusing on superior service, Advisor Services competes by utilizing technology to provide IAs with a highly-developed, scalable platform for administering their clients’ assets easily and efficiently. Advisor Services sponsors a variety of national, regional, and local events designed to help IAs identify and implement better ways to grow and manage their practices efficiently. An important aspect of the Company’s ability to compete is its ongoing focus on efficiency and productivity, as lower costs give the Company greater flexibility in its approach to pricing and investing for growth. Management believes that this flexibility remains important in light of the competitive environment, in which a number of competitors offer reduced online trading commission rates and low expense ratios on certain classes of mutual funds and exchange-traded funds. Additionally, the Company’s nationwide marketing effort is an important competitive tool because it reinforces the attributes of the Schwab® brand. The Company’s earnings growth strategy is based upon the belief that developing trusted relationships with clients will lead to strong business performance. The Company has been and continues to be committed to offering its clients more value and a better investing experience which the Company believes will translate into more assets from both new and existing clients which ultimately drive revenue in terms of asset management and administration fees, net interest revenue and trading revenue. Sources of Net Revenues The Company’s major sources of net revenues are asset management and administration fees, net interest revenue, and trading revenue. The Company generates the majority of asset management and administration fees through its proprietary and third-party mutual fund and ETF offerings, as well as fee-based advisory solutions. A portion of asset management and administration fees comes from client cash balances placed in the Company’s money market mutual funds. Net interest revenue is the difference between interest generated on interest-earning assets and interest paid on funding sources, the majority of which is derived from client cash balances in deposit and brokerage accounts. The Company generates trading revenue through commissions earned for executing trades for clients and principal transaction revenue earned primarily from trading activity in client fixed income securities.

THE CHARLES SCHWAB CORPORATION
- 3 -
Products and Services The Company offers a broad range of products to address individuals’ varying investment and financial needs. Examples of these product offerings include the following:
Brokerage – an array of full-feature brokerage accounts with cash management capabilities; Mutual funds – third-party mutual funds through the Mutual Fund Marketplace®, including no-transaction fee
mutual funds through the Mutual Fund OneSource® service, which also includes proprietary mutual funds, plus mutual fund trading and clearing services to broker-dealers;
Exchange-traded funds – an extensive offering of ETFs, including many proprietary and third-party ETFs available without a commission through Schwab ETF OneSource™;
Advice solutions – managed portfolios of both proprietary and third-party mutual funds and ETFs, separately managed accounts, customized personal advice for tailored portfolios, and specialized planning and full-time portfolio management;
Banking – checking and savings accounts, certificates of deposit, first lien residential real estate mortgage loans (First Mortgages), home equity loans and lines of credit (HELOCs), and Pledged Asset Lines® (PALs); and
Trust – trust custody services, personal trust reporting services, and administrative trustee services. The Company’s full array of investing services are made available through its two segments – Investor Services and Advisor Services. The Company’s major sources of revenues are generated by both of the Company’s reportable segments. Revenue is attributable to a reportable segment based on which segment has the primary responsibility for serving the client. The accounting policies of the Company’s reportable segments are the same as those described in “Item 8 – Financial Statements and Supplementary Data – Notes to Consolidated Financial Statements – 2. Summary of Significant Accounting Policies.” For financial information related to the Company’s reportable segments, see “Item 7 – Management’s Discussion and Analysis of Financial Condition and Results of Operations – Results of Operations – Segment Information” and “Item 8 – Financial Statements and Supplementary Data – Notes to the Consolidated Financial Statements – 24. Segment Information.” Investor Services Through the Investor Services segment, the Company provides retail brokerage and banking services, retirement plan services, and other corporate brokerage services. The Company offers research, analysis tools, online portfolio planning tools, performance reports, market analysis, and educational material to all clients. Schwab’s FCs can provide wealth management and financial planning assistance to clients to help them reach their financial goals. Investors looking for more guidance have access to professional advice from Schwab’s portfolio consultants who can help develop an investment strategy and carry out investment and portfolio management decisions, as well as a range of fully delegated managed solutions that provide ongoing portfolio management. Schwab strives to educate and assist clients in reaching their financial goals. Educational tools include workshops, interactive courses, and online information about investing, from which Schwab does not earn revenue. Additionally, Schwab provides various online research and analysis tools that are designed to help clients achieve better investment outcomes. As an example of such tools, Schwab Equity Ratings® is a quantitative model-based stock rating system that provides all clients with ratings on approximately 3,000 stocks, assigning each equity a single grade: A, B, C, D, or F. Schwab Equity Ratings International®, an international ranking methodology, covers approximately 4,000 stocks in 27 foreign equity markets. Clients may need specific investment recommendations, either from time to time or on an ongoing basis. The Company provides clients seeking advice with personalized solutions. The Company’s approach to advice is based on long-term investment strategies and guidance on portfolio diversification and asset allocation. This approach is designed to be offered consistently across all of Schwab’s delivery channels. Schwab Private Client™ features a personal advice relationship with a designated portfolio consultant, supported by a team of investment professionals who provide individualized service, a customized investment strategy developed in collaboration with the client, and ongoing guidance and execution. For clients seeking a relationship in which investment decisions are fully delegated to a financial professional, the Company offers several alternatives. The Company provides investors access to professional investment management in a diversified account that is invested exclusively in either mutual funds or ETFs through the Schwab Managed Portfolios™ and Windhaven Investment Management, Inc. (Windhaven®), or equity securities through ThomasPartners® programs. The
THE CHARLES SCHWAB CORPORATION
- 4 -
Company also refers investors who want to utilize a specific third-party money manager to direct a portion of their investment assets to the Schwab Managed Account program. In addition, clients who want the assistance of an independent professional in managing their financial affairs may be referred to IAs in the Schwab Advisor Network®. These IAs provide personalized portfolio management, financial planning, and wealth management solutions. To meet the specific needs of clients who trade actively, Schwab and optionsXpress, Inc. both offer integrated web- and software-based trading platforms, which incorporate intelligent order routing technology, real-time market data, options trading, premium stock or futures research, and multi-channel access, as well as sophisticated account and trade management features, risk management tools, decision support tools, and dedicated personal support. For U.S. clients wishing to invest in foreign equities, the Company offers a suite of global investing capabilities, including online access to certain foreign equity markets with the ability to trade in their local currencies. In addition, the Company serves both foreign investors and non-English-speaking U.S. clients who wish to trade or invest in U.S. dollar-based securities. In the U.S., the Company serves Mandarin-, Cantonese-, Spanish-, and Vietnamese-speaking clients through a combination of its branch offices and Web-based and telephonic services. The Investor Services segment also includes the Retirement Plan Services, Stock Plan Services, Compliance Solutions, Mutual Fund Clearing Services and Off-Platform Sales business units. Retirement Plan Services offers a bundled 401(k) retirement plan product that provides plan sponsors a wide array of investment options, trustee or custodial services, and participant-level recordkeeping. Plan design features, which increase plan efficiency and achieve employer goals, are also offered, such as automatic enrollment, automatic fund mapping at conversion, and automatic contribution increases. The Company offers Schwab Index Advantage®, a unique 401(k) plan utilizing low cost index mutual funds and ETFs, combined with a managed investing service to help participants reach their retirement goals. Services also include support for Roth 401(k) accounts, profit sharing and defined benefit plans. The Company provides a robust suite of tools to plan sponsors to manage their plans, including plan-specific reports, studies and research, access to legislative updates and benchmarking reports that provide perspective on their plan’s features compared with overall industry and segment-specific plans. Participants in bundled plans serviced by the Company receive targeted education materials, have access to electronic tools and resources, may attend onsite and virtual seminars, and can receive third-party advice delivered by Schwab. This third-party advice service is delivered online, by phone, or in person, including recommendations based on the core investment fund choices in their retirement plan and specific recommended savings rates. Stock Plan Services offers equity compensation plan sponsors full-service recordkeeping for stock plans, stock options, restricted stock, performance shares and stock appreciation rights. Specialized services for executive transactions and reporting, grant acceptance tracking, and other services are offered to employers to meet the needs of administering the reporting and compliance aspects of an equity compensation plan. Compliance Solutions provides solutions for compliance departments of regulated companies and firms with special requirements to monitor employee personal trading, including trade surveillance technology. Mutual Fund Clearing Services provides mutual fund clearing services and recordkeeping to banks, brokerage firms and trust companies. Off-Platform Sales offers proprietary mutual funds, ETFs, and collective trust funds outside the Company. Advisor Services Through the Advisor Services segment, the Company provides custodial, trading, and support services as well as retirement business services. To attract and serve IAs, the Company has a dedicated sales force and service teams assigned to meet their needs. IAs who custody client accounts at Schwab may use proprietary software that provides them with up-to-date client account information, as well as trading capabilities. The Advisor Services website is the core platform for IAs to conduct daily business activities online with Schwab, including viewing and managing client account information and accessing news and market information. The website provides account servicing capabilities for IAs, including account opening, money movement, transfer of assets, trading, checking status and communicating with the Schwab service team. The site provides multi-year archiving of statements, trade confirms, and tax reports, along with document search capabilities.

THE CHARLES SCHWAB CORPORATION
- 5 -
To help IAs grow and manage their practices, the Company offers a variety of services, including business management and technology and operations consulting on a variety of topics critical to an IA’s success including strategic business planning, client segmentation, growth strategies, technological strategies and succession planning. The Advisor Services website provides interactive tools, educational content, and research reports to assist advisors thinking about establishing and managing their own independent practices. The Company offers an array of services to help advisors establish their own independent practices through the Business Start-up Solutions package. These services include access to dedicated service teams and outsourcing of back-office operations, as well as third-party firms who provide assistance with real estate, errors and omissions insurance, and company benefits. The Company offers a variety of educational materials, programs, and events to IAs seeking to expand their knowledge of industry issues and trends, as well as sharpen their individual expertise and practice management skills. The Company updates and shares market research on an ongoing basis, and it holds a series of events and conferences every year to discuss topics of interest to IAs, including business strategies and best practices. The Company sponsors the annual IMPACT® conference, which provides a national forum for the Company, IAs, and other industry participants to gather and share information and insights, as well as a multitude of smaller events across the country each year. IAs and their clients have access to a broad range of the Company’s products and services, including individual securities, mutual funds, ETFs, managed accounts, and cash products. The Advisor Services segment also includes the Retirement Business Services and Corporate Brokerage Retirement Services business units. Retirement Business Services provides trust, custody, and retirement business services to independent retirement plan advisors and independent recordkeepers. Plan assets are held at the Business Trust division of Schwab Bank. The Company and independent retirement plan providers work together to serve plan sponsors, combining the consulting and administrative expertise of the administrator with the Company’s investment, technology, trust, and custodial services. Retirement Business Services also offers the Schwab Personal Choice Retirement Account®, a self-directed brokerage offering for retirement plans. Corporate Brokerage Retirement Services serves plan sponsors, advisors and independent recordkeepers seeking a brokerage-based account to hold retirement plan assets. Plans held at Schwab are either self-trusteed or trusteed by a separate, independent trustee. Corporate Brokerage Retirement Services also offers the Schwab Personal Choice Retirement Account®, and the Company Retirement Account, both of which are self-directed brokerage-based solutions designed to hold the assets of company-sponsored retirement plans. Regulation As a participant in the securities, banking and financial services industries, the Company is subject to extensive regulation under both federal and state laws by governmental agencies, supervisory authorities, and self-regulatory organizations (SROs). The Company is also subject to oversight by regulatory bodies in other countries in which the Company operates. These regulations affect the Company’s business operations and impose capital, client protection and market conduct requirements. The financial services industry has been subject to enhanced levels of regulatory oversight in recent years, and the Company expects this trend to continue for the foreseeable future. As a result of the enactment of the Dodd-Frank Wall Street Reform and Consumer Protection Act in 2010 (Dodd-Frank), the adoption of implementing regulations by the federal regulatory agencies, and other recent regulatory reforms, the Company has experienced significant changes in the laws and regulations that apply to it, how it is regulated, and regulatory expectations in the areas of compliance, risk management, corporate governance, operations, capital and liquidity. Holding Company and Bank Regulation CSC is a savings and loan holding company and Schwab Bank, CSC’s depository institution subsidiary, is a federal savings bank. CSC is regulated, examined and supervised by the Board of Governors of the Federal Reserve System (Federal Reserve), and Schwab Bank is regulated, examined and supervised by the Office of the Comptroller of the Currency (OCC),

THE CHARLES SCHWAB CORPORATION
- 6 -
the Consumer Financial Protection Bureau (CFPB), and the Federal Deposit Insurance Corporation (FDIC). CSC and Schwab Bank are also subject to regulation and various requirements and restrictions under state and other federal laws. This regulatory structure establishes a comprehensive framework designed to protect depositors and consumers, the safety and soundness of depository institutions and their holding companies, and the stability of the banking system as a whole. This framework affects the activities and investments of CSC, Schwab Bank and CSC’s non-bank subsidiaries and gives the regulatory authorities broad discretion in connection with their supervisory, examination and enforcement activities and policies. Financial Regulatory Reform As a result of the enactment of Dodd-Frank, the adoption by the federal banking agencies of implementing regulations and other regulatory reforms, the financial services industry is currently experiencing a period of unprecedented change in financial regulation. The changes that have been enacted under Dodd-Frank and other regulatory reforms that are significant for CSC and Schwab Bank are highlighted below. Basel III Capital and Liquidity Framework In July 2013, the U.S. Federal banking agencies finalized a rule to implement strengthened regulatory capital requirements for U.S. banking organizations consistent with Basel III (Final Regulatory Capital Rules). The Final Regulatory Capital Rules established Common Equity Tier 1 (CET1) Capital as a new capital standard, increased minimum required risk-based capital ratios, narrowed the eligibility criteria for regulatory capital instruments, provided for new regulatory capital deductions and adjustments, and modified methods for calculating risk-weighted assets (the denominator of risk-based capital ratios). See “Item 7 – Management’s Discussion and Analysis of Financial Condition and Results of Operations – Liquidity” and “Capital Management,” and “Item 8 – Financial Statements and Supplementary Data – Notes to Consolidated Financial Statements – 23. Regulatory Requirements” for the new capital ratio requirements. The Final Regulatory Capital Rules provided for a one-time election which CSC and Schwab Bank made to exclude accumulated other comprehensive income (AOCI) from the calculation of CET1 Capital. The Final Regulatory Capital Rules also introduced a capital conservation buffer that limits a banking organization’s ability to make capital distributions and discretionary bonus payments to executive officers if a banking organization fails to maintain a capital conservation buffer of more than 2.5%, on a fully phased-in basis, in excess of all of its minimum risk-based capital ratio requirements. The Final Regulatory Capital Rules provide for a “standardized approach” framework for the calculation of a banking organization’s regulatory capital and risk-weighted assets. Depository institutions and their holding companies with consolidated total assets of $250 billion or more, or total on-balance-sheet foreign exposures of $10 billion or more, are also required to calculate their regulatory capital requirements using an “advanced approaches” framework to determine their risk-weighted assets. Such companies must also maintain a minimum supplementary leverage ratio of at least 3.0% and are subject to certain other enhanced provisions. CSC and Schwab Bank are currently only subject to the “standardized approach” framework. The new capital requirements under the Final Regulatory Capital Rules became effective on January 1, 2015, for CSC, which had not previously been subject to any consolidated capital requirements, and Schwab Bank. The required minimum capital conservation buffer is being phased in incrementally; it started at .625% on January 1, 2016 and will increase to 1.25% on January 1, 2017, 1.875% on January 1, 2018 and 2.5% on January 1, 2019. In September 2014, U.S. Federal banking agencies issued an inter-agency final rule that imposes a quantitative liquidity coverage ratio (LCR) requirement on large banking organizations. The purpose of the LCR is to require banking organizations to hold minimum amounts of high-quality liquid assets (HQLA) based on a percentage of their projected net cash outflows over a 30-day period. Banking organizations with $250 billion or more in total consolidated assets or foreign exposures of $10 billion or more must hold HQLA in an amount equal to at least 100% of their projected net cash outflows over a 30-day period. Other bank and savings and loan holding companies with total consolidated assets of $50 billion or more, such as CSC, are subject to a modified LCR rule requiring them to hold HQLA in an amount equal to at least 70% of their projected net cash outflows over a 30-day period. The modified LCR rule went into effect on January 1, 2016, with holding companies subject to the rule required to hold at least 90% of the necessary amount of HQLA in 2016 and at least 100% starting on January 1, 2017.

THE CHARLES SCHWAB CORPORATION
- 7 -
Capital Stress Testing In October 2012, the OCC issued final rules implementing provisions of Dodd-Frank that require national banks and federal savings banks with total consolidated assets of more than $10 billion to conduct annual company-run stress tests. Under the Dodd-Frank Act Stress Test (D-FAST) rules, Schwab Bank must conduct annual stress tests using certain scenarios and prescribed stress-testing methodologies, report the results to the OCC and the Federal Reserve and publish a summary of the results of its stress tests. In March 2015, Schwab Bank submitted its company-run stress test results to the OCC. In June 2015 Schwab Bank publicly disclosed a summary of its stress test results under the severely adverse scenario prescribed by the OCC based upon a nine-quarter timeframe beginning on October 1, 2014 and ending on December 31, 2016. In its summary, Schwab Bank reported that its 7.2% Tier 1 leverage ratio at the beginning of the forecast period declined to a low of 6.5% during the nine-quarter forecast horizon and was 7.0% at the end. Under the final Federal Reserve D-FAST regulations, CSC will be required to conduct its first stress test using financial statement data as of December 31, 2016, report the results of that stress test to the Federal Reserve by April 5, 2017, and publicly disclose a summary of its stress test results between June 15 and June 30, 2017. CSC is not subject to the annual Comprehensive Capital Analysis and Review (CCAR) process, which requires certain financial institutions to submit annual capital plans to the Federal Reserve. However, CSC is taking steps to implement policies, procedures, systems and governance structures that are designed to be consistent with regulatory expectations for a firm of its size and complexity. Insured Depository Institution Resolution Plans In September 2011 and January 2012, the FDIC issued interim final and final rules requiring insured depository institutions with total consolidated assets of $50 billion or more to submit to the FDIC periodic plans providing for their resolution by the FDIC in the event of failure (resolution plans or so-called “living wills”) under the receivership and liquidation provisions of the Federal Deposit Insurance Act. Under these rules, Schwab Bank is required to file with the FDIC an annual resolution plan demonstrating how the bank could be resolved in an orderly and timely manner in the event of receivership such that the FDIC would be able: to ensure that the bank’s depositors receive access to their deposits within one business day; to maximize the net present value of the bank’s assets when disposed of; and to minimize losses incurred by the bank’s creditors. Schwab Bank submitted its most recent resolution plan to the FDIC on December 31, 2015. Consumer Financial Protection In July 2011, pursuant to Dodd-Frank, the CFPB began operations and was given rulemaking authority for a wide range of federal consumer protection laws as well as broad powers to supervise compliance with and enforce those laws. As a federal savings bank with $10 billion or more in consolidated total assets, Schwab Bank is subject to examination, supervision and regulation by the CFPB. The CFPB has proposed and finalized many consumer protection rules since its creation and has authority to promulgate regulations, issue orders, draft policy statements, conduct examinations and bring enforcement actions. The creation of the CFPB has led to enhanced enforcement of consumer protection laws. Although the ultimate impact of this heightened scrutiny is uncertain, it could result in changes to pricing, practices, products and procedures. Deposit Insurance Assessments The FDIC’s Deposit Insurance Fund (DIF) provides insurance coverage for certain deposits, generally up to $250,000 per depositor per account ownership type, and is funded by quarterly assessments on insured depository institutions. In February 2011, the FDIC established a risk-based deposit premium assessment system that, for large insured depository institutions with at least $10 billion in total consolidated assets, such as Schwab Bank, uses a scorecard method based on a number of factors, including the institution’s regulatory ratings, asset quality and brokered deposits. The deposit insurance assessment base is calculated as average consolidated total assets minus average tangible equity. The Dodd-Frank Act (i) raised the minimum reserve ratio for the DIF to 1.35% (from the former minimum of 1.15%) and (ii) required that the DIF’s reserve ratio reach 1.35% by September 30, 2020. In October 2015, the FDIC issued a proposed rule that would impose a flat-rate surcharge on the quarterly assessments of insured depository institutions with total assets of $10 billion or more to pay for the increase. See “Item 7 – Management’s Discussion and Analysis of Financial Condition and Results of Operations – Current Regulatory Environment and Other Developments.”

THE CHARLES SCHWAB CORPORATION
- 8 -
Community Reinvestment Act The Community Reinvestment Act of 1977 (CRA) requires Schwab Bank’s primary federal bank regulatory agency, the OCC, to assess the bank’s record in meeting the credit needs of the communities served by the bank, including low- and moderate-income neighborhoods and persons. Institutions are assigned one of four ratings: “Outstanding,” “Satisfactory,” “Needs to Improve” or “Substantial Noncompliance.” This assessment is reviewed in connection with any acquisition, merger or branch office application. Source of Strength The Dodd-Frank Act codified the Federal Reserve’s long-held position that a depository institution holding company must serve as a source of financial strength for its subsidiary depository institutions, the so-called “source of strength doctrine.” In effect, the holding company may be compelled to commit resources to support the subsidiary in the event the subsidiary is in financial distress. It is anticipated that in 2016 the Federal Reserve will issue guidance as to how it will implement and apply the doctrine in situations where a holding company’s depository institution subsidiaries are in a troubled condition. Broker-Dealer and Investment Advisor Regulation CSC’s principal broker-dealers are Schwab and optionsXpress, Inc. Schwab is registered as a broker-dealer with the United States Securities and Exchange Commission (SEC), the fifty states, the District of Columbia and Puerto Rico. optionsXpress, Inc. is registered as a broker-dealer with the SEC, the fifty states, the District of Columbia, Puerto Rico, and the Virgin Islands. Schwab and CSIM are registered as investment advisors with the SEC. Additionally, Schwab and optionsXpress, Inc. are regulated by the Commodities Futures Trading Commission (CFTC) with respect to the commodity futures and commodities trading activities they conduct as an introducing broker and futures commission merchant, respectively. Much of the regulation of broker-dealers has been delegated to SROs. Schwab is a member of the Financial Industry Regulatory Authority, Inc. (FINRA), the Municipal Securities Rulemaking Board (MSRB), NYSE Arca, and the Chicago Board Options Exchange. optionsXpress, Inc. is also a member of FINRA and the MSRB. In addition to the SEC, the primary regulators of Schwab and optionsXpress, Inc. are FINRA and, for municipal securities, the MSRB. The National Futures Association (NFA) is Schwab and optionsXpress, Inc.’s primary regulator for futures and commodities trading activities. The principal purpose of regulating broker-dealers and investment advisors is the protection of clients and the securities markets. The regulations cover all aspects of the securities business, including, among other things, sales and trading practices, publication of research, margin lending, uses and safekeeping of clients’ funds and securities, capital adequacy, recordkeeping and reporting, fee arrangements, disclosure to clients, fiduciary duties owed to advisory clients, and the conduct of directors, officers and employees. Schwab and optionsXpress, Inc. are both subject to Rule 15c3-1 under the Securities Exchange Act of 1934 (the Uniform Net Capital Rule) and related SRO requirements. The CFTC and NFA also impose net capital requirements. The Uniform Net Capital Rule specifies minimum capital requirements that are intended to ensure the general financial soundness and liquidity of broker-dealers. CSC itself is not a registered broker-dealer and it is not subject to the Uniform Net Capital Rule. However, if Schwab fails to maintain specified levels of net capital, such failure could constitute a default by CSC of certain debt covenants under its credit agreement. The Uniform Net Capital Rule prohibits a broker-dealer subsidiary from paying cash dividends, or making unsecured advances or loans to its parent company or repaying subordinated loans to its parent company if such payment would result in a net capital amount of less than 5% of aggregate debit balances or less than 120% of its minimum dollar requirement of $250,000. In addition to net capital requirements, as self-clearing broker-dealers, Schwab and optionsXpress, Inc. are subject to cash deposit and collateral requirements with clearing houses, such as the Depository Trust & Clearing Corporation and Options Clearing Corporation, which may fluctuate significantly from time to time based upon the nature and size of clients’ trading activity and market volatility.

THE CHARLES SCHWAB CORPORATION
- 9 -
Financial Service Regulation Bank Secrecy Act of 1970 and USA PATRIOT Act of 2001 CSC and its subsidiaries that conduct financial services activities are subject to the Bank Secrecy Act of 1970 (BSA), as amended by the USA PATRIOT Act of 2001, which requires financial institutions to develop and implement programs reasonably designed to achieve compliance with these regulations. The BSA and USA PATRIOT Act include a variety of monitoring, record-keeping and reporting requirements (such as currency transaction reporting and suspicious activity reporting), as well as identity verification and client due diligence requirements which are intended to detect, report and/or prevent money laundering and the financing of terrorism. In addition, CSC and various subsidiaries of the Company are subject to U.S. sanctions programs administered by the Office of Foreign Assets Control. For additional information on Regulation, please see “Item 7 – Management’s Discussion and Analysis of Financial Condition and Results of Operations – Liquidity” and “Capital Management,” and “Item 8 – Financial Statements and Supplementary Data – Notes to Consolidated Financial Statements – 23. Regulatory Requirements.” Available Information The Company files annual, quarterly, and current reports, proxy statements, and other information with the SEC. The Company’s SEC filings are available to the public over the Internet on the SEC’s website at http://www.sec.gov. You may read and copy any document that the Company files with the SEC at the SEC’s Public Reference Room at 100 F Street, NE, Washington, DC 20549. You may obtain information on the operation of the Public Reference Room by calling the SEC at 1-800-SEC-0330. On the Company’s website, http://www.aboutschwab.com, the Company posts the following filings after they are electronically filed with or furnished to the SEC: the Company’s annual reports on Form 10-K, the Company’s quarterly reports on Form 10-Q, the Company’s current reports on Form 8-K, and any amendments to those reports filed or furnished pursuant to Section 13(a) or 15(d) of the Securities Exchange Act of 1934. In addition, the Company’s website also includes the Dodd-Frank stress test results for Schwab Bank and the Company’s regulatory capital disclosures based on Basel III. All such filings are available free of charge either on the Company’s website or by request via email ([email protected]), telephone (415-667-1959), or mail (Charles Schwab Investor Relations at 211 Main Street, San Francisco, CA 94105). Item 1A. Risk Factors
The Company faces a variety of risks that may affect its operations or financial results, and many of those risks are driven by factors that the Company cannot control or predict. The following discussion addresses those risks that management believes are the most significant, although there may be other risks that could arise, or may prove to be more significant than expected, that may affect the Company’s operations or financial results. For a discussion of the Company’s risk management, including operational risk, credit risk, market risk, liquidity risk, compliance risk, and legal risk, see “Item 7 – Management’s Discussion and Analysis of Financial Condition and Results of Operations – Risk Management.” Developments in the business, economic, and geopolitical environment could negatively impact the Company’s business. The Company’s business can be adversely affected by the general environment – economic, corporate, securities market, regulatory, and geopolitical developments all play a role in client asset valuations, trading activity, interest rates and overall investor engagement, and are outside of the Company’s control. Deterioration in the housing and credit markets, reductions

THE CHARLES SCHWAB CORPORATION
- 10 -
in short-term interest rates, and decreases in securities valuations negatively impact the Company’s results of operations and capital resources. Extensive regulation of the Company’s businesses affects the Company’s activities and may subject it to significant penalties. As a participant in the securities, banking and financial services industries, the Company is subject to extensive regulation under both federal and state laws by governmental agencies, supervisory authorities and SROs. Such regulation continues to grow more extensive and complex, the costs and uncertainty related to complying with such regulations continue to increase, and regulatory proceedings continue to become more frequent and sanctions more severe. The requirements imposed by the Company’s regulators are designed to ensure the integrity of the financial markets, the safety and soundness of financial institutions and the protection of clients. These regulations affect the Company’s business operations and impose capital, client protection and market conduct requirements. In addition to specific banking laws and regulations, the Company’s banking regulators have broad discretion in connection with their supervisory and enforcement activities and examination policies and could require CSC and/or Schwab Bank to hold more capital, increase liquidity or limit their ability to pay dividends or CSC’s ability to repurchase shares. The banking regulators could also limit the Company’s ability to grow, including adding assets, launching new products, and undertaking strategic investments, could limit Schwab Bank’s ability to accept deposits swept from the client brokerage accounts and could prevent the Company from pursuing its business strategy. Despite the Company’s efforts to comply with applicable legal requirements, there are a number of risks, particularly in areas where applicable laws or regulations may be unclear or where regulators could revise their previous guidance. Any enforcement actions or other proceedings brought by the Company’s regulators against the Company or its affiliates, officers or employees could result in fines, penalties, cease and desist orders, enforcement actions, suspension or expulsion, or other disciplinary sanctions, including limitations on the Company’s business activities, any of which could harm the Company’s reputation and adversely affect the Company’s results of operations and financial condition. While the Company maintains systems and procedures designed to ensure that it complies with applicable laws and regulations, violations could occur. In addition, some legal/regulatory frameworks provide for the imposition of fines or penalties for noncompliance even though the noncompliance was inadvertent or unintentional and even though systems and procedures reasonably designed to prevent violations were in place at the time. There may be other negative consequences resulting from a finding of noncompliance, including restrictions on certain activities. Such a finding may also damage the Company’s reputation and its relationships with its regulators and could restrict the ability of institutional investment managers to invest in the Company’s securities. Legislation or changes in rules and regulations could negatively affect the Company’s business and financial results. New legislation, rules, regulations and guidance, or changes in the interpretation or enforcement of existing federal, state and SRO rules, regulations and guidance, including changes relating to mutual funds, broker-dealer fiduciary duties and regulatory treatment of deposit accounts may directly affect the operation and profitability of the Company or its specific business lines. The profitability of the Company could also be affected by rules and regulations that impact the business and financial communities generally, including changes to the laws governing taxation, electronic commerce, client privacy and security of client data. In addition, the rules and regulations could result in limitations on the lines of business the Company conducts, modifications to the Company’s business practices, increased capital requirements or additional costs. Financial reforms and related regulations may affect the Company’s business activities, financial position and profitability. There have been extensive changes to the laws regulating financial services firms as a result of the enactment of Dodd-Frank and the adoption by the federal banking agencies of regulations implementing Dodd-Frank and other reforms such as Basel III. Among the changes that are most likely to impact the Company’s business and financial results are: increased capital, liquidity and reporting requirements; increased deposit insurance assessments; the establishment of the CFPB, which has broad rulemaking, supervisory and enforcement authority over consumer financial products; the requirement for Schwab Bank (and CSC starting in 2017) to conduct annual capital adequacy stress tests; and discretion given to the SEC to adopt

THE CHARLES SCHWAB CORPORATION
- 11 -
rules regarding standards of conduct for broker-dealers providing investment advice to retail clients. The Company has incurred and will continue to incur significant additional costs and expend a significant amount of time as it develops and integrates appropriate systems and procedures, and then monitors, supports and refines those systems and procedures. While U.S. banking regulators have finalized many regulations to implement various provisions of Dodd-Frank and Basel III, implementation of the legislation is ongoing and significant rule-making and interpretations remain to be completed. For example, rules relating to a minimum net stable funding ratio, which will require financial institutions to have a stable funding structure over a one-year horizon, have not yet been proposed. Future regulatory changes or revised guidance and interpretations may impact the profitability of the Company’s business activities, require changes to certain of its business practices, impose upon the Company more stringent capital, liquidity and leverage ratio requirements or otherwise adversely affect the Company’s ability to pursue its business strategies. These changes may also require the Company to invest significant management attention and resources to evaluate and make necessary changes to its compliance, risk management and operations functions. Failure to meet capital adequacy and liquidity guidelines could affect the Company’s financial condition. CSC, together with Schwab Bank and its broker-dealer subsidiaries, must meet certain capital and liquidity standards, subject to qualitative judgments by regulators about components, risk weightings and other factors. The Uniform Net Capital Rule limits Schwab’s ability to transfer capital to CSC and other affiliates. New regulatory capital, liquidity, and stress testing requirements may limit or otherwise restrict how the Company utilizes its capital, including paying dividends and stock repurchases, and may require the Company to increase its capital and/or liquidity or to limit its growth. Any requirement that the Company increase its regulatory capital, replace certain capital instruments which presently qualify as Tier 1 capital, or increase regulatory capital ratios or liquidity, could require the Company to liquidate assets, deleverage or otherwise change its business and/or investment plans, which may adversely affect its financial results. Issuing additional common stock would dilute the ownership of existing stockholders. If the Company’s consolidated total assets equal or exceed $250 billion, the Company would become subject to the advanced approaches framework of the Basel III capital and liquidity requirements, including being subject to a supplementary leverage ratio, the inclusion of AOCI in regulatory capital, and the unmodified LCR and enhanced Basel III disclosures. In addition, federal banking agencies have broad discretion and could require CSC or Schwab Bank to hold higher levels of capital or increase liquidity above the applicable regulatory requirements. In July 2013, the Federal Reserve and OCC issued Final Regulatory Capital Rules, which established more restrictive capital definitions, higher risk-weightings for certain asset classes, higher minimum capital ratios and capital buffers. Failure by either CSC or Schwab Bank to meet its minimum capital requirements could result in certain mandatory, and additional discretionary, actions by regulators that, if undertaken, could have a negative impact on the Company. In addition, failure by CSC or Schwab Bank to maintain a sufficient amount of capital to satisfy its capital conservation buffer requirements (as phased in) would result in restrictions on the Company’s ability to make capital distributions and discretionary cash bonus payments to executive officers. Further, in September 2014, the Federal Reserve issued a modified LCR that requires CSC to maintain a sufficient amount of HQLA in relation to total projected net cash outflows over a 30-day stress period. For a discussion of the Company’s Liquidity and Capital Management, see “Item 7 – Management’s Discussion and Analysis of Financial Condition and Results of Operations – Liquidity” and “Capital Management,” and “Item 8 – Financial Statements and Supplementary Data – Notes to the Consolidated Financial Statements – 23. Regulatory Requirements.” Technology and operational failures or errors could subject the Company to losses, litigation, and regulatory actions. The Company faces operational risk, which is the potential for loss due to inadequate or failed internal processes, systems, and firms or exchanges handling client orders, or from external events and relationships impacting the Company and/or any of its key business partners and vendors. This risk also includes the risk of human error, execution errors, errors in models such as those used for asset management, capital planning and management, risk management, stress testing and compliance, employee misconduct, unauthorized trading, external fraud, computer viruses, distributed denial of service attacks, terrorist attacks, natural disaster, power outage, capacity constraints, software flaws and similar events. For example, the Company and other financial institutions have been the target of various denial of service attacks that have, in certain circumstances,
THE CHARLES SCHWAB CORPORATION
- 12 -
made websites, mobile applications and email unavailable for periods of time. It could take an extended period of time to restore full functionality to the Company’s technology or other operating systems in the event of an unforeseen event which could affect the Company’s ability to process and settle client transactions. Moreover, instances of fraud or other misconduct, might also negatively impact the Company’s reputation and client confidence in the Company, in addition to any direct losses that might result from such instances. Despite the Company’s efforts to identify areas of risk, oversee operational areas involving risk, and implement policies and procedures designed to manage these risks, there can be no assurance that the Company will not suffer unexpected losses, reputational damage or regulatory action due to technology or other operational failures or errors, including those of its vendors or other third parties. While the Company devotes substantial attention and resources to the reliability, capacity and scalability of its systems, extraordinary trading volumes could cause the Company’s computer systems to operate at unacceptably slow speeds or even fail, affecting the Company’s ability to process client transactions and potentially resulting in some clients’ orders being executed at prices they did not anticipate. Disruptions in service and slower system response times could result in substantial losses and decreased client satisfaction. The Company is also dependent on the integrity and performance of securities exchanges, clearing houses and other intermediaries to which client orders are routed for execution and settlement. Systems failures and constraints and transaction errors at such intermediaries could result in delays and erroneous or unanticipated execution prices, cause substantial losses for the Company and for its clients, and subject the Company to claims from its clients for damages. A significant decrease in the Company’s liquidity could negatively affect the Company’s business and financial management as well as reduce client confidence in the Company. Maintaining adequate liquidity is crucial to the business operations of the Company, including margin lending, mortgage lending, and transaction settlement, among other liquidity needs. The Company meets its liquidity needs primarily through cash generated by client activity and operating earnings, as well as cash provided by external financing. Fluctuations in client cash or deposit balances, as well as changes in regulatory treatment of client deposits or market conditions, may affect the Company’s ability to meet its liquidity needs. A reduction in the Company’s liquidity position could reduce client confidence in the Company, which could result in the loss of client accounts, or could cause the Company to fail to satisfy its liquidity requirements. In addition, if the Company’s broker-dealer or depository institution subsidiaries fail to meet regulatory capital guidelines, regulators could limit the subsidiaries’ operations or their ability to upstream funds to CSC, which could reduce CSC’s liquidity and adversely affect its ability to repay debt and pay cash dividends. In addition, CSC may need to provide additional funding to such subsidiaries. Factors which may adversely affect the Company’s liquidity position include fluctuations in cash held in banking or brokerage client accounts, a dramatic increase in the Company’s client lending activities (including margin, mortgage-related, and personal lending), unanticipated outflows of company cash, increased capital requirements, changes in regulatory guidance or interpretations, other regulatory changes, or a loss of market or client confidence in the Company. Schwab may also experience temporary liquidity demands due to timing differences between brokerage transaction settlements and the availability of segregated cash balances. When cash generated by client activity and operating earnings is not sufficient for the Company’s liquidity needs, the Company must seek external financing. During periods of disruptions in the credit and capital markets, potential sources of external financing could be reduced, and borrowing costs could increase. Although CSC and Schwab maintain committed and uncommitted, unsecured bank credit lines and CSC has a commercial paper issuance program, as well as a universal shelf registration statement filed with the SEC which can be used to sell securities, financing may not be available on acceptable terms or at all due to market conditions or disruptions in the credit markets. In addition, a significant downgrade in the Company’s credit ratings could increase its borrowing costs and limit its access to the capital markets. The Company may suffer significant losses from its credit exposures. The Company’s businesses are subject to the risk that a client, counterparty or issuer will fail to perform its contractual obligations, or that the value of collateral held to secure obligations will prove to be inadequate. While the Company has policies and procedures designed to manage this risk, the policies and procedures may not be fully effective. The Company’s exposure mainly results from margin lending, clients’ options trading, securities lending, mortgage lending, pledged asset
THE CHARLES SCHWAB CORPORATION
- 13 -
lending, its role as a counterparty in financial contracts and investing activities, and indirectly from the investing activities of certain of the proprietary funds the Company sponsors. When clients purchase securities on margin, borrow on lines of credit collateralized by securities, or trade options or futures, the Company is subject to the risk that clients may default on their obligations when the value of the securities and cash in their accounts falls below the amount of clients’ indebtedness. Abrupt changes in securities valuations and the failure of clients to meet margin calls could result in substantial losses. The Company has exposure to credit risk associated with its securities available for sale and securities held to maturity portfolios, which include U.S. agency and non-agency mortgage-backed securities, asset-backed securities, corporate debt securities, U.S. agency notes, certificates of deposit, and commercial paper among other investments. These instruments are also subject to price fluctuations as a result of changes in the financial market’s assessment of issuer credit quality, increases in the unemployment rate, delinquency and default rates, housing price declines, changes in prevailing interest rates and other economic factors. A failure to raise the U.S. debt limit and/or a downgrade of the U.S. government’s credit rating could decrease the value of the Company’s securities in both the available for sale and held to maturity portfolios. Loss of value of securities available for sale and securities held to maturity can negatively affect earnings if management determines that such securities are other than temporarily impaired. The evaluation of whether other-than-temporary impairment (OTTI) exists is a matter of judgment, which includes the assessment of several factors. If management determines that a security is other-than-temporarily impaired, the cost basis of the security may be adjusted and a corresponding loss may be recognized in current earnings. Deterioration in the performance of securities available for sale and securities held to maturity could result in the recognition of future impairment charges. See “Item 7 – Management’s Discussion and Analysis of Financial Condition and Results of Operations – Critical Accounting Estimates.” The Company’s bank loans primarily consist of First Mortgages, HELOCs, and PALs. Increases in delinquency and default rates, housing and stock price declines, increases in the unemployment rate, and other economic factors can result in charges for loan loss reserves and write downs on such loans. Heightened credit exposures to specific counterparties or instruments (concentration risk) can increase the Company’s risk of loss. Examples of the Company’s credit concentration risk include:
large positions in financial instruments collateralized by assets with similar economic characteristics or in securities of a single issuer or industry;
mortgage loans and HELOCs to banking clients which are secured by properties in the same geographic region; and margin, pledged asset, and securities lending activities collateralized by securities of a single issuer or industry.
The Company may also be subject to concentration risk when lending to a particular counterparty, borrower or issuer. The Company sponsors a number of proprietary money market mutual funds and other proprietary funds. Although the Company has no obligation to do so, the Company may decide for competitive or other reasons to provide credit, liquidity or other support to its funds in the event of significant declines in valuation of fund holdings or significant redemption activity that exceeds available liquidity. Such support could cause the Company to take significant charges, could reduce the Company’s liquidity and, in certain situations, could, with respect to proprietary funds other than money market mutual funds, result in the Company having to consolidate a supported fund in its financial statements. If the Company chose not to provide credit, liquidity or other support in such a situation, the Company could suffer reputational damage and its business could be adversely affected. Significant interest rate changes could affect the Company’s profitability and financial condition. The Company is exposed to interest rate risk primarily from changes in the interest rates on its interest-earning assets (such as cash equivalents, short- and long-term investments, and mortgage and margin loans) relative to changes in the costs of its funding sources (including bank deposits and cash in brokerage accounts, short-term borrowings, and long-term debt). Changes in interest rates can affect the interest earned on interest-earning assets differently than the interest the Company pays on its interest-bearing liabilities. In addition, certain funding sources do not bear interest and their cost therefore does not vary. Overall, the Company is positioned to benefit from a rising interest rate environment; the Company could be adversely affected by a decline in interest rates if the rates the Company earns on interest-earning assets decline more than

THE CHARLES SCHWAB CORPORATION
- 14 -
the rates that the Company pays on its funding sources, or if prepayment rates increase on the mortgages and mortgage-backed securities the Company holds. The Company may also be limited in the amount it can reduce interest rates on funding sources, such as deposit accounts, and still offer a competitive return. As a result of the low interest rate environment, the Company has been waiving and may continue to waive a portion of its management fees for certain Schwab-sponsored money market mutual funds. To the extent the overall yield on certain Schwab-sponsored money market mutual funds remains at or below the management fees on those funds, the Company may waive a portion of its fee in order to continue providing some return to clients. Such fee waivers negatively impact the Company’s asset management and administration fee revenues. Security breaches of the Company’s systems, or those of its clients or third parties, may subject the Company to significant liability and damage the Company’s reputation. The Company’s business involves the secure processing, storage and transmission of confidential information about the Company and its clients. Information security risks for financial institutions are increasing, in part because of the use of the internet and mobile technologies to conduct financial transactions, and the increased sophistication and activities of organized crime, activists, hackers and other external parties. The Company’s systems and those of other financial institutions have been and are likely to continue to be the target of cyber attacks, malicious code, computer viruses and denial of service attacks that could result in unauthorized access, misuse, loss or destruction of data (including confidential client information), account takeovers, unavailability of service or other events. Despite the Company’s efforts to ensure the integrity of its systems, the Company may not be able to anticipate or to implement effective preventive measures against all security breaches of these types, especially because the techniques used change frequently or are not recognized until launched, and because security attacks can originate from a wide variety of sources. Data security breaches may also result from non-technical means, for example, employee misconduct. Security breaches, including breaches of the Company’s security measures or those of the Company’s third-party service providers or clients, could result in a violation of applicable privacy and other laws and could subject the Company to significant liability or loss that may not be covered by insurance, actions by the Company’s regulators, damage to the Company’s reputation, or a loss of confidence in the Company’s security measures which could harm the Company’s business. The Company may be required to expend significant additional resources to modify its protective measures or to investigate and remediate vulnerabilities or other exposures. The Company also faces risk related to external fraud involving the compromise of clients’ personal electronic devices that can facilitate the unauthorized access to login and password information for their various online financial accounts, including those at the Company. Such risk has grown in recent years due to the increased sophistication and activities of organized crime and other external parties, including foreign state-sponsored parties. For example, these parties send fraudulent “phishing” emails to the Company’s clients in order to misappropriate user names, passwords or other personal information. Losses reimbursed to clients under the Company’s guarantee against unauthorized account activity could have a negative impact on the Company’s business, financial condition and results of operations. The Company is subject to litigation and regulatory investigations and proceedings and may not be successful in defending itself against claims or proceedings. The financial services industry faces substantial litigation and regulatory risks. The Company is subject to claims and lawsuits in the ordinary course of business, including arbitrations, class actions and other litigation, some of which include claims for substantial or unspecified damages. The Company is also the subject of inquiries, investigations, and proceedings by regulatory and other governmental agencies. Litigation and arbitration claims include those brought by the Company’s clients and the clients of third party advisors whose assets are custodied at the Company. Claims from clients of third party advisors may allege losses due to investment decisions made by the third party advisors or the advisors’ misconduct. Litigation claims also include claims from third parties alleging infringement of their intellectual property rights (e.g., patents). Such litigation can require the expenditure of significant Company resources. If the Company were found to have infringed on a third-party patent, or other intellectual property rights, it could incur substantial damages, and in some circumstances could be enjoined from using certain technology, or providing certain products or services.

THE CHARLES SCHWAB CORPORATION
- 15 -
Actions brought against the Company may result in settlements, awards, injunctions, fines, penalties or other results adverse to the Company including reputational harm. Even if the Company is successful in defending against these actions, the defense of such matters may result in the Company incurring significant expenses. Predicting the outcome of matters is inherently difficult, particularly where claims are brought on behalf of various classes of claimants, claimants seek substantial or unspecified damages, or when investigations or legal proceedings are at an early stage. A substantial judgment, settlement, fine, or penalty could be material to the Company’s operating results or cash flows for a particular future period, depending on the Company’s results for that period. In market downturns, the volume of legal claims and amount of damages sought in litigation and regulatory proceedings against financial services companies have historically increased. See “Item 8 – Financial Statements and Supplementary Data – Notes to Consolidated Financial Statements – 15. Commitments and Contingencies.” The Company relies on outsourced service providers to perform key functions. The Company relies on external service providers to perform certain key technology, processing, servicing, and support functions. These service providers face technology, operating, business, and economic risks, and any significant failures by them, including the improper use or disclosure of the Company’s confidential client, employee, or company information, could cause the Company to incur losses and could harm the Company’s reputation. An interruption in or the cessation of service by any external service provider as a result of systems failures, capacity constraints, financial difficulties or for any other reason, and the Company’s inability to make alternative arrangements in a timely manner could disrupt the Company’s operations, impact the Company’s ability to offer certain products and services, and result in financial losses to the Company. Switching to an alternative service provider may require a transition period and result in less efficient operations. Potential strategic transactions could have a negative impact on the Company’s financial position. The Company evaluates potential strategic transactions, including business combinations, acquisitions, and dispositions. Any such transaction could have a material impact on the Company’s financial position, results of operations, or cash flows. The process of evaluating, negotiating, and effecting any such strategic transaction may divert management’s attention from other business concerns, and might cause the loss of key clients, employees, and business partners. Moreover, integrating businesses and systems may result in unforeseen expenditures as well as numerous risks and uncertainties, including the need to integrate operational, financial, and management information systems and management controls, integrate relationships with clients and business partners, and manage facilities and employees in different geographic areas. In addition, an acquisition may cause the Company to assume liabilities or become subject to litigation or regulatory proceedings. Further, the Company may not realize the anticipated benefits from an acquisition, and any future acquisition could be dilutive to the Company’s current stockholders’ percentage ownership or to earnings per common share. The Company’s acquisitions and dispositions are typically subject to closing conditions, including regulatory approvals and the absence of material adverse changes in the business, operations or financial condition of the entity being acquired or sold. To the extent the Company enters into an agreement to buy or sell an entity, there can be no guarantee that the transaction will close when expected, or at all. If a material transaction does not close, the Company’s stock price could decline. The Company’s industry is characterized by aggressive price competition. The Company continually monitors its pricing in relation to competitors and periodically adjusts trade commission rates, interest rates on deposits and loans, fees for advisory services, and other fee structures to enhance its competitive position. Increased price competition from other financial services firms, such as reduced commissions to attract trading volume or higher deposit rates to attract client cash balances, could impact the Company’s results of operations and financial condition. To the extent that any of the Company’s competitors acquires or is acquired by another institution, that firm may be able to offer products and services at lower prices and/or promote those products and services more aggressively. The Company faces competition in hiring and retaining qualified employees, especially for employees who are key to the Company’s ability to build and enhance client relationships. The market for quality professionals and other personnel in the Company’s business is highly competitive. Competition is strong for FCs who build and sustain the Company’s client relationships and for certain risk and capital management talent.

THE CHARLES SCHWAB CORPORATION
- 16 -
The Company’s ability to continue to compete effectively will depend upon its ability to attract new employees and retain existing employees while managing compensation costs. The Company’s stock price has fluctuated historically, and may continue to fluctuate. The Company’s stock price can be volatile. Among the factors that may affect the volatility of the Company’s stock price are the following:
the Company’s exposure to changes in interest rates; speculation in the investment community or the press about, or actual changes in, the Company’s competitive
position, organizational structure, executive team, operations, financial condition, financial reporting and results, expense discipline, or strategic transactions;
the announcement of new products, services, acquisitions, or dispositions by the Company or its competitors; and increases or decreases in revenue or earnings, changes in earnings estimates by the investment community, and
variations between estimated financial results and actual financial results. Changes in the stock market generally, or as it concerns the Company’s industry, as well as geopolitical, corporate, regulatory, business, and economic factors may also affect the Company’s stock price. Future sales of CSC’s equity securities may adversely affect the market price of CSC’s common stock and result in dilution. CSC’s certificate of incorporation authorizes CSC’s Board of Directors to, among other things, issue additional shares of common or preferred stock or securities convertible or exchangeable into equity securities, without stockholder approval. CSC may issue additional equity or convertible securities to raise additional capital or for other purposes. The issuance of any additional equity or convertible securities could be substantially dilutive to holders of CSC’s common stock and may adversely affect the market price of CSC’s common stock.
Item 1B. Unresolved Securities and Exchange Commission Staff Comments
None. Item 2. Properties
A summary of the Company’s significant locations is presented in the following table. Locations are leased or owned as noted below. The square footage amounts are presented net of space that has been subleased to third parties.
December 31, 2015 Square Footage (amounts in thousands) Leased Owned
Location Corporate office space:
San Francisco, CA (1) 772 -
Service and other office space: Denver, CO 137 726Phoenix, AZ 28 721Austin, TX 299 185Indianapolis, IN - 275Orlando, FL 148 -Richfield, OH - 117El Paso, TX - 105Chicago, IL 83 -
(1) Includes the Company’s headquarters.
THE CHARLES SCHWAB CORPORATION
- 17 -
Substantially all of the Company’s branch offices are located in leased premises. The corporate headquarters, data centers, offices, and service centers support both of the Company’s segments.
Item 3. Legal Proceedings
For a discussion of legal proceedings, see “Item 8 – Financial Statements and Supplementary Data – Notes to Consolidated Financial Statements – 15. Commitments and Contingencies.” Item 4. Mine Safety Disclosures
Not applicable.

THE CHARLES SCHWAB CORPORATION
- 18 -
PART II Item 5. Market for Registrant’s Common Equity, Related Stockholder Matters and Issuer
Purchases of Equity Securities CSC’s common stock is listed on The New York Stock Exchange under the ticker symbol SCHW. The number of common stockholders of record as of January 29, 2016, was 6,609. The closing market price per share on that date was $25.53. The quarterly high and low sales prices for CSC’s common stock and the other information required to be furnished pursuant to this item are included in “Item 8 – Financial Statements and Supplementary Data – Notes to Consolidated Financial Statements – 20. Employee Incentive, Retirement, and Deferred Compensation Plans and 26. Quarterly Financial Information (Unaudited).” The following graph shows a five-year comparison of cumulative total returns for CSC’s common stock, the Dow Jones U.S. Investment Services Index, and the Standard & Poor’s 500 Index, each of which assumes an initial investment of $100 and reinvestment of dividends.
December 31, 2010 2011 2012 2013 2014 2015
The Charles Schwab Corporation $ 100 $ 67 $ 87 $ 159 $ 187 $ 205
Standard & Poor’s 500 Index $ 100 $ 102 $ 118 $ 157 $ 178 $ 181
Dow Jones U.S. Investment Services Index $ 100 $ 66 $ 83 $ 135 $ 154 $ 154
$0
$50
$100
$150
$200
$250
12/31/10 12/31/11 12/31/12 12/31/13 12/31/14 12/31/15
The Charles Schwab Corporation
Standard and Poor's 500 Index
Dow Jones U.S. Investment ServicesIndex

THE CHARLES SCHWAB CORPORATION
- 19 -
Issuer Purchases of Equity Securities At December 31, 2015, approximately $596 million of future share repurchases are authorized under the Share Repurchase Program. There were no share repurchases during the fourth quarter. There were two authorizations under this program by CSC’s Board of Directors, each covering up to $500 million of common stock that were publicly announced by the Company on April 25, 2007, and March 13, 2008. The remaining authorizations do not have an expiration date. The following table summarizes purchases made by or on behalf of CSC of its common stock for each calendar month in the fourth quarter of 2015:
Total Number of Average Shares Purchased Price Paid Month (in thousands) per Share
October: Employee transactions (1) 17 $ 28.17
November: Employee transactions (1) 1,101 $ 31.07
December: Employee transactions (1) 5 $ 33.67
Total: Employee transactions (1) 1,123 $ 31.04
(1) Includes restricted shares withheld (under the terms of grants under employee stock incentive plans) to offset tax withholding obligations that occur upon vesting and release of restricted shares. The Company may receive shares delivered or attested to pay the exercise price and/or to satisfy tax withholding obligations by employees who exercise stock options granted under employee stock incentive plans, which are commonly referred to as stock swap exercises.

THE CHARLES SCHWAB CORPORATION
- 20 -
Item 6. Selected Financial Data
Selected Financial and Operating Data (In Millions, Except Per Share Amounts, Ratios, or as Noted)
Growth Rates Compounded Annual 4-Year (1) 1-Year 2011-2015 2014-2015 2015 2014 2013 2012 2011
Results of Operations Net revenues 8% 5% $ 6,380 $ 6,058 $ 5,435 $ 4,883 $ 4,691 Expenses excluding interest 6% 4% $ 4,101 $ 3,943 $ 3,730 $ 3,433 $ 3,299 Net income 14% 10% $ 1,447 $ 1,321 $ 1,071 $ 928 $ 864 Net income available to common stockholders 12% 8% $ 1,364 $ 1,261 $ 1,010 $ 883 $ 864 Earnings per common share:
Basic 10% 8% $ 1.04 $ .96 $ .78 $ .69 $ .70 Diluted 10% 8% $ 1.03 $ .95 $ .78 $ .69 $ .70
Dividends declared per common share - - $ .24 $ .24 $ .24 $ .24 $ .24 Weighted average common shares outstanding:
Basic 2% 1% 1,315 1,303 1,285 1,274 1,227 Diluted 2% 1% 1,327 1,315 1,293 1,275 1,229
Asset management and administration fees as a percentage of net revenues 42% 42% 43% 42% 41%
Net interest revenue as a percentage of net revenues 40% 38% 36% 36% 37%Trading revenue as a percentage of net revenues 14% 15% 17% 18% 20%Effective income tax rate 36.5% 37.5% 37.2% 36.0% 37.9%
Performance Measures Net revenue growth 5% 11% 11% 4% 10%Pre-tax profit margin 35.7% 34.9% 31.4% 29.7% 29.7%Return on average common stockholders’ equity 12% 12% 11% 11% 12%
Financial Condition (at year end) Total assets 14% 19% $ 183,718 $ 154,642 $ 143,642 $ 133,617 $ 108,553 Long-term debt 10% 52% $ 2,890 $ 1,899 $ 1,903 $ 1,632 $ 2,001 Stockholders’ equity (2) 15% 14% $ 13,402 $ 11,803 $ 10,381 $ 9,589 $ 7,714 Assets to stockholders’ equity ratio 14 13 14 14 14Debt to total capital ratio 18% 14% 15% 15% 21%
Employee Information Full-time equivalent employees (in thousands,
at year end) 2% 5% 15.3 14.6 13.8 13.8 14.1
(1) The compounded 4-year growth rate is computed using the following formula: Compound annual growth rate = (Ending Value / Beginning Value) .25 - 1. (2) In 2012, the Company issued non-cumulative perpetual preferred stock, Series A, with a total liquidation preference of $400 million and non-cumulative perpetual preferred
stock, Series B, for a total liquidation preference of $485 million. In 2015, the Company issued non-cumulative perpetual preferred stock, Series C, with a total liquidation preference of $600 million.
THE CHARLES SCHWAB CORPORATION Management’s Discussion and Analysis of Financial Condition and Results of Operations
(Tabular Amounts in Millions, Except Ratios, or as Noted)
- 21 -
Item 7. Management’s Discussion and Analysis of Financial Condition and Results of Operations FORWARD-LOOKING STATEMENTS In addition to historical information, this Annual Report on Form 10-K contains “forward-looking statements” within the meaning of Section 27A of the Securities Act, and Section 21E of the Securities Exchange Act of 1934. Forward-looking statements are identified by words such as “believe,” “anticipate,” “expect,” “intend,” “plan,” “will,” “may,” “estimate,” “appear,” “aim,” “target,” “could,” “would,” “continue,” and other similar expressions. In addition, any statements that refer to expectations, projections, or other characterizations of future events or circumstances are forward-looking statements. These forward-looking statements, which reflect management’s beliefs, objectives, and expectations as of the date hereof, are estimates based on the best judgment of the Company’s senior management. These statements relate to, among other things:
the Company’s aim to maximize the Company’s value and returns over time; the Company’s ability to pursue its business strategy and maintain its market leadership position; and the Company’s belief that offering more value and a better investing experience will translate into more client assets which drives revenue (see “Item 1. – Business – Business Strategy and Competitive Environment”);
the impact of legal proceedings and regulatory matters (see “Item 3. – Legal Proceedings” and “Item 8. – Financial Statements and Supplementary Data – Notes to Consolidated Financial Statements –15. Commitments and Contingencies – Legal contingencies”);
the impact of current market conditions and interest rates on the Company’s results of operations (see “Item 7. – Management’s Discussion and Analysis of Financial Condition and Results of Operations – Overview” and “– Results of Operations – Net Interest Revenue”);
2016 capital expenditures (see “Item 7. – Management’s Discussion and Analysis of Financial Condition and Results of Operations – Results of Operations – Expenses Excluding Compensation and Benefits”);
sources of liquidity, capital, and level of dividends (see “Item 7. – Management’s Discussion and Analysis of Financial Condition and Results of Operations – Liquidity – Additional Funding Sources,” “– Contractual Obligations,” and “– Capital Management – Dividends”);
target capital ratios (see “Item 7. – Management’s Discussion and Analysis of Financial Condition and Results of Operations – Capital Management – Regulatory Capital Requirements”);
the impact of changes in management’s estimates on the Company’s results of operations (see “Item 7. – Management’s Discussion and Analysis of Financial Condition and Results of Operations – Critical Accounting Estimates”);
the expected impact of new accounting standards not yet adopted (see “Item 8. – Financial Statements and Supplementary Data – Notes to Consolidated Financial Statements – 2. Summary of Significant Accounting Policies – New Accounting Standards – New Accounting Standards Not Yet Adopted”); and
the impact of changes in the likelihood of indemnification and guarantee payment obligations on the Company’s results of operations (see “Item 8. – Financial Statements and Supplementary Data – Notes to Consolidated Financial Statements – 15. Commitments and Contingencies – Guarantees and indemnifications”).
Achievement of the expressed beliefs, objectives and expectations described in these statements is subject to certain risks and uncertainties that could cause actual results to differ materially from the expressed beliefs, objectives, and expectations. Readers are cautioned not to place undue reliance on these forward-looking statements, which speak only as of the date of this Annual Report on Form 10-K or, in the case of documents incorporated by reference, as of the date of those documents. Important factors that may cause actual results to differ include, but are not limited to:
changes in general economic and financial market conditions; changes in revenues and profit margin due to changes in interest rates; adverse developments in litigation or regulatory matters; the extent of any charges associated with litigation and regulatory matters; amounts recovered on insurance policies; the Company’s ability to attract and retain clients and grow client assets and relationships;

THE CHARLES SCHWAB CORPORATION Management’s Discussion and Analysis of Financial Condition and Results of Operations
(Tabular Amounts in Millions, Except Ratios, or as Noted)
- 22 -
the Company’s ability to develop and launch new products, services and capabilities in a timely and successful manner;
fluctuations in client asset values due to changes in equity valuations; the performance or valuation of securities available for sale and securities held to maturity; trading activity; the level of interest rates, including yields available on money market mutual fund eligible instruments; the timing and impact of changes in the Company’s level of investments in land, leasehold improvements,
information technology equipment and software; the adverse impact of financial reform legislation and related regulations; the amount of loans to the Company’s brokerage and banking clients; the level of the Company’s stock repurchase activity; the availability and terms of external financing; capital needs and management; client sensitivity to interest rates; timing, amount and impact of the migration of certain balances from brokerage accounts and sweep money market
funds into Schwab Bank; the Company’s ability to manage expenses; regulatory guidance; the level of client assets, including cash balances; competitive pressures on rates and fees; acquisition integration costs; potential breaches of contractual terms for which the Company has indemnification and guarantee obligations; client use of the Company’s investment advisory services and other products and services; the volume of prepayments in the Company’s mortgage-backed securities portfolio; and the impact of changes in market conditions on money market fund fee waivers, revenues and pre-tax profit margin.
Certain of these factors, as well as general risk factors affecting the Company, are discussed in greater detail in this Annual Report on Form 10-K, including “Item 1A – Risk Factors.”

THE CHARLES SCHWAB CORPORATION Management’s Discussion and Analysis of Financial Condition and Results of Operations
(Tabular Amounts in Millions, Except Ratios, or as Noted)
- 23 -
GLOSSARY OF TERMS Active brokerage accounts: Brokerage accounts with balances or activity within the preceding eight months. Asset-backed securities: Debt securities backed by financial assets such as loans or receivables. Assets receiving ongoing advisory services: Client relationships under the guidance of independent advisors and assets enrolled in one of the Company’s retail or other advisory solutions. Average client assets: The daily average client asset balance for the period. Basel III: Global regulatory standards on bank capital adequacy and liquidity issued by the Basel Committee on Banking Supervision. Basis point: One basis point equals 1/100th of 1%, or 0.01%. Cash and investments segregated and on deposit for regulatory purposes: Client cash or qualified securities balances not used for margin lending are generally segregated and maintained for the exclusive benefit of clients, pursuant to Rule 15c3-3 of the Securities Exchange Act of 1934 (commonly referred to as the Customer Protection Rule), by the Company’s broker-dealer subsidiaries. Client assets: The market value of all client assets custodied at the Company, which includes both cash and securities. Client cash as a percentage of client assets: Calculated as money market fund balances, bank deposits, Schwab One® balances, and certain cash equivalents as a percentage of client assets. Clients’ daily average trades: Includes daily average revenue trades by clients, trades by clients in asset-based pricing relationships, and all commission-free trades, including the Company’s Mutual Fund OneSource® funds and exchange-traded funds, and other proprietary products. Commitments to extend credit: Legally binding agreements to extend credit for unused HELOCs, pledged asset lines and other lines of credit. Common Equity Tier 1 (CET1) Capital: The sum of common stock and related surplus net of treasury stock, retained earnings, accumulated other comprehensive income and qualifying minority interests, less applicable regulatory adjustments and deductions. Common Equity Tier 1 (CET1) Risk-Based Capital Ratio: The ratio of CET1 Capital to total risk-weighted assets. Concentration risk: The Company’s risk exposure resulting from holding large positions in financial instruments collateralized by assets with similar economic characteristics or in securities of a single issuer or particular industry or geographical area. Core net new client assets: Net new client assets before significant one-time inflows or outflows, such as acquisitions/divestitures or extraordinary (generally, greater than $10 billion) mutual fund clearing transfers. Credit risk: The potential for loss due to a borrower, counterparty, or issuer failing to perform its contractual obligations. Daily average revenue trades: Total revenue trades during a certain period, divided by the number of trading days in that period. Revenue trades include all client trades that generate trading revenue (i.e., commission revenue or principal transaction revenue). Debt to total capital ratio: Calculated as long-term debt divided by stockholders’ equity and long-term debt.

THE CHARLES SCHWAB CORPORATION Management’s Discussion and Analysis of Financial Condition and Results of Operations
(Tabular Amounts in Millions, Except Ratios, or as Noted)
- 24 -
Delinquency roll rates: The rates at which loans transition through delinquency stages, ultimately resulting in a loss. The Company considers a loan to be delinquent if it is 30 days or more past due. Dodd-Frank Wall Street Reform and Consumer Protection Act (Dodd-Frank): Regulatory reform legislation signed into federal law in 2010 containing numerous provisions aimed at promoting financial stability in the U.S. financial system through enhanced prudential regulation of large financial services companies. Final Regulatory Capital Rules: Refers to the regulatory capital rules issued by U.S. banking agencies in July 2013 that implemented Basel III and relevant provisions of Dodd-Frank, which apply to savings and loan holding companies, as well as federal savings banks. Implementation began on January 1, 2015. First Mortgages: Refers to first lien residential real estate mortgage loans, which include two loan classes: first mortgages and purchased first mortgages. Full-time equivalent employees: Includes full-time, part-time and temporary employees, and persons employed on a contract basis, and excludes employees of outsourced service providers. Interest rate risk: The risk to earnings or capital arising from changes in interest rates. Interest-bearing liabilities: Includes bank deposits, payables to brokerage clients, and long-term debt on which the Company pays interest. Interest-earning assets: Includes cash and cash equivalents, cash and investments segregated, broker-related receivables, receivables from brokerage clients, securities available for sale, securities held to maturity, and bank loans. Investment grade: Defined as a rating equivalent to a Moody’s rating of “Baa” or higher, or a Standard & Poor’s or Fitch rating of “BBB-” or higher. Liquidity risk: Risk that the Company will be unable to meet obligations when they come due without incurring unacceptable losses. Loan-to-value ratio: Ratio shown as a percentage and calculated as the principal amount of a loan divided by the appraised value of the collateral securing the loan. Margin loans: Loans made to brokerage clients on a secured basis to purchase securities reflected in receivables from brokerage clients on the Company’s balance sheet. Market risk: The potential for changes in earnings or the value of financial instruments held by the Company as a result of fluctuations in interest rates, equity prices or market conditions. Master netting arrangement: An agreement between two counterparties that have multiple contracts with each other that provides for net settlement of all contracts through a single cash payment in the event of default or termination of any one contract. Mortgage-backed securities: A type of asset-backed security that is secured by a mortgage or group of mortgages. Net interest margin: Net interest revenue divided by average interest-earning assets. Net new client assets: Total inflows of client cash and securities to the Company less client outflows. Management believes that this metric depicts how well the Company’s products and services appeal to new and existing clients. New brokerage accounts: All brokerage accounts opened during the period, as well as any accounts added via acquisition. Nonperforming assets: The total of nonaccrual loans and other real estate owned.
THE CHARLES SCHWAB CORPORATION Management’s Discussion and Analysis of Financial Condition and Results of Operations
(Tabular Amounts in Millions, Except Ratios, or as Noted)
- 25 -
Operational risk: Potential for loss due to inadequate or failed internal processes, systems, and firms or exchanges handling client orders, or loss from external events and relationships impacting the Company and/or any of its key business partners and vendors. Order flow revenue: Net compensation received from markets and firms to which Schwab and optionsXpress, Inc. send equity and options orders. Reflects rebates received for certain types of orders, minus fees paid for execution of orders for which exchange fees or other charges apply. Pledged Asset Line®: A non-purpose revolving line of credit from Schwab Bank secured by eligible assets held in a separate pledged asset account maintained at Schwab. Return on average common stockholders’ equity: Calculated as net income available to common stockholders divided by average common stockholders’ equity. Return on average total assets: Calculated as net income divided by average total assets for the period. Risk-weighted assets: Primarily computed by assigning specific risk-weightings as determined by the regulators to assets and off-balance sheet instruments for capital adequacy calculations. Tier 1 Capital: The sum of CET1 Capital and additional Tier 1 Capital instruments and related surplus, less applicable adjustments and deductions. Tier 1 Leverage Ratio: Tier 1 capital divided by adjusted average total consolidated assets at the end of the quarter. Trading days: Days in which the markets/exchanges are open for the buying and selling of securities. Early market closures are counted as half-days. U.S. federal banking agencies: Refers to the Board of Governors of the Federal Reserve System, the Office of the Comptroller of the Currency, the Federal Deposit Insurance Corporation, and the Consumer Financial Protection Bureau. Uniform Net Capital Rule: Refers to Rule 15c3-1 under the Securities Exchange Act of 1934 which specifies minimum capital requirements that are intended to ensure the general financial soundness and liquidity of broker-dealers.

THE CHARLES SCHWAB CORPORATION Management’s Discussion and Analysis of Financial Condition and Results of Operations
(Tabular Amounts in Millions, Except Ratios, or as Noted)
- 26 -
OVERVIEW Management of the Company focuses on several key client activity and financial metrics in evaluating the Company’s financial position and operating performance. Management believes that net revenue growth, pre-tax profit margin, earnings per common share (EPS), and return on average common stockholders’ equity provide broad indicators of the Company’s overall financial health, operating efficiency, and ability to generate acceptable returns. Expenses excluding interest as a percentage of average client assets are considered by management to be a measure of operating efficiency. Results for the years ended December 31, 2015, 2014, and 2013 are:
Growth Rate 1-Year Year Ended December 31, 2014-2015 2015 2014 2013
Client Metrics: Net new client assets (in billions) 12 % $ 139.4 $ 124.8 $ 41.6 Core net new client assets (in billions) (1,2) 8 % $ 134.7 $ 124.8 $ 140.8 Client assets (in billions, at year end) 2 % $ 2,513.8 $ 2,463.6 $ 2,249.4 Average client assets (in billions) 6 % $ 2,531.8 $ 2,384.0 $ 2,116.7 New brokerage accounts (in thousands) 10 % 1,070 972 960 Active brokerage accounts (in thousands, at year end) 4 % 9,769 9,386 9,093 Assets receiving ongoing advisory services
(in billions, at year end) 2 % $ 1,253.7 $ 1,228.1 $ 1,101.4 Client cash as a percentage of client assets
(at year end) 13.0 % 12.3 % 13.1 %
Company Financial Metrics: Net revenues 5 % $ 6,380 $ 6,058 $ 5,435 Expenses excluding interest 4 % 4,101 3,943 3,730 Income before taxes on income 8 % 2,279 2,115 1,705 Taxes on income 5 % 832 794 634 Net income 10 % $ 1,447 $ 1,321 $ 1,071 Preferred stock dividends and other 38 % 83 60 61 Net income available to common stockholders 8 % $ 1,364 $ 1,261 $ 1,010 Earnings per common share – diluted 8 % $ 1.03 $ .95 $ .78 Net revenue growth from prior year 5 % 11 % 11 % Pre-tax profit margin 35.7 % 34.9 % 31.4 % Return on average common stockholders’ equity 12 % 12 % 11 % Expenses excluding interest as a percentage of
average client assets 0.16 % 0.17 % 0.18 %
(1) 2015 excludes an inflow of $6.1 billion to reflect the final impact of the consolidation of its retirement plan recordkeeping platforms, an inflow of $10.2 million relating to a mutual fund clearing services client, and an outflow of $11.6 billion relating to the Company’s planned resignation from an Advisor Services cash management relationship netting to an adjustment of ($4.7) billion.
(2) 2013 excludes an outflow of $74.5 billion relating to the planned transfer of a mutual fund clearing client and $24.7 billion to reflect the estimated impact of the consolidation of its retirement plan recordkeeping technology platforms and subsequent resignation from certain retirement plan clients for a total adjustment of $99.2 billion.
The Company’s financial results are highly correlated to the general overall strength of economic conditions and, more specifically, to the direction of the U.S. equity and fixed income markets, the mortgage lending markets and residential credit trends. Overall market conditions, interest rates, economic, political and regulatory trends, and industry competition are among the factors that could affect results and which are unpredictable. Interest rates have a direct correlation to the Company’s ability to generate net interest revenue, as interest-earning assets and funding sources are sensitive to changes in the rate environment. To the extent short-term interest rates remain at current low levels, the Company’s net interest revenue will continue to be constrained, even as growth in average balances helps to

THE CHARLES SCHWAB CORPORATION Management’s Discussion and Analysis of Financial Condition and Results of Operations
(Tabular Amounts in Millions, Except Ratios, or as Noted)
- 27 -
increase such revenue. Net interest revenue is also impacted by the amount and mix of interest-earning assets and interest-bearing funding sources, as well as the Company’s ability to attract assets from new and existing clients. The interest rate environment also affects asset management and administration fees through the fees earned on the Company’s lineup of proprietary money market funds. In 2015, 2014 and 2013, the low interest rate environment caused the Company to waive a portion of its money fund fees. To the extent that short-term rates remain low, asset management and administration fees may continue to be negatively affected. Other drivers of asset management and administration fees include securities valuations and the Company’s ability to attract assets from new and existing clients. The Company generates trading revenue through commissions earned for executing trades for clients and principal transaction revenue primarily from trading activity in client fixed income securities. Trading revenue is impacted by trading volumes, the volatility of prices in the equity and fixed income markets, and commission rates. Volatility in the markets can influence client behavior in terms of investment decisions and volume of trading activity. 2015 Compared to 2014 In 2015, the Company’s revenue and net income grew despite an environment that included significant equity market volatility and continued low interest rates. The Standard & Poor’s 500 Index declined as much as 9% during the year and ultimately ended the year down 1% when compared to the prior year. The federal funds short-term target rate increased 25 basis points in December 2015, however, the increase had limited effect on 2015 results. The average 3-month London Interbank Offered Rate (LIBOR) yield improved 8 basis points to .32% compared to 2014. Long-term interest rates decreased in 2015 compared to the same period in 2014. The average 10-year U.S. Treasury yield during 2015 was 2.13%, 40 basis points lower than the average yield during 2014. Strong client momentum continued as the Company’s innovative, full-service model continued to resonate with clients and drive growth during the year. Core net new assets totaled $134.7 billion in 2015 compared to $124.8 billion in 2014. Total client assets ended 2015 at $2.51 trillion, up 2% from the year ended 2014, despite the $89.2 billion impact of reduced market valuation on client assets during the year. The Company added 1.1 million new brokerage accounts to its client base during 2015, up 10% compared to 2014. Active brokerage accounts ended 2015 at 9.8 million, up 4% on a year-over-year basis. Faced with economic uncertainty and the resulting market volatility, investors increasingly turned to advice offerings throughout the year. Over 155,000 accounts enrolled in one of the Company’s retail advisory solutions during 2015, 60% more than the year-earlier period, and total accounts using these solutions reached 560,000, up 14% year-over-year. During 2015, the Company’s net revenues increased 5% compared to 2014 primarily due to increases in net interest revenue and asset management and administration fees, partially offset by a decrease in trading revenue.
Net interest revenue increased primarily due to higher client cash balances generating increased interest-earning assets, partially offset by lower average interest rate margins.
Asset management and administration fees increased due to higher client asset balances and higher net yields earned on money market funds.
Trading revenue decreased for 2015 primarily due to lower commissions per revenue trade and lower daily average revenue trades.
Growth in expenses, excluding interest, was limited to a 4% increase in 2015 primarily reflecting business growth related increases in compensation, benefits and other expenses. The combined effect of market conditions, strong business growth, and the Company’s overall spending discipline resulted in a pre-tax profit margin of 35.7% in 2015. 2014 Compared to 2013 The Company operated in an environment of mixed market conditions during 2014 compared to 2013, as the Nasdaq Composite Index, Standard & Poor’s 500 Index, and Dow Jones Industrial Average showed periods of volatility before

THE CHARLES SCHWAB CORPORATION Management’s Discussion and Analysis of Financial Condition and Results of Operations
(Tabular Amounts in Millions, Except Ratios, or as Noted)
- 28 -
ending the year up 13%, 11%, and 8%, respectively. The federal funds target rate remained unchanged at a range of zero to .25% during 2014. The average 10-year U.S. Treasury yield increased by 20 basis points to 2.53% during 2014 compared to 2013, while the yield ended the year down 86 basis points to 2.17%. In the same period, the average three-month U.S. Treasury Bill yield decreased by 3 basis points to .02%. The Company’s steady focus on serving investor needs through its full-service investing model continued to drive growth during 2014. Total client assets ended the year at $2.46 trillion, up 10% from 2013, reflecting net new client assets of $124.8 billion and a rising equity market environment. In addition, the Company added almost 1 million new brokerage accounts to its client base during 2014. Active brokerage accounts reached 9.4 million in 2014, up 3% from 2013. As a result of the Company’s strong key client activity metrics, the Company achieved a pre-tax profit margin of 34.9% in 2014. Overall, net income increased by 23% in 2014 from 2013 and the return on average common stockholders’ equity was 12% in 2014. Overall, net revenues increased by 11% in 2014 from 2013, primarily due to increases in net interest revenue, asset management and administration fees, and other revenue.
Net interest revenue increased primarily due to higher balances of interest-earning assets, including margin loans and the Company’s investment portfolio (securities available for sale and securities held to maturity), and the effect higher average interest rates on securities held to maturity had on the Company’s average net interest margin.
Asset management and administration fees increased due to fees from mutual fund services, advice solutions, and other asset management and administration services.
Other revenue increased primarily due to a net insurance settlement of $45 million, net litigation proceeds of $28 million related to the Company’s non-agency residential mortgage-backed securities (RMBS) portfolio, and increases in order flow revenue.
Expenses excluding interest increased by 6% in 2014 from 2013 primarily due to an increase in compensation and benefits expense as a result of a charge of $68 million for estimated future severance benefits resulting from changes in the Company’s geographic footprint and an increase in professional services expense. Current Regulatory Environment and Other Developments In December 2015, the OCC issued proposed guidelines to establish standards for recovery planning by national banks and federal savings banks with total consolidated assets of $50 billion or more. The proposed guidelines would require each bank to develop and maintain a recovery plan that sets forth the bank’s plan for how it will remain a going concern when it is experiencing considerable financial or operational stress. The comment period for the proposed guidelines ended on February 16, 2016 and the guidelines are subject to further modification. The Company is currently evaluating the impact of the proposed guidelines. In October 2015, the Federal Reserve issued a notice of proposed rulemaking that would require certain financial institutions that are subject to the Federal Reserve’s capital rules to apply a regulatory capital deduction treatment to their investments in unsecured debt issued by U.S. bank holding companies identified as global systemically important banking organizations. The comment period for the rule proposal ended on February 19, 2016 and the rule proposal is subject to further modification. The Company is currently evaluating the impact of the proposed rule. In October 2015, the FDIC issued a notice of proposed rulemaking that would impose a surcharge on the quarterly assessments of insured depository institutions with total assets of $10 billion or more. The surcharge would equal an annual rate of 4.5 basis points applied to the institution’s assessment base, with certain adjustments. The FDIC expects the proposed surcharge to commence in the third quarter of 2016 and continue through the quarter that the reserve ratio of the DIF reaches 1.35%. Under the proposed rule, if by year-end 2018, the reserve ratio has not reached 1.35%, the FDIC would impose a shortfall assessment on the institutions subject to the surcharge. The comment period for the rule proposal ended on January 5, 2016 and the rule proposal is subject to further modification. The Company will continue to evaluate the impact of the proposed rule.

THE CHARLES SCHWAB CORPORATION Management’s Discussion and Analysis of Financial Condition and Results of Operations
(Tabular Amounts in Millions, Except Ratios, or as Noted)
- 29 -
In April 2015, the Department of Labor published notice of a rule proposal to significantly broaden the definition of “fiduciary” under the Employee Retirement Income Security Act of 1974. If adopted, among other things, the new rule would subject broker-dealers who provide non-discretionary investment advice to retirement plans and accounts to a “best interest” standard, as well as other conditions and requirements. The second comment period for the rule proposal ended on September 24, 2015 and the rule proposal is subject to further modification. The Company will continue to evaluate the impact of the proposed rule. RESULTS OF OPERATIONS Net Revenues
Year Ended December 31, 2015 2014 2013 % of % of % of Growth Rate Total Net Total Net Total Net 2014-2015 Amount Revenues Amount Revenues Amount Revenues
Asset management and administration fees Mutual fund and ETF service fees (1) 5 % $ 1,479 23 % $ 1,413 23 % $ 1,339 25 % Advice solutions 7 % 898 14 % 840 14 % 718 13 % Other (1) (3)% 273 4 % 280 5 % 258 5 %
Asset management and administration fees 5 % 2,650 41 % 2,533 42 % 2,315 43 %
Net interest revenue
Interest revenue 12 % 2,657 42 % 2,374 39 % 2,085 38 % Interest expense 29 % (132) (2)% (102) (1)% (105) (2)%
Net interest revenue 11 % 2,525 40 % 2,272 38 % 1,980 36 %
Trading revenue
Commissions (4)% 822 13 % 857 14 % 864 16 % Principal transactions (12)% 44 1 % 50 1 % 49 1 %
Trading revenue (5)% 866 14 % 907 15 % 913 17 %
Other (4)% 328 5 % 343 5 % 236 4 % Provision for loan losses 175 % 11 - 4 - 1 - Net impairment losses on securities (100)% - - (1) - (10) -
Total net revenues 5 % $ 6,380 100 % $ 6,058 100 % $ 5,435 100 %
(1) In 2015, Other third-party mutual funds were reclassified to Mutual funds and ETFs. Related revenues have been reclassified from Other asset management and administration fees. Prior-period information has been recast to reflect this change.
Asset Management and Administration Fees Asset management and administration fees include mutual fund service fees and fees for other asset-based financial services provided to individual and institutional clients. The Company earns mutual fund and ETF service fees for shareholder services, administration, and investment management provided to its proprietary funds, and recordkeeping and shareholder services provided to third-party funds. These fees are based upon the daily balances of client assets invested in these funds. The Company also earns asset management fees for advice solutions, which include advisory and managed account services that are based on the daily balances of client assets subject to the specific fee for service. The fair values of client assets included in proprietary and third-party mutual funds and ETFs are based on quoted market prices and other observable market data. Other asset management and administration fees include various asset based fees such as mutual fund clearing fees, trust fees, collective trust fund fees, 401(k) record keeping fees, and non-balance based service and transaction fees. Asset management and administration fees vary with changes in the balances of client assets due to market fluctuations and client activity. For a discussion of the impact of current market conditions on asset management and administration fees, see “Item 7A – Quantitative and Qualitative Disclosures About Market Risk.”

THE CHARLES SCHWAB CORPORATION Management’s Discussion and Analysis of Financial Condition and Results of Operations
(Tabular Amounts in Millions, Except Ratios, or as Noted)
- 30 -
The following table presents a roll forward of client assets for the Schwab money market funds, Schwab equity and bond funds and ETFs and Mutual Fund OneSource®:
Schwab Money Schwab Equity and Mutual Fund
Market Funds Bond Funds and ETFs OneSource®
Year Ended December 31, 2015 2014 2013 2015 2014 2013 2015 2014 2013
Balance at beginning of period $ 167,909 $ 167,738 $ 167,896 $ 88,450 $ 71,249 $ 49,587 $ 234,381 $ 234,777 $ 204,465
Net inflows (outflows) (1,947) 287 (195) 15,542 11,398 8,311 (23,014) (8,925) (2,813)
Net market gains (losses) and other 186 (116) 37 (1,880) 5,803 13,351 (3,713) 8,529 33,125
Balance at end of period $ 166,148 $ 167,909 $ 167,738 $ 102,112 $ 88,450 $ 71,249 $ 207,654 $ 234,381 $ 234,777
The following table presents asset management and administration fees, average client assets, and average fee rate:
Year Ended December 31, 2015 2014 2013
Average Client Assets Revenue
AverageFee
AverageClient Assets Revenue
Average Fee
Average Client Assets Revenue
AverageFee
Schwab money market funds
before fee waivers $ 161,381 $ 947 0.59% $ 164,564 $ 957 0.58% $ 162,484 $ 936 0.58%
Fee waivers (672) (751) (674)
Schwab money market funds 161,381 275 0.17% 164,564 206 0.13% 162,484 262 0.16%
Schwab equity and bond funds and ETFs 102,486 217 0.21% 83,916 192 0.23% 63,012 157 0.25%
Mutual Fund OneSource® (1) 225,347 764 0.34% 236,003 805 0.34% 219,188 744 0.34%
Other third-party mutual funds and ETFs (1,2) 251,491 223 0.09% 241,314 210 0.09% 223,095 176 0.08%
Total mutual funds and ETFs (3) $ 740,705 1,479 0.20% $ 725,797 1,413 0.19% $ 667,779 1,339 0.20%
Advice solutions (3) :
Fee-based $ 172,302 898 0.52% $ 160,721 840 0.52% $ 136,353 718 0.53%
Intelligent Portfolios 3,274 - - N/A N/A N/A N/A N/A N/A
Legacy Non-Fee 16,463 N/A N/A 15,794 N/A N/A 13,890 N/A N/A
Total advice solutions $ 192,039 898 0.47% $ 176,515 840 0.48% $ 150,243 718 0.48%
Other balance-based fees (2,4) 324,701 226 0.07% 297,499 234 0.08% 249,619 216 0.09%
Other (2,5) 47 46 42
Total asset management
and administration fees $ 2,650 $ 2,533 $ 2,315
(1) In 2015, certain Mutual Fund OneSource balances and revenues were reclassified to Other third-party mutual funds and ETFs. Prior-period information has been recast to reflect this change.
(2) Beginning in 2015, Other third-party mutual funds and ETFs and Other balance-based fees are presented separately. Related revenues were previously presented in Other. Prior-period information has been recast to reflect this change. Other third-party mutual funds and ETFs include ETF OneSource.
(3) Beginning in 2015, Fee-based, Intelligent Portfolios and Legacy Non-Fee advice solutions are presented separately. Prior-period information has been recast to reflect this change. Advice solutions include managed portfolios, specialized strategies and customized investment advice. Fee-based advice solutions include Schwab Private Client, Schwab Managed Portfolios, Managed Account Select, Schwab Advisor Network, Windhaven Strategies, Thomas Partners Dividend Growth Strategy, and Schwab Index Advantage advised retirement plan balances. Intelligent Portfolios include Schwab Intelligent Portfolios™, launched in March 2015, and Institutional Intelligent Portfolios, launched in June 2015. Legacy Non-Fee advice solutions include superseded programs such as Schwab Advisor Source and certain retirement plan balances. Average client assets for advice solutions may also include the asset balances contained in the three categories of mutual funds listed above.
(4) Includes various asset-based fees, such as trust fees, mutual fund clearing fees, 401(k) recordkeeping fees, and other service fees. (5) Includes miscellaneous service and transaction fees relating to mutual funds and ETFs that are not balance-based. N/A Not applicable.
Asset management and administration fees increased by $117 million, or 5%, in 2015 from 2014, and by $218 million, or 9%, in 2014 from 2013, due to the following items.
Mutual fund and ETF service fees increased by $66 million, or 5%, in 2015 from 2014, due to higher net yields on money market fund assets, growth in client assets in equity and bond funds and ETFs and other third party mutual funds and ETFs, partially offset by a reduction in client assets in Mutual Fund OneSource. Mutual fund and ETF service fees increased by $74 million, or 6%, in 2014 from 2013 due to growth in client assets in Mutual Fund
THE CHARLES SCHWAB CORPORATION Management’s Discussion and Analysis of Financial Condition and Results of Operations
(Tabular Amounts in Millions, Except Ratios, or as Noted)
- 31 -
OneSource® funds and equity and bond funds and ETFs, and higher service fees in other third party mutual funds and ETFs, partially offset by lower net yields on money market fund assets.
Advice solutions fees increased by $58 million, or 7%, in 2015 from 2014 primarily due to growth in client assets enrolled in advisory offers, including Schwab Private Client™, ThomasPartners®, and Managed Account Select®, partially offset by a decrease in Windhaven®. Advice solutions fees increased by $122 million, or 17%, in 2014 from 2013 due to growth in client assets enrolled in advisory offers, including Schwab Private Client, ThomasPartners, and Schwab Managed Portfolios™.
Other balance-based asset management and administration service fees decreased by 3% in 2015 from 2014. Other balance-based asset management and administration fees increased by $18 million, or 8%, in 2014 from 2013 primarily due to growth in client assets in transaction fee fund clearing, collective trust funds, and Advisor Services – asset based fees.
Net Interest Revenue Net interest revenue is the difference between interest earned on interest-earning assets and interest paid on funding sources. The Company’s interest-earning assets are primarily funded through bank deposits and brokerage client account balances. Interest-earning assets include cash and cash equivalents, segregated cash and investments, margin loans included in receivables from brokerage clients, investment securities and bank loans. Revenue on interest-earning assets is affected by various factors such as distribution and composition of assets, prevailing interest rates when purchased, and changes in prepayment levels. Fees earned on securities borrowed and loaned are included in other interest revenue and expense. The rates on the majority of the Company’s investment securities and loans re-price or reset based on short-term market rates and the remainder is invested in fixed-rate loans and securities. The Company’s interest-bearing liabilities include bank deposits, payables to brokerage clients and long-term debt. Interest-bearing liabilities are primarily sensitive to short-term interest rates and the Company establishes the rates paid on most of these liabilities. The Company expects that the rate paid on these liabilities will generally adjust at some fraction of the movement in short-term market rates. The Company expects that net interest revenue will increase as short-term market rates increase and decline should rates fall below current levels. When interest rates fall, the Company may attempt to mitigate some of this negative impact by lowering rates paid to clients on interest-bearing liabilities. The current low interest rate environment limits the extent to which the Company can reduce interest expense on funding sources. The Company may also alter the amount and type of fixed rate loans and securities that are added to the portfolio. Generally, increases in the percentage of fixed-rate assets relative to non-interest-bearing liabilities will reduce the rate at which net interest revenue changes if rates move. Non-interest bearing funding sources include non-interest bearing cash balances, stockholders’ equity and other miscellaneous assets and liabilities.

THE CHARLES SCHWAB CORPORATION Management’s Discussion and Analysis of Financial Condition and Results of Operations
(Tabular Amounts in Millions, Except Ratios, or as Noted)
- 32 -
The following table presents net interest revenue information corresponding to interest-earning assets and funding sources on the consolidated balance sheets:
Year Ended December 31, 2015 2014 2013 Interest Average Interest Average Interest Average Average Revenue/ Yield/ Average Revenue/ Yield/ Average Revenue/ Yield/ Balance Expense Rate Balance Expense Rate Balance Expense Rate
Interest-earning assets: Cash and cash equivalents $ 9,358 $ 24 0.26 % $ 7,179 $ 16 0.22 % $ 6,943 $ 16 0.23 % Cash and investments segregated 18,606 31 0.17 % 20,268 24 0.12 % 25,419 35 0.14 % Broker-related receivables (1) 274 - 0.07 % 325 - 0.09 % 377 - 0.04 % Receivables from brokerage clients 15,212 502 3.30 % 13,778 482 3.50 % 11,800 434 3.68 % Securities available for sale (2) 62,249 629 1.01 % 52,057 546 1.05 % 49,114 557 1.13 % Securities held to maturity 38,280 957 2.50 % 32,361 828 2.56 % 24,915 610 2.45 % Bank loans 13,973 369 2.64 % 12,906 355 2.75 % 11,758 329 2.80 %
Total interest-earning assets 157,952 2,512 1.59 % 138,874 2,251 1.62 % 130,326 1,981 1.52 % Other interest revenue 145 123 104 Total interest-earning assets $ 157,952 $ 2,657 1.68 % $ 138,874 $ 2,374 1.71 % $ 130,326 $ 2,085 1.60 %
Funding sources: Bank deposits $ 113,464 $ 29 0.03 % $ 95,842 $ 30 0.03 % $ 85,465 $ 31 0.04 % Payables to brokerage clients 25,651 2 0.01 % 26,731 2 0.01 % 30,258 3 0.01 % Long-term debt 2,727 92 3.37 % 1,901 73 3.84 % 1,751 69 3.94 %
Total interest-bearing liabilities 141,842 123 0.09 % 124,474 105 0.08 % 117,474 103 0.09 % Non-interest-bearing funding sources 16,110 14,400 12,852 Other interest expense (3) 9 (3) 2 Total funding sources $ 157,952 $ 132 0.08 % $ 138,874 $ 102 0.07 % $ 130,326 $ 105 0.08 % Net interest revenue $ 2,525 1.60 % $ 2,272 1.64 % $ 1,980 1.52 %
(1) Interest revenue was less than $500,000 in the periods presented. (2) Amounts have been calculated based on amortized cost. (3) Includes the impact of capitalizing interest on building construction and software development.
Net interest revenue increased $253 million or 11% in 2015 from 2014 primarily due to higher average balances of interest-earning assets, partially offset by the effect of lower net interest margins. The growth in the average balances in bank deposits resulted from an increase in the uninvested cash balances in certain brokerage client accounts swept to Schwab Bank. Net interest revenue increased $292 million or 15% in 2014 from 2013 primarily due to higher average balances of interest-earning assets, including margin loans and the Company’s investment portfolio, and the effect higher average interest rates on securities held to maturity had on the Company’s average net interest margin. The growth in the average balance of bank deposits funded the increase in the balances of securities held to maturity and securities available for sale. Trading Revenue Trading revenue includes commission and principal transaction revenues. Commission revenue is affected by the number of revenue trades executed and the average revenue earned per revenue trade. Principal transaction revenue is primarily comprised of revenue from trading activity in client fixed income securities. Factors that influence principal transaction revenue include the volume of client trades and market price volatility. To accommodate clients’ fixed income trading activity, the Company maintains positions in fixed income securities, including U.S. state and municipal debt obligations, U.S. Government, corporate debt, and other securities. The difference between the price at which the Company buys and sells securities to and from its clients and other broker-dealers is recognized as principal transaction revenue. Principal transaction revenue also includes adjustments to the fair value of these securities positions.

THE CHARLES SCHWAB CORPORATION Management’s Discussion and Analysis of Financial Condition and Results of Operations
(Tabular Amounts in Millions, Except Ratios, or as Noted)
- 33 -
Growth Rate Year Ended December 31, 2014-2015 2015 2014 2013
Daily average revenue trades (in thousands) (2)% 292.0 298.2 295.0
Clients’ daily average trades (in thousands) 4 % 536.9 516.8 490.5
Number of trading days - 251.0 250.5 250.5
Average revenue per revenue trade (2)% $ 11.83 $ 12.13 $ 12.31
Trading revenue decreased by $41 million, or 5%, in 2015 from 2014 primarily due to a decrease in commission revenue as a result of lower commissions per revenue trade and lower daily average revenue trades. Trading revenue remained relatively flat in 2014 from 2013. Daily average revenue trades decreased in 2015 from 2014 primarily due to a lower volume of equity trades. Daily average revenue trades increased in 2014 from 2013 primarily due to a higher volume of equity trades, offset by a lower volume of mutual fund trades. Average revenue per revenue trade decreased 2% in 2015 compared to 2014 but remained relatively flat from 2014 to 2013. Other Revenue Other revenue includes order flow revenue, nonrecurring gains, software fees from the Company’s portfolio management services, exchange processing fees, and other service fees. Other revenue decreased by $15 million, or 4%, in 2015 compared to 2014 primarily due to lower order flow revenue. Order flow revenue was $103 million during 2015 compared to $114 million during 2014. The decrease was primarily due to changes in the composition and volume of different types of orders and the fees and rebates for such orders. Other revenue in 2015 also includes net litigation proceeds of $75 million related to the Company’s non-agency RMBS portfolio. Other revenue in 2014 includes a net insurance settlement of $45 million and net litigation proceeds of $28 million related to the Company’s non-agency RMBS portfolio. Other revenue increased by $107 million, or 45%, in 2014 compared to 2013 primarily due to a net insurance settlement of $45 million, net litigation proceeds of $28 million related to the Company’s non-agency RMBS portfolio, and increases in order flow revenue. Order flow revenue was $114 million during 2014 compared to $99 million during 2013. The increase was due to higher rebates received and higher volumes for certain types of orders. Expenses Excluding Interest The following table shows a comparison of expenses excluding interest:
Growth Rate Year Ended December 31, 2014-2015 2015 2014 2013
Compensation and benefits 3 % $ 2,241 $ 2,184 $ 2,027 Professional services - 459 457 415 Occupancy and equipment 9 % 353 324 309 Advertising and market development 2 % 249 245 257 Communications 4 % 233 223 220 Depreciation and amortization 13 % 224 199 202 Other 10 % 342 311 300
Total expenses excluding interest 4 % $ 4,101 $ 3,943 $ 3,730 Expenses as a percentage of total net revenues:
Compensation and benefits 35 % 36 % 37 % Advertising and market development 4 % 4 % 5 %

THE CHARLES SCHWAB CORPORATION Management’s Discussion and Analysis of Financial Condition and Results of Operations
(Tabular Amounts in Millions, Except Ratios, or as Noted)
- 34 -
Compensation and Benefits Compensation and benefits expense includes salaries and wages, incentive compensation, and related employee benefits and other. Incentive compensation includes variable compensation, discretionary bonuses, and stock-based compensation. Variable compensation includes payments to certain individuals based on their sales performance. Discretionary bonuses are based on the Company’s overall performance as measured by EPS, and therefore fluctuate with this measure. Stock-based compensation primarily includes employee and board of director stock options and restricted stock. The following table shows a comparison of certain compensation and benefits components and employee data:
Growth Rate
Year Ended December 31, 2014-2015 2015 2014 2013
Salaries and wages 1 % $ 1,258 $ 1,245 $ 1,110 Incentive compensation 2 % 618 605 599 Employee benefits and other 9 % 365 334 318
Total compensation and benefits expense 3 % $ 2,241 $ 2,184 $ 2,027
Full-time equivalent employees (in thousands) At year end 5 % 15.3 14.6 13.8 Average 6 % 15.1 14.2 13.9
Salaries and wages increased in 2015 from 2014 primarily due to higher employee headcount and annual salary increases, partially offset by a $68 million charge in 2014 for estimated future severance benefits resulting from changes in the Company’s geographic footprint. Incentive compensation increased in 2015 from 2014 primarily due to the earlier recognition of certain equity-based incentives due to plan changes offset by a reduction in long-term incentive plan expenses. Employee benefits and other expense increased in 2015 from 2014 due to increases in healthcare costs and higher employee headcount. Salaries and wages increased in 2014 from 2013 primarily due to a $68 million charge in 2014 for estimated future severance benefits resulting from changes in the Company’s geographic footprint and due to annual salary increases. Incentive compensation was relatively flat in 2014 from 2013 primarily due to an increase in discretionary bonus costs, offset by a higher 2013 expense related to a new payout schedule for field incentive plans. Expenses Excluding Compensation and Benefits Professional services remained relatively flat in 2015 compared to 2014. Professional services expense increased in 2014 from 2013 primarily due to higher spending on technology services and an increase in fees paid to outsourced service providers and consultants. Occupancy and equipment expense increased in 2015 from 2014 primarily due to increased software maintenance expense relating to the Company’s information technology systems and an increase in property taxes and other expenses attributable to the changes in the Company’s geographic footprint. Occupancy and equipment expense increased in 2014 from 2013 primarily due to increased software maintenance expenses relating to the Company’s information technology systems. Advertising and market development increased in 2015 compared to 2014 due to increased electronic and other media expenses and spending on client promotions, partially offset by a decrease in corporate sponsorships and print ad media expenses. Advertising and market development expense decreased in 2014 from 2013 primarily due to production costs incurred in 2013 relating to the development of the Company’s advertising and branding initiative, Own your tomorrow®, partially offset by higher 2014 spending on client promotions. Communication expense increased in 2015 compared to 2014 due to increases in news and informational communications, partially offset by a decrease in postage expenses. Communication expense remained relatively flat in 2014 compared to 2013.

THE CHARLES SCHWAB CORPORATION Management’s Discussion and Analysis of Financial Condition and Results of Operations
(Tabular Amounts in Millions, Except Ratios, or as Noted)
- 35 -
Depreciation and amortization expense increased in 2015 compared to 2014 primarily due to increased amortization of internally-developed software associated with the Company’s investment in software and technology enhancements and increased depreciation related to new buildings and equipment associated with the Company’s expanded geographic footprint. Depreciation and amortization expense remained relatively flat in 2014 compared to 2013. The Company’s capital expenditures were $285 million (5% of net revenues), $405 million (7% of net revenues), and $270 million (5% of net revenues) in 2015, 2014 and 2013, respectively. The decrease in capital expenditures in 2015 from 2014 was primarily due to lower investment in buildings and land relating to the change in the Company’s geographic footprint. Capitalized costs for developing internal-use software were $107 million, $81 million and $74 million in 2015, 2014 and 2013. Management currently anticipates that 2016 capital expenditures will be approximately 46% higher than 2015 primarily due to spending on land, leasehold improvements, information technology equipment and capitalized costs for internal use software. Other expense increased in 2015 from 2014 primarily due to increases in FDIC insurance assessments due to higher bank deposits, legal expenses and miscellaneous items. Other expense increased in 2014 from 2013 primarily due to higher travel costs as a result of increased employee headcount and travel. Taxes on Income The Company’s effective income tax rate on income before taxes was 36.5% in 2015, 37.5% in 2014, and 37.2% in 2013. The decrease in 2015 from 2014 was primarily due to the recognition of net tax benefits relating to certain current and prior-year matters. The increase in 2014 from 2013 was primarily due to the impact of a non-recurring state tax benefit in 2013. Segment Information The Company provides financial services to individuals and institutional clients through two segments – Investor Services and Advisor Services. The Investor Services segment provides retail brokerage and banking services, retirement plan services, and other corporate brokerage services. The Advisor Services segment provides custodial, trading, and support services as well as retirement business services. Revenues and expenses are allocated to the Company’s two segments based on which segment services the client. The Company evaluates the performance of its segments on a pre-tax basis, excluding items such as restructuring and other charges. Segment assets and liabilities are not used for evaluating segment performance or in deciding how to allocate resources to segments. For additional information on the products and services offered by each segment, please see “Item 1 – Business.”
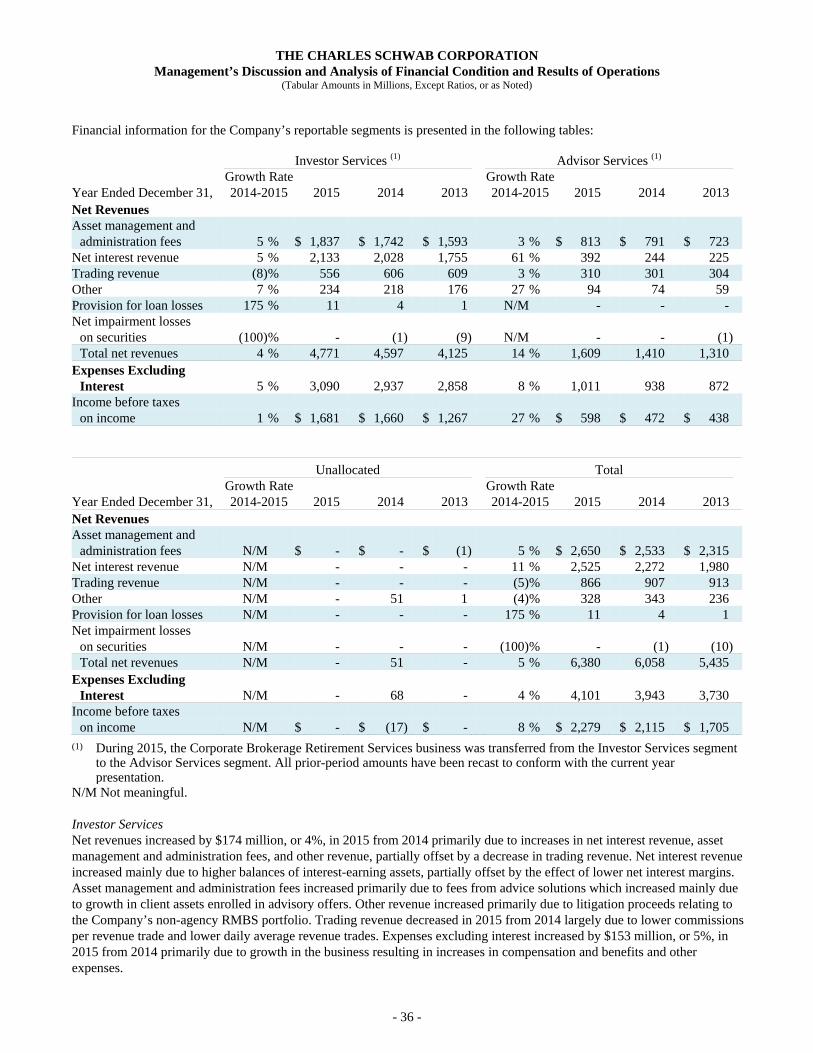
THE CHARLES SCHWAB CORPORATION Management’s Discussion and Analysis of Financial Condition and Results of Operations
(Tabular Amounts in Millions, Except Ratios, or as Noted)
- 36 -
Financial information for the Company’s reportable segments is presented in the following tables:
Investor Services (1) Advisor Services (1) Growth Rate Growth Rate Year Ended December 31, 2014-2015 2015 2014 2013 2014-2015 2015 2014 2013 Net Revenues Asset management and
administration fees 5 % $ 1,837 $ 1,742 $ 1,593 3 % $ 813 $ 791 $ 723Net interest revenue 5 % 2,133 2,028 1,755 61 % 392 244 225Trading revenue (8) % 556 606 609 3 % 310 301 304Other 7 % 234 218 176 27 % 94 74 59Provision for loan losses 175 % 11 4 1 N/M - - -Net impairment losses
on securities (100) % - (1) (9) N/M - - (1)Total net revenues 4 % 4,771 4,597 4,125 14 % 1,609 1,410 1,310
Expenses Excluding Interest 5 % 3,090 2,937 2,858 8 % 1,011 938 872
Income before taxes on income 1 % $ 1,681 $ 1,660 $ 1,267 27 % $ 598 $ 472 $ 438
Unallocated Total Growth Rate Growth Rate Year Ended December 31, 2014-2015 2015 2014 2013 2014-2015 2015 2014 2013 Net Revenues Asset management and
administration fees N/M $ - $ - $ (1) 5 % $ 2,650 $ 2,533 $ 2,315Net interest revenue N/M - - - 11 % 2,525 2,272 1,980Trading revenue N/M - - - (5)% 866 907 913Other N/M - 51 1 (4)% 328 343 236Provision for loan losses N/M - - - 175 % 11 4 1Net impairment losses
on securities N/M - - - (100)% - (1) (10)Total net revenues N/M - 51 - 5 % 6,380 6,058 5,435
Expenses Excluding Interest N/M - 68 - 4 % 4,101 3,943 3,730
Income before taxes on income N/M $ - $ (17) $ - 8 % $ 2,279 $ 2,115 $ 1,705
(1) During 2015, the Corporate Brokerage Retirement Services business was transferred from the Investor Services segment to the Advisor Services segment. All prior-period amounts have been recast to conform with the current year presentation.
N/M Not meaningful. Investor Services Net revenues increased by $174 million, or 4%, in 2015 from 2014 primarily due to increases in net interest revenue, asset management and administration fees, and other revenue, partially offset by a decrease in trading revenue. Net interest revenue increased mainly due to higher balances of interest-earning assets, partially offset by the effect of lower net interest margins. Asset management and administration fees increased primarily due to fees from advice solutions which increased mainly due to growth in client assets enrolled in advisory offers. Other revenue increased primarily due to litigation proceeds relating to the Company’s non-agency RMBS portfolio. Trading revenue decreased in 2015 from 2014 largely due to lower commissions per revenue trade and lower daily average revenue trades. Expenses excluding interest increased by $153 million, or 5%, in 2015 from 2014 primarily due to growth in the business resulting in increases in compensation and benefits and other expenses.

THE CHARLES SCHWAB CORPORATION Management’s Discussion and Analysis of Financial Condition and Results of Operations
(Tabular Amounts in Millions, Except Ratios, or as Noted)
- 37 -
Net revenues increased by $472 million, or 11%, in 2014 from 2013 primarily due to increases in net interest revenue, asset management and administration fees, and other revenue. Net interest revenue increased primarily due to higher balances of interest-earning assets, and the effect higher average interest rates on securities held to maturity had on the Company’s average net interest margin. Asset management and administration fees increased due to fees from mutual fund services, advice solutions, and other asset management and administration services. Mutual fund and ETF service fees increased due to growth in client assets invested in the Company’s Mutual Fund OneSource funds and equity and bond funds, partially offset by a decrease in net money market mutual fund fees as a result of continued low yields on fund assets. Advice solution fees increased due to growth in client assets enrolled in advisory offers. Other revenue increased primarily due to litigation proceeds related to the Company’s non-agency RMBS portfolio and increases in order flow revenue. Expenses excluding interest increased by $79 million, or 3%, in 2014 from 2013 primarily due to increases in compensation and benefits and professional services expense, partially offset by a decrease in advertising and market development expense. Advisor Services Net revenues increased by $199 million, or 14%, in 2015 from 2014 primarily due to increases in net interest revenue, asset management and administration fees, and other revenue. Net interest revenue increased primarily due to higher balances of interest-earning assets, partially offset by the effect of lower net interest margins. Interest-earning assets have grown due to growth in brokerage client cash swept to Schwab Bank. Asset management and administration fees increased primarily due to higher net yields on money market fund assets and growth in client assets in equity and bond funds. Other revenue increased primarily due to litigation proceeds relating to the Company’s non-agency RMBS portfolio. Expenses excluding interest increased by $73 million, or 8%, in 2015 from 2014 primarily due to increases in growth in the business resulting in increases in compensation and benefits, advertising and marketing, other expenses. Net revenues increased by $100 million, or 8%, in 2014 from 2013 primarily due to an increase in asset management and administration fees, net interest revenue, and other revenue. Asset management and administration fees increased due to fees from mutual fund services, advice solutions, and other asset management and administration services. Mutual fund and ETF service fees increased due to growth in client assets invested in the Company’s Mutual Fund OneSource funds and equity and bond funds, partially offset by a decrease in net money market mutual fund fees as a result of continued low yields on fund assets. Advice solutions fees increased due to growth in client assets enrolled in advisory offers. Net interest revenue increased primarily due to higher balances of interest-earning assets, including margin loans and the Company’s investment portfolio, and the effect higher average interest rates on securities held to maturity had on the Company’s average net interest margin. Other revenue increased primarily due to increases in order flow revenue. Expenses excluding interest increased by $66 million, or 8%, in 2014 from 2013 primarily due to increases in compensation and benefits and professional services expense. Unallocated Other revenue decreased in 2015 from 2014 due to a net insurance settlement of $45 million in 2014. Expenses excluding interest decreased in 2015 from 2014 as a result of a $68 million charge in 2014 for estimated future severance benefits resulting from changes in the Company’s geographic footprint. RISK MANAGEMENT The Company’s business activities expose it to a variety of risks, including operational, credit, market, liquidity, compliance and legal risk. The Company has a comprehensive risk management program to identify and manage these risks and their associated potential for financial and reputational impact. Despite the Company’s efforts to identify areas of risk and implement risk management policies and procedures, there can be no assurance that the Company will not suffer unexpected losses due to these risks. The Company’s risk management process is comprised of risk identification and assessment, risk measurement, risk monitoring and reporting and risk mitigation. The activities and organizations that comprise the risk management process are described below.

THE CHARLES SCHWAB CORPORATION Management’s Discussion and Analysis of Financial Condition and Results of Operations
(Tabular Amounts in Millions, Except Ratios, or as Noted)
- 38 -
Risk Culture The Board of Directors has approved an Enterprise Risk Management (ERM) framework that incorporates the Company’s purpose, vision and values to form the bedrock of its risk culture and set the tone for the organization. The ERM Framework and governance structure constitute a comprehensive approach to managing risks encountered by the Company in its business activities. The framework incorporates key concepts commensurate with the size, risk profile, complexity, and continuing growth of the Company. Risk appetite, which is defined as the amount of risk the Company is willing to accept in pursuit of its corporate strategy, is set by executive management and approved by the Board of Directors. Risk Governance Senior management takes an active role in the risk management process and has developed policies and procedures under which specific business and control units are responsible for identifying, measuring and controlling risks. The Global Risk Committee, which is comprised of senior executives from each major business and control function, is responsible for the oversight of risk management. This includes identifying emerging risks, assessing risk management practices and the control environment, reinforcing business accountability for risk management, supervisory controls and regulatory compliance, supporting resource prioritization across the Company, and escalating significant issues to the Board of Directors. The Company has established risk metrics and reporting that enable measurement of the impact of strategy execution against risk appetite. The risk metrics, with risk limits and tolerance levels, are established for key risk categories by the Global Risk Committee and its functional risk sub-committees. The Global Risk Committee reports regularly to the Risk Committee of the Board of Directors. The Risk Committee in turn assists the Board of Directors in fulfilling its oversight responsibilities with respect to the Company’s risk management program, including approving risk appetite statements and reviewing reports relating to risk issues from functional areas of risk management, legal, compliance, and internal audit. Functional risk sub-committees focusing on specific areas of risk report to the Global Risk Committee. These sub-committees include the:
Asset-Liability Management and Pricing Committee, which establishes strategies and policies for the management of corporate capital, liquidity, interest rate risk, and investments;
Compliance Risk Committee, which provides oversight of compliance risk management programs and policies providing an aggregate view of compliance risk exposure;
Credit and Market Risk Oversight Committee, which provides oversight of and approves credit and market risk policies, limits, and exposures in loan, investment, and positioning portfolios;
New Products and Services Risk Oversight Committee, which provides oversight of, and approves corporate policy and procedures relating to the risk governance of new products and services; and the
Operational Risk Oversight Committee, which provides oversight of and approves operational risk management policies, risk tolerance levels, and operational risk governance processes, and includes the following sub-committees:
o Client Fiduciary Risk Sub-Committee, which provides oversight of fiduciary risk throughout the Company; o Global Data Subcommittee, which oversees and approves corporate policies and standards related to
enterprise data governance; o Information Security and Privacy Sub-Committee, which provides oversight of the information and cyber
security and privacy programs and policies; o Model Governance Sub-Committee, which provides oversight of model risk throughout the Company; and
the o Vendor Management Sub-Committee, which provides oversight of the Company’s vendor management and
outsourcing program and policies.
THE CHARLES SCHWAB CORPORATION Management’s Discussion and Analysis of Financial Condition and Results of Operations
(Tabular Amounts in Millions, Except Ratios, or as Noted)
- 39 -
Senior management has also created an Incentive Compensation Risk Oversight Committee, which establishes policy and reviews and approves the Annual Risk Assessment of incentive compensation plans, and reports directly to the Board Compensation Committee. The Company’s compliance, finance, internal audit, legal, and corporate risk management departments assist management and the various risk committees in evaluating, testing, and monitoring the Company’s risk management. In addition, the Company’s Disclosure Committee is responsible for monitoring and evaluating the effectiveness of the Company’s (a) disclosure controls and procedures and (b) internal control over financial reporting as of the end of each fiscal quarter. The Disclosure Committee reports on this evaluation to the CEO and CFO prior to their certification required by Sections 302 and 906 of the Sarbanes Oxley Act of 2002. Operational Risk Operational risks arise due to potentially inadequate or failed internal processes, people, and systems or from external events and relationships impacting the Company and/or any of its key business partners and vendors. Operational risk includes fiduciary, information security, legal, and model risk, and each is also described in detail below. The Company’s operations are highly dependent on the integrity of its technology systems and the Company’s success depends, in part, on its ability to make timely enhancements and additions to its technology in anticipation of evolving client needs. To the extent the Company experiences system interruptions, errors or downtime (which could result from a variety of causes, including changes in client use patterns, technological failure, changes to its systems, linkages with third-party systems, and power failures), the Company’s business and operations could be significantly negatively impacted. To minimize business interruptions, Schwab has two data centers intended, in part, to further improve the recovery of business processing in the event of an emergency. The Company is committed to an ongoing process of upgrading, enhancing, and testing its technology systems. This effort is focused on meeting client needs, meeting market and regulatory changes, and deploying standardized technology platforms. Operational risk also includes the risk of human error, employee misconduct, external fraud, computer viruses, cyber attacks, terrorist attacks, and natural disasters. Employee misconduct could include fraud and misappropriation of client or Company assets, improper use or disclosure of confidential client or Company information, and unauthorized activities, such as transactions exceeding acceptable risks or authorized limits. External fraud includes misappropriation of client or Company assets by third parties, including through unauthorized access to Company systems and data and client accounts. The frequency and sophistication of such fraud attempts continue to increase. Operational risk is mitigated through a system of internal controls and risk management practices that are designed to keep operational risk and operational losses at levels appropriate to the inherent risk of the business in which the Company operates. The Company has specific policies and procedures to identify and manage operational risk, and uses periodic risk self-assessments and internal audit reviews to evaluate the effectiveness of these internal controls. The Company maintains backup and recovery functions, including facilities for backup and communications, and conducts periodic testing of disaster recovery plans. The Company also maintains policies and procedures and technology to protect against fraud and unauthorized access to systems and data. Despite the Company’s risk management efforts, it is not always possible to deter or prevent technological or operational failure, or fraud or other misconduct, and the precautions taken by the Company may not be effective in all cases. The Company may be subject to litigation, losses, and regulatory actions in such cases, and may be required to expend significant additional resources to remediate vulnerabilities or other exposures. The Company also faces operational risk when it employs the services of various external vendors, including domestic and international outsourcing of certain technology, processing, servicing, and support functions. The Company manages its exposure to external vendor risk through contractual provisions, control standards, and ongoing monitoring of vendor performance. The Company maintains policies and procedures regarding the standard of care expected with Company data, whether the data is internal company information, employee information, or non-public client information. The Company

THE CHARLES SCHWAB CORPORATION Management’s Discussion and Analysis of Financial Condition and Results of Operations
(Tabular Amounts in Millions, Except Ratios, or as Noted)
- 40 -
clearly defines for employees, contractors, and vendors the Company’s expected standards of care for confidential data. Regular training is provided by the Company in regard to data security. The Company is actively engaged in the research and development of new technologies, services, and products. The Company endeavors to protect its research and development efforts, and its brands, through the use of copyrights, patents, trade secrets, and contracts. Fiduciary Risk Fiduciary risk is the potential for financial or reputational loss through breach of fiduciary duties to a client. Fiduciary activities include, but are not limited to, individual and institutional trust, investment management, custody, and cash and securities processing. The Company attempts to manage this risk by establishing procedures to ensure that obligations to clients are discharged faithfully and in compliance with applicable legal and regulatory requirements. Business units have the primary responsibility for adherence to the procedures applicable to their business. Guidance and control are provided through the creation, approval, and ongoing review of applicable policies by business units and various risk committees. Information Security Risk Information Security risk is the potential for unauthorized access, use, disclosure, disruption, modification, perusal, inspection, recording or destruction of the firm’s information or systems. The Company has designed and implemented a security program that knits together complementary tools, controls and technologies to protect systems, client accounts and data. The Company continuously monitors the systems and works collaboratively with government agencies, law enforcement and other financial institutions to address potential threats. The Company uses advanced monitoring systems to identify suspicious activity and deter unauthorized access by internal or external actors. The Company limits the number of employees who have access to clients’ personal information and enforces internal authentication measures to protect against the potential for social engineering. All employees who handle sensitive information are trained in privacy and security. Schwab’s fraud and Cyber security teams monitor activity looking for suspicious behavior. These capabilities allow the Company to identify and quickly act on any attempted intrusions. Legal Risk Legal risk is the risk of a claim for damages or other relief brought by clients, employees or third parties, alleging a breach of legal requirements or other duties under law. This risk may occur as a result of operational failure but may also occur as a result of other factors. The financial services industry is subject to substantial litigation risk, and the firm incurs legal claims in the ordinary course of business. Increased litigation costs or substantial legal liability relating to an extraordinary claim or incidence of claims could have a material adverse effect on the Company’s business and financial condition. For information about the Company’s legal risk, see “Item 1A – Risk Factors,” and “Item 8 – Financial Statements and Supplementary Data – Notes to Consolidated Financial Statements – 15. Commitments and Contingencies.” Model Risk Model risk is the potential for adverse consequences from decisions based on incorrect or misused model outputs and reports. Models are owned by several business units throughout the Company, and are used for a variety of purposes. Model use includes, but is not limited to, calculating capital requirements for hypothetical stressful environments, estimating interest and credit risk for loans and other balance sheet assets, and providing guidance in the management of client portfolios. The Company has established a policy to describe the roles and responsibilities of all key stakeholders in model development, management, and use. All models at the Company are registered in a centralized database and classified into different risk ratings depending on their potential financial, reputational, or regulatory impact to the Company. The model risk rating informs the scope of all model governance activities.

THE CHARLES SCHWAB CORPORATION Management’s Discussion and Analysis of Financial Condition and Results of Operations
(Tabular Amounts in Millions, Except Ratios, or as Noted)
- 41 -
Compliance Risk The Company faces significant compliance risk in its business, that is, the risk of legal or regulatory sanctions, fines or penalties, financial loss, or damage to reputation resulting from the failure to comply with laws, regulations, rules, or other regulatory requirements. Among other things, compliance risks relate to the suitability of client investments, conflicts of interest, disclosure obligations and performance expectations for Company products and services, supervision of employees, and the adequacy of the Company’s controls. The Company and its affiliates are subject to extensive regulation by federal, state and foreign regulatory authorities, including SROs. Such regulation is becoming increasingly extensive and complex, and regulatory proceedings and sanctions against financial services firms continue to increase. The Company attempts to manage compliance risk through policies, procedures and controls reasonably designed to achieve and/or monitor compliance with applicable legal and regulatory requirements. These procedures address issues such as business conduct and ethics, sales and trading practices, marketing and communications, extension of credit, client funds and securities, books and records, anti-money laundering, client privacy, and employment policies. Despite the Company’s efforts to maintain an effective compliance program and internal controls, legal breaches and rule violations could result in reputational harm, significant losses and disciplinary sanctions, including limitations on the Company’s business activities. Credit Risk Credit risk is the potential for loss due to a borrower, counterparty, or issuer failing to perform its contractual obligations. The nature and amount of credit risk depends on the type of transaction, the structure and duration of that transaction, and the parties involved. The Company’s exposure to credit risk mainly results from margin lending and client option and futures activities, securities lending activities, mortgage lending activities, pledged asset lending, its role as a counterparty in financial contracts and other investing activities. To manage the risks of such losses, the Company has established policies and procedures which include: establishing and reviewing credit limits, monitoring of credit limits and quality of counterparties, and adjusting margin, PAL, option, and futures requirements for certain securities. Collateral arrangements relating to margin loans, PALs, option positions, securities lending agreements, and resale agreements include provisions that require additional collateral in the event market fluctuations result in declines in the value of collateral received. Additionally, for margin loan, PAL and securities lending agreements, collateral arrangements require that the fair value of such collateral exceeds the amounts loaned. Schwab performs clearing services for all securities transactions in its client accounts. Schwab has exposure to credit risk due to its obligation to settle transactions with clearing corporations, mutual funds, and other financial institutions even if Schwab’s client or a counterparty fails to meet its obligations to Schwab. The Company’s bank loan portfolio includes First Mortgages, HELOCs, PALs and other loans. The credit risk exposure related to loans is actively managed through individual and portfolio reviews performed by management. Management regularly reviews asset quality, including concentrations, delinquencies, nonaccrual loans, charge-offs, and recoveries. All are factors in the determination of an appropriate allowance for loan losses. The Company’s residential loan underwriting guidelines include maximum loan-to-value (LTV) ratios, cash out limits, and minimum Fair Isaac Corporation (FICO) credit scores. The specific guidelines are dependent on the individual characteristics of a loan (for example, whether the property is a primary or secondary residence, whether the loan is for investment property, whether the loan is for an initial purchase of a home or refinance of an existing home, and whether the loan size is conforming or jumbo). The Company does not originate or purchase residential loans that allow for negative amortization and does not purchase subprime loans (generally defined as extensions of credit to borrowers with a FICO score of less than 620 at origination), unless the borrower has compensating credit factors. At December 31, 2015, approximately 1% of both the First Mortgage and HELOC portfolios consisted of loans to borrowers with updated borrower FICO (updated FICO) scores of less than 620.

THE CHARLES SCHWAB CORPORATION Management’s Discussion and Analysis of Financial Condition and Results of Operations
(Tabular Amounts in Millions, Except Ratios, or as Noted)
- 42 -
At December 31, 2015, the weighted-average originated LTV ratio was 58% and 59% for the First Mortgage and HELOC portfolios, respectively. The computation of the LTV ratios at origination (origination LTV) for a HELOC includes any first lien mortgage outstanding on the same property at the time of origination. At December 31, 2015, 21% of HELOCs ($583 million of the HELOC portfolio) were in a first lien position. The weighted-average originated FICO score was 771 and 769 for the First Mortgage and HELOC portfolios, respectively. The Company monitors the estimated current LTV ratios (estimated current LTV) of its First Mortgage and HELOC portfolios on an ongoing basis. At December 31, 2015, the weighted-average estimated current LTV ratios were 48% and 51% for the First Mortgage and HELOC portfolios, respectively. The computation of the estimated current LTV ratio for a HELOC includes any first lien mortgage outstanding on the same property at the time of the HELOC’s origination. The Company estimates the current LTV ratio for each loan by reference to a home price appreciation index. The Company also monitors updated borrower FICO scores, delinquency trends, and verified liquid assets held by individual borrowers. At December 31, 2015, the weighted-average updated FICO scores were 773 and 770 for the First Mortgage and HELOC portfolios, respectively. A portion of the Company’s HELOC portfolio is secured by second liens on the associated properties. Second lien mortgage loans possess a higher degree of credit risk given the subordination to the first lien holder in the event of default. At December 31, 2015, $2.2 billion, or 79%, of the HELOC portfolio was in a second lien position. In addition to the credit monitoring activities described above, the Company also monitors credit risk on second lien HELOC loans by reviewing the delinquency status of the first lien loan on the associated property. At December 31, 2015, approximately 28% of the HELOC borrowers that had a balance only paid the minimum amount of interest due or less. For more information on the Company’s credit quality indicators relating to its First Mortgage and HELOC portfolios, including delinquency characteristics, borrower FICO scores at origination, updated borrower FICO scores, LTV ratios at origination, and estimated current LTV ratios, see “Item 8 – Financial Statements and Supplementary Data – Notes to Consolidated Financial Statements – 6. Bank Loans and Related Allowance for Loan Losses.” The following table presents certain of the Company’s bank loan quality metrics as a percentage of total outstanding loans:
December 31, 2015 2014
Loan delinquencies (1) 0.25 % 0.27 % Nonaccrual loans 0.19 % 0.26 % Allowance for loan losses 0.22 % 0.31 %
(1) Loan delinquencies include loans that are 30 days or more past due and other nonaccrual loans.
The Company has exposure to credit risk associated with its available for sale and held to maturity securities which include U.S. agency and non-agency mortgage-backed securities, asset-backed securities, corporate debt securities, U.S. agency notes, U.S. Treasury securities, certificates of deposit, and U.S. state and municipal securities. At December 31, 2015, substantially all securities in the available for sale and held to maturity portfolios were rated investment grade (defined as a rating equivalent to a Moody’s rating of “Baa” or higher, or a Standard & Poor’s rating of “BBB-” or higher). U.S. agency mortgage-backed securities do not have explicit credit ratings; however, management considers these to be of the highest credit quality and rating given the guarantee of principal and interest by the U.S. government-sponsored enterprises. Concentration Risk The Company has exposure to concentration risk when holding large positions in financial instruments collateralized by assets with similar economic characteristics or in securities of a single issuer or within a particular industry or geographical area.

THE CHARLES SCHWAB CORPORATION Management’s Discussion and Analysis of Financial Condition and Results of Operations
(Tabular Amounts in Millions, Except Ratios, or as Noted)
- 43 -
The fair value of the Company’s investments in mortgage-backed securities totaled $72.3 billion at December 31, 2015. Of these, $71.0 billion were issued by U.S. agencies and $1.3 billion were issued by private entities (non-agency securities). These U.S. agency and non-agency securities are included in securities available for sale and securities held to maturity. The fair value of the Company’s investments in asset-backed securities totaled $21.5 billion at December 31, 2015. Schwab holds $11.4 billion floating rate Federal Family Education Loan Program Asset-Backed Securities (FFELP ABS). Two Nationally Recognized Statistical Rating Organizations have placed a portion of FFELP ABS on review for downgrade. Both agencies have indicated that some classes could be downgraded below investment grade due to the risk that some remainder of the securities could be outstanding after their legal final maturity date. The timing of FFELP ABS principal payments is inherently uncertain given the variety of payment options available to student loan borrowers. Loans collateralizing these securities continue to offer a guarantee from the Department of Education of at least 97%. Schwab holds only senior class notes that have additional credit enhancement of 3% or more that, together with the Department of Education guarantee, provide 100% or more credit enhancement. The Company has an independent credit assessment function and it does not rely on rating agencies. The Company does not consider these securities to be impaired because it expects full payment of principal and interest. Therefore, the Company continues to assign them the highest internal credit rating. The fair value of the Company’s investments in corporate debt securities and commercial paper totaled $11.1 billion at December 31, 2015, with the majority issued by institutions in the financial services industry. These securities are included in securities available for sale, cash and cash equivalents, and other securities owned in the Company’s consolidated balance sheets. Issuer, geographic, and sector concentrations are controlled by established credit policy limits to each concentration type. The Company’s bank loans include $7.5 billion of adjustable rate First Mortgage loans at December 31, 2015. The Company’s adjustable rate mortgages have initial fixed interest rates for three to ten years and interest rates that adjust annually thereafter. Approximately 39% of these mortgages consisted of loans with interest-only payment terms. The interest rates on approximately 53% of these interest-only loans are not scheduled to reset for three or more years. The Company’s mortgage loans do not include interest terms described as temporary introductory rates below current market rates. The Company’s HELOC product has a 30-year loan term with an initial draw period of ten years from the date of origination. After the initial draw period, the balance outstanding at such time is converted to a 20-year amortizing loan. The interest rate during the initial draw period and the 20-year amortizing period is a floating rate based on the prime rate plus a margin. HELOCs that convert to an amortizing loan may experience higher delinquencies and higher loss rates than those in the initial draw period. The Company’s allowance for loan loss methodology takes this increased inherent risk into consideration. The following table presents when current outstanding HELOCs will convert to amortizing loans:
December 31, 2015 Balance
Converted to amortizing loan by period end $ 461
Within 1 year 166 > 1 year – 3 years 973 > 3 years – 5 years 334 > 5 years 801
Total $ 2,735 The Company also has exposure to concentration risk from its margin and securities lending, PAL, and client option and futures activities collateralized by or referencing securities of a single issuer, an index, or within a single industry. This concentration risk is mitigated by collateral arrangements that require the fair value of such collateral exceeds the amounts loaned. The Company has indirect exposure to U.S. Government and agency securities held as collateral to secure its resale agreements. The Company’s primary credit exposure on these resale transactions is with its counterparty. The Company would have exposure to the U.S. Government and agency securities only in the event of the counterparty’s default on the resale agreements. The fair value of U.S. Government and agency securities held as collateral for resale agreements totaled $8.2 billion at December 31, 2015.

THE CHARLES SCHWAB CORPORATION Management’s Discussion and Analysis of Financial Condition and Results of Operations
(Tabular Amounts in Millions, Except Ratios, or as Noted)
- 44 -
Foreign Holdings The Company has exposure to non-sovereign financial and non-financial institutions in foreign countries. The majority of the Company’s foreign investments, at fair value, of $1.5 billion, $1.4 billion and $1.1 billion are in Canada, Australia and France, respectively, at December 31, 2015. These exposures are based on which country the issuer or counterparty is domiciled. The Company has no direct exposure to sovereign foreign governments. The Company does not have unfunded commitments to counterparties in foreign countries, nor does it have exposure as a result of credit default protection purchased or sold separately as of December 31, 2015. In addition to direct holdings in foreign companies, the Company also has indirect exposure to foreign countries through its investments in Schwab sponsored money market funds (collectively, the Funds) resulting from clearing activities. At December 31, 2015, the Company had $261 million in investments in these Funds. Certain of the Funds’ positions include certificates of deposits, time deposits, commercial paper and corporate debt securities issued by counterparties in foreign countries. Market Risk Market risk is the potential for changes in earnings or the value of financial instruments held by the Company as a result of fluctuations in interest rates, equity prices or market conditions. Included in market risk is interest rate risk, which is the risk to earnings or capital arising from movement of interest rates. For discussion of the Company’s market risk, see “Item 7A – Quantitative and Qualitative Disclosures About Market Risk.” Liquidity Risk Liquidity risk arises from the inability to meet obligations when they come due without incurring unacceptable losses. It is the risk that valuations will be negatively affected by changes in demand and the underlying market for a financial instrument. Limits and contingency funding scenarios have been established for the Company to support liquidity levels and quality during both expected and stressed scenarios. The Company seeks to maintain client confidence in its balance sheet and the safety of client assets by maintaining liquidity and diversity of funding sources to allow the Company to meet its obligations under both expected and stressed scenarios. See “Liquidity” for additional detail on the Company’s liquidity requirements. LIQUIDITY CSC’s liquidity needs are primarily driven by the liquidity and capital needs of Schwab Bank and Schwab, the amount of dividend payments on CSC’s common and preferred stock and principal and interest due on corporate debt. The liquidity needs of its brokerage subsidiaries are primarily driven by client activity including trading and margin borrowing activities and capital expenditures; and the liquidity needs of its bank subsidiary are primarily driven by lending and investment activities and client withdrawals of deposits. The Company has established liquidity policies to support the successful execution of its business strategies, while ensuring ongoing and sufficient liquidity to meet its operational needs and satisfy applicable regulatory requirements under both normal and stress conditions. The Company employs a variety of methodologies to monitor and manage liquidity. The Company conducts regular liquidity stress testing to develop a consolidated view of liquidity risk exposures and to ensure the Company’s ability to maintain sufficient liquidity during market-related or company-specific liquidity stress events. Liquidity is also tested at key subsidiaries and results are reported on a monthly basis to the Company’s Corporate Asset-Liability Management and Pricing Committee. A number of early warning indicators are monitored to help identify emerging liquidity stresses in the market or within the Company and are reviewed with management as appropriate.

THE CHARLES SCHWAB CORPORATION Management’s Discussion and Analysis of Financial Condition and Results of Operations
(Tabular Amounts in Millions, Except Ratios, or as Noted)
- 45 -
As of January 1, 2016, the Company is required to comply with the modified LCR rule. This rule was adopted to help regulators ensure that large financial institutions have sufficient liquidity to withstand a short-term stress scenario, and is measured by comparing available high quality liquid assets against prescriptive cash outflows over a 30 day horizon. The Company is currently in compliance with the fully phased-in modified LCR rule. Primary Funding Sources The Company’s primary source of funds is cash generated by client activity: bank deposits and cash balances in brokerage client accounts. In 2015 bank deposits swept from brokerage accounts increased $26.0 billion. These funds were used to invest in interest earning assets, thereby funding a significant portion of the 19% growth in the Company’s balance sheet. Other sources of funds may include cash flows from operations, maturities and sales of investment securities, repayments on loans, securities lending, and cash provided by external financing or equity offerings. To meet daily funding needs, the Company maintains liquidity in the form of overnight cash deposits and short-term investments. For unanticipated liquidity needs, the Company maintains high-quality liquid assets, currently comprised of U.S. Treasury notes. Additional Funding Sources In addition to internal sources of liquidity, the Company has sources of external funding. CSC maintains a $750 million committed, unsecured credit facility with a group of banks that is scheduled to expire in June 2016. Other than an overnight borrowing to test the availability of this facility, it was unused during 2015. The funds under this facility are available for general corporate purposes. The financial covenants require Schwab to maintain a minimum net capital ratio, Schwab Bank to be well capitalized, and CSC to maintain a minimum level of stockholders’ equity, adjusted to exclude AOCI. At December 31, 2015, the minimum level of stockholders’ equity required under this facility was $8.9 billion (CSC’s stockholders’ equity, excluding accumulated other comprehensive income, at December 31, 2015 was $13.5 billion). Management believes that these restrictions will not have a material effect on CSC’s ability to meet foreseeable dividend or funding requirements. CSC and Schwab also have access to uncommitted, unsecured bank credit lines with several banks. The need for short-term borrowings arises primarily from timing differences between cash flow requirements, scheduled liquidation of interest-earning investments, and movements of cash to meet regulatory brokerage client cash segregation requirements. Schwab used such borrowings for six days in 2015, with average daily amounts borrowed of $137 million. These lines were not used by CSC during 2015. There were no borrowings outstanding under these lines at December 31, 2015. To partially satisfy the margin requirement of client option transactions with the Options Clearing Corporation, the broker-dealer subsidiaries have unsecured standby letter of credit agreements (LOCs) with several banks in favor of the Options Clearing Corporation aggregating $295 million at December 31, 2015. There were no funds drawn under any of these LOCs during 2015 or 2014. In connection with its securities lending activities, the Company is required to provide collateral to certain brokerage clients. The collateral requirements were satisfied by providing cash as collateral. Schwab Bank has access to short-term secured funding through the Federal Reserve’s discount window. Amounts available under the Federal Reserve discount window are dependent on the fair value of certain of Schwab Bank’s securities available for sale and/or securities held to maturity that are pledged as collateral. Schwab Bank maintains policies and procedures necessary to access this funding and tests discount window borrowing procedures on a periodic basis. At December 31, 2015, $2.0 billion was available under this arrangement. There were no funds drawn under this arrangement during 2015, except for testing purposes. Schwab Bank also maintains a secured credit facility with the Federal Home Loan Bank of San Francisco. Amounts available under this facility are dependent on the amount of Schwab Bank’s residential real estate mortgages and HELOCs that are pledged as collateral. Schwab Bank maintains policies and procedures necessary to access this funding and tests borrowing

THE CHARLES SCHWAB CORPORATION Management’s Discussion and Analysis of Financial Condition and Results of Operations
(Tabular Amounts in Millions, Except Ratios, or as Noted)
- 46 -
procedures on a periodic basis. At December 31, 2015, $9.3 billion was available under this facility. There were no funds drawn under this facility during 2015, except for testing purposes. CSC has authorization from its Board of Directors to issue unsecured commercial paper notes (Commercial Paper Notes) not to exceed $1.5 billion. Management has set a current limit for the commercial paper program not to exceed the amount of the committed, unsecured credit facility, which was $750 million at December 31, 2015. The maturities of the Commercial Paper Notes may vary, but are not to exceed 270 days from the date of issue. The commercial paper is not redeemable prior to maturity and cannot be voluntarily prepaid. The proceeds of the commercial paper program are to be used for general corporate purposes. CSC’s ratings for these short-term borrowings are P1 by Moody’s, A1 by Standard & Poor’s, and F1 by Fitch. There were no borrowings of Commercial Paper Notes outstanding at December 31, 2015 or 2014. At December 31, 2015 and 2014, CSC had long-term debt of $2.9 billion and $1.9 billion, respectively, which bears interest at a weighted-average rate of 3.38%. CSC has a universal automatic shelf registration statement (Shelf Registration Statement) on file with the SEC which enables it to issue debt, equity, and other securities. On March 10, 2015, CSC issued $625 million aggregate principal amount of Senior Notes that mature in 2018 and $375 million aggregate principal amount of Senior Notes that mature in 2025. The Senior Notes due 2018 and 2025 have a fixed interest rate of 1.50% and 3.00%, respectively, with interest payable semi-annually. Additionally, on November 13, 2015, CSC issued $350 million aggregate amount of 3.450% Senior Notes that mature in 2026, with interest payable semi-annually. The following are details of CSC’s long-term debt:
Par Standard December 31, 2015 Outstanding Maturity Interest Rate Moody’s & Poor’s Fitch
Senior Notes $ 2,581 2018 – 2026 1.50% to 4.45% fixed A2 A A Medium-Term Notes $ 250 2017 6.375% fixed A2 A A On August 3, 2015, CSC completed an equity offering of 24 million depositary shares, each representing a 1/40th ownership interest in a share of 6.00% non-cumulative perpetual preferred stock (Series C). The Series C preferred stock has a fixed dividend rate of 6.00%. The net proceeds from the sale were $581 million. For further discussion of CSC’s long-term debt and information on the equity offering, see “Item 8 – Financial Statements and Supplementary Data – Notes to Consolidated Financial Statements – 14. Borrowings and 18. Stockholders’ Equity.” Off-Balance Sheet Arrangements The Company enters into various off-balance sheet arrangements in the ordinary course of business, primarily to meet the needs of its clients. These arrangements include firm commitments to extend credit. Additionally, the Company enters into guarantees and other similar arrangements in the ordinary course of business. For information on each of these arrangements, see “Item 8 – Financial Statements and Supplementary Data – Notes to Consolidated Financial Statements – 6. Bank Loans and Related Allowance for Loan Losses, 14. Borrowings, 15. Commitments and Contingencies, and 16. Financial Instruments Subject to Off-Balance Sheet Credit Risk or Concentration Risk.”

THE CHARLES SCHWAB CORPORATION Management’s Discussion and Analysis of Financial Condition and Results of Operations
(Tabular Amounts in Millions, Except Ratios, or as Noted)
- 47 -
Contractual Obligations The Company’s principal contractual obligations as of December 31, 2015 are shown in the following table. Management believes that funds generated by its continuing operations, as well as cash provided by external financing, will continue to be the primary funding sources in meeting these obligations. Excluded from this table are liabilities recorded on the consolidated balance sheet that are generally short-term in nature (e.g., payables to brokers, dealers, and clearing organizations) or without contractual payment terms (e.g., bank deposits, payables to brokerage clients, and deferred compensation).
Less than 1-3 3-5 More than December 31, 2015 1 Year Years Years 5 Years Total
Credit-related financial instruments (1) $ 955 $ 1,635 $ 3,273 $ 1,975 $ 7,838 Long-term debt (2) 94 1,312 813 1,120 3,339 Leases (3) 111 191 114 172 588 Purchase obligations (4) 230 152 36 213 631
Total $ 1,390 $ 3,290 $ 4,236 $ 3,480 $ 12,396
(1) Represents Schwab Bank’s commitments to extend credit to banking clients and purchase mortgage loans.
(2) Includes estimated future interest payments through 2017 for Medium-Term Notes and through 2026 for Senior Notes. Amounts exclude maturities under a finance lease obligation and unamortized discounts and premiums.
(3) Represents minimum rental commitments, net of sublease commitments, and includes facilities under the Company’s past restructuring initiatives and rental commitments under a finance lease obligation.
(4) Consists of purchase obligations for services such as advertising and marketing, telecommunications, professional services, and hardware- and software-related agreements. Includes purchase obligations that can be canceled by the Company without penalty.
CAPITAL MANAGEMENT The Company seeks to manage capital to a level and composition sufficient to support execution of its business strategy, including anticipated balance sheet growth, providing financial support to its subsidiaries, and sustained access to the capital markets, while at the same time meeting its regulatory capital requirements and serving as a source of financial strength to Schwab Bank. The Company’s primary sources of capital are funds generated by the operations of its subsidiaries and securities issuances by CSC in the capital markets. To ensure that it has a sufficient amount of capital to absorb unanticipated losses or declines in asset values, the Company has adopted a policy to remain well capitalized even in stressed scenarios. The level, composition and utilization of capital are influenced by changes in the economic environment, strategic initiatives, and legislative and regulatory developments. Internal guidelines are set, for both the Company and its regulated subsidiaries, to ensure capital levels are in line with the Company’s strategy and regulatory requirements, and capital forecasts are reviewed monthly at Capital Planning and Asset-Liability Management and Pricing Committee meetings. A number of early warning indicators are monitored to help identify potential problems that could impact capital and are reviewed with management as appropriate. In addition, the Company monitors its subsidiaries’ capital levels and requirements. Subject to regulatory capital requirements and any required approvals, any excess capital held by subsidiaries is transferred to CSC in the form of dividends and returns. When subsidiaries have need of additional capital, funds are provided by CSC as equity investments and also as subordinated loans (in a form approved as regulatory capital by regulators) for Schwab. The details and method used for each cash infusion are based on an analysis of the particular entity’s needs and financing alternatives. The amounts and structure of infusions must take into consideration maintenance of regulatory capital requirements, debt/equity ratios, and equity double leverage ratios. The Company conducts regular capital stress testing to assess the potential financial impacts of various plausible adverse macroeconomic and company-specific events to which CSC and its subsidiaries could be subjected. The objective of the Company’s capital stress testing is (1) to explore various potential outcomes – including rare and extreme events and (2) to assess impacts of potential stressful outcomes on both capital and liquidity. Additionally, the Company has a comprehensive Capital Contingency Plan to provide action plans for certain low probability/high impact capital events that the Company might face. The Capital Contingency Plan is issued under the authority of the Asset-Liability Management and Pricing

THE CHARLES SCHWAB CORPORATION Management’s Discussion and Analysis of Financial Condition and Results of Operations
(Tabular Amounts in Millions, Except Ratios, or as Noted)
- 48 -
Committee and provides guidelines for sustained capital events. It does not specifically address every contingency, but is designed to provide a framework for responding to any capital stress. The Capital Contingency Plan is reviewed annually and updated as appropriate. See “Part I – Item 1. – Business – Regulation” for additional information. Regulatory Capital Requirements Beginning on January 1, 2015, CSC became subject to capital requirements set by the Federal Reserve. In addition, CSC is required to serve as a source of strength for Schwab Bank and to provide financial assistance if Schwab Bank experiences financial distress. To manage capital adequacy, the Company currently utilizes a target Tier 1 Leverage Ratio for CSC of at least 6%. Due to the relatively low risk of the Company’s balance sheet assets and risk-based capital ratios at CSC and Schwab Bank that are well in excess of regulatory requirements, the Tier 1 Leverage Ratio is the most restrictive capital constraint on CSC’s asset growth. Schwab Bank is also required to maintain capital levels specified by the OCC. These capital requirements are substantially similar to those imposed on CSC by the Federal Reserve. Schwab Bank’s failure to remain well capitalized could result in certain mandatory and possibly additional discretionary actions by the regulators that, if undertaken, could have a direct material effect on the bank. The Company currently utilizes a target Tier 1 Leverage Ratio for Schwab Bank of at least 6.25%. As of January 1, 2015, Schwab Bank became subject to the new Final Regulatory Capital Rules set by the OCC. Based on its regulatory capital ratios at December 31, 2015, Schwab Bank is considered well capitalized. The following table details CSC’s and Schwab Bank’s capital ratios under the new Final Regulatory Capital Rules:
December 31, 2015 CSC Schwab Bank Total stockholders’ equity $ 13,402 $ 9,191 Less:
Preferred Stock 1,459 - Common Equity Tier 1 Capital before regulatory adjustments $ 11,943 $ 9,191 Less:
Goodwill, net of associated deferred tax liabilities $ 1,185 $ 11 Other intangible assets, net of associated deferred tax liabilities 41 - AOCI adjustment (1) (134) (134)
Common Equity Tier 1 Capital $ 10,851 $ 9,314 Tier 1 Capital $ 12,310 $ 9,314Total Capital 12,342 9,345 Risk-Weighted Assets 59,578 51,516 Common Equity Tier 1 Capital/Risk-Weighted Assets 18.2 % 18.1 % Tier 1 Capital/Risk-Weighted Assets 20.7 % 18.1 % Total Capital/Risk-Weighted Assets 20.7 % 18.1 % Tier 1 Leverage Ratio 7.1 % 7.1 %
(1) CSC and Schwab Bank have elected to opt-out of the requirement to include most components of AOCI in CET1 Capital.
The Company’s broker-dealer subsidiaries (Schwab and optionsXpress, Inc.) are subject to regulatory requirements of the Uniform Net Capital Rule. The rule is intended to ensure the general financial soundness and liquidity of broker-dealers. These regulations prohibit the broker-dealer subsidiaries from paying cash dividends, making unsecured advances and loans to their parent company and employees, and Schwab from repaying subordinated borrowings from CSC if such payment would result in a net capital amount of less than 5% of aggregate debit balances or less than 120% of its minimum dollar requirement of $250,000. As such, the broker-dealer subsidiaries are required to maintain, at all times, at least the minimum level of net capital required under Rule 15c3-1. At December 31, 2015, Schwab and optionsXpress met and exceeded their net capital requirements.
THE CHARLES SCHWAB CORPORATION Management’s Discussion and Analysis of Financial Condition and Results of Operations
(Tabular Amounts in Millions, Except Ratios, or as Noted)
- 49 -
See “Item 8 – Financial Statements and Supplementary Data – Consolidated Balance Sheets and Notes to Consolidated Financial Statements – 23. Regulatory Requirements” for additional information on the components of stockholder’s equity and information on the capital requirements of each of the subsidiaries. In addition to capital requirements, the Company’s subsidiaries are subject to various regulatory requirements that are intended to ensure financial soundness and liquidity. Schwab Bank is subject to regulatory requirements that restrict and govern the terms of affiliate transactions. In addition, Schwab Bank is required to provide notice to, and may be required to obtain approval from, the OCC and the Federal Reserve to declare dividends to CSC. Dividends CSC paid common stock cash dividends of $318 million ($0.24 per share) and $316 million ($0.24 per share) in 2015 and 2014, respectively. Since the initial dividend in 1989, CSC has paid 107 consecutive quarterly dividends and has increased the quarterly dividend rate 19 times, resulting in a 20% compounded annual growth rate, excluding the special cash dividend of $1.00 per common share in 2007. While the payment and amount of dividends are at the discretion of the Board of Directors, subject to certain regulatory and other restrictions, CSC currently targets its common stock cash dividend at approximately 20% to 30% of net income. CSC paid Series A Preferred Stock cash dividends of $28 million ($70.00 per share) in 2015 and 2014, respectively. CSC paid Series B Preferred Stock cash dividends of $29 million ($60.00 per share) in 2015 and 2014, respectively. CSC paid Series C cash dividends of $12 million ($19.67 per share) in 2015. Share Repurchases There were no repurchases of CSC’s common stock in 2015 or 2014. As of December 31, 2015, CSC had remaining authority from the Board of Directors to repurchase up to $596 million of its common stock, which is not subject to expiration. FAIR VALUE OF FINANCIAL INSTRUMENTS The Company uses the market and income approaches to determine the fair value of certain financial assets and liabilities recorded at fair value, and to determine fair value disclosures. See “Item 8 – Financial Statements and Supplementary Data – Notes to Consolidated Financial Statements – 2. Summary of Significant Accounting Policies and 17. Fair Values of Assets and Liabilities” for more information on the Company’s assets and liabilities recorded at fair value. When available, the Company uses quoted prices in active markets to measure the fair value of assets and liabilities. When utilizing market data with a bid-ask spread, the Company uses the price within the bid-ask spread that best represents fair value. When quoted prices do not exist, the Company uses prices obtained from independent third-party pricing services to measure the fair value of investment assets. The Company generally obtains prices from at least three independent pricing sources for assets recorded at fair value. The Company’s primary independent pricing service provides prices based on observable trades and discounted cash flows that incorporate observable information such as yields for similar types of securities (a benchmark interest rate plus observable spreads) and weighted-average maturity for the same or similar “to-be-issued” securities. The Company compares the prices obtained from its primary independent pricing service to the prices obtained from the additional independent pricing services to determine if the price obtained from the primary independent pricing service is reasonable. The Company does not adjust the prices received from independent third-party pricing services unless such prices are inconsistent with the definition of fair value and result in a material difference in the recorded amounts. At December 31, 2015 and 2014, the Company did not adjust prices received from the primary independent third-party pricing service.

THE CHARLES SCHWAB CORPORATION Management’s Discussion and Analysis of Financial Condition and Results of Operations
(Tabular Amounts in Millions, Except Ratios, or as Noted)
- 50 -
CRITICAL ACCOUNTING ESTIMATES The consolidated financial statements of the Company have been prepared in accordance with accounting principles generally accepted in the U.S. While the majority of the Company’s revenues, expenses, assets and liabilities are not based on estimates, there are certain accounting principles that require management to make estimates regarding matters that are uncertain and susceptible to change where such change may result in a material adverse impact on the Company’s financial position and reported financial results. These critical accounting estimates are described below. Management regularly reviews the estimates and assumptions used in the preparation of the Company’s financial statements for reasonableness and adequacy. Other-than-Temporary Impairment of Securities Available for Sale and Securities Held to Maturity Management evaluates whether securities available for sale and securities held to maturity are other-than-temporarily impaired on a quarterly basis. Debt securities with unrealized losses are considered OTTI if the Company intends to sell the security or if it is more likely than not that the Company will be required to sell such security before any anticipated recovery. If management determines that a security is OTTI under these circumstances, the impairment recognized in earnings is measured as the entire difference between the amortized cost and the then-current fair value. A security is also OTTI if management does not expect to recover the amortized cost of the security. In this circumstance, the impairment recognized in earnings represents the estimated credit loss, and is measured by the difference between the present value of expected cash flows and the amortized cost of the security. Management utilizes cash flow models to estimate the expected future cash flow from the securities and to estimate the credit loss. Expected cash flows are discounted using the security’s effective interest rate. The evaluation of whether the Company expects to recover the amortized cost of a security is inherently judgmental. The evaluation includes the consideration of multiple factors including: the magnitude and duration of the unrealized loss; the financial condition of the issuer; the payment structure of the security; external credit ratings; for asset-backed securities, the amount of credit support provided by the structure of the security to absorb credit losses on the underlying collateral; recent events specific to the issuer and the issuer’s industry; and whether the Company has received all scheduled principal and interest payments. Valuation of Goodwill The Company tests goodwill for impairment at least annually, or whenever indications of impairment exist. Impairment exists when the carrying amount of goodwill exceeds its implied fair value, resulting in an impairment charge for this excess. Adverse changes in the Company’s planned business operations such as unanticipated competition, a loss of key personnel, the sale of a reporting unit or a significant portion of a reporting unit, or other unforeseen developments could result in an impairment of the Company’s recorded goodwill. The Company’s annual goodwill impairment testing date is April 1st. In testing for a potential impairment of goodwill on April 1, 2015, management performed an assessment of each of the Company’s reporting units (generally defined as the Company’s businesses for which financial information is available and reviewed regularly by management) and concluded that goodwill was not impaired. Allowance for Loan Losses The appropriateness of the allowance is reviewed quarterly by management, taking into consideration current economic conditions, the existing loan portfolio composition, past loss experience, and risks inherent in the portfolios. The methodology to establish an allowance for loan losses related to the First Mortgage and HELOC portfolios utilizes statistical models that estimate prepayments, defaults, and probable losses for the loan segments based on predicted behavior of individual loans within the segments. The methodology considers the effects of borrower behavior and a variety of factors including, but not limited to, interest rates, housing price movements as measured by a housing price index, economic
THE CHARLES SCHWAB CORPORATION Management’s Discussion and Analysis of Financial Condition and Results of Operations
(Tabular Amounts in Millions, Except Ratios, or as Noted)
- 51 -
conditions, estimated defaults and foreclosures measured by historical and expected delinquencies, changes in prepayment speeds, LTV ratios, past loss experience, estimates of future loss severities, borrower credit risk measured by FICO scores, and the adequacy of collateral. The methodology also evaluates concentrations in the loan segments including loan products, year of origination, and geographical distribution of collateral. Probable losses are forecast using a loan-level simulation of the delinquency status of the loans over the term of the loans. The simulation starts with the current relevant risk indicators, including the current delinquent status of each loan, the estimated current LTV ratio of each loan, the term and structure of each loan, current key interest rates including U.S. Treasury and LIBOR rates, and borrower FICO scores. The more significant variables in the simulation include delinquency roll rates, loss severity, housing prices, and interest rates. Delinquency roll rates are estimated from the Company’s historical loss experience adjusted for current trends and market information. Further, the delinquency roll rates within the loan-level simulation discussed above are calibrated to match a moving average of the delinquency roll rates actually experienced in the respective First Mortgage and HELOC portfolios. Loss severity estimates are based on the Company’s historical loss experience and market trends. The estimated loss severity (i.e., loss given default) used in the allowance for loan loss for HELOCs is higher than that used for First Mortgages. Housing price trends are derived from historical home price indices and econometric forecasts of future home values. Factors affecting the home price index include: housing inventory, unemployment, interest rates, and inflation expectations. Interest rate projections are based on the current term structure of interest rates and historical volatilities to project various possible future interest rate paths. This methodology results in loss factors that are applied to the outstanding balances to determine the allowance for loan loss for each loan segment. Legal and Regulatory Reserves Reserves for legal and regulatory claims and proceedings reflect an estimate of probable losses for each matter, after considering, among other factors, the progress of the case, prior experience and the experience of others in similar cases, available defenses, insurance coverage and indemnification, and the opinions and views of legal counsel. In many cases, including most class action lawsuits, it is not possible to determine whether a loss will be incurred, or to estimate the range of that loss, until the matter is close to resolution, in which case no accrual is made until that time. Reserves are adjusted as more information becomes available or when an event occurs requiring a change. Significant judgment is required in making these estimates, and the actual cost of resolving a matter may ultimately differ materially from the amount reserved. The Company’s management has discussed the development and selection of these critical accounting estimates with the Audit Committee. Additionally, management has reviewed with the Audit Committee the Company’s significant estimates discussed in this Management’s Discussion and Analysis of Financial Condition and Results of Operations.
THE CHARLES SCHWAB CORPORATION
- 52 -
Item 7A. Quantitative and Qualitative Disclosures About Market Risk Market risk is the potential for changes in earnings or the value of financial instruments held by the Company as a result of fluctuations in interest rates, equity prices or market conditions. The Company is exposed to interest rate risk primarily from changes in market interest rates on its interest-earning assets relative to changes in the costs of its funding sources that finance these assets. The majority of the Company’s interest-earning assets and interest-bearing liabilities are sensitive to changes in short-term interest rates. To a lesser degree, the Company is sensitive to changes in long-term interest rates through some of its investment portfolios. To manage the Company’s market risk related to interest rates, management utilizes simulation models, which include the net interest revenue sensitivity analysis described below. Net interest revenue is affected by various factors, such as the distribution and composition of interest-earning assets and interest-bearing liabilities, the spread between yields earned on interest-earning assets and rates paid on interest-bearing liabilities, which may reprice at different times or by different amounts, and the spread between short and long-term interest rates. Interest-earning assets primarily include investment securities, margin loans and bank loans. These assets are sensitive to changes in interest rates and changes in prepayment levels that tend to increase in a declining rate environment and decrease in a rising rate environment. Because the Company establishes the rates paid on certain brokerage client cash balances and bank deposits and the rates charged on margin loans and bank loans, and controls the composition of its investment securities, it has some ability to manage its net interest spread, depending on competitive factors and market conditions. To mitigate the risk of loss, the Company has established policies and procedures which include setting guidelines on the amount of net interest revenue at risk, and monitoring the net interest margin and average maturity of its interest-earning assets and funding sources. To remain within these guidelines, the Company manages the maturity, repricing, and cash flow characteristics of the investment portfolios. The Company is also subject to market risk as a result of fluctuations in option and equity prices. The Company’s direct holdings of option and equity securities and its associated exposure to option and equity prices are not material. The Company is indirectly exposed to option, futures, and equity market fluctuations in connection with client option and futures accounts, securities collateralizing margin loans to brokerage clients, and client securities loaned out as part of the Company’s securities lending activities. Equity market valuations may also affect the level of brokerage client trading activity, margin borrowing, and overall client engagement with the Company. Additionally, the Company earns mutual fund service fees and asset management fees based upon daily balances of certain client assets. Fluctuations in these client asset balances caused by changes in equity valuations directly impact the amount of fee revenue earned by the Company. Financial instruments held by the Company are also subject to liquidity risk – that is, the risk that valuations will be negatively affected by changes in demand and the underlying market for a financial instrument. Current conditions in the credit markets have reduced market liquidity among a range of financial instruments, including the types of instruments held by the Company, and fair value can differ significantly from the value implied by the credit quality and actual performance of the instrument’s underlying cash flows. The Company’s market risk related to financial instruments held for trading is not material. Net Interest Revenue Simulation For the Company’s net interest revenue sensitivity analysis, the Company uses net interest revenue simulation modeling techniques to evaluate and manage the effect of changing interest rates. The simulation includes all interest-sensitive assets and liabilities. Key variables in the simulation include the repricing of financial instruments, prepayment, reinvestment, and product pricing assumptions. The Company uses constant balances and market rates in the simulation assumptions in order to minimize the number of variables and to better isolate risks. The simulations involve assumptions that are inherently uncertain and, as a result, cannot precisely estimate net interest revenue or predict the impact of changes in interest rates on net interest revenue. Actual results may differ from simulated results due to balance growth or decline and the timing,

THE CHARLES SCHWAB CORPORATION
- 53 -
magnitude, and frequency of interest rate changes, as well as changes in market conditions and management strategies, including changes in asset and liability mix. If the Company’s guidelines for its net interest revenue sensitivity are breached, management must report the breach to the Company’s Corporate Asset-Liability Management and Pricing Committee and establish a plan to address the interest rate risk. This plan could include, but is not limited to, rebalancing certain investment portfolios or using derivative instruments to mitigate the interest rate risk. Depending on the severity and expected duration of the breach, as well as the then current interest rate environment, the plan could also be to take no action. Any plan that recommends taking action is required to be approved by the Company’s Corporate Asset-Liability Management and Pricing Committee. There were no breaches of the Company’s net interest revenue sensitivity guidelines during the years ended December 31, 2015 or 2014. As represented by the simulations presented below, the Company’s investment strategy is structured to produce an increase in net interest revenue when interest rates rise and, conversely, a decrease in net interest revenue when interest rates fall. The simulations in the following table assume that the asset and liability structure of the consolidated balance sheet would not be changed as a result of the simulated changes in interest rates. As the Company actively manages its consolidated balance sheet and interest rate exposure, in all likelihood the Company would take steps to manage any additional interest rate exposure that could result from changes in the interest rate environment. The following table shows the simulated net interest revenue change over the next 12 months beginning December 31, 2015 and 2014 of a gradual 100 basis point increase or decrease in market interest rates relative to prevailing market rates at the end of each reporting period.
December 31, 2015 2014
Increase of 100 basis points 8.2 % 11.8 % Decrease of 100 basis points (9.5) % (4.9)% The sensitivities shown in the simulation reflect the fact that short-term interest rates in 2015 remained at low levels despite the increase in federal funds target range to .25% to .50% as directed by the Federal Open Markets Committee in December 2015. The current low interest rate environment limits the extent to which the Company can reduce interest expense paid on funding sources. A decline in interest rates could negatively impact the yield on the Company’s investment portfolio to a greater degree than any offsetting reduction in interest expense, further compressing net interest margin. Any increases in short-term interest rates result in a greater impact as yields on interest-earning assets are expected to rise faster than the cost of funding sources.

THE CHARLES SCHWAB CORPORATION
- 54 -
Item 8. Financial Statements and Supplementary Data
TABLE OF CONTENTS
Consolidated Statements of Income 55Consolidated Statements of Comprehensive Income 56Consolidated Balance Sheets 57Consolidated Statements of Cash Flows 58Consolidated Statements of Stockholders’ Equity 59Notes to Consolidated Financial Statements 60Note 1. Introduction and Basis of Presentation 60Note 2. Summary of Significant Accounting Policies 60Note 3. Receivables from Brokerage Clients 68Note 4. Other Securities Owned 68Note 5. Securities Available for Sale and Securities Held to Maturity 69Note 6. Bank Loans and Related Allowance for Loan Losses 72Note 7. Equipment, Office Facilities, and Property 75Note 8. Intangible Assets and Goodwill 76Note 9. Other Assets 77Note 10. Variable Interest Entities 77Note 11. Bank Deposits 78Note 12. Payables to Brokers, Dealers, and Clearing Organizations 78Note 13. Payables to Brokerage Clients 78Note 14. Borrowings 79Note 15. Commitments and Contingencies 80Note 16. Financial Instruments Subject to Off-Balance Sheet Credit Risk or Concentration Risk 82Note 17. Fair Values of Assets and Liabilities 84Note 18. Stockholders’ Equity 88Note 19. Accumulated Other Comprehensive Income 89Note 20. Employee Incentive, Retirement, and Deferred Compensation Plans 90Note 21. Taxes on Income 92Note 22. Earnings Per Common Share 94Note 23. Regulatory Requirements 94Note 24. Segment Information 96Note 25. The Charles Schwab Corporation – Parent Company Only Financial Statements 97Note 26. Quarterly Financial Information (Unaudited) 100Report of Independent Registered Public Accounting Firm 101Management’s Report on Internal Control Over Financial Reporting 102

THE CHARLES SCHWAB CORPORATION
- 55 -
Consolidated Statements of Income (In Millions, Except Per Share Amounts) Year Ended December 31, 2015 2014 2013
Net Revenues
Asset management and administration fees $ 2,650 $ 2,533 $ 2,315Interest revenue 2,657 2,374 2,085Interest expense (132) (102) (105)
Net interest revenue 2,525 2,272 1,980
Trading revenue 866 907 913Other 328 343 236Provision for loan losses 11 4 1Net impairment losses on securities - (1) (10)
Total net revenues 6,380 6,058 5,435
Expenses Excluding Interest Compensation and benefits 2,241 2,184 2,027Professional services 459 457 415Occupancy and equipment 353 324 309Advertising and market development 249 245 257Communications 233 223 220Depreciation and amortization 224 199 202Other 342 311 300
Total expenses excluding interest 4,101 3,943 3,730
Income before taxes on income 2,279 2,115 1,705Taxes on income 832 794 634
Net Income 1,447 1,321 1,071
Preferred stock dividends and other (1) 83 60 61
Net Income Available to Common Stockholders $ 1,364 $ 1,261 $ 1,010
Weighted-Average Common Shares Outstanding:
Basic 1,315 1,303 1,285
Diluted 1,327 1,315 1,293
Earnings Per Common Share:
Basic $ 1.04 $ .96 $ .78
Diluted $ 1.03 $ .95 $ .78
Dividends Declared Per Common Share $ .24 $ .24 $ .24
(1) Includes preferred stock dividends and undistributed earnings and dividends allocated to non-vested restricted stock units.
See Notes to Consolidated Financial Statements.

THE CHARLES SCHWAB CORPORATION
- 56 -
Consolidated Statements of Comprehensive Income (In Millions) Year Ended December 31, 2015 2014 2013
Net income $ 1,447 $ 1,321 $ 1,071
Other comprehensive income (loss), before tax: Change in net unrealized gain on securities available for sale:
Net unrealized gain (loss) (477) 255 (468)Reclassification of impairment charges included in net
impairment losses on securities - 1 10Other reclassifications included in other revenue - (7) (7)
Other - - 1
Other comprehensive income (loss), before tax (477) 249 (464)Income tax effect 178 (93) 175
Other comprehensive income (loss), net of tax (299) 156 (289)
Comprehensive Income $ 1,148 $ 1,477 $ 782 See Notes to Consolidated Financial Statements.

THE CHARLES SCHWAB CORPORATION
- 57 -
Consolidated Balance Sheets (In Millions, Except Per Share and Share Amounts)
December 31, 2015 2014
Assets Cash and cash equivalents $ 11,978 $ 11,363Cash and investments segregated and on deposit for regulatory purposes
(including resale agreements of $8,088 and $10,186 at December 31, 2015 and 2014, respectively) 19,598 20,781
Receivables from brokers, dealers, and clearing organizations 582 469Receivables from brokerage clients — net 17,313 15,669Other securities owned — at fair value 533 516Securities available for sale 65,646 54,783Securities held to maturity (fair value — $50,088 and $34,743 at December 31,
2015 and 2014, respectively) 50,007 34,389Bank loans — net 14,334 13,399Equipment, office facilities, and property — net 1,145 1,039Goodwill 1,227 1,227Intangible assets — net 181 227Other assets 1,174 780
Total assets $ 183,718 $ 154,642
Liabilities and Stockholders’ Equity Bank deposits $ 129,502 $ 102,815Payables to brokers, dealers, and clearing organizations 2,588 2,004Payables to brokerage clients 33,185 34,305Accrued expenses and other liabilities 2,151 1,816Long-term debt 2,890 1,899
Total liabilities 170,316 142,839
Stockholders’ equity:
Preferred stock — $.01 par value per share; aggregate liquidation preference of $1,485 and $885 at December 31, 2015 and 2014, respectively 1,459 872
Common stock — 3 billion shares authorized; $.01 par value per share; 1,487,543,446 shares issued 15 15
Additional paid-in capital 4,152 4,050Retained earnings 11,253 10,198Treasury stock, at cost — 167,205,881 shares and 176,821,202 shares
at December 31, 2015 and 2014, respectively (3,343) (3,497)Accumulated other comprehensive income (134) 165
Total stockholders’ equity 13,402 11,803Total liabilities and stockholders’ equity $ 183,718 $ 154,642
See Notes to Consolidated Financial Statements.
THE CHARLES SCHWAB CORPORATION
- 58 -
Consolidated Statements of Cash Flows (In Millions)
Year Ended December 31, 2015 2014 2013 Cash Flows from Operating Activities
Net income $ 1,447 $ 1,321 $ 1,071 Adjustments to reconcile net income to net cash (used for) provided by operating activities:
Provision for loan losses (11) (4) (1)Net impairment losses on securities - 1 10 Stock-based compensation 135 115 116 Depreciation and amortization 224 199 202 (Benefit) provision for deferred income taxes (7) (25) (21)Premium amortization, net, on securities available for sale and securities held to maturity 162 125 162 Other (4) (7) 15
Net change in: Cash and investments segregated and on deposit for regulatory purposes 1,183 2,772 4,916 Receivables from brokers, dealers, and clearing organizations (108) 44 (175)Receivables from brokerage clients (1,652) (1,725) (496)Other securities owned (17) 1 119 Other assets (98) (30) 17 Payables to brokers, dealers, and clearing organizations 808 393 318 Payables to brokerage clients (1,120) (1,028) (4,997)Accrued expenses and other liabilities 304 196 400
Net cash provided by operating activities 1,246 2,348 1,656 Cash Flows from Investing Activities
Purchases of securities available for sale (21,351) (15,134) (22,942)Proceeds from sales of securities available for sale 2,424 6,556 6,167 Principal payments on securities available for sale 7,340 5,843 10,772 Purchases of securities held to maturity (19,303) (6,920) (16,061)Principal payments on securities held to maturity 3,540 2,687 3,895 Net increase in bank loans (980) (1,016) (1,634)Purchase of equipment, office facilities, and property (266) (400) (249)Other investing activities (27) (11) 2
Net cash used for investing activities (28,623) (8,395) (20,050)Cash Flows from Financing Activities
Net change in bank deposits 26,687 9,843 13,595 Repayment of commercial paper - - (300)Issuance of long-term debt 1,346 - 275 Repayment of long-term debt (357) (6) (6)Net proceeds from preferred stock offering 581 - -Dividends paid (387) (373) (368)Proceeds from stock options exercised and other 90 189 258 Other financing activities 32 29 5
Net cash provided by financing activities 27,992 9,682 13,459 Increase (Decrease) in Cash and Cash Equivalents 615 3,635 (4,935)Cash and Cash Equivalents at Beginning of Year 11,363 7,728 12,663 Cash and Cash Equivalents at End of Year $ 11,978 $ 11,363 $ 7,728
Supplemental Cash Flow Information Cash paid during the year for:
Interest $ 121 $ 103 $ 99 Income taxes $ 810 $ 778 $ 624
Non-cash investing activity: Securities purchased during the year but settled after year end $ - $ 143 $ 81
See Notes to Consolidated Financial Statements.

THE CHARLES SCHWAB CORPORATION
- 59 -
Consolidated Statements of Stockholders’ Equity (In Millions)
Accumulated
Additional Other
Preferred Common Stock Paid-In Retained Treasury Stock, Comprehensive
Stock Shares Amount Capital Earnings at cost Income (Loss) Total Balance at December 31, 2012 $ 865 1,488 $ 15 $ 3,881 $ 8,554 $ (4,024) $ 298 $ 9,589 Net income - - - - 1,071 - - 1,071Other comprehensive income (loss), net of tax - - - - - - (289) (289) Dividends declared on preferred stock - - - - (57) - - (57) Dividends declared on common stock - - - - (311) - - (311) Stock option exercises and other - - - (54) - 314 - 260 Stock-based compensation and
related tax effects - - - 119 - - - 119 Other 4 - - 5 (4) (6) - (1) Balance at December 31, 2013 869 1,488 15 3,951 9,253 (3,716) 9 10,381 Net income - - - - 1,321 - - 1,321Other comprehensive income (loss), net of tax - - - - - - 156 156 Dividends declared on preferred stock - - - - (57) - - (57) Dividends declared on common stock - - - - (316) - - (316) Stock option exercises and other - - - (53) - 240 - 187 Stock-based compensation and
related tax effects - - - 139 - - - 139 Other 3 - - 13 (3) (21) - (8) Balance at December 31, 2014 872 1,488 15 4,050 10,198 (3,497) 165 11,803 Net income - - - - 1,447 - - 1,447Other comprehensive income (loss), net of tax - - - - - - (299) (299)Issuance of preferred stock 581 - - - - - - 581 Dividends declared on preferred stock - - - - (69) - - (69)Dividends declared on common stock - - - - (318) - - (318)Stock option exercises and other - - - (87) - 177 - 90 Stock-based compensation and
related tax effects - - - 172 - - - 172 Other 6 - - 17 (5) (23) - (5)Balance at December 31, 2015 $ 1,459 1,488 $ 15 $ 4,152 $ 11,253 $ (3,343) $ (134) $ 13,402
See Notes to Consolidated Financial Statements.

THE CHARLES SCHWAB CORPORATION Notes to Consolidated Financial Statements
(Tabular Amounts in Millions, Except Per Share Data, Option Price Amounts, Ratios, or as Noted)
- 60 -
1. Introduction and Basis of Presentation CSC is a savings and loan holding company engaged, through its subsidiaries, in wealth management, securities brokerage, banking, money management, custody, and financial advisory services. Schwab is a securities broker-dealer with over 325 domestic branch offices in 45 states, as well as a branch in each of the Commonwealth of Puerto Rico and London, England. In addition, Schwab serves clients in Hong Kong through one of CSC’s subsidiaries. Other subsidiaries include Schwab Bank, a federal savings bank, and CSIM, the investment advisor for Schwab’s proprietary mutual funds, which are referred to as the Schwab Funds®, and for Schwab’s exchange-traded funds, which are referred to as the Schwab ETFs™. The accompanying consolidated financial statements include CSC and its majority-owned subsidiaries (collectively referred to as the Company). Intercompany balances and transactions have been eliminated. These consolidated financial statements have been prepared in conformity with accounting principles generally accepted in the U.S., which require management to make certain estimates and assumptions that affect the reported amounts in the accompanying financial statements. Certain estimates relate to OTTI of securities available for sale and securities held to maturity, valuation of goodwill, allowance for loan losses, and legal and regulatory reserves. Actual results may differ from those estimates. Principles of Consolidation The Company accounts for investments in entities for which it owns a voting interest and for which it has the ability to exercise significant influence over operating and financing decisions using the equity method of accounting. Investments in entities for which the Company does not have the ability to exercise significant influence are generally carried at cost. Both equity method and cost method investments are included in other assets. The Company evaluates its initial and continuing involvement with certain entities to determine if the Company is required to consolidate the entities under the variable interest entity (VIE) model. For interests in entities other than the Company’s sponsored funds, the evaluation is based on a qualitative assessment of whether the Company is the primary beneficiary of the VIE. The primary beneficiary of a VIE has the power to direct the activities of a VIE that most significantly impact the VIE’s economic performance and the obligation to absorb losses of the VIE that potentially could be significant to the VIE or the right to receive benefits from the VIE that potentially could be significant to the VIE. The primary beneficiary determination for the Company’s sponsored funds is based on a quantitative assessment of whether the Company would absorb a majority of the VIE’s expected losses, receive a majority of the VIE’s expected residual returns, or both. Based upon the Company’s assessments, the Company is not deemed to be the primary beneficiary of and, therefore, is not required to consolidate any VIEs. 2. Summary of Significant Accounting Policies Asset management and administration fees Asset management and administration fees include mutual fund service fees and fees for other asset-based financial services provided to individual and institutional clients, and are recognized as revenue over the period that the related service is provided, based upon average asset balances. The Company’s policy is to recognize revenue subject to refunds because management can estimate refunds based on Company specific experience. Actual refunds were not material as of December 31, 2015. The Company earns mutual fund and ETF service fees for shareholder services, administration, and investment management provided to its proprietary funds, and recordkeeping and shareholder services provided to third-party funds. These fees are based upon the daily balances of client assets invested in these funds. The Company also earns asset management fees for advice solutions, which include advisory and managed account services that are based on the daily balances of client assets subject to the specific fee for service. The fair values of client assets included in proprietary and third-party mutual funds and ETFs are based on quoted market prices and other observable market data. Other asset management and administration fees include various asset-based fees, such as third-party mutual fund service fees, trust fees, 401(k) recordkeeping fees, and mutual fund clearing and other service fees. In 2015, 2014 and 2013, the Company waived a portion of its asset management fees earned from certain Schwab-sponsored money market mutual funds. Under agreements with these funds entered into when the Company began waiving fees, the
THE CHARLES SCHWAB CORPORATION Notes to Consolidated Financial Statements
(Tabular Amounts in Millions, Except Per Share Data, Option Price Amounts, Ratios, or as Noted)
- 61 -
Company was entitled to recover such fee waivers depending on the future performance of the funds and approval by the boards of the respective funds until the third anniversary of the end of the fiscal year in which such fee waiver occurs, subject to certain limitations. During the year ended December 31, 2015, the Company terminated the fee waiver reimbursement agreements and, therefore, no longer has the right to receive reimbursement of waived fees. Interest revenue Interest revenue represents interest earned on cash and cash equivalents, cash and investments segregated, receivables from brokers, dealers, and clearing organizations, receivables from brokerage clients, other securities owned, securities available for sale, securities held to maturity, and bank loans. Interest revenue is recognized in the period earned based upon average or daily asset balances and respective interest rates. Trading revenue Trading revenue includes commission and principal transaction revenues. Commission revenue is affected by the number of trades executed and the average revenue earned per revenue trade. Principal transaction revenue is primarily comprised of revenue from trading activity in client fixed income securities. Factors that influence principal transaction revenue include the volume of client trades and market price volatility. To accommodate clients’ fixed income trading activity, the Company maintains positions in fixed income securities, including U.S. state and municipal debt obligations, U.S. Government, corporate debt and other securities. The difference between the price at which the Company buys and sells securities to and from its clients and other broker-dealers is recognized as principal transaction revenue. Principal transaction revenue also includes adjustments to the fair value of these securities positions. Cash and cash equivalents The Company considers all highly liquid investments with original maturities of three months or less that are not segregated and on deposit for regulatory purposes to be cash equivalents. Cash and cash equivalents include money market funds, deposits with banks, certificates of deposit, commercial paper, and U.S. Treasury securities. Cash and cash equivalents also include balances that Schwab Bank maintains at the Federal Reserve Bank. Cash and investments segregated and on deposit for regulatory purposes Cash and investments segregated and on deposit for regulatory purposes include securities purchased under agreements to resell (resale agreements), which are collateralized by U.S. Government and agency securities. Resale agreements are accounted for as collateralized financing transactions that are recorded at their contractual amounts plus accrued interest. The Company obtains control of collateral with a market value equal to or in excess of the principal amount loaned and accrued interest under resale agreements. Collateral is valued daily by the Company, with additional collateral obtained to ensure full collateralization. Cash and investments segregated also include certificates of deposit and U.S. Government securities. Certificates of deposit and U.S. Government securities are recorded at fair value. Pursuant to applicable regulations, client cash balances not used for margin lending are segregated into investment accounts maintained for the exclusive benefit of clients. Receivables from brokerage clients Receivables from brokerage clients include margin loans to clients and are recorded net of an allowance for doubtful accounts. Receivables from brokerage clients that remain unsecured or partially secured for more than 30 days are fully reserved. Other securities owned Other securities owned are recorded at fair value based on quoted market prices or other observable market data. Unrealized gains and losses are included in trading revenue.
THE CHARLES SCHWAB CORPORATION Notes to Consolidated Financial Statements
(Tabular Amounts in Millions, Except Per Share Data, Option Price Amounts, Ratios, or as Noted)
- 62 -
Securities available for sale and securities held to maturity Securities available for sale are recorded at fair value and unrealized gains and losses are reported, net of taxes, in accumulated other comprehensive income (loss) included in stockholders’ equity. Securities held to maturity are recorded at amortized cost based on the Company’s positive intent and ability to hold these securities to maturity. Realized gains and losses from sales of securities available for sale are determined on a specific identification basis and are included in other revenue. Management evaluates whether securities available for sale and securities held to maturity are OTTI on a quarterly basis. Debt securities with unrealized losses are considered OTTI if the Company intends to sell the security or if it is more likely than not that the Company will be required to sell such security before any anticipated recovery. If management determines that a security is OTTI under these circumstances, the impairment recognized in earnings is measured as the entire difference between amortized cost and fair value. A security is also OTTI if management does not expect to recover all of the amortized cost of the security. In this circumstance, the impairment recognized in earnings represents the estimated credit loss, and is measured by the difference between the present value of expected cash flows and the amortized cost of the security. Where appropriate, management utilizes cash flow models to estimate the expected future cash flow from the securities to estimate the credit loss. Expected cash flows are discounted using the security’s effective interest rate. The evaluation of whether the Company expects to recover the amortized cost of a security is inherently judgmental. The evaluation includes the consideration of multiple factors including: the magnitude and duration of the unrealized loss; the financial condition of the issuer; the payment structure of the security; external credit ratings; for asset-backed securities, the amount of credit support provided by the structure of the security to absorb credit losses on the underlying collateral; recent events specific to the issuer and the issuer’s industry; and whether the Company has received all scheduled principal and interest payments. Securities borrowed and securities loaned Securities borrowed require the Company to deliver cash to the lender in exchange for securities and are included in receivables from brokers, dealers, and clearing organizations. For securities loaned, the Company receives collateral in the form of cash in an amount equal to or greater than the market value of securities loaned. Securities loaned are included in payables to brokers, dealers, and clearing organizations. The Company monitors the market value of securities borrowed and loaned, with additional collateral obtained or refunded to ensure full collateralization. Fees received or paid are recorded in interest revenue or interest expense. Bank loans and related allowance for loan losses Bank loans are recorded at their contractual principal amounts and include unamortized direct origination costs or net purchase discounts or premiums. Direct origination costs and premiums and discounts are recognized in interest revenue using the effective interest method over the contractual life of the loan and are adjusted for actual prepayments. Additionally, loans are recorded net of an allowance for loan losses. The Company’s loan portfolio includes four loan segments: First Mortgages, HELOCs, PALs and other loans. First Mortgages include two loan classes: first mortgages and purchased first mortgages. Loan segments are defined as the level to which the Company disaggregates its loan portfolio when developing and documenting a methodology for determining the allowance for loan losses. A loan class is defined as a group of loans within a loan segment that has homogeneous risk characteristics. PALs are collateralized by marketable securities with liquid markets. Credit lines are over-collateralized dependent on the type of security pledged. Collateral market value is monitored on a daily basis and a borrower’s committed line may be reduced or collateral may be liquidated if the collateral is in danger of falling below specified levels. As such, the loss inherent within this portfolio is limited. The Company records an allowance for loan losses through a charge to earnings based on management’s estimate of probable losses in the existing portfolio. Management reviews the allowance for loan losses quarterly, taking into consideration current
THE CHARLES SCHWAB CORPORATION Notes to Consolidated Financial Statements
(Tabular Amounts in Millions, Except Per Share Data, Option Price Amounts, Ratios, or as Noted)
- 63 -
economic conditions, the composition of the existing loan portfolio, past loss experience, and risks inherent in the portfolio to ensure that the allowance for loan losses is maintained at an appropriate level. The methodology to establish an allowance for loan losses utilizes statistical models that estimate prepayments, defaults, and probable losses for the loan segments based on predicted behavior of individual loans within the segments. The methodology considers the effects of borrower behavior and a variety of factors including, but not limited to, interest rates, housing price movements as measured by a housing price index, economic conditions, estimated defaults and foreclosures measured by historical and expected delinquencies, changes in prepayment speeds, LTV ratios, past loss experience, estimates of future loss severities, borrower credit risk measured by FICO scores, and the adequacy of collateral. The methodology also evaluates concentrations in the loan segments, including loan products, year of origination, and geographical distribution of collateral. Probable losses are forecast using a loan-level simulation of the delinquency status of the loans over the term of the loans. The simulation starts with the current relevant risk indicators, including the current delinquent status of each loan, the estimated current LTV ratio of each loan, the term and structure of each loan, current key interest rates including U.S. Treasury and LIBOR rates, and borrower FICO scores. The more significant variables in the simulation include delinquency roll rates, loss severity, housing prices, and interest rates. Delinquency roll rates (i.e., the rates at which loans transition through delinquency stages and ultimately result in a loss) are estimated from the Company’s historical loss experience adjusted for current trends and market information. Further, the delinquency roll rates within the loan-level simulation discussed above are calibrated to match a moving average of the delinquency roll rates actually experienced in the respective First Mortgage and HELOC portfolios. Loss severity estimates are based on the Company’s historical loss experience and market trends. The estimated loss severity (i.e., loss given default) used in the allowance for loan loss methodology for HELOC loans is higher than that used in the methodology for First Mortgages. Housing price trends are derived from historical home price indices and econometric forecasts of future home values. Factors affecting the home price index include: housing inventory, unemployment, interest rates, and inflation expectations. Interest rate projections are based on the current term structure of interest rates and historical volatilities to project various possible future interest rate paths. This methodology results in loss factors that are applied to the outstanding balances to determine the allowance for loan loss for each loan segment. The Company considers loan modifications in which it makes an economic concession to a borrower experiencing financial difficulty to be a troubled debt restructuring (TDR). Nonaccrual, Nonperforming and Impaired loans First Mortgages, HELOCs, PALs, and other loans are placed on nonaccrual status upon becoming 90 days past due as to interest or principal (unless the loans are well-secured and in the process of collection), or when the full timely collection of interest or principal becomes uncertain, including loans to borrowers who have filed for bankruptcy. For the portion of the HELOC portfolio for which the Company is able to track the delinquency status on the associated first lien loan, the Company places a HELOC on non-accrual status if the associated first mortgage is 90 days or more delinquent, regardless of the payment status of the HELOC. When a loan is placed on nonaccrual status, the accrued and unpaid interest receivable is reversed and the loan is accounted for on the cash or cost recovery method until qualifying for return to accrual status. Generally, a nonaccrual loan may be returned to accrual status when all delinquent interest and principal is repaid and the borrower demonstrates a sustained period of performance, or when the loan is both well-secured and in the process of collection and collectability is no longer doubtful. Loans on nonaccrual status and other real estate owned are considered nonperforming assets. Nonaccrual loans, other real estate owned and TDRs are considered impaired assets as it is probable the Company will not collect all amounts due. Loan Charge-Offs The Company charges off a loan in the period that it is deemed uncollectible and records a reduction in the allowance for loan losses and the loan balance. The Company’s charge-off policy for First Mortgage and HELOC loans is to assess the value of the property when the loan has been delinquent for 180 days or has been discharged in bankruptcy proceedings,
THE CHARLES SCHWAB CORPORATION Notes to Consolidated Financial Statements
(Tabular Amounts in Millions, Except Per Share Data, Option Price Amounts, Ratios, or as Noted)
- 64 -
regardless of whether or not the property is in foreclosure, and charge-off the amount of the loan balance in excess of the estimated current value of the underlying property less estimated costs to sell. Equipment, office facilities, and property Equipment, office facilities, and property are recorded at cost net of accumulated depreciation and amortization, except for land, which is recorded at cost. Equipment and office facilities are depreciated on a straight-line basis over an estimated useful life of five to ten years. Buildings are depreciated on a straight-line basis over 20 to 40 years. Leasehold improvements are amortized on a straight-line basis over the shorter of the estimated useful life of the asset or the term of the lease. Software and certain costs incurred for purchasing or developing software for internal use are amortized on a straight-line basis over an estimated useful life of three or five years. Equipment, office facilities, and property are reviewed for impairment whenever events or changes in circumstances indicate that the carrying amount of such assets may not be recoverable. Goodwill Goodwill represents the fair value of acquired businesses in excess of the fair value of the individually identified net assets acquired. Goodwill is not amortized but is tested for impairment annually or whenever indications of impairment exist. The Company’s annual impairment testing date is April 1st. The Company can elect to qualitatively assess goodwill for impairment if it is more likely than not that the fair value of a reporting unit exceeds its carrying value. A qualitative assessment considers macroeconomic and other industry-specific factors, such as trends in short-term and long-term interest rates and the ability to access capital, and Company specific factors such as market capitalization in excess of net assets, trends in revenue generating activities, and merger or acquisition activity. If the Company elects to bypass qualitatively assessing goodwill, or it is not more likely than not that the fair value of a reporting unit exceeds its carrying value, management estimates the fair values of each of the Company’s reporting units (defined as the Company’s businesses for which financial information is available and reviewed regularly by management) and compares it to their carrying values. The estimated fair values of the reporting units are established using an income approach based on a discounted cash flow model that includes significant assumptions about the future operating results and cash flows of each reporting unit, a market approach which compares each reporting unit to comparable companies in their respective industries, as well as a market capitalization analysis. Based on the Company’s analysis, fair value significantly exceeded the carrying value for all reporting units as of its annual testing date. Intangible assets Intangible assets are amortized over their useful lives in a manner that best reflects their economic benefit. Intangible assets are reviewed for impairment whenever events or changes in circumstances indicate that the carrying amount of such assets may not be recoverable. The Company does not have any indefinite-lived intangible assets. Low-Income Housing Tax Credit (LIHTC) Investments As part of the Company’s community reinvestment initiatives, the Company invests with other institutional investors in funds that make equity investments in multifamily affordable housing properties. The Company receives tax credits and other tax benefits for these investments. The Company accounts for investments in qualified affordable housing projects using the proportional amortization method if certain criteria are met. The proportional amortization method amortizes the cost of the investment over the period in which the investor expects to receive tax credits and other tax benefits, and the resulting amortization is recognized as a component of income tax expense attributable to continuing operations. The carrying value of LIHTC investments is included in other assets on the consolidated balance sheets. Unfunded commitments related to LIHTC investments are included in accrued expenses and other liabilities on the consolidated balance sheets.

THE CHARLES SCHWAB CORPORATION Notes to Consolidated Financial Statements
(Tabular Amounts in Millions, Except Per Share Data, Option Price Amounts, Ratios, or as Noted)
- 65 -
Guarantees and indemnifications The Company recognizes, at the inception of a guarantee, a liability equal to the estimated fair value of the obligation undertaken in issuing the guarantee. The fair values of obligations relating to guarantees are estimated based on transactions for similar guarantees or expected present value measures. Advertising and market development Advertising and market development activities include the cost to produce and distribute marketing campaigns as well as client incentives and discounts. Such costs are generally expensed when incurred. Income taxes The Company provides for income taxes on all transactions that have been recognized in the consolidated financial statements. Accordingly, deferred tax assets are adjusted to reflect the tax rates at which future taxable amounts will likely be settled or realized. The effects of tax rate changes on future deferred tax assets and deferred tax liabilities, as well as other changes in income tax laws, are recorded in earnings in the period during which such changes are enacted. The Company’s unrecognized tax benefits, which are included in accrued expenses and other liabilities, represent the difference between positions taken on tax return filings and estimated potential tax settlement outcomes. Accrued interest relating to unrecognized tax benefits is recorded in income tax expense and penalties are recorded in other expense. Stock-based compensation Stock-based compensation includes employee and board of director stock options, restricted stock units, and restricted stock awards. The Company measures compensation expense for these share-based payment arrangements based on their estimated fair values as of the awards’ grant date. The fair value of the share-based award is recognized over the vesting period as stock-based compensation. Stock-based compensation expense is based on awards expected to vest and therefore is reduced for estimated forfeitures. Forfeitures are estimated at the time of grant based on the Company’s historical forfeiture experience and revised in subsequent periods if actual forfeitures differ from those estimates. The excess tax benefits from the exercise of stock options and the vesting of restricted stock awards are recorded in additional paid-in capital. Fair values of assets and liabilities Fair value is defined as the price that would be received to sell an asset or the price paid to transfer a liability in an orderly transaction between market participants at the measurement date. Fair value measurement accounting guidance describes the fair value hierarchy for disclosing assets and liabilities measured at fair value based on the inputs used to value them. The fair value hierarchy maximizes the use of observable inputs and minimizes the use of unobservable inputs. Observable inputs are based on market pricing data obtained from sources independent of the Company. A quoted price in an active market provides the most reliable evidence of fair value and is generally used to measure fair value whenever available. Unobservable inputs reflect management’s judgment about the assumptions market participants would use in pricing the asset or liability. Where inputs used to measure fair value of an asset or liability are from different levels of the hierarchy, the asset or liability is categorized based on the lowest level input that is significant to the fair value measurement in its entirety. Assessing the significance of a particular input requires judgment. The fair value hierarchy includes three levels based on the objectivity of the inputs as follows:
Level 1 inputs are quoted prices in active markets as of the measurement date for identical assets or liabilities that the Company has the ability to access.
Level 2 inputs are inputs other than quoted prices included in Level 1 that are observable for the asset or liability,
either directly or indirectly. Level 2 inputs include quoted prices for similar assets and liabilities in active markets, and inputs other than quoted prices that are observable for the asset or liability, such as interest rates, benchmark yields, issuer spreads, new issue data, and collateral performance.
THE CHARLES SCHWAB CORPORATION Notes to Consolidated Financial Statements
(Tabular Amounts in Millions, Except Per Share Data, Option Price Amounts, Ratios, or as Noted)
- 66 -
Level 3 inputs are unobservable inputs for the asset or liability, and include situations where there is little, if any, market activity for the asset or liability.
The Company’s policy is to recognize transfers of financial instruments between levels as of the beginning of the reporting period in which a transfer occurs. Assets and liabilities measured at fair value on a recurring basis The Company’s assets and liabilities measured at fair value on a recurring basis include certain cash equivalents, certain investments segregated and on deposit for regulatory purposes, other securities owned, and securities available for sale. The Company uses the market and income approaches to determine the fair value of assets and liabilities. When available, the Company uses quoted prices in active markets to measure the fair value of assets and liabilities. When utilizing market data and bid-ask spread, the Company uses the price within the bid-ask spread that best represents fair value. When quoted prices do not exist, the Company uses prices obtained from independent third-party pricing services to measure the fair value of investment assets. The Company generally obtains prices from at least three independent pricing sources for assets recorded at fair value. The Company’s primary independent pricing service provides prices based on observable trades and discounted cash flows that incorporate observable information such as yields for similar types of securities (a benchmark interest rate plus observable spreads) and weighted-average maturity for the same or similar “to-be-issued” securities. The Company compares the prices obtained from its primary independent pricing service to the prices obtained from the additional independent pricing services to determine if the price obtained from the primary independent pricing service is reasonable. The Company does not adjust the prices received from independent third-party pricing services unless such prices are inconsistent with the definition of fair value and result in a material difference in the recorded amounts. Fair value of other financial instruments Descriptions of the valuation methodologies and assumptions used to estimate the fair value of other financial instruments are described below. The Company’s financial instruments not recorded at fair value but for which fair value can be approximated and disclosed include:
Cash and cash equivalents are short-term in nature and accordingly are recorded at amounts that approximate fair value.
Cash and investments segregated and on deposit for regulatory purposes include cash and securities purchased
under resale agreements. Securities purchased under resale agreements are short-term in nature and are backed by collateral that both exceeds the carrying value of the resale agreement and is highly liquid in nature. Accordingly, the carrying values of these financial instruments approximate their fair values.
Receivables from/payables to brokers, dealers, and clearing organizations are short-term in nature, recorded at
contractual amounts and historically have been settled at those values. Accordingly, the carrying values of these financial instruments approximate fair values.
Receivables from/payables to brokerage clients — net are recorded at contractual amounts and historically have
been settled at those values and are short-term in nature, and therefore the carrying values of these financial instruments approximate their fair values.
Securities held to maturity – The fair values of securities held to maturity are obtained using an independent third-
party pricing service similar to investment assets recorded at fair value as discussed above.
Bank loans – The fair values of the Company’s First Mortgages and HELOCs are estimated based on prices of mortgage-backed securities collateralized by similar types of loans. PALs are non-purpose revolving lines of credit secured by eligible assets; accordingly, the carrying values of these loans approximate their fair values.

THE CHARLES SCHWAB CORPORATION Notes to Consolidated Financial Statements
(Tabular Amounts in Millions, Except Per Share Data, Option Price Amounts, Ratios, or as Noted)
- 67 -
Financial instruments included in other assets primarily consist of LIHTC investments, cost method investments and Federal Home Loan Bank (FHLB) stock, whose carrying values approximate their fair values. FHLB stock is recorded at par, which approximates fair value.
Bank deposits have no stated maturity and are recorded at the amount payable on demand as of the balance sheet
date. The Company considers the carrying value of these deposits to approximate their fair values.
Financial instruments included in accrued expenses and other liabilities consist of commercial paper, drafts payable, unfunded LIHTC commitments and certain amounts due under contractual obligations which are short-term in nature and accordingly are recorded at amounts that approximate fair value.
Long-term debt – Except for the finance lease obligation, the fair values of long-term debt are estimated using
indicative, non-binding quotes from independent brokers. The Company validates indicative prices for its debt through comparison to other independent non-binding quotes. The finance lease obligation is recorded at carrying value, which approximates fair value.
Firm commitments to extend credit – The Company extends credit to banking clients through HELOCs and PALs.
The Company considers the fair value of these unused commitments to not be material because the interest rates earned on these balances are based on floating interest rates that reset monthly.
New Accounting Standards Adoption of New Accounting Standards In January 2014, the Financial Accounting Standards Board (FASB) issued Accounting Standards Update (ASU) 2014-04, “Receivables – Troubled Debt Restructurings by Creditors (Subtopic 310-40).” ASU 2014-04 provides new guidance for creditors of consumer mortgage loans, and was effective January 1, 2015. The guidance clarifies when physical possession of a property underlying a consumer mortgage loan transfers to the creditor, and therefore when a loan receivable should be derecognized and the real estate property underlying the loan should be recognized. The adoption of this new guidance in the first quarter of 2015 did not have an impact on the Company’s financial statements or EPS as the Company’s practice for recognizing foreclosed real estate was already consistent with the guidance. In August 2015, the FASB issued ASU 2015-15, “Interest – Imputation of Interest (Subtopic 835-30).” Pursuant to the Securities and Exchange Commission (SEC) Staff Announcement at the June 18, 2015 Emerging Issues Task Force meeting, ASU 2015-15 provides clarification to ASU 2015-03 (discussed below) of SEC Staff views on the presentation and subsequent measurement of debt issuance costs related to line-of-credit arrangements. The new guidance permits deferring and presenting debt issuance costs as an asset and subsequently amortizing the deferred debt issuance costs ratably over the term of a line-of-credit arrangement, regardless of whether there are any outstanding borrowings on the line of credit. The adoption of this new guidance in the third quarter of 2015 did not have an impact on the Company’s financial statements or EPS as the Company’s practice for recognizing debt issuance costs on line-of-credit arrangements was already consistent with the guidance. New Accounting Standards Not Yet Adopted In May 2014, the FASB issued ASU 2014-09, “Revenue from Contracts with Customers (Topic 606),” which provides new guidance on revenue recognition. The guidance clarifies that revenue from contracts with customers should be recognized in a manner that depicts the timing of the related transfer of goods or performance of services at an amount that reflects the expected consideration. The new guidance will become effective January 1, 2018, and permits entities to elect either full or modified retrospective transition. Full retrospective transition will require a cumulative effect adjustment to retained earnings as of the earliest comparative period presented. Modified retrospective transition will require a cumulative effect adjustment to retained earnings as of the beginning of the reporting period in which the entity first applies the new guidance. The Company is currently evaluating the impact of this new guidance on its financial statements and EPS. In February 2015, the FASB issued ASU 2015-02, “Consolidation (Topic 810),” which amends the analysis a reporting entity must perform to determine whether it should consolidate certain types of legal entities. The new guidance became effective
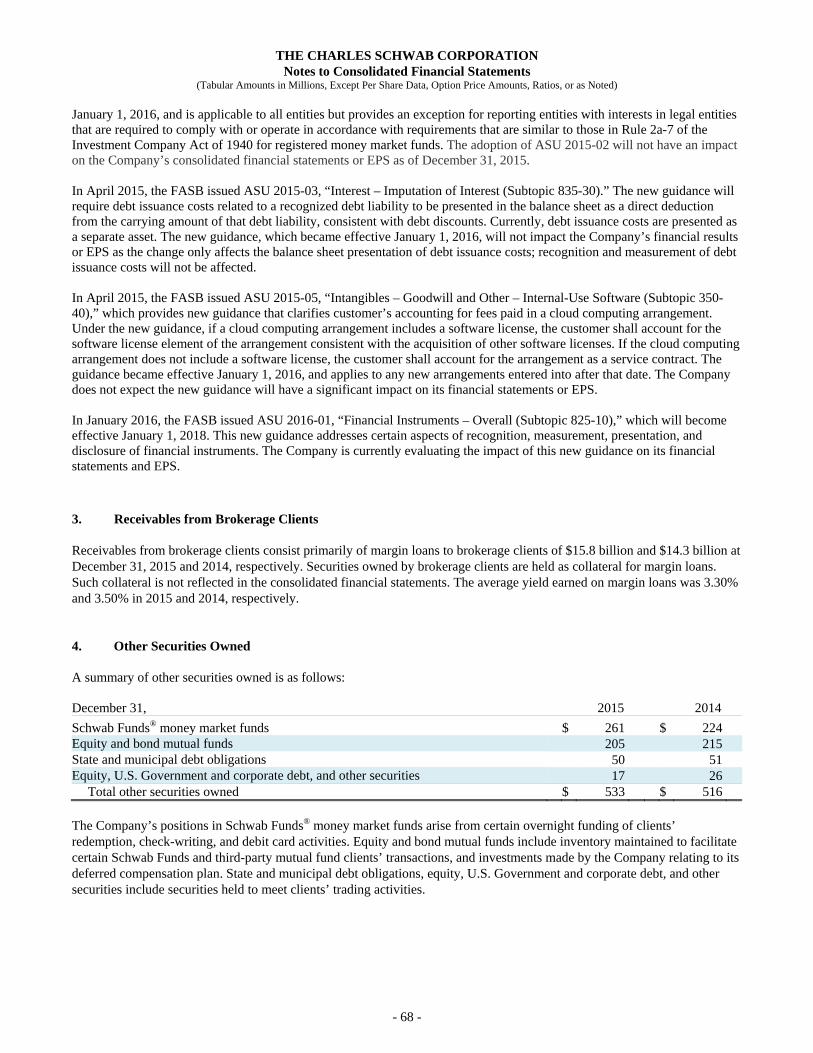
THE CHARLES SCHWAB CORPORATION Notes to Consolidated Financial Statements
(Tabular Amounts in Millions, Except Per Share Data, Option Price Amounts, Ratios, or as Noted)
- 68 -
January 1, 2016, and is applicable to all entities but provides an exception for reporting entities with interests in legal entities that are required to comply with or operate in accordance with requirements that are similar to those in Rule 2a-7 of the Investment Company Act of 1940 for registered money market funds. The adoption of ASU 2015-02 will not have an impact on the Company’s consolidated financial statements or EPS as of December 31, 2015. In April 2015, the FASB issued ASU 2015-03, “Interest – Imputation of Interest (Subtopic 835-30).” The new guidance will require debt issuance costs related to a recognized debt liability to be presented in the balance sheet as a direct deduction from the carrying amount of that debt liability, consistent with debt discounts. Currently, debt issuance costs are presented as a separate asset. The new guidance, which became effective January 1, 2016, will not impact the Company’s financial results or EPS as the change only affects the balance sheet presentation of debt issuance costs; recognition and measurement of debt issuance costs will not be affected. In April 2015, the FASB issued ASU 2015-05, “Intangibles – Goodwill and Other – Internal-Use Software (Subtopic 350-40),” which provides new guidance that clarifies customer’s accounting for fees paid in a cloud computing arrangement. Under the new guidance, if a cloud computing arrangement includes a software license, the customer shall account for the software license element of the arrangement consistent with the acquisition of other software licenses. If the cloud computing arrangement does not include a software license, the customer shall account for the arrangement as a service contract. The guidance became effective January 1, 2016, and applies to any new arrangements entered into after that date. The Company does not expect the new guidance will have a significant impact on its financial statements or EPS. In January 2016, the FASB issued ASU 2016-01, “Financial Instruments – Overall (Subtopic 825-10),” which will become effective January 1, 2018. This new guidance addresses certain aspects of recognition, measurement, presentation, and disclosure of financial instruments. The Company is currently evaluating the impact of this new guidance on its financial statements and EPS.
3. Receivables from Brokerage Clients Receivables from brokerage clients consist primarily of margin loans to brokerage clients of $15.8 billion and $14.3 billion at December 31, 2015 and 2014, respectively. Securities owned by brokerage clients are held as collateral for margin loans. Such collateral is not reflected in the consolidated financial statements. The average yield earned on margin loans was 3.30% and 3.50% in 2015 and 2014, respectively. 4. Other Securities Owned A summary of other securities owned is as follows:
December 31, 2015 2014
Schwab Funds® money market funds $ 261 $ 224 Equity and bond mutual funds 205 215 State and municipal debt obligations 50 51 Equity, U.S. Government and corporate debt, and other securities 17 26
Total other securities owned $ 533 $ 516 The Company’s positions in Schwab Funds® money market funds arise from certain overnight funding of clients’ redemption, check-writing, and debit card activities. Equity and bond mutual funds include inventory maintained to facilitate certain Schwab Funds and third-party mutual fund clients’ transactions, and investments made by the Company relating to its deferred compensation plan. State and municipal debt obligations, equity, U.S. Government and corporate debt, and other securities include securities held to meet clients’ trading activities.

THE CHARLES SCHWAB CORPORATION Notes to Consolidated Financial Statements
(Tabular Amounts in Millions, Except Per Share Data, Option Price Amounts, Ratios, or as Noted)
- 69 -
5. Securities Available for Sale and Securities Held to Maturity The amortized cost, gross unrealized gains and losses, and fair value of securities available for sale and securities held to maturity are as follows:
Gross Gross Amortized Unrealized Unrealized Fair December 31, 2015 Cost Gains Losses Value
Securities available for sale: U.S. agency mortgage-backed securities $ 22,014 $ 183 $ 48 $ 22,149Asset-backed securities 21,784 7 306 21,485Corporate debt securities 10,764 14 31 10,747U.S. Treasury securities 5,719 2 17 5,704U.S. agency notes 3,177 - 27 3,150Certificates of deposit 1,685 1 3 1,683U.S. state and municipal securities 414 10 - 424Non-agency commercial mortgage-backed securities 298 1 - 299Other securities 5 - - 5
Total securities available for sale $ 65,860 $ 218 $ 432 $ 65,646
Securities held to maturity: U.S. agency mortgage-backed securities $ 48,785 $ 391 $ 293 $ 48,883Non-agency commercial mortgage-backed securities 999 6 20 985U.S. Treasury securities 223 - 3 220
Total securities held to maturity $ 50,007 $ 397 $ 316 $ 50,088
Gross Gross Amortized Unrealized Unrealized Fair December 31, 2014 Cost Gains Losses Value
Securities available for sale: U.S. agency mortgage-backed securities $ 18,487 $ 242 $ 12 $ 18,717Asset-backed securities 19,320 64 18 19,366Corporate debt securities 8,023 30 8 8,045U.S. Treasury securities 2,993 2 1 2,994U.S. agency notes 3,839 - 44 3,795Certificates of deposit 1,533 1 - 1,534Non-agency commercial mortgage-backed securities 310 7 - 317Other securities 15 - - 15
Total securities available for sale $ 54,520 $ 346 $ 83 $ 54,783
Securities held to maturity: U.S. agency mortgage-backed securities $ 33,388 $ 531 $ 174 $ 33,745Non-agency commercial mortgage-backed securities 1,001 11 14 998
Total securities held to maturity $ 34,389 $ 542 $ 188 $ 34,743

THE CHARLES SCHWAB CORPORATION Notes to Consolidated Financial Statements
(Tabular Amounts in Millions, Except Per Share Data, Option Price Amounts, Ratios, or as Noted)
- 70 -
Schwab Bank pledges securities issued by federal agencies to secure certain trust deposits. The fair value of these pledged securities was $170 million at December 31, 2015. A summary of securities with unrealized losses, aggregated by category and period of continuous unrealized loss, is as follows:
Less than 12 months 12 months or longer Total Fair Unrealized Fair Unrealized Fair UnrealizedDecember 31, 2015 Value Losses Value Losses Value Losses
Securities available for sale: U.S. agency mortgage-backed securities $ 8,541 $ 47 $ 813 $ 1 $ 9,354 $ 48Asset-backed securities 17,127 240 2,743 66 19,870 306Corporate debt securities 5,433 25 942 6 6,375 31U.S. Treasury securities 5,010 17 - - 5,010 17U.S. agency notes 1,281 10 1,547 17 2,828 27Certificates of deposit 773 2 599 1 1,372 3
Total $ 38,165 $ 341 $ 6,644 $ 91 $ 44,809 $ 432
Securities held to maturity: U.S. agency mortgage-backed securities $ 24,219 $ 253 $ 1,842 $ 40 $ 26,061 $ 293Non-agency commercial mortgage-backed
securities 729 20 - - 729 20U.S. Treasury securities 220 3 - - 220 3
Total $ 25,168 $ 276 $ 1,842 $ 40 $ 27,010 $ 316Total securities with unrealized losses (1) $ 63,333 $ 617 $ 8,486 $ 131 $ 71,819 $ 748
(1) The number of investment positions with unrealized losses totaled 409 for securities available for sale and 286 for securities held to maturity.
Less than 12 months 12 months or longer Total Fair Unrealized Fair Unrealized Fair UnrealizedDecember 31, 2014 Value Losses Value Losses Value Losses
Securities available for sale: U.S. agency mortgage-backed securities $ 2,247 $ 5 $ 1,767 $ 7 $ 4,014 $ 12Asset-backed securities 5,754 15 792 3 6,546 18Corporate debt securities 1,781 4 552 4 2,333 8U.S. Treasury securities 1,246 1 - - 1,246 1U.S. agency notes - - 3,696 44 3,696 44
Total $ 11,028 $ 25 $ 6,807 $ 58 $ 17,835 $ 83
Securities held to maturity: U.S. agency mortgage-backed securities $ 264 $ 1 $ 10,415 $ 173 $ 10,679 $ 174Non-agency commercial mortgage-backed
securities - - 660 14 660 14Total $ 264 $ 1 $ 11,075 $ 187 $ 11,339 $ 188
Total securities with unrealized losses (1) $ 11,292 $ 26 $ 17,882 $ 245 $ 29,174 $ 271
(1) The number of investment positions with unrealized losses totaled 173 for securities available for sale and 111 for securities held to maturity.
Management evaluates whether securities available for sale and securities held to maturity are OTTI on a quarterly basis as described in “Notes – 2. Summary of Significant Accounting Policies.”

THE CHARLES SCHWAB CORPORATION Notes to Consolidated Financial Statements
(Tabular Amounts in Millions, Except Per Share Data, Option Price Amounts, Ratios, or as Noted)
- 71 -
The following table is a roll forward of the amount of credit losses recognized in earnings for OTTI securities held by the Company during the period for which a portion of the impairment was reclassified from or recognized in other comprehensive income (loss):
Year Ended December 31, 2015 2014 2013
Balance at beginning of year $ 2 $ 169 $ 159
Credit losses recognized into current year earnings on debt securities for
which an OTTI was not previously recognized - 1 1
Credit losses recognized into current year earnings on debt securities for
which an OTTI was previously recognized - - 9
Reductions due to sale of debt securities for which an OTTI was
previously recognized (1) (168) -
Balance at end of year $ 1 $ 2 $ 169
The maturities of securities available for sale and securities held to maturity are as follows:
After 1 year After 5 years Within through through After December 31, 2015 1 year 5 years 10 years 10 years Total
Securities available for sale: U.S. agency mortgage-backed securities (1) $ - $ 1,883 $ 10,372 $ 9,894 $ 22,149Asset-backed securities - 7,014 3,555 10,916 21,485Corporate debt securities 2,344 8,403 - - 10,747U.S. Treasury securities 2,494 3,015 195 - 5,704U.S. agency notes - 3,150 - - 3,150Certificates of deposit 935 748 - - 1,683U.S. state and municipal securities - - 19 405 424Non-agency commercial mortgage-backed
securities (1) - - - 299 299Other securities - - - 5 5
Total fair value $ 5,773 $ 24,213 $ 14,141 $ 21,519 $ 65,646Total amortized cost $ 5,774 $ 24,247 $ 14,160 $ 21,679 $ 65,860
Securities held to maturity: U.S. agency mortgage-backed securities (1) $ - $ 2,380 $ 20,337 $ 26,166 $ 48,883Non-agency commercial mortgage-backed
securities (1) - - 357 628 985
U.S. Treasury securities - - 220 - 220Total fair value $ - $ 2,380 $ 20,914 $ 26,794 $ 50,088Total amortized cost $ - $ 2,311 $ 20,878 $ 26,818 $ 50,007
(1) Mortgage-backed securities have been allocated to maturity groupings based on final contractual maturities. Actual maturities will differ from final contractual maturities because borrowers on a certain portion of loans underlying these securities have the right to prepay their obligations.
Proceeds and gross realized gains and losses from sales of securities available for sale are as follows:
Year Ended December 31, 2015 2014 2013 Proceeds $ 2,424 $ 6,556 $ 6,167 Gross realized gains 1 30 7 Gross realized losses 1 23 -

THE CHARLES SCHWAB CORPORATION Notes to Consolidated Financial Statements
(Tabular Amounts in Millions, Except Per Share Data, Option Price Amounts, Ratios, or as Noted)
- 72 -
6. Bank Loans and Related Allowance for Loan Losses The composition of bank loans and delinquency analysis by loan segment is as follows:
>90 days past Total past due Allowance Total 30-59 days 60-89 days due and other and other Total for loan bank
December 31, 2015 Current past due past due nonaccrual loans nonaccrual loans loans losses loans - net
Residential real estate mortgages $ 8,304 $ 11 $ 1 $ 18 $ 30 $ 8,334 $ 20 $ 8,314
Home equity loans and lines of credit 2,720 4 1 10 15 2,735 11 2,724
Pledged asset lines 3,228 3 1 - 4 3,232 - 3,232
Other 64 - - - - 64 - 64
Total bank loans $ 14,316 $ 18 $ 3 $ 28 $ 49 $ 14,365 $ 31 $ 14,334
December 31, 2014
Residential real estate mortgages $ 8,092 $ 9 $ 2 $ 24 $ 35 $ 8,127 $ 29 $ 8,098
Home equity loans and lines of credit 2,942 1 1 11 13 2,955 13 2,942
Pledged asset lines 2,320 - - - - 2,320 - 2,320
Other 38 1 - - 1 39 - 39
Total bank loans $ 13,392 $ 11 $ 3 $ 35 $ 49 $ 13,441 $ 42 $ 13,399
First mortgages and HELOCs include unamortized premiums and discounts and direct origination costs of $80 million at December 31, 2015 and 2014, respectively. The Company had commitments to extend credit related to unused HELOCs, PALs, and other lines of credit, which totaled $7.4 billion and $6.7 billion at December 31, 2015 and 2014, respectively. The Company had commitments to purchase First Mortgage loans of $37 million and $24 million at December 31, 2015 and 2014, respectively. Additionally, the Company had a pipeline of First Mortgages in process of $223 million and $202 million at December 31, 2015 and 2014, respectively. All PALs were fully collateralized by securities with fair values in excess of borrowings at December 31, 2015 and 2014. Schwab Bank provides a co-branded loan origination program for Schwab Bank clients (the Program) with Quicken Loans, Inc. (Quicken Loans®). Pursuant to the Program, Quicken Loans originates and services First Mortgages and HELOCs for Schwab Bank clients. Under the Program, Schwab Bank purchases certain First Mortgages and HELOCs that are originated by Quicken Loans. Schwab Bank purchased First Mortgages of $2.0 billion and $1.4 billion during 2015 and 2014, respectively. Schwab Bank purchased HELOCs with commitments of $573 million and $664 million during 2015 and 2014, respectively. Credit Quality Changes in the allowance for loan losses were as follows:
December 31, 2015 December 31, 2014 December 31, 2013 Residential Home equity Residential Home equity Residential Home equity real estate loans and real estate loans and real estate loans and mortgages lines of credit Total mortgages lines of credit Total mortgages lines of credit Total
Balance at beginning of year $ 29 $ 13 $ 42 $ 34 $ 14 $ 48 $ 36 $ 20 $ 56
Charge-offs (1) (2) (3) (3) (2) (5) (5) (6) (11) Recoveries 1 2 3 2 1 3 2 2 4 Provision for loan losses (9) (2) (11) (4) - (4) 1 (2) (1)Balance at end of year $ 20 $ 11 $ 31 $ 29 $ 13 $ 42 $ 34 $ 14 $ 48
The majority of the bank loans were collectively evaluated for impairment at both December 31, 2015 and 2014. There were no loans accruing interest that were contractually 90 days or more past due at December 31, 2015 or 2014. Nonperforming assets, which include nonaccrual loans and other real estate owned, totaled $36 million and $44 million at December 31, 2015 and 2014, respectively. Impaired assets, which include non-accrual loans, other real estate owned and TDRs, totaled $50 million and $61 million at December 31, 2015 and 2014, respectively. Troubled debt restructurings were not material at December 31, 2015 or 2014, respectively.

THE CHARLES SCHWAB CORPORATION Notes to Consolidated Financial Statements
(Tabular Amounts in Millions, Except Per Share Data, Option Price Amounts, Ratios, or as Noted)
- 73 -
In addition to monitoring delinquency, the Company monitors the credit quality of First Mortgages and HELOCs by stratifying the portfolios by the year of origination, borrower FICO scores at origination, updated borrower FICO scores, LTV ratios at origination, and estimated current LTV ratios. Borrowers’ FICO scores are provided by an independent third party credit reporting service and were last updated in December 2015. The Origination LTV and Estimated Current LTV ratios for a HELOC include any first lien mortgage outstanding on the same property at the time of the HELOC’s origination. The Estimated Current LTV for each loan is estimated by reference to a home price appreciation index. As of December 31, 2015 and 2014, 48% of the Company’s HELOC and First Mortgage portfolio was concentrated in California. These loans have performed in a manner consistent with the portfolio as a whole.
Weighted Percent of Loans Average Utilization that are onDecember 31, 2015 Balance Updated FICO Rate (1) Nonaccrual Status
Residential real estate mortgages: Estimated Current LTV
<70% $ 7,508 774 N/A 0.03 % >70% – <90% 759 764 N/A 0.31 % >90% – <100% 37 736 N/A 5.54 % >100% 30 713 N/A 7.72 %
Total $ 8,334 773 N/A 0.11 %
Home equity loans and lines of credit: Estimated Current LTV
<70% $ 2,277 772 37 % 0.09 % >70% – <90% 373 760 50 % 0.48 % >90% – <100% 48 748 63 % 1.02 % >100% 37 739 67 % 1.79 %
Total $ 2,735 770 39 % 0.18 %
Pledged asset lines:
Weighted Average LTV
=70%
$ 3,232 764 49 % -
(1) The Utilization Rate is calculated using the outstanding balance divided by the associated total line of credit. N/A Not applicable.

THE CHARLES SCHWAB CORPORATION Notes to Consolidated Financial Statements
(Tabular Amounts in Millions, Except Per Share Data, Option Price Amounts, Ratios, or as Noted)
- 74 -
Residential Home equity real estate loans and December 31, 2015 mortgages lines of credit
Year of origination Pre-2011 $ 882 $ 1,9342011 424 1142012 1,644 1252013 2,450 2322014 1,021 1882015 1,913 142
Total $ 8,334 $ 2,735
Origination FICO <620 $ 10 $ -620 – 679 88 16680 – 739 1,381 498>740 6,855 2,221
Total $ 8,334 $ 2,735
Origination LTV <70% $ 5,913 $ 1,858 >70% – <90% 2,408 860 >90% – <100% 13 17
Total $ 8,334 $ 2,735
Weighted Percent of Loans Average Utilization that are onDecember 31, 2014 Balance Updated FICO Rate (1) Nonaccrual Status
Residential real estate mortgages: Estimated Current LTV
<70% $ 7,131 774 N/A 0.04 % >70% – <90% 882 765 N/A 0.50 % >90% – <100% 61 740 N/A 2.95 % >100% 53 726 N/A 10.95 %
Total $ 8,127 773 N/A 0.18 %
Home equity loans and lines of credit: Estimated Current LTV
<70% $ 2,282 773 36 % 0.08 % >70% – <90% 526 762 48 % 0.34 % >90% – <100% 81 749 61 % 1.67 % >100% 66 742 63 % 1.54 %
Total $ 2,955 769 39 % 0.20 %
Pledged asset lines:
Weighted Average LTV
=70%
$ 2,320 764 50 % -
(1) The Utilization Rate is calculated using the outstanding balance divided by the associated total line of credit. N/A Not applicable.

THE CHARLES SCHWAB CORPORATION Notes to Consolidated Financial Statements
(Tabular Amounts in Millions, Except Per Share Data, Option Price Amounts, Ratios, or as Noted)
- 75 -
Residential Home equity real estate loans and December 31, 2014 mortgages lines of credit
Year of origination Pre-2011 $ 1,119 $ 2,2442011 588 1372012 2,107 1472013 3,047 2502014 1,266 177
Total $ 8,127 $ 2,955
Origination FICO
<620 $ 10 $ -620 – 679 97 18680 – 739 1,366 549>740 6,654 2,388
Total $ 8,127 $ 2,955
Origination LTV
<70% $ 5,572 $ 1,979>70% – <90% 2,538 955>90% – <100% 17 21
Total $ 8,127 $ 2,955 7. Equipment, Office Facilities, and Property Equipment, office facilities, and property are detailed below:
December 31, 2015 2014
Software $ 1,183 $ 1,281 Buildings 771 673 Leasehold improvements 322 310 Information technology equipment 273 257 Furniture and equipment 177 154 Telecommunications equipment 78 83 Construction in progress 18 64 Land 110 107
Total equipment, office facilities, and property 2,932 2,929 Accumulated depreciation and amortization (1,787) (1,890)
Total equipment, office facilities, and property – net $ 1,145 $ 1,039 Depreciation and amortization expense for equipment, office facilities, and property was $179 million, $155 million, $154 million in 2015, 2014, and 2013, respectively.
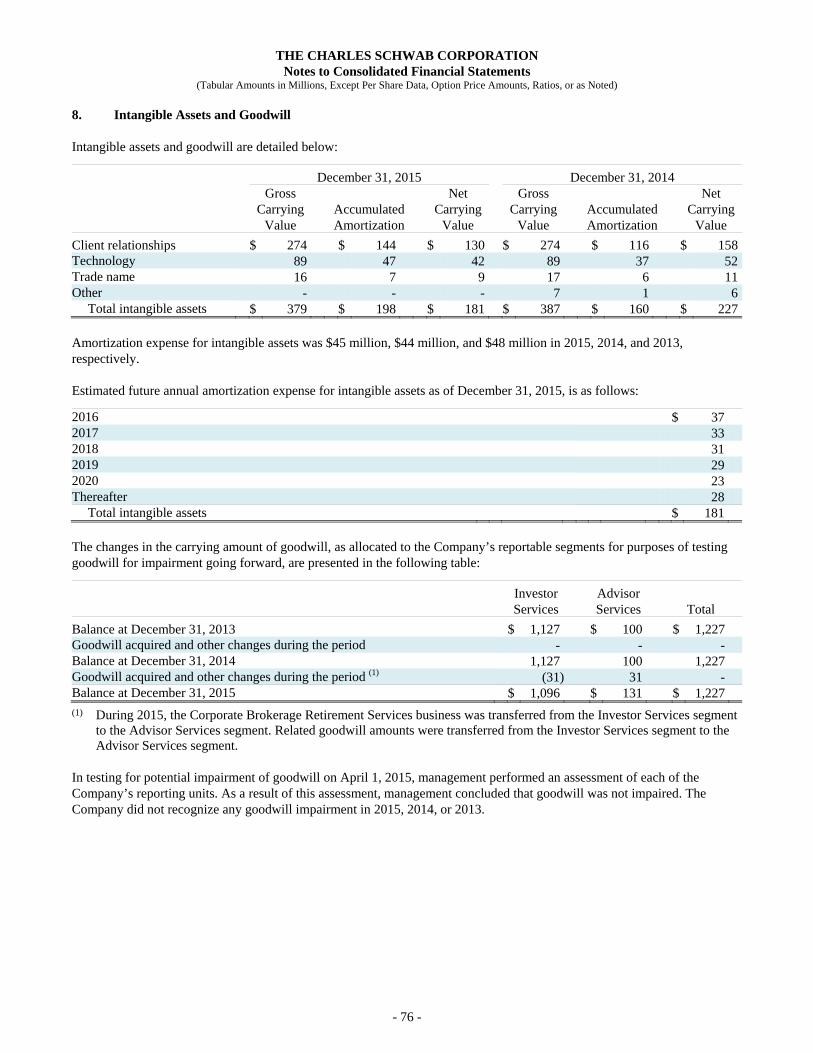
THE CHARLES SCHWAB CORPORATION Notes to Consolidated Financial Statements
(Tabular Amounts in Millions, Except Per Share Data, Option Price Amounts, Ratios, or as Noted)
- 76 -
8. Intangible Assets and Goodwill Intangible assets and goodwill are detailed below:
December 31, 2015 December 31, 2014 Gross Net Gross Net Carrying Accumulated Carrying Carrying Accumulated Carrying Value Amortization Value Value Amortization Value
Client relationships $ 274 $ 144 $ 130 $ 274 $ 116 $ 158Technology 89 47 42 89 37 52Trade name 16 7 9 17 6 11Other - - - 7 1 6
Total intangible assets $ 379 $ 198 $ 181 $ 387 $ 160 $ 227 Amortization expense for intangible assets was $45 million, $44 million, and $48 million in 2015, 2014, and 2013, respectively. Estimated future annual amortization expense for intangible assets as of December 31, 2015, is as follows:
2016 $ 372017 332018 312019 292020 23Thereafter 28
Total intangible assets $ 181 The changes in the carrying amount of goodwill, as allocated to the Company’s reportable segments for purposes of testing goodwill for impairment going forward, are presented in the following table:
Investor Advisor Services Services Total
Balance at December 31, 2013 $ 1,127 $ 100 $ 1,227 Goodwill acquired and other changes during the period - - - Balance at December 31, 2014 1,127 100 1,227 Goodwill acquired and other changes during the period (1) (31) 31 - Balance at December 31, 2015 $ 1,096 $ 131 $ 1,227
(1) During 2015, the Corporate Brokerage Retirement Services business was transferred from the Investor Services segment to the Advisor Services segment. Related goodwill amounts were transferred from the Investor Services segment to the Advisor Services segment.
In testing for potential impairment of goodwill on April 1, 2015, management performed an assessment of each of the Company’s reporting units. As a result of this assessment, management concluded that goodwill was not impaired. The Company did not recognize any goodwill impairment in 2015, 2014, or 2013.

THE CHARLES SCHWAB CORPORATION Notes to Consolidated Financial Statements
(Tabular Amounts in Millions, Except Per Share Data, Option Price Amounts, Ratios, or as Noted)
- 77 -
9. Other Assets The components of other assets are as follows:
December 31, 2015 2014
Accounts receivable (1) $ 388 $ 359 Interest and dividends receivable 241 180 Other investments (2) 180 72 Deferred tax asset – net 145 - Other 119 59 Prepaid expenses 101 110
Total other assets $ 1,174 $ 780
(1) Accounts receivable includes accrued service fee income and a receivable from the Company’s loan servicer.
(2) Other investments include LIHTC investments. 10. Variable Interest Entities A VIE requires consolidation by the entity’s primary beneficiary. The Company evaluates all of the entities in which it is involved to determine if an entity is a VIE and if so, whether the Company is the primary beneficiary. See the “Principles of Consolidation” section of “Notes – 1. Introduction and Basis of Presentation” for discussion of the Company’s evaluations of VIEs and whether it is deemed to be the primary beneficiary of any VIEs in which it holds an interest. The Company was not the primary beneficiary of, and therefore, not required to consolidate any VIEs during 2015, 2014, or 2013. Community Reinvestment Act investments Schwab Bank is subject to the CRA. The CRA is intended to encourage banks to help meet the credit needs of the communities in which they operate, including low and moderate income neighborhoods, consistent with safe and sound banking operations. As part of Schwab Bank’s community reinvestment initiatives, Schwab Bank invests with other institutional investors in funds that make equity investments in multifamily affordable housing properties. In 2014, Schwab Bank’s management approved a program to invest in LIHTC funds. Schwab Bank receives tax credits and other tax benefits for these investments. Schwab Bank’s LIHTC investments are accounted for using the proportional amortization method if certain criteria are met. See “Notes – 2. Summary of Significant Accounting Policies” for discussion of the application of the proportional amortization method. As of December 31, 2015, the majority of the Company’s VIEs are related to Schwab Bank’s LIHTC investments made in 2014 and 2015. Schwab Bank did not have any LIHTC investments prior to 2014. Schwab Bank also has investments in other CRA-related funds, which were invested prior to 2014. During 2015 and 2014, Schwab Bank recorded amortization of $3.3 million and $0.3 million, respectively, and recognized tax credits and other tax benefits of $4.5 million and $0.5 million, respectively, associated with these investments, both of which are included in taxes on income. The carrying value of the LIHTC investments was $104 million and $45 million as of December 31, 2015 and 2014, respectively, which is included in other assets on the consolidated balance sheets. Schwab Bank recorded liabilities of $84 million and $40 million for unfunded commitments related to LIHTC investments at December 31, 2015 and 2014, respectively, which are included in accrued expenses and other liabilities on the consolidated balance sheets. Schwab Bank’s funding of these remaining commitments is dependent upon the occurrence of certain conditions and Schwab Bank expects to pay substantially all of these commitments between 2016 and 2020.

THE CHARLES SCHWAB CORPORATION Notes to Consolidated Financial Statements
(Tabular Amounts in Millions, Except Per Share Data, Option Price Amounts, Ratios, or as Noted)
- 78 -
Aggregate assets, liabilities and maximum exposure to loss The aggregate assets, liabilities, and maximum exposure to loss from those VIEs in which the Company holds a variable interest, but as to which the Company has concluded it is not the primary beneficiary, are summarized in the table below:
December 31, 2015 December 31, 2014 Maximum Maximum Aggregate Aggregate exposure Aggregate Aggregate exposure assets liabilities to loss assets liabilities to loss
LIHTC Investments (1) $ 104 $ 84 $ 104 $ 45 $ 40 $ 45
Other CRA Investments (2) 57 - 66 37 - 62Total $ 161 $ 84 $ 170 $ 82 $ 40 $ 107
(1) LIHTC investments are recorded using the proportional amortization method. (2) Other CRA investments are recorded using either the cost method or the equity method. Aggregate assets are included in
either other assets or bank loans – net on the consolidated balance sheets. The Company’s maximum exposure to loss would result from the loss of the investments, including any committed amounts. During the years ended December 31, 2015 and 2014, the Company did not provide or intend to provide financial or other support to the VIEs that it was not contractually required to provide. 11. Bank Deposits Bank deposits consist of interest-bearing and non-interest-bearing deposits as follows:
December 31, 2015 2014
Interest-bearing deposits: Deposits swept from brokerage accounts $ 108,137 $ 82,101 Checking 12,822 12,318 Savings and other 7,896 7,832
Total interest-bearing deposits 128,855 102,251 Non-interest-bearing deposits 647 564
Total bank deposits $ 129,502 $ 102,815 12. Payables to Brokers, Dealers, and Clearing Organizations Payables to brokers, dealers, and clearing organizations include securities loaned of $2.2 billion and $1.5 billion at December 31, 2015 and 2014, respectively. The cash collateral received from counterparties under securities lending transactions was equal to or greater than the market value of the securities loaned at December 31, 2015 and 2014. 13. Payables to Brokerage Clients The principal source of funding for Schwab’s margin lending is cash balances in brokerage client accounts, which are included in payables to brokerage clients. Cash balances in interest-bearing brokerage client accounts were $26.6 billion and $27.6 billion at December 31, 2015 and 2014, respectively. The average rate paid on cash balances in interest-bearing brokerage client accounts was 0.01% in 2015 and 2014.

THE CHARLES SCHWAB CORPORATION Notes to Consolidated Financial Statements
(Tabular Amounts in Millions, Except Per Share Data, Option Price Amounts, Ratios, or as Noted)
- 79 -
14. Borrowings Long-term debt including unamortized debt discounts and premiums, where applicable, consists of the following:
December 31, 2015 2014
Senior Notes $ 2,565 $ 1,567 Medium-Term Notes, Series A 250 249 Finance lease obligation 75 83
Total long-term debt $ 2,890 $ 1,899 CSC has a universal automatic shelf registration statement (Shelf Registration Statement) on file with the SEC, which enables CSC to issue debt, equity, and other securities. The Senior Notes outstanding at December 31, 2015, have maturities ranging from 2018 to 2026 and bear interest at a weighted-average rate of 3.03% with interest payable semi-annually. On November 13, 2015, CSC issued $350 million aggregate principal amount of Senior Notes that mature in 2026. The Senior Notes have a fixed interest rate of 3.450% with interest payable semi-annually. On March 10, 2015, CSC issued $625 million aggregate principal amount of Senior Notes that mature in 2018 and $375 million aggregate principal amount of Senior Notes that mature in 2025. The Senior Notes due 2018 and 2025 have a fixed interest rate of 1.50% and 3.00%, respectively, with interest payable semi-annually. The Medium-Term Notes, Series A (Medium-Term Notes) outstanding at December 31, 2015, mature in 2017 and have a fixed interest rate of 6.375% with interest payable semi-annually. Schwab has a finance lease obligation related to an office building and land under a 20-year lease. The remaining finance lease obligation of $75 million at December 31, 2015, is being reduced by a portion of the lease payments over the remaining lease term of nine years. Annual maturities on long-term debt outstanding at December 31, 2015, are as follows:
2016 $ 7 2017 258 2018 908 2019 8 2020 709 Thereafter 1,016 Total maturities 2,906 Unamortized discount, net (16)
Total long-term debt $ 2,890 CSC has authorization from its Board of Directors to issue Commercial Paper Notes not to exceed $1.5 billion. Management has set a current limit for the commercial paper program not to exceed the amount of the committed, unsecured credit facility, which was $750 million at December 31, 2015. The maturities of the Commercial Paper Notes may vary, but are not to exceed 270 days from the date of issue. The commercial paper is not redeemable prior to maturity and cannot be voluntarily prepaid. The proceeds of the commercial paper program are to be used for general corporate purposes. There were no borrowings of Commercial Paper Notes outstanding at December 31, 2015 or 2014. CSC maintains a $750 million committed, unsecured credit facility with a group of banks, which is scheduled to expire in June 2016. This facility replaced a similar facility that expired in June 2015. The funds under this facility are available for general corporate purposes. The financial covenants require Schwab to maintain a minimum net capital ratio, as defined, Schwab Bank to be well capitalized, as defined, and CSC to maintain a minimum level of stockholders’ equity, adjusted to exclude accumulated other comprehensive income. At December 31, 2015, the minimum level of stockholders’ equity

THE CHARLES SCHWAB CORPORATION Notes to Consolidated Financial Statements
(Tabular Amounts in Millions, Except Per Share Data, Option Price Amounts, Ratios, or as Noted)
- 80 -
required under this facility was $8.9 billion (CSC’s stockholders’ equity, excluding accumulated other comprehensive income, at December 31, 2015, was $13.5 billion). There were no borrowings outstanding under these facilities at December 31, 2015 or 2014. To manage short-term liquidity, Schwab maintains uncommitted, unsecured bank credit lines with several banks. There were no borrowings outstanding under these lines at December 31, 2015 or 2014. To partially satisfy the margin requirement of client option transactions with the Options Clearing Corporation, the broker-dealer subsidiaries have unsecured standby LOCs with several banks in favor of the Options Clearing Corporation aggregating $295 million at December 31, 2015. There were no funds drawn under any of these LOCs at December 31, 2015 or 2014. In connection with its securities lending activities, the Company is required to provide collateral to certain brokerage clients. The collateral requirements were satisfied by providing cash as collateral. 15. Commitments and Contingencies Operating leases: The Company has non-cancelable operating leases for office space and equipment. Future annual minimum rental commitments under these leases, net of contractual subleases are as follows:
Operating December 31, 2015 Leases Subleases Net
2016 $ 135 $ 34 $ 101 2017 122 28 94 2018 82 6 76 2019 53 2 51 2020 43 2 41 Thereafter 139 4 135
Total $ 574 $ 76 $ 498 Certain leases contain provisions for renewal options, purchase options, and rent escalations based on increases in certain costs incurred by the lessor. Rent expense relating to operating leases was $116 million, $114 million, and $116 million in 2015, 2014, and 2013, respectively. Purchase obligations: The Company has purchase obligations for services such as advertising and marketing, telecommunications, professional services, and hardware- and software-related agreements. The Company has purchase obligations as follows:
December 31, 2015
2016 $ 230 2017 114 2018 38 2019 19 2020 17 Thereafter 213
Total $ 631 Guarantees and indemnifications: The Company has clients that sell (i.e., write) listed option contracts that are cleared by the Options Clearing Corporation – a clearing house that establishes margin requirements on these transactions. The Company partially satisfies the margin requirements by arranging unsecured standby LOCs, in favor of the Options Clearing Corporation and others, which are issued by multiple banks. At December 31, 2015, the aggregate face amount of these LOCs totaled $304 million. There were no funds drawn under any of these LOCs at December 31, 2015. In connection with its securities lending activities, the Company is required to provide collateral to certain brokerage clients. The Company satisfies the collateral requirements by providing cash as collateral.
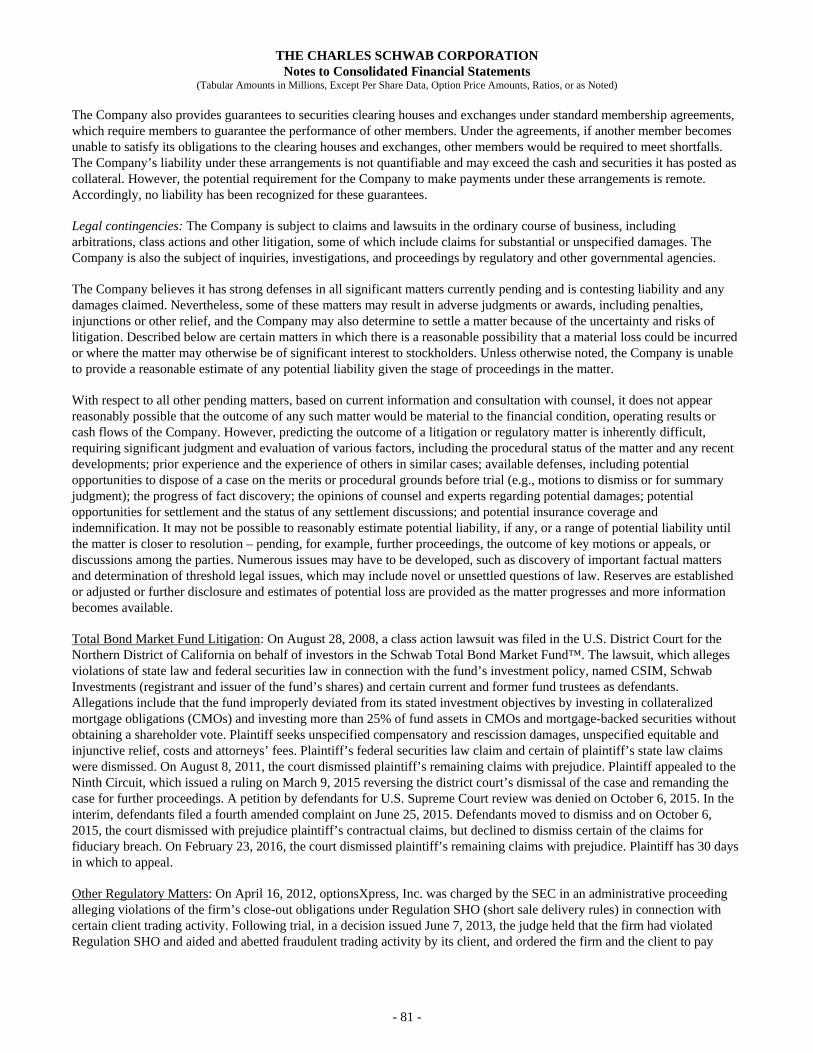
THE CHARLES SCHWAB CORPORATION Notes to Consolidated Financial Statements
(Tabular Amounts in Millions, Except Per Share Data, Option Price Amounts, Ratios, or as Noted)
- 81 -
The Company also provides guarantees to securities clearing houses and exchanges under standard membership agreements, which require members to guarantee the performance of other members. Under the agreements, if another member becomes unable to satisfy its obligations to the clearing houses and exchanges, other members would be required to meet shortfalls. The Company’s liability under these arrangements is not quantifiable and may exceed the cash and securities it has posted as collateral. However, the potential requirement for the Company to make payments under these arrangements is remote. Accordingly, no liability has been recognized for these guarantees. Legal contingencies: The Company is subject to claims and lawsuits in the ordinary course of business, including arbitrations, class actions and other litigation, some of which include claims for substantial or unspecified damages. The Company is also the subject of inquiries, investigations, and proceedings by regulatory and other governmental agencies. The Company believes it has strong defenses in all significant matters currently pending and is contesting liability and any damages claimed. Nevertheless, some of these matters may result in adverse judgments or awards, including penalties, injunctions or other relief, and the Company may also determine to settle a matter because of the uncertainty and risks of litigation. Described below are certain matters in which there is a reasonable possibility that a material loss could be incurred or where the matter may otherwise be of significant interest to stockholders. Unless otherwise noted, the Company is unable to provide a reasonable estimate of any potential liability given the stage of proceedings in the matter. With respect to all other pending matters, based on current information and consultation with counsel, it does not appear reasonably possible that the outcome of any such matter would be material to the financial condition, operating results or cash flows of the Company. However, predicting the outcome of a litigation or regulatory matter is inherently difficult, requiring significant judgment and evaluation of various factors, including the procedural status of the matter and any recent developments; prior experience and the experience of others in similar cases; available defenses, including potential opportunities to dispose of a case on the merits or procedural grounds before trial (e.g., motions to dismiss or for summary judgment); the progress of fact discovery; the opinions of counsel and experts regarding potential damages; potential opportunities for settlement and the status of any settlement discussions; and potential insurance coverage and indemnification. It may not be possible to reasonably estimate potential liability, if any, or a range of potential liability until the matter is closer to resolution – pending, for example, further proceedings, the outcome of key motions or appeals, or discussions among the parties. Numerous issues may have to be developed, such as discovery of important factual matters and determination of threshold legal issues, which may include novel or unsettled questions of law. Reserves are established or adjusted or further disclosure and estimates of potential loss are provided as the matter progresses and more information becomes available. Total Bond Market Fund Litigation: On August 28, 2008, a class action lawsuit was filed in the U.S. District Court for the Northern District of California on behalf of investors in the Schwab Total Bond Market Fund™. The lawsuit, which alleges violations of state law and federal securities law in connection with the fund’s investment policy, named CSIM, Schwab Investments (registrant and issuer of the fund’s shares) and certain current and former fund trustees as defendants. Allegations include that the fund improperly deviated from its stated investment objectives by investing in collateralized mortgage obligations (CMOs) and investing more than 25% of fund assets in CMOs and mortgage-backed securities without obtaining a shareholder vote. Plaintiff seeks unspecified compensatory and rescission damages, unspecified equitable and injunctive relief, costs and attorneys’ fees. Plaintiff’s federal securities law claim and certain of plaintiff’s state law claims were dismissed. On August 8, 2011, the court dismissed plaintiff’s remaining claims with prejudice. Plaintiff appealed to the Ninth Circuit, which issued a ruling on March 9, 2015 reversing the district court’s dismissal of the case and remanding the case for further proceedings. A petition by defendants for U.S. Supreme Court review was denied on October 6, 2015. In the interim, defendants filed a fourth amended complaint on June 25, 2015. Defendants moved to dismiss and on October 6, 2015, the court dismissed with prejudice plaintiff’s contractual claims, but declined to dismiss certain of the claims for fiduciary breach. On February 23, 2016, the court dismissed plaintiff’s remaining claims with prejudice. Plaintiff has 30 days in which to appeal. Other Regulatory Matters: On April 16, 2012, optionsXpress, Inc. was charged by the SEC in an administrative proceeding alleging violations of the firm’s close-out obligations under Regulation SHO (short sale delivery rules) in connection with certain client trading activity. Following trial, in a decision issued June 7, 2013, the judge held that the firm had violated Regulation SHO and aided and abetted fraudulent trading activity by its client, and ordered the firm and the client to pay

THE CHARLES SCHWAB CORPORATION Notes to Consolidated Financial Statements
(Tabular Amounts in Millions, Except Per Share Data, Option Price Amounts, Ratios, or as Noted)
- 82 -
disgorgement and penalties in an amount which would not be material. The Company continues to dispute the allegations and is appealing the decision. 16. Financial Instruments Subject to Off-Balance Sheet Credit Risk or Concentration Risk Off-Balance Sheet Credit Risk Resale and repurchase agreements: Schwab enters into collateralized resale agreements principally with other broker-dealers, which could result in losses in the event the counterparty fails to purchase the securities held as collateral for the cash advanced and the fair value of the securities declines. To mitigate this risk, Schwab requires that the counterparty deliver securities to a custodian, to be held as collateral, with a fair value in excess of the resale price. Schwab also sets standards for the credit quality of the counterparty, monitors the fair value of the underlying securities as compared to the related receivable, including accrued interest, and requires additional collateral where deemed appropriate. At December 31, 2015 and 2014, the fair value of collateral received in connection with resale agreements that are available to be repledged or sold was $8.2 billion and $10.4 billion, respectively. Schwab utilizes the collateral provided under these resale agreements to meet obligations under broker-dealer client protection rules, which place limitations on its ability to access such segregated securities. For Schwab to repledge or sell this collateral, it would be required to deposit cash and/or securities of an equal amount into its segregated reserve bank accounts in order to meet its segregated cash and investment requirement. The Company’s resale agreements are not subject to master netting arrangements. Securities lending: The Company loans client securities temporarily to other brokers in connection with its securities lending activities and receives cash as collateral for the securities loaned. Increases in security prices may cause the fair value of the securities loaned to exceed the amount of cash received as collateral. In the event the counterparty to these transactions does not return the loaned securities or provide additional cash collateral, the Company may be exposed to the risk of acquiring the securities at prevailing market prices in order to satisfy its client obligations. The Company mitigates this risk by requiring credit approvals for counterparties, monitoring the fair value of securities loaned, and requiring additional cash as collateral when necessary. The fair value of client securities pledged in securities lending transactions to other broker-dealers was $1.9 billion and $1.3 billion at December 31, 2015 and 2014, respectively. The Company has also pledged a portion of its securities owned in connection with securities lending transactions to other broker-dealers. Additionally, the Company borrows securities from other broker-dealers to fulfill short sales by clients and delivers cash to the lender in exchange for the securities. The fair value of these borrowed securities was $72 million and $88 million at December 31, 2015 and 2014, respectively. All of the Company’s securities lending transactions are subject to enforceable master netting arrangements with other broker-dealers. However, the Company does not net securities lending transactions and therefore, the Company’s securities loaned and securities borrowed are presented gross in the consolidated balance sheets.

THE CHARLES SCHWAB CORPORATION Notes to Consolidated Financial Statements
(Tabular Amounts in Millions, Except Per Share Data, Option Price Amounts, Ratios, or as Noted)
- 83 -
The following table presents information about the Company’s resale agreements and securities lending activity to enable the users of the Company’s financial statements to evaluate the potential effect of rights of setoff between these recognized assets and recognized liabilities.
Gross Amounts Not Offset in the Gross Amounts Net Amounts Consolidated Balance Sheet Gross Offset in the Presented in the Assets/ Consolidated Consolidated Counterparty Net Liabilities Balance Sheet Balance Sheet Offsetting Collateral Amount December 31, 2015 Assets:
Resale agreements (1) $ 8,088 $ - $ 8,088 $ - $ (8,088) (2) $ -Securities borrowed (3) 198 - 198 (70) (127) 1
Total $ 8,286 $ - $ 8,286 $ (70) $ (8,215) $ 1 Liabilities:
Securities loaned (4,5) $ 2,233 $ - $ 2,233 $ (70) $ (1,990) $ 173
Total $ 2,233 $ - $ 2,233 $ (70) $ (1,990) $ 173
December 31, 2014 Assets:
Resale agreements (1) $ 10,186 $ - $ 10,186 $ - $ (10,186) (2) $ -Securities borrowed (3) 187 - 187 (69) (117) 1
Total $ 10,373 $ - $ 10,373 $ (69) $ (10,303) $ 1 Liabilities:
Securities loaned (4,5) $ 1,477 $ - $ 1,477 $ (69) $ (1,293) $ 115
Total $ 1,477 $ - $ 1,477 $ (69) $ (1,293) $ 115
(1) Included in cash and investments segregated and on deposit for regulatory purposes in the Company’s consolidated balance sheets.
(2) Actual collateral was greater than or equal to 102% of the related assets. (3) Included in receivables from brokers, dealers, and clearing organizations in the Company’s consolidated balance sheets. (4) Included in payables to brokers, dealers, and clearing organizations in the Company’s consolidated balance sheets. (5) Securities loaned are predominantly comprised of equity securities with overnight and continuous remaining contractual
maturities. Client trade settlement: The Company is obligated to settle transactions with brokers and other financial institutions even if the Company’s clients fail to meet their obligations to the Company. Clients are required to complete their transactions on settlement date, generally three business days after the trade date. If clients do not fulfill their contractual obligations, the Company may incur losses. The Company has established procedures to reduce this risk by requiring deposits from clients in excess of amounts prescribed by regulatory requirements for certain types of trades, and therefore the potential to make payments under these client transactions is remote. Accordingly, no liability has been recognized for these transactions. Margin lending: The Company provides margin loans to its clients which are collateralized by securities in their brokerage accounts and may be liable for the margin requirement of its client margin securities transactions. As clients write options or sell securities short, the Company may incur losses if the clients do not fulfill their obligations and the collateral in client accounts is insufficient to fully cover losses which clients may incur from these strategies. To mitigate this risk, the Company monitors required margin levels and requires clients to deposit additional collateral, or reduce positions to meet minimum collateral requirements. The contractual value of margin loans to clients was $15.8 billion and $14.3 billion at December 31, 2015 and 2014, respectively. Clients with margin loans have agreed to allow the Company to pledge collateralized securities in their brokerage accounts in accordance with federal regulations. Under such regulations, the Company was allowed to pledge securities with a fair value of $22.4 billion and $20.4 billion at December 31, 2015 and 2014, respectively. The fair value of client securities pledged to fulfill the short sales of its clients was $1.3 billion and $1.5 billion at December 31, 2015 and 2014, respectively. The fair

THE CHARLES SCHWAB CORPORATION Notes to Consolidated Financial Statements
(Tabular Amounts in Millions, Except Per Share Data, Option Price Amounts, Ratios, or as Noted)
- 84 -
value of client securities pledged to fulfill the Company’s proprietary short sales, which resulted from facilitating clients’ dividend reinvestment elections, was $303 million and $216 million at December 31, 2015 and 2014, respectively. The Company may also pledge client securities to fulfill client margin requirements for open option contracts established with the Options Clearing Corporation. The fair value of these pledged securities to the Options Clearing Corporation was $1.5 billion and $1.3 billion at December 31, 2015 and 2014, respectively. Financial Guarantees: See “Notes – 15. Commitments and Contingencies.” Concentration Risk The Company has exposure to concentration risk when holding large positions of financial instruments collateralized by assets with similar economic characteristics or in securities of a single issuer or industry. The fair value of the Company’s investments in mortgage-backed securities totaled $72.3 billion at December 31, 2015. Of these, $71.0 billion were issued by U.S. agencies and $1.3 billion were issued by private entities (non-agency securities). The fair value of the Company’s investments in mortgage-backed securities totaled $53.8 billion at December 31, 2014. Of these, $52.5 billion were issued by U.S. agencies and $1.3 billion were non-agency securities. These U.S. agency and non-agency securities are included in securities available for sale and securities held to maturity in the consolidated balance sheets. The fair value of the Company’s investments in corporate debt securities and commercial paper totaled $11.1 billion and $8.1 billion at December 31, 2015 and 2014, respectively, with the majority issued by institutions in the financial services industry. These securities are included in securities available for sale, cash and cash equivalents, and other securities owned. The Company’s bank loans include $7.5 billion and $7.4 billion of adjustable rate First Mortgages at December 31, 2015 and 2014, respectively. At December 31, 2015, approximately 39% of these mortgages consisted of loans with interest-only payment terms. At December 31, 2015, the interest rates on approximately 53% of these interest-only loans are not scheduled to reset for three or more years. For additional detail on concentrations in bank loans, see “Notes – 6. Bank Loans and Related Allowance for Loan Losses.” No single client accounted for more than 10% of the Company’s net revenues in 2015, 2014, or 2013. Substantially all of the Company’s revenues and assets are generated or located in the U.S. The percentage of Schwab’s total client accounts located in California was 23% at December 31, 2015, 2014, and 2013. The Company also has exposure to concentration risk from its margin and securities lending activities collateralized by securities of a single issuer or industry. This concentration risk is mitigated by collateral arrangements that require the fair value of such collateral exceeds the amounts loaned, as described above. 17. Fair Values of Assets and Liabilities For a description of the fair value hierarchy and the Company’s fair value methodologies, including the use of independent third-party pricing services, see “Notes – 2. Summary of Significant Accounting Policies.” The Company did not transfer any assets or liabilities between Level 1, Level 2, or Level 3 during 2015 or 2014. In addition, the Company did not adjust prices received from the primary independent third-party pricing service at December 31, 2015 or 2014.

THE CHARLES SCHWAB CORPORATION Notes to Consolidated Financial Statements
(Tabular Amounts in Millions, Except Per Share Data, Option Price Amounts, Ratios, or as Noted)
- 85 -
Assets and Liabilities Measured at Fair Value on a Recurring Basis The following tables present the fair value hierarchy for assets measured at fair value on a recurring basis. Liabilities recorded at fair value were not material, and therefore are not included in the following tables:
Quoted Prices in Active Markets Significant Significant for Identical Other Observable Unobservable Assets Inputs Inputs Balance at December 31, 2015 (Level 1) (Level 2) (Level 3) Fair Value
Cash equivalents: Money market funds $ 1,968 $ - $ - $ 1,968 Commercial paper - 360 - 360
Total cash equivalents 1,968 360 - 2,328 Investments segregated and on deposit for
regulatory purposes: Certificates of deposit - 3,430 - 3,430 U.S. Government securities - 4,517 - 4,517
Total investments segregated and on deposit for regulatory purposes - 7,947 - 7,947
Other securities owned: Schwab Funds® money market funds 261 - - 261 Equity and bond mutual funds 205 - - 205 State and municipal debt obligations - 50 - 50 Equity, U.S. Government and corporate debt, and
other securities 1 16 - 17 Total other securities owned 467 66 - 533
Securities available for sale: U.S. agency mortgage-backed securities - 22,149 - 22,149 Asset-backed securities - 21,485 - 21,485 Corporate debt securities - 10,747 - 10,747 U.S. Treasury securities - 5,704 - 5,704 U.S. agency notes - 3,150 - 3,150 Certificates of deposit - 1,683 - 1,683 U.S. state and municipal securities - 424 - 424 Non-agency commercial mortgage-backed securities - 299 - 299 Other securities - 5 - 5
Total securities available for sale - 65,646 - 65,646 Total $ 2,435 $ 74,019 $ - $ 76,454

THE CHARLES SCHWAB CORPORATION Notes to Consolidated Financial Statements
(Tabular Amounts in Millions, Except Per Share Data, Option Price Amounts, Ratios, or as Noted)
- 86 -
Quoted Prices in Active Markets Significant Significant for Identical Other Observable Unobservable Assets Inputs Inputs Balance at December 31, 2014 (Level 1) (Level 2) (Level 3) Fair Value
Cash equivalents: Money market funds $ 2,142 $ - $ - $ 2,142 Commercial paper - 32 - 32
Total cash equivalents 2,142 32 - 2,174 Investments segregated and on deposit for
regulatory purposes: Certificates of deposit - 4,125 - 4,125 U.S. Government securities - 2,186 - 2,186
Total investments segregated and on deposit for
regulatory purposes - 6,311 - 6,311 Other securities owned:
Schwab Funds® money market funds 224 - - 224 Equity and bond mutual funds 215 - - 215 State and municipal debt obligations - 51 - 51 Equity, U.S. Government and corporate debt, and
other securities 2 24 - 26 Total other securities owned 441 75 - 516
Securities available for sale: U.S. agency mortgage-backed securities - 18,717 - 18,717 Asset-backed securities - 19,366 - 19,366 Corporate debt securities - 8,045 - 8,045 U.S. Treasury securities - 2,994 - 2,994 U.S. agency notes - 3,795 - 3,795 Certificates of deposit - 1,534 - 1,534 Non-agency commercial mortgage-backed securities - 317 - 317 Other securities - 15 - 15
Total securities available for sale - 54,783 - 54,783 Total $ 2,583 $ 61,201 $ - $ 63,784

THE CHARLES SCHWAB CORPORATION Notes to Consolidated Financial Statements
(Tabular Amounts in Millions, Except Per Share Data, Option Price Amounts, Ratios, or as Noted)
- 87 -
Fair Value of Other Financial Instruments Descriptions of the valuation methodologies and assumptions used to estimate the fair value of other financial instruments are also described in “Notes – 2. Summary of Significant Accounting Policies.” There were no significant changes in these methodologies or assumptions during 2015. The following tables present the fair value hierarchy for other financial instruments:
Quoted Prices in Active Markets Significant Significant for Identical Other Observable Unobservable Carrying Assets Inputs Inputs Balance atDecember 31, 2015 Amount (Level 1) (Level 2) (Level 3) Fair Value
Assets: Cash and cash equivalents $ 9,650 $ - $ 9,650 $ - $ 9,650 Cash and investments segregated and
on deposit for regulatory purposes 11,647 - 11,647 - 11,647 Receivables from brokers, dealers, and
clearing organizations 582 - 582 - 582 Receivables from brokerage clients – net 17,310 - 17,310 - 17,310 Securities held to maturity:
U.S. agency mortgage-backed securities 48,785 - 48,883 - 48,883 Non-agency commercial mortgage-backed
securities 999 - 985 - 985 U.S. Treasury securities 223 - 220 - 220
Total securities held to maturity 50,007 - 50,088 - 50,088 Bank loans: (1)
Residential real estate mortgages 8,334 - 8,347 - 8,347 Home equity loans and lines of credit 2,735 - 2,857 - 2,857 Pledged asset lines 3,232 - 3,232 - 3,232 Other 64 - 64 - 64
Total bank loans 14,365 - 14,500 - 14,500 Other assets 184 - 184 - 184
Total $ 103,745 $ - $ 103,961 $ - $ 103,961
Liabilities: Bank deposits $ 129,502 $ - $ 129,502 $ - $ 129,502 Payables to brokers, dealers, and clearing
organizations 2,588 - 2,588 - 2,588 Payables to brokerage clients 33,185 - 33,185 - 33,185 Accrued expenses and other liabilities 1,115 - 1,115 - 1,115 Long-term debt 2,890 - 2,980 - 2,980
Total $ 169,280 $ - $ 169,370 $ - $ 169,370
(1) The carrying value of bank loans excludes the allowance for loan losses of $31 million at December 31, 2015.

THE CHARLES SCHWAB CORPORATION Notes to Consolidated Financial Statements
(Tabular Amounts in Millions, Except Per Share Data, Option Price Amounts, Ratios, or as Noted)
- 88 -
Quoted Prices in Active Markets Significant Significant for Identical Other Observable Unobservable Carrying Assets Inputs Inputs Balance atDecember 31, 2014 Amount (Level 1) (Level 2) (Level 3) Fair Value
Assets: Cash and cash equivalents $ 9,189 $ - $ 9,189 $ - $ 9,189 Cash and investments segregated and
on deposit for regulatory purposes 14,466 - 14,466 - 14,466 Receivables from brokers, dealers, and
clearing organizations 469 - 469 - 469 Receivables from brokerage clients – net 15,666 - 15,666 - 15,666 Securities held to maturity:
U.S. agency mortgage-backed securities 33,388 - 33,745 - 33,745 Non-agency commercial mortgage-backed
securities 1,001 - 998 - 998 Total securities held to maturity 34,389 - 34,743 - 34,743
Bank loans: (1) Residential real estate mortgages 8,127 - 8,158 - 8,158 Home equity loans and lines of credit 2,955 - 3,026 - 3,026 Pledged asset lines 2,320 - 2,320 - 2,320 Other 39 - 38 - 38
Total bank loans 13,441 - 13,542 - 13,542 Other assets 76 - 76 - 76
Total $ 87,696 $ - $ 88,151 $ - $ 88,151
Liabilities: Bank deposits $ 102,815 $ - $ 102,815 $ - $ 102,815 Payables to brokers, dealers, and clearing
organizations 2,004 - 2,004 - 2,004 Payables to brokerage clients 34,305 - 34,305 - 34,305 Accrued expenses and other liabilities 687 - 687 - 687 Long-term debt 1,899 - 2,010 - 2,010
Total $ 141,710 $ - $ 141,821 $ - $ 141,821
(1) The carrying value of bank loans excludes the allowance for loan losses of $42 million at December 31, 2014. 18. Stockholders’ Equity The Company did not issue any shares of common stock during 2015, 2014, or 2013, respectively. The Company was authorized to issue 9,940,000 shares of preferred stock, $0.01 par value, at December 31, 2015 and 2014. The Company’s preferred stock issued and outstanding is as follows:
December 31, 2015 2014 Shares Shares Issued and Liquidation Issued and Liquidation Outstanding Preference Liquidation Carrying Outstanding Preference Liquidation Carrying (In thousands) Per Share Preference Value (In thousands) Per Share Preference Value
Series A 400 $ 1,000 $ 400 $ 396 400 $ 1,000 $ 400 $ 395 Series B 485 1,000 485 480 485 1,000 485 477 Series C 600 1,000 600 583 - - - -Total Preferred Stock 1,485 $ 1,485 $ 1,459 885 $ 885 $ 872
The Series A Preferred Stock has no stated maturity and has a fixed dividend rate of 7.000% until February 2022 and a floating rate equal to three-month LIBOR plus 4.820% thereafter. During the fixed rate period, dividends, if declared, will be

THE CHARLES SCHWAB CORPORATION Notes to Consolidated Financial Statements
(Tabular Amounts in Millions, Except Per Share Data, Option Price Amounts, Ratios, or as Noted)
- 89 -
payable semi-annually in arrears. During the floating rate period, dividends, if declared, will be payable quarterly in arrears. Dividends are not cumulative. Under the terms of the Series A Preferred Stock, the Company’s ability to pay dividends on, make distributions with respect to, or to repurchase, redeem or acquire its common stock or any preferred stock ranking on parity with or junior to the Series A Preferred Stock, is subject to restrictions in the event that the Company does not declare and either pay or set aside a sum sufficient for payment of dividends on the Series A Preferred Stock for the immediately preceding dividend period. The Series A Preferred Stock is redeemable at the Company’s option, in whole or in part, on any dividend payment date on or after February 1, 2022 or, in whole but not in part, within 90 days following a regulatory capital treatment event as defined in its Certificate of Designations. The Series B Preferred Stock has no stated maturity and has a fixed dividend rate of 6.00%. Dividends, if declared, will be payable quarterly in arrears. Dividends are not cumulative. Under the terms of the Series B Preferred Stock, the Company’s ability to pay dividends on, make distributions with respect to, or to repurchase, redeem or acquire its common stock or any preferred stock ranking on parity with or junior to the Series B Preferred Stock, is subject to restrictions in the event that the Company does not declare and either pay or set aside a sum sufficient for payment of dividends on the Series B Preferred Stock for the immediately preceding dividend period. The Series B Preferred Stock is redeemable at the Company’s option, in whole or in part, on any dividend payment date on or after September 1, 2017 or, in whole but not in part, within 90 days following a regulatory capital treatment event as defined in its Certificate of Designations. On August 3, 2015, the Company issued and sold 24 million depositary shares, each representing a 1/40th ownership interest in a share of 6.00% non-cumulative perpetual preferred stock, Series C, $0.01 par value, with a liquidation preference of $1,000 per share (equivalent to $25 per depositary share). The Series C Preferred Stock has no stated maturity and a fixed dividend rate of 6.00%. Dividends, if declared, will be payable quarterly in arrears. Dividends are not cumulative. Under the terms of the Series C Preferred Stock, the Company’s ability to pay dividends on, make distributions with respect to, or to repurchase, redeem or acquire its common stock or any preferred stock ranking on parity with or junior to the Series C Preferred Stock, is subject to restrictions in the event that the Company does not declare and either pay or set aside a sum sufficient for payment of dividends on the Series C Preferred Stock for the immediately preceding dividend period. The Series C Preferred Stock is redeemable at the Company’s option, in whole or in part, on any dividend payment date on or after December 1, 2020 or, in whole but not in part, within 90 days following a regulatory capital treatment event as defined in its Certificate of Designations. 19. Accumulated Other Comprehensive Income Accumulated other comprehensive income represents cumulative gains and losses that are not reflected in earnings. The components of other comprehensive income (loss) are as follows:
Year Ended December 31, 2015 2014 2013 Before Tax Net of Before Tax Net of Before Tax Net of tax effect tax tax effect tax tax effect tax
Change in net unrealized gain on securities available for sale: Net unrealized gain (loss) $ (477) $ 178 $ (299) $ 255 $ (95) $ 160 $ (468) $ 176 $ (292)Reclassification of impairment charges
included in net impairment losses on securities - - - 1 (1) - 10 (4) 6
Other reclassifications included in other revenue - - - (7) 3 (4) (7) 3 (4)
Change in net unrealized gain on securities available for sale (477) 178 (299) 249 (93) 156 (465) 175 (290)
Other - - - - - - 1 - 1 Other comprehensive income (loss) $ (477) $ 178 $ (299) $ 249 $ (93) $ 156 $ (464) $ 175 $ (289)

THE CHARLES SCHWAB CORPORATION Notes to Consolidated Financial Statements
(Tabular Amounts in Millions, Except Per Share Data, Option Price Amounts, Ratios, or as Noted)
- 90 -
Accumulated other comprehensive income balances are as follows:
Net unrealized Total gain/(loss) on securities accumulated other available for sale Other comprehensive income
Balance at December 31, 2012 $ 299 $ (1) $ 298 Other net changes (290) 1 (289)
Balance at December 31, 2013 $ 9 $ - $ 9 Other net changes 156 - 156
Balance at December 31, 2014 $ 165 $ - $ 165 Other net changes (299) - (299)
Balance at December 31, 2015 $ (134) $ - $ (134) 20. Employee Incentive, Retirement, and Deferred Compensation Plans The Company’s stock incentive plans provide for granting options, restricted stock units, and restricted stock awards to employees, officers, and directors. In addition, the Company offers retirement and employee stock purchase plans to eligible employees and sponsors deferred compensation plans for eligible officers and non-employee directors. A summary of the Company’s stock-based compensation and related income tax benefit is as follows:
Year Ended December 31, 2015 2014 2013
Stock option expense $ 46 $ 44 $ 52 Restricted stock unit expense 83 66 60 Employee stock purchase plan expense 6 5 4
Total stock-based compensation expense $ 135 $ 115 $ 116
Income tax benefit on stock-based compensation $ (51) $ (43) $ (43) The Company issues shares for stock options and restricted stock awards from treasury stock. At December 31, 2015, the Company was authorized to grant up to 57 million common shares under its existing stock incentive plans. Additionally, at December 31, 2015, the Company had 40 million shares reserved for future issuance under its employee stock purchase plan. As of December 31, 2015, there was $201 million of total unrecognized compensation cost, net of forfeitures, related to outstanding stock options, restricted stock awards, and restricted stock units, which is expected to be recognized through 2019 with a remaining weighted-average service period of 2.8 years. Stock Option Plan Options are granted for the purchase of shares of common stock at an exercise price not less than market value on the date of grant, and expire within seven or ten years from the date of grant. Options generally vest annually over a three- to five-year period from the date of grant. Certain options were granted at an exercise price above the market value of common stock on the date of grant (i.e., premium-priced options).
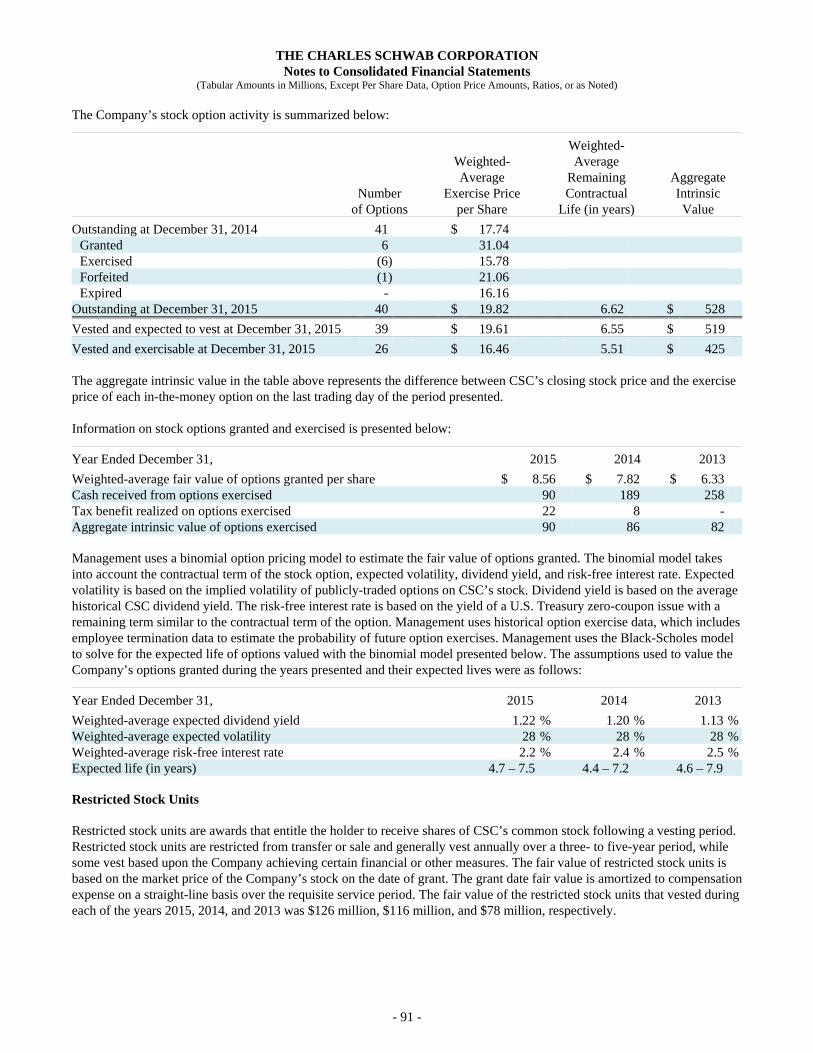
THE CHARLES SCHWAB CORPORATION Notes to Consolidated Financial Statements
(Tabular Amounts in Millions, Except Per Share Data, Option Price Amounts, Ratios, or as Noted)
- 91 -
The Company’s stock option activity is summarized below:
Weighted-
Weighted- Average
Average Remaining Aggregate
Number Exercise Price Contractual Intrinsic
of Options per Share Life (in years) Value
Outstanding at December 31, 2014 41 $ 17.74
Granted 6 31.04
Exercised (6) 15.78
Forfeited (1) 21.06
Expired - 16.16
Outstanding at December 31, 2015 40 $ 19.82 6.62 $ 528
Vested and expected to vest at December 31, 2015 39 $ 19.61 6.55 $ 519
Vested and exercisable at December 31, 2015 26 $ 16.46 5.51 $ 425
The aggregate intrinsic value in the table above represents the difference between CSC’s closing stock price and the exercise price of each in-the-money option on the last trading day of the period presented. Information on stock options granted and exercised is presented below:
Year Ended December 31, 2015 2014 2013
Weighted-average fair value of options granted per share $ 8.56 $ 7.82 $ 6.33 Cash received from options exercised 90 189 258 Tax benefit realized on options exercised 22 8 - Aggregate intrinsic value of options exercised 90 86 82 Management uses a binomial option pricing model to estimate the fair value of options granted. The binomial model takes into account the contractual term of the stock option, expected volatility, dividend yield, and risk-free interest rate. Expected volatility is based on the implied volatility of publicly-traded options on CSC’s stock. Dividend yield is based on the average historical CSC dividend yield. The risk-free interest rate is based on the yield of a U.S. Treasury zero-coupon issue with a remaining term similar to the contractual term of the option. Management uses historical option exercise data, which includes employee termination data to estimate the probability of future option exercises. Management uses the Black-Scholes model to solve for the expected life of options valued with the binomial model presented below. The assumptions used to value the Company’s options granted during the years presented and their expected lives were as follows:
Year Ended December 31, 2015 2014 2013
Weighted-average expected dividend yield 1.22 % 1.20 % 1.13 % Weighted-average expected volatility 28 % 28 % 28 % Weighted-average risk-free interest rate 2.2 % 2.4 % 2.5 % Expected life (in years) 4.7 – 7.5 4.4 – 7.2 4.6 – 7.9 Restricted Stock Units Restricted stock units are awards that entitle the holder to receive shares of CSC’s common stock following a vesting period. Restricted stock units are restricted from transfer or sale and generally vest annually over a three- to five-year period, while some vest based upon the Company achieving certain financial or other measures. The fair value of restricted stock units is based on the market price of the Company’s stock on the date of grant. The grant date fair value is amortized to compensation expense on a straight-line basis over the requisite service period. The fair value of the restricted stock units that vested during each of the years 2015, 2014, and 2013 was $126 million, $116 million, and $78 million, respectively.

THE CHARLES SCHWAB CORPORATION Notes to Consolidated Financial Statements
(Tabular Amounts in Millions, Except Per Share Data, Option Price Amounts, Ratios, or as Noted)
- 92 -
The Company’s restricted stock units activity is summarized below:
Weighted- Average Grant Number Date Fair Value of Units per Unit
Outstanding at December 31, 2014 10 $ 20.66 Granted 3 30.84 Vested (4) 17.95 Forfeited (1) 21.25
Outstanding at December 31, 2015 8 $ 25.84 Retirement Plan Employees of the Company can participate in the Company’s qualified retirement plan, the SchwabPlan® Retirement Savings and Investment Plan. The Company may match certain employee contributions or make additional contributions to this plan at its discretion. The Company’s total expense was $78 million, $68 million, and $63 million in 2015, 2014, and 2013, respectively. Deferred Compensation Plans The Company’s deferred compensation plan for officers permits participants to defer the receipt of certain cash compensation. The Company’s deferred compensation plan for non-employee directors permits participants to defer receipt of all or a portion of their director fees and to receive either a grant of stock options, or upon ceasing to serve as a director, the number of shares of CSC’s common stock that would have resulted from investing the deferred fee amount into CSC’s common stock. The deferred compensation liability was $129 million and $132 million at December 31, 2015 and 2014, respectively. 21. Taxes on Income The components of income tax expense are as follows:
Year Ended December 31, 2015 2014 2013
Current: Federal $ 740 $ 747 $ 598 State 99 72 57
Total current 839 819 655
Deferred: Federal (6) (23) (20) State (1) (2) (1)
Total deferred (7) (25) (21) Taxes on income $ 832 $ 794 $ 634
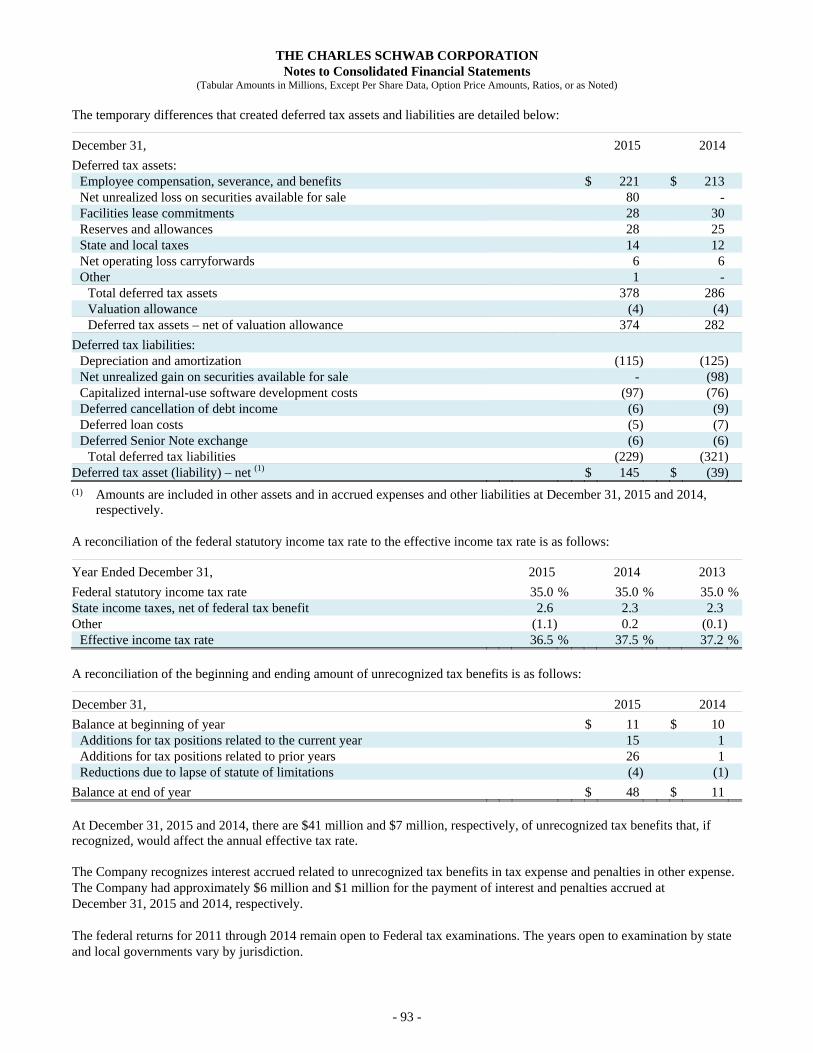
THE CHARLES SCHWAB CORPORATION Notes to Consolidated Financial Statements
(Tabular Amounts in Millions, Except Per Share Data, Option Price Amounts, Ratios, or as Noted)
- 93 -
The temporary differences that created deferred tax assets and liabilities are detailed below:
December 31, 2015 2014
Deferred tax assets: Employee compensation, severance, and benefits $ 221 $ 213Net unrealized loss on securities available for sale 80 -Facilities lease commitments 28 30Reserves and allowances 28 25State and local taxes 14 12Net operating loss carryforwards 6 6Other 1 -
Total deferred tax assets 378 286Valuation allowance (4) (4)Deferred tax assets – net of valuation allowance 374 282
Deferred tax liabilities: Depreciation and amortization (115) (125)Net unrealized gain on securities available for sale - (98)Capitalized internal-use software development costs (97) (76)Deferred cancellation of debt income (6) (9)Deferred loan costs (5) (7)Deferred Senior Note exchange (6) (6)
Total deferred tax liabilities (229) (321)Deferred tax asset (liability) – net (1) $ 145 $ (39)
(1) Amounts are included in other assets and in accrued expenses and other liabilities at December 31, 2015 and 2014, respectively.
A reconciliation of the federal statutory income tax rate to the effective income tax rate is as follows:
Year Ended December 31, 2015 2014 2013
Federal statutory income tax rate 35.0 % 35.0 % 35.0 % State income taxes, net of federal tax benefit 2.6 2.3 2.3 Other (1.1) 0.2 (0.1)
Effective income tax rate 36.5 % 37.5 % 37.2 % A reconciliation of the beginning and ending amount of unrecognized tax benefits is as follows:
December 31, 2015 2014
Balance at beginning of year $ 11 $ 10Additions for tax positions related to the current year 15 1Additions for tax positions related to prior years 26 1Reductions due to lapse of statute of limitations (4) (1)
Balance at end of year $ 48 $ 11 At December 31, 2015 and 2014, there are $41 million and $7 million, respectively, of unrecognized tax benefits that, if recognized, would affect the annual effective tax rate. The Company recognizes interest accrued related to unrecognized tax benefits in tax expense and penalties in other expense. The Company had approximately $6 million and $1 million for the payment of interest and penalties accrued at December 31, 2015 and 2014, respectively. The federal returns for 2011 through 2014 remain open to Federal tax examinations. The years open to examination by state and local governments vary by jurisdiction.
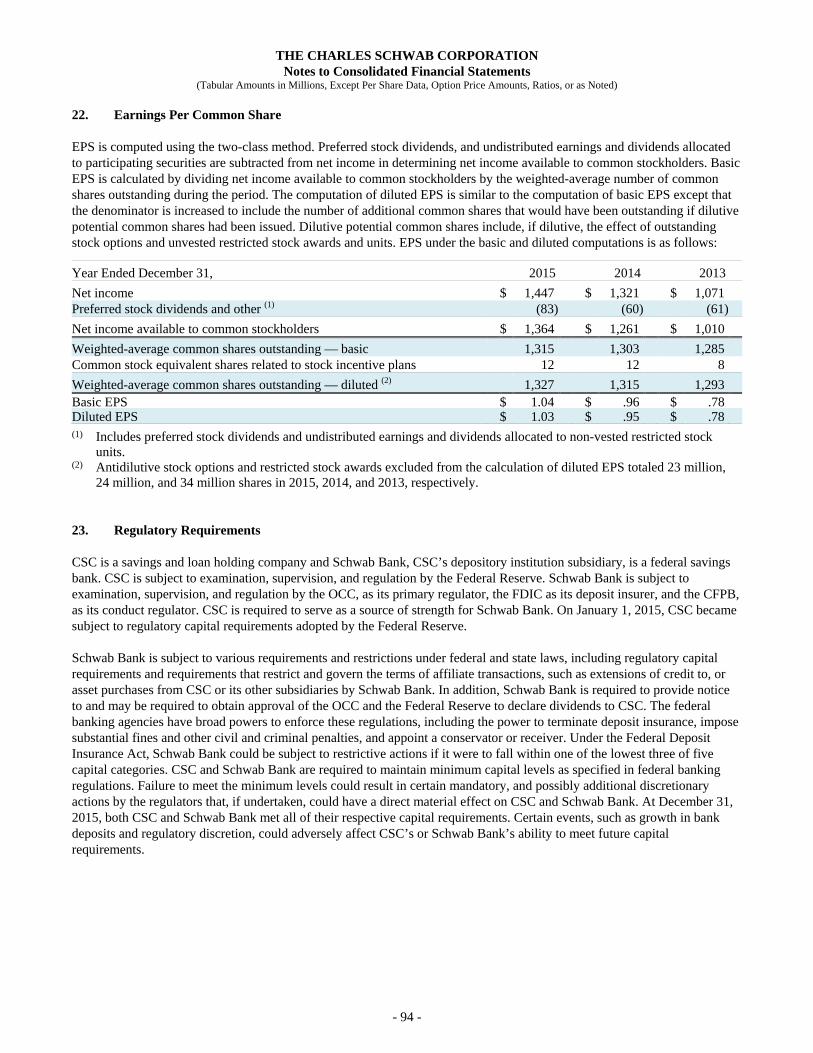
THE CHARLES SCHWAB CORPORATION Notes to Consolidated Financial Statements
(Tabular Amounts in Millions, Except Per Share Data, Option Price Amounts, Ratios, or as Noted)
- 94 -
22. Earnings Per Common Share EPS is computed using the two-class method. Preferred stock dividends, and undistributed earnings and dividends allocated to participating securities are subtracted from net income in determining net income available to common stockholders. Basic EPS is calculated by dividing net income available to common stockholders by the weighted-average number of common shares outstanding during the period. The computation of diluted EPS is similar to the computation of basic EPS except that the denominator is increased to include the number of additional common shares that would have been outstanding if dilutive potential common shares had been issued. Dilutive potential common shares include, if dilutive, the effect of outstanding stock options and unvested restricted stock awards and units. EPS under the basic and diluted computations is as follows:
Year Ended December 31, 2015 2014 2013
Net income $ 1,447 $ 1,321 $ 1,071Preferred stock dividends and other (1) (83) (60) (61)
Net income available to common stockholders $ 1,364 $ 1,261 $ 1,010
Weighted-average common shares outstanding — basic 1,315 1,303 1,285Common stock equivalent shares related to stock incentive plans 12 12 8
Weighted-average common shares outstanding — diluted (2) 1,327 1,315 1,293Basic EPS $ 1.04 $ .96 $ .78Diluted EPS $ 1.03 $ .95 $ .78
(1) Includes preferred stock dividends and undistributed earnings and dividends allocated to non-vested restricted stock units.
(2) Antidilutive stock options and restricted stock awards excluded from the calculation of diluted EPS totaled 23 million, 24 million, and 34 million shares in 2015, 2014, and 2013, respectively.
23. Regulatory Requirements CSC is a savings and loan holding company and Schwab Bank, CSC’s depository institution subsidiary, is a federal savings bank. CSC is subject to examination, supervision, and regulation by the Federal Reserve. Schwab Bank is subject to examination, supervision, and regulation by the OCC, as its primary regulator, the FDIC as its deposit insurer, and the CFPB, as its conduct regulator. CSC is required to serve as a source of strength for Schwab Bank. On January 1, 2015, CSC became subject to regulatory capital requirements adopted by the Federal Reserve. Schwab Bank is subject to various requirements and restrictions under federal and state laws, including regulatory capital requirements and requirements that restrict and govern the terms of affiliate transactions, such as extensions of credit to, or asset purchases from CSC or its other subsidiaries by Schwab Bank. In addition, Schwab Bank is required to provide notice to and may be required to obtain approval of the OCC and the Federal Reserve to declare dividends to CSC. The federal banking agencies have broad powers to enforce these regulations, including the power to terminate deposit insurance, impose substantial fines and other civil and criminal penalties, and appoint a conservator or receiver. Under the Federal Deposit Insurance Act, Schwab Bank could be subject to restrictive actions if it were to fall within one of the lowest three of five capital categories. CSC and Schwab Bank are required to maintain minimum capital levels as specified in federal banking regulations. Failure to meet the minimum levels could result in certain mandatory, and possibly additional discretionary actions by the regulators that, if undertaken, could have a direct material effect on CSC and Schwab Bank. At December 31, 2015, both CSC and Schwab Bank met all of their respective capital requirements. Certain events, such as growth in bank deposits and regulatory discretion, could adversely affect CSC’s or Schwab Bank’s ability to meet future capital requirements.
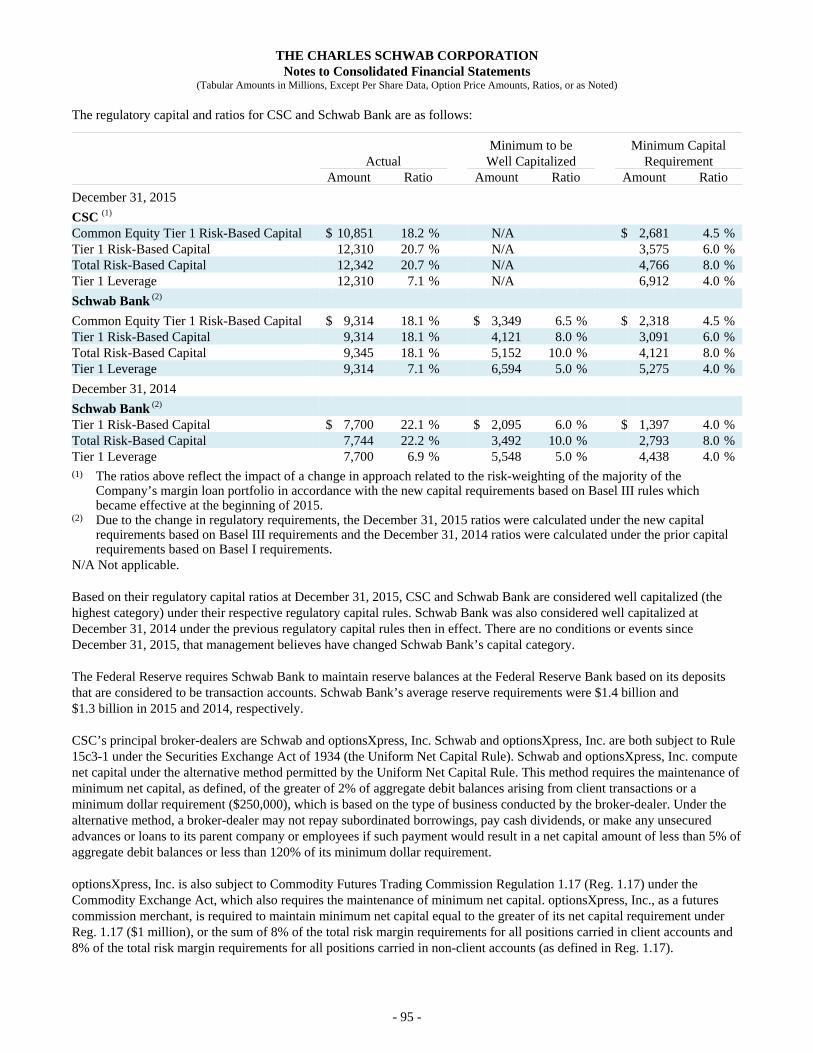
THE CHARLES SCHWAB CORPORATION Notes to Consolidated Financial Statements
(Tabular Amounts in Millions, Except Per Share Data, Option Price Amounts, Ratios, or as Noted)
- 95 -
The regulatory capital and ratios for CSC and Schwab Bank are as follows:
Minimum to be Minimum Capital Actual Well Capitalized Requirement Amount Ratio Amount Ratio Amount Ratio
December 31, 2015
CSC (1) Common Equity Tier 1 Risk-Based Capital $ 10,851 18.2 % N/A $ 2,681 4.5 % Tier 1 Risk-Based Capital 12,310 20.7 % N/A 3,575 6.0 % Total Risk-Based Capital 12,342 20.7 % N/A 4,766 8.0 % Tier 1 Leverage 12,310 7.1 % N/A 6,912 4.0 %
Schwab Bank (2)
Common Equity Tier 1 Risk-Based Capital $ 9,314 18.1 % $ 3,349 6.5 % $ 2,318 4.5 % Tier 1 Risk-Based Capital 9,314 18.1 % 4,121 8.0 % 3,091 6.0 % Total Risk-Based Capital 9,345 18.1 % 5,152 10.0 % 4,121 8.0 % Tier 1 Leverage 9,314 7.1 % 6,594 5.0 % 5,275 4.0 %
December 31, 2014
Schwab Bank (2) Tier 1 Risk-Based Capital $ 7,700 22.1 % $ 2,095 6.0 % $ 1,397 4.0 % Total Risk-Based Capital 7,744 22.2 % 3,492 10.0 % 2,793 8.0 % Tier 1 Leverage 7,700 6.9 % 5,548 5.0 % 4,438 4.0 %
(1) The ratios above reflect the impact of a change in approach related to the risk-weighting of the majority of the Company’s margin loan portfolio in accordance with the new capital requirements based on Basel III rules which became effective at the beginning of 2015.
(2) Due to the change in regulatory requirements, the December 31, 2015 ratios were calculated under the new capital requirements based on Basel III requirements and the December 31, 2014 ratios were calculated under the prior capital requirements based on Basel I requirements.
N/A Not applicable. Based on their regulatory capital ratios at December 31, 2015, CSC and Schwab Bank are considered well capitalized (the highest category) under their respective regulatory capital rules. Schwab Bank was also considered well capitalized at December 31, 2014 under the previous regulatory capital rules then in effect. There are no conditions or events since December 31, 2015, that management believes have changed Schwab Bank’s capital category. The Federal Reserve requires Schwab Bank to maintain reserve balances at the Federal Reserve Bank based on its deposits that are considered to be transaction accounts. Schwab Bank’s average reserve requirements were $1.4 billion and $1.3 billion in 2015 and 2014, respectively. CSC’s principal broker-dealers are Schwab and optionsXpress, Inc. Schwab and optionsXpress, Inc. are both subject to Rule 15c3-1 under the Securities Exchange Act of 1934 (the Uniform Net Capital Rule). Schwab and optionsXpress, Inc. compute net capital under the alternative method permitted by the Uniform Net Capital Rule. This method requires the maintenance of minimum net capital, as defined, of the greater of 2% of aggregate debit balances arising from client transactions or a minimum dollar requirement ($250,000), which is based on the type of business conducted by the broker-dealer. Under the alternative method, a broker-dealer may not repay subordinated borrowings, pay cash dividends, or make any unsecured advances or loans to its parent company or employees if such payment would result in a net capital amount of less than 5% of aggregate debit balances or less than 120% of its minimum dollar requirement. optionsXpress, Inc. is also subject to Commodity Futures Trading Commission Regulation 1.17 (Reg. 1.17) under the Commodity Exchange Act, which also requires the maintenance of minimum net capital. optionsXpress, Inc., as a futures commission merchant, is required to maintain minimum net capital equal to the greater of its net capital requirement under Reg. 1.17 ($1 million), or the sum of 8% of the total risk margin requirements for all positions carried in client accounts and 8% of the total risk margin requirements for all positions carried in non-client accounts (as defined in Reg. 1.17).

THE CHARLES SCHWAB CORPORATION Notes to Consolidated Financial Statements
(Tabular Amounts in Millions, Except Per Share Data, Option Price Amounts, Ratios, or as Noted)
- 96 -
Net capital and net capital requirements for Schwab and optionsXpress, Inc. are as follows:
Net Capital Minimum 2% of in Excess of Net Capital Aggregate RequiredDecember 31, 2015 Net Capital Required Debit Balances Net CapitalSchwab $ 1,746 $ 0.250 $ 358 $ 1,388optionsXpress, Inc. 244 1 7 237
December 31, 2014
Schwab $ 1,550 $ 0.250 $ 324 $ 1,226optionsXpress, Inc. 123 1 6 117 Schwab and optionsXpress, Inc. are also subject to Rule 15c3-3 under the Securities Exchange Act of 1934 and other applicable regulations, which require them to maintain cash or qualified securities in a segregated reserve account for the exclusive benefit of clients. In accordance with Rule 15c3-3, Schwab and optionsXpress, Inc. had portions of their cash and investments segregated for the exclusive benefit of clients at December 31, 2015. Amounts included in cash and investments segregated and on deposit for regulatory purposes represent actual balances on deposit, whereas cash and investments required to be segregated and on deposit for regulatory purposes at December 31, 2015 for Schwab and optionsXpress, Inc. totaled $20.5 billion. On January 5, 2016, Schwab and optionsXpress, Inc. deposited a net amount of $1.4 billion of cash into their segregated reserve bank accounts. Cash and investments required to be segregated and on deposit for regulatory purposes at December 31, 2014 for Schwab and optionsXpress, Inc. totaled $21.9 billion. On January 5, 2015, Schwab and optionsXpress, Inc. deposited a net amount of $1.7 billion of cash into their segregated reserve bank accounts. 24. Segment Information The Company’s two reportable segments are Investor Services and Advisor Services. The Company structures its operating segments according to its clients and the services provided to those clients. The Investor Services segment provides retail brokerage and banking services, retirement plan services, and other corporate brokerage services. The Advisor Services segment provides custodial, trading, and support services as well as retirement business services. Revenues and expenses are allocated to the Company’s two segments based on which segment services the client. The accounting policies of the segments are the same as those described in “Notes – 2. Summary of Significant Accounting Policies.” For the computation of its segment information, the Company utilizes an activity-based costing model to allocate traditional income statement line item expenses (e.g., compensation and benefits, depreciation and amortization, and professional services) to the business activities driving segment expenses (e.g., client service, opening new accounts, or business development) and a funds transfer pricing methodology to allocate certain revenues. The Company evaluates the performance of its segments on a pre-tax basis, excluding significant non-recurring items and results of discontinued operations. Segment assets and liabilities are not used for evaluating segment performance or in deciding how to allocate resources to segments. However, capital expenditures are used in resource allocation and are therefore disclosed. There are no revenues from transactions between the segments. Capital expenditures are reported gross, and are not net of proceeds from the sale of fixed assets.

THE CHARLES SCHWAB CORPORATION Notes to Consolidated Financial Statements
(Tabular Amounts in Millions, Except Per Share Data, Option Price Amounts, Ratios, or as Noted)
- 97 -
Financial information for the Company’s reportable segments is presented in the following table:
Investor Services (1) Advisor Services (1) Unallocated Total
Year Ended December 31, 2015 2014 2013 2015 2014 2013 2015 2014 2013 2015 2014 2013
Net Revenues:
Asset management and
administration fees $ 1,837 $ 1,742 $ 1,593 $ 813 $ 791 $ 723 $ - $ - $ (1) $ 2,650 $ 2,533 $ 2,315
Net interest revenue 2,133 2,028 1,755 392 244 225 - - - 2,525 2,272 1,980
Trading revenue 556 606 609 310 301 304 - - - 866 907 913
Other (2) 234 218 176 94 74 59 - 51 1 328 343 236
Provision for loan losses 11 4 1 - - - - - - 11 4 1
Net impairment losses
on securities - (1) (9) - - (1) - - - - (1) (10)
Total net revenues 4,771 4,597 4,125 1,609 1,410 1,310 - 51 - 6,380 6,058 5,435
Expenses Excluding Interest (3) 3,090 2,937 2,858 1,011 938 872 - 68 - 4,101 3,943 3,730
Income before taxes on income $ 1,681 $ 1,660 $ 1,267 $ 598 $ 472 $ 438 $ - $ (17) $ - $ 2,279 $ 2,115 $ 1,705
Capital expenditures $ 195 $ 271 $ 188 $ 90 $ 134 $ 82 $ - $ - $ - $ 285 $ 405 $ 270
Depreciation and amortization $ 171 $ 154 $ 157 $ 53 $ 45 $ 45 $ - $ - $ - $ 224 $ 199 $ 202
(1) During 2015, the Corporate Brokerage Retirement Services business was transferred from the Investor Services segment to the Advisor Services segment. All prior period amounts have been recast to conform with the current year presentation.
(2) Unallocated amount includes a net insurance settlement of $45 million in 2014. (3) Unallocated amount includes a charge of $68 million for estimated future severance benefits resulting from changes in the Company’s geographic footprint in 2014.
25. The Charles Schwab Corporation – Parent Company Only Financial Statements Condensed Statements of Income
Year Ended December 31, 2015 2014 2013
Interest revenue $ 12 $ 2 $ 4 Interest expense (86) (64) (65)
Net interest expense (74) (62) (61) Other 4 1 - Expenses excluding interest (27) (24) (28) Loss before income tax benefit and equity in net income of subsidiaries (97) (85) (89) Income tax benefit 41 32 38 Loss before equity in net income of subsidiaries (56) (53) (51) Equity in net income of subsidiaries:
Equity in undistributed net income of subsidiaries 1,287 1,157 830 Dividends from bank subsidiary - 45 163 Dividends from non-bank subsidiaries 216 172 129
Net Income 1,447 1,321 1,071 Preferred stock dividends and other (1) 83 60 61 Net Income Available to Common Stockholders $ 1,364 $ 1,261 $ 1,010
(1) Includes preferred stock dividends and undistributed earnings and dividends allocated to non-vested restricted stock units.

THE CHARLES SCHWAB CORPORATION Notes to Consolidated Financial Statements
(Tabular Amounts in Millions, Except Per Share Data, Option Price Amounts, Ratios, or as Noted)
- 98 -
Condensed Balance Sheets
December 31, 2015 2014
Assets Cash and cash equivalents $ 1,007 $ 1,043 Receivables from subsidiaries 419 360 Securities available for sale 569 - Securities held to maturity 223 - Other securities owned – at fair value 65 74 Loans to non-bank subsidiaries 468 327 Investment in non-bank subsidiaries 4,374 4,083 Investment in bank subsidiary 9,191 7,883 Other assets 101 68
Total assets $ 16,417 $ 13,838
Liabilities and Stockholders’ Equity Accrued expenses and other liabilities $ 189 $ 185 Payables to subsidiaries 11 34 Long-term debt 2,815 1,816 Total liabilities 3,015 2,035 Stockholders’ equity 13,402 11,803
Total liabilities and stockholders’ equity $ 16,417 $ 13,838
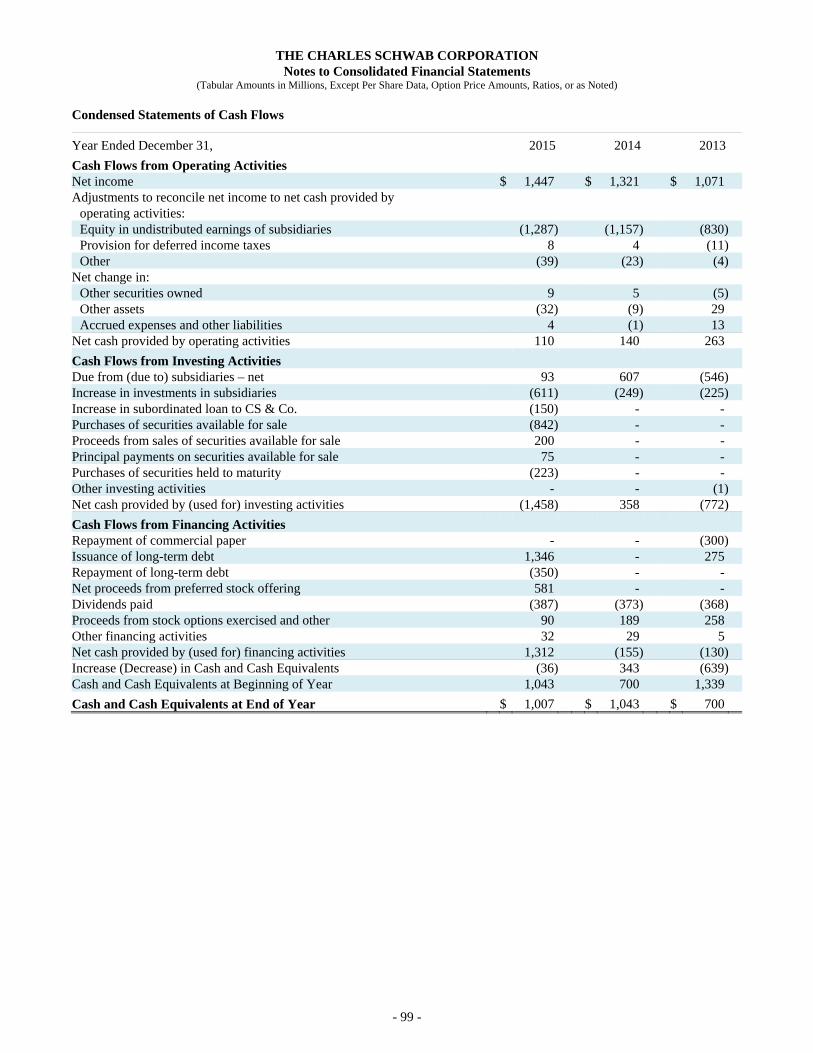
THE CHARLES SCHWAB CORPORATION Notes to Consolidated Financial Statements
(Tabular Amounts in Millions, Except Per Share Data, Option Price Amounts, Ratios, or as Noted)
- 99 -
Condensed Statements of Cash Flows
Year Ended December 31, 2015 2014 2013
Cash Flows from Operating Activities Net income $ 1,447 $ 1,321 $ 1,071 Adjustments to reconcile net income to net cash provided by
operating activities: Equity in undistributed earnings of subsidiaries (1,287) (1,157) (830) Provision for deferred income taxes 8 4 (11) Other (39) (23) (4)
Net change in: Other securities owned 9 5 (5) Other assets (32) (9) 29 Accrued expenses and other liabilities 4 (1) 13
Net cash provided by operating activities 110 140 263
Cash Flows from Investing Activities Due from (due to) subsidiaries – net 93 607 (546) Increase in investments in subsidiaries (611) (249) (225) Increase in subordinated loan to CS & Co. (150) - - Purchases of securities available for sale (842) - - Proceeds from sales of securities available for sale 200 - - Principal payments on securities available for sale 75 - - Purchases of securities held to maturity (223) - - Other investing activities - - (1) Net cash provided by (used for) investing activities (1,458) 358 (772)
Cash Flows from Financing Activities Repayment of commercial paper - - (300) Issuance of long-term debt 1,346 - 275 Repayment of long-term debt (350) - - Net proceeds from preferred stock offering 581 - - Dividends paid (387) (373) (368) Proceeds from stock options exercised and other 90 189 258 Other financing activities 32 29 5 Net cash provided by (used for) financing activities 1,312 (155) (130) Increase (Decrease) in Cash and Cash Equivalents (36) 343 (639) Cash and Cash Equivalents at Beginning of Year 1,043 700 1,339
Cash and Cash Equivalents at End of Year $ 1,007 $ 1,043 $ 700

THE CHARLES SCHWAB CORPORATION Notes to Consolidated Financial Statements
(Tabular Amounts in Millions, Except Per Share Data, Option Price Amounts, Ratios, or as Noted)
- 100 -
26. Quarterly Financial Information (Unaudited)
Fourth Third Second First Quarter Quarter Quarter Quarter
Year Ended December 31, 2015: Net Revenues $ 1,691 $ 1,597 $ 1,566 $ 1,526 Expenses Excluding Interest $ 1,046 $ 1,014 $ 999 $ 1,042 Net Income $ 416 $ 376 $ 353 $ 302 Net Income Available to Common Stockholders $ 378 $ 365 $ 330 $ 291 Weighted-Average Common Shares Outstanding – Basic 1,319 1,316 1,314 1,312Weighted-Average Common Shares Outstanding – Diluted 1,330 1,328 1,326 1,323 Basic Earnings Per Common Share $ .29 $ .28 $ .25 $ .22Diluted Earnings Per Common Share $ .28 $ .28 $ .25 $ .22Dividends Declared Per Common Share $ .06 $ .06 $ .06 $ .06Range of Common Stock Price Per Share:
High $ 34.52 $ 35.72 $ 33.78 $ 31.73 Low $ 26.40 $ 27.10 $ 29.12 $ 25.43
Range of Price/Earnings Ratio (1): High 34 36 35 34 Low 26 27 30 27
Year Ended December 31, 2014: Net Revenues $ 1,551 $ 1,551 $ 1,478 $ 1,478 Expenses Excluding Interest $ 997 $ 1,033 $ 957 $ 956 Net Income $ 350 $ 321 $ 324 $ 326 Net Income Available to Common Stockholders $ 329 $ 312 $ 302 $ 318 Weighted-Average Common Shares Outstanding – Basic 1,309 1,304 1,302 1,299Weighted-Average Common Shares Outstanding – Diluted 1,320 1,316 1,313 1,311 Basic Earnings Per Common Share $ .25 $ .24 $ .23 $ .24Diluted Earnings Per Common Share $ .25 $ .24 $ .23 $ .24Dividends Declared Per Common Share $ .06 $ .06 $ .06 $ .06Range of Common Stock Price Per Share:
High $ 30.89 $ 31.00 $ 28.04 $ 29.13 Low $ 23.35 $ 26.44 $ 24.56 $ 23.56
Range of Price/Earnings Ratio (1): High 32 33 30 33 Low 24 28 27 27
(1) Price/earnings ratio is computed by dividing the high and low market prices by diluted earnings per common share for the preceding 12-month period ending on the last day of the quarter presented.

- 101 -
REPORT OF INDEPENDENT REGISTERED PUBLIC ACCOUNING FIRM To the Board of Directors and Stockholders of The Charles Schwab Corporation San Francisco, California We have audited the accompanying consolidated balance sheets of The Charles Schwab Corporation and subsidiaries (the “Company”) as of December 31, 2015 and 2014, and the related consolidated statements of income, comprehensive income, stockholders’ equity, and cash flows for each of the three years in the period ended December 31, 2015. Our audits also included the financial statement schedule of the Company on page F-2. We also have audited the Company’s internal control over financial reporting as of December 31, 2015, based on the criteria established in Internal Control – Integrated Framework (2013) issued by the Committee of Sponsoring Organizations of the Treadway Commission. The Company’s management is responsible for these financial statements and financial statement schedule, for maintaining effective internal control over financial reporting, and for its assessment of the effectiveness of internal control over financial reporting, included in the accompanying Management’s Report on Internal Control over Financial Reporting. Our responsibility is to express an opinion on the financial statements and financial statement schedule and an opinion on the Company’s internal control over financial reporting based on our audits. We conducted our audits in accordance with the standards of the Public Company Accounting Oversight Board (United States). Those standards require that we plan and perform the audit to obtain reasonable assurance about whether the financial statements are free of material misstatement and whether effective internal control over financial reporting was maintained in all material respects. Our audits of the financial statements included examining, on a test basis, evidence supporting the amounts and disclosures in the financial statements, assessing the accounting principles used and significant estimates made by management, and evaluating the overall financial statement presentation. Our audit of internal control over financial reporting included obtaining an understanding of internal control over financial reporting, assessing the risk that a material weakness exists, and testing and evaluating the design and operating effectiveness of internal control based on the assessed risk. Our audits also included performing such other procedures as we considered necessary in the circumstances. We believe that our audits provide a reasonable basis for our opinions. A company’s internal control over financial reporting is a process designed by, or under the supervision of, the company’s principal executive and principal financial officers, or persons performing similar functions, and effected by the company’s board of directors, management, and other personnel to provide reasonable assurance regarding the reliability of financial reporting and the preparation of financial statements for external purposes in accordance with generally accepted accounting principles. A company’s internal control over financial reporting includes those policies and procedures that (1) pertain to the maintenance of records that, in reasonable detail, accurately and fairly reflect the transactions and dispositions of the assets of the company; (2) provide reasonable assurance that transactions are recorded as necessary to permit preparation of financial statements in accordance with generally accepted accounting principles and that receipts and expenditures of the company are being made only in accordance with authorizations of management and directors of the company; and (3) provide reasonable assurance regarding prevention or timely detection of unauthorized acquisition, use, or disposition of the company’s assets that could have a material effect on the financial statements. Because of the inherent limitations of internal control over financial reporting, including the possibility of collusion or improper management override of controls, material misstatements due to error or fraud may not be prevented or detected on a timely basis. Also, projections of any evaluation of the effectiveness of the internal control over financial reporting to future periods are subject to the risk that the controls may become inadequate because of changes in conditions, or that the degree of compliance with the policies or procedures may deteriorate. In our opinion, the consolidated financial statements referred to above present fairly, in all material respects, the financial position of The Charles Schwab Corporation and subsidiaries as of December 31, 2015 and 2014, and the results of their operations and their cash flows for each of the three years in the period ended December 31, 2015, in conformity with accounting principles generally accepted in the United States of America. Also, in our opinion, such financial statement schedule, when considered in relation to the basic consolidated financial statements taken as a whole, presents fairly, in all material respects, the information set forth therein. Also, in our opinion, the Company maintained, in all material respects, effective internal control over financial reporting as of December 31, 2015, based on the criteria established in Internal Control – Integrated Framework (2013) issued by the Committee of Sponsoring Organizations of the Treadway Commission. DELOITTE & TOUCHE LLP
San Francisco, California February 24, 2016
THE CHARLES SCHWAB CORPORATION
- 102 -
Management’s Report on Internal Control Over Financial Reporting Management of The Charles Schwab Corporation, together with its subsidiaries (the Company), is responsible for establishing and maintaining adequate internal control over financial reporting. The Company’s internal control over financial reporting is a process designed under the supervision of and effected by the Company’s chief executive officer and chief financial officer to provide reasonable assurance regarding the reliability of financial reporting and the preparation of published financial statements in accordance with accounting principles generally accepted in the United States of America. As of December 31, 2015, management conducted an assessment of the effectiveness of the Company’s internal control over financial reporting based on the framework established in Internal Control – Integrated Framework (2013) issued by the Committee of Sponsoring Organizations of the Treadway Commission. Based on this assessment, management has determined that the Company’s internal control over financial reporting was effective as of December 31, 2015. The Company’s internal control over financial reporting includes policies and procedures that pertain to the maintenance of records that, in reasonable detail, accurately and fairly reflect transactions and dispositions of assets; provide reasonable assurance that transactions are recorded as necessary to permit preparation of financial statements in accordance with accounting principles generally accepted in the United States of America, and that receipts and expenditures are being made only in accordance with authorizations of management and the directors of the Company; and provide reasonable assurance regarding prevention or timely detection of unauthorized acquisition, use or disposition of the Company’s assets that could have a material effect on the Company’s financial statements. The Company’s internal control over financial reporting as of December 31, 2015, has been audited by Deloitte & Touche LLP, an independent registered public accounting firm, as stated in their report appearing on the previous page.
THE CHARLES SCHWAB CORPORATION
- 103 -
Item 9. Changes in and Disagreements With Accountants on Accounting and Financial Disclosure None. Item 9A. Controls and Procedures Evaluation of disclosure controls and procedures: The management of the Company, with the participation of the Company’s Chief Executive Officer and Chief Financial Officer, has evaluated the effectiveness of the Company’s disclosure controls and procedures (as defined in Rule 13a-15(e) under the Securities Exchange Act of 1934) as of December 31, 2015. Based on this evaluation, the Company’s Chief Executive Officer and Chief Financial Officer have concluded that the Company’s disclosure controls and procedures were effective as of December 31, 2015. Changes in internal control over financial reporting: No change in the Company’s internal control over financial reporting (as defined in Rule 13a-15(f) under the Securities Exchange Act of 1934) was identified during the quarter ended December 31, 2015, that has materially affected, or is reasonably likely to materially affect, the Company’s internal control over financial reporting. Management’s Report on Internal Control Over Financial Reporting and the Report of Independent Registered Public Accounting Firm are included in “Item 8 – Financial Statements and Supplementary Data.” Item 9B. Other Information None.
PART III Item 10. Directors, Executive Officers, and Corporate Governance The information relating to directors of CSC required to be furnished pursuant to this item is incorporated by reference from portions of the Company’s definitive proxy statement for its annual meeting of stockholders to be filed with the SEC pursuant to Regulation 14A by April 30, 2016 (the Proxy Statement) under “Members of the Board of Directors,” “Corporate Governance Information,” “Director Nominations,” and “Section 16(a) Beneficial Ownership Reporting Compliance.” The Company’s Code of Conduct and Business Ethics, applicable to directors and all employees, including senior financial officers, is available on the Company’s website at http://www.aboutschwab.com/governance. If the Company makes any amendments to or grants any waivers from its Code of Conduct and Business Ethics, which are required to be disclosed pursuant to the Securities Exchange Act of 1934, the Company will make such disclosures on this website.

THE CHARLES SCHWAB CORPORATION
- 104 -
Schwab Executive Officers of the Registrant The following table provides certain information about each of the Company’s executive officers as of December 31, 2015.
Executive Officers of the Registrant
Name Age Title
Charles R. Schwab 78 Chairman of the Board
Walter W. Bettinger II 55 President and Chief Executive Officer
Marie A. Chandoha 54 President and Chief Executive Officer – Charles Schwab Investment Management, Inc.
Bernard J. Clark 57 Executive Vice President – Advisor Services
David R. Garfield 59 Executive Vice President, General Counsel and Corporate Secretary
Terri R. Kallsen 47 Executive Vice President – Investor Services
Joseph R. Martinetto 53 Senior Executive Vice President and Chief Financial Officer
Nigel J. Murtagh 52 Executive Vice President – Corporate Risk
Mr. Schwab has been Chairman of the Board and a director of CSC since its incorporation in 1986. He also served as Chief Executive Officer of CSC from 1986 to 1997, and as Co-Chief Executive Officer from 1998 until 2003. He was re-appointed Chief Executive Officer in 2004 and served in that role until 2008. Mr. Schwab is also Chairman of Schwab and Schwab Bank. He served as Chairman and trustee of The Charles Schwab Family of Funds, Schwab Investments, Schwab Capital Trust, Schwab Annuity Portfolios, Laudus Trust, and Laudus Institutional Trust, all registered investment companies, through December 31, 2015. Mr. Bettinger has been President and Chief Executive Officer of CSC since 2008. He also serves on the Board of Directors of CSC, Schwab and Schwab Bank, and as Chairman and trustee of The Charles Schwab Family of Funds, Schwab Investments, Schwab Capital Trust, Schwab Annuity Portfolios, Laudus Trust, Laudus Institutional Trust, and Schwab Strategic Trust, all registered investment companies. Prior to assuming his current role, Mr. Bettinger served as President and Chief Operating Officer of CSC from 2007 until 2008 and as Executive Vice President and President – Schwab Investor Services of CSC and Schwab from 2005 to 2007. He served as Executive Vice President and Chief Operating Officer – Individual Investor Enterprise of CSC and Schwab from 2004 until 2005, and Executive Vice President – Corporate Services of Schwab from 2002 until 2004. Mr. Bettinger joined Schwab in 1995. Ms. Chandoha has been President and Chief Executive Officer of CSIM since 2011 and has served as a director of CSIM since 2010. Prior to joining Schwab, Ms. Chandoha served as the global head of the fixed-income business at BlackRock (formerly Barclays Global Investors) from 2007 until 2010 and as co-head and senior portfolio manager in charge of the Montgomery fixed income division at Wells Capital Management from 1999 until 2007. Mr. Clark has been Executive Vice President – Advisor Services of CSC since 2012. Mr. Clark has served as Executive Vice President – Advisor Services of Schwab since 2010. From 2006 until 2010, Mr. Clark served as Senior Vice President – Schwab Institutional Sales of Schwab. During 2005 and 2006, he served as Senior Vice President – Client Service of Schwab. Mr. Clark joined Schwab in 1998. Mr. Garfield has been Executive Vice President, General Counsel and Corporate Secretary of CSC and Executive Vice President of Schwab since 2014. Mr. Garfield served as Deputy General Counsel of Wells Fargo & Company from 1998 until he joined Schwab in 2014. Ms. Kallsen has been Executive Vice President – Investor Services of CSC and Schwab since 2014. She served as Senior Vice President – Portfolio Consulting of Schwab from 2012 until 2014 and as Senior Vice President – Branch Network from
THE CHARLES SCHWAB CORPORATION
- 105 -
June 2014 until December 2014. Prior to joining Schwab, Ms. Kallsen served as Executive Vice President of First Command Financial Services from 2009 until 2012 and as Senior Vice President of USAA from 2004 until 2009. Mr. Martinetto has been Senior Executive Vice President and Chief Financial Officer of CSC and Schwab since July 2015. He served as Executive Vice President and Chief Financial Officer of CSC and Schwab from 2007 until July 2015. Mr. Martinetto served as Senior Vice President and Treasurer of CSC and Schwab from 2003 to 2007 and Senior Vice President – Individual Investor Finance of Schwab from 2002 to 2003. Mr. Martinetto joined Schwab in 1997. Mr. Murtagh has been Executive Vice President – Corporate Risk of CSC and Schwab since 2012. He served as Senior Vice President and Chief Credit Officer of Schwab from 2002 until 2012 and of CSC from 2008 until 2012. Mr. Murtagh joined Schwab in 2000. Item 11. Executive Compensation The information required to be furnished pursuant to this item is incorporated by reference from portions of the Proxy Statement under “Compensation Discussion and Analysis,” “Executive Compensation Tables – 2015 Summary Compensation Table,” “Executive Compensation Tables – 2015 Grants of Plan-Based Awards Table,” “Executive Compensation Tables – Narrative to Summary Compensation and Grants of Plan-Based Awards Tables,” “Executive Compensation Tables – 2015 Termination and Change in Control Benefits Table,” “Executive Compensation Tables – Outstanding Equity Awards as of December 31, 2015,” “Executive Compensation Tables – 2015 Option Exercises and Stock Vested Table,” “Executive Compensation Tables – 2015 Nonqualified Deferred Compensation Table,” “Director Compensation,” and “Compensation Committee Interlocks and Insider Participation.” In addition, the information from a portion of the Proxy Statement under “Compensation Committee Report,” is incorporated by reference from the Proxy Statement and furnished on this Form 10-K, and shall not be deemed “filed” for purposes of Section 18 of the Securities Exchange Act of 1934, nor shall it be deemed incorporated by reference in any filing under the Securities Act of 1933. Item 12. Security Ownership of Certain Beneficial Owners and Management and Related Stockholder Matters The information required to be furnished pursuant to this item is incorporated by reference from portions of the Proxy Statement under “Security Ownership of Certain Beneficial Owners and Management,” and “Securities Authorized for Issuance under Equity Compensation Plans.” Item 13. Certain Relationships and Related Transactions, and Director Independence The information required to be furnished pursuant to this item is incorporated by reference from portions of the Proxy Statement under “Transactions with Related Persons” and “Director Independence.” Item 14. Principal Accountant Fees and Services The information required to be furnished pursuant to this item is incorporated by reference from a portion of the Proxy Statement under “Auditor Fees.”

THE CHARLES SCHWAB CORPORATION
- 106 -
PART IV Item 15. Exhibits and Financial Statement Schedule (a) Documents filed as part of this Report 1. Financial Statements The financial statements and independent auditors’ report are included in “Item 8 – Financial Statements and Supplementary Data” and are listed below:
Consolidated Statements of Income Consolidated Statements of Comprehensive Income Consolidated Balance Sheets Consolidated Statements of Cash Flows Consolidated Statements of Stockholders’ Equity Notes to Consolidated Financial Statements Report of Independent Registered Public Accounting Firm
2. Financial Statement Schedule The financial statement schedule required to be furnished pursuant to this item is listed in the accompanying index appearing on page F-1.

THE CHARLES SCHWAB CORPORATION
- 107 -
(b) Exhibits The exhibits listed below are filed as part of this annual report on Form 10-K.
Exhibit Number
Exhibit
2.1 Agreement and Plan of Merger, dated March 18, 2011, by and among The Charles Schwab Corporation, Neon Acquisition Corp. and optionsXpress Holdings, Inc., filed as Exhibit 2.1 to the Registrant’s Form 8-K dated March 18, 2011, and incorporated herein by reference.
3.11 Fifth Restated Certificate of Incorporation, effective May 7, 2001, of the Registrant, filed as Exhibit 3.11 to the Registrant’s Form 10-Q for the quarter ended September 30, 2011, and incorporated herein by reference.
3.14 Fourth Restated Bylaws, as amended on January 27, 2010, of the Registrant, filed as Exhibit 3.1 to the Registrant’s Form 8-K dated January 27, 2010, and incorporated herein by reference.
3.15 Certificate of Designations of Fixed to Floating Rate Non-Cumulative Perpetual Preferred Stock, Series A of The Charles Schwab Corporation filed as Exhibit 3.15 to the Registrant’s Form 8-K dated January 24, 2012, and incorporated herein by reference.
3.16 Certificate of Designations of 6.00% Non-Cumulative Perpetual Preferred Stock, Series B, of the Charles Schwab Corporation filed as Exhibit 3.1 to the Registrant’s Form 8-K dated May 31, 2012, and incorporated herein by reference.
3.17 Certificate of Designations of 6.00% Non-Cumulative Perpetual Preferred Stock, Series C, of The Charles Schwab Corporation filed as Exhibit 3.1 to the Registrant’s Form 8-K dated August 3, 2015 and incorporated herein by reference.
4.1 Deposit Agreement, dated June 6, 2012, between the Company and Wells Fargo Bank, N.A., as Depositary (including the form of Depositary Share Receipt attached as Exhibit A thereto), filed as Exhibit 4.1 to the Registrant’s Form 8-K dated May 31, 2012, and incorporated herein by reference.
THE CHARLES SCHWAB CORPORATION
- 108 -
Exhibit Number
Exhibit
4.2 Deposit Agreement, dated August 3, 2015, between the Company and Wells Fargo Bank, N.A., as Depositary (including the form of Depositary Share Receipt attached as Exhibit A thereto), filed as Exhibit 4.1 to the Registrant’s Form 8-K dated August 3, 2015 and incorporated herein by reference.
4.3 Neither the Registrant nor its subsidiaries are parties to any instrument with respect to long-term debt for which securities authorized thereunder exceed 10% of the total assets of the Registrant and its subsidiaries on a consolidated basis. Copies of instruments with respect to long-term debt of lesser amounts will be provided to the SEC upon request.
10.4 Form of Release Agreement dated as of March 31, 1987 among BAC, Registrant, Schwab Holdings, Inc., Charles Schwab & Co., Inc. and former shareholders of Schwab Holdings, Inc., filed as the identically-numbered exhibit to Registrant’s Registration Statement No. 33-16192 on Form S-1 and incorporated herein by reference.
10.57 Registration Rights and Stock Restriction Agreement, dated as of March 31, 1987, between the Registrant and the holders of the Common Stock, filed as Exhibit 4.23 to Registrant’s Registration Statement No. 33-16192 on Form S-1 and incorporated herein by reference.
10.72 Restatement of Assignment and License, as amended January 25, 1988, among Charles Schwab & Co., Inc., Charles R. Schwab and the Registrant, and incorporated herein by reference.
10.271 The Charles Schwab Corporation Directors’ Deferred Compensation Plan, as amended through December 8, 2004, and incorporated herein by reference.
(2)
10.272 The Charles Schwab Corporation Deferred Compensation Plan, as amended through December 8, 2004, and incorporated herein by reference.
(2)
10.314 Employment Agreement dated as of March 13, 2008, between the Registrant and Charles R. Schwab, filed as Exhibit 10.314 to the Registrant’s Form 10-Q for the quarter ended March 31, 2013, and incorporated herein by reference.
(2)
10.322 The Charles Schwab Corporation Deferred Compensation Plan II, as amended and restated as of October 23, 2008, filed as Exhibit 10.322 to the Registrant’s Form 10-K for the year ended December 31, 2013, and incorporated herein by reference.
(2)
10.331 The Charles Schwab Corporation Corporate Executive Bonus Plan, restated to include amendments approved at the Annual Meeting of Stockholders on May 13, 2010, filed as Exhibit 10.331 to the Registrant’s Form 10-Q for the quarter ended June 30 2010, and incorporated herein by reference.
(2)
10.338 The Charles Schwab Corporation 2004 Stock Incentive Plan, as approved at the Annual Meeting of Stockholders on May 17, 2011, filed as Exhibit 10.338 to the Registrant’s Form 10-Q for the quarter ended June 30, 2011, and incorporated herein by reference.
(2)
10.349 The Charles Schwab Severance Pay Plan, as Amended and Restated Effective May 1, 2012, filed as Exhibit 10.349 to the Registrant’s Form 10-Q for the quarter ended June 30, 2012, and incorporated herein by reference.
(2)
10.351 Summary of Non-Employee Director Compensation, filed as Exhibit 10.351 to the Registrant’s Form 10-K for the year ended December 31, 2012, and incorporated herein by reference.
(2)
10.352 Form of Performance-Based Cash Long-Term Incentive Award Agreement under The Charles Schwab Corporation 2004 Stock Incentive Plan and successor plans, filed as Exhibit 10.352 to the Registrant’s Form 8-K dated January 24, 2013, and incorporated herein by reference.
(2)
10.353 Form of Notice and Performance-Based Restricted Stock Unit Agreement under The Charles Schwab Corporation 2004 Stock Incentive Plan and successor plans, filed as Exhibit 10.353 to the Registrant’s Form 8-K dated January 24, 2013, and incorporated herein by reference.
(2)

THE CHARLES SCHWAB CORPORATION
- 109 -
Exhibit Number
Exhibit
10.354 Form of Notice and Nonqualified Stock Option Agreement under The Charles Schwab Corporation 2004 Stock Incentive Plan and successor plans, filed as Exhibit 10.354 to the Registrant’s Form 8-K dated January 24, 2013, and incorporated herein by reference.
(2)
10.355 Form of Notice and Restricted Stock Unit Agreement under The Charles Schwab Corporation 2004 Stock Incentive Plan and successor plans, filed as Exhibit 10.355 to the Registrant’s Form 8-K dated January 24, 2013, and incorporated herein by reference.
(2)
10.356 Form of Notice and Retainer Stock Option Agreement for Non-Employee Directors under The Charles Schwab Corporation 2004 Stock Incentive Plan and successor plans, filed as Exhibit 10.356 to the Registrant’s Form 8-K dated January 24, 2013, and incorporated herein by reference.
(2)
10.357 Form of Notice and Retainer Restricted Stock Unit Agreement for Non-Employee Directors under The Charles Schwab Corporation 2004 Stock Incentive Plan and successor plans, filed as Exhibit 10.357 to the Registrant’s Form 8-K dated January 24, 2013, and incorporated herein by reference.
(2)
10.358 Form of Notice and Stock Option Agreement for Non-Employee Directors under The Charles Schwab Corporation Directors’ Deferred Compensation Plan II and The Charles Schwab Corporation 2004 Stock Incentive Plan and successor plans, filed as Exhibit 10.358 to the Registrant’s Form 8-K dated January 24, 2013, and incorporated herein by reference.
(2)
10.359 Form of Notice and Restricted Stock Unit Agreement for Non-Employee Directors under The Charles Schwab Corporation Directors’ Deferred Compensation Plan II and The Charles Schwab Corporation 2004 Stock Incentive Plan and successor plans, filed as Exhibit 10.359 to the Registrant’s Form 8-K dated January 24, 2013, and incorporated herein by reference.
(2)
10.360 The Charles Schwab Corporation 2013 Stock Incentive Plan, as approved at the Annual Meeting of Stockholders on May 16, 2013, filed as Exhibit 10.360 to the Registrant’s Form 8-K dated May 16, 2013, and incorporated herein by reference.
(2)
10.362 The Charles Schwab Corporation Directors’ Deferred Compensation Plan II, as amended and restated as of April 24, 2013, filed as Exhibit 10.362 to the Registrant’s Form 10-Q for the quarter ended June 30, 2013, and incorporated herein by reference.
(2)
10.363 Credit Agreement (364 – Day Commitment) dated as of June 6, 2014, between the Registrant and financial institutions therein, filed as Exhibit 10.363 to the Registrant’s Form 10-Q for the quarter ended June 30, 2014, and incorporated herein by reference.
10.364 Separation Agreement, General Release and Waiver of Claims by and between Mr. Clendening and CSC, filed as Exhibit 10.364 to the Registrant’s Form 8-K/A dated December 10, 2014, and incorporated herein by reference.
(2)
10.365 The Charles Schwab Corporation Corporate Executive Bonus Plan, restated to include amendments approved at the Annual Meeting of Stockholders on May 13, 2015 (supersedes Exhibit 10.331), and incorporated herein by reference.
(2)
10.366 Credit Agreement (364 – Day Commitment) dated as of June 5, 2015, between the Registrant and financial institutions therein (supersedes Exhibit 10.363), filed as Exhibit 10.366 to the Registrant’s Form 10-Q for the quarter ended June 30, 2015, and incorporated herein by reference.
10.367 Summary of Non-Employee Director Compensation (supersedes Exhibit 10.351). (2)

THE CHARLES SCHWAB CORPORATION
- 110 -
Exhibit Number
Exhibit
12.1 Computation of Ratio of Earnings to Fixed Charges and Ratio of Earnings to Fixed Charges and Preferred Stock Dividends.
21.1 Subsidiaries of the Registrant.
23.1 Independent Registered Public Accounting Firm’s Consent.
31.1 Certification Pursuant to Rule 13a-14(a)/15d-14(a), As Adopted Pursuant to Section 302 of The Sarbanes-Oxley Act of 2002.
31.2 Certification Pursuant to Rule 13a-14(a)/15d-14(a), As Adopted Pursuant to Section 302 of The Sarbanes-Oxley Act of 2002.
32.1 Certification Pursuant to 18 U.S.C. Section 1350, As Adopted Pursuant to Section 906 of The Sarbanes-Oxley Act of 2002.
(1)
32.2 Certification Pursuant to 18 U.S.C. Section 1350, As Adopted Pursuant to Section 906 of The Sarbanes-Oxley Act of 2002.
(1)
101.INS XBRL Instance Document (3)
101.SCH XBRL Taxonomy Extension Schema (3)
101.CAL XBRL Taxonomy Extension Calculation (3)
101.DEF XBRL Extension Definition (3)
101.LAB XBRL Taxonomy Extension Label (3)
101.PRE XBRL Taxonomy Extension Presentation (3)
(1) Furnished as an exhibit to this annual report on Form 10-K.
(2) Management contract or compensatory plan.
(3) Attached as Exhibit 101 to this Annual Report on Form 10-K for the annual period ended December 31, 2015, are the following materials formatted in XBRL (Extensible Business Reporting Language) (i) the Consolidated Statements of Income,(ii) the Consolidated Statements of Comprehensive Income, (iii) the Consolidated Balance Sheets, (iv) the Consolidated Statements of Cash Flows, (v) the Consolidated Statements of Stockholders’ Equity, and (vi) Notes to Consolidated Financial Statements.

THE CHARLES SCHWAB CORPORATION
- 111 -
SIGNATURES Pursuant to the requirements of Section 13 or 15(d) of the Securities Exchange Act of 1934, the registrant has duly caused this report to be signed on its behalf by the undersigned, thereunto duly authorized, on February 24, 2016. THE CHARLES SCHWAB CORPORATION (Registrant) BY: /s/ Walter W. Bettinger II Walter W. Bettinger II President and Chief Executive Officer Pursuant to the requirements of the Securities Exchange Act of 1934, this report has been signed below by the following persons on behalf of the registrant and in the capacities indicated, on February 24, 2016.
Signature / Title Signature / Title
/s/ Walter W. Bettinger II /s/ Joseph R. Martinetto Walter W. Bettinger II, Joseph R. Martinetto, President and Chief Executive Officer Senior Executive Vice President
and Chief Financial Officer (principal financial and accounting officer)
/s/ Charles R. Schwab /s/ John K. Adams, Jr. Charles R. Schwab, Chairman of the Board John K. Adams, Jr., Director
/s/ Nancy H. Bechtle /s/ C. Preston Butcher Nancy H. Bechtle, Director C. Preston Butcher, Director
/s/ Christopher V. Dodds /s/ Stephen A. Ellis Christopher V. Dodds, Director Stephen A. Ellis, Director
/s/ Mark A. Goldfarb /s/ William S. Haraf Mark A. Goldfarb, Director William S. Haraf, Director
/s/ Frank C. Herringer /s/ Stephen T. McLin Frank C. Herringer, Director Stephen T. McLin, Director /s/ Arun Sarin /s/ Paula A. Sneed Arun Sarin, Director Paula A. Sneed, Director
/s/ Roger O. Walther /s/ Robert N. Wilson Roger O. Walther, Director Robert N. Wilson, Director
THE CHARLES SCHWAB CORPORATION
F-1
Index to Financial Statement Schedule
Page
Schedule II - Valuation and Qualifying Accounts F-2 Supplemental Financial Data for Charles Schwab Bank (Unaudited) F-3 – F-9
Schedules not listed are omitted because of the absence of the conditions under which they are required or because the information is included in the Company’s consolidated financial statements and notes in “Item 8 – Financial Statements and Supplementary Data.”
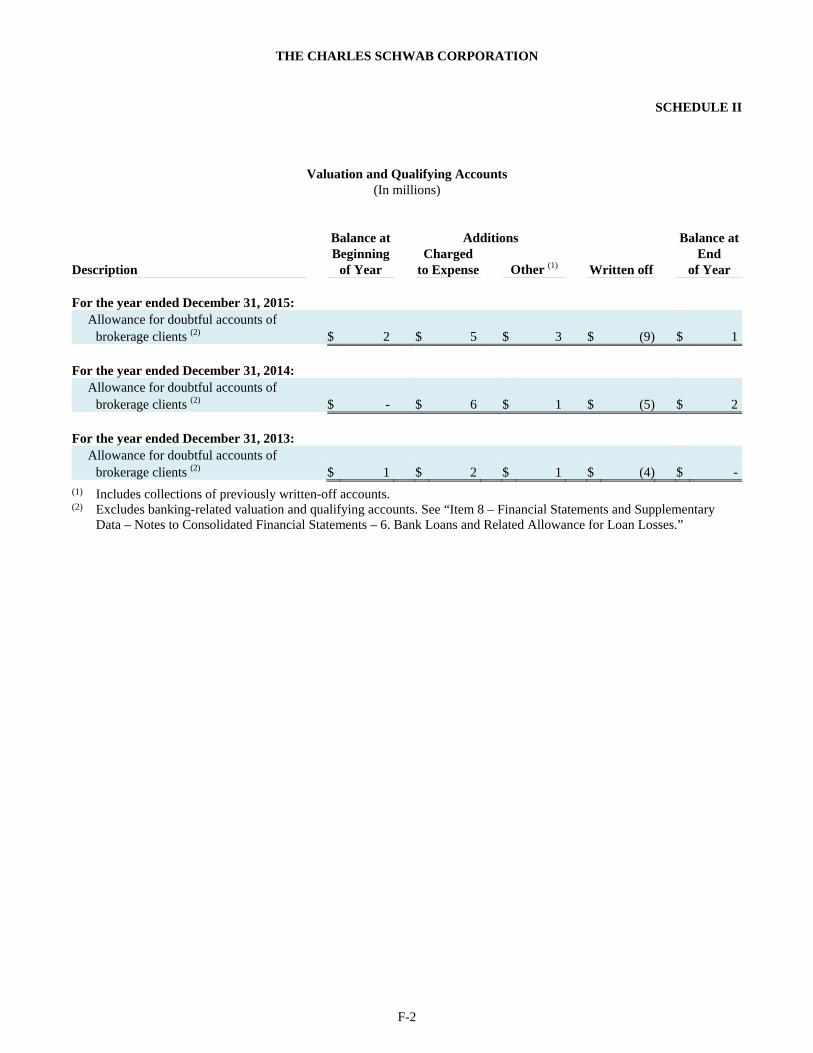
THE CHARLES SCHWAB CORPORATION
F-2
SCHEDULE II
Valuation and Qualifying Accounts (In millions)
Balance at Additions Balance at Beginning Charged End Description of Year to Expense Other (1) Written off of Year For the year ended December 31, 2015:
Allowance for doubtful accounts of brokerage clients (2) $ 2 $ 5 $ 3 $ (9) $ 1
For the year ended December 31, 2014: Allowance for doubtful accounts of
brokerage clients (2) $ - $ 6 $ 1 $ (5) $ 2
For the year ended December 31, 2013: Allowance for doubtful accounts of
brokerage clients (2) $ 1 $ 2 $ 1 $ (4) $ -
(1) Includes collections of previously written-off accounts.
(2) Excludes banking-related valuation and qualifying accounts. See “Item 8 – Financial Statements and Supplementary Data – Notes to Consolidated Financial Statements – 6. Bank Loans and Related Allowance for Loan Losses.”

THE CHARLES SCHWAB CORPORATION Supplemental Financial Data for Charles Schwab Bank (Unaudited)
(Dollars in Millions)
F-3
The following supplemental financial data is consistent with the Securities Exchange Act of 1934, Industry Guide 3 – Statistical Disclosure by Bank Holding Companies. The accompanying unaudited financial information represents Schwab Bank, which is a subsidiary of CSC. CSC is a savings and loan holding company and Schwab Bank is a federal savings bank. The following information excludes intercompany balances and transactions with CSC and its affiliates. 1. Three-year Net Interest Revenue and Average Balances
For the Year Ended December 31, 2015 2014 2013 Average Average Average Average Average Average Balance Interest Rate Balance Interest Rate Balance Interest Rate
Assets: Cash and cash equivalents (1) $ 8,028 $ 22 0.27 % $ 5,871 $ 15 0.26 % $ 5,626 $ 15 0.27 %Securities available for sale (2) 61,783 623 1.01 % 52,056 546 1.05 % 49,112 557 1.13 %Securities held to maturity 38,099 953 2.50 % 32,361 828 2.56 % 24,915 610 2.45 %Bank loans (3) 13,970 369 2.64 % 12,903 354 2.74 % 11,756 329 2.80 %Other interest-earning assets 56 5 8.93 % 63 6 9.52 % 53 2 3.77 %Total interest-earning assets 121,936 1,972 1.62 % 103,254 1,749 1.69 % 91,462 1,513 1.65 %
Net unrealized gain on securities available for sale 187 229 252
Noninterest-earning assets 601 525 671 Total Assets $ 122,724 $ 104,008 $ 92,385
Liabilities and Stockholder’s Equity: Interest-bearing banking deposits $ 113,464 29 0.03 % $ 95,842 30 0.03 % $ 85,465 31 0.04 %Total sources on which interest is paid 113,464 29 0.03 % 95,842 30 0.03 % 85,465 31 0.04 %
Noninterest-bearing liabilities 719 723 650 Stockholder’s equity 8,541 7,443 6,270 Total Liabilities and Stockholder’s Equity $ 122,724 $ 104,008 $ 92,385 Net interest revenue $ 1,943 $ 1,719 $ 1,482
Net yield on interest-earning assets 1.59 % 1.66 % 1.62 %
(1) Includes deposits with banks and short-term investments. (2) Amounts have been calculated based on amortized cost. (3) Includes average principal balances of nonaccrual loans.

THE CHARLES SCHWAB CORPORATION Supplemental Financial Data for Charles Schwab Bank (Unaudited)
(Dollars in Millions)
F-4
2. Analysis of Change in Net Interest Revenue An analysis of the year-to-year changes in the categories of interest revenue and interest expense resulting from changes in volume and rate is as follows:
2015 Compared to 2014 2014 Compared to 2013 Increase (Decrease) Due to Increase (Decrease) Due to Change in: Change in: Average Average Average Average Volume Rate Total Volume Rate Total
Interest-earning assets: Cash and cash equivalents (1) $ 6 $ 1 $ 7 $ - $ - $ -Securities available for sale (2) 102 (25) 77 33 (44) (11)Securities held to maturity 147 (22) 125 182 36 218Bank loans (3) 29 (14) 15 32 (7) 25Other interest-earning assets (1) - (1) - 4 4Total interest-earning assets $ 283 $ (60) $ 223 $ 247 $ (11) $ 236
Interest-bearing sources of funds: Interest-bearing banking deposits $ 5 $ (6) $ (1) $ 4 $ (5) $ (1)Total sources on which interest is paid $ 5 $ (6) $ (1) $ 4 $ (5) $ (1)
Change in net interest revenue $ 278 $ (54) $ 224 $ 243 $ (6) $ 237 Changes that are not due solely to volume or rate have been allocated to rate.
(1) Includes deposits with banks and short-term investments.
(2) Amounts have been calculated based on amortized cost. (3) Includes average principal balances of nonaccrual loans.

THE CHARLES SCHWAB CORPORATION Supplemental Financial Data for Charles Schwab Bank (Unaudited)
(Dollars in Millions)
F-5
3. Securities Available for Sale and Securities Held to Maturity The amortized cost, gross unrealized gains and losses, and fair value of securities available for sale and securities held to maturity are as follows:
Gross Gross Amortized Unrealized Unrealized Fair December 31, 2015 Cost Gains Losses Value
Securities available for sale: U.S. agency mortgage-backed securities $ 22,014 $ 183 $ 48 $ 22,149Asset-backed securities 21,784 7 306 21,485Corporate debt securities 10,764 14 31 10,747U.S. Treasury securities 5,150 1 16 5,135U.S. agency notes 3,177 - 27 3,150Certificates of deposit 1,685 1 3 1,683U.S. state and municipal securities 414 10 - 424Non-agency commercial mortgage-backed securities 298 1 - 299Other securities 5 - - 5
Total securities available for sale $ 65,291 $ 217 $ 431 $ 65,077
Securities held to maturity: U.S. agency mortgage-backed securities $ 48,785 $ 391 $ 293 $ 48,883Non-agency commercial mortgage-backed securities 999 6 20 985
Total securities held to maturity $ 49,784 $ 397 $ 313 $ 49,868
Gross Gross Amortized Unrealized Unrealized Fair December 31, 2014 Cost Gains Losses Value
Securities available for sale: U.S. agency mortgage-backed securities $ 18,487 $ 242 $ 12 $ 18,717Asset-backed securities 19,320 64 18 19,366Corporate debt securities 8,023 30 8 8,045U.S. Treasury securities 2,993 2 1 2,994U.S. agency notes 3,839 - 44 3,795Certificates of deposit 1,533 1 - 1,534Non-agency commercial mortgage-backed securities 310 7 - 317Other securities 15 - - 15
Total securities available for sale $ 54,520 $ 346 $ 83 $ 54,783
Securities held to maturity: U.S. agency mortgage-backed securities $ 33,388 $ 531 $ 174 $ 33,745Non-agency commercial mortgage-backed securities 1,001 11 14 998
Total securities held to maturity $ 34,389 $ 542 $ 188 $ 34,743
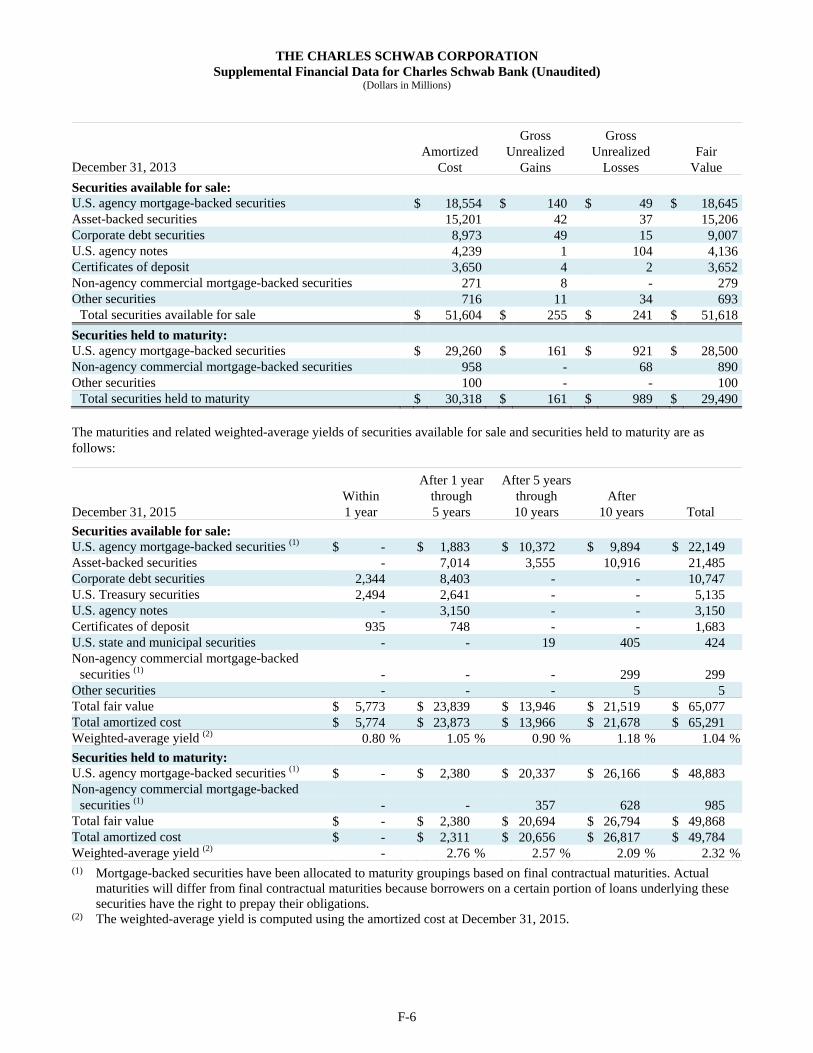
THE CHARLES SCHWAB CORPORATION Supplemental Financial Data for Charles Schwab Bank (Unaudited)
(Dollars in Millions)
F-6
Gross Gross Amortized Unrealized Unrealized Fair December 31, 2013 Cost Gains Losses Value
Securities available for sale: U.S. agency mortgage-backed securities $ 18,554 $ 140 $ 49 $ 18,645Asset-backed securities 15,201 42 37 15,206Corporate debt securities 8,973 49 15 9,007U.S. agency notes 4,239 1 104 4,136Certificates of deposit 3,650 4 2 3,652Non-agency commercial mortgage-backed securities 271 8 - 279Other securities 716 11 34 693
Total securities available for sale $ 51,604 $ 255 $ 241 $ 51,618
Securities held to maturity: U.S. agency mortgage-backed securities $ 29,260 $ 161 $ 921 $ 28,500Non-agency commercial mortgage-backed securities 958 - 68 890Other securities 100 - - 100
Total securities held to maturity $ 30,318 $ 161 $ 989 $ 29,490 The maturities and related weighted-average yields of securities available for sale and securities held to maturity are as follows:
After 1 year After 5 years Within through through After December 31, 2015 1 year 5 years 10 years 10 years Total
Securities available for sale: U.S. agency mortgage-backed securities (1) $ - $ 1,883 $ 10,372 $ 9,894 $ 22,149 Asset-backed securities - 7,014 3,555 10,916 21,485 Corporate debt securities 2,344 8,403 - - 10,747 U.S. Treasury securities 2,494 2,641 - - 5,135 U.S. agency notes - 3,150 - - 3,150 Certificates of deposit 935 748 - - 1,683 U.S. state and municipal securities - - 19 405 424 Non-agency commercial mortgage-backed
securities (1) - - - 299 299 Other securities - - - 5 5 Total fair value $ 5,773 $ 23,839 $ 13,946 $ 21,519 $ 65,077 Total amortized cost $ 5,774 $ 23,873 $ 13,966 $ 21,678 $ 65,291 Weighted-average yield (2) 0.80 % 1.05 % 0.90 % 1.18 % 1.04 %
Securities held to maturity: U.S. agency mortgage-backed securities (1) $ - $ 2,380 $ 20,337 $ 26,166 $ 48,883 Non-agency commercial mortgage-backed
securities (1) - - 357 628 985 Total fair value $ - $ 2,380 $ 20,694 $ 26,794 $ 49,868 Total amortized cost $ - $ 2,311 $ 20,656 $ 26,817 $ 49,784 Weighted-average yield (2) - 2.76 % 2.57 % 2.09 % 2.32 %
(1) Mortgage-backed securities have been allocated to maturity groupings based on final contractual maturities. Actual maturities will differ from final contractual maturities because borrowers on a certain portion of loans underlying these securities have the right to prepay their obligations.
(2) The weighted-average yield is computed using the amortized cost at December 31, 2015.

THE CHARLES SCHWAB CORPORATION Supplemental Financial Data for Charles Schwab Bank (Unaudited)
(Dollars in Millions)
F-7
4. Cross-border Holdings The tables below set forth the amount of Schwab Bank’s cross-border holdings, based on carrying value, as of December 31, 2015, 2014, and 2013. Such holdings, by country, that exceed 1% of total assets are disclosed separately, and such holdings, by country, that are between 0.75% and 1% of total assets are listed in the aggregate. Cross-border holdings are comprised of cash equivalents and securities available for sale.
Banks and other Commercial and Exposure as a %December 31, 2015 financial institutions industrial institutions Total of total assets
Country:
Canada $ 1,499 $ - $ 1,499 1.1 % Australia 1,376 60 1,436 1.0 %
Total $ 2,875 $ 60 $ 2,935 Banks and other Commercial and Exposure as a %December 31, 2014 financial institutions industrial institutions Total of total assets
Country:
Canada $ 1,437 $ - $ 1,437 1.3 % Australia 1,182 - 1,182 1.1 %
Total $ 2,619 $ - $ 2,619
Banks and other Commercial and Exposure as a %December 31, 2013 financial institutions industrial institutions Total of total assets
Country:
Canada $ 2,408 $ - $ 2,408 2.4 % Australia 1,563 - 1,563 1.6 % United Kingdom 1,262 140 1,402 1.4 % Sweden 1,247 - 1,247 1.2 % Switzerland 825 - 825 0.8 %
Total $ 7,305 $ 140 $ 7,445 5. Bank Loans and Related Allowance for Loan Losses The composition of the loan portfolio is as follows:
December 31, 2015 2014 2013 2012 2011
Residential real estate mortgages $ 8,334 $ 8,127 $ 8,006 $ 6,507 $ 5,596Home equity loans and lines of credit 2,735 2,955 3,041 3,287 3,509Pledged asset lines 3,232 2,320 1,384 963 742Other 61 36 34 22 16
Total bank loans $ 14,362 $ 13,438 $ 12,465 $ 10,779 $ 9,863 An analysis of nonaccrual loans is as follows:
December 31, 2015 2014 2013 2012 2011
Nonaccrual loans $ 28 $ 35 $ 48 $ 48 $ 52Average nonaccrual loans $ 30 $ 39 $ 43 $ 48 $ 51

THE CHARLES SCHWAB CORPORATION Supplemental Financial Data for Charles Schwab Bank (Unaudited)
(Dollars in Millions)
F-8
Changes in the allowance for loan losses were as follows:
December 31, 2015 2014 2013 2012 2011
Balance at beginning of year $ 42 $ 48 $ 56 $ 54 $ 53Charge-offs (3) (5) (11) (16) (19)Recoveries 3 3 4 2 2Provision for loan losses (11) (4) (1) 16 18
Balance at end of year $ 31 $ 42 $ 48 $ 56 $ 54 The maturities of the loan portfolio are as follows:
After 1 year Within through After
December 31, 2015 1 year 5 years 5 years Total
Residential real estate mortgages (1) $ - $ - $ 8,334 $ 8,334Home equity loans and lines of credit (2) 620 1,307 808 2,735Pledged asset lines 466 2,766 - 3,232Other 6 52 3 61
Total $ 1,092 $ 4,125 $ 9,145 $ 14,362
(1) Maturities are based upon the contractual terms of the loans.
(2) Maturities are based on an initial draw period of ten years. The interest sensitivity of loans with contractual maturities in excess of one year is as follows:
After December 31, 2015 1 year
Loans with floating or adjustable interest rates $ 12,336Loans with predetermined interest rates 934
Total $ 13,270 6. Summary of Loan Loss on Banking Loans Experience
December 31, 2015 2014 2013 2012 2011
Average loans $ 13,972 $ 12,904 $ 11,756 $ 10,050 $ 9,468 Allowance to year end loans .21 % .31 % .39 % .52 % .55 % Allowance to nonperforming loans 110 % 120 % 100 % 117 % 104 % Nonperforming assets to average loans
and real estate owned .26 % .31 % .45 % .54 % .59 %
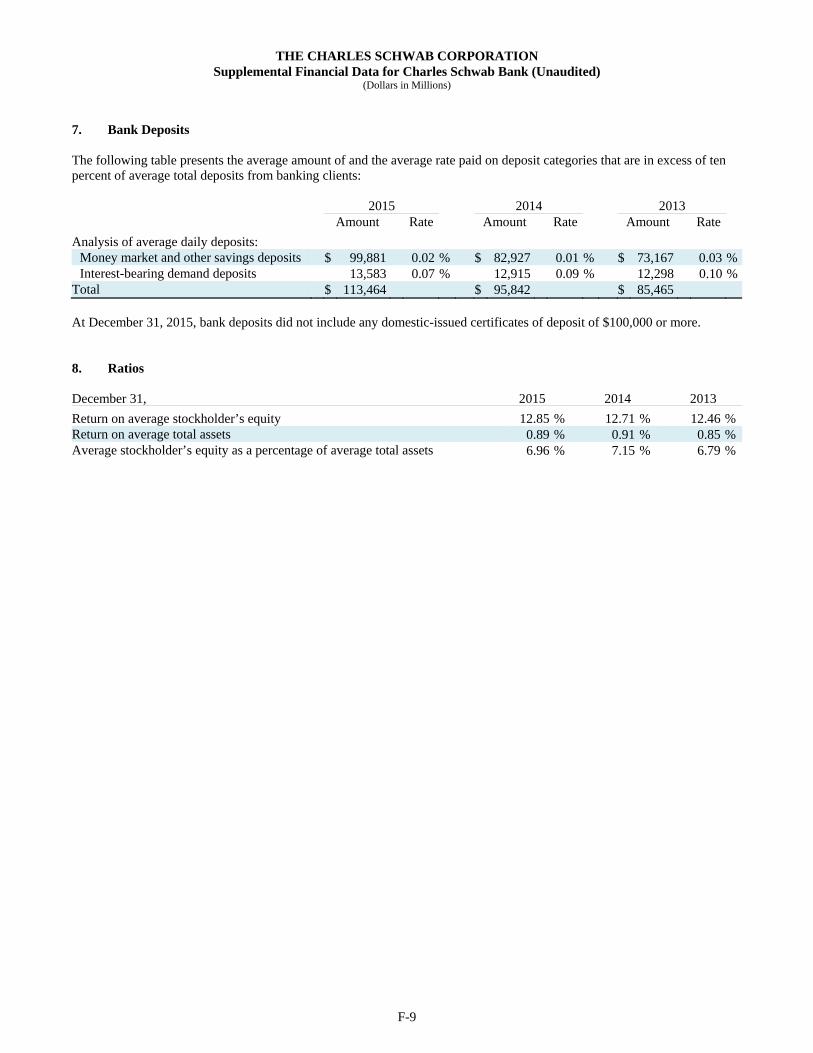
THE CHARLES SCHWAB CORPORATION Supplemental Financial Data for Charles Schwab Bank (Unaudited)
(Dollars in Millions)
F-9
7. Bank Deposits The following table presents the average amount of and the average rate paid on deposit categories that are in excess of ten percent of average total deposits from banking clients:
2015 2014 2013 Amount Rate Amount Rate Amount Rate
Analysis of average daily deposits: Money market and other savings deposits $ 99,881 0.02 % $ 82,927 0.01 % $ 73,167 0.03 % Interest-bearing demand deposits 13,583 0.07 % 12,915 0.09 % 12,298 0.10 %
Total $ 113,464 $ 95,842 $ 85,465 At December 31, 2015, bank deposits did not include any domestic-issued certificates of deposit of $100,000 or more. 8. Ratios
December 31, 2015 2014 2013
Return on average stockholder’s equity 12.85 % 12.71 % 12.46 % Return on average total assets 0.89 % 0.91 % 0.85 % Average stockholder’s equity as a percentage of average total assets 6.96 % 7.15 % 6.79 %
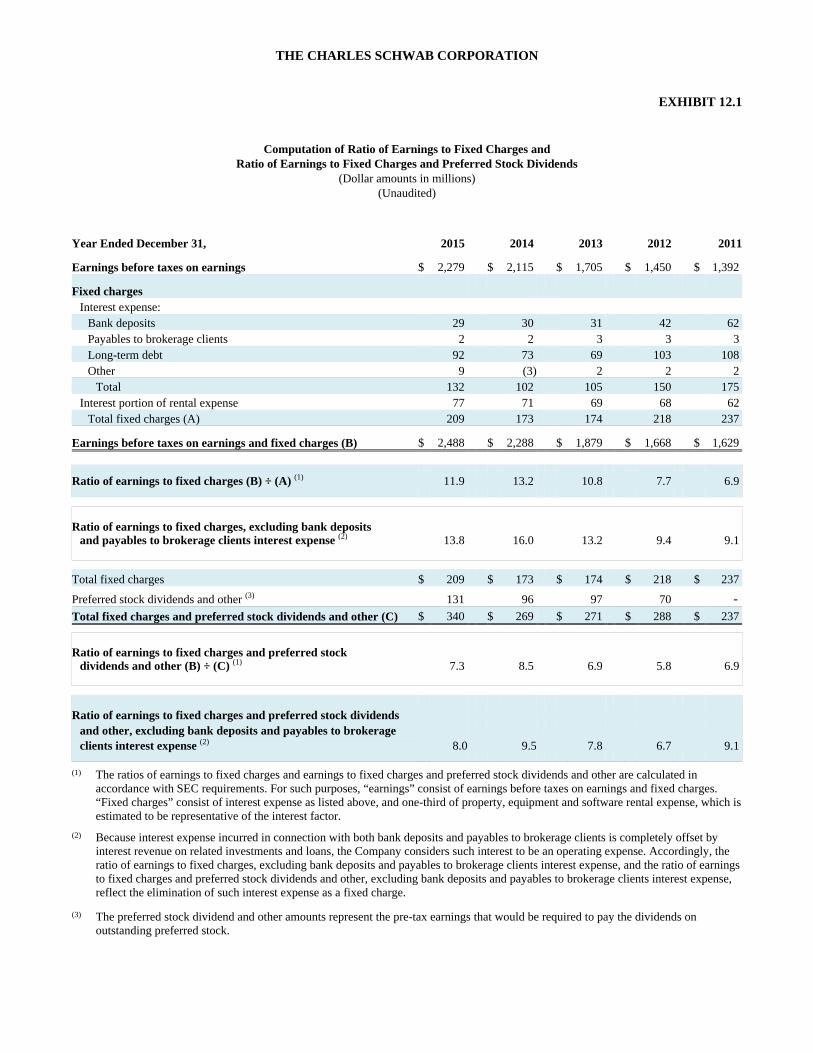
THE CHARLES SCHWAB CORPORATION
EXHIBIT 12.1
Computation of Ratio of Earnings to Fixed Charges and Ratio of Earnings to Fixed Charges and Preferred Stock Dividends
(Dollar amounts in millions) (Unaudited)
Year Ended December 31, 2015 2014 2013 2012 2011
Earnings before taxes on earnings $ 2,279 $ 2,115 $ 1,705 $ 1,450 $ 1,392
Fixed charges Interest expense:
Bank deposits 29 30 31 42 62 Payables to brokerage clients 2 2 3 3 3 Long-term debt 92 73 69 103 108 Other 9 (3) 2 2 2
Total 132 102 105 150 175 Interest portion of rental expense 77 71 69 68 62
Total fixed charges (A) 209 173 174 218 237
Earnings before taxes on earnings and fixed charges (B) $ 2,488 $ 2,288 $ 1,879 $ 1,668 $ 1,629
Ratio of earnings to fixed charges (B) ÷ (A) (1) 11.9 13.2 10.8 7.7 6.9
Ratio of earnings to fixed charges, excluding bank deposits and payables to brokerage clients interest expense (2) 13.8 16.0 13.2 9.4 9.1
Total fixed charges $ 209 $ 173 $ 174 $ 218 $ 237
Preferred stock dividends and other (3) 131 96 97 70 -Total fixed charges and preferred stock dividends and other (C) $ 340 $ 269 $ 271 $ 288 $ 237
Ratio of earnings to fixed charges and preferred stock dividends and other (B) ÷ (C) (1)
7.3 8.5 6.9 5.8 6.9
Ratio of earnings to fixed charges and preferred stock dividends and other, excluding bank deposits and payables to brokerage clients interest expense (2)
8.0 9.5 7.8 6.7 9.1
(1) The ratios of earnings to fixed charges and earnings to fixed charges and preferred stock dividends and other are calculated in accordance with SEC requirements. For such purposes, “earnings” consist of earnings before taxes on earnings and fixed charges. “Fixed charges” consist of interest expense as listed above, and one-third of property, equipment and software rental expense, which is estimated to be representative of the interest factor.
(2) Because interest expense incurred in connection with both bank deposits and payables to brokerage clients is completely offset by
interest revenue on related investments and loans, the Company considers such interest to be an operating expense. Accordingly, the ratio of earnings to fixed charges, excluding bank deposits and payables to brokerage clients interest expense, and the ratio of earnings to fixed charges and preferred stock dividends and other, excluding bank deposits and payables to brokerage clients interest expense, reflect the elimination of such interest expense as a fixed charge.
(3) The preferred stock dividend and other amounts represent the pre-tax earnings that would be required to pay the dividends on
outstanding preferred stock.

THE CHARLES SCHWAB CORPORATION
EXHIBIT 21.1
Subsidiaries of the Registrant
Pursuant to Item 601 (b)(21)(ii) of Regulation S-K, certain subsidiaries of the Registrant have been omitted which, considered in the aggregate as a single subsidiary, would not constitute a significant subsidiary (as defined in Rule 1-02(w) of Regulation S-X) as of December 31, 2015.
The following is a listing of the significant subsidiaries of the Registrant: Schwab Holdings, Inc. (holding company for Charles Schwab & Co., Inc.), a Delaware corporation Charles Schwab & Co., Inc., a California corporation Charles Schwab Bank, a Federal Savings Association Charles Schwab Investment Management, Inc., a Delaware corporation

THE CHARLES SCHWAB CORPORATION
EXHIBIT 23.1 CONSENT OF INDEPENDENT REGISTERED PUBLIC ACCOUNTING FIRM We consent to the incorporation by reference in the following Registration Statements of our report dated February 24, 2016, relating to the consolidated financial statements and financial statement schedule of The Charles Schwab Corporation and the effectiveness of The Charles Schwab Corporation’s internal control over financial reporting appearing in this Annual Report on Form 10-K of The Charles Schwab Corporation for the year ended December 31, 2015. Filed on Form S-3:
Registration Statement No. 333-200939 (Debt Securities, Preferred Stock, Depositary Shares, Common Stock, Purchase Contracts, Warrants, and Units Consisting of Two or More Securities)
Filed on Form S-8:
Registration Statement No. 333-205862 (The Charles Schwab Corporation 2013 Stock Incentive Plan) Registration Statement No. 333-192893 (The Charles Schwab Corporation Financial Consultant Career
Achievement Award Program)
Registration Statement No. 333-189553 (The Charles Schwab Corporation 2013 Stock Incentive Plan)
Registration Statement No. 333-175862 (The Charles Schwab Corporation 2004 Stock Incentive Plan)
Registration Statement No. 333-173635 (optionsXpress Holdings, Inc. 2008 Equity Incentive Plan, optionsXpress Holdings, Inc. 2005 Equity Incentive Plan, and optionsXpress, Inc. 2001 Equity Incentive Plan)
Registration Statement No. 333-144303 (The Charles Schwab Corporation Employee Stock Purchase Plan)
Registration Statement No. 333-131502 (The Charles Schwab Corporation Deferred Compensation Plan II)
Registration Statement No. 333-101992 (The Charles Schwab Corporation 2004 Stock Incentive Plan)
Registration Statement No. 333-71322 (The SchwabPlan Retirement Savings and Investment Plan)
Registration Statement No. 333-63448 (The Charles Schwab Corporation 2004 Stock Incentive Plan)
Registration Statement No. 333-47107 (The Charles Schwab Corporation 2004 Stock Incentive Plan)
Registration Statement No. 333-44793 (Charles Schwab Profit Sharing and Employee Stock Ownership Plan) /s/ Deloitte & Touche LLP
San Francisco, California February 24, 2016

THE CHARLES SCHWAB CORPORATION
EXHIBIT 31.1
CERTIFICATION PURSUANT TO RULE 13a-14(a)/15d-14(a), AS ADOPTED PURSUANT TO SECTION 302 OF THE SARBANES-OXLEY ACT OF 2002
I, Walter W. Bettinger II, certify that:
1. I have reviewed this Annual Report on Form 10-K of The Charles Schwab Corporation;
2. Based on my knowledge, this report does not contain any untrue statement of a material fact or omit to state a material fact necessary to make the statements made, in light of the circumstances under which such statements were made, not misleading with respect to the period covered by this report;
3. Based on my knowledge, the financial statements, and other financial information included in this report, fairly present in all material respects the financial condition, results of operations and cash flows of the registrant as of, and for, the periods presented in this report;
4. The registrant’s other certifying officer and I are responsible for establishing and maintaining disclosure controls and procedures (as defined in Exchange Act Rules 13a-15(e) and 15d-15(e)) and internal control over financial reporting (as defined in Exchange Act Rules 13a-15(f) and 15d-15(f)) for the registrant and have:
a) Designed such disclosure controls and procedures, or caused such disclosure controls and procedures to be designed under our supervision, to ensure that material information relating to the registrant, including its consolidated subsidiaries, is made known to us by others within those entities, particularly during the period in which this report is being prepared;
b) Designed such internal control over financial reporting, or caused such internal control over financial reporting to be designed under our supervision, to provide reasonable assurance regarding the reliability of financial reporting and the preparation of financial statements for external purposes in accordance with generally accepted accounting principles;
c) Evaluated the effectiveness of the registrant’s disclosure controls and procedures and presented in this report our conclusions about the effectiveness of the disclosure controls and procedures, as of the end of the period covered by this report based on such evaluation; and
d) Disclosed in this report any change in the registrant’s internal control over financial reporting that occurred during the registrant’s most recent fiscal quarter (the registrant’s fourth fiscal quarter in the case of an annual report) that has materially affected, or is reasonably likely to materially affect, the registrant’s internal control over financial reporting; and
5. The registrant’s other certifying officer and I have disclosed, based on our most recent evaluation of internal control over financial reporting, to the registrant’s auditors and the audit committee of registrant’s board of directors (or persons performing the equivalent functions):
a) All significant deficiencies and material weaknesses in the design or operation of internal control over financial reporting which are reasonably likely to adversely affect the registrant’s ability to record, process, summarize and report financial information; and
b) Any fraud, whether or not material, that involves management or other employees who have a significant role in the registrant’s internal control over financial reporting.
Date: February 24, 2016 /s/ Walter W. Bettinger II Walter W. Bettinger II President and Chief Executive Officer
THE CHARLES SCHWAB CORPORATION
EXHIBIT 31.2
CERTIFICATION PURSUANT TO RULE 13a-14(a)/15d-14(a), AS ADOPTED PURSUANT TO SECTION 302 OF THE SARBANES-OXLEY ACT OF 2002
I, Joseph R. Martinetto, certify that:
1. I have reviewed this Annual Report on Form 10-K of The Charles Schwab Corporation;
2. Based on my knowledge, this report does not contain any untrue statement of a material fact or omit to state a material fact necessary to make the statements made, in light of the circumstances under which such statements were made, not misleading with respect to the period covered by this report;
3. Based on my knowledge, the financial statements, and other financial information included in this report, fairly present in all material respects the financial condition, results of operations and cash flows of the registrant as of, and for, the periods presented in this report;
4. The registrant’s other certifying officer and I are responsible for establishing and maintaining disclosure controls and procedures (as defined in Exchange Act Rules 13a-15(e) and 15d-15(e)) and internal control over financial reporting (as defined in Exchange Act Rules 13a-15(f) and 15d-15(f)) for the registrant and have:
a) Designed such disclosure controls and procedures, or caused such disclosure controls and procedures to be designed under our supervision, to ensure that material information relating to the registrant, including its consolidated subsidiaries, is made known to us by others within those entities, particularly during the period in which this report is being prepared;
b) Designed such internal control over financial reporting, or caused such internal control over financial reporting to be designed under our supervision, to provide reasonable assurance regarding the reliability of financial reporting and the preparation of financial statements for external purposes in accordance with generally accepted accounting principles;
c) Evaluated the effectiveness of the registrant’s disclosure controls and procedures and presented in this report our conclusions about the effectiveness of the disclosure controls and procedures, as of the end of the period covered by this report based on such evaluation; and
d) Disclosed in this report any change in the registrant’s internal control over financial reporting that occurred during the registrant’s most recent fiscal quarter (the registrant’s fourth fiscal quarter in the case of an annual report) that has materially affected, or is reasonably likely to materially affect, the registrant’s internal control over financial reporting; and
5. The registrant’s other certifying officer and I have disclosed, based on our most recent evaluation of internal control over financial reporting, to the registrant’s auditors and the audit committee of registrant’s board of directors (or persons performing the equivalent functions):
a) All significant deficiencies and material weaknesses in the design or operation of internal control over financial reporting which are reasonably likely to adversely affect the registrant’s ability to record, process, summarize and report financial information; and
b) Any fraud, whether or not material, that involves management or other employees who have a significant role in the registrant’s internal control over financial reporting.
Date: February 24, 2016 /s/ Joseph R. Martinetto Joseph R. Martinetto Senior Executive Vice President and
Chief Financial Officer
THE CHARLES SCHWAB CORPORATION
EXHIBIT 32.1
CERTIFICATION PURSUANT TO 18 U.S.C. SECTION 1350, AS ADOPTED PURSUANT TO
SECTION 906 OF THE SARBANES-OXLEY ACT OF 2002 In connection with the Annual Report of The Charles Schwab Corporation (the Company) on Form 10-K for the year ended December 31, 2015 (the Report), I, Walter W. Bettinger II, President and Chief Executive Officer of the Company, hereby certify, pursuant to 18 U.S.C. section 1350, as adopted pursuant to section 906 of the Sarbanes-Oxley Act of 2002, that to the best of my knowledge: (1) The Report fully complies with the requirements of section 13(a) or 15(d) of the Securities
Exchange Act of 1934; and (2) The information contained in the Report fairly presents, in all material respects, the financial
condition and results of operations of the Company for the periods presented therein. /s/ Walter W. Bettinger II Date: February 24, 2016
Walter W. Bettinger II President and Chief Executive Officer A signed original of this written statement required by Section 906 has been provided to The Charles Schwab Corporation and will be retained by The Charles Schwab Corporation and furnished to the Securities and Exchange Commission or its staff upon request.
THE CHARLES SCHWAB CORPORATION
EXHIBIT 32.2
CERTIFICATION PURSUANT TO 18 U.S.C. SECTION 1350, AS ADOPTED PURSUANT TO
SECTION 906 OF THE SARBANES-OXLEY ACT OF 2002 In connection with the Annual Report of The Charles Schwab Corporation (the Company) on Form 10-K for the year ended December 31, 2015 (the Report), I, Joseph R. Martinetto, Senior Executive Vice President and Chief Financial Officer of the Company, hereby certify, pursuant to 18 U.S.C. section 1350, as adopted pursuant to section 906 of the Sarbanes-Oxley Act of 2002, that to the best of my knowledge: (1) The Report fully complies with the requirements of section 13(a) or 15(d) of the Securities
Exchange Act of 1934; and (2) The information contained in the Report fairly presents, in all material respects, the financial
condition and results of operations of the Company for the periods presented therein. /s/ Joseph R. Martinetto Date: February 24, 2016 Joseph R. Martinetto Senior Executive Vice President
and Chief Financial Officer A signed original of this written statement required by Section 906 has been provided to The Charles Schwab Corporation and will be retained by The Charles Schwab Corporation and furnished to the Securities and Exchange Commission or its staff upon request.