Characteristics and outcomes of COVID-19 associated stroke ...
U . S . D e p a r t m e n t o f E d u c a t i o n
November 2016
What’s Happening
The characteristics and education outcomes of
American Indian students in grades 6–12 in North Carolina
Sarah Crittenden Fuller Cassandra R. Davis
University of North Carolina at Chapel Hill
Key findings
American Indian students in grades 6–12 in North Carolina lag behind their peers of other races/ethnicities on most education outcomes, in large part because of differences in student demographics and school characteristics between American Indian students and students of other races/ethnicities across the state. American Indian students are much more similar in education outcomes and background characteristics to their peers of other races/ethnicities within the same schools when compared with students in the same school.
At Florida State University
U.S. Department of Education John B. King, Jr., Secretary
Institute of Education Sciences Ruth Neild, Deputy Director for Policy and Research Delegated Duties of the Director
National Center for Education Evaluation and Regional Assistance Joy Lesnick, Acting Commissioner Amy Johnson, Action Editor Sandra Garcia, Project Officer
REL 2017–202
The National Center for Education Evaluation and Regional Assistance (NCEE) conducts unbiased large-scale evaluations of education programs and practices supported by federal funds; provides research-based technical assistance to educators and policymakers; and supports the synthesis and the widespread dissemination of the results of research and evaluation throughout the United States.
November 2016
This report was prepared for the Institute of Education Sciences (IES) under Contract ED-IES-12-C-0011 by Regional Educational Laboratory Southeast administered by the Florida Center for Reading Research, Florida State University. The content of the publication does not necessarily reflect the views or policies of IES or the U.S. Department of Education, nor does mention of trade names, commercial products, or organizations imply endorsement by the U.S. Government.
This REL report is in the public domain. While permission to reprint this publication is not necessary, it should be cited as:
Fuller, S.C., & Davis, C. R. (2016). The characteristics and education outcomes of American Indian students in grades 6–12 in North Carolina (REL 2017–202). Washington, DC: U.S. Department of Education, Institute of Education Sciences, National Center for Education Evaluation and Regional Assistance, Regional Educational Laboratory Southeast. Retrieved from http://ies.ed.gov/ncee/edlabs.
This report is available on the Regional Educational Laboratory website at http://ies.ed.gov/ ncee/edlabs.
Summary
In the 2012/13 school year American Indian students accounted for 1.1 percent of K–12 students nationwide and 1.4 percent of K–12 students in North Carolina (U.S. Department of Education, n.d.). Research has identified substantial achievement gaps between American Indian and other students on national tests, in graduation rates, and in postsecondary attainment (Nelson, Greenough, & Sage, 2009; U.S. Department of Education, 2010, 2011). The gaps highlight the need to examine a broad range of education outcomes and to look for connections between the outcomes and student characteristics, school characteristics, and education resources.
A 2014 report by the North Carolina State Advisory Council on Indian Education identified important achievement gaps between American Indian students and White students. The report found that proficiency rates in all tested subjects and at all grade levels were 25–28 percentage points lower among American Indian students than among White students and that large disparities also existed in dropout rates, graduation rates, Advanced Placement coursetaking, and SAT performance (State Advisory Committee on Indian Education, 2014).
The current study was conducted in response to a request from the council to compare student and school characteristics and education outcomes of American Indian students in grades 6–12 in North Carolina with those of non–American Indian students within the state. The study has two comparison groups. One group is composed of all non-American Indian students enrolled in the same grades in the same schools attended by American Indian students during the same years (referred to as within-school peers)—in short, the non–American Indian students at the schools that have American Indian enrollments. The other group is composed of all non–American Indian students enrolled in the same grades as American Indian students in any school in North Carolina during the same years (referred to as statewide peers).
Although within-school peers are more similar to American Indian students in many respects, comparing only students within the same schools hides important differences across schools. By using both within-school and statewide comparisons of student demographic characteristics, school characteristics, and education outcomes (including standardized test scores, absenteeism, grade retention, suspensions, advanced coursetaking, and four-year graduation rates), this report provides a more complete picture of the differences between American Indian students and their peers. This study also examines teacher quality in schools attended by American Indian students in grades 6–12 in North Carolina.
The primary analyses used administrative data for school years 2010/11–2013/14 collected and provided by the North Carolina Department of Public Instruction.
The key findings of this study, organized into three categories, are as follows: • Student and school characteristics.
American Indian students’ average characteristics differ from those of their statewide peers. The percentage of students receiving free or reduced-price lunch (a proxy for economically disadvantaged status) and the percentage of students with a disability were higher among American Indian students than
•
i

among their statewide peers, and the percentage of students who were identified as academically or intellectually gifted was lower among American Indian students than among their statewide peers.
• American Indian students and their within-school peers have more similar average characteristics than American Indian students and their statewide peers. The percentage of students receiving free or reduced-price lunch and the percentage of students with any identified disability were higher among both American Indian students and their within-school peers than among their statewide peers, and the percentage of students identified as academically and intellectually gifted was lower among American Indian students and their within-school peers than among their statewide peers.
• The average characteristics (region, urbanicity, and student demographic characteristics) of schools that American Indian students attend differ from the average characteristics of schools that non–American Indian students attend. American Indian students are more likely to attend rural schools, schools in the Coastal Plain, and schools with a large number of economically disadvantaged students.
• Student outcomes. • Average scores on all middle school and high school standardized tests exam
ined in the study are lower among American Indian students than among their within-school and statewide peers. American Indian students’ scores are more similar to—but still lower than—those of their within-school peers in nearly all subjects and grades.
• On average, compared with their within-school and statewide peers, American Indian students are absent for more days and have lower advanced course-taking rates and graduation rates. But all three groups have similar grade retention rates.
• Suspension rates are higher for American Indian students than for their statewide peers, and American Indian students who are suspended are suspended more frequently and for more days on average. Suspension rates are similar among American Indian students and their within–school peers.
• Holding school and student demographic characteristics constant substantially reduces the size of the gaps in most outcomes between American Indian students and their within-school and statewide peers.
• School resources. • Teachers of American Indian students have lower average value-added scores,
which represent the teachers’ contribution to students’ academic growth. They also have lower average licensure test scores and lower rates of certification by the National Board for Professional Teaching Standards than do other teachers at the same grade levels. But teachers of American Indian students are similar to other teachers in evaluations conducted by principals, advanced test scores, and experience.
ii
Contents
Summary i
Why this study? 1
What the study examined 3
What the study found 5 American Indian students in North Carolina are heavily concentrated in a small number of
districts 5 The percentage of students receiving free or reduced price lunch is higher among American
Indian students than among their statewide peers and in schools attended by American Indian students than in schools attended by their statewide peers 5
American Indian students lag behind their peers on many education outcomes 7 Differences in student and school characteristics explain much of the disparity in education
outcomes between American Indian students and their statewide peers 9 Availability of education resources—notably teacher quality—may influence the gap in
academic outcomes between American Indian students and their within-school and statewide peers 12
Implications of the study findings 12
Limitations of the study 12
Appendix A. Previous research on the education outcomes and characteristics of American Indian students A-1
Appendix B. Data and methodology B-1
Appendix C. Detailed quantitative results C-1
Note Notes-1
References Ref-1
Boxes 1 Key terms 2 2 Data and methods 4 3 Effect sizes 8
Figures 1 The percentage of American Indian students varies substantially across the 17 districts
in North Carolina that received funding through the federal Indian Education Program, 2013/14 5
2 American Indian students in North Carolina score substantially below the statewide average on state standardized tests, 2013/14 9
iii

3 Differences in standardized test scores between American Indians and their statewide peers in North Carolina are partially explained by differences in student and school characteristics, 2013/14 10
4 Differences in nontest education outcomes between American Indian students and their statewide peers in North Carolina are reduced when student and school characteristics are accounted for, 2013/14 11
C1 Percentage of American Indian students in grades 6–12 in North Carolina receiving free or reduced-price lunch and within-school and districtwide comparisons, by tribe, 2013/14 C-3
C2 Percentage of American Indian students in grades 6–12 in North Carolina identified as academically or intellectually gifted and within-school and districtwide comparisons, by tribe, 2013/14 school year C-4
C3 Average percentage of students receiving free or reduced-price lunch in schools attended by American Indian students in grades 6–12 in North Carolina and districtwide comparison, by district, 2013/14 C-4
C4 Percentage of American Indian students in grades 6–12 in North Carolina ever suspended and within-school and districtwide comparisons, by tribe, 2013/14 C-5
C5 Cohort graduation rate for American Indian students in North Carolina and within-school and districtwide comparisons, by tribe, 2013/14 C-5
Tables 1 Demographic characteristics of American Indian students and their within-school and
statewide peers, 2013/14 6 2 Average characteristics of schools attended by American Indian students and schools
attended by non–American Indian students in North Carolina, 2013/14 7 3 American Indian students in North Carolina lag behind their peers on many nontest
education outcomes, 2013/14 10 C1 Average performance on standardized tests among American Indian students and
non–American Indian students in North Carolina within the same schools and statewide, 2013/14 C-1
C2 Measures of access to high-quality teachers between American Indian students and non–American Indian students within the same schools and statewide in grades 6–12 in North Carolina, 2013/14 C-1
C3 Regression analyses of differences between American Indian students and their statewide peers in grades 6–12 in North Carolina, 2010/11–2013/14 C-2
iv

Why this study?
In the 2012/13 school year American Indian students accounted for 1.1 percent of K–12 students nationwide and 1.4 percent of North Carolina elementary and secondary school students (U.S. Department of Education, n.d.). Research has identified substantial achievement gaps between American Indian and other students on national tests, in graduation rates, and in postsecondary attainment (Nelson et al., 2009; U.S. Department of Education, 2010, 2011). The gaps highlight the need to examine a broad range of education outcomes and to look for connections between the outcomes and student demographic characteristics, school characteristics, and education resources.
A 2014 report by the North Carolina State Advisory Council on Indian Education identified important achievement gaps between American Indian students and White students. The report found that proficiency rates in all tested subjects and at all grade levels were 25–28 percentage points lower among American Indian students than among White students and that large disparities also existed in dropout rates, graduation rates, Advanced Placement coursetaking, and SAT performance (State Advisory Committee on Indian Education, 2014).
The current study was conducted in response to a request from the advisory council to compare the student and school characteristics and education outcomes of American Indian students in grades 6–12 in North Carolina with those of non–American Indian students within the state. The study has two comparison groups. One group is composed of all non–American Indian students enrolled in the same grades in the same schools attended by American Indian students during the same years (referred to as within-school peers). The other group is composed of all non–American Indian students enrolled in the same grades as American Indian students in any school in North Carolina during the same years (referred to as statewide peers).
This report documents the demographic characteristics, education outcomes, and school experiences of the approximately 11,000 American Indian students who were enrolled in middle or high school in North Carolina public schools each school year from 2010/11 through 2013/14.
High school graduation and standardized test scores are important outcomes, but several nontest education outcomes are also associated with longer term education outcomes. Absences, grade retention, and suspensions can signal a lack of student engagement that may be related to higher dropout rates and poorer future achievement (Finn & Zimmer, 2012; Goodman, 2014; Gottfried, 2011; Henry, Knight, & Thornberry, 2012). Advanced coursetaking is associated with higher achievement and a higher likelihood of four-year college attendance (Aughinbaugh, 2012; Domina, 2014; Long, Conger, & Iaterola, 2012). Given that these nontest outcomes predict ultimate educational attainment, they may be at least as important as test scores.
An advantage to comparing American Indian students with other students within the same school is that the comparison students are likely to be more similar in demographic characteristics and schooling experiences. However, within-school comparison may hide important areas in which American Indian students lag behind other students in the state (see box 1 for definitions of key terms used in the report). Therefore, both comparisons
This report documents the demographic characteristics, education outcomes, and school experiences of the approximately 11,000 American Indian students who were enrolled in middle or high school in North Carolina public schools each school year from 2010/11 through 2013/14
1
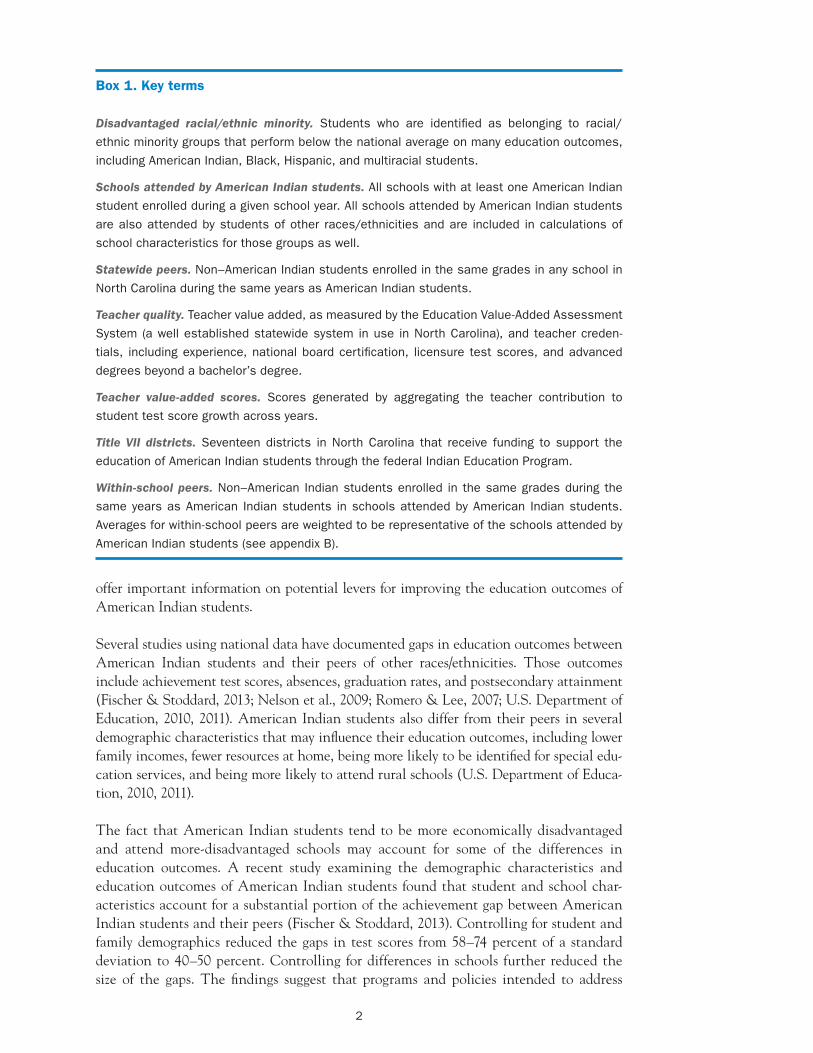
Box 1. Key terms
Disadvantaged racial/ethnic minority. Students who are identified as belonging to racial/
ethnic minority groups that perform below the national average on many education outcomes,
including American Indian, Black, Hispanic, and multiracial students.
Schools attended by American Indian students. All schools with at least one American Indian
student enrolled during a given school year. All schools attended by American Indian students
are also attended by students of other races/ethnicities and are included in calculations of
school characteristics for those groups as well.
Statewide peers. Non–American Indian students enrolled in the same grades in any school in
North Carolina during the same years as American Indian students.
Teacher quality. Teacher value added, as measured by the Education Value-Added Assessment
System (a well established statewide system in use in North Carolina), and teacher creden
tials, including experience, national board certification, licensure test scores, and advanced
degrees beyond a bachelor’s degree.
Teacher value-added scores. Scores generated by aggregating the teacher contribution to
student test score growth across years.
Title VII districts. Seventeen districts in North Carolina that receive funding to support the
education of American Indian students through the federal Indian Education Program.
Within-school peers. Non–American Indian students enrolled in the same grades during the
same years as American Indian students in schools attended by American Indian students.
Averages for within-school peers are weighted to be representative of the schools attended by
American Indian students (see appendix B).
offer important information on potential levers for improving the education outcomes of American Indian students.
Several studies using national data have documented gaps in education outcomes between American Indian students and their peers of other races/ethnicities. Those outcomes include achievement test scores, absences, graduation rates, and postsecondary attainment (Fischer & Stoddard, 2013; Nelson et al., 2009; Romero & Lee, 2007; U.S. Department of Education, 2010, 2011). American Indian students also differ from their peers in several demographic characteristics that may influence their education outcomes, including lower family incomes, fewer resources at home, being more likely to be identified for special education services, and being more likely to attend rural schools (U.S. Department of Education, 2010, 2011).
The fact that American Indian students tend to be more economically disadvantaged and attend more-disadvantaged schools may account for some of the differences in education outcomes. A recent study examining the demographic characteristics and education outcomes of American Indian students found that student and school characteristics account for a substantial portion of the achievement gap between American Indian students and their peers (Fischer & Stoddard, 2013). Controlling for student and family demographics reduced the gaps in test scores from 58–74 percent of a standard deviation to 40–50 percent. Controlling for differences in schools further reduced the size of the gaps. The findings suggest that programs and policies intended to address
2
problems related to poverty and rural schooling may help improve achievement among American Indian students (Demmert, 2001; Demmert, Grissmer, & Towner, 2006; Fischer & Stoddard, 2013).
Although previous studies of American Indian students suggest possible opportunities for improved performance, most research has been limited by small sample sizes and a focus on specific tribes (Demmert et al., 2006). Conversely, most large studies, such as national reports produced by federal agencies, have not explored the relationship between American Indian race/ethnicity and specific school contexts (or other student-level characteristics). Only one study has examined the extent to which student and school characteristics are related to achievement gaps for American Indian students, and that study was based only on national achievement test scores (Fischer and Stoddard, 2013). For a more detailed review of previous research, see appendix A.
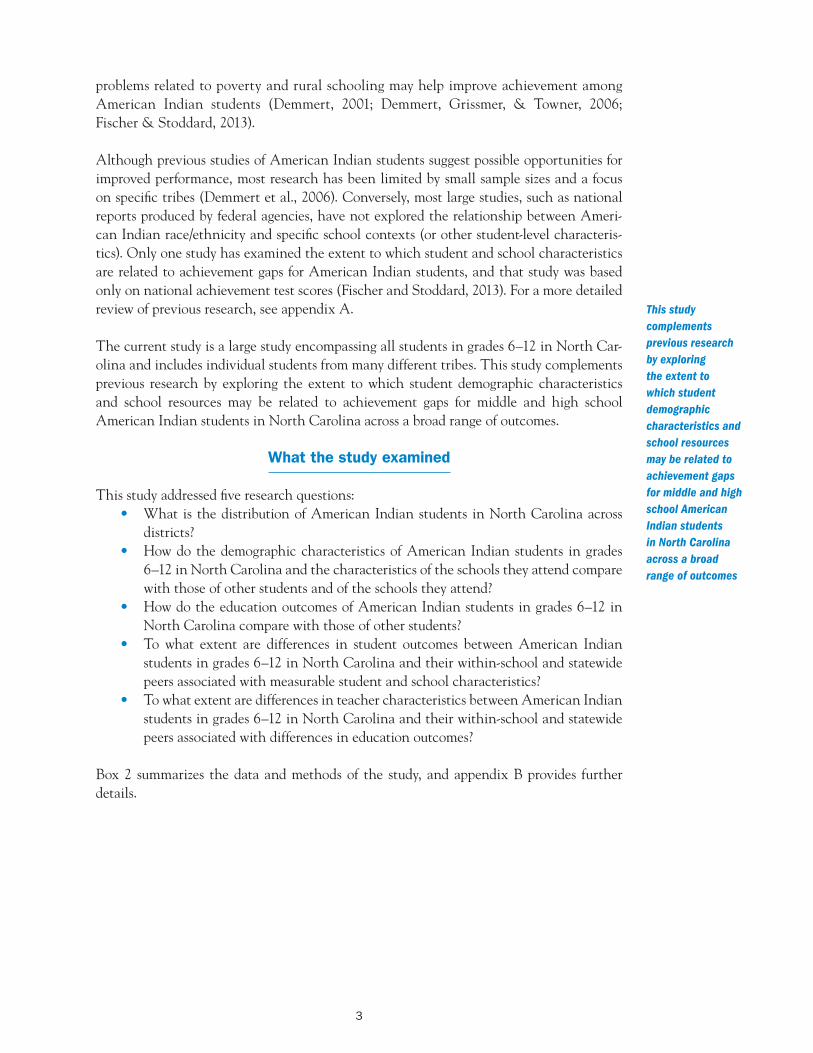
The current study is a large study encompassing all students in grades 6–12 in North Carolina and includes individual students from many different tribes. This study complements previous research by exploring the extent to which student demographic characteristics and school resources may be related to achievement gaps for middle and high school American Indian students in North Carolina across a broad range of outcomes.
What the study examined
This study addressed five research questions: • What is the distribution of American Indian students in North Carolina across
districts? • How do the demographic characteristics of American Indian students in grades
6–12 in North Carolina and the characteristics of the schools they attend compare with those of other students and of the schools they attend?
• How do the education outcomes of American Indian students in grades 6–12 in North Carolina compare with those of other students?
• To what extent are differences in student outcomes between American Indian students in grades 6–12 in North Carolina and their within-school and statewide peers associated with measurable student and school characteristics?
• To what extent are differences in teacher characteristics between American Indian students in grades 6–12 in North Carolina and their within-school and statewide peers associated with differences in education outcomes?
Box 2 summarizes the data and methods of the study, and appendix B provides further details.
This study complements previous research by exploring the extent to which student demographic characteristics and school resources may be related to achievement gaps for middle and high school American Indian students in North Carolina across a broad range of outcomes
3
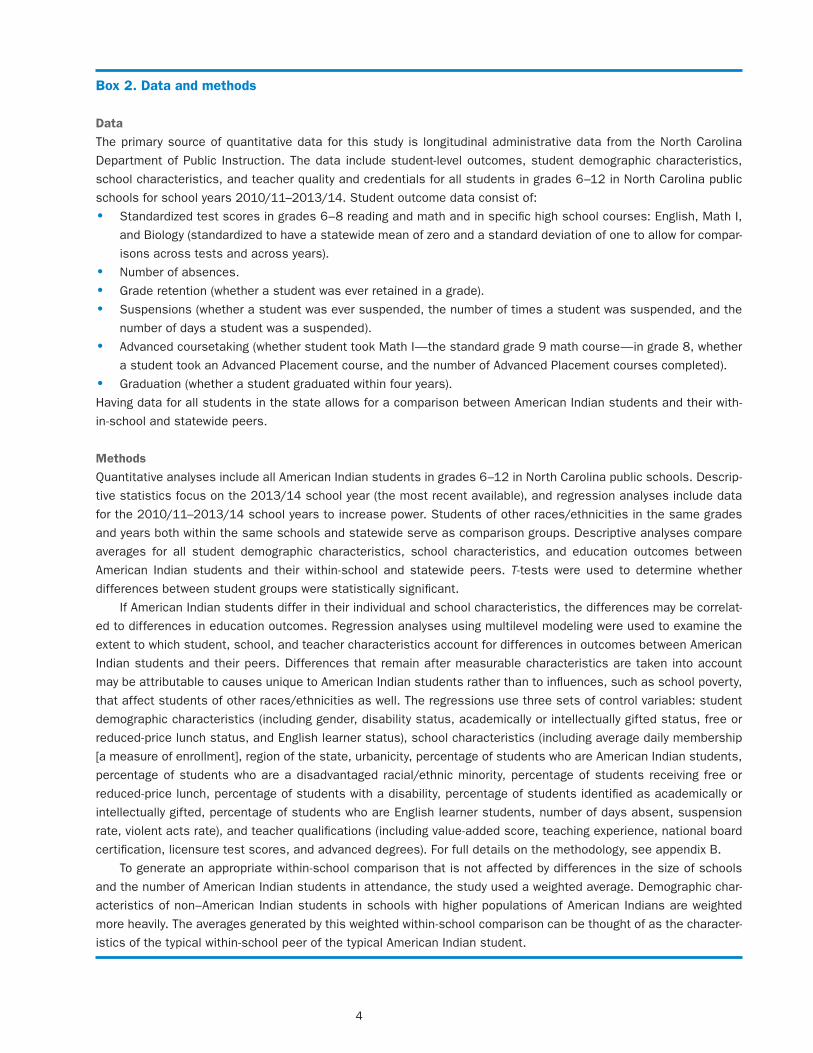
Box 2. Data and methods
Data The primary source of quantitative data for this study is longitudinal administrative data from the North Carolina
Department of Public Instruction. The data include student-level outcomes, student demographic characteristics,
school characteristics, and teacher quality and credentials for all students in grades 6–12 in North Carolina public
schools for school years 2010/11–2013/14. Student outcome data consist of:
• Standardized test scores in grades 6–8 reading and math and in specific high school courses: English, Math I,
and Biology (standardized to have a statewide mean of zero and a standard deviation of one to allow for compar
isons across tests and across years).
• Number of absences.
• Grade retention (whether a student was ever retained in a grade).
• Suspensions (whether a student was ever suspended, the number of times a student was suspended, and the
number of days a student was a suspended).
• Advanced coursetaking (whether student took Math I—the standard grade 9 math course—in grade 8, whether
a student took an Advanced Placement course, and the number of Advanced Placement courses completed).
• Graduation (whether a student graduated within four years).
Having data for all students in the state allows for a comparison between American Indian students and their with
in-school and statewide peers.
Methods Quantitative analyses include all American Indian students in grades 6–12 in North Carolina public schools. Descrip
tive statistics focus on the 2013/14 school year (the most recent available), and regression analyses include data
for the 2010/11–2013/14 school years to increase power. Students of other races/ethnicities in the same grades
and years both within the same schools and statewide serve as comparison groups. Descriptive analyses compare
averages for all student demographic characteristics, school characteristics, and education outcomes between
American Indian students and their within-school and statewide peers. T-tests were used to determine whether
differences between student groups were statistically significant.
If American Indian students differ in their individual and school characteristics, the differences may be correlat
ed to differences in education outcomes. Regression analyses using multilevel modeling were used to examine the
extent to which student, school, and teacher characteristics account for differences in outcomes between American
Indian students and their peers. Differences that remain after measurable characteristics are taken into account
may be attributable to causes unique to American Indian students rather than to influences, such as school poverty,
that affect students of other races/ethnicities as well. The regressions use three sets of control variables: student
demographic characteristics (including gender, disability status, academically or intellectually gifted status, free or
reduced-price lunch status, and English learner status), school characteristics (including average daily membership
[a measure of enrollment], region of the state, urbanicity, percentage of students who are American Indian students,
percentage of students who are a disadvantaged racial/ethnic minority, percentage of students receiving free or
reduced-price lunch, percentage of students with a disability, percentage of students identified as academically or
intellectually gifted, percentage of students who are English learner students, number of days absent, suspension
rate, violent acts rate), and teacher qualifications (including value-added score, teaching experience, national board
certification, licensure test scores, and advanced degrees). For full details on the methodology, see appendix B.
To generate an appropriate within-school comparison that is not affected by differences in the size of schools
and the number of American Indian students in attendance, the study used a weighted average. Demographic char
acteristics of non–American Indian students in schools with higher populations of American Indians are weighted
more heavily. The averages generated by this weighted within-school comparison can be thought of as the character
istics of the typical within-school peer of the typical American Indian student.
4
What the study found
This section presents the findings related to each research question.
American Indian students in North Carolina are heavily concentrated in a small number of districts
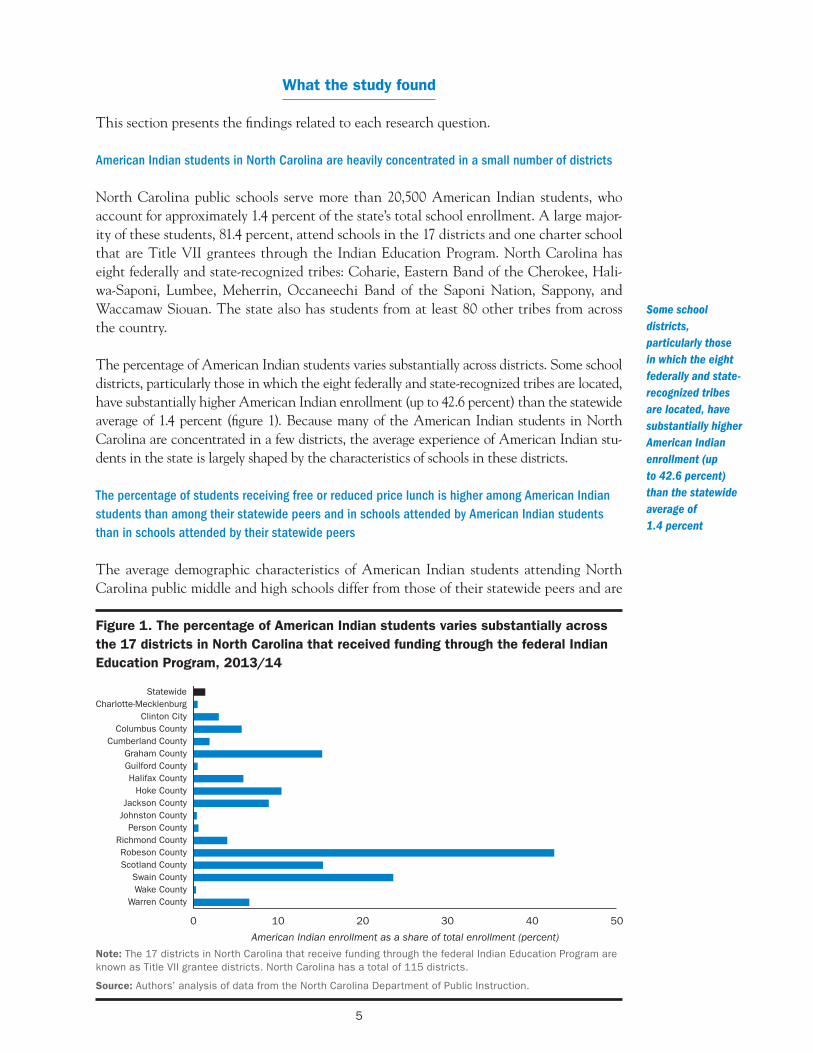
North Carolina public schools serve more than 20,500 American Indian students, who account for approximately 1.4 percent of the state’s total school enrollment. A large majority of these students, 81.4 percent, attend schools in the 17 districts and one charter school that are Title VII grantees through the Indian Education Program. North Carolina has eight federally and state-recognized tribes: Coharie, Eastern Band of the Cherokee, Haliwa-Saponi, Lumbee, Meherrin, Occaneechi Band of the Saponi Nation, Sappony, and Waccamaw Siouan. The state also has students from at least 80 other tribes from across the country.
The percentage of American Indian students varies substantially across districts. Some school districts, particularly those in which the eight federally and state-recognized tribes are located, have substantially higher American Indian enrollment (up to 42.6 percent) than the statewide average of 1.4 percent (figure 1). Because many of the American Indian students in North Carolina are concentrated in a few districts, the average experience of American Indian students in the state is largely shaped by the characteristics of schools in these districts.
The percentage of students receiving free or reduced price lunch is higher among American Indian students than among their statewide peers and in schools attended by American Indian students than in schools attended by their statewide peers
The average demographic characteristics of American Indian students attending North Carolina public middle and high schools differ from those of their statewide peers and are
Figure 1. The percentage of American Indian students varies substantially across the 17 districts in North Carolina that received funding through the federal Indian Education Program, 2013/14
Statewide Charlotte-Mecklenburg
Clinton City Columbus County
Cumberland County Graham County Guilford County Halifax County
Hoke County Jackson County
Johnston County Person County
Richmond County Robeson County Scotland County
Swain County Wake County
Warren County
Some school districts, particularly those in which the eight federally and state-recognized tribes are located, have substantially higher American Indian enrollment (up to 42.6 percent) than the statewide average of 1.4 percent
0 10 20 30 40 50
American Indian enrollment as a share of total enrollment (percent)
Note: The 17 districts in North Carolina that receive funding through the federal Indian Education Program are known as Title VII grantee districts. North Carolina has a total of 115 districts.
Source: Authors’ analysis of data from the North Carolina Department of Public Instruction.
5
-
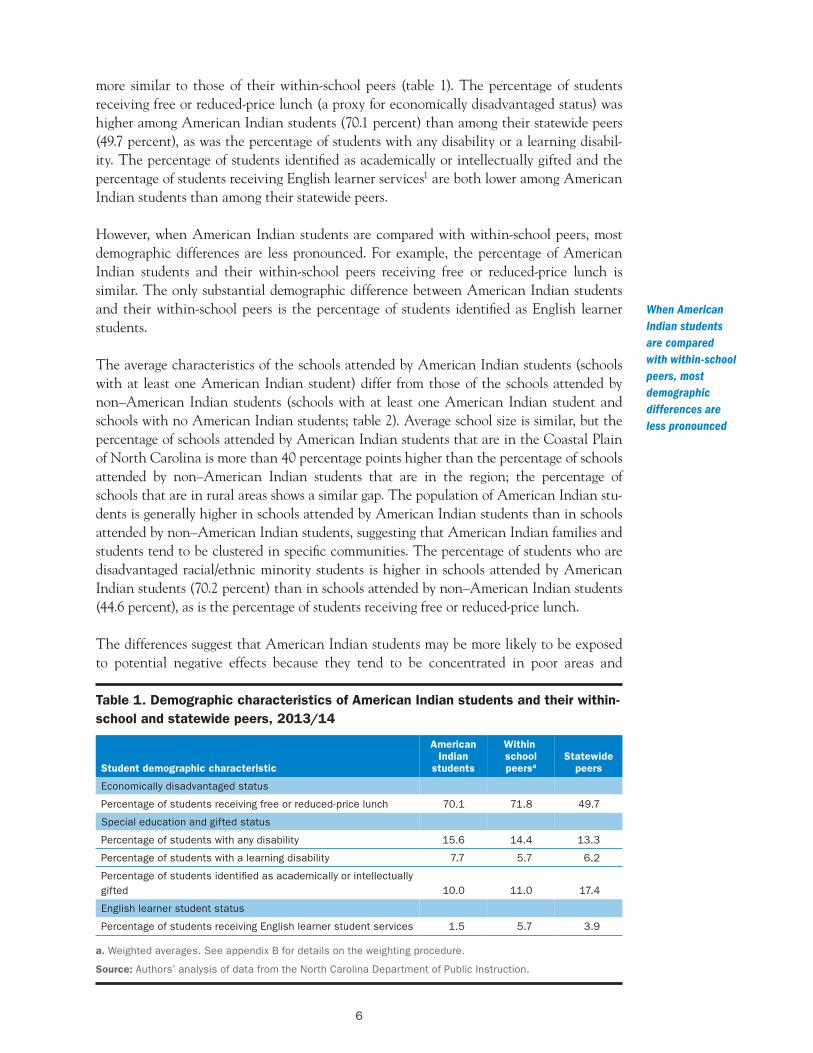
more similar to those of their within-school peers (table 1). The percentage of students receiving free or reduced-price lunch (a proxy for economically disadvantaged status) was higher among American Indian students (70.1 percent) than among their statewide peers (49.7 percent), as was the percentage of students with any disability or a learning disability. The percentage of students identified as academically or intellectually gifted and the percentage of students receiving English learner services1 are both lower among American Indian students than among their statewide peers.
However, when American Indian students are compared with within-school peers, most demographic differences are less pronounced. For example, the percentage of American Indian students and their within-school peers receiving free or reduced-price lunch is similar. The only substantial demographic difference between American Indian students and their within-school peers is the percentage of students identified as English learner students.
The average characteristics of the schools attended by American Indian students (schools with at least one American Indian student) differ from those of the schools attended by non–American Indian students (schools with at least one American Indian student and schools with no American Indian students; table 2). Average school size is similar, but the percentage of schools attended by American Indian students that are in the Coastal Plain of North Carolina is more than 40 percentage points higher than the percentage of schools attended by non–American Indian students that are in the region; the percentage of schools that are in rural areas shows a similar gap. The population of American Indian students is generally higher in schools attended by American Indian students than in schools attended by non–American Indian students, suggesting that American Indian families and students tend to be clustered in specific communities. The percentage of students who are disadvantaged racial/ethnic minority students is higher in schools attended by American Indian students (70.2 percent) than in schools attended by non–American Indian students (44.6 percent), as is the percentage of students receiving free or reduced-price lunch.
The differences suggest that American Indian students may be more likely to be exposed to potential negative effects because they tend to be concentrated in poor areas and
Table 1. Demographic characteristics of American Indian students and their within-school and statewide peers, 2013/14
When American Indian students are compared with within-school peers, most demographic differences are less pronounced
Student demographic characteristic
American Indian
students
Within school peersa
Statewide peers
Economically disadvantaged status
Percentage of students receiving free or reduced-price lunch 70.1 71.8 49.7
Special education and gifted status
Percentage of students with any disability 15.6 14.4 13.3
Percentage of students with a learning disability 7.7 5.7 6.2
Percentage of students identified as academically or intellectually gifted 10.0 11.0 17.4
English learner student status
Percentage of students receiving English learner student services 1.5 5.7 3.9
a. Weighted averages. See appendix B for details on the weighting procedure.
Source: Authors’ analysis of data from the North Carolina Department of Public Instruction.
6

–
Table 2. Average characteristics of schools attended by American Indian students and schools attended by non–American Indian students in North Carolina, 2013/14
School characteristic
American Indian
students
Non American Indian
students
Enrollment 1,018.0 1,042.0
Region (percent of schools)
Mountain 7.5 10.8
Piedmont 19.7 61.4
Coastal Plain 72.8 27.8
Urbanicity (percent of schools)
City 16.2 39.1
Suburban 1.9 7.8 American Indian
Town 13.2 6.8 students may be
Percentage of students who are American Indian students 32.2 1.0 potential negative Percentage of students who are disadvantaged racial/ethnic minority studentsa 70.2 44.6 effects because
more likely to be exposed to
Rural 68.7 46.3
School demographic characteristics
they tend to be Economically disadvantaged status
Percentage of students receiving free or reduced-price lunch 70.7 52.1 concentrated in poor areas and Disability and gifted status surrounded by Percentage of students with a disability 14.1 13.4 classmates who Percentage of students identified as academically or intellectually gifted 12.3 17.3 struggle in school
English learner status
Percentage of students receiving English learner student services 2.8 3.9
Absenteeism
Number of days absent 9.2 7.2
School safety
Short-term suspension rate (per 100 students) 36.0 20.5
Violent acts rate (per 1,000 students) 13.1 11.5
Note: Average school characteristics are calculated at the student level. Schools enrolling both American Indian and non–American Indian students are included in both columns, and schools with more students are weighted more heavily.
a. Students whose race/ethnicity is identified as American Indian, Black, Hispanic, or multiracial.
Source: Authors’ analysis of data from the North Carolina Department of Public Instruction.
surrounded by classmates who struggle in school. Schools attended by American Indian students have a lower percentage of students identified as academically and intellectually gifted than do schools attended by non–American Indian students but a higher number of absentee days and higher rates of short-term suspension and violent acts.
American Indian students lag behind their peers on many education outcomes
The differences in student demographic characteristics and school characteristics are important factors to consider when comparing education outcomes of American Indian students and their peers. For example, research suggests that students and schools with higher poverty rates have lower academic outcomes (Caldas & Bankston, 1997; Jacob & Ludwig, 2008; Murnane, 2007; Rumberger & Palardy, 2005; Sirin, 2005). See box 3 for information on how effect sizes are characterized in this report.
7
-
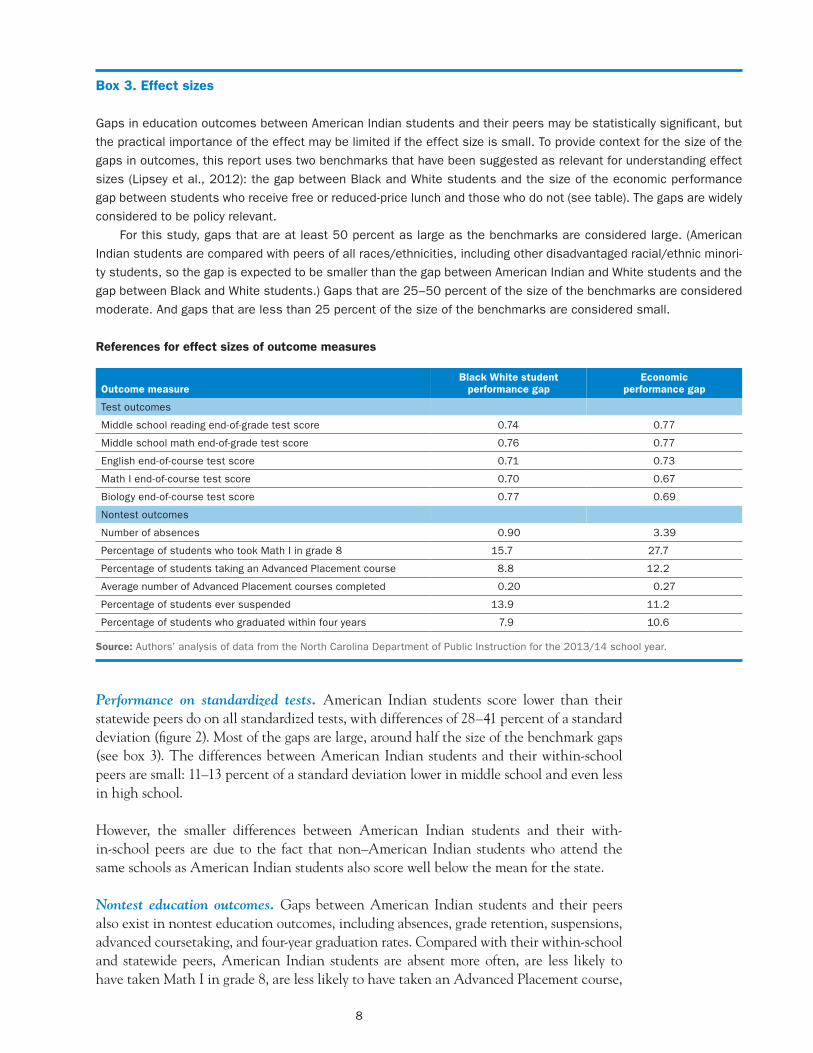
Box 3. Effect sizes
Gaps in education outcomes between American Indian students and their peers may be statistically significant, but
the practical importance of the effect may be limited if the effect size is small. To provide context for the size of the
gaps in outcomes, this report uses two benchmarks that have been suggested as relevant for understanding effect
sizes (Lipsey et al., 2012): the gap between Black and White students and the size of the economic performance
gap between students who receive free or reduced-price lunch and those who do not (see table). The gaps are widely
considered to be policy relevant.
For this study, gaps that are at least 50 percent as large as the benchmarks are considered large. (American
Indian students are compared with peers of all races/ethnicities, including other disadvantaged racial/ethnic minori
ty students, so the gap is expected to be smaller than the gap between American Indian and White students and the
gap between Black and White students.) Gaps that are 25–50 percent of the size of the benchmarks are considered
moderate. And gaps that are less than 25 percent of the size of the benchmarks are considered small.
References for effect sizes of outcome measures
Outcome measure Black White student
performance gap Economic
performance gap
Test outcomes
Middle school reading end-of-grade test score 0.74 0.77
Middle school math end-of-grade test score
English end-of-course test score
0.76
0.71
0.77
0.73
Math I end-of-course test score 0.70 0.67
Number of absences 0.90 3.39
Percentage of students who took Math I in grade 8 15.7 27.7
Biology end-of-course test score 0.77 0.69
Nontest outcomes
Percentage of students taking an Advanced Placement course 8.8 12.2
Average number of Advanced Placement courses completed 0.20 0.27
Percentage of students ever suspended 13.9 11.2
Percentage of students who graduated within four years 7.9 10.6
Source: Authors’ analysis of data from the North Carolina Department of Public Instruction for the 2013/14 school year.
Performance on standardized tests. American Indian students score lower than their statewide peers do on all standardized tests, with differences of 28–41 percent of a standard deviation (figure 2). Most of the gaps are large, around half the size of the benchmark gaps (see box 3). The differences between American Indian students and their within-school peers are small: 11–13 percent of a standard deviation lower in middle school and even less in high school.
However, the smaller differences between American Indian students and their within-school peers are due to the fact that non–American Indian students who attend the same schools as American Indian students also score well below the mean for the state.
Nontest education outcomes. Gaps between American Indian students and their peers also exist in nontest education outcomes, including absences, grade retention, suspensions, advanced coursetaking, and four-year graduation rates. Compared with their within-school and statewide peers, American Indian students are absent more often, are less likely to have taken Math I in grade 8, are less likely to have taken an Advanced Placement course,
8

Figure 2. American Indian students in North Carolina score substantially below the statewide average on state standardized tests, 2013/14
Difference from statewide average (standard deviations)
American Indian Within-school peersa Statewide peers 0.1
0.0
–0.1
–0.2
–0.3
–0.4
–0.5 Reading Math English Math Biology
Middle school High school
a. Weighted averages. See appendix B for details on the weighting procedure.
Source: Authors’ analysis of data from the North Carolina Department of Public Instruction.
American Indian students score lower than their statewide peers do on all standardized tests, but the differences are smaller between American Indian students and their within-school peers
and complete fewer Advanced Placement courses (table 3). American Indian students are more likely than their statewide peers to have been suspended, and among students who are suspended, American Indian students are suspended more frequently and for more days. American Indian students and their within-school peers are suspended at similar rates. The differences in these outcomes between American Indian students and their statewide peers are large and could lead to lower long-term educational attainment.
It is thus unsurprising that the four-year graduation rate is lower for American Indian students than for their within-school and statewide peers. The difference in graduation rates between American Indian students and their within-school peers—approximately 4 percentage points—is classified as medium (see box 3).
Differences in student and school characteristics explain much of the disparity in education outcomes between American Indian students and their statewide peers
The differences in student test scores between American Indian students and their statewide peers are significantly smaller once student and school characteristics are taken into account (figure 3; see appendix B for a description of the methodological approach used). The reduction in the size of the gaps shows that the differences in these characteristics between American Indian students and their statewide peers are related to the differences in education outcomes. For example, low-income students on average have lower test scores than higher income students do, and American Indian students are more likely to be low-income; therefore, the difference in average income level explains a portion of the gap in test scores between American Indian students and their peers.
9
-
0.0
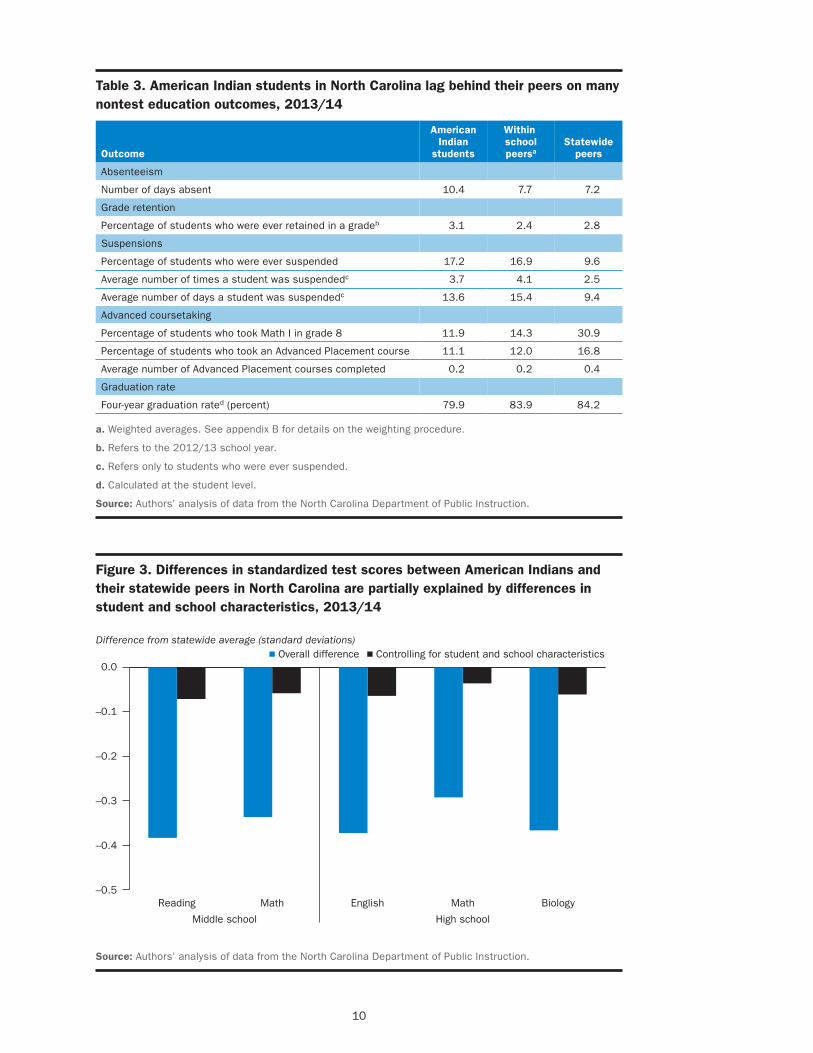
Table 3. American Indian students in North Carolina lag behind their peers on many nontest education outcomes, 2013/14
Outcome
American Indian
students
Within school peersa
Statewide peers
Absenteeism
Number of days absent 10.4 7.7 7.2
Grade retention
Percentage of students who were ever retained in a gradeb 3.1 2.4 2.8
Suspensions
Percentage of students who were ever suspended 17.2 16.9 9.6
Average number of times a student was suspendedc 3.7 4.1 2.5
Average number of days a student was suspendedc 13.6 15.4 9.4
Percentage of students who took Math I in grade 8 11.9 14.3 30.9
Advanced coursetaking
Percentage of students who took an Advanced Placement course 11.1 12.0 16.8
Average number of Advanced Placement courses completed 0.2 0.2 0.4
Four-year graduation rated (percent) 79.9 83.9 84.2
Graduation rate
a. Weighted averages. See appendix B for details on the weighting procedure.
b. Refers to the 2012/13 school year.
c. Refers only to students who were ever suspended.
d. Calculated at the student level.
Source: Authors’ analysis of data from the North Carolina Department of Public Instruction.
Figure 3. Differences in standardized test scores between American Indians and their statewide peers in North Carolina are partially explained by differences in student and school characteristics, 2013/14
Difference from statewide average (standard deviations) Overall difference Controlling for student and school characteristics
–0.1
–0.2
–0.3
–0.4
–0.5 Reading Math English Math Biology
Middle school High school
Source: Authors’ analysis of data from the North Carolina Department of Public Instruction.
10
Student demographic characteristics explain 40–58 percent of the gap in test scores, and school characteristics explain 25–43 percent. These magnitudes are similar to those found by Fischer and Stoddard (2013). Altogether these characteristics explain 82–88 percent of the gaps in test scores. The remaining differences in test scores are only one-fifth to one-sixth the size of the initial differences.
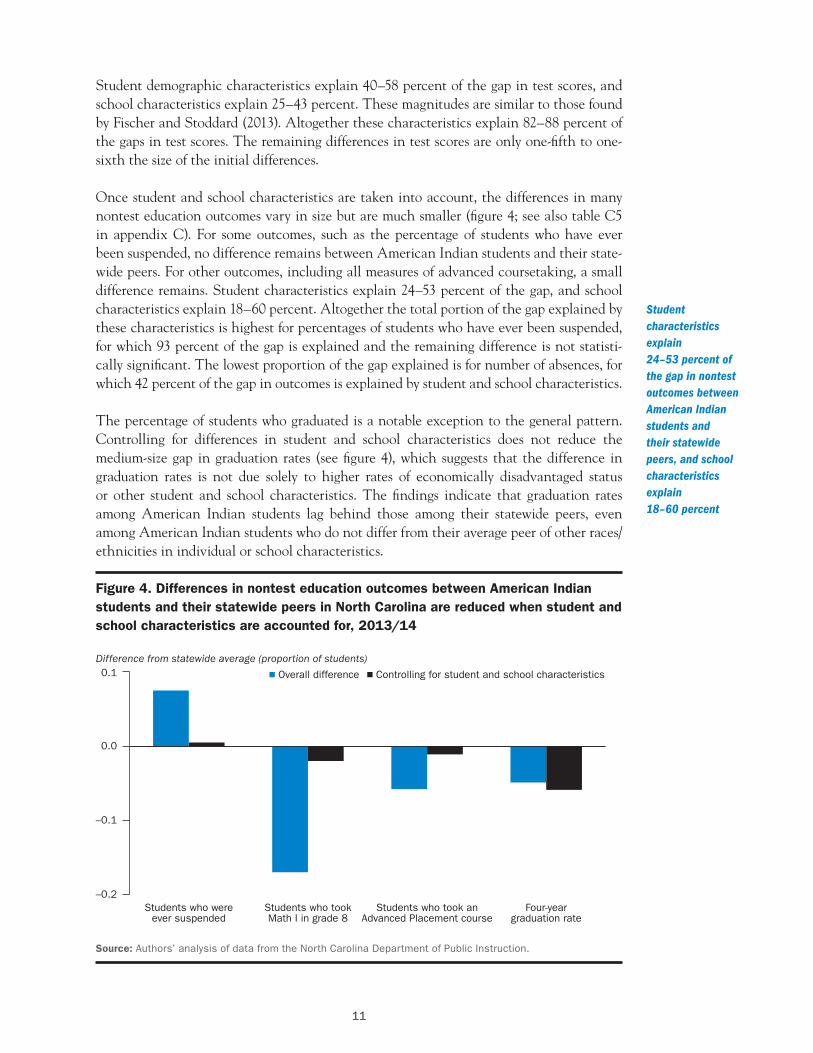
Once student and school characteristics are taken into account, the differences in many nontest education outcomes vary in size but are much smaller (figure 4; see also table C5 in appendix C). For some outcomes, such as the percentage of students who have ever been suspended, no difference remains between American Indian students and their statewide peers. For other outcomes, including all measures of advanced coursetaking, a small difference remains. Student characteristics explain 24–53 percent of the gap, and school characteristics explain 18–60 percent. Altogether the total portion of the gap explained by these characteristics is highest for percentages of students who have ever been suspended, for which 93 percent of the gap is explained and the remaining difference is not statistically significant. The lowest proportion of the gap explained is for number of absences, for which 42 percent of the gap in outcomes is explained by student and school characteristics.
The percentage of students who graduated is a notable exception to the general pattern. Controlling for differences in student and school characteristics does not reduce the medium-size gap in graduation rates (see figure 4), which suggests that the difference in graduation rates is not due solely to higher rates of economically disadvantaged status or other student and school characteristics. The findings indicate that graduation rates among American Indian students lag behind those among their statewide peers, even among American Indian students who do not differ from their average peer of other races/ ethnicities in individual or school characteristics.
Figure 4. Differences in nontest education outcomes between American Indian students and their statewide peers in North Carolina are reduced when student and school characteristics are accounted for, 2013/14
Difference from statewide average (proportion of students)
Student characteristics explain 24–53 percent of the gap in nontest outcomes between American Indian students and their statewide peers, and school characteristics explain 18–60 percent
–0.2
–0.1
0.0
0.1 Controlling for student and school characteristicsOverall difference
Students who were Students who took Students who took an Four-year ever suspended Math I in grade 8 Advanced Placement course graduation rate
Source: Authors’ analysis of data from the North Carolina Department of Public Instruction.
11
Availability of education resources—notably teacher quality—may influence the gap in academic outcomes between American Indian students and their within-school and statewide peers
Teachers of American Indian students and teachers of other students in North Carolina differ in average teacher quality measures (see table C4 in appendix C). Although both groups of teachers have similar years of teaching experience and a similar percentage of teachers with an advanced degree, teacher value-added scores, licensure test scores, and the percentage of teachers with national board certification is lower among teachers of American Indian students than among teachers of American Indian students’ statewide peers. However, measures of teacher quality within schools are very similar. When teacher quality is controlled for, the size of the gap between American Indian students and their statewide peers is narrower for many outcome measures (see table C5 in appendix C), suggesting that differences in teacher quality may influence student outcomes. Teacher quality explains up to 8 percent of the gap in outcome measures between American Indian students and their statewide peers, although the percentage of the gap explained varies by outcome.
Implications of the study findings
American Indian students in grades 6–12 in North Carolina lag behind their statewide peers on nearly every education outcome measured in this study. The performance gaps can be explained partially by differences in student characteristics between American Indian students and their statewide peers and differences in the characteristics of schools attended by American Indian students and of schools attended by their statewide peers. The percentage of students who are economically disadvantaged is higher among American Indian students than among their statewide peers, as is the percentage of students who attend a rural school where more of the students are disadvantaged. American Indian students and their within-school peers share similar student demographic characteristics and education outcomes.
Many American Indian students are economically disadvantaged and attend rural and economically disadvantaged schools; those students would likely benefit from resources targeted to improve student outcomes for all disadvantaged students and all students in rural or economically disadvantaged schools. One such resource may be improving teacher quality, as teachers of American Indian students and their within-school peers score lower on some measures of teacher quality than teachers of their statewide peers. The differences in teacher quality could account for some of the differences in education outcomes between American Indian students and their statewide peers. Although American Indian students may benefit from solutions aimed at improving the education outcomes of economically disadvantaged students and closing the performance gap, solutions that specifically address the challenges of American Indian students may also be necessary.
Limitations of the study
Although this report documents many aspects of the experience of American Indian students in the middle and high school grades in North Carolina public schools, it has several limitations.
Many American Indian students are economically disadvantaged and attend rural and economically disadvantaged schools; those students would likely benefit from resources targeted to improve student outcomes for all disadvantaged students and all students in rural or economically disadvantaged schools
12

First, the study examines differences between the average American Indian student in North Carolina and his or her average within-school peer and statewide peer. However, tribal and other demographic differences exist across the state. Filtering the data by dominant tribe in each district yields notable differences in student demographic characteristics, school characteristics, and education outcomes (see appendix C). Although the average patterns highlight important trends among American Indian students as a whole, differences across tribes suggest that inferences from statewide averages may be more accurate for some tribes than for others.
Second, the population of American Indian students in North Carolina public schools may be considerably different from that in some other states. Several states, such as Oklahoma, New Mexico, and Montana, have substantially larger populations of American Indian students, whereas many states have much smaller populations. The size of the American Indian student population, the unique history of the American Indian tribes in the state, and differences across tribes may make the study’s findings less relevant to other states.
Finally, the study is limited to an analysis of student demographic characteristics, outcomes, and education resources for which administrative data were available from North Carolina.
13

Appendix A. Previous research on the education outcomes and characteristics of American Indian students
Nationwide data demonstrate the existence and persistence of gaps between American Indian students and students of other races/ethnicities in scores on achievement tests (Fischer & Stoddard, 2013; Nelson et al., 2009; U.S. Department of Education, 2010, 2011). Substantial gaps in absences, graduation rates, and postsecondary attainment also exist (Romero & Lee, 2007; U.S. Department of Education, 2010). Several of those reports find that the performance of American Indian students in North Carolina is at or below the national average for American Indian students and that the performance gap within the state is persistent (Nelson et al., 2009; U.S. Department of Education, 2011).
American Indian students are more likely to attend rural schools and are more likely to be identified for special education services, have lower family incomes, and have fewer resources at home (U.S. Department of Education, 2010, 2011). Given that those characteristics are often associated with lower student achievement, their prevalence among the American Indian population may account for a portion of the achievement gap (Demmert, Grissmer, & Towner, 2006). Indeed, a recent study that examined the role of student and school characteristics demonstrated that the differences account for a greater portion of the achievement gap between American Indian students and White students than of the gap between students of other races/ethnicities and White students (Fischer & Stoddard, 2013), which suggests that addressing problems related to poverty and rural demographic characteristics may help improve academic achievement among American Indian students (Demmert, 2001; Demmert et al., 2006; Fischer & Stoddard, 2013).
A-1
Appendix B. Data and methodology
This appendix provides a detailed description of the data sources, the analysis sample, and the methods used to analyze the data.
Data sources
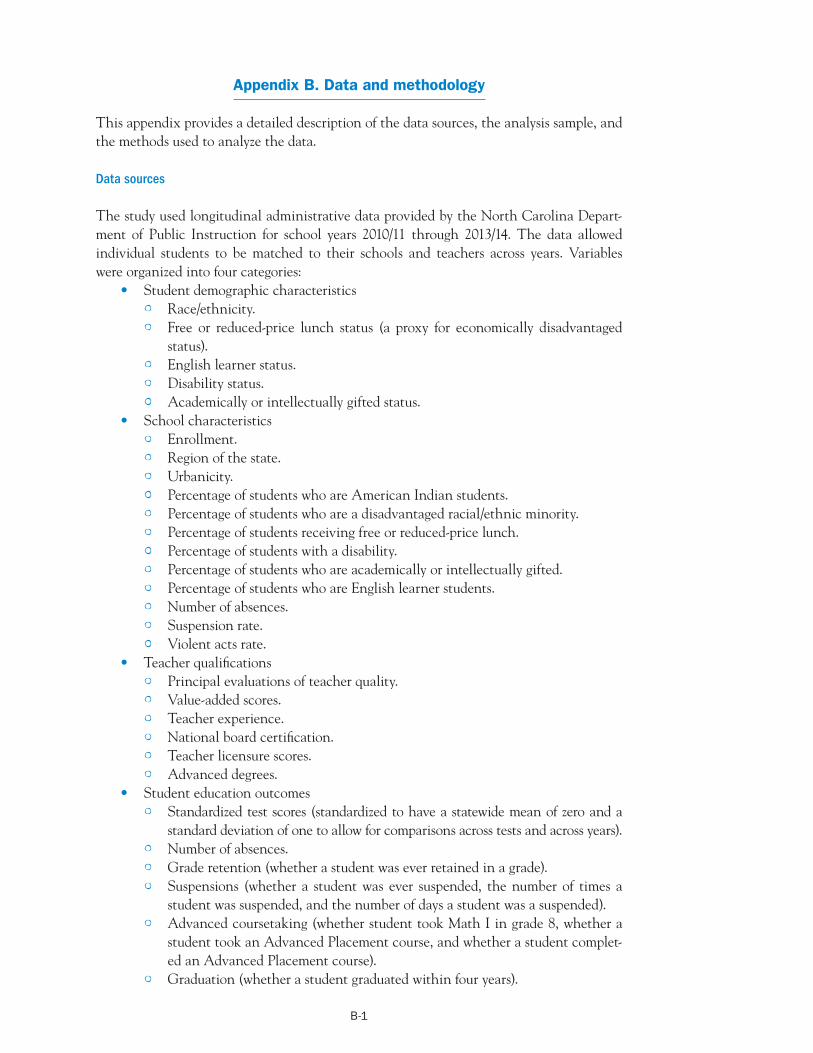
The study used longitudinal administrative data provided by the North Carolina Department of Public Instruction for school years 2010/11 through 2013/14. The data allowed individual students to be matched to their schools and teachers across years. Variables were organized into four categories:
• Student demographic characteristics • Race/ethnicity. • Free or reduced-price lunch status (a proxy for economically disadvantaged
status). • English learner status. • Disability status. • Academically or intellectually gifted status.
• School characteristics • Enrollment. • Region of the state. • Urbanicity. • Percentage of students who are American Indian students. • Percentage of students who are a disadvantaged racial/ethnic minority. • Percentage of students receiving free or reduced-price lunch. • Percentage of students with a disability. • Percentage of students who are academically or intellectually gifted. • Percentage of students who are English learner students. • Number of absences. • Suspension rate. • Violent acts rate.
• Teacher qualifications • Principal evaluations of teacher quality. • Value-added scores. • Teacher experience. • National board certification. • Teacher licensure scores. • Advanced degrees.
• Student education outcomes • Standardized test scores (standardized to have a statewide mean of zero and a
standard deviation of one to allow for comparisons across tests and across years). • Number of absences. • Grade retention (whether a student was ever retained in a grade). • Suspensions (whether a student was ever suspended, the number of times a
student was suspended, and the number of days a student was a suspended). • Advanced coursetaking (whether student took Math I in grade 8, whether a
student took an Advanced Placement course, and whether a student completed an Advanced Placement course).
• Graduation (whether a student graduated within four years).
B-1

Sample
Quantitative analyses included all American Indian students in grades 6–12 in North Carolina public schools during school years 2010/11–2013/14. Students of other races/ ethnicities in the state served as a comparison group. Some of the analyses focused on schools in the 17 districts that received Title VII funding. This subsample of districts contained greater concentrations of American Indian students within the same school, which allowed the study team to explore the effects of multiple student- and school-level factors in greater detail. Throughout, American Indian students were compared with students of other races/ethnicities within the same schools and statewide.
A weighted average was used to generate an appropriate within-school comparison that is not affected by differences in school size and American Indian student population. Demographic characteristics of non–American Indian students in schools with a higher population of American Indians were weighted more heavily. The averages generated by this weighted within-school comparison can be thought of as the characteristics of the typical within-school peer of the typical American Indian student.
Analyses were also disaggregated by district and tribe where data allowed because of the high concentration of American Indian students within a small number of districts. Therefore, the results of a statewide analysis for the entire population of American Indian students may be heavily influenced by that one district and tribe. This level of disaggregation allowed for investigation into the extent to which patterns seen among the general population of American Indian students also hold true for specific population subsets.
Data analysis
This section describes the models and analytical strategies used to answer the research questions. The analysis plan is organized by research question.
How do the demographic characteristics of American Indian students in grades 6–12 in North Carolina and the characteristics of the schools they attend compare with those of other students and of the schools they attend? The first step in the analysis was to describe the population and school experiences of middle and high school American Indian students in North Carolina. This descriptive analysis compared average student demographic characteristics and school characteristics among American Indian students with within-school and statewide averages among students of other races/ethnicities in the 2013/14 school year. The analysis included all student demographic characteristics and all school characteristics in the dataset.
How do the education outcomes of American Indian students in grades 6–12 in North Carolina compare with those of other students? All student outcome data for the 2013/14 school year was used to compare average outcomes among American Indian students with within-school and statewide averages among students of other races/ethnicities. T-tests were used to determine whether the differences between American Indian students and their within-school and statewide peers were statistically significant. The Bonferroni adjustment method was used to correct for type I error resulting from multiple comparisons.
B-2
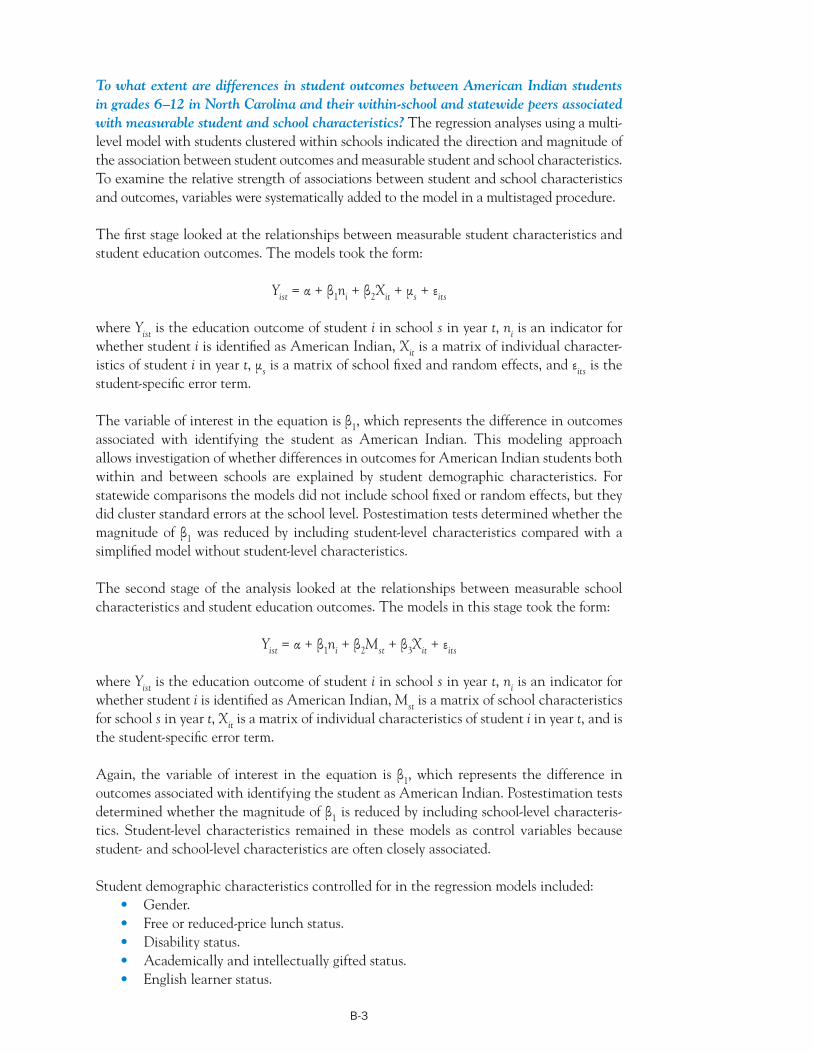
To what extent are differences in student outcomes between American Indian students in grades 6–12 in North Carolina and their within-school and statewide peers associated with measurable student and school characteristics? The regression analyses using a multilevel model with students clustered within schools indicated the direction and magnitude of the association between student outcomes and measurable student and school characteristics. To examine the relative strength of associations between student and school characteristics and outcomes, variables were systematically added to the model in a multistaged procedure.
The first stage looked at the relationships between measurable student characteristics and student education outcomes. The models took the form:
Yist = α + β1ni + β2Xit + μ s + εits
where Yist is the education outcome of student i in school s in year t, ni is an indicator for whether student i is identified as American Indian, Xit is a matrix of individual characteristics of student i in year t, μ s is a matrix of school fixed and random effects, and εits is the student-specific error term.
The variable of interest in the equation is β1, which represents the difference in outcomes associated with identifying the student as American Indian. This modeling approach allows investigation of whether differences in outcomes for American Indian students both within and between schools are explained by student demographic characteristics. For statewide comparisons the models did not include school fixed or random effects, but they did cluster standard errors at the school level. Postestimation tests determined whether the magnitude of β1 was reduced by including student-level characteristics compared with a simplified model without student-level characteristics.
The second stage of the analysis looked at the relationships between measurable school characteristics and student education outcomes. The models in this stage took the form:
Yist = α + β1ni + β2Mst + β3Xit + εits
where Yist is the education outcome of student i in school s in year t, ni is an indicator for whether student i is identified as American Indian, Mst is a matrix of school characteristics for school s in year t, Xit is a matrix of individual characteristics of student i in year t, and is the student-specific error term.
Again, the variable of interest in the equation is β1, which represents the difference in outcomes associated with identifying the student as American Indian. Postestimation tests determined whether the magnitude of β1 is reduced by including school-level characteristics. Student-level characteristics remained in these models as control variables because student- and school-level characteristics are often closely associated.
Student demographic characteristics controlled for in the regression models included: • Gender. • Free or reduced-price lunch status. • Disability status. • Academically and intellectually gifted status. • English learner status.
B-3
School characteristics controlled for in the regression models included: • Average daily membership (a measure of enrollment). • Region of the state. • Rural versus urban locale. • Percentage of students who were American Indian students. • Percentage of students who were disadvantaged racial/ethnic minority students. • Percentage of students receiving free or reduced-price lunch. • Suspension rate. • Violent acts rate.
Again, the Bonferroni adjustment method was used to correct for type I error resulting from multiple comparisons.
B-4
-
-
Appendix C. Detailed quantitative results
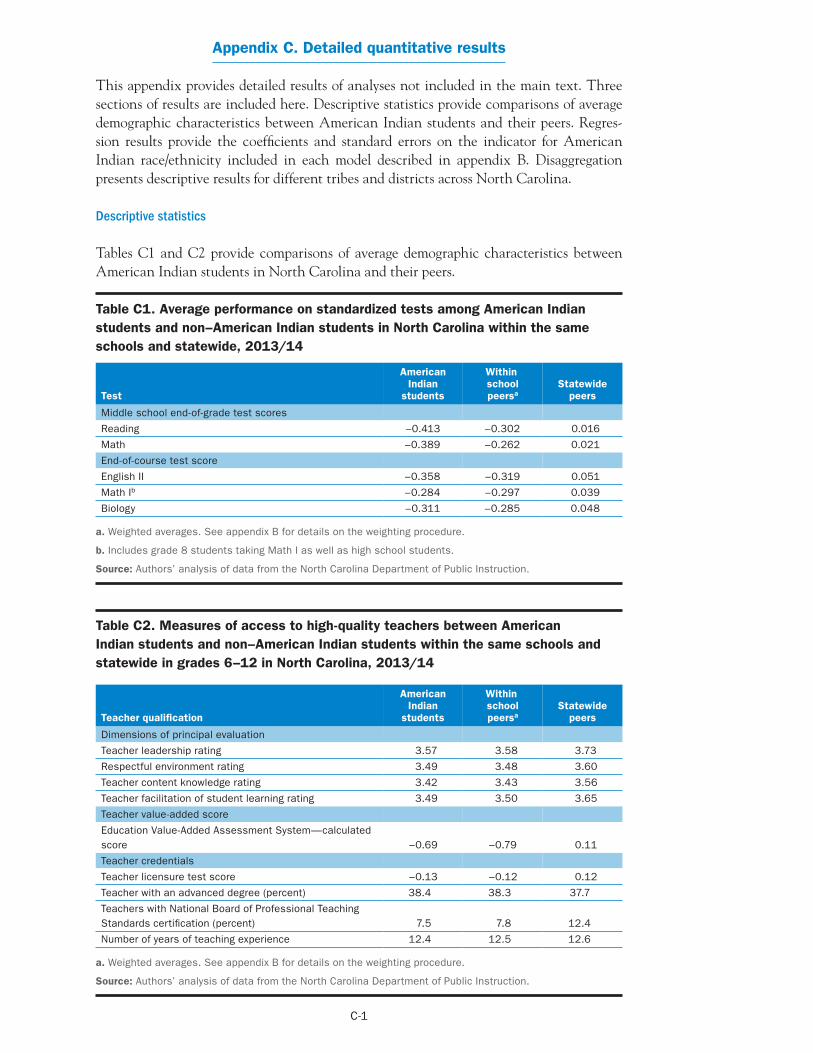
This appendix provides detailed results of analyses not included in the main text. Three sections of results are included here. Descriptive statistics provide comparisons of average demographic characteristics between American Indian students and their peers. Regression results provide the coefficients and standard errors on the indicator for American Indian race/ethnicity included in each model described in appendix B. Disaggregation presents descriptive results for different tribes and districts across North Carolina.
Descriptive statistics
Tables C1 and C2 provide comparisons of average demographic characteristics between American Indian students in North Carolina and their peers.
Table C1. Average performance on standardized tests among American Indian students and non–American Indian students in North Carolina within the same schools and statewide, 2013/14
American Indian
Within
Test students school peersa
Statewide peers
Middle school end-of-grade test scores
Reading –0.413 –0.302 0.016
Math –0.389 –0.262 0.021
End-of-course test score
English II –0.358 –0.319 0.051
Math Ib –0.284 –0.297 0.039
Biology –0.311 –0.285 0.048
a. Weighted averages. See appendix B for details on the weighting procedure.
b. Includes grade 8 students taking Math I as well as high school students.
Source: Authors’ analysis of data from the North Carolina Department of Public Instruction.
Table C2. Measures of access to high-quality teachers between American Indian students and non–American Indian students within the same schools and statewide in grades 6–12 in North Carolina, 2013/14
American Indian
Within
Teacher qualification students school peersa
Statewide peers
Dimensions of principal evaluation
Teacher leadership rating 3.57 3.58 3.73
Respectful environment rating 3.49 3.48 3.60
Teacher content knowledge rating 3.42 3.43 3.56
Education Value-Added Assessment System—calculated score –0.69 –0.79 0.11
Teacher licensure test score –0.13 –0.12 0.12
Teacher with an advanced degree (percent) 38.4 38.3 37.7
Teacher facilitation of student learning rating 3.49 3.50 3.65
Teacher value-added score
Teacher credentials
Teachers with National Board of Professional Teaching Standards certification (percent) 7.5 7.8 12.4
Number of years of teaching experience 12.4 12.5 12.6
a. Weighted averages. See appendix B for details on the weighting procedure.
Source: Authors’ analysis of data from the North Carolina Department of Public Instruction.
C-1
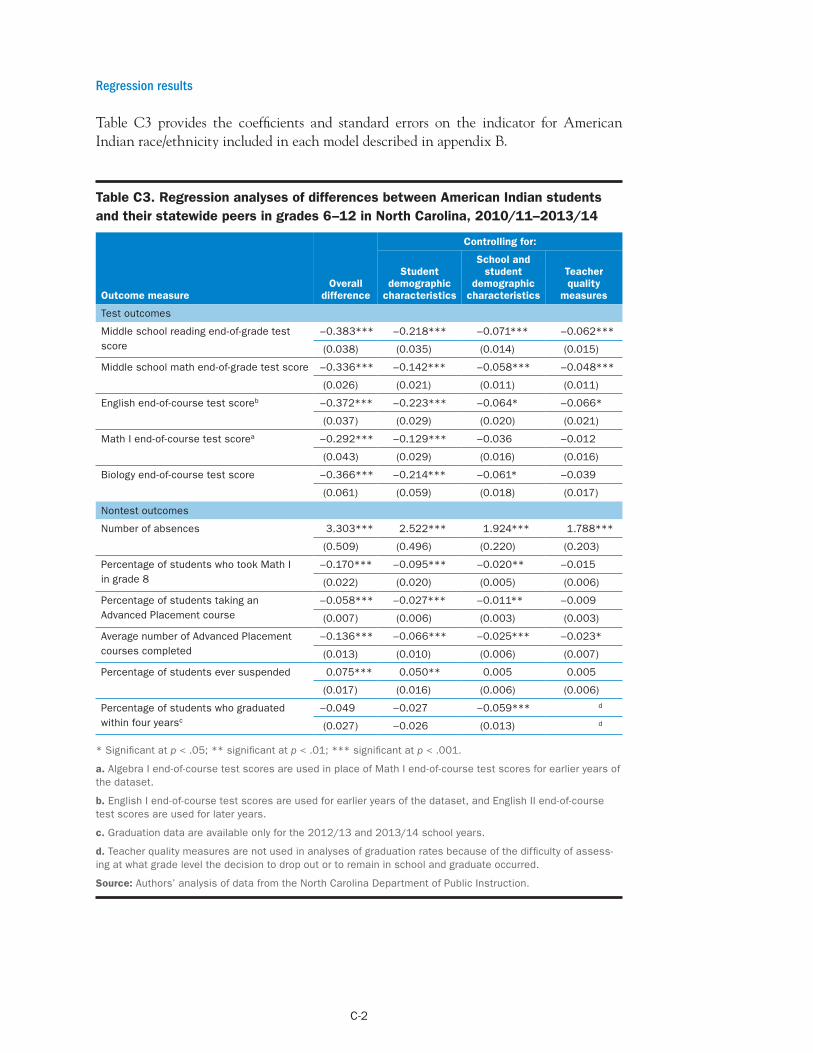
Regression results
Table C3 provides the coefficients and standard errors on the indicator for American Indian race/ethnicity included in each model described in appendix B.
Table C3. Regression analyses of differences between American Indian students and their statewide peers in grades 6–12 in North Carolina, 2010/11–2013/14
Controlling for:
Student student Teacher
Outcome measure difference characteristics characteristics measures Overall demographic
School and
demographic quality
Test outcomes
Middle school reading end-of-grade test –0.383*** –0.218*** –0.071*** –0.062*** score (0.038) (0.035) (0.014) (0.015)
Middle school math end-of-grade test score –0.336*** –0.142*** –0.058*** –0.048***
(0.026) (0.021) (0.011) (0.011)
English end-of-course test scoreb –0.372*** –0.223*** –0.064* –0.066*
(0.037) (0.029) (0.020) (0.021)
Math I end-of-course test scorea –0.292*** –0.129*** –0.036 –0.012
(0.043) (0.029) (0.016) (0.016)
Biology end-of-course test score –0.366*** –0.214*** –0.061* –0.039
(0.061) (0.059) (0.018) (0.017)
Nontest outcomes
Number of absences 3.303*** 2.522*** 1.924*** 1.788***
(0.509) (0.496) (0.220) (0.203)
Percentage of students who took Math I –0.170*** –0.095*** –0.020** –0.015 in grade 8 (0.022) (0.020) (0.005) (0.006)
Percentage of students taking an –0.058*** –0.027*** –0.011** –0.009 Advanced Placement course (0.007) (0.006) (0.003) (0.003)
Average number of Advanced Placement –0.136*** –0.066*** –0.025*** –0.023* courses completed (0.013) (0.010) (0.006) (0.007)
Percentage of students ever suspended 0.075*** 0.050** 0.005 0.005
(0.017) (0.016) (0.006) (0.006)
Percentage of students who graduated –0.049 –0.027 –0.059*** d
within four yearsc (0.027) –0.026 (0.013) d
* Significant at p < .05; ** significant at p < .01; *** significant at p < .001.
a. Algebra I end-of-course test scores are used in place of Math I end-of-course test scores for earlier years of the dataset.
b. English I end-of-course test scores are used for earlier years of the dataset, and English II end-of-course test scores are used for later years.
c. Graduation data are available only for the 2012/13 and 2013/14 school years.
d. Teacher quality measures are not used in analyses of graduation rates because of the difficulty of assessing at what grade level the decision to drop out or to remain in school and graduate occurred.
Source: Authors’ analysis of data from the North Carolina Department of Public Instruction.
C-2

Disaggregation by tribe and district
Figures C1–C5 present descriptive results for different American Indian tribes and districts across North Carolina. Only five of the eight tribes in North Carolina are included in this disaggregation because the numbers of students in other tribes do not allow for separate reporting. In addition, a multiple tribes category is used for urban districts that contain American Indian students from many different tribes rather than a concentration of students from a single tribe.
Figure C1. Percentage of American Indian students in grades 6–12 in North Carolina receiving free or reduced-price lunch and within-school and districtwide comparisons, by tribe, 2013/14
Percent of students
0
25
50
75
100 Within-school comparisona Districtwide comparisonAmerican Indian
Coharie Eastern Band Haliwa- Lumbee Waccamaw Multiple of Cherokee Saponi Siouan tribesb
a. Weighted averages. See appendix B for details on the weighting procedure.
b. Category is used for urban districts that contain American Indian students from many different tribes rather than a concentration of students from a single tribe.
Source: Authors’ analysis of data from the North Carolina Department of Public Instruction.
C-3

Figure C2. Percentage of American Indian students in grades 6–12 in North Carolina identified as academically or intellectually gifted and within-school and districtwide comparisons, by tribe, 2013/14 school year
Percent of students
25
20
15
10
5
0
American Indian Within-school comparisona Districtwide comparison
Coharie Eastern Band Haliwa- Lumbee Waccamaw Multiple of Cherokee Saponi Siouan tribesb
a. Weighted averages. See appendix B for details on the weighting procedure.
b. Category is used for urban districts that contain American Indian students from many different tribes rather than a concentration of students from a single tribe.
Source: Authors’ analysis of data from the North Carolina Department of Public Instruction.
Figure C3 includes the 17 districts that receive Title VII funding because these districts have the largest concentrations of American Indian students in North Carolina.
Figure C3. Average percentage of students receiving free or reduced-price lunch in schools attended by American Indian students in grades 6–12 in North Carolina and districtwide comparison, by district, 2013/14
American Indian students Districtwide comparison
Charlotte-Mecklenburg Clinton City Columbus
Cumberland Graham Guilford Halifax
Hoke Jackson
Johnston Person
Richmond Robeson Scotland
Swain Wake
Warren
0 25 50 75 100
Percent of students in school
Source: Authors’ analysis of data from the North Carolina Department of Public Instruction.
C-4
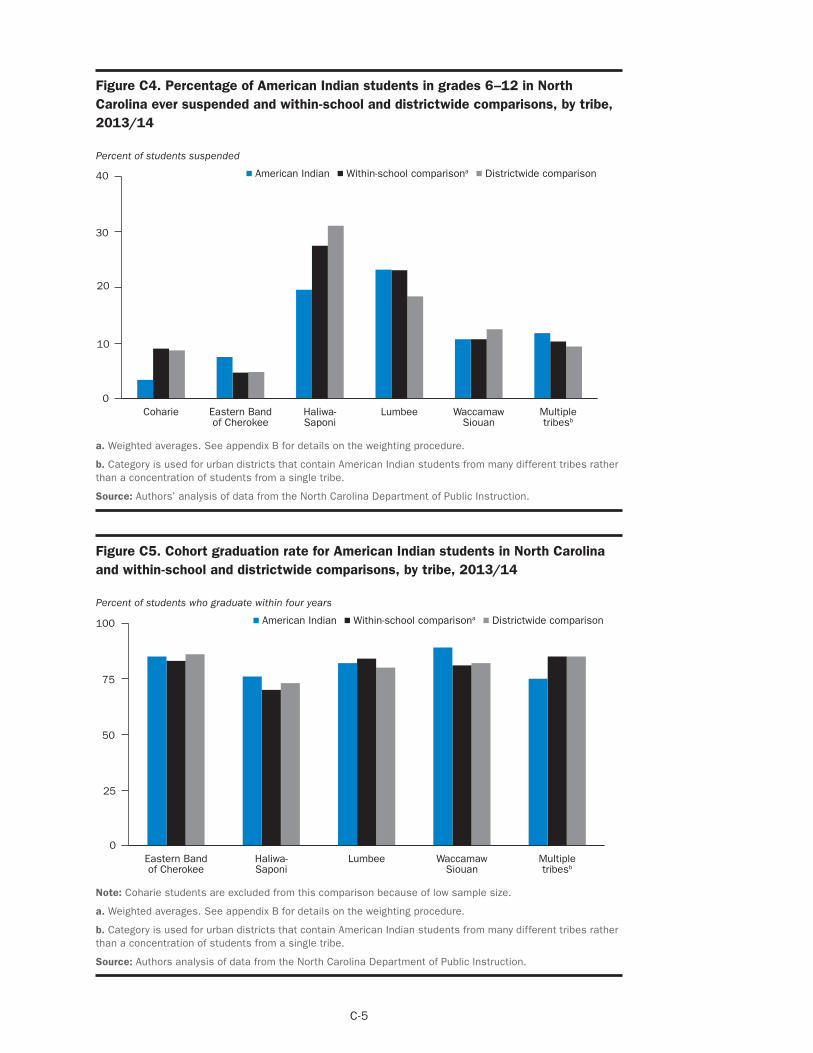
Figure C4. Percentage of American Indian students in grades 6–12 in North Carolina ever suspended and within-school and districtwide comparisons, by tribe, 2013/14
Percent of students suspended
40
30
20
10
0
American Indian Within-school comparisona Districtwide comparison
Coharie Eastern Band Haliwa- Lumbee Waccamaw Multiple of Cherokee Saponi Siouan tribesb
a. Weighted averages. See appendix B for details on the weighting procedure.
b. Category is used for urban districts that contain American Indian students from many different tribes rather than a concentration of students from a single tribe.
Source: Authors’ analysis of data from the North Carolina Department of Public Instruction.
Figure C5. Cohort graduation rate for American Indian students in North Carolina and within-school and districtwide comparisons, by tribe, 2013/14
Percent of students who graduate within four years
0
25
50
75
100 Within-school comparisona Districtwide comparisonAmerican Indian
Eastern Band of Cherokee
Haliwa-Saponi
Lumbee Waccamaw Siouan
Multiple tribesb
Note: Coharie students are excluded from this comparison because of low sample size.
a. Weighted averages. See appendix B for details on the weighting procedure.
b. Category is used for urban districts that contain American Indian students from many different tribes rather than a concentration of students from a single tribe.
Source: Authors analysis of data from the North Carolina Department of Public Instruction.
C-5

Note
1. North Carolina uses the term “limited English proficient students.”
Notes-1
References
Aughinbaugh, A. (2012). The effects of high school math curriculum on college attendance: Evidence from the NLSY97. Economics of Education Review, 31(6), 861–870. http://eric.ed.gov/?id=EJ989065
Caldas, S. J., & Bankston III, C. (1997). Effect of school population socioeconomic status on individual academic achievement. The Journal of Educational Research, 90(5), 269– 277. http://eric.ed.gov/?id=EJ549950
Cleary, L. M., & Peacock, T. D. (1998). Collected wisdom: American Indian education. Boston, MA: Allyn and Bacon. http://eric.ed.gov/?id=ED422138
Cowell, A. (2002). Bilingual curriculum among the Northern Arapaho: Oral tradition, literacy, and performance. The American Indian Quarterly, 26(1), 24–43. http://eric. ed.gov/?id=EJ675320
Demmert, W. G. (2001). Improving academic performance among Native American students: A review of the research literature. Charleston, WV: ERIC Clearinghouse on Rural Education and Small Schools. http://eric.ed.gov/?id=ED463917
Demmert, W. G., Grissmer, D., & Towner, J. (2006). A review and analysis of the research on Native American students. Journal of American Indian Education, 45(3), 5–23.
Domina, T. (2014). The link between middle school mathematics course placement and achievement. Child Development, 85(5), 1948–1964. http://eric.ed.gov/?id=EJ1039375
Finn, J. D., & Zimmer, K. S. (2012). Student engagement: What is it? Why does it matter? In S. Christenson (Ed.), Handbook of research on student engagement (pp. 97–131). New York, NY: Springer.
Fischer, S., & Stoddard, C. (2013). The academic achievement of American Indians. Economics of Education Review, 36(C), 135–152.
Glaser, B. G. (1965). The constant comparative method of qualitative analysis. Social Problems, 12(4), 436–445.
Glaser, B. G., & Strauss, A. L. (1967). The discovery of grounded theory: Strategies for qualitative research. Chicago, IL: Aldine.
Goodman, J. (2014). Flaking out: Student absences and snow days as disruptions of instructional time (NBER Working Paper No. w20221). Cambridge, MA: National Bureau of Economic Research. Retrieved June 30, 2015, from http://www.nber.org/papers/w20221. pdf.
Gottfried, M. A. (2011). The detrimental effects of missing school: Evidence from urban siblings. American Journal of Education, 117(2), 147–182. http://eric.ed.gov/?id=EJ920345
Ref-1
Henry, K. L., Knight, K. E., & Thornberry, T. P. (2012). School disengagement as a predictor of dropout, delinquency, and problem substance use during adolescence and early adulthood. Journal of Youth and Adolescence, 41(2), 156–166. http://eric.ed. gov/?id=EJ953840
Jacob, B. A., & Ludwig, J. (2008). Improving education outcomes for poor children. In M. Cancian & S. Danziger (Eds.), Changing poverty, changing policies. New York, NY: Russell Sage Foundation.
Karathanos, K. (2009). Exploring US mainstream teachers’ perspectives on use of the native language in instruction with English language learner students. International Journal of Bilingual Education and Bilingualism, 12(6), 615–633. http://eric.ed.gov/?id=EJ862599
Lipka, J. (2002). Schooling for self-determination: Research on the effects of including native language and culture in the schools (ERIC No. ED459989). ERIC Digest. Charleston, WV: ERIC Clearinghouse on Rural Education and Small Schools.
Lipsey, M. W., Puzio, K., Yun, C., Hebert, M. A., Steinka-Fry, K., Cole, M. W., et al. (2012). Translating the statistical representation of the effects of education interventions into more readily interpretable forms (NCSER No. 2013–3000). Washington, DC: U.S. Department of Education, Institute of Education Sciences, National Center for Special Education Research. http://eric.ed.gov/?id=ED537446
Long, M. C., Conger, D., & Iatarola, P. (2012). Effects of high school course-taking on secondary and postsecondary success. American Educational Research Journal, 49(2), 285–322. http://eric.ed.gov/?id=EJ960491
McCarty, T. L. (2003). Revitalizing indigenous languages in homogenizing times. Comparative Education, 39(2), 147–163. http://eric.ed.gov/?id=EJ670240
Murnane, R. J. (2007). Improving the education of children living in poverty. Future of Children, 17(2), 161–182. http://eric.ed.gov/?id=EJ795871
Nelson, S., Greenough, R., & Sage, N. (2009). Achievement gap patterns of grade 8 American Indian and Alaska Native students in reading and math. Washington, DC: U.S. Department of Education, Institute of Education Sciences, National Center for Education Evaluation and Regional Assistance, Regional Educational Laboratory Northwest. http://eric.ed.gov/?id=ED505876
Rivera, H., & Tharp, R. (2006). A Native American community’s involvement and empowerment to guide their children’s development in the school setting. Journal of Community Psychology, 34(4), 435–451. http://eric.ed.gov/?id=EJ958107
Romero, M., & Lee, Y. (2007). A national portrait of chronic absenteeism in the early grades. New York, NY: National Center for Children in Poverty. Retrieved January 17, 2015, from http://www.nccp.org/publications/pub_771.html.
Ref-2
Rumberger, R. W., & Palardy, G. J. (2005). Test scores, dropout rates, and transfer rates as alternative indicators of high school performance. American Educational Research Journal, 42(1), 3–42. http://eric.ed.gov/?id=EJ737117
Sirin, S. R. (2005). Socioeconomic status and academic achievement: A meta-analytic review of research. Review of Educational Research, 75(3), 417–453. http://eric.ed.gov/ ?id=EJ737302
State Advisory Committee on Indian Education. (2014). A new vision for Native students. Report to the North Carolina State Board of Education. Raleigh, NC: Author. Retrieved June 12, 2014, from http://www.dpi.state.nc.us/docs/americanindianed/ reports/2013indianedreport.pdf.
Strauss, A., & Corbin, J. (1990). Basics of qualitative research: Grounded theory procedures and techniques. Newbury Park, CA: Sage.
U.S. Department of Education, Institute of Education Sciences, National Center for Education Statistics. (2010). Status and trends in the education of racial and ethnic groups. Washington, DC: Author. http://eric.ed.gov/?id=ED510909
U.S. Department of Education, Institute of Education Sciences, National Center for Education Statistics. (2011). National Indian education study: The educational experiences of American Indian and Alaska Native students at grades 4 and 8. Washington, DC: Author. http://eric.ed.gov/?id=ED533306
U.S. Department of Education, Institute of Education Sciences, National Center for Education Statistics. (n.d). Common Core of Data. State Nonfiscal Public Elementary/ Secondary Education Survey, 2012–13 v.1a. Retrieved July 8, 2014, from https://nces. ed.gov/ccd/stnfis.asp.
Winstead, T., Lawrence, A., Brantmeier, E., & Frey, C. (2008). Language, sovereignty, cultural contestation, and American Indian schools: No Child Left Behind and a Navajo test case. Journal of American Indian Education, 47(1), 46–64. http://eric. ed.gov/?id=EJ794266
Ref-3
The Regional Educational Laboratory Program produces 7 types of reports
Making Connections Studies of correlational relationships
Making an Impact Studies of cause and effect
What’s Happening Descriptions of policies, programs, implementation status, or data trends
What’s Known Summaries of previous research
Stated Briefly Summaries of research findings for specific audiences
Applied Research Methods Research methods for educational settings
Tools Help for planning, gathering, analyzing, or reporting data or research