THE CHANGING PLACE OF VISUAL REPRESENTATION IN …
23
Journal of the History of Economic Thought, Volume 32, Number 2, June 2010 THE CHANGING PLACE OF VISUAL REPRESENTATION IN ECONOMICS: PAUL SAMUELSON BETWEEN PRINCIPLE AND STRATEGY, 1941–1955 BY YANN B. GIRAUD In this paper, we show that Paul Samuelson (1915–2009), renowned as one of the main advocates of the mathematization of economics, has also contributed to the change of the place of visual representation in the discipline. In his early works (e.g. Foundations of Economic Analysis published in 1947), he rejected diagrammatic analysis as a relevant tool of theorizing but used diagrams extensively, both as a pedagogic tool in his introductory textbook Economics (1948) and as a way of clarifying his theory of public expenditure (1954-5). We show that Samuelson’s reluctance to use diagrams in his early works can be explained by his training at Chicago and Harvard and his rejecting Marshall’s economics, whereas his adoption of visual language in Economics was a product of the peculiar context affecting American mass-education after WWII. A methodological debate which opposed him to Kenneth Boulding in 1948 led him to reconsider the place of visual representation in order to clarify conceptual controversies during subsequent debates on mathematical economics. Therefore, it can be said that the prominent place of visual language in the diffusion of economic ideas was stabilized in the mid- 1950s, as mathematical language became the prevailing tool of economic theorizing. From this, we conclude that the idea that algebra simply upstaged geometry in the making of economic analysis must be qualified. THEMA, Universite ´ de Cergy-Pontoise, 33 Boulevard du Port, F–95011 Cergy-Pontoise Cedex, France; [email protected]. Part of the research for this paper has been carried out within the Cachan History of Social Science Group (H2S) and as a visiting fellow at the Center for the History of Political Economy at Duke University. I wish to thank Philippe Fontaine, Roger Backhouse, Steve Medema, Loı ¨c Charles, Cle ´ment Levallois, Carlo Zappia and two anonymous referees for their helpful remarks, criticisms and suggestions on several previous drafts of this paper. I retain full responsibility for any remaining error or inaccuracy. ISSN 1053-8372 print; ISSN 1469-9656 online/10/02000175-197 Ó The History of Economics Society, 2010 doi:10.1017/S1053837210000143
Transcript of THE CHANGING PLACE OF VISUAL REPRESENTATION IN …

Journal of the History of Economic Thought,Volume 32, Number 2, June 2010
THE CHANGING PLACE OF VISUAL
REPRESENTATION IN ECONOMICS: PAUL
SAMUELSON BETWEEN PRINCIPLE
AND STRATEGY, 1941–1955
BY
YANN B. GIRAUD
In this paper, we show that Paul Samuelson (1915–2009), renowned as one of themain advocates of the mathematization of economics, has also contributed to thechange of the place of visual representation in the discipline. In his early works (e.g.Foundations of Economic Analysis published in 1947), he rejected diagrammaticanalysis as a relevant tool of theorizing but used diagrams extensively, both asa pedagogic tool in his introductory textbook Economics (1948) and as a way ofclarifying his theory of public expenditure (1954-5). We show that Samuelson’sreluctance to use diagrams in his early works can be explained by his training atChicago and Harvard and his rejecting Marshall’s economics, whereas hisadoption of visual language in Economics was a product of the peculiar contextaffecting American mass-education after WWII. A methodological debate whichopposed him to Kenneth Boulding in 1948 led him to reconsider the place of visualrepresentation in order to clarify conceptual controversies during subsequentdebates on mathematical economics. Therefore, it can be said that the prominentplace of visual language in the diffusion of economic ideas was stabilized in the mid-1950s, as mathematical language became the prevailing tool of economictheorizing. From this, we conclude that the idea that algebra simply upstagedgeometry in the making of economic analysis must be qualified.
THEMA, Universite de Cergy-Pontoise, 33 Boulevard du Port, F–95011 Cergy-Pontoise Cedex, France;[email protected]. Part of the research for this paper has been carried out within the Cachan Historyof Social Science Group (H2S) and as a visiting fellow at the Center for the History of Political Economyat Duke University. I wish to thank Philippe Fontaine, Roger Backhouse, Steve Medema, Loıc Charles,Clement Levallois, Carlo Zappia and two anonymous referees for their helpful remarks, criticisms andsuggestions on several previous drafts of this paper. I retain full responsibility for any remaining error orinaccuracy.
ISSN 1053-8372 print; ISSN 1469-9656 online/10/02000175-197 � The History of Economics Society, 2010
doi:10.1017/S1053837210000143
I. INTRODUCTION
In the past twenty years or so, historians, sociologists, and methodologists of sciencehave emphasized the significance of visual representation, testifying to what BrunoLatour describes as ‘‘the extraordinary obsession of scientists with papers, prints,diagrams, archives, abstracts and curves on graph paper’’ (Latour 1988, p. 39).1 Theircontributions allowed for a new focus on the history of science, presenting seeminglyfamiliar episodes in a new fashion. Following this trend, some historians ofeconomics have begun to interest themselves in visual representations, stressingtheir importance from the emergence of political economy in the eighteenth centuryto the making of nineteenth-century neoclassical economics (Charles 2003, 2004;Maas and Morgan 2002; Cook 2005). However, with the exception of Derobert andTheriot (2003) and De Marchi (2003), who studied the uses of a number of diagramsin postwar economics, little has been written on that highly significant period for thediscipline.2
This is not to say that modern economics is free from visualization. It wouldrequire only a little imagination to realize how important visual representation hasbeen in shaping the discipline’s workaday tools, and how those tools are still firmlyentrenched in the contemporary economist’s activities. Yet it is hardly arguable thatvisual language is still seen as a powerful tool, one that could help push theboundaries of economic research. In the early 1960s, when Paul Samuelson (1915–2009) wrote a piece celebrating fellow economist Abba Lerner’s sixtieth birthday, hemade clear that diagrams were no longer the research engines they used to be. ‘‘Atfirst,’’ he observed, ‘‘Lerner was known as a diagram man. In those days [the early1930s], graphs did represent the frontier of our science’’ (Samuelson 1964a, p. 170),referring to an evolution of the discipline to which he himself contributed. As theauthor of Foundations of Economic Analysis, published in 1947, Samuelson may beseen as one of the most ardent defenders of a type of mathematics, made of matricesand difference equations, which questioned the usefulness of the kind of diagram-matic analysis that was so central in the practice of economists less than ten yearsbefore, and this is one of the reasons which could explain why he has been pointedout as the founder of ‘‘modern economic theory.’’3 On the other hand, the same Paul
1In methodology, see Larkin and Simon (1987). Recently, a special issue of Foundations of Science(2004) on ‘‘Model-Based Reasoning’’ gave a central place to visualization. In history of science, seeDaston and Galison (1992), Lightman (2000), Hankins (1999, 2006), and the ‘‘Focus’’ section in ISIS97 (1), March 2006, ‘‘Science and Visual Culture,’’ pp. 75–132.2Charles (2003) and (2004) both deal with the visual history of Quesnay’s Tableau Economique. Maasand Morgan (2002) and Cook (2005) explore the visual aspect of neoclassical economic theory and it isnoticeable that both were published in history of science journals. De Marchi (2003) studies the role ofvisualization in the representation of the gains from trade from Marshall to Samuelson, and Derobert andTheriot (2003) shows how the use of the Lorenz curve has changed throughout the twentieth century. Allthese contributions are revised versions of drafts that were presented at the 7th European Conference onthe History of Economics held at the University of Quebec at Montreal in 2002, whose purpose was toexplore ‘‘the role of visual imagination in the history of economics.’’ Also of interest is Leonard (1999),which studies Otto Neurath’s engagement with art in the representation of social order.3See Brown and Solow (1983). Not without irony, Deirdre McCloskey (2002) suggests that moderneconomics, because it relies on qualitative theorems and significance tests, should be called ‘‘Samuelsonian’’economics.
176 JOURNAL OF THE HISTORY OF ECONOMIC THOUGHT
Samuelson was also the author of Economics: An Introductory Analysis (firstpublished in 1948), a textbook devoted to undergraduate students that gained hima reputation both within and outside of the economics’ profession. Economics wasalso a much more visual book than Foundations. It has often been asserted that hisdiagrammatic presentation of the theory of income determination strongly contrib-uted to the dissemination of Keynesianism in the United States.4 In view of theincreasing importance of visual representation both in economics textbooks and inthe field of economic education over the past fifty years, it is incontestable thatSamuelson also played a role in this significant feature of recent economics which hasnot yet been thoroughly examined by historians.5
The changing place of visual representation from a useful tool at the core ofeconomic analysis to a pedagogical device may seem too obvious to be investigated.It can be viewed as a consequence of the mathematization of the discipline, or of thetransition from partial to general equilibrium analysis, two subjects that have beenexamined in detail by historians of economics. Yet the relation between the use ofvisual representation and those important developments of the discipline is anythingbut self-evident. Mathematical analysis can make use of many visual artifacts, andtherefore an increasing use of mathematics could have resulted in more rather thanless visualization.6 Moreover, the increasing use of visualization in economicstextbooks could hardly be explained solely by the changes in the tools of theorization.Our perspective in this article is that the changing place of visual representationshould be seen in a context of differentiation of the audience. This was a process inwhich the push for mathematical economics played a significant, but not exclusive,role. The increasing number of students taking economics courses, the birth ofa market for mass-education, and the ongoing commitment of some economists todiagrammatic methods in economics may also explain the changes affecting the placeof visual representation in the discipline. Because Samuelson played a central role inthese developments, we propose in this paper a contextualization of his attitudetoward visual representation. We show that his reluctance to use diagrams in his earlyworks such as Foundations and his endorsement of diagrams in Economics andsubsequent articles were dictated by different circumstances, corresponding todifferent audiences. Samuelson promoted the use of algebra when much of economictheory continued to rely on geometric analysis and he wrote a very visual textbookwhen others continued to make extensive use of prose. The subsequent unsympatheticreviews and harsh debates suggest that what appears today as an immutable feature ofthe discipline was then highly controversial. Our narrative shows that the changingplace of visual representation in the discipline parallels the increasing gap betweenthe creation and the diffusion of scientific knowledge.
4See Elzinga (1992), Colander and Landreth (1996), Skousen (1997), and Samuelson (1997).5Cohn et al. (2004) observe that visual representations have gained a prominent place in contemporaryeconomic textbooks and give the example of Parkin’s Economics (2000) with its 417 diagrams (Cohnet al. 2004, p. 41). Concomitantly, graphical analysis has increasingly been discussed in economiceducation (see, for instance, Wilkins 1992; Kugler and Andrews 1996). Robert Solow (1997) relates theprofusion of diagrams, schemas, and tables in current textbooks to the increasing importance offormalization in the discipline.6See for example Emmer (2005), which is devoted to the various relations existing between mathematiciansand visual artists.
SAMUELSON ON VISUAL REPRESENTATION 177
Section 2 confronts Samuelson’s interest in visual representations as a student andyoung scholar with the lack of such representations in his early work from 1941 to1947, culminating with the algebraic Foundations of Economic Analysis. It is shownthat Samuelson’s search for operationally meaningful theorems led him to abandon thediagrammatical analysis that was predominant in the economics of the 1930s. Section 3studies the visual apparatus of Economics (1948). We show that the visual treatment ofEconomics was a response to the constraints associated with mass education in theimmediate postwar period. Section 4 examines the various presentations of Samuelson’stheory of public expenditure in the 1950s. It is shown that his use of diagrams wasmotivated by the willingness to increase the communicability of economic results in theprofession. Section 5 offers concluding remarks.
II. BREAKING AWAY FROM DIAGRAMMATICAL ANALYSIS:SAMUELSON’S FOUNDATIONS (1941–1947)
Early reviewers of Samuelson’s Foundations often focused on its mathematics fortwo main reasons. First, though the book could hardly be considered the first attemptto offer a mathematical economic analysis, it was certainly the first which madealgebra visible with such ostentation; in its 439 pages, less than hundred were freefrom any mathematical symbols, and the title page was adorned with physicistJ. Willard Gibbs’s famous quotation: ‘‘Mathematics is a language.’’ Second, for mosteconomists at the time, the mathematics of Foundations made it a difficult book. Forthat reason, many early reviews were written by mathematical economists who attemptedto broaden the audience for the book by comparing Samuelson’s mathematics to previouscontributions and by assessing their accuracy. The importance of the book wasacknowledged by the fact that most reviews appeared as journal articles or extendednotes.7 Kenneth Boulding’s review article of 1948 was among the dissenting voices. Itsauthor, a moderately mathematically trained economist and soon-to-be recipient of theJohn Bates Clark medal, intended his contribution as a general statement on the place ofmathematics in economics. Like many other reviewers, Boulding realized that Samuelson’sbook constituted a shift in the way mathematics was used as a tool of theorization ineconomics, but raised a rather unusual viewpoint. Asking ‘‘what kind of mathematics ismost useful?’’ he drew the distinction between the ‘‘analytical (algebraic)’’ and ‘‘thegeometric method.’’ Boulding pleaded in favor of the latter, which was ‘‘a very convenientway of dealing with discontinuities, the description of which is very awkward in analyticalterms’’ (Boulding 1948, p. 191). By contrast, the analytical method used by Samuelsonseemed too complicated and lacked generalizability.
Still, Boulding’s disagreement with Samuelson’s ‘‘analytical method’’ concernedmore than the simple matter of the significance of discontinuities. One canunderstand his critique through the lens of the British diagrammatic economics inwhich he was trained.8 This tradition can be traced back to Alfred Marshall’s early
7See for example Baumol (1949) and Allen (1949).8A former chemistry student from Liverpool, Boulding chose economics as a field of study during a visitto Oxford where he met Lionel Robbins. The latter advised him to read Marshall’s Principles as anintroduction to the discipline. See Boulding (1989), p. 639.
178 JOURNAL OF THE HISTORY OF ECONOMIC THOUGHT
papers, such as those on the ‘‘Theory of Foreign Trade,’’ in which he asserted that‘‘diagrams present simultaneously to the eye the chief forces which are at work, laidout, as it were, in a map; and thereby suggest results to which attention has not beendirected by the use of the methods of mathematical analysis’’ (Marshall 1930 [1879],p. 5).9 Marshall’s ideas on the use of diagrammatic analysis were rooted in thetradition of Cambridge philosophy of science, which considered that the method ofcurves should be seen as distinct from the rules of mathematics and geometry.10
Marshall’s papers circulated privately, much to their author’s discontent, and hismethod of curves was widely disseminated by his disciple Henry Cunynghame. Thatmay explain why, two decades after Marshall’s death, the tradition of diagrammaticalanalysis was still prevalent among British economists, even among those who haddismissed Marshall’s partial equilibrium analysis in favor of the Walrasian generalequilibrium framework. John Hicks’s Value and Capital, published in 1939,reasserted Marshall’s preference for diagrams, and strived to find a new diagrammaticmethod for the treatment of more than two or three simultaneous commodities.11
Those economists did not necessarily draw on Marshall’s philosophical backgroundbut they all shared a strong belief in the analytical and communicational virtues ofdiagrams, and though they were aware of their limits, they seemed reluctant to usealgebraic analysis, which they pushed into appendices and endnotes.
In 1931, when Samuelson entered the University of Chicago at the age of sixteen,diagrammatic analysis was not as firmly entrenched in the practice of Americaneconomists as it was in Britain. Though Frank Knight, Jacob Viner, and HenrySimons were close to the economic theory that dominated England, theirs was moreliterary, less mathematical than the English version.12 Among the Chicagoans, JacobViner, the greatest neoclassical economist ever according to Samuelson, followedMarshall’s tradition and used diagrams to some extent, especially in his lectures oninternational trade. Viner, however, could not be considered a visual thinker in thesame sense as the British economists already mentioned were. In his Studies in theTheory of International Trade (1937), diagrams were not really used as theoreticaldevices but rather as historical arguments, which the author used to synthesize andappraise past theories. For example, one of Viner’s most famous diagrams in thisbook, which showed the intersection between the production possibility frontier and
9This conception was not shared by all of Marshall’s contemporaries. Edgeworth, for example, adoptedan opposite point of view (see his 1894 article on the ‘‘Theory of International Values’’).10See Klein (1995), Weintraub (2002), and Cook (2005). Klein notes: ‘‘By the 1870s, graphs were notsubstitutes of equations or tables pegged, with apology at the end of a work for the mathematicallyilliterate; they were tools for exploring and describing phenomena that could not easily be captured byalgebra, calculus or words’’ (Klein 1995, p. 113).11Hicks wrote: ‘‘One often hears, particularly from those who are engaged in the study of the mostintricate questions, a wish for some method of dealing, at once, with more than two of three variables.Simple problems of two or three variables can be dealt with, quite efficiently, by geometrical diagrams;but when the problem becomes more complex, the familiar geometric method fails. What is to be done?The obvious answer is, Have recourse to algebra. But, quite apart from the fact that many economists arenot very good at algebra, the sort of algebraic methods commonly employed, while they are of some usein setting out problems, are much less efficient as a means of argument than diagrams appear to be, whendiagrams can be used’’ (Hicks 1939, p. 1).12In addition, institutionalism was still highly influential in American economics until the late forties (seeYonay 1998).
SAMUELSON ON VISUAL REPRESENTATION 179
the collective indifference curve (see p. 521), was used by the author to introducea critique of Gottfried Haberler’s theory.13 Viner’s blackboard errors were asnotorious as his renown as an impressive and frightening professor. Samuelson,who attended Viner’s graduate course in the academic year of 1934–1935 though hewas an undergraduate in his senior year, gained a reputation as a wunderkind bycorrecting them. Samuelson notes that ‘‘Viner had a custom of coming to class withcomplicated diagrams to be copied on the blackboard. Such transcriptions arenotoriously subject to minor errors in which curves intersect on the wrong side ofaxes and so forth’’ (Samuelson 1972, p. 8). It is unclear whether those ‘‘pettyaberrations’’ hurt Viner’s reputation among students, but they probably gaveSamuelson a rather jaded view of the rigor and accuracy of diagrams.14
On the other hand, when Samuelson entered Harvard University after hisgraduation in 1935, he was particularly influenced by the ideas and personality ofEdwin B. Wilson who taught mathematical economics there.15 Born in 1879, Wilsonwas a Yale-educated physicist and mathematician, interested in various socialsciences and not only in economic theory. He was Josiah Willard Gibbs’s onlyprotege. Though few students and scholars actually attended his lectures at Harvard,his advocacy for a careful application of the mathematical apparatus used in physicsto the social sciences was of importance for the genesis of Samuelson’s Founda-tions.16 In 1928, while Wilson was participating in a roundtable on the future ofquantitative economics, joining some neoclassical economists such as Viner andFrank Taussig to oppose the views of Wesley Mitchell, he pleaded for the use ofqualitative mathematics in economics. ‘‘Many persons seem to believe thatmathematics is essentially quantitative, but the first stages in analysis are generallyqualitative and mathematics has a large branch which deals with qualitative matters’’(in Mills 1928, p. 37). Interestingly, Viner’s contribution to the debate was to arguethat only the use of a more technical apparatus would lead to a better interactionbetween theoretical economics and empirical research. Answering the criticism thatthe foundations of neoclassical economics were too abstract to allow for a goodrecognition of facts, Viner claimed that, on the contrary, more abstract foundationswould help build a more rigorous economic theory. These suggestions, expressed byboth Viner and Wilson on the occasion of this roundtable, constituted one of the mainorientations of modern neoclassical economics in the post-war period. Foundations,
13It is very different from the way Abba Lerner used the same diagram in his first published article (1932.Lerner used the diagram to represent various combinations of cost conditions without actually discussingits theoretical background.14Notorious was also the fact that Viner did not draw his diagrams himself. Y. K. Wong did. Wong wasa Chinese statistician who, in 1931, attempted unsuccessfully to correct Viner’s long-run cost curveenvelope, arguing—and rightly so—that it could not be drawn through the minimum points of the short-run average cost curves. This was one of the most famous errors in the history of economics. When Viner,after admitting before the classroom that Wong had been right about the envelope, said privately to theyoung Samuelson he nevertheless kept on thinking he could trace it, the latter replied: ‘‘With a good thickpencil, you can do it’’ (Samuelson 1972, p. 9).15It is noticeable that Samuelson later explained he was drawn to Harvard because of his interest inChamberlin’s theory of monopolistic competition ‘‘by miscalculation’’ (Samuelson 1998, p. 1376).16Samuelson (1998) notes that, apart from himself, the only students in Wilson’s seminar were AbramBergson, Sidney Alexander, and Joseph Schumpeter.
180 JOURNAL OF THE HISTORY OF ECONOMIC THOUGHT

an adaptation of Samuelson’s PhD dissertation, ‘‘The Observational Significance ofEconomic Theory: A Study in the Foundations of Analytical Economics,’’ writtenunder Wilson’s supervision, was undoubtedly one of the cornerstones of this largermovement.
More precisely, Samuelson’s purpose in Foundations was to determine operation-ally meaningful theorems, i.e. theorems that would turn abstract economic conceptsinto a set of observable or measurable data.17 Provided that these theorems weredetermined, economic theory could be tested and eventually accepted or refutedin the Popperian sense of the term. According to Samuelson, this process ofoperationalization would reveal ‘‘the unmistakable signs of decadence which wereclearly present in economic theory prior to 1930’’ (Samuelson 1947, p. 4).Samuelson’s dedicated tools to show the existence of such theorems were compar-ative statics and dynamics. Samuelson’s only methodological justification for hisextended use of algebra and matrices against any other method of inquiry wasessentially strategic (Ibid., p. 6). Actually, his justification was not so much in the textitself as in the intellectual authorities outside of the economics’ profession to whichhe appealed. In addition to Gibbs’s sentence on the title page, Samuelson began hisintroduction by quoting mathematician Eliakim H. Moore’s defense of generalizationby abstraction. Turning Marshall’s ‘‘Burn the Mathematics’’ upside down, he thendismissed ‘‘[t]he laborious literary working over essentially simple mathematicalconcepts such as is characteristic of much of modern economic theory’’ as ‘‘not onlyunrewarding from the standpoint of advancing the science’’ but ‘‘involv[ing] as wellmental gymnastics of a peculiarly depraved type’’ (Ibid., p. 6).
His critique was not so much addressed to the non-mathematical mode ofreasoning as to the process of translation from the mathematical to the literary modeof exposition. Given that for some economists diagrams were the appropriate tools toaddress the poorly mathematically-trained reader, it is a little surprising thatFoundations had so few of them. While mathematical economics books, such asIrving Fisher’s Mathematical Investigation in the Theory of Value and Prices orHicks’s Value and Capital, contained a number of innovative visual artifacts meant toease the way for more complicated mathematics, Samuelson’s book deliberatelyavoided them. The six diagrams included in Foundations were intended as mereillustrative devices. This was particularly obvious from the section devoted to indexnumbers. Earlier contributions on index numbers, such as Hans Staehle’s and AbbaLerner’s articles in the Review of Economic Studies, involved an extensive use ofdiagrams.18 By contrast, Samuelson used only one diagram, which added littleinformation to the words used to conduct the demonstration. Though Samuelsonsporadically referred to geometry and curves throughout the book, he depicted thoseusing words, not diagrams (see, for example, his treatment of cost curves, p. 79). Two
17Exemplary of this research program was also Samuelson’s theory of consumer’s behavior he had firstpublished in 1938, though his attempt to eschew the theory of utility in this article was slightlyundermined in several subsequent articles and in Foundations (see Hands and Mirowski 1998).18On the other hand, when Samuelson criticized the ‘‘fondness’’ economists had developed for ‘‘certaindimensionless expressions called elasticity coefficients,’’ noting that they were only ‘‘mental exercises forbeginning students’’ (Samuelson 1947, p. 125), he was certainly referring to some of the works Lernerand his fellow LSE scholars had done at the beginning of the previous decade.
SAMUELSON ON VISUAL REPRESENTATION 181

of the diagrams were reinventions of Marshall’s curves in his ‘‘Pure Theory ofForeign Trade,’’ which Samuelson used only to show that his own mathematicalanalysis was a generalization of Marshall’s (Ibid., p. 266).19 In addition, Samuelsondismissed all economic concepts which could not benefit from his search foroperationally meaningful theorems. Most of those, indeed, had been defined andexplored visually by previous contributors, such as complementarity (Ibid., p. 183)and consumer’s surplus (Ibid., p. 195).20 In short, the quasi-absence of visualrepresentation from Foundations reflected not so much the author’s lack of interest indiagrams but rather a rough rejection of entire sections of economic theory which hadpreviously been framed in diagrammatic analysis. Methodological justificationsaside, the use of a different language of inquiry was required to enhance the book’snovelty and reinforce the feeling that Samuelson was departing from previouseconomic theorizing. This strategy was especially unusual given that in theoreticalbooks, unlike in scientific articles, greater attention was given to audience, so thatfresh theories were usually presented in a rather polished and palatable fashion. InHicks’s Value and Capital, for example, the use of diagrammatic analysis testified toa bargain between accuracy and communication. For Samuelson, however, it seemsthat the greater accuracy allowed for by the use of algebra could not be bargainedaway in a book devoted to the advancement of economic theory.
Actually, as early reviewers unanimously observed, communication was not one ofSamuelson’s main concerns in Foundations. Metzler (1948) and Carter (1950) notedthat the final mathematical appendix, which was intended as a brief textbook ondifference equations, was hardly readable for the uninitiated. Carter added thatFoundations’ mathematics was ‘‘often obscure; and the obscurity often arises, notfrom the inherent difficulties of the subject, but from the use of a notation which isunexplained, or difficult to be remembered over several pages of argument, orexcessively general’’ (Carter 1950, p. 51). Roy Allen found Samuelson’s mathematics‘‘not simplified enough for the economist and not rigorous enough to satisfy themathematician’’ (Allen 1949, p. 114). George Stigler considered Samuelson’s‘‘failure to provide translations for the ‘literary’ economist a serious shortcomingof his work,’’ pleading for a greater ‘‘responsibility to the canons of scholarship’’(Stigler 1948, p. 605). William Baumol emphasized the more rhetorical side ofFoundations’ algebraic apparatus, suspecting that ‘‘one will be left with the feelingthat it is occasionally overdone here’’ and assuming that Samuelson was ‘‘toounwilling to adapt himself to the needs and limitations of his potential readers’’(Baumol 1949, p. 160).21 Most reviewers argued that Samuelson’s mathematics wasunnecessarily complicated, but Boulding went further. ‘‘[T]here is among mathe-matical economists a certain feeling (from which Samuelson is by no means exempt)
19It is also interesting to note that all but one diagrams were included in two chapters that had beenpreviously published in Econometrica (chapters IX and X). One might infer from this that Samuelson’soriginal PhD dissertation was even less visual than the published book.20Nicholas Georgescu-Roegen’s ‘‘A diagrammatic analysis of complementarity’’ (1952) was a responseto Samuelson’s criticism.21We are not insisting here on the number of typographical errors and other mistakes that the authors haveraised in their reviews, for we know that careless proof correction was due to Samuelson’s intricaterelationship with Harvard University Press, as explained in Samuelson 1998.
182 JOURNAL OF THE HISTORY OF ECONOMIC THOUGHT
that there is something childish and elementary about geometrical treatments and thatanalytical treatment is the only ultimately satisfactory method’’ (p. 191). Noting thatSamuelson’s algebra added ‘‘much to the aesthetics of economics but surprisinglylittle to its substance,’’ he remarked that in some cases algebra could even be inferiorto diagrammatic analysis, the latter being ‘‘much more suited to dealing withfunctions ‘in the large’ than the analytic [algebraic] method’’ (Ibid., p. 192).Samuelson succinctly answered Boulding’s criticism in private correspondence:‘‘Any controversy between geometry and analysis,’’ he noted, ‘‘involves strategynot principle.’’22 His answer was not mere rhetoric. Samuelson did not dismissdiagrammatic analysis as an engine of discovery; ideally, geometry should be on anequal footing with algebra as an analytical device. His reluctance to use diagrams inFoundations reflected his opposition to careless and inaccurate practices by theuninitiated who had been misled by the apparent accessibility provided by thegeometrical method of exposition. By adopting the algebraic mode of exposition,Samuelson thought he would erase the illusion of simplicity, and make the field ofpure theory a domain for specialists. Communication, on the other hand, could onlybe worked out, as he wrote to Boulding, ‘‘provided that this is not pushed so far as toslow down unduly the development at the frontier.’’23
III. INTRODUCING ECONOMIC THEORY THROUGHVISUALIZATION: SAMUELSON’S ECONOMICS (1948)
Published in the wake of Foundations, Economics: An Introductory Analysis wasa textbook intended for undergraduate students. Following Lorie Tarshis’s TheElements of Economics, it was the second textbook to incorporate the Keynesianmessage. As noted by Kenneth Elzinga, its commercial success could be explained bytwo rather unusual diagrams: the circular flow diagram which had its roots in FrankKnight’s wheel of wealth, and the Keynesian Cross, which ‘‘became the standardformat to teach the Keynesian system to principles students’’ (Elzinga 1992,p. 863).24
Despite what Elzinga implies, the idea that diagrams helped students betterunderstand economics was not widely accepted among the economics professionin the interwar period, and most economists were then reluctant to use visualrepresentation for pedagogical purposes. Reviewing a number of textbooks and
22Samuelson to Boulding, July 13th 1948, Kenneth Ewart Boulding Papers, Bentley Historical Library,University of Michigan, Box 3. Emphasis by Samuelson. I am grateful to Philippe Fontaine for drawingmy attention to this correspondence.23Samuelson to Boulding, July 13th 1948, Boulding Papers, Box 3.24According to Elzinga, and based on McGraw-Hill sales figures, 42,757 copies were sold for only theyear of 1948 and the first edition sold 121,453. The highest sales encountered were for the sixth edition,which sold more than 400,000. For an account of the origin of Knight’s wheel of wealth and its influenceon Samuelson’s circular flow diagram, see Patinkin (1973). On the influence of Samuelson’s KeynesianCross see also Blaug (1984): ‘‘[Samuelson’s] elementary textbook, Economics, containing his inventionof the ‘45-degree Keynesian Cross’ diagram to depict the determination of national income, was a majorfactor in the Keynesian conquest of economics departments in the years after World War II’’ (Blaug 1984,p. 248).
SAMUELSON ON VISUAL REPRESENTATION 183

presenting his views on economic education, Charles E. Persons wrote in 1916:‘‘Mere outlines of lectures—notes made to save the students’ ink—are valueless. Ofsimilar sort are the elaborate endeavors to simplify the study of economics throughthe use of diagrams and illustrations. It is not thus that one thinks effectively of thingseconomic. . . . Our function is not to painlessly and surreptitiously make lodgment ofour doctrines in the student mind. It rather behooves us to stir him to high endeavorand give continual mental exercise to his mental muscle; to send him out finally wellexercised in economic thinking and confident of his ability to perform well in thatfield’’ (Persons 1916, p. 97). Such reluctance was discernable even among thoseeconomists who used diagrams extensively as research engines. In Marshall’sPrinciples, most diagrams appeared in footnotes. His Economics of Industry, whichwas an abridged version of Principles intended for junior students, contained evenfewer diagrams. Lerner’s 1944 book, Economics of Control, had only a few diagrams,though it included some of the results its author had obtained graphically in a seriesof articles published between 1933 and 1936. When asked by his friend Mary Wisewhy he did not choose a graphical exposition, Lerner replied: ‘‘I think you are rightabout the advisability of having put some diagrams in for the sake of making it easier,but I was much of the time thinking of getting others than university students ofeconomics to read the book and these would have been frightened by diagrams andnot helped by them much, if at all.’’25 Taussig’s Principles of Economics, still one ofthe most influential textbooks in the early postwar period though its first edition hadbeen published in 1911, was a very austere book with only a dozen diagrams. Anotable exception, Boulding’s textbook Economic Analysis (1941) had 158 diagrams,but it was conceived not only as a book for students but also as a theoreticalcontribution, which may explain why the complexity of its graphical apparatus wascriticized by most early reviewers. Apart from this, there was the abiding feelingamong the economics profession that diagrams were not for everyone, especially forthe students taking economics courses as a minor subject.
The scarcity of visual representations in economics textbooks contrasted with thefact that American mass culture had become increasingly visual since the end ofWWI. Created in 1912 by Paul Kellogg, the liberal magazine Survey Graphicpromoted the use of visual representation as a way to diffuse the results of socialscientific research to a larger audience, using statistical charts and various othervisual artifacts. Under the influence of the photographic essays that were included inthe periodical, the Farm Security Administration, created in 1937, hired a newgeneration of photographers to document poverty and to promote New Dealprograms. Those photographs , which were also diffused in the newly creatednewsmagazines like Look and US Camera, contributed to a shift in the role of visualrepresentation from a simple illustrative device to a tool of communication andpersuasion intended for a larger audience.26 The invention of a new technology todisplay images helped increase that movement. Before the war, most Americans usedto go to movie theatres at least once a week. By the time Economics was published in1948, American citizens were buying their first TV sets ‘‘at increasingly dramatic
25Lerner to Wise, June 16th 1944, Abba Ptachya Lerner Papers at the Library of Congress, ManuscriptReading Room, Box 19 Folder 5.26On the influence of the FSA photographs on US print culture, see Finnegan (2003).
184 JOURNAL OF THE HISTORY OF ECONOMIC THOUGHT

rates’’ (Baughman 2006, p. 30). In addition, the end of World War II fostered theintroduction of visual aids into education in various fields. After Congress voted theGI Bill, which offered scholarships to those ex-servicemen who wanted to pursuehigher education, the number of students increased significantly in US colleges anduniversities. Whereas less than 200,000 bachelor degrees were awarded annually byUS universities before WWII, this figure rose to 271,000 in 1947–8 and 432,000 in1949–50.27 Many students took economics courses as a minor field of study as part oftheir undergraduate programs; they just wanted to gain basic knowledge in order tobecome engineers or businessmen. Visual aids could be helpful in this respectespecially as they had proven their efficiency as pedagogical devices during wartimewhen time was of the essence.28
Thus, it is not surprising that in 1950, when the Committee on the UndergraduateTeaching of Economics and the Training of Economists published its report to theAmerican Economic Association under the supervision of Horace Taylor, an entiresection was devoted to the use of visual aids in the teaching of economics. The reporthighlighted the growing demand for visual materials—not only diagrammatictextbooks but also motion pictures and film strips—by those who taught economicsat the introductory level.29 Among the publishers who filled the demand was the firmMcGraw-Hill which specialized in textbooks for engineers. Those books were full ofschemas and patterns, and some of them were extensively used by the US armyduring WWII. Samuelson’s Economics was McGraw-Hill’s first foray into the field ofeconomics textbooks. Its author was particularly well-placed to be aware of thechanges affecting US education, as a young professor at MIT who mostly taughtsoon-to-be engineers, some of them coming from the US army contingent. Asa researcher, Samuelson had worked since 1941 for the Radiation Laboratory,a research center which had been established at MIT by the National DefenseResearch Committee. His work there contributed to the improvement of the NavyMK-56 automatic gun aiming device.30 Having completed his PhD dissertation, hetemporarily left the field of economic theory and became entrenched in the culture ofapplied mathematicians working for the military.31 In 1945, there were 8,000 studentswho had to take a one-year seminar in economics, a course that was quite unpopularat the time. Samuelson was asked to write an introductory textbook for thoseparticular undergraduate students. In this context, it is likely that Samuelson’s visualrepresentations in Economics were influenced more by the visual culture ofengineering than by the tradition of diagrammatic analysis he had somewhatdismissed in his Foundations.
27See Backhouse (2008), p. 523.28Burlingame (1959) wrote: ‘‘During the war visual education was widely used in quick trainingprograms. At that time when the requirement of speed was paramount, the people in command of trainingprojects seized upon any device that could help quicken the instruction. Factory workers were taught byfilms how to use lathes or millers; men in the Army medical corps were shown films on first-aidprocedures; soldiers were taught everything from machine-gun assembly to venereal prophylaxis bymotion pictures’’ (Burlingame 1959, p. 407).29See Taylor (1950), especially pp. 187–201.30See Mirowski (2002), p. 225.31In a 1950 article, Samuelson described himself as being ‘‘out of economics’’ during this period. SeeSamuelson (1950), p. 358.
SAMUELSON ON VISUAL REPRESENTATION 185
Economics’ visual apparatus was different from what had been done in previoustextbooks. It embraced the development of visualization as a mass medium. Actually,it was almost unrelated to the diagrammatic analysis of Boulding’s textbook of 1941.On purely quantitative considerations, the first edition of Economics did not representa step forward in visual economic education. It had only 75 diagrams, which did notconstitute a major difference with Frederic Garver and Alvin Hansen’s Principles ofEconomics, one of the economic textbooks students were assigned to read at Harvard.Yet the structure of Economics’ visuals was completely different: Samuelson’s bookcontained as many statistical charts as analytical diagrams, whereas analyticaldiagrams were predominant in Garver and Hansen. In the latter, the majority ofdiagrams were located in the microeconomics section, whereas Samuelson used morevisual aids to introduce macroeconomics.
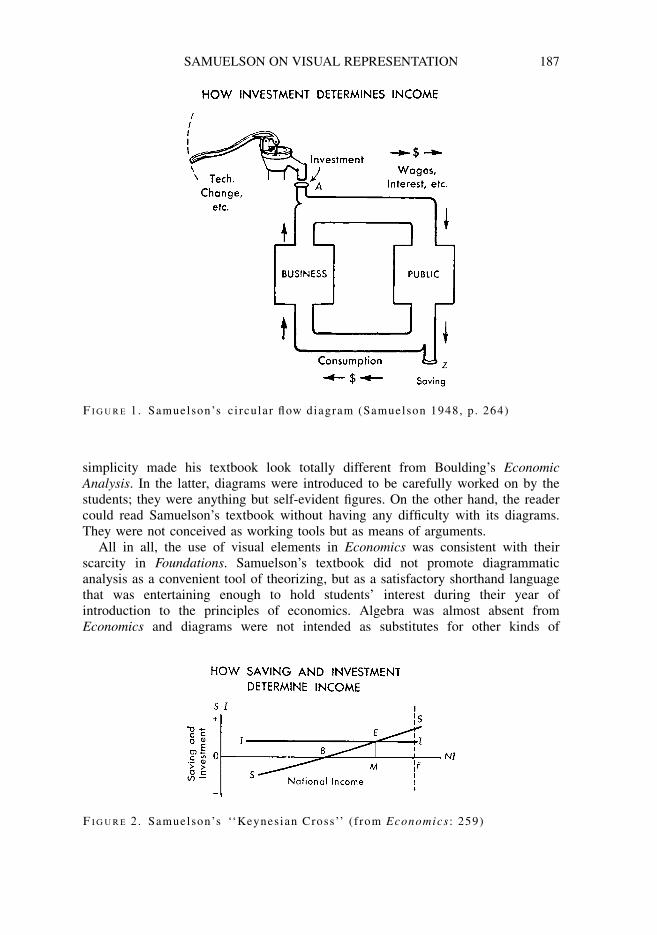
One of the most important visual elements in Economics, the circular flowdiagram, inspired by Knight but drawn in the fashion of Fisher’s hydraulic apparatus,was used to explain the Keynesian principle of the multiplier metaphorically(Samuelson 1948, p. 264 and Figure 1 below). Visually, it looked like one of themany engineering diagrams MIT undergraduate students were likely to encounter. Ithad two spigots, representing investment and saving. Of course, the equilibrium isreached when saving equals investment.
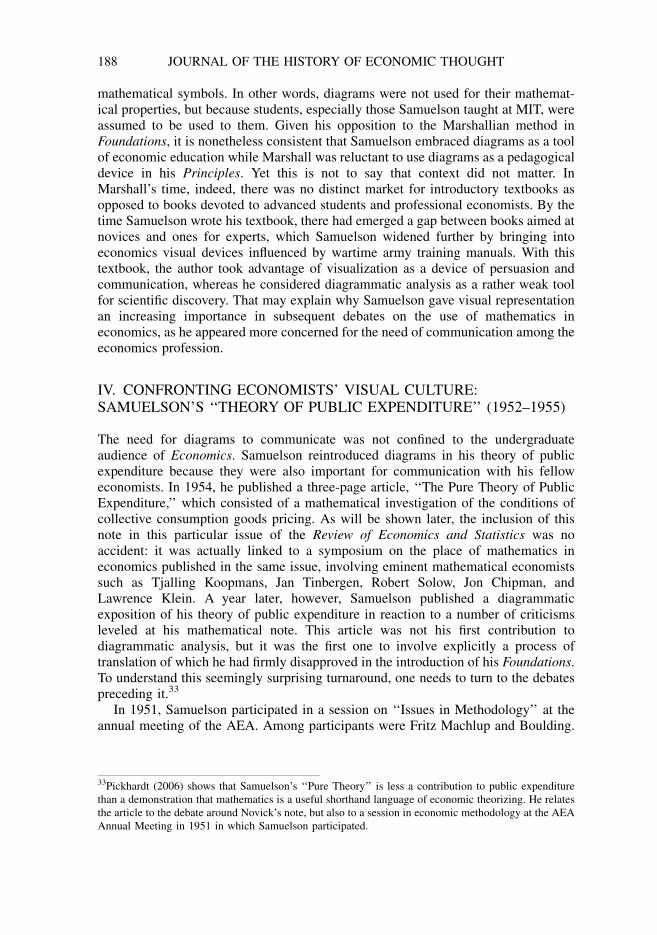
The circular flow diagram allowed for a ‘‘restatement’’ of the theory of income thatSamuelson had introduced a few pages before in the form of the 45-degree diagram,a figure that he had previously used in a 1939 article in the Journal of PoliticalEconomy.32 This diagram represented the intersection between the global demand andsupply curves and the determination of national income (p. 260). The same level ofnational income could be alternately obtained by representing the intersection of thesaving curve with the investment line (see Figure 2). This diagram, later known as theKeynesian Cross, was reproduced on the cover and the spine of the book.
In spite of its instant appeal for teaching purposes, the ‘‘Keynesian Cross,’’ likeMarshallian supply and demand curves, did not allow for the internal mechanics to beseen. The curves helped determine the equilibrium but did not explain the process andthe hypotheses underlying it. The circular flow schema helped complete thedemonstration by describing the principle of the multiplier in a convenient way.The diagram was a relevant tool to display some results that were already known, butan analogy was necessary to depict the economic machinery. In other words, theschema brought in more explanatory power than the diagram.
Samuelson’s figures in Economics were interesting not only because of theirintrinsic properties but also because of the way they were displayed. Compared withthose of Taussig or Garver and Hansen, Samuelson’s visual representations were clearand simple, filled with captions, embellishments, symbols, stipples and stripes thateased the reader’s comprehension. In addition, Samuelson offered many statisticalcharts taken from various sources and displayed them in a fashionable way.Parallelism was one of the numerous artifacts Samuelson used in order to gain bothclarity and enhancement in his visual explanations. Samuelson’s striving for visual
32Samuelson later explained (1959) that the article was a correction of one of Alvin Hansen’s numericalexamples in his 1938 book, Full Recovery or Stagnation. Hansen himself used the diagram in his visualexposition of Keynes’ theory (1953).
186 JOURNAL OF THE HISTORY OF ECONOMIC THOUGHT
simplicity made his textbook look totally different from Boulding’s EconomicAnalysis. In the latter, diagrams were introduced to be carefully worked on by thestudents; they were anything but self-evident figures. On the other hand, the readercould read Samuelson’s textbook without having any difficulty with its diagrams.They were not conceived as working tools but as means of arguments.
All in all, the use of visual elements in Economics was consistent with theirscarcity in Foundations. Samuelson’s textbook did not promote diagrammaticanalysis as a convenient tool of theorizing, but as a satisfactory shorthand languagethat was entertaining enough to hold students’ interest during their year ofintroduction to the principles of economics. Algebra was almost absent fromEconomics and diagrams were not intended as substitutes for other kinds of
FIGURE 1. Samuelson’s circular flow diagram (Samuelson 1948, p. 264)
FIGURE 2. Samuelson’s ‘‘Keynesian Cross’’ ( f rom Economics : 259)
SAMUELSON ON VISUAL REPRESENTATION 187
mathematical symbols. In other words, diagrams were not used for their mathemat-ical properties, but because students, especially those Samuelson taught at MIT, wereassumed to be used to them. Given his opposition to the Marshallian method inFoundations, it is nonetheless consistent that Samuelson embraced diagrams as a toolof economic education while Marshall was reluctant to use diagrams as a pedagogicaldevice in his Principles. Yet this is not to say that context did not matter. InMarshall’s time, indeed, there was no distinct market for introductory textbooks asopposed to books devoted to advanced students and professional economists. By thetime Samuelson wrote his textbook, there had emerged a gap between books aimed atnovices and ones for experts, which Samuelson widened further by bringing intoeconomics visual devices influenced by wartime army training manuals. With thistextbook, the author took advantage of visualization as a device of persuasion andcommunication, whereas he considered diagrammatic analysis as a rather weak toolfor scientific discovery. That may explain why Samuelson gave visual representationan increasing importance in subsequent debates on the use of mathematics ineconomics, as he appeared more concerned for the need of communication among theeconomics profession.
IV. CONFRONTING ECONOMISTS’ VISUAL CULTURE:SAMUELSON’S ‘‘THEORY OF PUBLIC EXPENDITURE’’ (1952–1955)
The need for diagrams to communicate was not confined to the undergraduateaudience of Economics. Samuelson reintroduced diagrams in his theory of publicexpenditure because they were also important for communication with his felloweconomists. In 1954, he published a three-page article, ‘‘The Pure Theory of PublicExpenditure,’’ which consisted of a mathematical investigation of the conditions ofcollective consumption goods pricing. As will be shown later, the inclusion of thisnote in this particular issue of the Review of Economics and Statistics was noaccident: it was actually linked to a symposium on the place of mathematics ineconomics published in the same issue, involving eminent mathematical economistssuch as Tjalling Koopmans, Jan Tinbergen, Robert Solow, Jon Chipman, andLawrence Klein. A year later, however, Samuelson published a diagrammaticexposition of his theory of public expenditure in reaction to a number of criticismsleveled at his mathematical note. This article was not his first contribution todiagrammatic analysis, but it was the first one to involve explicitly a process oftranslation of which he had firmly disapproved in the introduction of his Foundations.To understand this seemingly surprising turnaround, one needs to turn to the debatespreceding it.33
In 1951, Samuelson participated in a session on ‘‘Issues in Methodology’’ at theannual meeting of the AEA. Among participants were Fritz Machlup and Boulding.
33Pickhardt (2006) shows that Samuelson’s ‘‘Pure Theory’’ is less a contribution to public expenditurethan a demonstration that mathematics is a useful shorthand language of economic theorizing. He relatesthe article to the debate around Novick’s note, but also to a session in economic methodology at the AEAAnnual Meeting in 1951 in which Samuelson participated.
188 JOURNAL OF THE HISTORY OF ECONOMIC THOUGHT
In his contribution, ‘‘Economic Theory and Mathematics—An Appraisal,’’ Samuelsonanswered Boulding’s critical article on Foundations, though he did not make this targetexplicit. Samuelson’s article addressed Boulding’s critique point by point, beginningwith the relevance of mathematics as a language. Then, Samuelson devoted one sectionto the debate between algebra and geometry.34
Today, when an economic theorist deplores the use of mathematics, he usually
speaks up for the virtues of geometrical diagrams as the alternatives. It was not
always thus. Seventy years ago, when a man like Cairnes criticized the use of
mathematics in economics, probably he meant by the term ‘‘mathematics’’ primarily
geometrical diagrams. From the point of view of this lecture, the ancients were more
nearly right than the modern critics. Geometry is a branch of mathematics, in exactly
the same sense that mathematics is a branch of language. . . . [W]hat is not at all clear
is . . . why any modern methodologist should find some virtue in two-dimensional
graphs but should draw the line at third or higher dimensions. I suggest that the
reason for such inconsistent methodological views must be found in the psycholog-
ical and tactical problems which constitute the remaining part of my remarks
(Samuelson 1952, pp. 59–60).
Samuelson did not really develop those remarks on psychology and strategy in his1952 article, but in the debate of 1954 we mentioned above. At the origin of thecontroversy was Novick’s two-page article in which he dismissed the idea ofmathematics as a language, claiming that mathematics should be used only whenquantification was involved.35 All the other participants strongly disagreed withNovick—Solow was undoubtedly the roughest—, turning the whole symposium intoa press tribute in favor of mathematical economics. Samuelson’s contribution to thisdiscussion shed some new light on his reluctance to provide a translation of hisalgebraic language, showing that his disdain for ‘‘mental gymnastics of a peculiarlydepraved type’’ did not stand on methodological but rather sociological grounds:
[O]ften poor mathematicians, such as Novick claims to be, do find it necessary to
work through the logical conclusions of some branch of technical economics. This
with work they can always do: for there is absolute truth in the saying: ‘‘What one
fool can learn so can another.’’ Now what happens when finally they do grasp the
contents of the theory? Quite usually, they genuinely say, ‘‘Is that all there is to it?
Why poor little me with the infinite ignorance can easily understand that—in fact I
probably knew it all along. What was all the fuss about?’’ . . . Only if you swallow
Novick’s deep-down view—that all [mathematical economists’] work has been
34Fritz Machlup, who was the chairman of the session, was also fond of diagrammatic analysis.Describing his experience as a scholar at Harvard University in 1935, Nicholas Georgescu-Roegen (1988,p. 22) wrote, ‘‘Machlup usually attended only when the topic involved diagrammatical analysis in whichhe was a deft expert.’’ This suggests that Samuelson’s remarks were also directed at Machlup.35Though Novick’s critique could be regarded as a direct attack on Samuelson’s mathematical economics,Mirowski (2002) showed that it was mainly a debate within RAND Corporation, between system analystDavid Novick and members of the Cowles Commission. Samuelson was not part of any of these twogroups, but he knew editor Seymour Harris very well and may have been invited to act as chairman of thesymposium.
SAMUELSON ON VISUAL REPRESENTATION 189

trivial—can you regard the problem of charlatanism as one of any importance. The
real problem goes much deeper and will, I think, long persist (Samuelson et al. 1954,
p. 382).
Samuelson’s rhetoric rephrased the ‘‘strategy vs. principle’’ argument he had usedin his letter to Boulding. As far as geometry and algebra are considered asmethodologically equivalent, there is no need to recast the algebraic formulation,because it will not provide much understanding among the non-mathematicallytrained community but a feeling of deception about mathematical economics.Samuelson’s viewpoint turned the debate on mathematics in economics into a matterof generation. This was reinforced by the younger participants, like Solow andChipman, the latter arguing, ‘‘[E]conomics has gone a long way since the days when . . .it was considered a great accomplishment to be able to draw a marginal curve from anaverage one. . . . This is not to suggest that . . . geometrical economics did not have animportant place in the history of economic thought. [It was], I believe [an] inevitablestage in the development of economics’’ (in Samuelson et al. 1954, p. 364).
Following this discussion, editor Seymour Harris added a note which slightlyundermined the arguments of Samuelson and his allies. He quoted a study publishedin 1953, which showed that, among the PhD candidates, only 2 percent were judgedgood in mathematical practice by their professors, 41 percent were judged fair and44 percent, poor (Samuelson et al. 1954, p. 382). Harris, who recognized himselfhaving difficulties in understanding some of the articles he used to publish, pleadedfor a better understanding between mathematical and literary economists. ‘‘Hence themathematical economist has a responsibility to communicate his results to the non-mathematical economist, and also both in the choice of problems to be treated and inthe manner of treatment not to overdo mathematical economics’’ (Ibid. pp. 385–6).Though Harris’s note was supposed to qualify the other participants’ attack onNovick’s critique, it also undermined the methodological aspects of the debate,reducing it to a question of communication.
The inclusion of the ‘‘Pure Theory of Public Expenditure’’ in the same issue of theReview of Economics and Statistics made it part of the debate, as Samuelsonexplicitly introduced it as an alternative to ‘‘[his] own views on the deeper substantivemethodological questions.’’ He noted, not without provocation, that the papercontained ‘‘most of the imperfections of communication so often charged againstmathematical economics’’ (in Samuelson et al. 1954, p. 380). Thus the article wasonly three pages long—‘‘about the space of Novick’s note.’’ The mathematics of thearticle consisted of the determination of Pareto-optimal conditions of production of n‘‘private consumption goods’’ and m ‘‘collective consumption goods,’’ with standardassumptions concerning the production possibility functions F and individual’s utilityfunction U. Samuelson’s main contribution in the paper was the second of threeoptimality conditions which showed that the sum of the individual marginal rates ofsubstitution between the public good and the private good must be equal to themarginal rate of transformation between the two goods.
In subsequent issues of the Review of Economics and Statistics, Samuelson’s‘‘Pure Theory’’ was strongly criticized on various grounds by Stephen Enke andJulius Margolis, both collaborators with Novick at RAND Corporation. Standing up forNovick, Enke refused to draw a distinction between substantive and communication
190 JOURNAL OF THE HISTORY OF ECONOMIC THOUGHT

issues, considering Samuelson’s inability to address non-mathematical economistsa serious defect of his paper:
First, it is unnecessarily unintelligible to most people. Many economists, interested
in public finance and welfare, will want to understand what anyone of Samuelson’s
reputation has to contribute. Frustration will be their lot. Moreover, this refusal to
communicate to more than a few is willful. . . . Mathematical shorthand may permit
a three-page article, but a few more words would have added many readers, some of
them capable of subsequent contributions to the theory (Enke 1955, p. 132).
On the other hand, Margolis’s critique of the Pure Theory was more substantial as itquestioned Samuelson’s definition of ‘‘collective consumption goods.’’ Samuelson’s‘‘Diagrammatic Exposition’’ of 1955 was his answer to both critical notes, with itsclear and simple diagrams. Samuelson mentioned explicitly Margolis’s article but notEnke’s note, and yet the fact that Samuelson decided to write a diagrammaticexposition could not be unrelated to previous criticisms. Samuelson’s reaction toEnke’s remarks on unintelligibility resulted in a diagrammatic exposition rather thanin a pure literary article. The fifth and last diagram in the article was a graphicaltranslation of the second equation in the 1954 paper, showing the optimal conditionas the equivalence of the public good’s marginal cost and the sum of the individual’smarginal rate of substitution between the two goods (see Figure 3 below).
By employing the graphical method, Samuelson highlighted the connectionbetween his contribution and earlier works by Eric Lindahl and Howard Bowen,a point he had just suggested in his article of 1954. His own mathematicalformulation, he argued, allowed for the generalization of an infinite number ofBowen and Lindahl diagrams. The fact that visualization had already been used in thepublic goods literature constituted however a more favorable ground for the use ofdiagrammatic analysis. Moreover, the frequent use of the imperative mode through-out the article was evidence that Samuelson was actually extending his pedagogicalskills from students to the economics’ profession. Samuelson’s diagrams in his 1955article were not comparable to those of Marshall, or to those of the diagrammaticanalysis which was predominant in the 1930s. His visualization was much simplerthan the complicated geometrical constructs of Lerner or Boulding; they were tools ofdiffusion of some previous research and not any longer the tools on which researchitself relied. Though the article of 1955 can be considered as a concession bySamuelson, showing that the advancement of science itself could not be totallydissociated from a good understanding among the profession of the results that hadalready been expressed algebraically, it did not represent a turnaround in Samuelson’suse of visual representation. On the contrary, it was evidence that visuals weresuccessfully migrating from the core of economic research to its diffusion. Actually,it is rather striking that Samuelson’s ‘‘diagrammatic representation of a theory ofpublic expenditure’’ was published in a period which constituted both a peak in thehistory of diagrammatic analysis in economics and the beginning of its decline.According to Roger Backhouse’s 1998 survey of US post-war economics through thestudy of three leading journals (AER, QJE, and JPE), the proportion of mathematicalarticles containing diagrams began to decrease in the mid-1950s, after two decades ofsteady rise. During the same period, the proportion of articles relying on algebrabegan to rise at a higher rate, as did the number of diagrams in economic textbooks.
SAMUELSON ON VISUAL REPRESENTATION 191

The sixth edition of Economics in 1964 had twice as many diagrams as the firstedition of 1948, and still it would seem arid by today’s standards.
V. CONCLUDING REMARKS
Over the course of less than two decades, the place of visual language in economicshas dramatically changed. Visual representation became an expository device aimedat the mathematically unskilled rather than an engine of discovery at the frontier ofthe discipline. Samuelson played a leading role in this process by publishing the bookwhich would set the standard for scientific writing at the research level, givingdiagrams a subsidiary role and simultaneously setting a much higher visual standardfor textbook writing. On one hand, his reluctance to use visual representation inhis early scientific writings was prompted by his rejection of all the economicconcepts which did not fit into his theoretical framework, most of them related to
FIGURE 3. Intersect ion between publ ic good’s marginal cost curve and the sumof the individual’s rates of subst i tut ion between private and publ ic goods(Samuelson 1955, p. 354)
192 JOURNAL OF THE HISTORY OF ECONOMIC THOUGHT
diagrammatic analysis. On the other hand, his endorsement of visual language asa pedagogical device can be explained by the peculiar audience he was trying to reachat MIT, in a context marked by the invention of new tools to provide mass education.This duality may explain why certain diagrams achieved almost mythical statusamong students even though teachers often despise them as a vulgar form ofknowledge.
Norton Wise has argued, in the context of the history of science, that accounts ofvisualization should break free from the traditional division between algebra andgeometry because ‘‘[g]eometric intuition never gets far without analytic abstractionand vice versa’’ (Wise 2006, p. 81). In contrast, the episode discussed here suggeststhat this distinction has to be taken into account because it reflects the wayparticipants actually reasoned: the relevance of geometry versus algebra was oneof the points at issue. Boulding, for example, explicitly introduced this distinctionbecause he found it useful to discuss the future of mathematical economics. On theother hand, Samuelson’s statement that ‘‘geometry is a branch of mathematics’’seems to suggest that he did not find this distinction very useful for discussion.Perhaps a better mathematician than Boulding, Samuelson was more conscious of thecontroversies between Lagrange and Newton, which showed that both geometry andalgebra contributed to the advancement of physics. It is customary to associatemathematics (algebra) with general equilibrium and diagrams (geometry) with partialequilibrium but that does not get us to the heart of the issue. Hicks, for example, triedto reconcile the use of diagrams with the general equilibrium framework, whereasSamuelson used algebra in two-variable models.
The division between Samuelson and Boulding, however, was not merely aboutdimensions. Though their debate does not only revolve around a distinction betweenthe creation of scientific knowledge and its dissemination, that was an important issuethat involved different ideals of scientific knowledge; it was not simply a dispute aboutcommunication. For Boulding, there should not be a gap between the creation anddiffusion of knowledge, even for the sake of scientific rigor. For Samuelson, rigor wasthe only valid criterion of any serious economic research, beside which any otherappreciation was subsidiary. From this, it follows that Samuelson’s and Boulding’spositions were actually incommensurable. Samuelson eschewed diagrams in Founda-tions mainly because he was using Marshall as a straw man while his real target therewas the economics of the early 1930s. On the other hand, though his thought was notfully shaped at the time, Boulding was in the process of building a theoreticalframework which he thought would help integrate the social sciences with the help ofvisual representation. Much later, he would write: ‘‘My own inclination is for graphicalanalysis of statistical data, simply because the core of our imaging process is spatialand temporal. I have argued that numbers are something of a figment of the humanimagination, that the real world consists of shapes, sizes, structures, patterns, fittings,and so on, and very often, though not necessarily, unless we can visualize them in someform, numbers do not convey very much’’ (1988, pp. 113-4). Samuelson’s point ofview is the one that eventually prevailed in the second half of the twentieth century,resulting in an increasing gap between scientific creation, driven by the use of algebra,and its diffusion, driven by the use of visual representation.
Our study of Samuelson’s use of visual representation between 1941 and 1955 hasallowed us to deconstruct historically some of the characteristics of diagrams that
SAMUELSON ON VISUAL REPRESENTATION 193

contemporary economists may find both immutable and unquestionable, such as theirobvious convenience for pedagogical purpose. Though we believe this deconstructionto be useful, we are aware that this is only a modest step toward the construction ofa satisfying history of visual representation in modern economics. The latter wouldrequire much more attention to the place of visual culture both within and outside ofthe economics profession, as well as a deeper understanding of how economics hasbeen diffused to a larger audience during the studied period. The fact that properconsideration to those elements is part of the very recent developments in the historyof economics as a discipline explains why we should expect many more contributionson the subject in the future.
REFERENCESAllen, Roy G. D. 1949. ‘‘The Mathematical Foundations of Economic Theory.’’ Quarterly Journal of
Economics 63 (1): 111–27.
Backhouse, Roger E. 1998. ‘‘The Transformation of U.S. Economics, 1920–1960, Viewed through
a Survey of Journal Articles.’’ In Mary S. Morgan and Malcolm Rutherford, eds., From Interwar
Pluralism to Postwar Neoclassicism. Annual Supplement to Volume 30 of History of Political
Economy. Durham, NC: Duke University Press, pp. 85–107.
Backhouse, Roger E. 2008. ‘‘Economics in the United States (1945 to present).’’ In Steven N. Durlauf and
Lawrence E. Blume, eds., New Palgrave Dictionary of Economics, 2nd edition, Volume 8.
New York, NY: Macmillan, pp. 522–31.
Baughman, James L. 2006. The Republic of Mass Culture: Journalism, Filmmaking and Broadcasting in
America Since 1941. Baltimore, MD: The Johns Hopkins University Press.
Baumol, William. 1949. ‘‘Relaying the Foundations.’’ Economica 16 (62): 159–68.
Blaug, Mark. 1984. Great Economists since Keynes: An Introduction to the Lives and Works of One
Hundred Modern Economists. Brighton, UK: Harvester.
Boulding, Kenneth E. 1941. Economic Analysis. New York, NY: Harper.
Boulding, Kenneth E. 1948. ‘‘Samuelson’s Foundations: The role of mathematics in economics.’’ Journal
of Political Economy 56 (3): 187–99.
Boulding, Kenneth E. 1988. ‘‘What Do We Want in an Economics Textbook?’’ Journal of Economic
Education 19 (2): 113–32.
Boulding, Kenneth E. 1989. ‘‘A Bibliographical Autobiography.’’ Banca Nazionale del Lavoro Quaterly
Review 172: 365–93.
Brown, E. Cary and Robert M. Solow, eds. 1983. Paul Samuelson and Modern Economic Theory.
New York, NY: McGraw-Hill.
Burlingame, Roger. 1959. Endless Frontier: The Story of McGraw-Hill. New York, NY: McGraw-Hill.
Carter, C. F. 1950. ‘‘Review of Foundations of Economic Analysis.’’ Economic Journal 60 (238): 351–5.
Charles, Loıc. 2003. ‘‘The Visual History of the Tableau Economique.’’ European Journal of the History
of Economic Thought 10 (4): 527–50.
Charles, Loıc. 2004. ‘‘The Tableau Economique as Rational Recreation.’’ History of Political Economy
36 (3): 445–74.
Cohn, Elchanan, Sharon Cohn, Donald C. Balch, and James Bradley, Jr. 2004. ‘‘The Relation between
Student Attitude toward Graphs and Performance in Economics.’’ The American Economist 48 (2):
41–52.
Colander, David C. and Harry Landreth, eds. 1996. The Coming of Keynesianism to America:
Conversations with the founders of Keynesian economics. Cheltenham, UK: Edward Elgar.
Cook, Simon. 2005. ‘‘Late Victorian Visual Reasoning and Alfred Marshall’s Economic Science.’’ British
Journal for the History of Science 38 (2): 179–95.
Daston, Lorraine and Peter Galison. 1992. ‘‘The Image of Objectivity.’’ Representations 40 (Special
Issue: Seeing Science): 81–128.
194 JOURNAL OF THE HISTORY OF ECONOMIC THOUGHT

De Marchi, Neil B. 2003. ‘‘Visualizing the Gains from Trade, mid-1870’s to 1962.’’ European Journal of
the History of Economic Thought 10 (4), pp. 551–72.
Derobert, Laurent and Guillaume Theriot. 2003. ‘‘The Lorenz Curve as an Archetype: A Historico-
Epistemological Study.’’ European Journal of the History of Economic Thought 10 (4): 573–85.
Edgeworth, Francis Y. 1894. ‘‘Theory of International Values.’’ Economic Journal 4 (15): 424–43.
Ely, Richard T., ed. 1923. Outlines of Economics. New York, NY: Macmillan.
Elzinga, Kenneth G. 1992. ‘‘The Eleven Principles of Economics.’’ Southern Economic Journal 58 (4):
861–79.
Emmer, Michele, ed. 2005. The Visual Mind II. Cambridge, MA: The MIT Press.
Enke, Stephen. 1955. ‘‘More on the Misuse of Mathematics in Economics: A Rejoinder.’’ Review of
Economics and Statistics 37 (2): 131–3.
Finnegan, Cara A. 2003. Picturing Poverty: Print Culture and FSA Photographs. Washington, DC:
Smithsonian Books.
Fisher, Irving. 1892. Mathematical Investigations in the Theory of Value and Price. New Haven, CT: Yale
University Press, 1925.
Garver, Frederic and Alvin Hansen. 1928. Principles of Economics. Boston, MA: Ginn and Company.
Georgescu-Roegen, Nicholas. 1952. ‘‘A Diagrammatic Analysis of Complementarity.’’ Southern
Economic Journal 19 (1): 1–20.
Georgescu-Roegen, Nicholas. 1988. ‘‘An Emigrant from a Developing Country: Autobiographical Note-
I.’’ Banca Nazionale Del Lavoro Quarterly Review 164: 3–31.
Hands, D. Wade and Philip Mirowski. 1998. ‘‘A Paradox of Budgets: The Postwar Stabilization of
American Neoclassical Demand Theory.’’ In Mary S. Morgan and Malcolm Rutherford, eds., From
Interwar Pluralism to Postwar Neoclassicism. Annual Supplement to Volume 30 of History of
Political Economy. Durham, NC: Duke University Press, pp. 260–92.
Hankins, Thomas L. 1999. ‘‘Blood, Dirt, and Nomograms: A Particular History of Graphs.’’ Isis 90 (1),
pp. 50–80.
Hankins, Thomas L. 2006. ‘‘A ‘Large and Graceful Sinuosity’: John Herschel’s Graphical Method.’’ Isis
97 (4): 605–33.
Hansen, Alvin H. 1953. A Guide to Keynes. New York, NY: McGraw-Hill.
Hicks, John R. 1939. Value and Capital. Oxford, UK: Clarendon Press.
Keynes, John Maynard. 1924. ‘‘Alfred Marshall, 1842–1924.’’ Economic Journal 34 (135): 310–72.
Klein, Judy L. 1995. ‘‘The Method of Diagrams and the Black Arts of Inductive Economics.’’ In Rima
Ingrid, ed., Measurement, Quantification and Economic Analysis. London, UK: Routledge,
pp. 98–137.
Kugler, Kenny and Kim Andrews. 1996. ‘‘Graphical Analysis and the Visually Impaired in Un-
dergraduate Economics Courses.’’ Journal of Economic Education 27 (3): 224–8.
Larkin, Jill H. and Herbert A. Simon. 1987. ‘‘Why a Diagram Is (Sometimes) Worth Ten Thousand
Words.’’ Cognitive Science 11 (1): 65–99.
Latour, Bruno. 1988. ‘‘Drawing Things Together.’’ In Michael Lynch and Steve Woolgar, eds.,
Representation in Scientific Practice. Cambridge, MA: MIT Press, pp. 19–68.
Leonard, Robert J. 1999. ‘‘Seeing is Believing: Otto Neurath, Graphic Art and the Social Order.’’ In Neil
De Marchi and Craufurd Goodwin, eds., Economic Engagements with Art. Durham, NC: Duke
University Press, pp. 452–478.
Lerner, Abba P. 1932. ‘‘The diagrammatical Representation of Cost Conditions in International Trade.’’
Economica 37: 346–56.
Lerner, Abba P. The Economics of Control. New York, NY: Macmillan & Co.
Lightman, Bernard. 2000. ‘‘The Visual Theology of Victorian Popularizers of Science: From Reverent
Eye to Chemical Retina.’’ Isis 91 (4): 351–80.
Maas, Harro and Mary S. Morgan 2002. ‘‘Timing History: The Introduction of Graphical Analysis in
the 19th Century British Economics.’’ Revue d’Histoire des Sciences Humaines 7 (October):
97–127.
SAMUELSON ON VISUAL REPRESENTATION 195
Margolis, Julius. 1955. ‘‘A Comment on the Pure Theory of Public Expenditure.’’ Review of Economics
and Statistics 37 (4), pp. 347–9.
Marshall, Alfred. 1896. Economics of Industry. London, UK: Macmillan Co.
Marshall, Alfred. 1879. Pure Theory (Foreign Trade—Domestic Values). No. 1 in Series of Reprints of
Scarce Tracts in Economic and Political Science. London: London School of Economics, 1930.
McCloskey, Deirdre N. 2002. ‘‘Other Things Equal: Samuelsonian Economics.’’ Eastern Economic
Journal 28 (3): 425–30.
Metzler, Lloyd. 1948. ‘‘Review of Foundations of Economic Analysis.’’ American Economic Review
38 (5): 905–10.
Mills, Frederick C. et al. 1928. ‘‘The Present Status and Future Prospects of Quantitative Economics (in
Round Table Discussions).’’ The American Economic Review 18 (1): 28–45.
Mirowski, Philip. 2002. Machine Dreams: Economics Becomes a Cyborg Science. Cambridge, UK:
Cambridge University Press.
Novick, David. 1954. ‘‘Mathematics: Logic, Quantity and Method.’’ Review of Economics and Statistics
36 (4): 357–9.
Patinkin, Don. 1973. ‘‘In Search of the ‘Wheel of Wealth’: On the Origins of Frank Knight’s Circular-
Flow Diagram.’’ American Economic Review 63 (5): 1037–46.
Persons, Charles E. 1916. ‘‘Teaching the Introductory Course in Economics.’’ Quarterly Journal of
Economics 31 (1): 86–107.
Pickhardt, Michael. 2006. ‘‘Fifty Years after Samuelson’s ‘The Theory of Public Expenditure’: What Are
We Left With?’’ Journal of the History of Economic Thought 28 (4): 439–60.
Samuelson, Paul A. 1938. ‘‘A Note on the Pure Theory of Consumer’s Behaviour.’’ Economica 5 (17):
61–71.
Samuelson, Paul A. 1939. ‘‘A Synthesis of the Principle of Acceleration and the Multiplier.’’ The Journal
of Political Economy 47 (6): 786–97.
Samuelson, Paul A. 1942. ‘‘The Stability of Equilibrium: Linear and Nonlinear Systems.’’ Econometrica
10(1): 1–25.
Samuelson, Paul A. 1947. Foundations of Economic Analysis. Cambridge, MA: Harvard University Press.
Samuelson, Paul A. 1948. Economics: An Introductory Analysis, 1st edition. New York, NY: McGraw-
Hill.
Samuelson, Paul A. 1950. ‘‘The Problem of Integrability in Utility Theory.’’ Economica 17 (68): 355–85.
Samuelson, Paul A. 1952. ‘‘Economic Theory and Mathematics—An Appraisal.’’ American Economic
Review 42 (2): 56–66.
Samuelson, Paul A. 1954. ‘‘The Pure Theory of Public Expenditure.’’ Review of Economics and Statistics
36 (4): 387–9.
Samuelson, Paul A. 1955. ‘‘Diagrammatic Exposition of a Theory of Public Expenditure.’’ Review of
Economics and Statistics 37 (4): 350–6.
Samuelson, Paul A. 1959. ‘‘Alvin Hansen and the Interaction between the Multiplier Analysis and the
Principle of Acceleration.’’ The Review of Economics and Statistics 41 (2): 183–4.
Samuelson, Paul A. 1964a. ‘‘A. P. Lerner at Sixty.’’ Review of Economic Studies 31 (3): 169–78.
Samuelson, Paul A. 1964b. Economics: An Introductory Analysis. 6th edition. New York, NY: McGraw-
Hill.
Samuelson, Paul A. 1972. ‘‘Jacob Viner, 1892–1970.’’ Journal of Political Economy 80 (1): 5–11.
Samuelson, Paul A. 1997. ‘‘Credo of a Lucky Textbook Author.’’ Journal of Economic Perspectives
11 (2): 153–60.
Samuelson, Paul A. 1998. ‘‘How Foundations Came to Be.’’ Journal of Economic Literature 36 (3):
1375–86.
Samuelson, Paul A. et al. 1954. ‘‘Mathematics and Economics: Discussion of Mr. Novick’s article.’’
Review of Economics and Statistics 36 (4): 359–86.
Skousen, Mark. 1997. ‘‘The Perseverance of Paul Samuelson’s Economics.’’ Journal of Economic
Perspectives 11 (2): 137–52.
196 JOURNAL OF THE HISTORY OF ECONOMIC THOUGHT
Solow, Robert M. 1997. ‘‘How Did Economics Get That Way and What Way Did It Get?’’ Daedalus
126 (1): 39–58.
Stigler, George J. 1948. ‘‘Review of Foundations of Economic Analysis.’’ Journal of the American
Statistical Association 43 (244): 603–5.
Taussig, Frank. 1911. Principles of Economics. New York, NY: Macmillan.
Taylor, Horace. 1950. ‘‘The Teaching of Undergraduate Economics.’’ American Economic Review
40 (5, part 2): 1–226.
Viner, Jacob. 1937. Studies in the Theory of International Trade. New York, NY: Harper and Brothers
Publishers.
Weintraub, E. Roy. 2002. How Economics Became a Mathematical Science. Durham, NC: Duke
University Press.
Wilkins, Allen J. 1992. ‘‘Facilitating the Transition from Graphical to Algebraic Models: A Teaching
Challenge for Intermediate Microeconomics.’’ Journal of Economic Education 23 (4): 317–31.
Wise, M. Norton. 2006. ‘‘Making Visible.’’ Isis 97 (1): 75–82.
Yonay, Yuval P. 1998. The Struggle Over the Soul of Economics: Institutionalist and Neoclassical
Economists in America between the Wars. Princeton, NJ: Princeton University Press.
SAMUELSON ON VISUAL REPRESENTATION 197