The Changing Face of Emerging Markets - VanEck - …€¦ · The Changing Face of Emerging Markets...
12
The Changing Face of Emerging Markets August 2017 David Semple, Portfolio Manager
Transcript of The Changing Face of Emerging Markets - VanEck - …€¦ · The Changing Face of Emerging Markets...

The Changing Face
of Emerging Markets
August 2017
David Semple, Portfolio Manager

Disclosures
THIS MATERIAL MAY ONLY BE PROVIDED TO YOU BY VANECK AND IS FOR YOUR PERSONAL USE ONLY AND MUST NOT BE PASSED ON TO THIRD PARTIES WITHOUT THE
PRIOR EXPRESS WRITTEN CONSENT OF VANECK. IF YOU HAVE NOT RECEIVED THIS MATERIAL FROM VANECK, YOU ARE HEREBY NOTIFIED THAT YOU HAVE RECEIVED
IT FROM A NON-AUTHORIZED SOURCE THAT DID NOT ACT ON BEHALF OF VANECK AND THAT ANY REVIEW, USE, DISSEMINATION, DISCLOSURE OR COPYING OF THIS
MATERIAL IS STRICTLY PROHIBITED.
All indices listed are unmanaged indices and include the reinvestment of all dividends, but do not reflect the payment of transaction costs, advisory fees or expenses that are
associated with an investment in a fund. An index’s performance is not illustrative of a fund’s performance. Indices are not securities in which investments can be made.
MSCI Emerging Markets (MSCI EM) Index is a free float-adjusted market capitalization index that is designed to measure equity market performance of 24 emerging markets countries. The
MSCI Emerging Markets Investable Market Index (IMI) is a free float adjusted market capitalization index that is designed to capture large-, mid- and small-cap representation across 24
emerging markets countries. The MSCI China Index captures large and mid cap representation across China H shares, B shares, Red chips, P chips and foreign listings (e.g. ADRs). With
150 constituents, the index covers about 85% of this China equity universe. U.S. Open-Ended Diversified Emerging Markets Morningstar Category consists of emerging markets funds that
invest at least 50% of stock assets in developing nations. The MSCI ACWI index captures large and mid cap representation across 23 Developed Markets (DM) and 24 Emerging Markets
(EM) countries. With 2,494 constituents, the index covers approximately 85% of the global investable equity opportunity set.
This material does not constitute an offer to sell or solicitation to buy any security, including shares of any fund. An offer or solicitation will be made only through a fund’s
prospectus or summary prospectus and will be subject to the terms and conditions contained. This material and the information provided herein are not directed at or
intended for distribution to any person (or entity) who is a citizen or resident of (or located or established in) any jurisdiction where the distribution of these materials and/or
the purchase or sale of interests of a fund would be contrary to applicable law or regulation or would subject a fund to any registration or licensing requirement in such
jurisdiction. Persons who wish to review this material are required to inform themselves about and to observe any legal or regulatory restrictions which may affect their
eligibility to make an investment in a fund. Professional advice should be sought in cases of doubt.
Investments in foreign securities involve a greater degree of risk including currency fluctuations, economic instability and political risk. Investing in emerging markets, of which frontier
markets is a subset, involve a heightened degree of risk, including smaller sized markets, less liquid markets and other risks associated with less established legal, regulatory, and business
infrastructures to support securities markets.
The information herein reflects prevailing market conditions and our judgments as of the date of this document, which are subject to change. In preparing this document, we
have relied upon and assumed, without independent verification, the accuracy and completeness of all information available from public sources. Opinions and estimates may
be changed without notice and involve a number of assumptions which may not prove valid. There is no guarantee that any forecasts or opinions in this material will be
realized. Past performance is not a guarantee or a reliable indicator of future results. All investments contain risk and may lose value. This information should not be
construed as investment advice. This information should not be construed as sales or marketing material or an offer or solicitation for the purchase or sale of any financial
instrument, product or service, including any financial instrument, product, or service sponsored by Van Eck Associates Corporation or its affiliates. © 2017 VanEck.
No part of this material may be reproduced in any form, or referred to in any other publication, without express written permission of VanEck.
Van Eck Securities Corporation, Distributor, 666 Third Avenue, New York, NY 10017 www.vaneck.com 800.826.2333
2

Change #1: The shifting investment landscape
Source: CIT, FactSet , Citi, and MSCI. Data as of December 2016. See disclosures on page 2.
DM, EM and FM Market Cap to GDP
• Kuwait 28%, but a country with a small rich population is
not what most investors think of as a frontier market
• What are emerging markets? A disparate group of countries and markets with as many differences as similarities. There is a
world of difference between Taiwan/Nigeria and Korea/Brazil
• In 1990, Mexico and Malaysia drove performance, now China and India matter most
• Increased corporate multi-nationality – e.g. Samsung and Unilever
• China at 2% of MSCI ACWI is significantly underrepresented
3
Brazil 17%
South Africa 14%
Taiwan 12%
Malaysia 11%
Mexico 10%
India 6%
Korea 4%
Chile 4%
Argentina 4%
Indonesia 3%
Others 14%
Emerging Markets 1997
China 28%
Korea 15%
Taiwan 13%
India 9%
Brazil 7%
South Africa 7%
Mexico 4%
Russia 3%
Malaysia 2%
Thailand 2%
Others 11%
Emerging Markets 2017

Change #1: The shifting investment landscape
• Emerging markets is a dynamic, ever-changing asset class
• Not just countries, but also sectors have seen significant change in emerging markets
• A shift from transportation to commodities to technology, and a shift from state monopolies to natural and merit-based winners
4
Source: FactSet. Data as of December 2016.
See disclosures on page 2.
MSCI EM Index Holdings Over Time

Change #2: Demographics – one change that you can count on
• According to J.P. Morgan, by 2099, 90% of the world population will live in emerging markets
• By 2037, most of the global population will live in EM cities
• By 2037, India will have added more workers than the U.S. currently has
• Nigeria uses more diapers in a month than western Europe does in a year
5
Source: US Census, China National Bureau of Statistics, JP Morgan Calculations. Data as of December 2016.
See disclosures on page 2.

Change #2: Demographics – one change that you can count on
Emerging Markets middle class a big winner
# % # % # % # %
North America 335 11 344 9 350 8 354 7
Europe 724 24 736 20 738 16 733 14
Cental and South America 285 9 303 8 321 7 335 6
Asia Pacific 1,380 46 2,023 54 2,784 60 3,492 65
Sub-Saharan Africa 114 4 132 4 166 4 212 4
Middle East and North Africa 192 6 228 6 258 6 285 5
World 1,030 100 3,766 100 4,817 100 5,412 100
2015 2020 2025 2030
Number (in millions) and share of the global middle class by region
• The inexorable rise of the middle class – from the need for food and shelter to the luxuries of education, entertainment, healthcare, and travel
• Increased importance of domestic demand as an economic driver
• The emerging markets middle class is a big winner from globalization
Stellar growth in EM middle class
6
Source: Top: Brookings Institute. Data as of February 2017. Bottom: Branko Milanovic. Data as of December 2016.
See disclosures on page 2.

Change #3: The changing business model of emerging markets
• No longer just digging holes in the ground; the importance of commodities in emerging markets is often exaggerated and misunderstood
• Urbanization remains a driver, but the fourth bridge over the river matters less than the first three bridges
Net commodity exports as a % of GDP Cyclical production growth (%) in China
has already declined
EPS growth of EM energy vs. materials (in US$ terms)
7
Source: Top Left: Bloomberg, IMF. Data as of December 2015. Top Right: JP Morgan. Data as of June 2016. Bottom: Barclays. Data as of December 2016.
See disclosures on page 2.

Change #3: The changing business model of emerging markets
• No longer just selling cheap goods to developed markets consumers
• More production designed for internal consumption or for export to other emerging markets
China exports as a % GDP EM % exports by destination
8
Source: Left: China Banking Corporation, UBS. Right: WorldScope, Citigroup, and Factset. Data as of December 2016.
See disclosures on page 2.

Change #4: Less financial vulnerability
• Most emerging economies (with major exception of the Chinese yuan) have floating currency exchange systems
• Currency flexibility is a natural progression from mercantilism and gives central banks more control over monetary policy
• Emerging economies are less vulnerable today due to major economic and financial reforms in the past decade
• External and fiscal accounts have significantly improved from the “taper tantrum” period
Number of EM countries by exchange agreementsFinancial Vulnerability in EM
9
Source: Left: UBS. Right: Merrill Lynch. Top Right: Data as of December of 2016.
See disclosures on page 2.

Change #5: Intra-country changes – China
• Significant sectoral and ownership changes – state ownership diminishes
• Not one economy – “The mountains are high and the emperor is far away”
• Cheap labor still relevant, but the growth of robotics is remarkable – what type of jobs do they create?
0
5
10
15
20
25
30
35
40
45
50
The changing face of China Sector weights (%) over time in MSCI China
MSCI CHINA/INF TECH MSCI CHINA/FINANCE MSCI CHINA/ENERGY
Economic growth by province 2015
Robot demand by country Number of engineering graduates in China and the US
10
Source: Top Left: CEIC, National Bureau of Statistics. Top Right: MSCI, Factset. Bottom Left: National Bureau of Statistics, National Center of Education Statistics, Goldman Sachs. Bottom Right:
International Federation of Robotics, Goldman Sachs. Top Right: Data of December 2016. See disclosures on page 2.

Change #6: Micro changes – Free cash flow
• Emerging markets are generally more capex heavy than developed markets
• Capex to sales is rapidly decreasing, leading to a significant increase in free cash flow, and in the context of under leveraged balance sheets
• A combination of return to shareholders, corporate activity or perhaps a pick-up in capex again – all have positive implications
Tangible to intangible asset ratio Net debt % Equity
11
Source: Left: BAML, Worldscope. Right: Citigroup, Worldscope. Data as of December of 2015.
See disclosures on page 2.
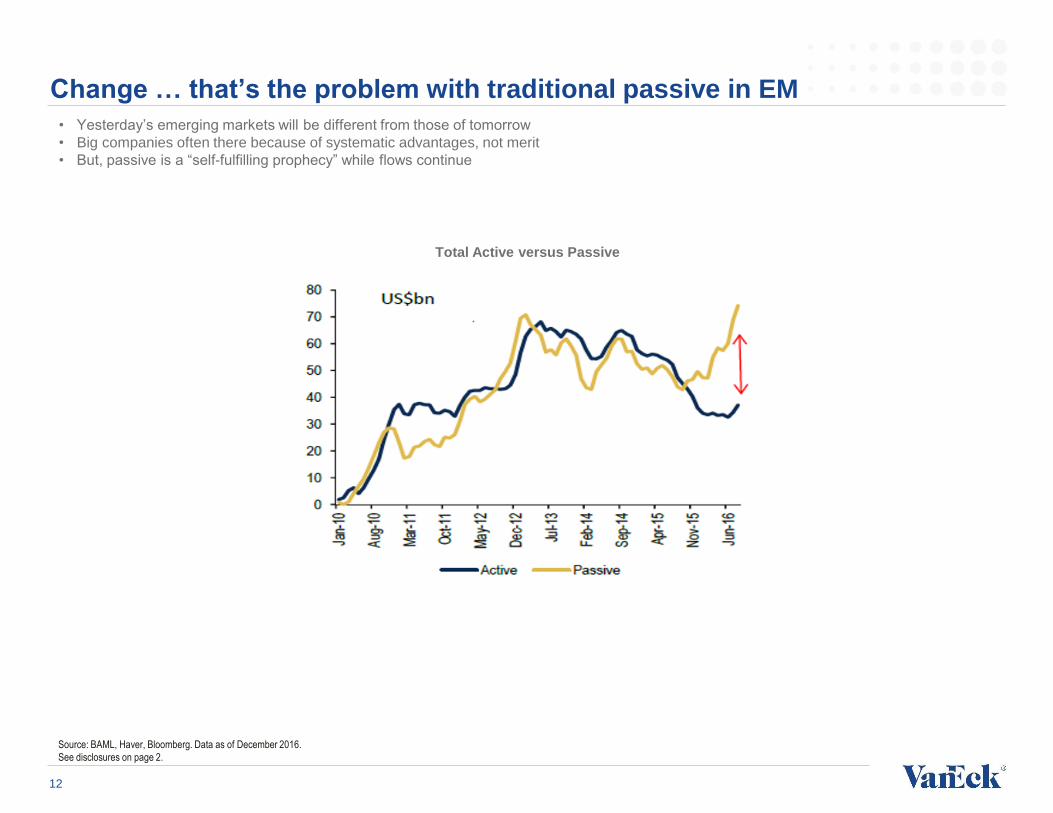
Change … that’s the problem with traditional passive in EM
• Yesterday’s emerging markets will be different from those of tomorrow
• Big companies often there because of systematic advantages, not merit
• But, passive is a “self-fulfilling prophecy” while flows continue
Total Active versus Passive
12
Source: BAML, Haver, Bloomberg. Data as of December 2016.
See disclosures on page 2.