The Changing Face of Communities Served by Minority .../media/files/communitybanking/... · The...
34
The Changing Face of Communities Served by Minority Depository Institutions: 2001-2015 Russell D. Kashian a Fernanda Contreras b Claudia Perez-Valdez c a University of Wisconsin- Whitewater, Whitewater, Wisconsin b University of Wisconsin- Whitewater, Whitewater, Wisconsin c University of Wisconsin- Whitewater, Whitewater, Wisconsin Corresponding Author: Russell D. Kashian, Department of Economics, University of Wisconsin-Whitewater, Whitewater, WI Email: [email protected]
Transcript of The Changing Face of Communities Served by Minority .../media/files/communitybanking/... · The...

The Changing Face of Communities Served by Minority
Depository Institutions: 2001-2015
Russell D. Kashiana Fernanda Contrerasb Claudia Perez-Valdezc
a University of Wisconsin- Whitewater, Whitewater, Wisconsin b University of Wisconsin- Whitewater, Whitewater, Wisconsin c University of Wisconsin- Whitewater, Whitewater, Wisconsin
Corresponding Author: Russell D. Kashian, Department of Economics, University of Wisconsin-Whitewater,
Whitewater, WI Email: [email protected]

1
Abstract
This research analyzes factors related to the increase of the numbers of Minority Depository
Institutions (MDIs) from 2000 to 2015. There were 164 and 174 MDIs in 2000 and 2015,
respectively, according to a study by the Federal Depository Insurance Corporation. After
separating these banks into Black-owned, Hispanic-owned, Asian American-owned and
Native American-owned, this research found that the 10 bank increase was not equally
distributed across the MDI categories. The number of Black-owned banks decreased, but the
number of Asian American-owned banks increased. The objective of this study is to expand
the literature by disaggregating the growth and change in the industry by the subset
categories of MDIs. Disaggregation makes it is possible to identify which types of banks
witnessed changes in their composition. It is also possible to identify the mechanism
(merger, failure, and take-over) through which these changes occurred.
Key words
Minority Depository Institutions ; Minority Ownership; Banking

2
Introduction
In 2014, the Federal Depository Insurance Corporation (FDIC) released a study
concluding that Minority Depository Institutions (MDIs) were healthy, since they rose from
164 to 174 banks. However, that analysis aggregated all of the MDIs. It left undetected shifts
in branch types and underlying patterns in the data due to the aggregation of the MDI data.
This report expands on that work by pursuing more detailed questions: How many
Black-owned Banks (BlkBs) exist? How many still serve low-income neighborhoods? How
many actually serve the racial/ethnic group they initially set out to serve? Similar questions
are asked in terms of other MDI categories, including Asian American-owned banks
(AsnBs), Hispanic-owned banks (HispBs), Native American-owned banks (NatBs), Multi-
Ethnically owned banks (MultBs) and Women-owned banks (WomBs).
Literature Review
History of Minority-Owned Banks
In 1969, President Nixon signed executive orders #11458 and #11625 with its intention
to strengthen minority owned business. These orders created MDI status, and led to
encouragement from the government towards federal agencies and offices to utilize MDI
services through the Minority Bank Depository Program (MBDP). The MBDP increased
minority banks longevity by encouraging companies and the government to allocate deposits
to qualifying institutions. In practice, the MBDP is a list generated by the government
(Price, 1990).
In 1989, Section 308 of the Financial Institutions Reform, Recovery, and Enforcement
Act (FIRREA) mandated that the Federal Deposit Insurance Corporation (FDIC) identify

3
methods to help preserve and encourage minority ownership of depository institutions, with
those institutions defined as having at least 51 percent of voting stock held by Black
Americans, Asian Americans, Hispanic Americans or Native Americans. The FDIC (2002)
interpreted that definition as additionally inclusive of banks held by a mixture of those
minority groups, and banks with both a majority minority board of directors and serving
communities that are predominantly minority.
Whom did MDI’s serve before 2001?
The history of Minority-Owned banks is intertwined with racial/ethnic minority
social progress in the United States. The first Minority-Owned banks were Black-owned
banks during the late 1800’s serving communities in urban African American communities of
southern states. Thielbot (1970) explains that the increase in unemployment and dislocation
of African Americans in urban areas impacted Black-owned banks, which contributed to the
early Black-owned banks closing. Migration to the north commenced later, with “1.6 million
Afro-Americans [leaving the south for urban areas in northern states] …. In the 1950s, a total
of 1.5 million …. And during the following decade an additional 1.4 million migrated”
(Conniff & Davis, 1994, pp. 242-243). In Ammons’ (1996) journal he claims that Black-owned
banks established between 1954 and 1969 were mostly located in urban areas of northern
states. According to Ammons, changes in legislation and national economic hardship which
affected African American communities increased competition and amplified the decline of
banks, especially during the 1980s and 1990s.
After the Black-owned banks were established, other growing racial/ethnic minority
groups opened their own banks to serve their communities. According to Lawrence (1997),
AsnBs are located primarily in southern California and most HispBs are located in southern

4
Texas. The location of these banks is associated with areas of heavy populations of Asian
Americans and Hispanic Americans, respectively. Although there has been much progress
for the minority banks, NatBs are still one of the slowest growing minority banks, with only
7 banks in 2000, and with that figure only increasing to 13 by 2012. Smalls (2013) claims that
the majority of the banks serving Native American communities are located in Oklahoma.
Much of the MDI literature addresses bank efficiency in relation to other MDIs and
non-MDI banks. Some authors conclude there are no substantial differences in bank
efficiency while others conclude MDIs are inefficient. Iqbal, Ramaswamy and Akhigbe
(1999) found that MDIs were less profitable than other banks. The authors used descriptive
statistics to compare MDIs and non-MDIs. They then separated MDIs into AsnBs, BlkBs,
HispBs, NatBs, and WomBs. Bank efficiency was measured in both technical terms, or the
distance of bank outputs set from the output frontier of best practice banks, and allocative
terms, or how closely the shadow prices of a bank are to observed prices. The authors found
that HispBs were the second most efficient, just behind NatBs. The extremely small sample
size of NatBs makes the data less reliable, thus making HispBs arguably the most efficient
among Minority-Owned banks.
Community Reinvestment Act
Even though there was a growing focus on MDIs, the economic role of MDIs
remained fairly small in disadvantaged communities. In an attempt to better address
economic growth in those communities, the government legislated the Community
Development Act of 1977, better known as the Community Reinvestment Act (CRA). The
purpose of CRA was to encourage depository institutions to help meet the credit needs of
communities in which they operated, including low-and moderate-income neighborhoods,

5
which was intended to reduce the ill effects of discriminatory lending practices. Many
criticized the fact that this legislation forced competition between commercial banks and
MDIs among the low-income populations that MDIs usually serve (Lawrence, 1997). Ann
Matasar and Deborah Pavelka (2004) analyzed the performance of MDIs in regards to
serving their communities by using the CRA audit data. The most important finding of the
study was that loan growth is slower when banks are owned by minorities than when owned
by non-minorities. Additional legislation passed in 1994 included the Community
Development Banking and Financial Institution Act (CDB). The act created a network of
CDBs in poor to middle class communities, financed by subsidies directly from general tax
revenues. The government injected $382 million over 4 years to finance banks, credit unions,
and revolving loan funds.
Competition between MDI’s and Commercial Banks
MDIs, such as BlkBs, were created to serve communities often neglected by
commercial banks. The CRA act was intended to address the problem of redlining, as
activists proved commercial banks were not making loans in low-income areas. Under the
CRA, larger banks were regulated for redlining and must serve low-income to moderate-
income individuals. Competition started decreasing the share of low-income communities
which MDIs could serve (Beyer, 1997). According to Beyer, commercial banks realized there
was an opportunity in minority and low income to moderate-income communities. Four
resulting effects were:
(1) they recognize the potential profitability of low income loans; (2) they realize that
moving into low- and moderate income communities can be helpful in their
pursuit of mergers and acquisitions; (3) they offer creative new services and

6
lending programs that are especially appealing to low- and moderate-income
communities; and (4) they have created new CRA divisions specifically designed
to give structure to their CRA lending. (Beyer, 1997, p. 402)
To decrease the effects of the CRA act on MDIs, Beyer (1997) suggested that
Minority-Owned banks concentrate on increasing lending to churches, as they were once the
largest lenders to this group before commercial banks began to dominate this market. An
example is found in the churches in African American communities in Washington, D.C.,
which borrowed to expand social services in their communities. Also, Beyer claimed that
MDIs should improve their CRA lending score, given MDIs and thrifts had lower CRA
ratings than comparable banks, with 24 percent receiving ratings of “substantial
noncompliance” or “need to improve” (Beyer, 1997).
Changes in MDI Serving Populations
New charters, buy outs and closures are part and parcel of the banking industry.
However, this turbulence reduced the market share of MDIs as the individuals they
traditionally served switched to mainstream banks with more competitive pricing. As
previously mentioned, this decrease in market share may have been accelerated by the CRA.
According to Dugan (2006), racial/ethnic minority groups face a variety of challenges,
some due to the limited availability of capital. Part of their struggle in raising capital is that
they serve low-income to moderate-income customers who have little wealth. A study by
Dahl (1995) examined the lending patterns of 34 commercial banks during periods when the
same bank was owned by a member of a minority or non-minority group during the 1980s
and 1990s. He found that acquisitions of MDIs by non-MDIs, relative to acquisitions of non-
MDIs by MDIs, increased lending. The study implies that, as non-MDIs crowd out MDIs,

7
lending increases, which undercuts the case for MDIs fostering economic development in
poor communities (Dahl, 1995).
Harold Black, Breck Robinson, and Robert Scheitzer (2001) focused on lending across
Caucasians and different racial/ethnic minority groups. The goal of their work was to see
whether various groups engaged in discriminatory lending regarding other racial/ethnic
minority groups, Caucasians, or their own race. A HMDA model was constructed by adding
bank specific and demographic information based on the bank’s location. The data showed
that HispBs exhibited no correlation between race and lending. This finding was especially
surprising given that non-MDIs located near HispBs were less likely to accept Hispanic
mortgage applications, leaving Hispanic application pools even larger for HispBs, (Black,
Robinson & Schweitzer, 2001).
Changes in Black-Owned Banks and Asian-American Owned Banks
There has been a gradual shift of ownership within the MDIs. Recently there are
more AsnBs than BlkBs, NatBs or HispBs. Li, et al (2002) addressed the expansion of AsnBs
in Los Angeles. This study found that, in addition to serving low-income Asian
communities, new AsnBs were also created in affluent immigrant Asian communities
known as “ethnoburbs,” located in the San Gabriel Valley. The connection between Chinese-
American banks and Chinese-Americans residing around these banks was analyzed using
spatial and temporal correlation. Chinese-American banks witnessed deposit growth in the
billions. By 1999, Asian-American banks had surpassed other minority depository
institutions and became the largest MDIs in terms of deposits (Li et al, 2002).
In contrast, most banks owned by racial/ethnic minorities are located in low-income
communities. A study from the FDIC looked at the how the MDIs have changed over time,

8
and which MDIs had achieved their mission of serving the needs of their communities. The
results indicate that the share of service area populations living in low-and- moderate income
census tracts is higher for MDIs. In fact, the portion of estimated service area populations
living in low-and- moderate income tracts was substantially higher for AsnBs, BlkBs and
HispBs, compared with both community banks and non-community banks (FDIC, 2014).
Data
The FDIC (2001, 2014) produces a list of MDIs on a quarterly basis, and lists from the
2nd quarters of 2001 and 2014 are used for the analysis. Those lists classify MDIs as falling
into 10 categories, with the first 5 for minority ownership and the last 5 for a
minority/majority board and service to a minority community (FDIC, 2002). Following
current FDIC practice, the latter are folded into the prior to yield 5 types of MDIs: Black-
owned or serving banks (BlkBs), Hispanic-owned banks (HispBs), Asian American-owned
banks (AsnBs), Native American owned-banks (NatBs), and Multi-racially owned or
serving banks (MultBs). MDIs located in Puerto Rico, Guam, Micronesia and the Virgin
Islands are excluded in the demographic calculations, due to the absence of race/ethnicity
and poverty data for those territories. This leaves 48 BlkBs as of 2001, which fell to 28 in
2014, 23 HispBs in 2001, which rose to 36 in 2014, 68 AsnBs as of 2001, which rose to 85 in 2014,
14 NatBs in 2001, which climbed to 19 as of 2014, and 2 MultBs as of both 2001 and 2014. The
FDIC also provides Summary of Deposits (SOD) data from the 2nd quarter of each year.
The 2001 and 2014 SOD data are matched to the MDI list to yield the location of deposits for
all MDI branches and main offices.

9
The race/ethnicity and poverty data are drawn from the 5% Public Use Microdata
(PUMS) data, which are derived from long-form Census 2000 data, and the 2011 3-year
American Community Survey (ACS) data (Ruggles, et al., 2015). The 2000 PUMS data are
the only large (~14m observations), representative sample from a time period near 2001,
while the 3-year 2011 ACS is selected because it is a large (~6m observations), and relatively
current (2009-2011) sample. The 3-year 2012 ACS data are not used because they use
inconsistent geographic variables (i.e., the geographic definitions shifted between 2011 and
2012), and the 5-year 2011 ACS data are not used because they go further back in time (2007-
2008).
For both the 2000 PUMS and 2011 ACS data, race/ethnicity variables allow for multi-
race categorization. In response, a White non-Hispanic variable is used which excludes all
individuals who either self-classify as another race or ethnicity or as holding multiple
race/ethnicity identities. Additional racial/ethnic groups include African American and non-
Hispanic, Hispanic, Asian American and non-Hispanic, and Native American and non-
Hispanic. The poverty variable is defined as the proportion of individuals living in
households with less than 100% of the income level defined as the official poverty threshold.
The geographic unit for the analysis is the U.S. Census Zip Code Tabulation Area or
ZCTA (U.S. Census, n.d.). To assign MDIs to ZCTAs, the zip codes of each MDI office
(from the SOD data) are translated to ZCTAs using Snow’s (2014) cross-walk, and
duplicates are removed for each MDI location (i.e., we ignore multiple branches for a bank in
any ZCTA). The PUMS and ACS data define populations by state and, within each state,
by Public Use Microdata Areas (PUMAs), which include approximately 100,000 people, with
both the 2000 PUMS and 2011 ACS using PUMAs defined for Census 2000. For each

10
state/PUMA combination, the number of individuals in total, and by race/ethnicity and
poverty characteristics, is estimated after applying the individual sample weights.
The MABLE/Geocorr2K geographic correspondence engine from the Missouri
Census Data Center is used to allocate individuals within each state/PUMA combination to
ZCTAs (implicitly assuming a uniform geographic distribution of the population within any
given state/PUMA area), and proportions for the race/ethnicity and poverty variables are
then estimated for each ZCTA. At the ZCTA level, the race/ethnicity and poverty data are
merged with the MDI location data to yield the sample for analysis.
Methods
The analyses begin with the categorization of the MDIs for 2014 into 3 groups: those
that survived or continued MDI status from 2001, banks that existed in 2001 and acquired
MDI status as of 2014, and newly chartered MDI banks. In parallel fashion, the 2001 MDIs
are divided into groups that maintain MDI status through 2014, banks that lose MDI status
but still exist in 2014, and MDIs that fail or merge with other banks by 2014. Average
race/ethnicity and poverty rates within all ZCTAs covered by each of those groups are then
estimated. Those estimates inform us as to the types of communities that lost, gained, or
maintained MDI coverage.
Next, average race/ethnicity and poverty rates are estimated for each of the 5 types of
MDIs, first for 2014 and then for 2001. That analysis provides a direct comparison of the
number of distinct communities served by each type of MDI over time, and whether the
concentration of population-matched markets (e.g., BlkBs with African Americans, HispBs
with Hispanics, etc.) increased or decreased over time.

11
That analysis is replicated for the subsample of 2014 MDIs that either did not exist or
acquired MDI status post-2001, and for the 2001 MDIs that lost MDI status or failed/merged
by 2014. This analysis helps to pin-point how shifts in MDI status shifted the communities
served by MDIs. The following analyses use various cut-offs to identify ZCTAs with high
proportions of various race/ethnicity and poverty groups. That approach allows a count of
communities served by MDIs in 2001 and 2014, which provides a different way to see shifts in
communities served.
Since the cut-offs are somewhat arbitrary, figures with a variety of cut-offs are
provided in an appendix. The count of ZCTAs, however, may be misleading to the extent
the number of relevant communities (e.g., ZCTAs with high proportions of Hispanics)
shifted over time, so an alternative estimate divides that count of ZCTAs by the total
number of ZCTAs exhibiting that characteristic, yielding the proportion covered.
Given the substantial decline in coverage by BlkBs, the appendix table with various
cut-offs is replicated for those specific banks in 2001 and 2014. The final results section
presents a shift-share analysis of the changing composition of MDIs. Specifically, average
changes for all MDIs in terms of new charters, re-designation as MDI, or away from MDI
status, mergers, and failures are estimated, and the behavior of each subset of MDIs is
compared to that expectation from overall behavior.
Results
Changes in Communities Served
The communities served by MDIs, as of 2014, are provided in Table 1. For all MDIs (4th
column), a total of 721 communities are served, with an average non-Hispanic white
population of 27.0%, just over 10% for non-Hispanic African Americans, almost twice as

12
many Hispanics, with smaller percentages of non-Hispanic, Native or Asian Americans, and
with an average poverty rate of 13.5%.
Those same figures for MDIs in continuous existence since at least 2001 are provided
in the first column. This suggests the older MDIs service communities which are slightly
less white, slightly more African American, slightly less Asian American, and have slightly
higher poverty rates. The banks that acquired MDI status (2nd column) or were de novo
banks (3rd column) were less likely to serve African American or poor communities, and
more likely to serve Hispanic or Asian American communities.
Parallel figures for 2001 are provided in Table 2. Starting with the overall figures (4th
column), relative to the overall figures for 2014 (Table 1), the banks less often served non-
Hispanic white, Hispanic and Asian American communities, more often served African
American communities (by almost 4 percentage points), and served slightly less poor
communities (noting that the overall poverty rate increased from 2001 to 2014). In terms of
the 2001 banks that continued through 2014 versus those that lost MDI status (2nd column) or
failed (3rd column), those that lost MDI status tended to be concentrated in white and Asian
American areas, while those that failed or merged were also more likely to be in white or
Asian American communities, and slightly less likely to be located in African American
communities.
Counterintuitively, the 2001 figures suggest that it was not banks located in African
American communities failing, merging, or losing MDI status that caused decreases in the
representation of African American communities over time. If anything, failures, mergers
and loss of MDI status were concentrated in Hispanic and especially Asian American

13
communities. Instead, the relative decline for African American communities may be traced
to the scarcity of new MDIs or banks acquiring MDI status in those communities.
Tables 3 and 4 detail the race/ethnicity and poverty characteristics of communities
served by MDIs, excepting the WomBs are excluded because their figures are close to
national averages for all banks. Starting with 2014 in Table 3, as expected, the BlkBs serve the
largest proportion of African Americans, HispBs the largest proportion of Hispanics, NatBs
Native Americans, and AsnBs Asian Americans, with the MultBs tending to serve Hispanic
or Asian American communities. In terms of cross-over, the most notable difference is that
the AsnBs also serve relatively large numbers of Hispanics. Poverty rates are highest for the
communities served by BlksBs, followed by NatBs, then HispBs, with AsnB and MultB
figures only in the single digits.
Going back to 2001 in Table 4 shows similar overall patterns. However, BlkBs became
more concentrated in African American and high poverty communities by 2014. The
similarities tend to mask differences found in the last row of each table for how many
communities the MDI groups serve. BlkBs shrank from covering 150 to only 121
communities, while NatBs expanded from 35 to 56 communities. MultBs remained marginal,
but the HispBs and AsnBs expanded to around 100 new communities each.
Race/ethnicity and poverty figures, as of 2014, for banks that became MDIs since 2001,
are provided in Table 5. As before, the race/ethnicity figures align with the MDI categories,
with new BlkBs disproportionately representing African American communities, HispBs
Hispanics, and so forth. Instead, what is most striking is that most new MDI communities
are either served by AsnBs (59.3%) or AsnBs and HispBs (87.1%), with minimal expansion of
BlkBs, NatBs, or MultBs.

14
Communities losing MDI coverage post-2001 are described in Table 6. The percentage
figures for each type of MDI are similar to those found in the prior tables, with the most
notable differences surrounding the number of communities losing an MDI. The AsnBs left
122 communities, the BlkBs left 50, and the HispBs left 36. “Losing” does not, however, imply
that these banks were not replaced by other MDIs, as Table 5 figures suggest occurred for the
AsnBs and HispBs. But in the case of BlkBs, there were few replacements relative to the
number of communities lost to bank failures or mergers.
Figures reported in Tables 7 and 8 switch the vantage point to all African American
communities, Hispanic communities, and so forth, and whether those communities are
served by any MDI, regardless of MDI category. Table 7 provides the absolute numbers of
such communities served in 2001 and 2014. These show an almost doubling of coverage in
non-Hispanic white communities, an approximate 25% shrinkage in coverage of African
American communities, a 63% expansion in Hispanic communities covered, with a far
smaller absolute increase in Native American communities covered, a 68% increase in Asian
American communities covered, and a 51% increase in high poverty communities served by
MDIs. Excepting the African American community, these numbers suggest that more poor
people and people of color gained MDI service from 2001-2014.
Figures in Table 7 do not account for any expansion or contraction in the absolute
number of race/ethnic communities or poor communities. To do so, Table 8 reports the
percentage of all relevant communities having MDI coverage. Coverage of non-Hispanic
white, Hispanic, Native American, Asian American and poor communities again increased
but, excepting the Asian American increase, the other increases are relatively small in
comparison to Table 7 figures, which reflects the growth of Hispanic and high poverty
15
communities. The loss of MDI coverage in African American communities, however, is
similar at around 25% regardless of measurement method.
Tables 9 replicates figures reported in Table 7 after adding additional cut-offs to
define race/ethnic and high poverty communities. The general pattern of results remains as
before, but with two differences worth highlighting. First, coverage of communities with at
least 90% non-Hispanic whites is very low in both 2001 and 2014. Second, coverage of
communities with at least a 10% African American population actually increased slightly,
and the number of highly segregated African American communities (>50%) served was
stable at 45, with the losses discussed earlier centered around communities with at least 30%
African Americans.
Table 10 replicates Table 9 figures after limiting the sample to BlkBs. The figures
suggest that BlkBs tended to fail in communities with at least half non-Hispanic whites, and
relatively low numbers of African Americans. The flip side is that the BlkBs tended to
become concentrated in highly segregated communities with large number of both Hispanics
and particularly African Americans, and in poor (>30%) but not extremely poor
communities.
Shift share analysis of MDIs
MDIs increased from 164 banks in 2001 to 174 in 2014. This paper employs a shift-
share tool often used in regional science. This model determines what portions of the growth
(or decline) in the bank distribution within MDIs can be attributed to new charters, closings
(failures, mergers, others), and re-designations (to and from MDI status). The shift share
analysis helps identify types of MDIs that have a competitive advantage over the other
MDIs.

16
Following the approach of the FDIC (2014), this analysis breaks down the increase
into 5 different components. These include: number of banks in 2000, new charters, closings
(failures, mergers, others), re-designations (to and from MDI status), and number of banks
in 2014. Each category of MDI is treated separately to show any major differences. The
overall pattern is shown in Figure 1, taken from the 2014 FDIC study. The figure decomposes
the net increase of 10 MDIs from 2001-2013 into 44 new MDI charters (de novo banks), 33
bank failures, 57 mergers, 5 losses in other ways, 20 MDI designation losses, and 81 pre-
existing banks that became MDIs.
Changes in Black-Owned Banks
Figure 2 replicates Figure 1 for the subsample of BlkBs. BlkBs went from 48 MDI’s in
2000 to only 28 in 2014. They lost 8 banks to failure, 11 to mergers, and 6 to take-overs by
mainstream banks, along with two re-designations away from BlkB status. Gains were
limited to two new charters and four re-designations to MDI status. Table 11 contains the
same information in terms of actual numbers (first numeric column), but also the figures
expected if BlkBs had behaved like MDIs overall (second numeric column), and the
difference between expected and actual behavior (third numeric column). The table suggests
that there were three new BlkB charters but, if they had followed the aggregate trend for
MDIs, they would have experienced 21 new charters. The BlkBs substantially under
performed in this area. Considering failures, the black-owned banks experienced eight
failures, but would have experienced only five failures if they had followed the overall MDI
pattern, so they generated three unexpected failures.
In the case of mergers, eight banks were taken over by other BlkBs and the aggregate
trend predicted seven, causing a net unexpected loss of one BlkB. Similarly, the banks which

17
merged when being taken over by other MDIs experienced three but were only supposed to
have two, for a net loss of one additional BlkB. Turning to the BlkBs lost when taken over by
mainstream banks, they experienced six losses, but were supposed to experience 15, for a net
unexpected gain of nine BlkBs. Although that finding is apparently positive, it may reflect
the fact that BlkBs are located in and serve disadvantaged communities of color, so they are
not attractive merger candidates.
A positive note is that, if the BlkBs followed the aggregate trend, they were projected
to lose 15 banks due to loss of MDI status, but only lost two. That is a positive sign. On the
other hand, the BlkBs under performed substantially when it came to gaining MDIs by
converting existing banks to MDI status. They experienced only four such conversions, but
were projected to experience 24, for a net unexpected loss of 20 banks.
Changes in Hispanic Owned Banks
As depicted in Figure 3, HispBs rose from 31 in 2000 to 41 in 2014. They gained 10
MDI’s, which is a substantial amount. As found in Table 12, a major contributing factor was
that they opened 21 newly chartered HispBs, but were only projected to open 13. They
exceeded expectations by eight banks and over performed in this area. Seven of the 31 banks
as of 2001 failed, instead of the expected loss of three banks, for a net loss beyond
expectations of four banks.
In the case of mergers, Hispanic-owned banks did not have any sections where they
under performed. One bank was taken over by another Hispanic-owned bank and the
aggregate trend called for five banks for a net gain of four banks; similarly, no HispBs were
merged with a non-HispB or non-AsnB, while one was projected to do so. A total of 12
HispBs were merged with mainstream banks, while only 10 were projected to do so, for a net

18
gain of two banks, and two HispBs became AsnBs, while none were projected to do so. A
total of 22 banks lost MDI, and HispB, status, while only 10 were projected to do so, for a net
loss of 12 banks. A total of 33 HispBs were converted from mainstream banks, while only 16
were expected to convert. The net effect was that 10 HispBs were added, while only one was
expected, for an unexpected net gain of nine banks. The HispBs seemed to overperform
expectations, in contrast to BlkBs.
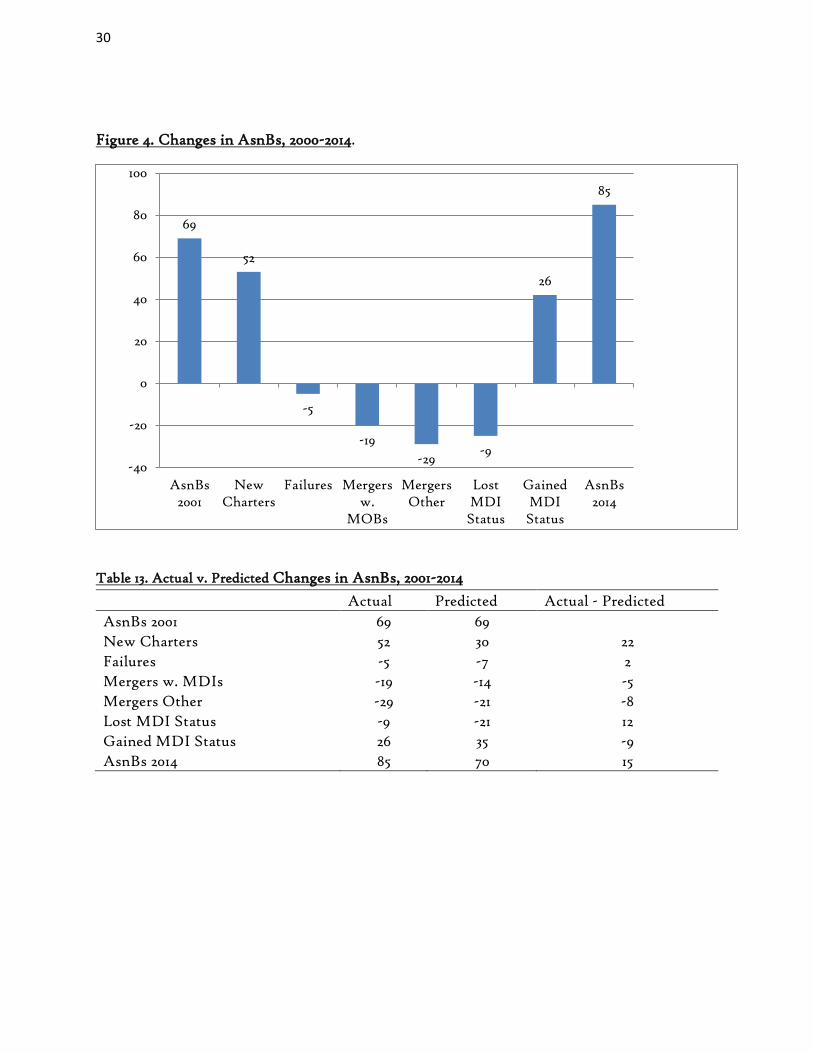
Changes in Asian Owned Banks
When accounting for the AsnBs in this research, there is a noticeable difference from
the other MDIs. As shown in Figure 4, AsnBs rose from 69 in 2000 to 85 in 2014 and although
this 16 bank increase might seem fairly small, the context for that net increase includes a total
of 53 closures or mergers and an additional nine AsnBs losing MDI status, which is
surprising given the net gain.
From Table 13, we can see that a major contribution to this increase was the opening
of 52 new charters, while they were only projected to open 30 new AsnBs. They exceeded
expectations by 22 banks and over performed in this area. Five of the 69 initial banks failed
and the AsnBs also over performed in this area, by two banks. In the case of mergers, AsnBs
were projected to have 35 banks merged, but in fact had 48 banks merged for a net loss of 13
banks beyond expectations. They experienced 16 banks taken over by AsnBs but were only
expected to lose 11 banks, so they under performed by 5 banks. Another area where they
under performed was the banks lost when taken over by mainstream banks: 29 banks were
lost to mergers with mainstream banks, but the projection was for 21, for a net loss of eight
banks. However, they did meet expectations in terms of banks taken over by other MDIs
(three).

19
A total of nine AsnBs lost their MDI status, a figure which was expected to be 21, for
a net unexpected gain of 12 banks. Under performance was found in AsnBs picking up 26
banks by converting existing banks to MDI status, while they were projected to gain 35, so
they under performed by nine banks in this area.
Changes in Native American Owned Banks
In contrast to the drastic changes experienced by the BlkBs, HispBs and AsnBs, the
NatBs experiences limited changes. In addition, the changes seem slight due to the small
number of NatBs. However, even with the small number, the pattern of actual NatB change
is close to expectations. As shown in Figure 5, NatBs expanded from 14 in 2000 to 19 in 2014.
Following Table 14, a major contributor to this increase was that they opened five new
charters although they were projected to open six, for a net loss of one bank. As to failures,
the actual number (one) was identical to expectations.
In the case of mergers, Native American-owned banks lost three banks when they
were taken over by mainstream banks. In this case, they over performed, because they were
projected to lose four banks. Despite being expected to lose two banks to take-over from
another NatB and another to takeover by another type of MDI, they did not lose any banks
in this fashion, yielding a net advantage of three banks.
The NatBs had one bank lose MDI status when they were projected to lose four, so
they over performed by three banks. However, they under performed in terms of converting
existing banks to MDI status, where they only gained four and were expected to gain seven,
for a net loss against expectations of three banks, which explains the minimal change from 14
to 19 NatBs in the last 14 years.

20
Conclusion/Discussion
From the results reported here, the increase from 162 to 173 MDIs (excluding the
Multi-racial MDIs) from 2000-2014 misses more complex dynamics. There are several
individual components that contribute to this increase and this research detailed those
components.
In terms of changes in the communities served, a critical focal point involves
increases in service to Hispanic and Asian American communities and a relative decrease in
service to African American communities, with similar coverage of poor communities across
the period of 2001-2014. The first two changes can be traced to growth in the number of
Hispanics with a parallel expansion of the HispBs, and a substantial increase in the number
of AsnBs, which appears to be independent of the zip code’s Asian American population. The
loss of service to African American communities follows directly from the loss of BlkBs, and
a pattern of increasing isolation of the remaining BlkBs in highly segregated communities.
From the shift share analysis, the BlkBs began with 48 banks and then dropped to 28
banks. Compared to expectations from the experience of all MDIs during this period, the net
loss of BlkBs lies in that fact that they had very few new charters and rarely converted
existing banks to MDI and BlkB status. In other words, failures and mergers were less of a
problem than limited expansion.
The HispBs are a different story. On net, the HispBs grew from 31 to 41 banks
between 2001 and 2014, and where the BlkBs underperformed, the HispBs overperformed.
The HispBs added 21 new charters but were only projected to add 13. In addition 33 existing

21
banks converted to MDI status, while only 16 conversions were projected.
The AsnBs expanded from 69 to 85 banks. Just like the HispBs, AsnBs over-
performed when it came to new charters, and they over performed by 30 banks. The AsnBs
also appeared to overperform in terms of losing MDI status. However, they appeared to
underperform when it came to mergers, losing 29 banks in that fashion, with an expectation
of losing only 21. As a result, we conclude that there was extreme turbulence behind the net
expansion of AsnBs during this period. Indeed, 62 AsnBs were either closed, merged or lost
MDI status between 2001 and 2014, but there were only 69 AsnBs in total as of 2001.
The changes in the NatBs, on the other hand, were small. NatBs gained five banks. In
contrast to either BlkBs, HispBs or AsnBs, NatBs were generally stable, with slight growth
close to expectations. However, due to the small numbers overall, it is difficult to make
general statements in regards to these banks.
The purpose of federal support for MDIs is not to promote minority ownership of
banks; it is to “promote the economic viability of minority and under-served communities”
(FDIC, 2002, p. 1). The 2014 FDIC study of MDIs notes that, relative to comparable banks,
MDIs tend to serve relatively high-poverty and minority communities, and to originate more
mortgages for housing in high-poverty areas and to minority individuals, together indicating
that MDIs are “serving the purpose that this segment of the banking industry was intended
to achieve” (2014, p. 34).
With regard to the HispBs and NatBs, the achievement of service in high-poverty and
minority communities appears to hold: those banks have expanded, tend to be stable, and
serve people of color in poor communities. With regard to the AsnBs, their demographic
achievement is not in line with policy intentions: those banks are not serving poor

22
communities and, while they indeed serve people of color, the fact that the average AsnB as
of 2001 did not even exist as of 2014 suggests they did not provide stability to their
communities (or employees).
It is difficult to conclude this research without a reflection on the recent turbulence in
regards to the BlkBs. For many of these banks, the story is bleak: these banks served African
Americans in some of America’s poorest communities, yet they lost out in terms of the
absolute number of BlkBs, the number of communities served and, as a result, fewer African
Americans have access to BlkBs or indeed any MDI in comparison to 2001. While policy
prescriptions are beyond the scope of this report, it is clear that efforts to expand BlkBs,
whether through new banks or branch expansion, are warranted.

23
Appendix
Table 1. Race/ethnicity and poverty for communities served by MDIs, 2014, by bank status
Race/ethnicity, Poverty Continuing MDIs
Acquired MDI status
New MDI charters
All MDIs1
White, NH % 25.8 24.8 27.2 27.0 African American, NH %
11.7 4.3 6.4 10.3
Hispanic % 19.1 22.1 21.3 19.1 Native American, NH %
1.1 0.8 0.4 1.1
Asian American, NH % 6.3 10.0 12.6 6.7 % <100% Poverty 14.0 11.6 11.7 13.5 # Unique zip codes 549 252 113 721
Note. NH for non-Hispanic.
1 The number of zip codes for continuing MDIs, acquired MDI status and new MDI charters
does not sum to the total for all MDIs due to overlapping zip codes.
Table 2. Race/ethnicity and poverty for communities served by MDIs, 2001, by bank status
Race/ethnicity, Poverty Continuing MDIs
Lose MDI status
MDI failed/merged
All MDIs1
White, NH % 23.3 27.7 26.6 25.4 African American, NH %
14.3 11.7 11.7 14.0
Hispanic % 17.5 7.8 15.1 16.1 Native American, NH %
1.2 0.3 0.4 1.0
Asian American, NH % 6.2 21.7 8.8 5.9 % <100% Poverty 13.2 12.2 11.2 12.5 # Unique zip codes 381 35 206 538
Note. NH for non-Hispanic.
1 The number of zip codes for continuing MDIs, lose MDI status and failed/merged MDIs
does not sum to the total for all MDIs due to overlapping zip codes.

24
Table 3. Race/ethnicity and poverty for communities served by MDIs, 2014, by MDI type
Race/ethnicity, Poverty BlkBs HispBs NatBs AsnBs MultBs White, NH % 20.3 24.3 57.5 26.3 22.8 African American, NH %
35.2 6.0 6.1 4.4 4.1
Hispanic % 8.0 28.4 5.8 16.8 18.1 Native American, NH %
0.1 0.9 9.3 0.2 0.2
Asian American, NH % 2.2 3.3 0.8 14.2 10.6 % <100% Poverty 18.1 13.9 17.6 9.9 7.5 # Unique zip codes 121 303 56 263 12
Note. NH for non-Hispanic.
Table 4. Race/ethnicity and poverty for communities served by MDIs, 2001, by MDI type
Race/ethnicity, Poverty BlkBs HispBs NatBs AsnBs MultBs White, NH % 22.2 21.4 53.5 26.0 27.8 African American, NH %
33.1 7.4 7.4 5.3 35.6
Hispanic % 5.7 28.8 6.9 13.0 14.3 Native American, NH %
0.2 0.4 11.3 0.2 0.0
Asian American, NH % 1.9 2.6 0.8 14.6 2.3 % <100% Poverty 15.4 12.7 15.1 9.3 12.8 # Zip codes 150 193 35 169 7
Note. NH for non-Hispanic.
Table 5. Race/ethnicity and poverty for MDI communities, 2014, by MDI type, new charters
or acquired MDI status post-2001
Race/ethnicity, Poverty
BlkBs HispBs NatBs AsnBs MultBs
White, NH % 21.0 15.6 68.3 26.2 22.8 African American, NH %
29.6 3.8 3.0 4.3 4.1
Hispanic % 7.2 36.0 5.4 19.4 18.1 Native American, NH %
0.1 0.5 9.2 0.2 0.2
Asian American, NH %
3.6 1.5 0.7 15.5 10.6
% <100% Poverty 16.4 13.4 18.8 10.3 7.5 # Unique zip codes 10 84 17 179 12
Note. NH for non-Hispanic.

25
Table 6. Race/ethnicity and poverty for MDI communities, 2001, by MDI type, lose MDI
status or failed/merged post-2001
Race/ethnicity, Poverty BlkBs HispBs NatBs AsnBs MultBs White, NH % 25.0 27.8 51.4 25.4 27.8 African American, NH %
34.3 8.8 2.0 4.0 35.6
Hispanic % 4.0 32.9 16.4 12.4 14.3 Native American, NH %
0.2 1.0 1.4 0.2 0.2
Asian American, NH % 1.5 2.9 1.2 15.4 2.3 % <100% Poverty 15.7 13.8 11.9 8.9 12.8 # Unique zip codes 50 36 11 122 7
Note. NH for non-Hispanic.
Table 7. Race/ethnicity and poverty among communities served by MDIs, 2001 and 2014
Race/ethnicity, Poverty 2001 2014 White, NH % >70% 31 58 African American, NH >30% 98 74 Hispanic >20% 140 228 Native American, NH >10% 16 22 Asian American, NH >20% 47 79 <100% Poverty >20% 127 192 # Unique zip codes 538 722
Note. NH for non-Hispanic.
Table 8. Race/ethnicity and poverty, Proportions with MDI coverage, 2001 and 2014
Race/ethnicity, Poverty 2001 2014 White, NH % >70% 0.1% 0.3% African American, NH >30% 3.5% 2.7% Hispanic >20% 4.6% 5.8% Native American, NH >10% 1.0% 1.5% Asian American, NH >20% 4.7% 7.4% <100% Poverty >20% 2.0% 2.1%
Note: Number of US zip code areas with MDI coverage divided by number of zip codes with
specified characteristics. Note. NH for non-Hispanic.

26
Table 9. Race/ethnicity and poverty among communities served by MDIs, 2001 and 2014,
alternative cut-offs
Race/ethnicity, Poverty 2001 2014 White, NH >50% 107 149 White, NH >70% 31 58 White, NH >90% 3 5 African American, NH >10% 180 185 African America, NH >30% 98 74 African American, NH >50% 45 45 Hispanic >10% 220 352 Hispanic >30% 95 167 Hispanic >50% 54 87 Native American, NH >10% 16 22 Native American, NH >30% 6 7 Native American, NH >50% 0 1 Asian American, NH >10% 76 149 Asian American, NH > 30% 37 53 Asian American, NH > 50% 13 14 <100% Poverty >10% 284 412 <100% Poverty >30% 41 70 <100% Poverty >50% 0 1
Note. NH for non-Hispanic.
Table 10. Race/ethnicity and poverty among communities served by BlkBs, 2001 and 2014,
alternative cut-offs
Race/ethnicity, Poverty 2001 2014 White, NH >50% 22 8 White, NH >70% 5 1 White, NH >90% 0 0 African American, NH >10% 107 89 African America, NH >30% 78 62 African American, NH >50% 39 40 Hispanic >10% 28 31 Hispanic >30% 4 6 Hispanic >50% 1 3 Asian American, NH >10% 2 7 Asian American, NH > 30% 0 0 Asian American, NH > 50% 0 0 <100% Poverty >10% 88 80 <100% Poverty >30% 18 26 <100% Poverty >50% 0 0
Note. NH for non-Hispanic. Native American, NH category excluded because no coverage.

27
Figure 1. Changes in MDIs, 2001-2013.
Source: FDIC (2014).

28
Figure 2. Changes in BlkBs, 2001-2014
Table 11. Actual v. Predicted Changes in BlkBs, 2001-2014
Actual Predicted Actual - Predicted BlkBs 2001 48 48 New Charters 3 21 -18 Failures -8 -5 -3 Mergers w. MDIs -11 -9 -2 Mergers Other -6 -15 9 Lost MDI Status -2 -15 13 Gained MDI Status 4 24 -20 BlkBs 2014 28 51 -23
48
3
-8-11
-6-2
4
28
-20
-10
0
10
20
30
40
50
60
BlkBs 2001 NewCharters
Failures Mergers w.MOBs
MergersOther
Lost MDIStatus
Gained MDIStatus
BlkBs 2014

29
Figure 3. Changes in HispBs, 2000-2014.
Table 12. Actual v. Predicted Changes in HispBs, 2001-2014
Actual Predicted Actual - Predicted
HispBs 2001 31 31 New Charters 21 13 8
Failures -7 -3 -4
Mergers w. MDIs -3 -6 3
Mergers Other -12 -10 -2
Lost MDI Status -22 -10 -12
Gained MDI Status 33 16 18
HispBs 2014 41 32 9
31
21
-7-3
-12
-22
33
41
-30
-20
-10
0
10
20
30
40
50
HispBs 2001 NewCharters
Failures Mergers w.MOBs
MergersOther
Lost MDIStatus
GainedMDI Status
HispBs 2014
30
Figure 4. Changes in AsnBs, 2000-2014.
Table 13. Actual v. Predicted Changes in AsnBs, 2001-2014
Actual Predicted Actual - Predicted
AsnBs 2001 69 69 New Charters 52 30 22 Failures -5 -7 2 Mergers w. MDIs -19 -14 -5 Mergers Other -29 -21 -8 Lost MDI Status -9 -21 12 Gained MDI Status 26 35 -9 AsnBs 2014 85 70 15
69
52
-5
-19
-29-9
26
85
-40
-20
0
20
40
60
80
100
AsnBs2001
NewCharters
Failures Mergersw.
MOBs
MergersOther
LostMDIStatus
GainedMDIStatus
AsnBs2014

31
Figure 5. Changes in NatBs, 2000-2014.
Table 14. Actual v. Predicted Changes in NatBs, 2001-2014
Actual Predicted Actual - Predicted
NatBs 2001 14 14 New Charters 5 7 -2 Failures -1 -2 1 Mergers w. MDIs 0 -3 3 Mergers Other -2 -4 2 Lost MDI Status -1 -4 3 Gained MDI Status 4 7 -3
NatBs 2014 19 15 4
Declaration of Conflicting Interests: The author(s) declared no potential conflicts of interest with respect to the research, authorship, and/or publication of this article.
14
5
-1
0
-2-1
4
19
-5
0
5
10
15
20
25
NatBs 2001 NewCharters
Failures Mergers w.MOBs
MergersOther
Lost MDIStatus
Gained MDIStatus
NatBs 2014

32
References Ammons, Lila (1996). The Evolution of Black-owned Banks in the United States Between the 1880s
and 1990s. Journal of Black Studies 26: 467–489.
Beyers, Laura T. 1997. The Community Reinvestment Act: A Boost to Low- and Moderate-Income Communities, a Set-Back for Minority-Owned Banks. North Carolina Banking Institute 1: Article 22.
Black, H., Robinson, B., & Schweitzer, R. (2001). Do Lenders Discriminate Against Low Income Borrowers? Review of Black Political Economy 28: 73-94.
Cole JA (1985) Black banks: A Survey and Analysis of the Literature. Review of Black Political
Economy 14: 29-50
Conniff, M.L., & Davis, T.J. (1994). Africans in the Americas: A History of the Black Diaspora. New York: St. Martin.
Dahl, D. (1995). Ownership Changes and Lending at Minority Banks. Journal of Banking and Finance 20: 1289-1301.
Dugan, John (2006). Minority-Owned Banks – Making a Difference in Their Communities. Office of the Comptroller of the Currency.
FDIC Federal Deposit Insurance Corporation (2002). FDIC Definition of Minority Depository Institution http://www.fdic.gov/regulations/resources/minority/MDI_Definition.html Accessed 20 June 2016
FDIC (2001 to 2014 inclusive) Minority Depository Institutions. FDIC.
FDIC (2002, 2015) Summary of Deposits. FDIC.
FDIC (2014). Minority Depository Institutions: Structure, Performance, and Social Impact. FDIC Quarterly, 8: 33-63.
Hasan I, Hunter W. (1996). Management Efficiency in Minority- and Women-Owned Banks. Economic Perspectives 20: 20–8.
Iqbal, Z., Ramaswamy, K., & Akhigbe, A. (1999). The Output Efficiency of Minority-Owned Banks in the United States. International Review of Economics and Finance 8: 104–114.
Kashian R, McGregory R, Grunfelder-Mcrank D (2014) Whom Do Black-Owned Banks Serve? Communities & Banking. Boston FDIC Bank, Summer: 29-31
Lawrence, E. (1997). The Viability of Minority-Owned Banks. The Quarterly Review of Economic and Finance, 37: 1–21.
Li, W, Dymski, G, Zhou, Y, Chee, M & Aldana, C (2002). Chinese-American Banking and Community Development in Los Angeles County. Annals of the Association of American Geographers 92: 777-796.

33
Matasar, A., & Pavelka, D. (2004). Minority Banks and Minority Are Minority Banks Good Communities: Neighbors? International Advances in Economic Research 10: 43–57.
Price D. (1990). Minority-Owned banks: history and trends. Federal Reserve Bank of Cleveland Economic Commentary July: 1-5.
Ruggles, S., Genadek, K., Goeken, R., Grover, J., and Sobek, M. (2015). Integrated Public Use Microdata Series: Version 6.0 [Machine-readable database]. Minneapolis: University of Minnesota.
Snow J (2014). Zip code to Zcta Crosswalk. Washington DC: American Academy of Family Physicians. http://www.udsmapper.org/zcta-crosswalk.cfm Accessed 15 June 2015
Thiebolt, A (1970). The Negro in the Banking Industry. University of Pennsylvania, Wharton School of Finance and Commerce, Industrial Research Unit.
U.S. Census (n.d.). Geography: ZIP Code Tabulation Areas. U.S. Census. https://www.census.gov/geo/reference/zctas.html Accessed 4 February 2015.