The Changing Epidemiology of Preterm Birth in the U.S. Nancy S. Green, MD Medical Director National...
39
The Changing Epidemiology of The Changing Epidemiology of Preterm Birth in the U.S. Preterm Birth in the U.S. Nancy S. Green, MD Medical Director National March of Dimes White Plains, NY [email protected] Associate Professor of Pediatrics Assistant Professor of Cell Biology Albert Einstein College of Medicine, N.Y.
-
date post
18-Dec-2015 -
Category
Documents
-
view
213 -
download
0
Transcript of The Changing Epidemiology of Preterm Birth in the U.S. Nancy S. Green, MD Medical Director National...

The Changing Epidemiology of The Changing Epidemiology of Preterm Birth in the U.S.Preterm Birth in the U.S.
Nancy S. Green, MDMedical Director
National March of DimesWhite Plains, NY
Associate Professor of PediatricsAssistant Professor of Cell Biology
Albert Einstein College of Medicine, N.Y.

March of Dimes Birth Defects Foundation
Mission:• To improve infant health by preventing infant
mortality and birth defects
The Continuum of Reproductive Health• Determinates of infant health:
–The entire spectrum of reproductive health extends from pre- conception through 1st year of infant’s life and throughout the woman’s childbearing years
• Pre-conceptional health as the cornerstone

Preterm Birth/Prematurity• #1 cause of perinatal mortality (28 weeks gestation - 6 days
life) in US (~ 75% of these losses)
• #1 cause of neonatal mortality (0-27 days) in US
• #2 cause of infant mortality (<1 year) in US
• #1 cause of infant mortality for black infants in the US
• Major determinant of neonatal and infant illness:
– Neuro-developmental handicaps (CP, Mental Retardation)
– Chronic respiratory problems
– Intraventricular hemorrhage, Periventricular leukomalacia
– Infection
– Necrotizing enterocolitis
– Neurosensory deficits (hearing, visual)

www.marchofdimes.com or peristats.modimes.org
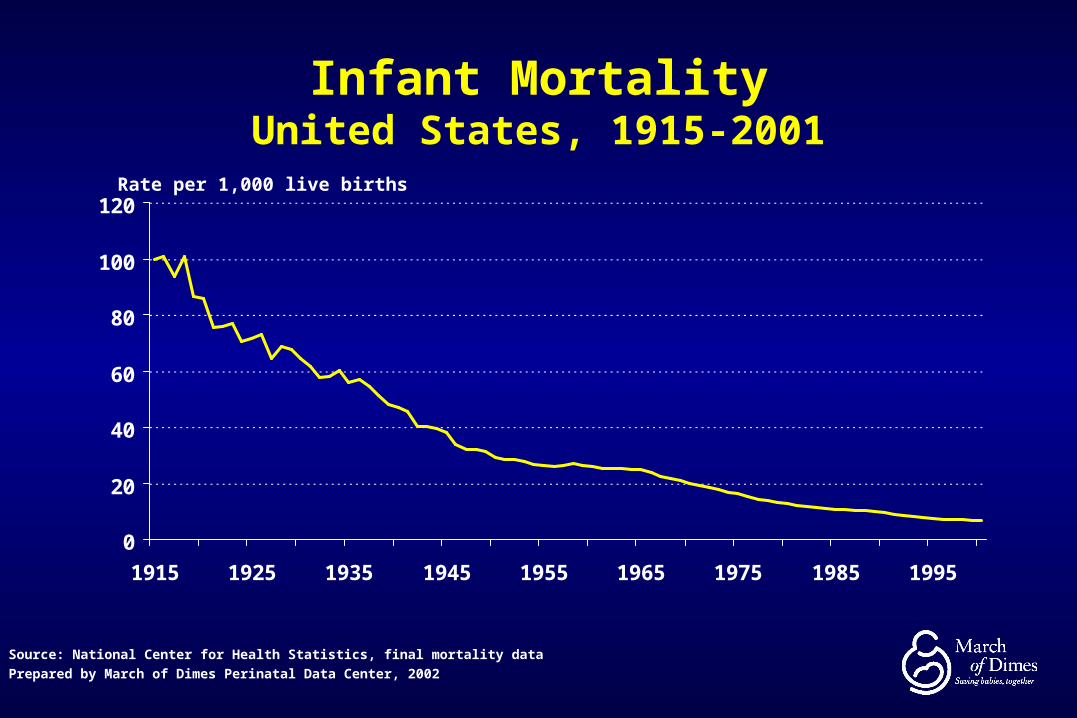
Infant MortalityUnited States, 1915-2001
0
20
40
60
80
100
120
1915 1925 1935 1945 1955 1965 1975 1985 1995
Rate per 1,000 live births
Source: National Center for Health Statistics, final mortality data
Prepared by March of Dimes Perinatal Data Center, 2002

Selected Leading Causes of Infant Mortality United States, 1990 and 2000
24.8
62.1
108.4
141.8
68.5
130.3
96.5
198.1
0 50 100 150 200 250
RDS
SIDS
Preterm / LBW
Birth Defects
1990
2000
Rate per 100,000 live births
Source: National Center for Health Statistics, 1990 final mortality data and 2000 linked birth/infant death data
Prepared by March of Dimes Perinatal Data Center, 2002
1
2
3
6
2000
Rank

Low Birthweight
Births7.8%
Preterm Births12.0%
Birth Defects~3-4%
Overlap in LBW, Preterm and Birth Defects U.S. (2002)
Among LBW: 2/3 are preterm
Among preterm: almost 50% are LBW (some preterm
are not LBW)

Current Definitions
• Birth Weight– Low Birth weight (LBW) - < 2500 grams or 5.5 lbs
– Very low birth weight - (VLBW) < 1500 grams or 3.3 lbs
• Gestation Length– Premature (preterm delivery, PTD)- < 37 weeks
– Early preterm delivery - < 32 weeks
• Growth Restriction
– < 10th percentile for gestational age
• IUGR - intrauterine growth restricted applies to fetuses
• SGA - small for gestational age applies to neonates
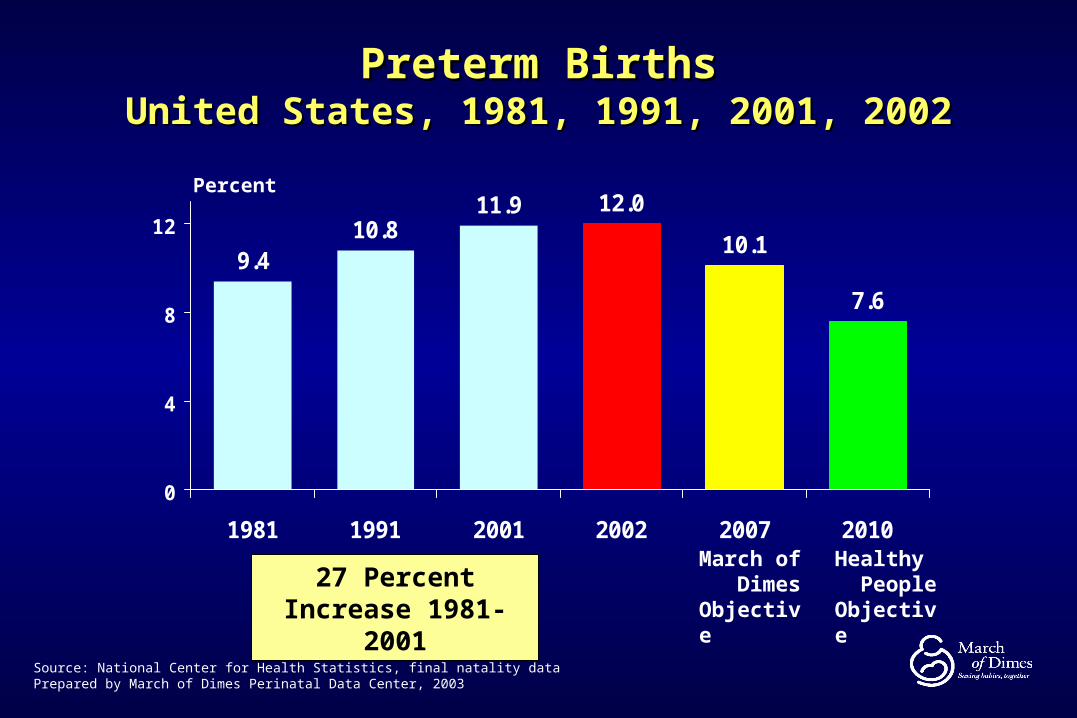
9.410.8
11.9 12.0
10.1
7.6
0
4
8
12
1981 1991 2001 2002 2007 2010
Preterm BirthsPreterm BirthsUnited States, 1981, 1991, 2001, 2002United States, 1981, 1991, 2001, 2002
Source: National Center for Health Statistics, final natality dataPrepared by March of Dimes Perinatal Data Center, 2003
Percent
Healthy People Objective
March of Dimes Objective
27 Percent Increase 1981-2001

U.S. Preterm Birth by State (2001)
US Total = 11.9%
Percent of Live Births
12.7 to 17.0 (18)11.2 to 12.7 (15) 8.2 to 11.2 (18)

Percent Change in Preterm Birth RateBy State, United States, 1991 to 2001
Note: Value in ( ) = number of states (includes District of Columbia)
Value ranges are based on equal countsSource: National Center for Health Statistics, final natality dataPrepared by March of Dimes Perinatal Data Center
Percent Change in Preterm Birth Rate
Increase greater than 20.2% (14)Increase from 10.5% to 20.1% (17)Increase from 0.1% to 10.4% (18)Decline (2)

Distribution of Live Births by Gestational AgeUnited States, 1990 and 2001
2001Live Births
n = 3,986,102*
1990Live Births
n = 4,111,396*
Not Preterm (88.4%)Not Preterm (89.4%)
Very Preterm (1.9%)
Moderately Preterm (10.0%)
Very Preterm (1.9%)
Moderately Preterm (8.7%)
Total Preterm = 10.6% Total Preterm = 11.9%
* Note: Live births with missing gestational age data were excluded from the analysis.Source: National Center for Health Statistics, final natality data
Prepared by March of Dimes Perinatal Data Center, 2003
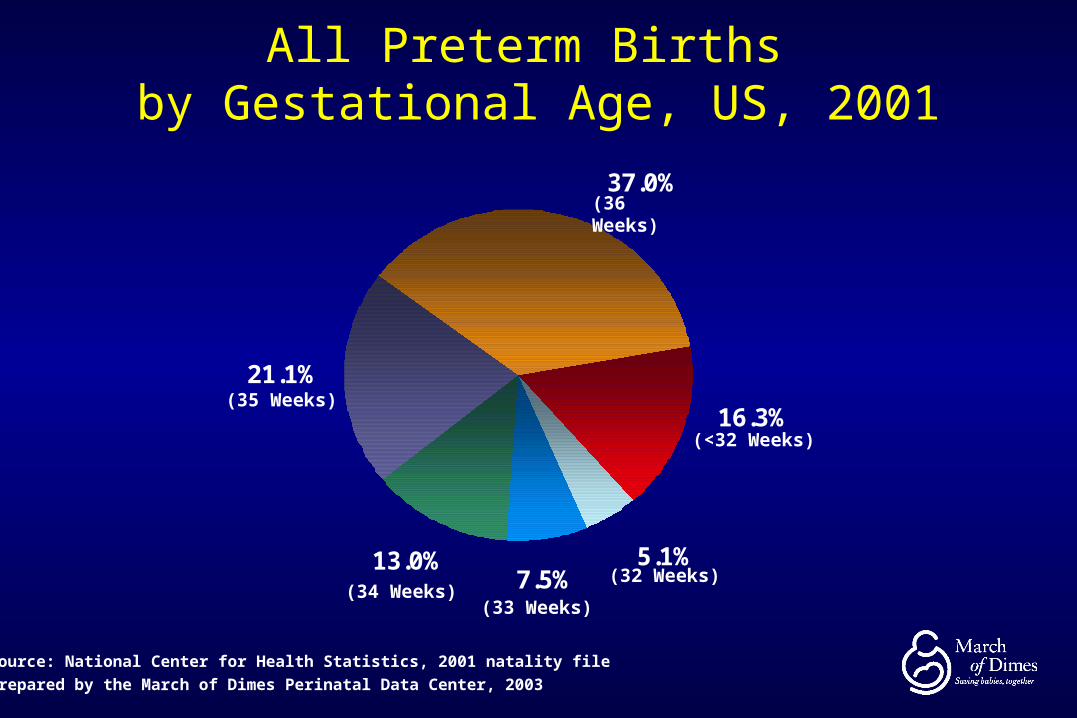
All Preterm Births by Gestational Age, US, 2001
Source: National Center for Health Statistics, 2001 natality file
Prepared by the March of Dimes Perinatal Data Center, 2003
13.0%
21.1%
5.1%7.5%
16.3%
37.0%
(34 Weeks)(33 Weeks)
(32 Weeks)
(<32 Weeks)
(35 Weeks)
(36 Weeks)

Preterm Births (<37 weeks)by Maternal Race/Ethnicity, US, 2001
11.0
17.5
13.2
10.311.4 11.9
0
6
12
18
White Black NativeAmerican
Asian orPacific
Islander
Hispanic All Races
Percent
Preterm is less than 37 weeks gestation
Hispanics can be of any race
Source: National Center for Health Statistics, 2000 final natality data
Prepared by March of Dimes Perinatal Data Center, 2002
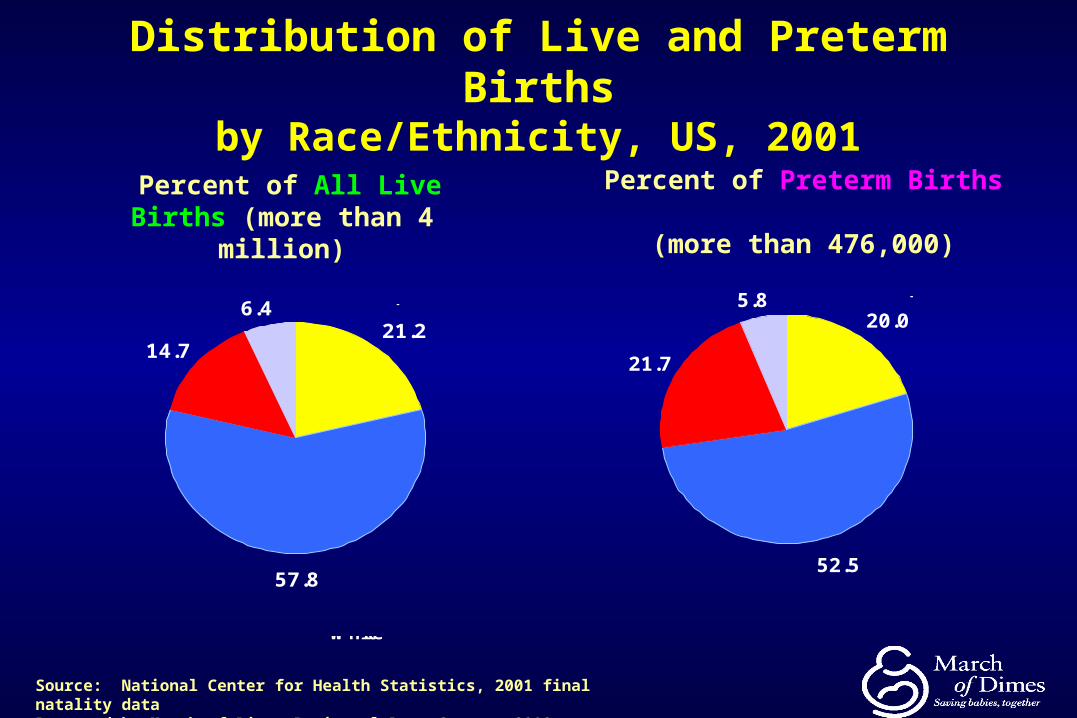
Distribution of Live and Preterm Birthsby Race/Ethnicity, US, 2001
Percent of All Live Births (more than 4 million)
Percent of Preterm Births (more than 476,000)
20.0
52.5
21.7
5.8
Non-Hispanic White
Non-Hispanic Black
Other/Unknown
Hispanic
21.2
57.8
14.7
6.4
Non-Hispanic
White
Non-Hispanic Black
Other/Unknown
Hispanic
Source: National Center for Health Statistics, 2001 final natality dataPrepared by March of Dimes Perinatal Data Center, 2003

Types of Preterm BirthTypes of Preterm Birth
SpontaneousPreterm Labor
SpontaneousPremature Ruptureof the Membranes
MedicalIntervention
PretermBirth
While this suggests distinct pathways, many of the risk factors for all 3 are similar
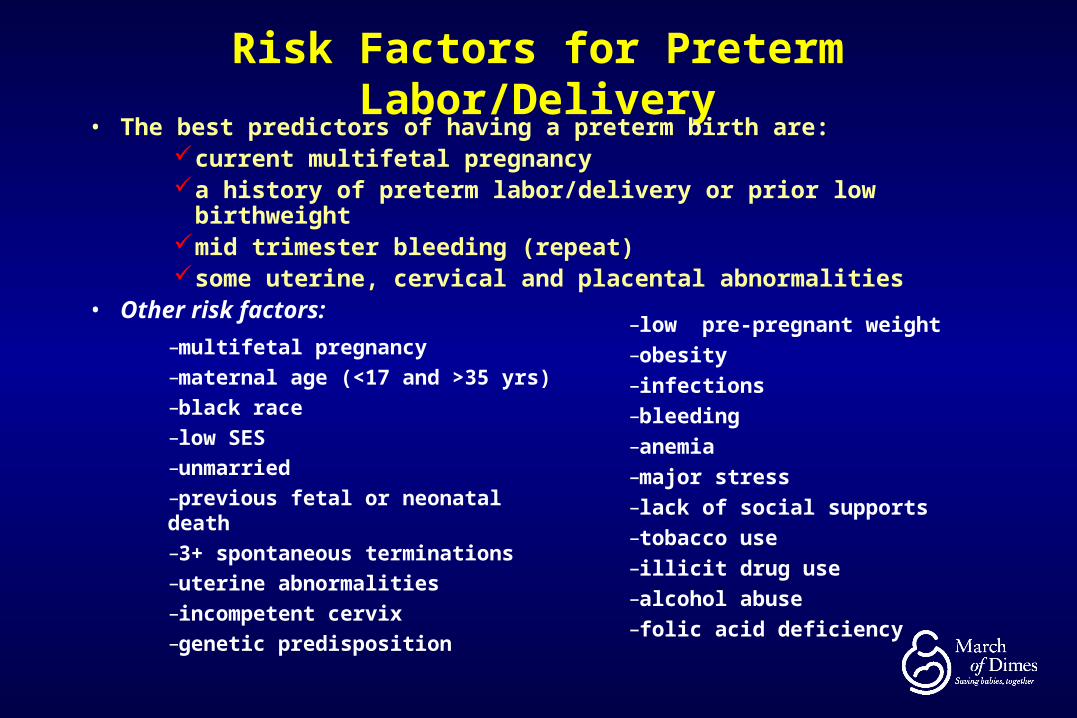
Risk Factors for Preterm Labor/Delivery• The best predictors of having a preterm birth are:
current multifetal pregnancya history of preterm labor/delivery or prior low birthweightmid trimester bleeding (repeat) some uterine, cervical and placental abnormalities
• Other risk factors:
–multifetal pregnancy
–maternal age (<17 and >35 yrs)
–black race
–low SES
–unmarried
–previous fetal or neonatal death
–3+ spontaneous terminations
–uterine abnormalities
–incompetent cervix
–genetic predisposition
–low pre-pregnant weight–obesity–infections–bleeding –anemia –major stress –lack of social supports–tobacco use–illicit drug use–alcohol abuse–folic acid deficiency
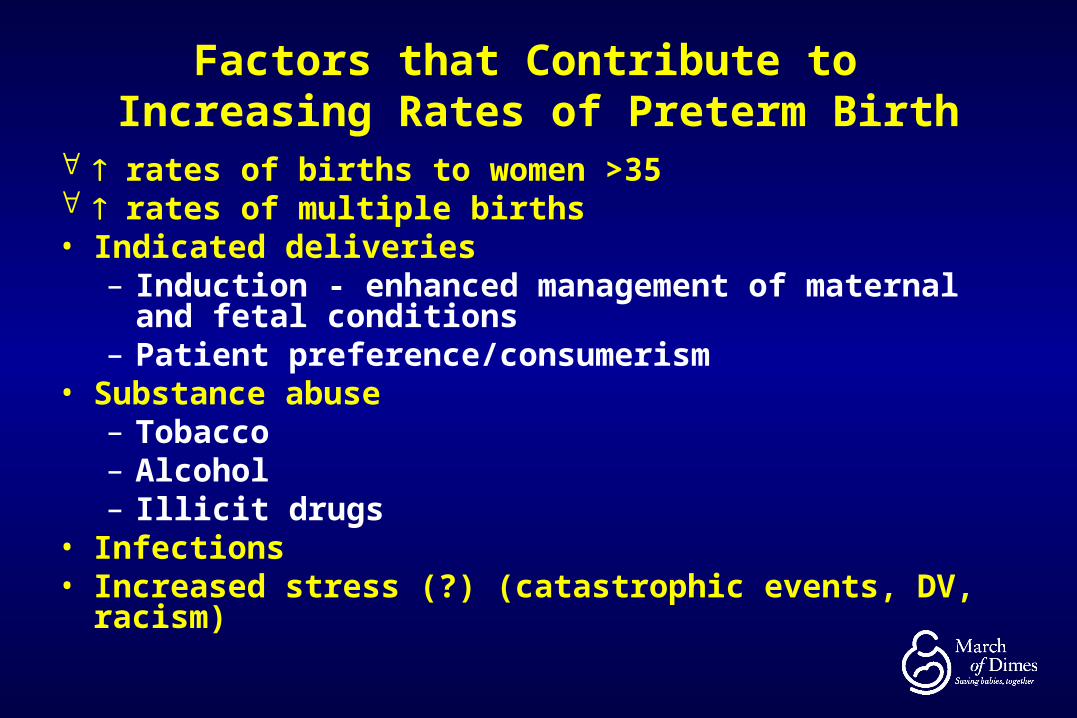
Factors that Contribute to Increasing Rates of Preterm Birth
rates of births to women >35 rates of multiple births• Indicated deliveries
– Induction - enhanced management of maternal and fetal conditions
– Patient preference/consumerism• Substance abuse
– Tobacco– Alcohol– Illicit drugs
• Infections • Increased stress (?) (catastrophic events, DV, racism)
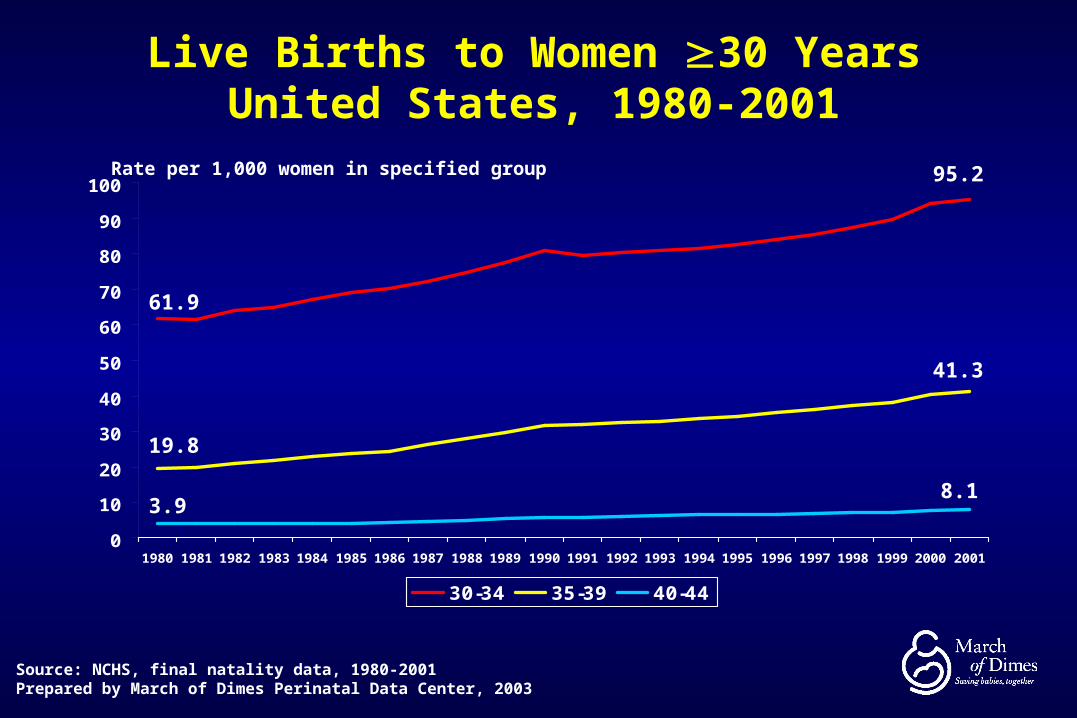
Live Births to Women 30 YearsUnited States, 1980-2001
0
10
20
30
40
50
60
70
80
90
100
1980 1981 1982 1983 1984 1985 1986 1987 1988 1989 1990 1991 1992 1993 1994 1995 1996 1997 1998 1999 2000 2001
30-34 35-39 40-44
Rate per 1,000 women in specified group
Source: NCHS, final natality data, 1980-2001Prepared by March of Dimes Perinatal Data Center, 2003
61.9
19.8
3.98.1
41.3
95.2

15.7
13.011.6
10.6 11.012.4
15.1
11.6
0
3
6
9
12
15
18
17 andunder
18-19 20-24 25-29 30-34 35-39 40+ AllAges
Percent
Preterm is less than 37 competed weeks gestation
Source: National Center for Health Statistics, 2000 final natality data
Prepared by March of Dimes Perinatal Data Center, 2002
Preterm BirthsPreterm Birthsby Maternal Age, United States, 2000by Maternal Age, United States, 2000

Very Preterm (<32 wks) by Maternal Age United States, 1999-2001 average

Preterm Births by PluralityUnited States, 2001
10.4
57.4
92.7
0
25
50
75
100
Singletons Twins Higher order
Percent
Source: National Center for Health Statistics, 2001 final natality dataPrepared by March of Dimes Perinatal Data Center, 2003

Multiple Birth Ratios by Race*United States, 1980-2001
19.3 19.7 19.9 20.3 20.3 21.0 21.6 22.0 22.4 23.0 23.3 23.9 24.4 25.2 25.7 26.127.4
28.630.0 30.7 31.1
32.0
0
5
10
15
20
25
30
35
All Races White Black
Ratio per 1,000 live births
*Race of child from 1980-1988; Race of mother from 1989-2001Source: NCHS, final natality data, 1980-2001Prepared by March of Dimes Perinatal Data Center, 2003
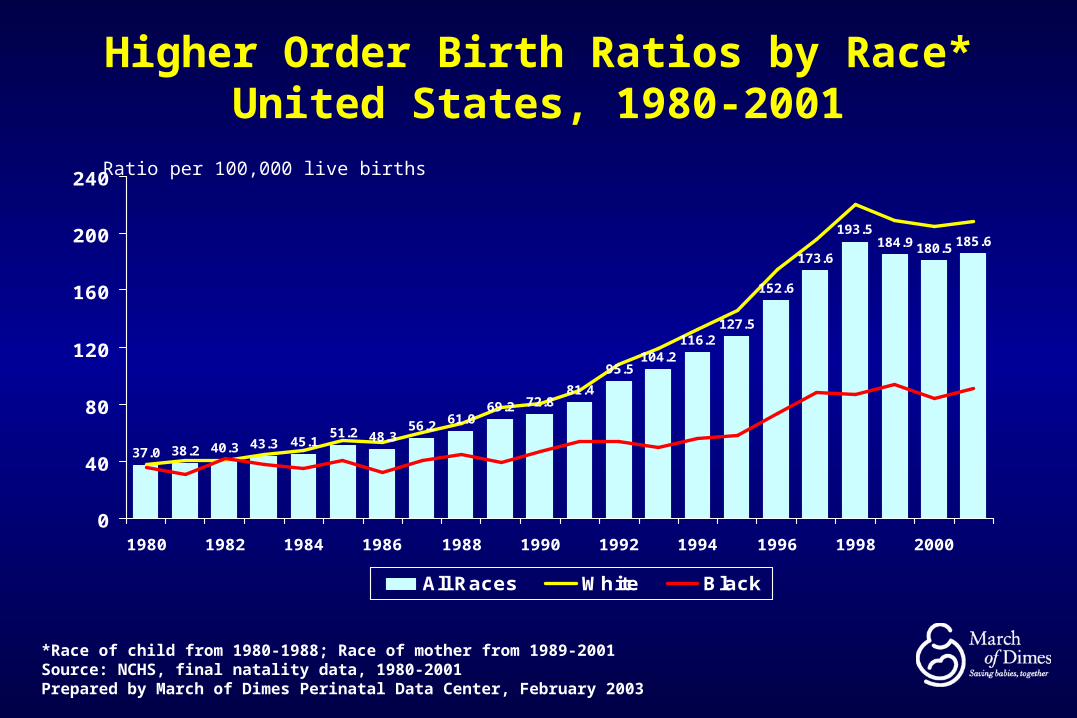
Higher Order Birth Ratios by Race*United States, 1980-2001
37.0 38.2 40.3 43.3 45.151.2 48.3
56.2 61.069.2 72.8
81.4
95.5104.2
116.2127.5
152.6
173.6
193.5184.9 180.5 185.6
0
40
80
120
160
200
240
1980 1982 1984 1986 1988 1990 1992 1994 1996 1998 2000
All Races White Black
Ratio per 100,000 live births
*Race of child from 1980-1988; Race of mother from 1989-2001Source: NCHS, final natality data, 1980-2001Prepared by March of Dimes Perinatal Data Center, February 2003

Risks of Adverse Pediatric Outcomes with ART
MultiplesTwins - 10-35% Triplets - 0.5-9.3%
• Prematurity• Low birth weight
Birth Defects? Complicated analysis
• Maternal: Low birth weight, Birth defects• Paternal: Chromosomal abnormalities• Procedures: ??

Singletons Preterm Delivery United States, 1991-2001
US Singleton PTB increase 6.1%

Total and Primary Cesarean and VBAC Rates United States, 1989-2002
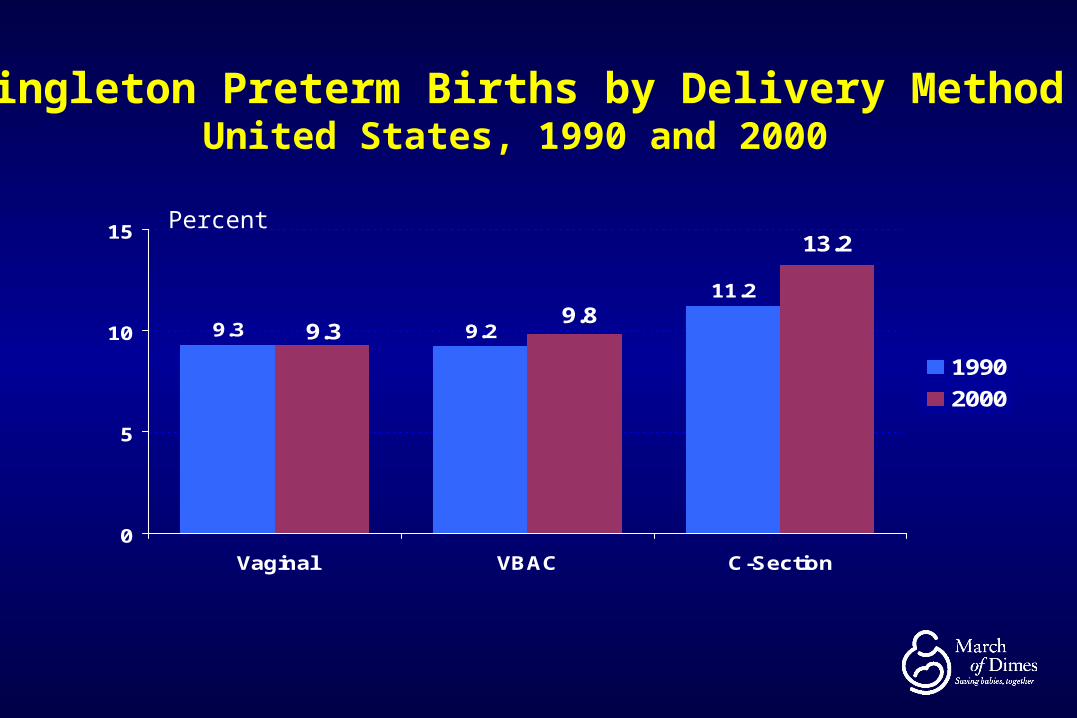
Singleton Preterm Births by Delivery MethodUnited States, 1990 and 2000
9.3 9.2
11.2
13.2
9.89.3
0
5
10
15
Vaginal VBAC C-Section
1990
2000
Percent

Thank you for your attention
Additional Resources
www.marchofdimes.com www.jjpi.com
this continuing education presentation is sponsored by the
March of Dimes - Johnson & Johnson Pediatric Institute Grand Rounds Program
as part of the
March of Dimes National Prematurity Campaign


March of Dimes National Prematurity March of Dimes National Prematurity CampaignCampaign
Nancy S. Green, MDMedical Director
National March of DimesWhite Plains, NY
Associate Professor of PediatricsAssistant Professor of Cell Biology
Albert Einstein College of Medicine, N.Y.

March of Dimes National Prematurity Campaign
2003-2007
5 year $75 million initiativeNational Partners: ACOG, AAP,AWHONN
and many national professional health group alliances

Campaign Goals
1. Increase public awareness of the problems of prematurity to at least 60%
Annual survey: 38% baseline
2. Decrease the rate of preterm birth in the U.S. by at least 15%
2001 rate: 11.9% (to <10.1%)

9.410.8
11.9 12.0
10.1
7.6
0
4
8
12
1981 1991 2001 2002 2007 2010
Preterm BirthsPreterm BirthsUnited States, 1981, 1991, 2001, 2002United States, 1981, 1991, 2001, 2002
Source: National Center for Health Statistics, final natality dataPrepared by March of Dimes Perinatal Data Center, 2003
Percent
Healthy People Objective
March of Dimes Objective
27 Percent Increase 1981-2001

March of Dimes Prematurity Campaign2003-2007
5 Campaign Aims:
1. Raise public awareness
2. Educate women as to signs of premature labor
3. Assist practitioners
4. Invest to identify causes and promising interventions
5. Seek guaranteed access to health care

Outreach
• Public:– Media (PSA’s, etc.), Print, Web
• Pregnant women:– Signs and symptoms of preterm labor and actions– Risk reduction (pre-conception and prenatal care,
healthy lifestyles, risk-appropriate care– NICU family support
• Health care providers:– Grand Rounds, Curricula, patient ed materials,
journal articles, PERIstats website

Premature Birth:The answers can’t come soon enough

Thank you for your attention
Additional Resources
www.marchofdimes.com www.jjpi.com
this continuing education presentation is sponsored by the
March of Dimes - Johnson & Johnson Pediatric Institute Grand Rounds Program
as part of the
March of Dimes National Prematurity Campaign