
The changing demographics of the uninsured in MN and the nation
24
THE CHANGING DEMOGRAPHICS OF THE UNINSURED IN MINNESOTA AND THE NATION Elizabeth Lukanen, MPH State Health Access Data Assistance Center (SHADAC) Minnesota Health Services Research Conference March 1, 2016 St. Paul, MN
-
Upload
soder145 -
Category
Healthcare
-
view
227 -
download
0
Transcript of The changing demographics of the uninsured in MN and the nation
THE CHANGING DEMOGRAPHICS OF THE UNINSURED IN MINNESOTA AND
THE NATION
Elizabeth Lukanen, MPH State Health Access Data Assistance Center (SHADAC)
Minnesota Health Services Research Conference
March 1, 2016 St. Paul, MN

Outline
1. Study details 2. Coverage expansions and outreach under
the Affordable Care Act 3. Changes in uninsurance rates, 2013-2014 4. Changes in the characteristics of the
uninsured, 2013-2014 5. Conclusions and policy implications

Study Details
• Research question: Have insurance coverage gains likely related to the Affordable Care Act (ACA) changed the demographic profile of the uninsured?
• Data source: 2013 and 2014 American Community Survey Public Use Micro Data Sample
• Approach: Descriptive statistics, year-over-year testing for significance using t-test at the 95% confidence interval
• Co-Author: Brett Fried, SHADAC 3

ACA COVERAGE EXPANSIONS AND OUTREACH

Affordable Care Act Expanded Health Insurance Coverage Options • Optional Medicaid expansion for childless adults up
to 138% Federal Poverty Level (FPL, $16,104 in 2014) • 32 states have currently expanded Medicaid, including
Minnesota • Tax credits to purchase private coverage through the
health insurance Marketplace • For families below 400% FPL ($46,680 for a family of 4 in
2014) • Single, streamlined enrollment and application
assistance through the Marketplace • 13 state-based (including Minnesota – MNsure), 11
Federally-supported or partnership and 27 states opted to use the federal marketplace
• Expended the definition of “young adult” so that children up to 25 could stay on their parents health insurance plan

Financial Support for Outreach and Enrollment • Federal funding for outreach and assistance
during the first Open Enrollment Period (OEP) exceeded $400 million
• Minnesota awarded more than $4.75 million in outreach and enrollment grants in the first OEP
• Many states (including Minnesota) and the federal government targeted groups with historically high rates of uninsurance • Young adults • Racial and ethnic minorities • Non- English speakers or limited English proficiency • Immigrants and refugees
Source: “Survey of Health Insurance Marketplaces Assister Program” The Henry J. Kaiser Family Foundation, July 2014.

IMPACTS ON UNINSURED RATES, 2013-2014

National Uninsured Rate Over Time, 2008-2014
15% 15% 16% 15% 15% 15%
12%
8% 9% 9% 9% 8% 8%
6%
0%2%4%6%8%
10%12%14%16%18%
2008 2009 2010 2011 2012 2013 2014
U.S. Minnesota
Source: SHADAC Analysis of the ACS.

Significant Declines Seen in all 50 States
Source: SHADAC Analysis of ACS.
Percentage Point Declines in State Uninsured Rates, 2013-2014

Uninsured Rates Declined for Most Targeted Subpopulations • Decline in every age category
• +5pp drop for young adults 19-25 • Decline in every racial/ethnic category
• Rates for Hispanics and Asians declined more than 4pp
• Rates for Blacks declined more than 4pp in MN and 3.5pp in the U.S.
• Decline in every income category • +4pp declines for low income families (0-138 FPL
and 139 to 199% FPL) • Declines in all category of workers, all education
levels and citizenship status categories

DID CHANGES IN RATES OF UNINSURANCE IMPACT THE CHARACTERISTICS OF THE UNINSURED?

Characteristics of Interest
• Age • Sex • Race/Ethnicity • Marital status • Employment status • Industry • Education • Veteran status • Disability status
• Citizenship status • Language • Receipt of public
assistance (e.g. food stamps)
• Presence of internet in the home
• Disability

Minnesota: Uninsured are now More Likely to be Hispanic
16% 22%*
61% 58%
11% 10% 7% 5% 3% 3% 2% 2%
0%10%20%30%40%50%60%70%80%90%
100%
2013 2014
Characteristics of the Uninsured by Race/Ethnicity, 2013-2014
Hispanic White Black Asian American Indian Multiple/other
Source: SHADAC analysis of the ACS. * significant at the 95% confidence interval.

Minnesota: Uninsured are now More Likely to be Non-Citizens
16% 20%*
84% 80%*
0%
10%
20%
30%
40%
50%
60%
70%
80%
90%
100%
2013 2014
Characteristics of the Uninsured by Citizenship Status, 2013-2014
Non Citizen Citizen
Source: SHADAC analysis of the ACS. * significant at the 95% confidence interval.
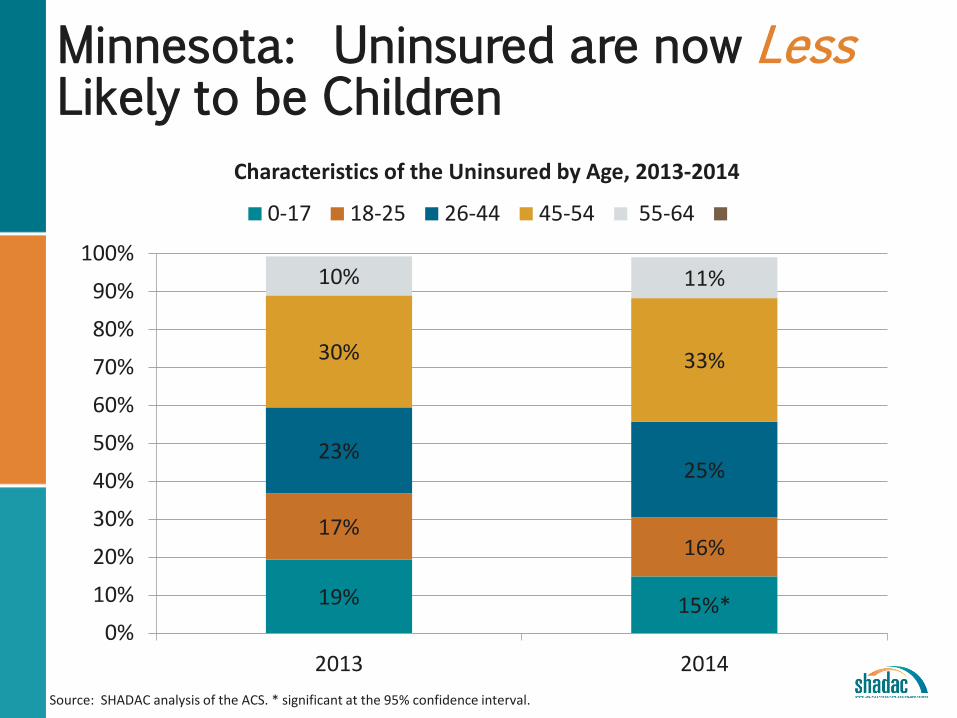
Minnesota: Uninsured are now Less Likely to be Children
19% 15%*
17% 16%
23% 25%
30% 33%
10% 11%
0%
10%
20%
30%
40%
50%
60%
70%
80%
90%
100%
2013 2014
Characteristics of the Uninsured by Age, 2013-2014
0-17 18-25 26-44 45-54 55-64
Source: SHADAC analysis of the ACS. * significant at the 95% confidence interval.

U.S.: Uninsured are now More Likely, to be Hispanic and Less Likely to be White /Asian
33% 35%*
44% 43%*
14% 14% 5% 5%* 1% 1% 2% 2%
0%10%20%30%40%50%60%70%80%90%
100%
2013 2014
Characteristics of the Uninsured by Race/Ethnicity, 2013-2014
Hispanic White Black Asian American Indian Multiple/other
Source: SHADAC analysis of the ACS. * significant at the 95% confidence interval.

U.S.: Uninsured are now More Likely to be Non-Citizens
22% 24%*
78% 76%*
0%
10%
20%
30%
40%
50%
60%
70%
80%
90%
100%
2013 2014
Characteristics of the Uninsured by Citizenship Status, 2013-2014
Non -Citizen Citizen
Source: SHADAC analysis of the ACS. * significant at the 95% confidence interval.
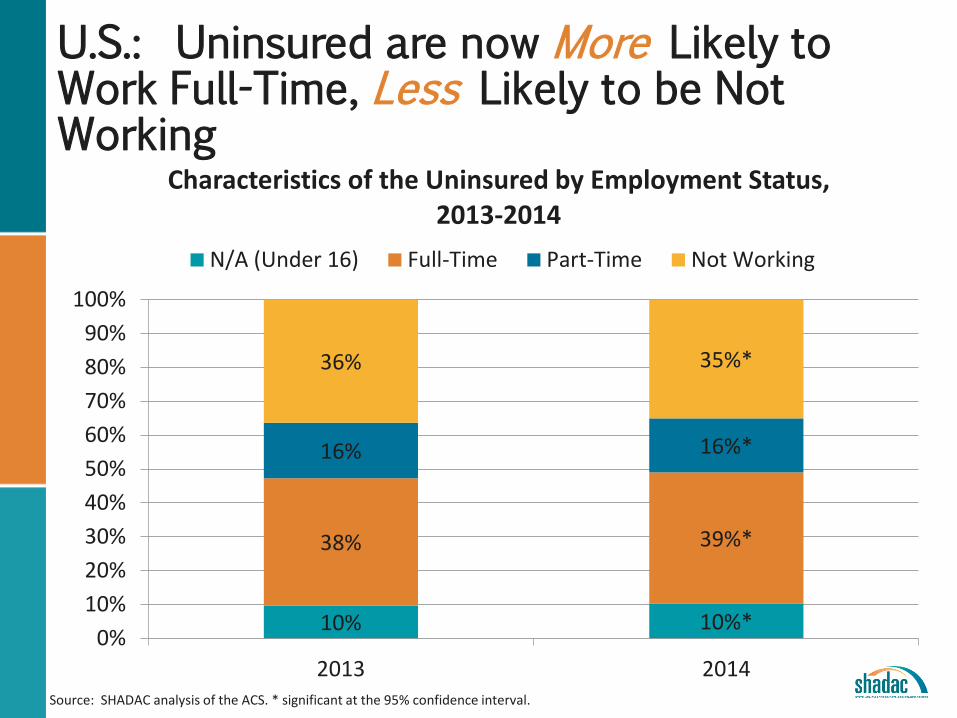
U.S.: Uninsured are now More Likely to Work Full-Time, Less Likely to be Not Working
10% 10%*
38% 39%*
16% 16%*
36% 35%*
0%10%20%30%40%50%60%70%80%90%
100%
2013 2014
Characteristics of the Uninsured by Employment Status, 2013-2014
N/A (Under 16) Full-Time Part-Time Not Working
Source: SHADAC analysis of the ACS. * significant at the 95% confidence interval.
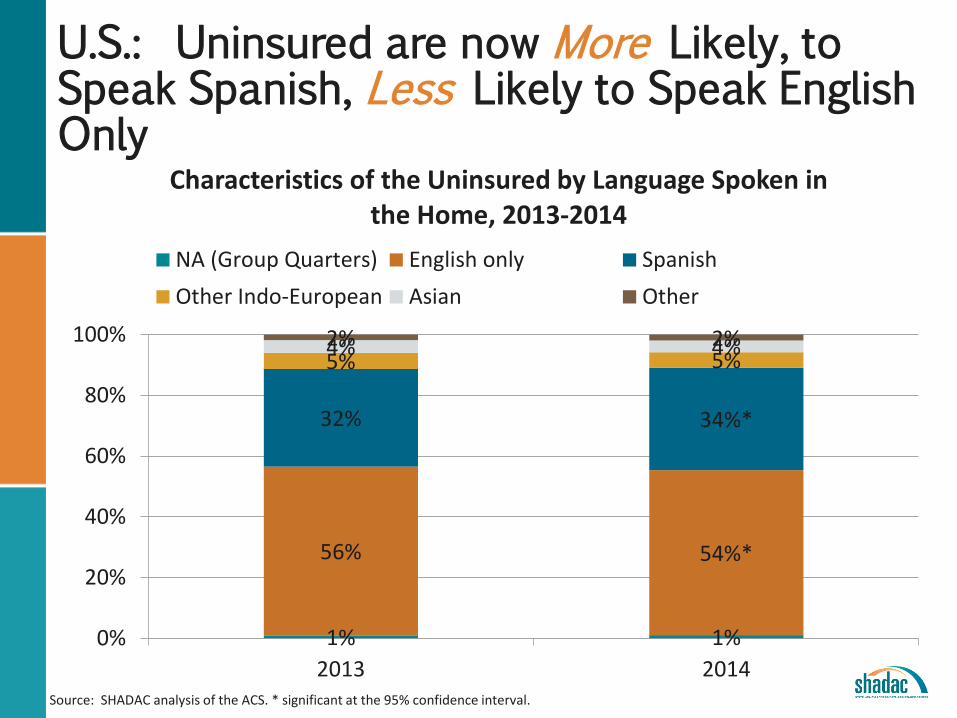
U.S.: Uninsured are now More Likely, to Speak Spanish, Less Likely to Speak English Only
1% 1%
56% 54%*
32% 34%*
5% 5% 4% 4% 2% 2%
0%
20%
40%
60%
80%
100%
2013 2014
Characteristics of the Uninsured by Language Spoken in the Home, 2013-2014
NA (Group Quarters) English only SpanishOther Indo-European Asian Other
Source: SHADAC analysis of the ACS. * significant at the 95% confidence interval.

U.S.: Uninsured are now Less Likely to be Very Low Income
55% 54%*
24% 24%
13% 13% 8% 8%
0%10%20%30%40%50%60%70%80%90%
100%
2013 2014
Characteristics of the Uninsured by Income (% Federal Poverty Level), 2013-2014
0-138% 139-250% 251-400% 400+
Source: SHADAC analysis of the ACS. * significant at the 95% confidence interval.

U.S.: Uninsured are now More Likely to Have Less Education
25% 26%*
34% 35%*
30% 28%*
11% 11%
0%10%20%30%40%50%60%70%80%90%
100%
2013 2014
Characteristics of the Uninsured by Education, 2013-2014 Less than High School High school GraduateSome college Bachelor's degree or higher
Source: SHADAC analysis of the ACS. * significant at the 95% confidence interval.
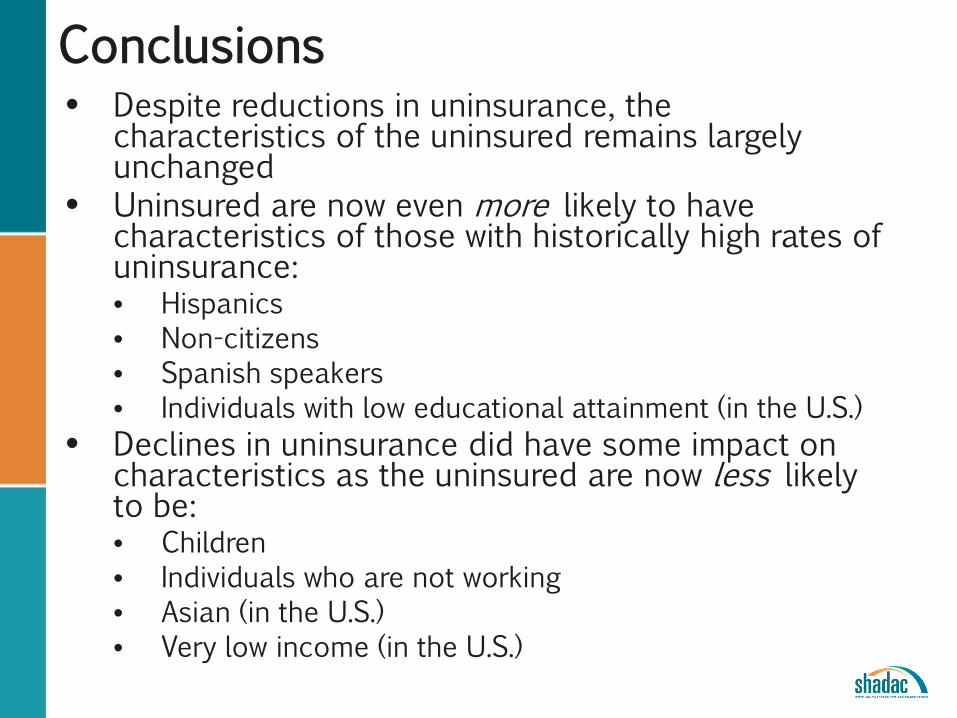
Conclusions • Despite reductions in uninsurance, the
characteristics of the uninsured remains largely unchanged
• Uninsured are now even more likely to have characteristics of those with historically high rates of uninsurance: • Hispanics • Non-citizens • Spanish speakers • Individuals with low educational attainment (in the U.S.)
• Declines in uninsurance did have some impact on characteristics as the uninsured are now less likely to be: • Children • Individuals who are not working • Asian (in the U.S.) • Very low income (in the U.S.)

Policy Implications
• Findings don’t signal a need for a radical shift in approach to outreach and enrollment
• Outreach and enrollment efforts need to continue to target Hispanics, Spanish speakers and those with low education
• Policy action is needed to address individuals whose citizenship status limits coverage options (due to eligibility or fear)
• The Medicaid expansion is likely critical to maintain shifts in the characteristics of the uninsured related to income and age

www.shadac.org @shadac
Elizabeth Lukanen SHADAC Deputy Director
University of Minnesota Senior Fellow [email protected]
612.626.1537


![Who Goes Where Revisedv3 082312mna - Rhode Island · Minneapolis, MN: Minnesota Population Center [producer and distributor], 2010. Uninsured Medicaid 221 221 Individual: w/Tax Credit](https://static.fdocuments.in/doc/165x107/5f5defa5036d52514064f013/who-goes-where-revisedv3-082312mna-rhode-minneapolis-mn-minnesota-population.jpg)