The Fan Design Impact on the Rotor Cooling of Axial Flux ...
THE CHALLENGE FOR THE ACCURATE DETERMINATION OF THE AXIAL ROTOR THRUST IN CENTRIFUGAL COMPRESSORS
Yves Bidaut Manager Mechanical Development MAN Diesel & Turbo Schweiz AG Zürich, Switzerland Yves Bidaut is Manager of the mechanical development department of MAN Diesel & Turbo Schweiz AG in Zürich, Switzerland.
His job function includes the development and analysis of the components of centrifugal compressors for the Oil & Gas application. He is responsible for providing technical support in rotordynamics and stress analysis. Before joining the site in 2003 he was employed for 6 years in MAN Diesel & Turbo, Berlin where he was involved in the design, finite element analysis, rotordynamic analysis, testing and development of centrifugal compressors. He received his diploma (Mechanical Engineering, 1995) from the University of Valenciennes (France).
Dominique Dessibourg Head of Application Engineering MAN Diesel & Turbo Schweiz AG Zürich, Switzerland Dominique Dessibourg is Head of Application department of MAN Diesel & Turbo Schweiz AG in Zürich, Switzerland. His job includes
the thermodynamic layout of centrifugal compressors from the bid phase to the final test. He works in the O&G upstream segment of the company since 1989 and he participated in the development of the HOFIMTM compressor and to the patent about the cooling system. He received his diploma (Mechanical Engineering, 1988) from the Engineering school of Fribourg (Switzerland) ABSTRACT
The axial thrust is basically generated by a pressure imbalance across the impeller. The impeller is subjected to a great force trying to move it against the incoming flow. The cumulative thrust of all impellers on the shaft, especially when the impeller arrangement is in-line, has to be compensated by a balance piston.
The purpose of this paper is to describe the calculation procedure for the accurate evaluation of the thrust in centrifugal compressors for medium and high pressure applications. In this respect the paramount factors which influence the thrust are considered such as the operating conditions (surge or choke), the different combinations of operating modes inside the compressor (in the case of multi-section configuration), as well
as variable labyrinth seal clearances and different roughness of rotor and stator.
Different arrangements of the compressor like in-line and back-to-back configurations are analysed and compared with regard to their influence on thrust and thrust variation. An example with a medium pressure compressor is given.
The paper also focuses on the main inaccuracies for the calculation of the thrust like the core rotation factor and the degree of reaction of the stages.
To validate the calculations, extensive measurements of the thrust forces acting on the axial thrust bearing were performed during the full-load, full-pressure factory testing of different high-pressure centrifugal compressors. The results of the tests demonstrate the accuracy of the prediction and the high sensitivity of the thrust to the boundary conditions. The evaluation of the thrust analyses is the base for the further determination of the stability behavior of the compressor which is compared to the damping measurement carried out during factory testing. These measurements emphasize the importance of performing such thrust measurements during a full-load, full-pressure or ASME PTC10 Type 1 test.
The requirements of some specifications are discussed and their consequences on the design of the compressor are evaluated with respect to their feasibility.
The impact of the size of the ASV (Anti-Surge Valve) on the thrust range of the compressor is further discussed. INTRODUCTION
For the design of a centrifugal compressor, the analysis of the axial rotor thrust during the pre-design phase has a decisive consequence on the final configuration of the rotor (and of the casing) and on other crucial factors like leakage, rotordynamic behavior and thermodynamic properties. Moreover, an incorrect layout of the thrust bearing resulting from a wrong or insufficient analysis of the thrust can lead to a dysfunction of the compressor. One possible consequence is to reduce the overall performance of the compressor (due to an inacceptable high temperature at the bearing Babbitt). The overload of the bearing can even lead to its damage provoking the breaking down of the unit. The required time to mend the bearing implies a costly loss of production to the operator. Hence the proper calculation of the thrust belongs to the essential analyses for the design of the compressor, similarly to the analysis of the rotordynamic stability or the choice of the right materials.
In the past, some papers can be found with failures that resulted from damaged thrust bearings. For instance, in the case study of Moll and Postill (2011), the root cause of the axial bearing failure of a refrigeration compressor was found in the overloaded bearing. This overloading originated from an
1 Copyright© 2016 by Turbomachinery Laboratory, Texas A&M Engineering Experiment Station

inaccurate calculation of the thrust with an “old” code: a review of the thrust with a new code delivered a thrust value of more than twice the original one. However, there exist only few publications about a throughout investigation of the axial thrust. Generally, this topic is introduced only as one (interesting) part of a more general study. Recently, Kurz, et al. (2011) investi-gated the thrust behavior of a centrifugal compressor in choke conditions and pointed out the necessity to consider the thrust in choke for a proper sizing of the balance piston.
Hence, the principal basic considerations for the correct layout of the thrust bearing must first be defined. Then the main parameters which influence the thrust behavior, such as the section arrangement (back-to-back or in-line) or the use of thrust brakes, are addressed. At last special attention must be paid to the remaining uncertainties of the calculation. WHAT SHOULD BE CONSIDERED? Balance Piston Layout The first step for the calculation of the thrust is to determine the diameter of the balance piston in order to reach a low thrust with the specified process condition of the design point as shown in Figure 1. It is possible to choose a diameter for a thrust of 0 N but this means that the position of the rotor is not defined and could move from one side of the bearing to the other which is not adequate. For magnetic bearing, a thrust of 0 N can be chosen because the magnetic field keeps the collar in the middle of the bearing. Figure 1. General layout of balance piston Operating points The design of the thrust bearing and of the balance piston must account for the overall performance map of the compressor. In principle, it is sufficient to consider only some extreme points in the performance map as shown in Figure 2. These points are operated during tests and commissioning. Near to surge, the pressure difference (hence the thrust) through the compressor increases especially for variable speed drivers. For such a configuration, the point near to surge at the maximum
continuous speed (MCS) and choke at minimum speed shall also be calculated. Figure 2. Mainly considered operating points for thrust calculation If the compressor consists of two sections, i.e. two anti-surge (AS) loops, a section can be operated near to the stability limit (actually at the anti-surge control line) and the other section at the choke line (resistance line of the AS valve). This operation is understandably not specified. However as both AS-loops are independent from each other, such a case is possible, especially during commissioning or at upset conditions. For each of these cases, the resulting thrust is different: the combination “surge – choke” is not necessarily covered by the cases “surge – surge” and “choke – choke”. Clearance Any possible change of the geometry has also to be considered. The clearance of the labyrinth seals of the impellers and balance piston often increases after some years of operation. Thus, in adherence to API 617, the calculations are also performed with twice the maximum internal clearances of the seals. All the thrust variations result from a change in pressure difference, also with higher clearances. However, this variation depends also strongly of the size of the impellers. The example below demonstrates the magnitude of this thrust variation: let’s consider a compressor with a suction pressure ps = 30 bara (435 psi), a discharge pressure pD = 180 bara (2,610 psi) and impellers whose tip diameter (D2) is 400 mm. The total pressure difference is 150 bar (2,175 psi). Assuming a common degree of reaction (RE) for a stage of 0.66, the impellers provide a pressure difference of 100 bar (1,450 psi). The variation of the static pressure along the shroud between the nominal and twice the maximal clearance can be estimated as roughly 10% of the pressure difference of the impeller.
2 Copyright© 2016 by Turbomachinery Laboratory, Texas A&M Engineering Experiment Station

Therefore the thrust variation due to the different clearances is estimated according the following rule of thumb: (1), where the area “A” of the shroud is calculated as: (2). As the eye diameter (DDA) for low flow coefficient impeller is typically roughly 60% of the tip diameter (D2), the shroud area A can be approximated as: (3). Hence the shroud area for this example is A= ½ . 0.42= 0.08 m2 and the thrust variation becomes: ΔS = 0.1. 150.105 [Pa].0.66 . 0.08 [m2] = 79,200 [N]. Such a thrust variation requires a big thrust bearing with high capacity. However this variation can be reduced by using thrust brakes. The thrust variation due to clearance differences is represented in Figure 3 in dependence of the tip diameter of the impellers for different pressure differences through the casing according to Equations (1) and (3). In this study, the clearance varies from the theoretical nominal value to twice the maximum. The maximum allowable bearing capacity (50% of the maximal load) is superimposed. It has also to be noted that the size of the bearing (and consequently the thrust capacity) is restricted by the lateral behavior of the compressor. Figure 3. Estimated thrust variation due to variable seal clearances Figure 3 clearly shows that a medium size compressor with only 100 bar pressure difference can be subjected to a higher thrust variation than a small high pressure compressor (compare points and ). However such compressors are equipped with a thrust bearing of higher capacity. Roughness The roughness of the surfaces in contact with the gas may change in case of fouling or of corrosion if the chosen material does not comply with the gas. The fouling issue strongly depends on the application of the compressor:
• For air, wet gas, coker gas, flash gas or gas lift the internal parts of the compressor can be in contact with dirt or droplets. For compressors with two sections the first section can get fouling but not the second stage. Although the efficiency and capacity of the stage decrease at higher roughness the compressor still delivers the specified pressure thanks to increased rotating speed.
• For export (pipeline) or injection applications the gas is already treated through several scrubbers and devices like the dehydration columns and possibly also through a sweetening column. Therefore fouling is not expected as well as for H2-Recycle, pure N2 or O2 applications.
Figure 4 shows schematically the thrust variation for an in-line design due to higher clearance (direction of suction side, “SS”) and higher roughness (discharge side, “DS”) in dependence on the diameter of the balance piston. The basis for the layout of the thrust bearing is the worst case (highest axial force) which is determined by the combination of the three parameters operating points, clearance and roughness. Figure 4. Thrust variation for different roughness and clearances IF THE CALCULATION IS WRONG… Without measurement at full pressure the accuracy of the calculated thrust is still unknown and for medium or high pressure compressors the error at the design case (due to inaccurate assumptions) can easily be 20 - 40 KN or even more. Usually the balance piston is dimensioned on the basis of the design case in order to reach a low residual thrust (e.g. 10 KN). Therefore, even if the actual thrust is 50 KN due to an inaccurate calculation, it remains within the bearing capacity and nothing appears during the commissioning of the unit. However if the thrust at design case is 40 KN higher than calculated, then all the thrust variations are shifted with approx. 40 KN. It means that, by increased seal clearance, the maximal thrust can exceed the limit of 50% bearing capacity (but still within the 100% maximum bearing capacity). In such a case the bearing will not automatically fail but high bearing metal temperature and accordingly high oil temperature are expected.
3 Copyright© 2016 by Turbomachinery Laboratory, Texas A&M Engineering Experiment Station

MAGNETIC BEARING COMPRESSOR: PARTICULARITIES In the early 90’s, the development of compressors equipped with magnetic bearings accounted for low thrust variation because of the (approx. 10 times) lower capacity of the axial magnetic bearings in comparison to the conventional one with oil film. In the early 2000’s hermetically sealed oil-free compressors (compressors and high speed motor encapsulated with magnetic bearing) were developed for gas storage application. Kleynhans, et al. (2005) described the main properties and the challenges related to this compressor design. The accuracy of the prediction of the thrust is also of utmost importance, less due to the pressure level (usually lower than 200 bara) but because of the large variation of the suction and discharge pressures and the possibility to run two compressors simultaneously in parallel and in serial mode. COMPARISON IN-LINE / BACK-TO-BACK As explained by Wada, and al. (2009), one main advantage of the back-to-back arrangement (BtB) in comparison to the in-line configuration is the possibility to compensate the thrust forces between both sections, especially when the labyrinths are worn. However the wear issue has to be investigated further. In the literature, some cases related to unexpected higher clearances can be found. For example, Skaare, et al (2010) reported the case of an inacceptable increase of axial thrust on a BtB compressor design due to asymmetric fouling and change in radial clearances. This is the reason why the influence of the asymmetric modification of clearance between the sections is evaluated with the help of calculation on a typical compressor. The analysis is carried out on a compressor with two sections and a suction pressure of 8 bara (115 psi), an intermediate pressure of 30 bara (435 psi) and a discharge pressure of 75 bara (1,090 psi). The tip diameter of the impellers is 500 mm. Additionally to the design case (nominal clearance at all seals) and the usual case 1 (max clearance at all seals), six other cases, which cover the asymmetric clearances, are calculated as listed in Table 1: Table 1. Investigated clearance cases
The resulting thrusts are shown in Figure 5. For the in-line design, the highest thrust occurs with high seal clearances (Case 7). For the BtB design, the thrust is lower in this case because the thrust increases in both sections but in opposite direction and then largely compensate. For the in-line arrangement, it turns out that the maximum overall thrust variation is 64 KN (obtained from the difference between Case 7 & 2). The maximum variation for the BtB arrangement is 75 KN (difference between Case 4 & 5). The thrust with the BtB arrangement is still low if the clearance of all seals is simultaneously high (Case 1). However, the probability that the clearance is higher in one section only or in the balance piston only is similar than in all labyrinths simultaneously. For the BtB arrangement the worst case is obtained with a clearance increase only in one section and/or in the balance piston. Figure 5. Thrust at different clearances and arrangements Finally the API requirement has to be discussed. According to API 617, 2.7.3.3 of Chapter 2, 2002: “Calculations (…) shall include (…) twice the maximum design internal clearances.” However, the experience gained from the inspections and repairs of the rotors shows that the radial clearance increase is usually 0.10 – 0.15 mm. Related to a nominal radial clearance of typically 0.25 mm, the maximum actual clearance is therefore rather 0.4 mm. This is significantly less than twice the maximum clearance (0.6 – 0.7 mm). A second argument for the BtB arrangement is the thrust behavior near surge which remains low in comparison to the in-line design for the same reason as explained before (forces of both section are compensated). However, if each performance map of both sections is considered separately because of separated AS loops (instead of the overall performance map of the complete compressor), the thrust analysis must account for additional cases as listed in Table 2: for instance Section 2 could run in the surge control line whereas Section 1 is near choke. The study was performed for the same compressor as investigated above for both configurations.
-30
-10
10
30
50
70
Desig
n 1 2 3 4 5 6 7
Desig
n 1 2 3 4 5 6 7
Thru
st (k
N)
Case #
Back - to - Back In-Line
75 kN
64 kNSS
DS
0
Section 1 Section 2 Balance PistonDesign Nominal Nominal Nominal
1 Max Max Max2 Nominal Nominal Max3 Max Nominal Nominal4 Max Nominal Max5 Nominal Max Nominal6 Nominal Max Max7 Max Max Nominal
CaseSeal Clearances
4 Copyright© 2016 by Turbomachinery Laboratory, Texas A&M Engineering Experiment Station

Table 2. Investigated operating cases Figure 6 shows the resulting thrusts due to operation for surge and/or choke for both sections. As expected, the thrust for Case A (both sections are in their stability limit simultaneously) is clearly lower in the BtB arrangement than in the in-line design. However the variation is significantly higher for the BtB design in the cases C & D where the forces of both sections cannot be compensated. Hence the maximum thrust variation (58 kN) is reached for the BtB arrangement between Cases C & D, whereas the thrust variation for the in-line arrangement is only 16 kN. Figure 6. Thrust at different operations and arrangements The force variations become even much higher when the operating cases A/B/C/D are combined with variable clearances (as separately investigated before). Table 3 summarizes the extreme forces which were obtained by combining the seven clearance cases and the four operating condition cases. The thrust variation rises from 75 kN up to 99 kN for the BtB configuration and from 64 kN to 89 kN in the in-line arrangement. Hence it can be stated that both configurations have equivalent overall thrust variation. Table 3. Extreme thrusts from combined cases
At this point, it has to be emphasized again that the aim of this study is not to demonstrate the superiority of a configuration to the other. Its purpose is rather to highlight the different influences and sensitivities to parameters which must be accounted for a proper analysis of the thrust to ensure the reliability of the compressor in its life time, independently of its arrangement. SURGE CYCLE AND SIZE OF THE ASV The thrust shall be calculated at the maximum operating volume flow of the compressor which can also be determined by the size of the ASV (Anti Surge Valve). During start-up and shutdown, this valve is fully open and the resistance is very low. There are several reasons to settle the resistance line near the choke line:
• During commissioning the compressor is generally operated with nitrogen which produces higher pressure ratios and especially higher temperatures than with the specified gas. Thus, in order to keep the temperature below the maximum allowable working temperature, (MAWT) the pressure ratio is limited thanks to reduced resistance in the loop. (Despite the recom-mendation of OEMs, some operators implement an ASV with even bigger size which brings the resistance line even lower than the specified choke limit.)
• The second reason is to avoid a surge cycle during a controlled shut down (with fix speed motor) because the speed decreases extremely quickly. However, during an emergency shut-down (ESD), a surge cycle can generally not be prevented. A hot gas bypass valve can avoid the second and third surge cycle but not the first one. Therefore the compressor shall be robust enough to withstand some (2 – 3) surge cycles during ESD.
• A third reason is due to the operation in “stand-by” conditions: if a compressor runs in full recycling because of the shutdown of another compressor, it should not run in the surge control line when the other compressor starts again. The start-up of a motor in a limited power network (e.g. for FPSO) can produce a drop of the net frequency (and therefore also in the speed) which can lead the compressor running near the response line to surge and trip.
-30
-10
10
30
50
Desig
n A B C D
Desig
n A B C D
Thru
st (k
N)
Case #
Back - to - Back In - Line
DSSS
58 kN16 kN
0
Section 1 Section 2Design Design Design
A Surge SurgeB Choke ChokeC Surge ChokeD Choke Surge
CaseOperating Conditions
Clearance Operating4 C + 56 kN5 D - 43 kN7 A + 90 kN
Design B + 1 kN
Back - to - Back
In - Line
Arrangement
99 kN
89 kN
Thrust Thrust - Variation
Case
5 Copyright© 2016 by Turbomachinery Laboratory, Texas A&M Engineering Experiment Station

-150
-100
-50
0
50
Thru
st [k
N]
Compressor III
pd = 110 bara
Compressor IV
pd = 182 bara
Compressor II
pd = 66 bara
Compressor I
pd = 15 bara
Bearing Capacity (acc. API 50%)
SS
DS
Static - ImpellerBalance PistonMomentumDynamic - Hub & Shroud
Residual thrust
Thrust Components
THRUST CALCULATION General Considerations The axial rotor thrust is the cumulative thrust of all impellers and of the static thrust acting on the balance piston and on the shaft ends. As shown in Figure 7, the thrust acting on an impeller is broken down into the static forces FS1 (eye) and FS2 (hub), the forces acting on the shroud FD and on the hub disk FN and the momentum forces FM (in the impeller eye). In case of stepped labyrinth seals, the thrust resulting from the pressure distribution along the seal is also considered. The cumulated thrust of all impellers is compensated by a balance piston.
Figure 7. Axial forces acting on the impeller The static forces are only a function of the labyrinth and shaft diameters and of the static pressures in front of and after the stage. As all these parameters are well defined, the calculated force is fairly accurate. Although the force on the piston (FK) is also easy to calculate, it must account for the static pressure in the side room behind the balance piston which can vary with respect to the pressure losses along the balance piston line. It still exists correspondingly an uncertainty for this force. The momentum force is a function only of the mass flow and of the gas speed at the impeller eye which depends on the volume flow and the suction area of the impeller. As all of these parameters are well known, this force is determined with very good accuracy. Regarding the hub and the shroud thrusts, the forces are more difficult to calculate because they depend on the static pressure distribution along the hub and shroud disks. These distributions must account for many parameters which are further described below. Lüdke (2004) stated that a sufficient capacity reserve for the thrust bearing is required when the pressure distributions are not experimentally determined. According to Figure 7, a positive thrust is defined for a direction towards the suction side of the stage (SS). In order to determine the influence of the thrust components on the overall thrust of the rotor, a study is carried out on four different compressors of the author’s company. For the purpose of a fair comparison all the investigated compressors are of the
same size and with similar pressure ratio (π = 3). Only the pressure level varies between each configuration. It has to be mentioned that these compressors are not equipped with thrust brakes. Only the design point is considered.
Figure 8. Thrust breakdown of different compressors of same size Figure 8 shows the thrust components of the four compressors. The absolute residual thrust is nearly the same for all configurations. This is the consequence of the appropriate choice of the diameter of the balance piston to compensate the overall static thrust force acting on all impellers. It can clearly be seen that the momentum force has only a marginal role on the overall thrust of the rotor, independently of the pressure level. For the purpose of better understanding, the shroud and hub forces are divided in a static force (visualized with dash lines in Figure 7) and a kinetic force representing the pressure distribution along the hub and shroud side. The influence of this so-called kinetic force acting on the hub and shroud of the impellers is interesting as it depends strongly on the pressure level. For low pressure (Compressor I, pd= 15 bar or 220 psi), this force has a low influence on the overall thrust. In contrary, at higher pressure (Compressor IV, pd= 182 bara or 2,640 psi), this kinetic force has a significant influence on the overall thrust. Hence the accuracy of the calculation of this kinematic force becomes essential for high-pressure compressors. For illustration, in compressor by low pressure, an uncertainty of 50% in the calculation of the kinetic forces results in 2.5 % error of the calculated thrust related to the bearing capacity, which is acceptable. At high pressure, this 50% of uncertainty leads to a fluctuation of 38 % related to the bearing capacity, which can become an issue. As can be derived from these results, the accurate determination of this kinetic force is essential for compressors at higher pressures (i.e. higher than 200 bara or 2,900 psi).
6 Copyright© 2016 by Turbomachinery Laboratory, Texas A&M Engineering Experiment Station

-50
-40
-30
-20
-10
0
10
20
30
40
50
Thru
st [k
N]
Compressor III
pd = 110 bara
Compressor IV
pd = 182 bara
Compressor II
pd = 66 bara
Compressor I
pd = 15 bara
SS
DS
Roughness
Tolerances
Design Seal Clearance Max. Performance map
Min. Performance map
Bearing Capacity (acc. API 50%)
Tolerances, Variations As explained above, the analysis of the resulting thrust must account for many parameters (variable seal clearances, different roughness, and operating conditions like surge or choke) which influence each single force. This is the reason why the four previously analyzed compressors are subjected to a parameter study whose results are shown in Figure 9. The seal clearance varies from the nominal value to twice the maximum clearance (the tolerances are also considered).
Figure 9. Thrust variations as a consequence of tolerances It can clearly be seen that the variation of the thrust due to the variation of the seal clearance is considerable, especially for higher pressures. To simulate a deterioration of the surfaces of the rotor and stator due to dust or condensate deposits, the roughness is varied as well from one to ten times the original value. Due to this modified roughness, the overall thrust varies also significantly. At last, the compressor can be operated within the entire specified performance map, from the choke area (among other during start-up) until the stability limit (surge control line). Hence the overall thrust variation, as shown in Figure 9, can dramatically change at higher pressures (this is the reason why the nominal thrust of Compresor IV was configured in the DS direction instead of the usual SS direction). These tolerances shall be considered for a proper design of the thrust bearing. From this analysis, it turns out that a loading of the bearing only in one direction is not possible if all the tolerances are considered. To fulfill this criterion, a much bigger thrust bearing would be required to the disadvantage of the critical overhung mode. Hence the aim of a reliable design of the bearing with respect to all the influences is to reduce the effects of the tolerances and to increase the accuracy of the calculations in order to minimize the thrust variations. The influence of the axial gap in the side room between the impeller and the casing (depicted “s” in Figure 13) on the
overall thrust was also investigated. Based on the original assumed value, the gap for the four machines was varied within +/- 50%. The variation of the overall thrust was only between 3% (Compressor I) and 25% (Compressor IV). This variation is marginal in comparison to the variation obtained by modifying the roughness, labyrinth clearances or within the performance map (140% at Compressor I and 500% at Compressor IV). Hence the influence of the gap in the side room is generally not further considered. THRUST LOAD ON HUB AND SHROUD DISKS The major challenge for the proper calculation of the overall thrust of a centrifugal compressor lies in the correct determination of the forces acting on the shroud and hub disks of each impeller. The accuracy of these calculated disk thrust loads depends strongly on the knowledge of the thermodynamic characteristics of the flow field in the cavities. As shown in Figure 10, the forces on the disk can be broken down into a static and a kinetic force which are calculated according to Equations (4) to (6): (4)
(5)
(6)
The static force FD/N,stat is calculated with the static pressure at the impeller exit (p3) assumed to be constant along the disk. As can be derived from Equations (5) and (6), the pressure distribution along the disk pD/N (r) and the static pressure at the impeller exit p3 are the key factor for the correct determination of the forces. Figure 10. Definition of static and kinetic forces on disks
7 Copyright© 2016 by Turbomachinery Laboratory, Texas A&M Engineering Experiment Station

Core rotation factor Usually the static pressure distribution in the cavities is calculated according to Equation (7):
(7),
where the circumferential component cu is determined as Equation (8): (8).
ω is the angular velocity of the disk and C(r) is the so-called core rotation factor (or swirl-factor) along the disks. Its evaluation is complex and depends on many factors as the geometry of the disk and the gap between the rotating and static part. Recently Petry, et al. (2012) presented an overview for the determination of the radial pressure distribution, corroborated by measurements, and the assumptions for Equation (7). For the purpose of simplification, a common rule consists of assuming a constant rotational speed of the fluid in the side room to be half of the rotational speed of the disk, as often mentioned in text books. Japikse (1996) reported values between 0.3 and 0.9 in industrial practice. Based on the common value C(r) = 0.5, the kinetic force can easily be re-written as Equation (9)
(9) This simple approach allows for a quick estimation of the residual thrust on the impeller with a satisfying accuracy. However, for high pressure applications or compressors equipped with magnetic bearing systems, the accurate value of the thrust is vital. Hence the assumptions for the Equation (7) and especially the simplified value for the core of 0.5 as presented by Lempart (1992) are not sufficient. In reality the pressure distribution in radial direction is as the following Equation (10):
(10) In particular the second term (shear stresses in radial direction) describes the influence of the roughness on the boundary layers on the rotating part (disk) and stationary part (casing). s is the gap between the impeller and the casing. Furthermore, the circumferential speed cu cannot be assumed constant over the entire disk and is also a function of the shear stresses. The second important factor is the value of the core rotation factor at the inlet of the side room. This value is known with reasonable accuracy at the exit of the impeller (for centripetal flow, i.e. for the shroud disk) and is a simple function of the work input factor which varies with the operating condition (optimum, part load, and overload). On the other side, the core rotation factor for centrifugal flow (i.e. generally on the hub
side) cannot be analytically estimated with sufficient accuracy as it depends on many factors, such as the geometry of the side room, rotational velocity, gas properties, etc … For this purpose, some CFD simulations of the flow pattern are performed in the side room of the impeller hub. Figure 11 shows an example of the swirl behavior at the flow inlet in the side room of the hub for two different labyrinth configurations (on stator, left and rotating, right). It shows that the type of the labyrinth does not have a significant influence on the core rotation factor. It has to be noted that Kurz, and al. (2011) presented values for the core rotation factor between 0.3 and 0.5. Figure 11. Core rotation factors at inlet of side room (hub disk) Characteristic of flow in the side rooms The next decisive factor is the flow direction in the hub cavity. As the pressure at the outlet of the impeller is always higher than the pressure at the inlet, independently of the operation point (part load, optimum, overload), the flow in the shroud cavity is always centripetal (radial inward, because p3>p0). On the contrary the direction of the leakage flow in the hub cavity depends of the operating point of the stage. For an operation at the optimum or in part load condition, the flow is centrifugal (radial outward, when p3<p6). As shown in Figure 12, the pressure distribution in the hub room is then totally different to the distribution in the shroud side room. At operation in overload (near the choke), the built up pressure in the impeller is compensated by a pressure drop in the diffuser. Hence the pressure p6 is lower than the pressure at the impeller exit and the leakage flow in the hub cavity becomes centripetal (like in the shroud cavity). Hence the pressure distribution in the hub-cavity follows a similar pattern as in the shroud (see dashed line in Figure 12). It has to be mentioned that the flow in the hub cavity of the last stage is always inward, as the balance piston is installed behind the impeller. Figure 12. Radial pressure in cavities (hub & shroud)
p4
p3
p5
0.5
0.6
0.7
0.8
0.9
1.0
Nor
mal
ized
Radi
us r/
r 2
Normalized Pressure p(r) / p0
hubcentripetal shroud
hubcentrifugal
stator stator
hub disk hub disk
8 Copyright© 2016 by Turbomachinery Laboratory, Texas A&M Engineering Experiment Station

Thrust Brakes In the 80’s, the author’s company developed a new stage for low flow coefficients (Casey, and al., 1990). The experience gained from the early high pressure compressors in the 70’s emphasized the necessity to reduce the thrust variation for low flow compressors with small impellers running at high speed. Therefore it was decided to equip this stage with thrust brakes: in order to quantify the influence of this device on the performance characteristics of the stage, several tests were performed with thrust brakes as well as with different clearances. The use of the thrust brakes was particularly beneficial for the train arrangements with solid couplings and thrust collar gears (instead of axial bearing inside the compressor): the reduction of the thrust variation removed the main shortcoming of this configuration which was the limited capacity of the collar. As shown previously, several parameters have a strong influence on the resulting thrust of the compressor. The overall thrust variation due to the different conditions can be very large. Hence, in order to keep the thrust in the range of the bearing capacity, the thrust variations are reduced. The variation depends strongly on the change of the swirl velocity in the shroud cavity as schematically described below:
• higher clearance higher leakage increased velocity decreased static pressure increased thrust in the SS direction.
• increased roughness lower velocity increased static pressure increased thrust in the DS direction.
Figure 13 shows a typical arrangement of thrust brakes. The influence of the thrust brakes on the leakage flow in the cavity is analyzed with CFD calculations. Figure 14 shows the static pressure and the swirl velocity distribution in the shroud cavity for both configurations (with and without thrust brake). It can be seen that the thrust brakes remove the swirl velocity and hence increase the static pressure in the cavity: the sensitivity to clearance or roughness changes is also strongly reduced. Figure 13. Arrangement of thrust brakes However with higher static pressure in the cavity, the leakage through the labyrinths increases and therefore the efficiency of the stage is reduced. For stages with low flow coefficient, this reduction has to be considered for a proper layout thanks to dedicated corrections implemented in the layout tool. Hence, the decision of implementing thrust brakes and (if yes) at which
stage depends among others on the bearing capacity and on the thermodynamic boundary conditions of the compressor. The influence of the thrust brakes on the core rotation factor was quantified thanks to the recorded pressures along the disk during the measurements of the stages at the author’s test rig. Figure 14. Static pressure (above) and swirl velocity (below) distribution in the shroud cavity w/o (left) and with (right) thrust brake Static pressure at impeller exit (p3), Degree of reaction towards choke Finally the resulting thrust on the impeller depends also strongly on the value of the static pressure at the impeller exit (p3). For the operation at or near the optimum of the stage, this static pressure is known with high accuracy because the stage (including impeller, diffuser and return channel) is designed for this condition. In operation outside the optimum, especially in overload conditions (near or at choke), the correct determina-tion of p3 is more complex. Usually the characteristics of the stages which are the basis of the thermodynamic layout are recorded as “total-to-total efficiency” and “work input factor” of the overall stage. However, these factors do not deliver any information related to p3. This is the reason why the degree of reaction (RE) is required which is the ratio of the polytropic head of the impeller divided by the polytropic head of the stage. Figure 15 shows a typical behavior of the degree of reaction in dependence of the inlet flow coefficient. It can clearly be seen that the degree of reaction increases dramatically in the choke area, especially at high Mach number. In choke, the diffuser doesn’t convert anymore the velocity into static pressure; it even removes partially the static pressure achieved through the impeller. Such steep curves are not adequate for an accurate determination of the pressure p3. This is the reason why this pressure is calculated directly from the impeller characteristic
shro
ud
hub
s
Thrust brake
9 Copyright© 2016 by Turbomachinery Laboratory, Texas A&M Engineering Experiment Station

(without consideration of the diffuser). During the development of each stage, the characteristics of the impeller combined with different types of diffuser (vaned as well as vaneless) are measured for the release of the stage in production. Figure 15. Degree of reaction in dependence of flow coefficient As shown in Figure 16, the choke limit of this stage is determined by the diffuser. In overload operation, the impeller still delivers a reasonable efficiency and pressure coefficient. Hence the losses of diffuser (and of the crossover bend and return channel), which are large in operating overload, are covered by this method of calculation. Figure 16. Characteristic of impeller and stage (typical) MEASUREMENTS History In the middle of the 90’s, first thrust measurements were carried out on a high pressure compressor (420 bara, 6,090 psi) during its full-load, full-pressure factory testing. Two types of thrust brakes and different clearances (nominal and higher) were tested. Baumann, 1999 presented the influence of the thrust brakes on the rotordynamic stability. Regarding the overall thrust, the results were satisfying with respect to the trouble free operation of the compressor. However, the thrust variation from surge to choke was larger than expected. In order to achieve a better prediction of the thrust behavior, similar measurements were performed on the successional high pressure compressor. The gained knowledge from these measurements supported the development of a compressor with 300 bar (4,350 psi) pressure difference (ps = 114 bar / 1,655 psi,
pd = 414 bar / 6,005 psi). The results indicated clearly that a back-to-back design was not necessary with respect to the thrust. To further validate the calculations thrust measurements were also performed on a 655 bar (9,500 psi) reinjection compressor along with the associated rotor damping measurements (Bidaut, and al., 2009). As this compressor was equipped with a solid coupling, the compressor was not equipped with a thrust bearing because the axial forces were taken via a thrust collar in the gear by a low speed axial bearing installed in the bull gear shaft. Beyond the satisfying accuracy of the prediction of the above mentioned compressor, a series of thrust measurements was carried out in the following years to further increase the pressure difference. The purpose of these tests is to demonstrate the safe operating of the compressor regarding the thrust bearing capacity and to validate the accuracy of the calculations. In the following the measurements of two high-pressure centrifugal compressors are presented. Compressor A For a FPSO (Floating Production Storage and Offloading) application, the authors’ company recently delivered the reinjection skid with two identical cartridges of a centrifugal compressor driven by induction motor. Before delivering on site, the compressor (with both cartridges) was tested in the OEM’s test facility with the original flexible job high speed coupling and dry gas seal device. Motor and gearbox were the test bed equipment. Table 4 shows the main operating conditions of the compressor for site operation as well as for the shop tests. The compressor runs at fixed speed (12,650 rpm). Table 4. Operating and test conditions (Compressor A) The compressor which has a pressure rating of 800 bar (11,600 psi) consists of six radial stages in an in-line design. Four stages are equipped with thrust brakes. Figure 17 shows a cross-sectional drawing of the compressor. The axial bearing is installed at the non driven end of the rotor. To measure the lateral damping during the FLFD-test, a shaker device was installed behind the axial bearing.
0.5
0.4
Degr
ee o
f Rea
ctio
n (n
orm
alisz
ed)
Inlet Flow Coefficient (normalized)
Mu2 = 0.5Mu2 = 0.8Mu2 = 1.0
Effic
ienc
y
Inlet Flow Coefficient
Stage
Impeller
Design TestSuction pressure bara (Psia) 248 (3,600 psi) 285 (4,130 psi)Discharge pressure bara (Psia) 551 (7,990 psi) 585 (8,485 psi)Average Gas density kg/m3 291 306Discharge Gas density kg/m3 315 338Rotor speed (100%) rpm 12,650 12,650
CO2+CnHm N2
g/mol 21.8 28.0Gas
Operating conditionsFeature Unit
10 Copyright© 2016 by Turbomachinery Laboratory, Texas A&M Engineering Experiment Station

Figure 17. Cross sectional drawing of Compressor A After the successful mechanical and thermodynamic tests in accordance with API 617 (2003) and ASME PTC-10 (1997) Type 2 specification, the compressor was subjected to a FLFD-test according to the specifications listed in Table 4. In order to obtain similar gas density as on site, pure nitrogen was used during the tests. The resulting axial force acting on the bearing was measured with strain gages installed at each pad of the bearing (both sides). The overall force was averaged from each single value per side. Figure 18 shows the equipped thrust pads. Figure 18. Equipped thrust device The compressor was operated at rotational speeds of 12,000 rpm (cartridge 1) and 12,650 rpm (cartridge 2). The measurements were performed along the performance curve for suction pressures of 285 bar (4,130 psi) and 200 bar (2,930 psi) with both cartridges, 245 bar (3,550 psi) with cartridge 2 and 106 bar (1,535 psi) with cartridge 1. The measured operating points are represented in Figure 19. The pressure ratio is greater at lower pressures due to real gas effects (which is still valid for nitrogen). The thrust was measured up to a maximum discharge pressure of 648 bar (9,400 psi) which is depicted in Figure 19 and corresponds to a pressure difference of 364 bar (5,280 psi).
Figure 19. Measured performance curves (Compressor A) Figure 20 shows the measured data together with the analytical predictions for both cartridges. The calculation is performed on the base of the theoretical nominal seal clearances. The resulting thrust is represented in dependence of the overall compressor pressure difference. It can clearly be seen that the thrust is mainly influenced by the position of the operating point within the compressor characteristic. The results support the following conclusions:
• The thrust variation between the stability limit and the choke increases slightly with pressure level. For a suction pressure of 285 bara, the variation is ∆= 28 kN, whereas at 106 bara ∆= 22 kN.
• The most remarkable result is the large drop of the force at (or near) choke: In this region a small variation of flow (10% of suction volume flow) leads to a large drop of thrust of 15 kN (compare points and ). This variation is similar to the variation between point and (stability limit). This drop is attributable to the high degree of reaction.
• Generally the results demonstrate the good correlation between the calculated thrust and the measurements. Especially the comparison at choke between measurements and calculation proves the good accuracy of the estimated thermodynamic characteristics at the side rooms of the impellers.
• In contrast to the cartridge 1, the results for cartridge 2 show a noticeable difference between the measure-ments and the calculations (even if the thrust is still
1.3
1.7
2.1
2.5
0.6 0.8 1.0 1.2 1.4 1.6
Pres
sure
Rat
io P
I
Suction Volume Flow (normalized)
200 bara
245 bara
285 bara
Suction Pressure
pd,maxCartridge 2
1.3
1.7
2.1
2.5
0.6 0.8 1.0 1.2 1.4 1.6
Pres
sure
Rat
io P
I
Suction Volume Flow (normalized)
106 bara
202 bara
285 bara
Suction Pressure
Cartridge 1
11 Copyright© 2016 by Turbomachinery Laboratory, Texas A&M Engineering Experiment Station

predicted with a fairly good accuracy). This can be attributed to the manufacturing tolerances and different realized seal clearances.
Figure 20. Measured and calculated thrusts (Compressor A) Compressor B The second considered compressor belongs to a gas injection train for an onshore application. The compressor is driven by synchronous motor with variable speed thanks to a VFD (Variable Frequency Converter) via a speed increasing gear. Both low speed and high speed couplings are flexible. In order to minimize the CAPEX, the gas is handled through only one casing instead of the previously planned two casings. Thus the compressor consists of two sections with seven stages in an inline arrangement. Table 5. Operating and test conditions (Compressor B)
Five stages are equipped with thrust brakes. Figure 21 shows a cross-sectional drawing of the compressor. The entire skid train consisting of the compressor with the original job equipment as couplings, gear, motor, VFD, lube oil system and dry gas seal devices was subjected to a thermodynamic and a mechanical test in the authors’ company test facility. During the FLFD-test of the train, which was performed under the conditions listed in Table 5, the damping and frequency of the bending mode of the compressor was measured thanks to the use of an electromagnetic exciter attached to the non driven end of the shaft (not represented in Figure 21). This test, performed up to a discharge pressure of 451 bara (6,540 psi) demonstrated the good stability of the compressor. Figure 21. Cross sectional Drawing of Compressor B Figure 22 shows the compressor in the test stand. In order to reach a similar gas discharge density as on site, carbon dioxide was supplied during the FLFD-test to nitrogen in the loop in order to obtain a gas composition of 30 percent carbon dioxide and 70 percent nitrogen. The axial forces were measured with the similar device as used for Compressor A. Figure 22. Photo of Compressor B in the test facility The axial thrust was measured along the performance curve for a fixed suction pressure of 74 bar (1,075 psi). As the flow control of this compressor is provided through variable speed
-25
-20
-15
-10
-5
0
5
10
15
20
0 50 100 150 200 250 300 350 400
Res
ultin
g Th
rust
(kN
)
Pressure Difference (bar)
Cartridge 1
Suction Pres.106 bara202 bara285 bara
Measured Calculated
-25
-20
-15
-10
-5
0
5
10
15
20
0 50 100 150 200 250 300 350 400
Res
ultin
g Th
rust
(kN
)
Pressure Difference (bar)
Cartridge 2
Suction Pres.200 bara245 bara285 bara
Measured Calculated
Section 1 Section 2 Section 1 Section 2
Suction pressure bara (Psia) 82 (1,185) 180 (2,610) 74 (1,075) 185 (2,685)
Discharge pressure bara (Psia) 181 (2,630) 415 (6,020) 195 (2,830) 446 (6,470)
Average Gas density kg/m3 159 327 159 306
Discharge Gas density kg/m3 196 353 196 342
Rotor speed rpm
g/mol
13,377 (105%)CO2 + N2
28.0 32.8
Operating conditions
Gas
Feature Unit Design Test
CnHm + H2S + CO2
12,387 (97%)
12 Copyright© 2016 by Turbomachinery Laboratory, Texas A&M Engineering Experiment Station

the thrust was measured accordingly at the minimum (70%) and maximum speed (105%). Two intermediate speeds were also considered (82% and 93%). Figure 23 shows the measured operating points. Due to the particular configuration of the compressor with two sections, the thrust was also measured for different operating points, considering an independent operation of both sections with two separated AS loops: based on the operation at the stability limit for 105% running speed (referred as S on Figure 23), the flow at section 2 was increased until choke (point SC). The similar procedure was conducted at the choke limit of the compressor: based on an overall choke limit (point C), section 2 was throttled up to its stability limit (CS). Hence both sections were considered independently from each other. This procedure was repeated at 70% running speed. Figure 23. Measured performance curves (Compressor B) The results are represented in Figure 24 in dependence of the sum of the pressure differences of both sections. The thrust was calculated with consideration of the specified nominal seal clearances. It can clearly be seen that the thrust is calculated with a good accuracy for all four rotating speeds. It turns out that the increase of the thrust is particularly large in the range of the stability limit (point S in the figure), where the thrust is well predicted even though somewhat underestimated. One of the most remarkable results is that both operating points (“SC” and “CS”) are within the 105% speed - line. It demonstrates that the thrust is primarily a function of the pressure difference in the compressor. It has to be added that an update of the calculation with the actual, realized seal clearances shows an even better match with the measurements.
Figure 24. Measured and calculated thrusts (Compressor B) REQUIREMENTS, SPECIFICATIONS In order to ensure the reliability of the compressors some specifications were developed taking into account the experiences of the OEMs and operators. Usually, the thrust bearing is designed according to the API specification (2002) and usually consists of tilting pads (steel) with a white metal bearing surface. Especially the API norm states that the “hydrodynamic thrust bearings shall be selected at no more than 50% of the bearing manufacturer’s ultimate load rating”. Moreover, the calculation of the thrust shall also consider twice the seal clearances. Based on the API norm some strengthened criteria were developed. These criteria are summarized below: • The specification of company A (“SpecA”) requires a
maximum bearing load of 1.7 N/mm2 (250 psi). Furthermore, no thrust reversal is allowed at any load condition.
• The specification of company B (“SpecB”) could be interpreted as even more conservative as it limits the maximum load to 7 bar (100 psi), however at design clearances and rated conditions. Moreover the bearing metal temperature shall not exceed 90°C (194 °F).
• According to the “NORSOK standard”, the thrust bearings shall be loaded with less than 33% of its rating for compressors with discharge pressures higher than 200 barg (2,901 psi).
Consequences on consumptions In order to evaluate the consequence of these specifications on the design of the compressor, four typical compressors of the author’s company are investigated representing different pressure levels of barrel compressors for oil & gas applications. The main characteristics of these compressors are listed in Table 6. The previously calculated resulting rotor thrust is applied on each compressor. Originally the thrust bearings were
1
3
5
7
0.4 0.8 1.2 1.6
Pres
sure
Rat
ion
PI
Suction Volume Flow normalized
105%93%82%70%
Rot. Speed
SCCS
S
C
-40
-30
-20
-10
0
10
20
30
0 50 100 150 200 250 300 350
Res
ultin
g Th
rust
(kN
)
Sum of Pressure Differences (bar)
CSSC
S
C
Rot. Speed105%93%82%70%
Measured Calculated
13 Copyright© 2016 by Turbomachinery Laboratory, Texas A&M Engineering Experiment Station
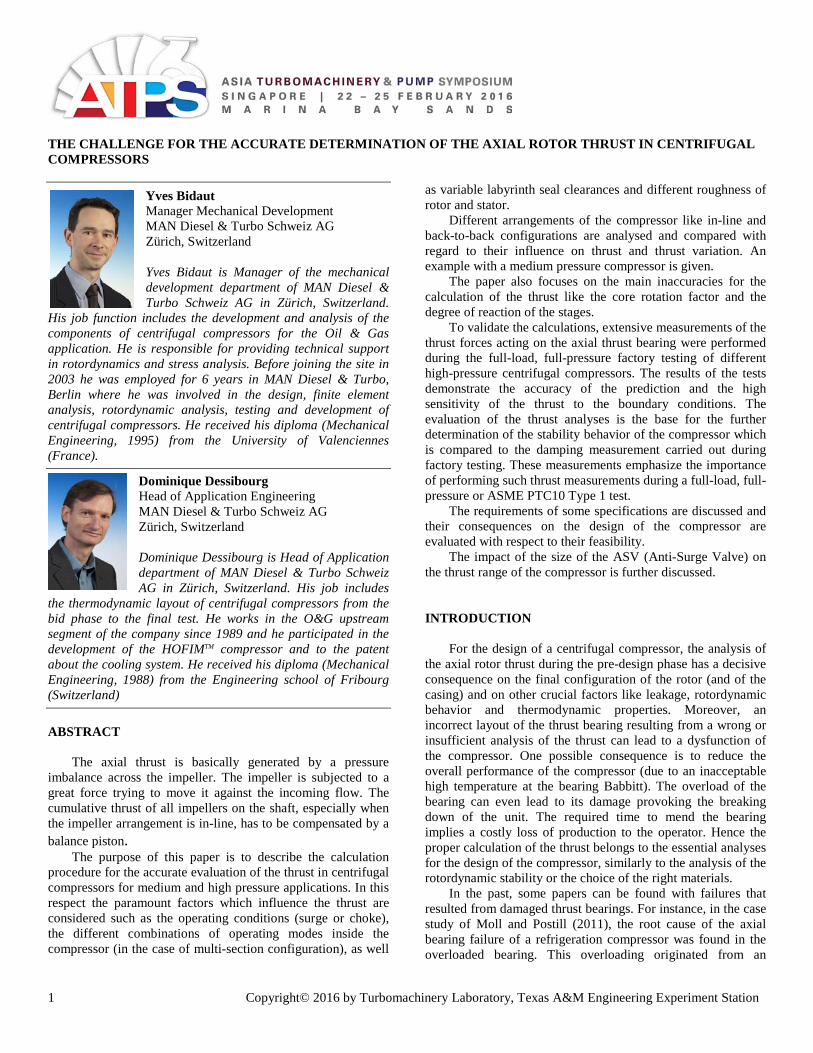
chosen in accordance with API (max. load below 50% of maximum capacity of bearing). To fulfill the strengthened criteria (SpecA, SpecB, NORSOK), a bigger thrust bearing might be required as discussed below. Table 6. Operating conditions of the selected compressors The increase of the sizing of the bearing is an issue regarding the space requirement inside the compressor which is not further discussed here. Figure 25 shows the power loss and the required oil flow of the thrust bearing in dependence of the load (above) and of the load ratio (actual load divided by the maximum load capacity), below. These values are normalized to the data of the original realized bearing (in conformity with API). Each curve represents the variation of the consumption with different bearing sizes.
Figure 25. Power Loss and Oil Flow for different axial thrust bearings
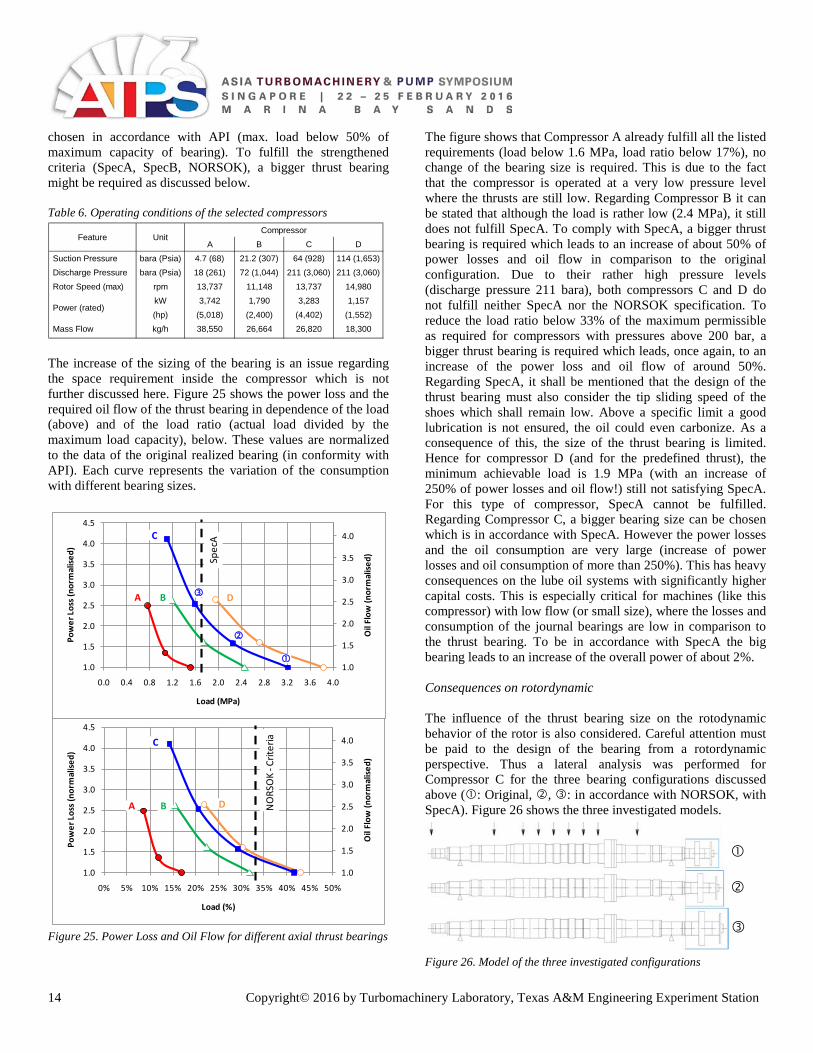
The figure shows that Compressor A already fulfill all the listed requirements (load below 1.6 MPa, load ratio below 17%), no change of the bearing size is required. This is due to the fact that the compressor is operated at a very low pressure level where the thrusts are still low. Regarding Compressor B it can be stated that although the load is rather low (2.4 MPa), it still does not fulfill SpecA. To comply with SpecA, a bigger thrust bearing is required which leads to an increase of about 50% of power losses and oil flow in comparison to the original configuration. Due to their rather high pressure levels (discharge pressure 211 bara), both compressors C and D do not fulfill neither SpecA nor the NORSOK specification. To reduce the load ratio below 33% of the maximum permissible as required for compressors with pressures above 200 bar, a bigger thrust bearing is required which leads, once again, to an increase of the power loss and oil flow of around 50%. Regarding SpecA, it shall be mentioned that the design of the thrust bearing must also consider the tip sliding speed of the shoes which shall remain low. Above a specific limit a good lubrication is not ensured, the oil could even carbonize. As a consequence of this, the size of the thrust bearing is limited. Hence for compressor D (and for the predefined thrust), the minimum achievable load is 1.9 MPa (with an increase of 250% of power losses and oil flow!) still not satisfying SpecA. For this type of compressor, SpecA cannot be fulfilled. Regarding Compressor C, a bigger bearing size can be chosen which is in accordance with SpecA. However the power losses and the oil consumption are very large (increase of power losses and oil consumption of more than 250%). This has heavy consequences on the lube oil systems with significantly higher capital costs. This is especially critical for machines (like this compressor) with low flow (or small size), where the losses and consumption of the journal bearings are low in comparison to the thrust bearing. To be in accordance with SpecA the big bearing leads to an increase of the overall power of about 2%. Consequences on rotordynamic The influence of the thrust bearing size on the rotodynamic behavior of the rotor is also considered. Careful attention must be paid to the design of the bearing from a rotordynamic perspective. Thus a lateral analysis was performed for Compressor C for the three bearing configurations discussed above (: Original, , : in accordance with NORSOK, with SpecA). Figure 26 shows the three investigated models. Figure 26. Model of the three investigated configurations
1.0
1.5
2.0
2.5
3.0
3.5
4.0
1.0
1.5
2.0
2.5
3.0
3.5
4.0
4.5
0% 5% 10% 15% 20% 25% 30% 35% 40% 45% 50%
Oil
Flow
(nor
mal
ised)
Pow
er Lo
ss (n
orm
alise
d)
Load (%)
NO
RSO
K -C
riter
ia
A B D
C
1.0
1.5
2.0
2.5
3.0
3.5
4.0
1.0
1.5
2.0
2.5
3.0
3.5
4.0
4.5
0.0 0.4 0.8 1.2 1.6 2.0 2.4 2.8 3.2 3.6 4.0
Oil
Flow
(nor
mal
ised)
Pow
er Lo
ss (n
orm
alise
d)
Load (MPa)
Spec
A
A B D
C
A B C D
Suction Pressure bara (Psia) 4.7 (68) 21.2 (307) 64 (928) 114 (1,653)
Discharge Pressure bara (Psia) 18 (261) 72 (1,044) 211 (3,060) 211 (3,060)
Rotor Speed (max) rpm 13,737 11,148 13,737 14,980
kW 3,742 1,790 3,283 1,157
(hp) (5,018) (2,400) (4,402) (1,552)
Mass Flow kg/h 38,550 26,664 26,820 18,300
Feature UnitCompressor
Power (rated)
14 Copyright© 2016 by Turbomachinery Laboratory, Texas A&M Engineering Experiment Station

The results of the lateral analysis are shown in the combined speed map in Figure 27. For the purpose of a better understanding only the first bending and the overhang modes (related to the different thrust bearings) are represented.
Figure 27. Combined Speed Map for Compressor C with different thrust bearings It can clearly be seen that the first bending mode is not affected by the design of the thrust bearing. However the overhang mode and the associated critical speed are mainly influenced by the size of the bearing. Whereas the critical speed with the original configuration () is well above the operating speed range with a very comfortable margin, this separation margin dramatically decreases with configuration . However the corresponding critical speed is still outside the speed range, the API specification regarding the lateral analysis is fulfilled. The results of the lateral analyses for the configuration (which fulfills SpecA) show a further dramatic drop of the overhung critical speed into the speed range. Although this critical speed is critically damped, it is still within the operating speed range which is inconvenient (e.g. for the balancing of the rotor). This is the reason why, for this size of compressors (high rotational speed, low flow, high pressure), SpecA is fulfilled only with shortcomings regarding the power consumption and the rotordynamic. In contrary, these strengthened criteria can be applied for compressors with large size and low rotational speed (where the power losses and the oil lubrication are marginal in relation to the overall losses) or for low pressure level (as shown for compressor A). Although the specifications are not applicable for all compressors, the reasons and background for these criteria are important to be understood. There are two main reasons for the required large safety with respect to the estimated load on the thrust bearing:
• The poor accuracy of the calculations for the determination of the overall thrust
• The large fluctuation of the forces depending on the boundary conditions
Hence only an acceptable accuracy of the thrust calculation with a determination of all the possible factors influencing the single forces acting on the rotor can allow for an optimization of the axial bearing with respect to the size (which has to be kept as small as possible) and to the reliability (which has to be ensured along the life time of the machine). DISCUSSION On one hand, the capacity of the axial bearing shall be high enough to support any thrust variation during the life time of the machine. On the other hand, the size of the bearing is an issue regarding the losses and the rotordynamics. Thus in order to ensure the reliability of the axial bearing (enough capacity) while minimizing the power losses and rotordynamic shortcomings, the following rule is proposed:
• For compressors with an overall pressure difference lower than 80 bar (1,160 psi), the current API rule (maximum permitted axial load lower than 50% of axial bearing capacity) is applied for the design point only at different clearances (nominal and twice maximum clearance). Additionally, variable roughness shall also be considered.
• For compressors with pressure difference higher than 80 bar, a comprehensive calculation shall be applied with consideration of the entire performance map (including choke, stability limit), clearances, roughness, and their combinations. The API rule of 50% capacity is still recommended. However, if this criterion cannot be fulfilled, a measurement of the thrust during a FLFD (or Type 1) test shall be performed in order to verify the calculations. The maximum calculated thrust, corrected by the measurements, shall not exceed 67% of the bearing capacity.
0
5'000
10'000
15'000
20'000
25'000
30'000
35'000
40'000
1.E+07 1.E+08 1.E+09 1.E+10
Spee
d (r
pm)
Support stiffness (N/m)
Thrust Bearing "API" "NORSOK" "SpecA"
Operating Speed Range
1st bending mode
Overhang mode
15 Copyright© 2016 by Turbomachinery Laboratory, Texas A&M Engineering Experiment Station

CONCLUSION Although the determination of the thrust belongs to the standard calculations for the design of centrifugal compressors, this topic does not attract the same interest like the rotordynamic stability. This may be acceptable for low or middle pressure compressors. For high pressure compressors attention must be paid on the thrust with the same severity as on the stability. For very high pressure applications, it might even be impossible to comply with the stronger rules. For a proper determination of the thrust several parameters shall be considered as different operating conditions, roughness, clearances, etc… To ensure the accuracy of the calculation, comprehensive analyses (analytical and CFD) are required. To validate the calculation of the thrust (and to ensure the reliability of the machine), additional measurements should be performed during the FLFD (or Type 1) tests. The findings gained from these measurements support the development of compressors beyond 400 bar pressure difference while minimizing the thrust variation and hence reducing the size of the axial bearing. NOMENCLATURE AD/N = Area of Shroud / Hub Disk (m) D2 = Tip Diameter of Impeller (m) DDA = Impeller Eye Diameter (m) FD/N = Axial Force on Shroud / Hub Disk (N) FD/N, stat = Axial Force on Shroud / Hub Disk (static) (N) FD/N, kin = Axial Force on Shroud / Hub Disk (kin.) (N) FS1 = Static Force on eye (N) FS2 = Static Force on hub (N) FM = Momentum Force on eye (N) FK = Static Force on balance piston (N) RE = Degree of Reaction of stage (-) C(r) = Core Rotation Factor (-) cu = Circumferential Speed (m/s) cm = Radial Speed (m/s) p0 = Suction Pressure (total) (bar) p3 = Discharge Pressure (static) of Impeller (bar) p4 = Pressure (static) at seal inlet (shroud) (bar) p5 = Pressure (static) at seal inlet (hub) (bar) p6 = Discharge Pressure (total) of Stage (bar) pD/N = Pressure distribution along Disk (bar) pD = Discharge Pressure of Compressor (bar) pS = Suction Pressure of Compressor (bar) r2 = Tip Radius of Impeller (m) rD/N = Radius of Labyrinth (Shroud / Hub) (m) s = Axial gap in side room (m) ρ = Gas Density at Impeller Tip (kg/m3) ω = Angular velocity of impeller (rad/s) τw,r = Shear Stress Wall (radial) (bar) τd,r = Shear Stress Disk (radial) (bar)
REFERENCES API 617, 2002, “Axial and Centrifugal Compressors and
Expander-compressors for Petroleum, Chemical and Gas Industry Services”, Seventh Edition, American Petroleum Institute, Washington, D.C.
Baumann, U., 1999, “Rotordynamic Stability Tests on High-
Pressure Radial Compressors”, Proceedings of the Twenty-Eighth Turbomachinery Symposium, Turbomachinery Laboratory, Departement of Mechanical Engineering, Texas A&M University, College Station, Texas, USA
Bidaut, Y., Baumann, U., Al. Harthy, S. M., 2009,
“Rotordynamic Stability of a 9500 psi Reinjection Centrifugal Compressor Equipped with a Hole Pattern Seal – Measurement versus Prediction taking into account the Operational Boundary Conditions”, Proceedings of the Thirty-Eighth Turbomachinery Symposium, Turbomachinery Laboratory, Departement of Mechanical Engineering, Texas A&M University, College Station, Texas, USA
Casey, M. V., Dalbert, P., Schurter, E., 1990, “Radial
Compressor Stages for Low Flow Coefficients”, IMechE Fourth European Congress, Fluid Machinery for the Oil, Petromechanical and Related Industries, The Hague, The Netherlands.
Japikse, D., 1996, “Centrifugal Compressor, Design and
Performance”, Concepts ETI, Inc., Wilder, Vermont, USA Kleynhans, G., Pfrehm, G., Berger, H., Baudelocque, L., 2005,
“Hermetically Sealed Oil-Free Turbocompressor Technology”, Proceedings of the Thirty-Fourth Turbomachinery Symposium, Turbomachinery Laboratory, Departement of Mechanical Engineering, Texas A&M University, College Station, Texas, USA
Kurz, R., Marechale, R.K., Fowler, E.J., Ji, M., Cave, M.J.,
2011, “Operation of Centrifugal Compressors in Choke Conditions”, Proceedings of the Fortieth Turbomachinery Symposium, Turbomachinery Laboratory, Departement of Mechanical Engineering, Texas A&M University, College Station, Texas, USA
Lempart, A., 1992, “Das Axialschubverhalten von industriellen
Turboverdichtern”, VDI Berichte NR. 947, pp 177-194, Düsseldorf, Germany
Lüdtke, K. H., 2004, “Process Centrifugal Compressors,
Basics, Function, Operation, Design, Application”, Springer-Verlag, Berlin, Germany
16 Copyright© 2016 by Turbomachinery Laboratory, Texas A&M Engineering Experiment Station
Moll, M.D., Postill, J., 2011, “Correction of Chronic Thrust
Bearing Failures on a Refrigeration Compressor”, Case Study, Proceedings of the Fortieth Turbomachinery Symposium, Turbomachinery Laboratory, Departement of Mechanical Engineering, Texas A&M University, College Station, Texas, USA
NORSOK Standard, 1997, “Mechanical Equipment”, R-001,
Rev.3, Standards Norway Petry, N., König, S., Benra, F.-K., 2012, “Influence of the
Swirling Flow in the Side Cavities of a High-Pressure Centrifugal Compressor on the Characteristics of Excited Acoustic Modes”, Proceedings of GT2012 Symposium, ASME Turbo Expo 2012, Copenhagen, Denmark
Skaare, S.H., Hancock, W.P., Egeland, B.K., Fosse, H., 2010,
“Centrifugal Compressor Modification mitigating the Effect of Increased Thrust Due to Fouling and Leakages”, Eleventh European Fluid Machinery Congress, Edinburgh, Scotland, UK
Wada, N., Sinoshita, H., Horiba, J., 2003, “Advances
Technology of High Pressure Compressor For Gas Injection”, Proceedings of the Ninth International Compressor Symposium, St. Petersburg Institute of Technology, Russia.
17 Copyright© 2016 by Turbomachinery Laboratory, Texas A&M Engineering Experiment Station