The Centroidal Voronoi Tessellation (CVT): an Application...
29
The Centroidal Voronoi Tessellation (CVT): an Application to Optimal Placement of Resources Annie Kendzior Advisor: Dr. Hoa Nguyen Mathematics Department Trinity University May 2, 2013 The Centroidal Voronoi Tessellation (CVT): an Application to Optimal Placement of Resources
-
Upload
trankhuong -
Category
Documents
-
view
229 -
download
4
Transcript of The Centroidal Voronoi Tessellation (CVT): an Application...

The Centroidal Voronoi Tessellation (CVT): anApplication to Optimal Placement of Resources
Annie KendziorAdvisor: Dr. Hoa NguyenMathematics Department
Trinity University
May 2, 2013
The Centroidal Voronoi Tessellation (CVT): an Application to Optimal Placement of Resources
Outline
Motivation
Method: CVT
Lloyd’s Algorithm
Numerical Results
Conclusion
The Centroidal Voronoi Tessellation (CVT): an Application to Optimal Placement of Resources

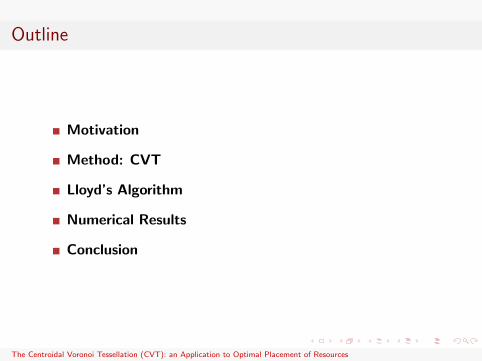
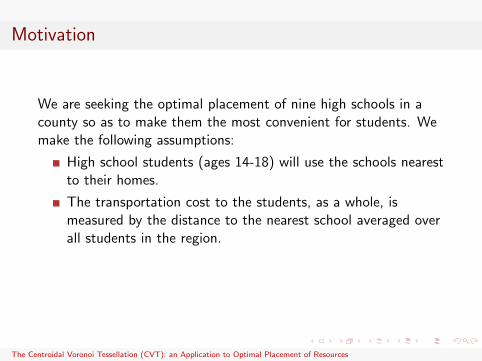
Motivation
We are seeking the optimal placement of nine high schools in acounty so as to make them the most convenient for students. Wemake the following assumptions:
High school students (ages 14-18) will use the schools nearestto their homes.
The transportation cost to the students, as a whole, ismeasured by the distance to the nearest school averaged overall students in the region.
The optimal placement of schools is defined to be the onethat minimizes the total transportation cost to the students.
The Centroidal Voronoi Tessellation (CVT): an Application to Optimal Placement of Resources

Motivation
This problem is an application of the centroidal Voronoitessellation (CVT) concept. It turns on that the optimal placementof the schools is at the centroids of a CVT of the city with respectto a given density function of the student population.
The Centroidal Voronoi Tessellation (CVT): an Application to Optimal Placement of Resources
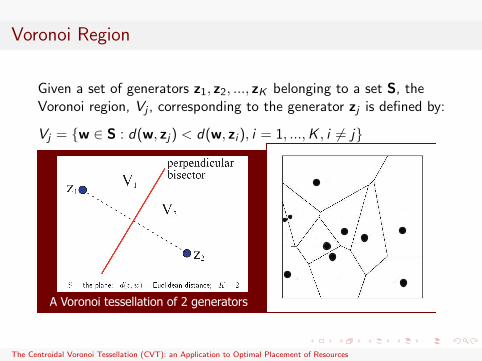
Voronoi Region
Given a set of generators z1, z2, ..., zK belonging to a set S, theVoronoi region, Vj , corresponding to the generator zj is defined by:
Vj = w ∈ S : d(w, zj) < d(w, zi ), i = 1, ...,K , i 6= j
VORONOI TESSELLATION ! Given a set of generators z1, z2, . . . , zK belonging to a
set S, the Voronoi region/subset Vj corresponding to the generator zj is defined by
A Voronoi tessellation of 2 generators
Georgi Voronoi
A Voronoi tessellation of 10 generators
distance function = Euclidean distance
VORONOI TESSELLATION ! Given a set of generators z1, z2, . . . , zK belonging to a
set S, the Voronoi region/subset Vj corresponding to the generator zj is defined by
A Voronoi tessellation of 2 generators
Georgi Voronoi
A Voronoi tessellation of 10 generators
distance function = Euclidean distance
The Centroidal Voronoi Tessellation (CVT): an Application to Optimal Placement of Resources

Voronoi Tessellation (VT)
Given an open set Ω ⊆ Rn, the set ViKi=1 is called a tessellation
of Ω if Vi ∩ Vj = 0 for i 6= j and⋃K
i=1Vi = Ω.
The set ViKi=1 is called a Voronoi tessellation or Voronoi diagramof Ω.
The Centroidal Voronoi Tessellation (CVT): an Application to Optimal Placement of Resources

VT vs. CVT
The Centroidal Voronoi Tessellation (CVT): an Application to Optimal Placement of Resources

Center of Mass/Centroid
Given a non-negative and almost everywhere continuous densityfunction ρ(x) defined on Ω and given any region V ⊂ Ω, we defineits centroid or center of mass by
z =
∫V xρ(x)dx∫V ρ(x)dx
In particular, for each Voronoi region Vi , i = 1, ...,K we can defineits centroid zi by
zi =
∫Vi
xρ(x)dx∫Viρ(x)dx
The Centroidal Voronoi Tessellation (CVT): an Application to Optimal Placement of Resources

Optimization Problem
CVT = solution of an optimization problem.
Energy/Cost Function Given K generators z1, z2, ..., zK andassociated V = V1,V2, ...,VK, and a density function ρ(x) onΩ ⊆ Rn, we define the energy/cost function:
F (zk ,VkKk=1) =∑K
k=1
∫Vkρ(x)|x− zk |2dx
The Centroidal Voronoi Tessellation (CVT): an Application to Optimal Placement of Resources

Proposition
Given an integer K > 1 and a non-negative and almost everywherecontinuous density function ρ(x) defined on Ω ⊆ Rn. Let ViKi=1
denote an arbitrary subdivision of Ω into K non-overlapping,covering subsets and let ziKi=1 denote an arbitrary set of Kpoints in Ω.
Then, a necessary condition for F (zi ,ViKi=1) to beminimized is that zi ,ViKi=1 define a centroidal Voronoitessellation of Ω.
We see that F (·) is a variance measure; we will refer to it as theCVT energy.
The Centroidal Voronoi Tessellation (CVT): an Application to Optimal Placement of Resources

Proof
Given F (zk ,VkKk=1) =∑K
k=1
∫Vkρ(x)|x− zk |2dx,
∂F
∂zim=
∫Vi
ρ(x)∂
∂zim|x− zi |2dx
=
∫Vi
ρ(x)2(xm − zim)(−1)dx
= −2
∫Vi
ρ(x)(xm − zim)dx
where i = 1, ...,K and m = 1, ..., n since Ω ⊆ Rn.
The Centroidal Voronoi Tessellation (CVT): an Application to Optimal Placement of Resources

Proof
Set ∂F∂zim
= 0 i.e.,
−2
∫Vi
ρ(x)(xm − zim)dx = 0∫Vi
ρ(x)xmdx =
∫Vi
ρ(x)zimdx
zim =
∫Viρ(x)xmdx∫
Viρ(x)dx
= z∗im
which is the m-th coordinate of the centroid of Vi .
The Centroidal Voronoi Tessellation (CVT): an Application to Optimal Placement of Resources

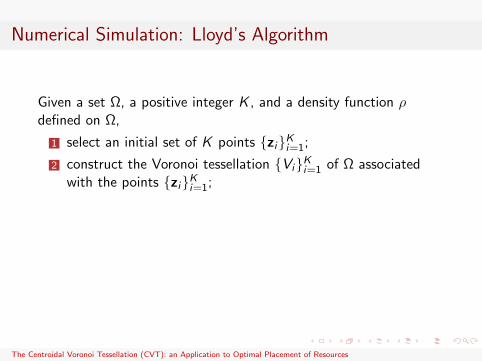
Numerical Simulation: Lloyd’s Algorithm
Given a set Ω, a positive integer K , and a density function ρdefined on Ω,
1 select an initial set of K points ziKi=1;
2 construct the Voronoi tessellation ViKi=1 of Ω associatedwith the points ziKi=1;
3 compute the mass centroids of the Voronoi regions ViKi=1
found in Step (2); these centroids are the new set of pointsziKi=1.
4 If this new set of points meets some convergence criterion,terminate; otherwise, return to Step (2).
The Centroidal Voronoi Tessellation (CVT): an Application to Optimal Placement of Resources

Lloyd’s Algorithm Steps
The Centroidal Voronoi Tessellation (CVT): an Application to Optimal Placement of Resources

Numerical Results
In our problem, we focused on nine individual high schools thatwere to be placed in a given county. The county has an areashaped like a unit square. The high schoolers in the county areevenly distributed throughout the area, giving this problem auniform density.
The Centroidal Voronoi Tessellation (CVT): an Application to Optimal Placement of Resources

CVT Result with Uniform Density
The Centroidal Voronoi Tessellation (CVT): an Application to Optimal Placement of Resources
Numerical Results
Now, a more realistic example that is similar to ours would be thatthe high schoolers are not evenly distributed, therefore there is nouniform density.
For example, students tend to live closer to the center of thecounty which is the center of the square. As a result, we want theschools to be closer to the center which means we must use thedensity function that has a higher value near the center and asmaller value near the boundary of the county.
ρ(x) = e10d(x,∂Ω)
where d(x, ∂Ω) is the distance from the point, x, to the closestboundary of the domain, Ω.
The Centroidal Voronoi Tessellation (CVT): an Application to Optimal Placement of Resources

CVT Result with Non-Uniform Density
The Centroidal Voronoi Tessellation (CVT): an Application to Optimal Placement of Resources

Comparison
Left: uniform CVT; Right: non-uniform CVT
The Centroidal Voronoi Tessellation (CVT): an Application to Optimal Placement of Resources

Conclusion
From this optimal location of high schools we learned that CVTcan be used for different optimization problems. Depending on aspecified density function, CVT results can reflect the underlyingdistribution over a given domain.
We can also generalize CVT to solve the locational-optimizationproblems of line-like and area-like generators (Okabe).
The Centroidal Voronoi Tessellation (CVT): an Application to Optimal Placement of Resources

Line-like Generators
Use line generators instead of point generators to account for thesize of the school. See the following figure (Okabe).
The Centroidal Voronoi Tessellation (CVT): an Application to Optimal Placement of Resources
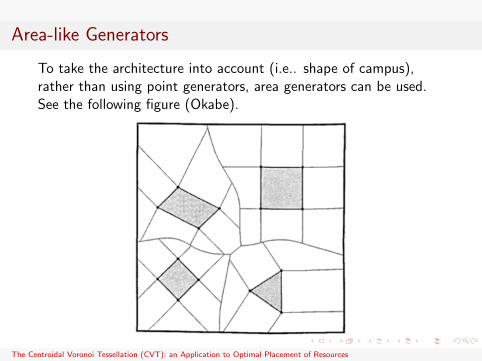
Area-like Generators
To take the architecture into account (i.e.. shape of campus),rather than using point generators, area generators can be used.See the following figure (Okabe).
The Centroidal Voronoi Tessellation (CVT): an Application to Optimal Placement of Resources

Acknowledgements
I would like to thank Dr. Nguyen for her assistance andparticipation in this project. It would not have been possiblewithout her guidance.
The Centroidal Voronoi Tessellation (CVT): an Application to Optimal Placement of Resources
References
H. Nguyen, J. Burkardt, M. Gunzburger, L. Ju, and Y. Saka.“Constrained CVT meshes and a comparison of triangularmesh generators,” Computational Geometry: Theory andApplications, Vol. 42, pp. 1-19, 2009.
Q. Du, V. Faber, and M. Gunzburger. “Centroidal Voronoitessellations: Applications and algorithms,” SIAM Rev. 41, pp637-676, 1999.
A. Okabe. “Locational Optimization Problems SolvedThrough Voronoi Diagrams,” European Journal ofOperational Research, Vol. 98, pp. 445-456, 1997.
The Centroidal Voronoi Tessellation (CVT): an Application to Optimal Placement of Resources