The cement CO2 protocol: CO2 Emissions Monitoring and ... · WBCSD Working Group Cement The Cement...
38
WBCSD Working Group Cement The Cement CO 2 Protocol: CO 2 Emissions Monitoring and Reporting Protocol for the Cement Industry Guide to the Protocol, Version 1.6 October 19, 2001 Authors: Bruno Vanderborght, Holcim Group Support (Brussels) SA Urs Brodmann, Factor Consulting + Management AG, Zurich
Transcript of The cement CO2 protocol: CO2 Emissions Monitoring and ... · WBCSD Working Group Cement The Cement...
WBCSD Working Group Cement
The Cement CO2 Protocol:
CO2 Emissions Monitoring and Reporting Protocol for the Cement Industry
Guide to the Protocol, Version 1.6
October 19, 2001
Authors:
Bruno Vanderborght, Holcim Group Support (Brussels) SA Urs Brodmann, Factor Consulting + Management AG, Zurich

Contents
1 Introduction..................................................................................................................... 1 1.1 Background and Objectives ................................................................................... 1 1.2 Outline of Related Initiatives................................................................................... 1
2 Criteria for the CO2 Protocol.......................................................................................... 5 3 Direct CO2 Emissions from Cement Manufacturing.................................................... 6
3.1 Overview ................................................................................................................ 6 3.2 CO2 from Raw Material Calcination........................................................................ 7 3.3 CO2 from Conventional Fossil Fuels ...................................................................... 8 3.4 CO2 from Alternative Fuels (Fossil and Biomass Wastes) ..................................... 8 3.5 CO2 from Non-Kiln Fuels ........................................................................................ 9
4 Other Greenhouse Gas Emissions ............................................................................. 11 4.1 Indirect CO2 Emissions......................................................................................... 11 4.2 Non-CO2 Greenhouse Gases............................................................................... 12
5 Indirect Greenhouse Gas Savings .............................................................................. 12 5.1 Indirect Greenhouse Gas Savings Through Alternative Fuels ............................. 12 5.2 Other Indirect Greenhouse Gas Savings ............................................................. 13
6 Performance Indicators ............................................................................................... 14 6.1 Introduction........................................................................................................... 14 6.2 Denominator for Specific, Unit-Based Emissions................................................. 15 6.3 Denominator for Other Ratio Indicators................................................................ 16 6.4 Dealing with Stock Changes ................................................................................ 17
7 Accounting Issues........................................................................................................ 17 7.1 Which Installations Should Be Covered? ............................................................. 17 7.2 Consolidating Emissions ...................................................................................... 18 7.3 Baselines, Acquisitions and Divestitures.............................................................. 19
8 Recommendations for Reporting................................................................................ 19 8.1 Reporting for Different Purposes.......................................................................... 19 8.2 Reporting Periods................................................................................................. 21 8.3 Scopes of WRI / WBCSD GHG Protocol.............................................................. 21
9 Further Information ...................................................................................................... 22 10 References .................................................................................................................... 23 11 Acronyms and Glossary .............................................................................................. 24 A1 Cement CO2 Protocol: Structure and Instructions A2 Default CO2 Emission Factors for Grid Electricity A3 Greenhouse Gas Sources and Abatement Options in Cement Production A4 Details on Calcination CO2 A5 Numeric Prefixes, Units and Conversion Factors

1
1 Introduction
1.1 Background and Objectives
Under the umbrella of the Working Group Cement of the World Business Council for Sus-tainable Development (WGC-WBCSD), ten cement companies have developed and agreed upon a methodology for monitoring and reporting CO2 emissions from cement manufacturing: the Cement CO2 Protocol. The protocol aims at harmonizing the methodologies for calculat-ing the CO2 emissions from cement production, with a view to reporting of CO2 emissions for various purposes.
The protocol is intended as a tool for cement companies worldwide. It allows the monitoring and reporting of all direct and indirect CO2 emissions from the cement manufacturing process in an absolute (tonnes of CO2 per year) and a specific, unit-based (kg CO2 per tonne of product) way. It consists of two blocks:
• A „company“ block, which collects all the essential production data as well as all the nec-essary calculations and key performance indicators. This information can be subject to auditing but is not for public disclosure.
• A „public“ block which reports the production and emission data for public communication to all concerned or interested stakeholders.
The protocol is a spreadsheet in MS Excel. An overview of the spreadsheet structure is pro-vided in Appendix 1.
The purpose of this Guide is to explain the protocol’s structure and rationale, and provide calculation and reporting instructions. In order to make this Guide comprehensible to stake-holders from outside the cement sector, some background information on the cement pro-duction process is included in Appendix 3. Please note that the protocol uses metric tonnes, where 1 tonne = 1000 kg. For other abbreviations of units and numeric prefixes, see Appen-dix 5.
1.2 Outline of Related Initiatives
This section gives a brief outline of selected initiatives for greenhouse gas (GHG) emission reporting, both on the national and the corporate levels. The list is not comprehensive, but it includes those initiatives which are considered of prime importance in the future coordination process. Key implications for the Cement CO2 Protocol are summarized.
1.2.1 IPCC Guidelines for National GHG Inventories under the UNFCCC
The Parties to the UNFCCC are required to establish and regularly update national GHG inventories which will, among other purposes, be used to assess Annex 1 Parties’ compli-

2
ance with their emission limitation or reduction commitments under the Kyoto Protocol. The Intergovernmental Panel on Climate Change (IPCC) has issued guidelines for the national inventories.1 These guidelines are intended to report emissions from countries and are to a large extent based on national energy statistics and aggregated production data, using spe-cific emission factors per unit fuel- or energy consumption or per unit production of goods.
National inventories and the IPCC guidelines are not explicitly designed to monitor and report the emissions of legal entities. Rather, IPCC encourages legal entities to develop appropriate methodologies for companies and corporations. The development of the WGC methodology should also be seen in this light.
Compatibility with the IPCC guidelines is a prime objective of this protocol. This should result, for instance, in the possibility to use inventory data from the cement sector as a straightfor-ward and transparent data source for national inventories. Generally speaking, changes in emissions in the cement industry inventory should result in corresponding changes in the national inventory. IPCC recommendations relevant for the cement industry are referred to throughout this document.
1.2.2 WRI / WBCSD Initiative for Corporate Greenhouse Gas Reporting
The Greenhouse Gas Protocol initiative2 was developed by the World Resources Institute (WRI) and World Business Council for Sustainable Development (WBCSD) to build and pro-mote the use of voluntary international accounting and reporting standards for businesses, through an open, transparent, and inclusive process. The initiative comprises three separate but linked modules: core inventory, reporting project-based reductions, and accounting for GHGs in the value chain.
The second and third modules are currently work in progress. The first version of the Core Inventory Module was published in October 2001. Its standards, guidance and tools will help companies and other organisations to:
• develop a credible GHG inventory underpinned by GHG accounting and reporting princi-ples;
• account and report information from global operations in a way that presents a clear pic-ture of GHG impacts and facilitates understanding as well as comparison with similar re-ports;
1 Revised 1996 Guidelines for National Greenhouse Gas Inventories (see IPCC 1996), and Good Practice Guidance and
Uncertainty Management in National Greenhouse Gas Inventories (see IPCC 2000, http://www.ipcc-nggip.iges.or.jp). A number of European countries have so far based their national inventories on the somewhat older CORINAIR guidelines for inventories under the Convention on Long Range Transboundary Air Pollution. While considerable progress has been made in harmonizing the IPCC and CORINAIR approaches, there nevertheless remain some differences.
2 See http://www.ghgprotocol.org
3
• provide internal management with valuable information on which to build an effective strategy to manage and reduce GHG emissions;
• provide GHG information that complements other climate initiatives and reporting stan-dards, including financial standards.
WRI and WBCSD have adopted this Cement CO2 Protocol as a standard for the cement in-dustry under their GHG Protocol initiative. Conversely, the Cement Protocol has been aligned with the relevant recommendations of the WRI / WBCSD GHG Protocol, for instance with regard to organizational boundaries (see Chapter 7).
With regard to operational boundaries, the WRI / WBCSD GHG Protocol introduces the con-cept of emission scopes:
• Scope 1 accounts for direct GHG emissions from sources that are owned or controlled by the reporting company.
• Scope 2 accounts for indirect emissions associated with the generation of imported / purchased electricity, heat, or steam.
• Scope 3 allows for the treatment of other indirect emissions that are a consequence of the activities of the reporting company, but occur from sources owned or controlled by another entity (e.g., employee business travel and commuting, and outsorced activities).
The relation between the WRI / WBCSD scopes and the recommendations of the Cement Protocol are summarized in Section 8.3 below.
1.2.3 Australian Greenhouse Energy Management System
In January 1997, the Australian Cement Industry Federation entered into a cooperative agreement under the Commonwealth's Greenhouse Gas Challenge program. The agreement commits Australian cement producers to pursue cost-effective („no regrets“) measures for abating GHG emissions. Following this agreement, guidelines for a Greenhouse Energy Management System were developed (GEMS).3 The guidelines cover all steps required to comply with the cooperative agreement, ranging from the selection of the relevant sites over inventories to the development and implementation of action plans.
1.2.4 Climate Wise Initiative (US / Canada)
The Climate Wise initiative was launched by the U.S. Administration in 1994 in response to President Clinton's „Climate Action Plan“. Climate Wise is a voluntary partnership program
3 see CIF 1998
4
designed to assist businesses in turning energy efficiency and environmental performance into a corporate asset. In particular, Climate Wise encourages U.S. industry to take advan-tage of the environmental and economic benefits associated with energy efficiency improve-ments and GHG emissions reductions. An important component is the voluntary reporting of GHG emissions using a standardized form.4
The American Portland Cement Association (APCA) participates in the Climate Wise initia-tive. An Excel spreadsheet was developed to help companies develop action plans and re-port on their efforts.
4 Form EIA-1605; EIA = U.S. Department of Energy's Energy Information Administration
5
2 Criteria for the CO2 Protocol
The protocol was designed to meet a number of criteria:
1. be consistent, transparent, and credible;
2. cover all relevant emission sources;
3. be applicable at different levels (plant, company, group, industry);
4. avoid double-counting (or failure to count) at plant, company, group, national, and inter-national levels;
5. allow to distinguish between different drivers of emissions (technological improvement, internal and external growth);
6. be compatible with IPCC guidelines;
7. allow to report emissions in absolute as well as specific (unit-based) terms;
8. allow to report the full range of CO2 abatements achieved;
9. include performance indicators which do not distort the markets for cement and cementi-tious products, nor endanger fair trading;
10. provide a flexible tool suiting the needs of different monitoring and reporting purposes, such as: internal management of environmental performance, public corporate environ-mental reporting, reporting under CO2 taxation schemes, reporting under CO2 compliance schemes (voluntary or negotiated agreements, emissions trading), industry benchmark-ing, and product life-cycle analysis.
KPMG has undertaken an independent review of the Cement Protocol and found that it meets the above criteria (see validation report, KPMG 2001).

6
3 Direct CO2 Emissions from Cement Manufacturing
3.1 Overview
Direct GHG emissions are emissions from sources that are owned or controlled by the re-porting entity. In cement plants, direct CO2 emissions result from the following sources:
• calcination of limestone in the raw materials • conventional fossil kiln fuels • alternative fossil-based kiln fuels (= fossil AFR, fossil wastes) • biomass kiln fuels (biomass wastes) • non-kiln fuels
Emission factors, formulas and reporting approaches for these sources are described below. Table 1 summarizes the parameters involved, and the proposed data sources. Generally, companies are encouraged to measure the required parameters at plant level. Where plant- or company-specific data is not available, the recommended, international default factors should be used. Other default factors (e.g., national) may be preferred to the international defaults if deemed reliable and more appropriate.
Emission components Parameters Units Proposed data source
CO2 from raw materials calcination
• from clinker produced clinker produced CaO + MgO in clinker CaO + MgO in raw mix
t cli % %
measured at plant level measured at plant level measured at plant level
• from dust landfilled dust landfilled emission factor clinker dust calcination degree
t dust t CO2/ t cli % calcined
measured at plant level as calculated above measured at plant level
CO2 from fuel combustion
• conventional kiln fuels
fuel consumption net calorific value emission factor
t fuel GJ /t fuel t CO2 /GJ fuel
measured at plant level measured at plant level measured or IPCC defaults
• fossil waste fuels (AFR) (gross emissions)
fuel consumption net calorific value emission factor
t fuel GJ /t fuel t CO2 /GJ fuel
measured at plant level measured at plant level measured or estimated defaults
• biomass waste fuels (AFR) fuel consumption net calorific value emission factor
t fuel GJ /t fuel t CO2 /GJ fuel
measured at plant level measured at plant level measured or estimated defaults
• non-kiln fuels
fuel consumption net calorific value emission factor
t fuel GJ /t fuel t CO2 /GJ fuel
measured at plant level measured or IPCC defaults measured or IPCC defaults
Table 1: Parameters and proposed data sources for calculation of direct CO2 emissions. See the Cement Protocol spreadsheet for default CO2 emission factors of fuels t = metric tonne AFR = Alternative fuels and raw materials cli = clinker
7
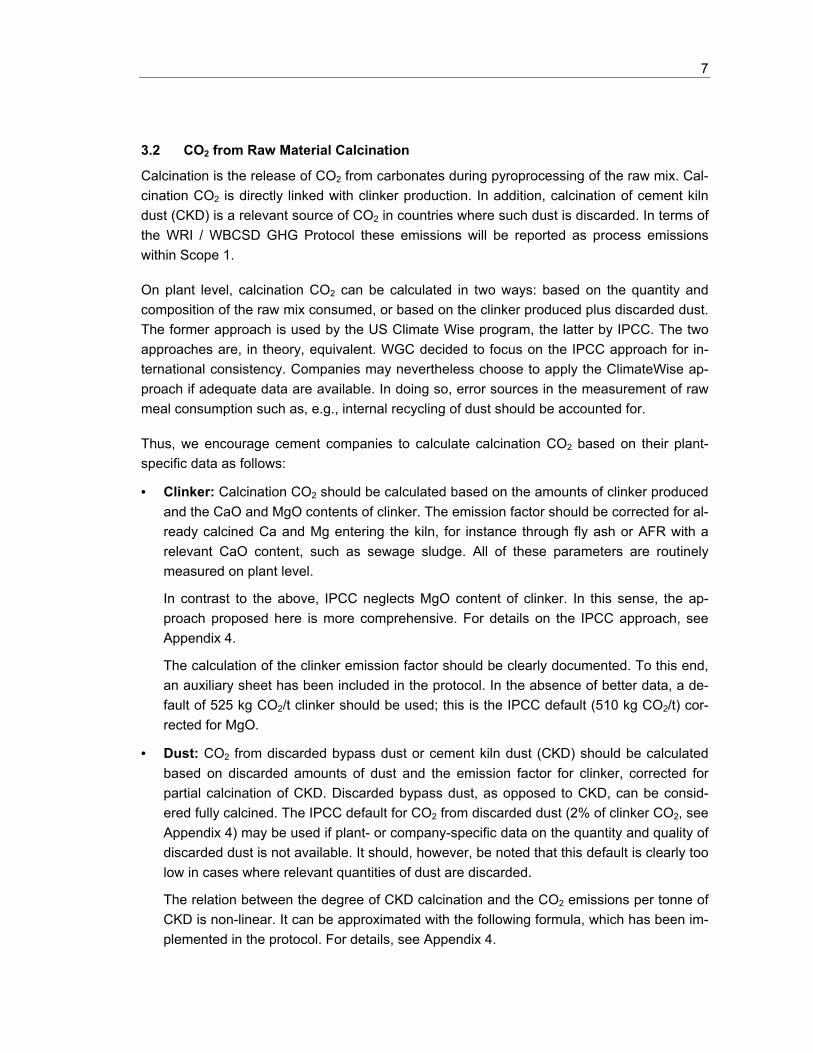
3.2 CO2 from Raw Material Calcination
Calcination is the release of CO2 from carbonates during pyroprocessing of the raw mix. Cal-cination CO2 is directly linked with clinker production. In addition, calcination of cement kiln dust (CKD) is a relevant source of CO2 in countries where such dust is discarded. In terms of the WRI / WBCSD GHG Protocol these emissions will be reported as process emissions within Scope 1.
On plant level, calcination CO2 can be calculated in two ways: based on the quantity and composition of the raw mix consumed, or based on the clinker produced plus discarded dust. The former approach is used by the US Climate Wise program, the latter by IPCC. The two approaches are, in theory, equivalent. WGC decided to focus on the IPCC approach for in-ternational consistency. Companies may nevertheless choose to apply the ClimateWise ap-proach if adequate data are available. In doing so, error sources in the measurement of raw meal consumption such as, e.g., internal recycling of dust should be accounted for.
Thus, we encourage cement companies to calculate calcination CO2 based on their plant-specific data as follows:
• Clinker: Calcination CO2 should be calculated based on the amounts of clinker produced and the CaO and MgO contents of clinker. The emission factor should be corrected for al-ready calcined Ca and Mg entering the kiln, for instance through fly ash or AFR with a relevant CaO content, such as sewage sludge. All of these parameters are routinely measured on plant level.
In contrast to the above, IPCC neglects MgO content of clinker. In this sense, the ap-proach proposed here is more comprehensive. For details on the IPCC approach, see Appendix 4.
The calculation of the clinker emission factor should be clearly documented. To this end, an auxiliary sheet has been included in the protocol. In the absence of better data, a de-fault of 525 kg CO2/t clinker should be used; this is the IPCC default (510 kg CO2/t) cor-rected for MgO.
• Dust: CO2 from discarded bypass dust or cement kiln dust (CKD) should be calculated based on discarded amounts of dust and the emission factor for clinker, corrected for partial calcination of CKD. Discarded bypass dust, as opposed to CKD, can be consid-ered fully calcined. The IPCC default for CO2 from discarded dust (2% of clinker CO2, see Appendix 4) may be used if plant- or company-specific data on the quantity and quality of discarded dust is not available. It should, however, be noted that this default is clearly too low in cases where relevant quantities of dust are discarded.
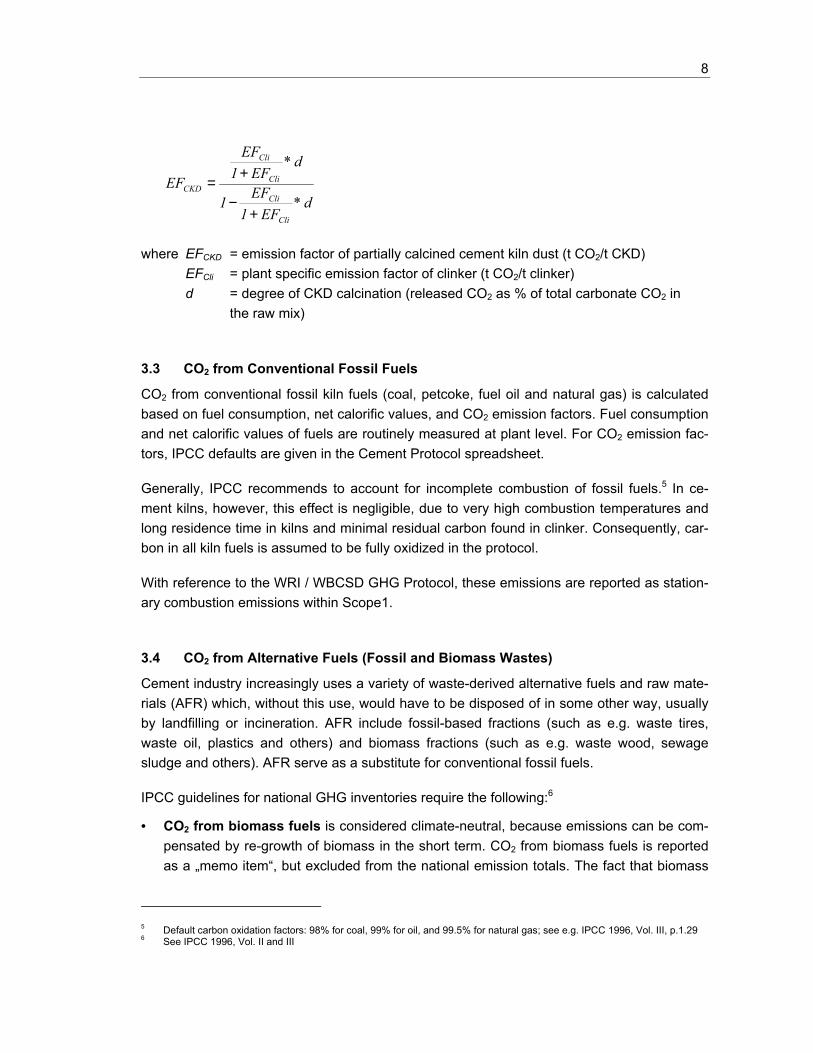
The relation between the degree of CKD calcination and the CO2 emissions per tonne of CKD is non-linear. It can be approximated with the following formula, which has been im-plemented in the protocol. For details, see Appendix 4.
8
d*
EF1EF1
d*EF1EF
EF
Cli
Cli
Cli
Cli
CKD
+−
+=
where EFCKD = emission factor of partially calcined cement kiln dust (t CO2/t CKD) EFCli = plant specific emission factor of clinker (t CO2/t clinker) d = degree of CKD calcination (released CO2 as % of total carbonate CO2 in the raw mix)
3.3 CO2 from Conventional Fossil Fuels
CO2 from conventional fossil kiln fuels (coal, petcoke, fuel oil and natural gas) is calculated based on fuel consumption, net calorific values, and CO2 emission factors. Fuel consumption and net calorific values of fuels are routinely measured at plant level. For CO2 emission fac-tors, IPCC defaults are given in the Cement Protocol spreadsheet.
Generally, IPCC recommends to account for incomplete combustion of fossil fuels.5 In ce-ment kilns, however, this effect is negligible, due to very high combustion temperatures and long residence time in kilns and minimal residual carbon found in clinker. Consequently, car-bon in all kiln fuels is assumed to be fully oxidized in the protocol.
With reference to the WRI / WBCSD GHG Protocol, these emissions are reported as station-ary combustion emissions within Scope1.
3.4 CO2 from Alternative Fuels (Fossil and Biomass Wastes)
Cement industry increasingly uses a variety of waste-derived alternative fuels and raw mate-rials (AFR) which, without this use, would have to be disposed of in some other way, usually by landfilling or incineration. AFR include fossil-based fractions (such as e.g. waste tires, waste oil, plastics and others) and biomass fractions (such as e.g. waste wood, sewage sludge and others). AFR serve as a substitute for conventional fossil fuels.
IPCC guidelines for national GHG inventories require the following:6
• CO2 from biomass fuels is considered climate-neutral, because emissions can be com-pensated by re-growth of biomass in the short term. CO2 from biomass fuels is reported as a „memo item“, but excluded from the national emission totals. The fact that biomass
5 Default carbon oxidation factors: 98% for coal, 99% for oil, and 99.5% for natural gas; see e.g. IPCC 1996, Vol. III, p.1.29 6 See IPCC 1996, Vol. II and III

9
is only really climate-neutral if sustainably harvested, is taken into account in the „Land use change and forestry“ sections of the national inventories, where CO2 emissions due to forest depletion are reported.
• CO2 from fossil fuel-derived wastes (fossil AFR), in contrast, is not a priori climate-neutral. According to IPCC guidelines, GHG emissions from industrial waste-to-energy conversion are reported in the „energy“ source category of national inventories, while GHG emissions from conventional waste disposal (landfilling, incineration) are reported in the „waste management” category.
To ensure consistency with IPCC guidelines and completeness of the inventory, there is thus a need to report direct CO2 emissions and indirect GHG savings resulting from AFR combus-tion in cement plants.
With this background, the protocol handles AFR as follows:
• Direct CO2 from combustion of biomass AFR is reported as a memo item (or supporting information, in WRI / WBCSD terminology), but excluded from emission totals. The IPCC default emission factor of 110 kg CO2/ GJ is used.
• Direct CO2 from combustion of fossil AFR is calculated and included in the total of direct CO2 emissions (gross emissions total). CO2 emission factors are a function of the na-ture of the AFR and should therefore be specified at plant level where possible. The pro-tocol provides a set of „best estimate” default factors which could be improved in the fu-ture (see Protocol spreadsheet). With reference to the WRI / WBCSD GHG Protocol, the gross emissions from waste are reported as stationary combustion emissions within Scope 1.
• Indirect GHG savings through utilization of AFR, and resulting net emissions from AFR, are accounted for in a separate step. This is further described in Section 5.1.
Some AFR, for instance impregnated saw dust, contain both fossil and biomass carbon. Ide-ally, a weighted emission factor should be calculated here, based on the share of the fossil impregnating substance in the fuel's overall carbon content. However, since this share varies considerably, companies are advised to use a conservative approach where carbon from impregnated saw dust is assumed to be of 100% fossil origin.
3.5 CO2 from Non-Kiln Fuels
3.5.1 Overview
Non-kiln fuels include, for instance, fuels for thermal process equipment (e.g. dryers), auto-production of power, plant and quarry vehicles, and room heating. Direct CO2 from non-kiln fuels is accounted for in the protocol as follows:
10
• CO2 from non-kiln fuels is reported separately, by application type, to provide flexibility in the aggregation of emissions. The protocol distinguishes the following applications: – equipment and on-site vehicles – room heating / cooling – raw material drying – on-site power generation
• CO2 from off-site transports by company-owned fleets is currently excluded from the pro-tocol (see details below).
• Carbon in non-kiln fuels is assumed to be fully oxidized, i.e. carbon storage in soot or ash is not accounted for. The resulting overestimation of emissions will usually be small (approx. 1%). This approach is in line with the WRI / WBCSD Stationary Fuel Combus-tion Tool.
3.5.2 CO2 from Transports
Like any other manufacturing process, cement production requires transports for the provi-sion of raw materials and fuels as well as for the distribution of products (clinker, cement, concrete). In some cases, clinker is transferred to another site for grinding. Transport modes include conveyer belts, rail, water, and road. Most transports are carried out by independent third parties, which makes associated emissions indirect, like the emissions due to electricity consumption.
The protocol covers energy consumption for internal (on-site) transports, such as quarry ve-hicles and conveyor belts. It also includes the associated CO2 emissions, which can be direct (fuel combustion) or indirect (power consumption of conveyor belts), while allowing them to be separated from kiln-fuel emission totals.
In contrast, CO2 emissions from off-site transports, e.g. of fuels and finished products, are at present excluded from the protocol, irrespective of whether the transports are carried out by third parties or by company-owned fleets. The reason is that these emissions are small com-pared to emissions from the kiln, and difficult to quantify in a consistent manner. If necessary, emissions of company fleets can nevertheless be included in the non-kiln fuel section of the inventory. Companies can use the WRI / WBCSD Mobile Combustion Tool to calculate their direct and indirect emissions from mobile sources.7
7 See http://www.ghgprotocol.org

11
4 Other Greenhouse Gas Emissions
4.1 Indirect CO2 Emissions
Indirect GHG emissions are emissions that are a consequence of the activities of the report-ing entity, but occur from sources owned or controlled by another entity. Cement production is associated with indirect emissions from various sources, for instance:
• external production of electricity consumed by cement producers;
• production of clinker bought from other producers and interground with own production;
• production and processing of conventional and alternative fuels;
• transport of inputs (raw materials, fuels) and outputs (cement, clinker) by third parties.
Data on indirect emissions can be useful to assess overall environmental performance of an industry. To this end, two categories of indirect emissions are included in the inventory: CO2 from external electricity production, and CO2 from production of clinker bought from other companies. The calculation approach is summarized in Table 2.
CO2 associated with clinker- or cement-substituting mineral components (MIC) is not consid-ered an indirect emission of the cement industry, because MIC are waste materials (by-products) as e.g. slag from steel production or fly ash from power generation. The CO2 emis-sion is associated with the intended product – steel and power – and not with the waste. The use of these wastes in the cement industry does not cause additional CO2 emissions in the steel or power production.
Emission components Parameters Units Source of parameters
CO2 from external power prod. (indirect emission)
power consumption emission factor
GWh t CO2 /GWh
measured at plant level supplier-specific value or country grid factor (see Appendix 2)
CO2 from clinker bought (indirect emission)
clinker bought emission factor
t cli t CO2 /cli
measured at plant level own emission factor used as proxy
Table 2: Parameters and data sources for calculation of indirect CO2 emissions
12
4.2 Non-CO2 Greenhouse Gases
Emissions of methane (CH4) and nitrous oxide (N2O) from cement kilns are relatively small due to the high combustion temperatures in cement kilns, and are negligible compared to the CO2 emissions.8 The other GHG covered by the Kyoto Protocol (PFC, HFC, SF6) are not relevant in the cement context.
Relevant emissions of CH4 and N2O may result from the stationary combustion of non-kiln fuels (e.g., dryers, on-site power generation). If these emissions are significant (e.g. with gas fired internal combustion engines), the emission level should be assessed for every specific case, using the WRI / WBCSD Stationary Fuel Combustion Tool. Please refer to the Station-ary Fuel Combustion Tool Guide for more detailed information.9
5 Indirect Greenhouse Gas Savings
5.1 Indirect Greenhouse Gas Savings Through Alternative Fuels
Waste can substitute conventional fossil fuels and minerals in cement production. The re-covered wastes become alternative fuels and raw materials (abbreviated: AFR). As a result, direct CO2 emissions from conventional fuels are reduced but direct CO2 emissions from wastes („waste-to-energy conversion”) occur. The direct CO2 emissions from waste combus-tion can be higher or lower than the displaced emission, depending on the emission factors of the fuels involved. Moreover, wastes can be of fossil or biomass origin.
In addition to those direct effects, utilization of AFR results in indirect GHG savings at land-fills and incineration plants where these wastes would otherwise be disposed. These savings can partly, fully or more than fully offset the direct CO2 emissions from waste combustion at the cement plant, depending on local conditions (type of waste, reference disposal path). Consequently, the IEA greenhouse gas R & D program (IEA 1998) recognizes that substitut-ing fossil fuels by AFR is an effective way to reduce global GHG emissions.
Therefore, the protocol defines the following indicators:
• Gross Emissions are the total direct CO2 emissions from a cement plant or company, including CO2 from fossil wastes (but excluding CO2 from biomass wastes, which is treated as a memo item);
8 For methane emissions from cement kilns, IPCC (1996, Table I-17) provides a default emission factor of approx. 1 g
CH4/GJ, which is not more than 0.01% of CO2-equivalent emissions per GJ fuel use in cement plants (Assumptions: direct CO2 from cement plants is 56 – 100 kg CO2/GJ from fuel combustion, plus 130 – 170 kg CO2/GJ from raw materials calci-nation, totalling 186 – 270 kg CO2/GJ. In comparison, 1 g CH4/GJ corresponds to 21 g CO2-equiv./GJ on a 100 years hori-zon). IPCC defaults for N2O emissions are currently not available.
9 See http://www.ghgprotocol.org

13
• Credits for Indirect GHG Savings reflect the GHG emission reductions achieved at waste disposal sites as a result of AFR utilization. The actual reductions will usually be difficult to determine with precision; hence the creditable savings will to some degree have to be agreed upon by convention, rather than based on „precise“ GHG impact as-sessments. It is anticipated that national or internationally agreed emission factors will be identified in the future and these should be used when available. Further guidance on ac-counting for reduction projects will be given by the WRI /WBCSD GHG Protocol, where a module on project based reductions is currently under preparation (The publication of this module is planned for December 2002).
• Net Emissions are the gross emissions minus the credits for indirect GHG savings.
Different policy measures from Annex 1 Parties concern net emissions. For example, energy from waste is exempt from the United Kingdom’s Climate Change Levy. Similarly, the Swiss CO2 law excludes CO2 from waste, and Germany, France and Belgium have signed volun-tary agreements with the industry excluding CO2 from waste from the reduction obligation. All these policy measures require reporting of net emissions.
As far as practicable, reported AFR credits should take into account local circumstances (e.g., national agreements, life cycle analyses of local AFR use, etc.). When reporting to third parties, supporting evidence for the credits should be provided and verified as appropriate. As a default, the protocol assumes credits for indirect savings to be equal to the direct CO2 emission from fossil AFR use.
The protocol recognizes that this approach is a simplification of the AFR issue. It is however, in the medium term, the least onerous and most practicable approach, where transparency is achieved through disclosure of gross and net emissions. International convention on a more precise treatment of AFR has yet to be reached.
5.2 Other Indirect Greenhouse Gas Savings
5.2.1 Heat and Power Exports
Some cement plants export heat and / or electric power to external consumers. In accor-dance with Scope 1 as defined by WRI / WBCSD, GHG emissions caused by these exports should be reported as direct emissions, and included in the gross and net emissions totals.
Moreover, WRI / WBCSD recommend to report these emissions also separately under Scope 2, which deals with emissions from energy imports and exports. For the sake of transpar-ency, emissions associated with imported and exported electricity, steam and heat should not be netted.
No explicit provisions for energy exports have been made in the Cement CO2 Protocol be-cause few cement plants actually export energy. However, companies who receive credits

14
for indirect GHG savings associated with their energy exports could include them under „Credits for Indirect GHG Savings”, in analogy to savings from AFR.
5.2.2 JI/CDM Projects
Joint Implementation (JI) and the Clean Development Mechanism (CDM) are instruments of the Kyoto Protocol for bilateral, project-based trading of GHG emissions. They allow compa-nies to receive credits for GHG emission reduction projects in Annex 1 countries (JI) or de-veloping countries (CDM). Such credits may, eventually, be accounted for in the same way as credits for AFR use, i.e. by subtraction from gross emissions. For the time being, the Ce-ment CO2 Protocol does not make explicit provision for JI/CDM. Companies are advised to follow the recommendations of the reductions project module of the WRI / WBCSD GHG Protocol (The publication of this module is planned for December 2002).
5.2.3 Recarbonization of Cement as a CO2 Sink
When poured concrete is curing, it reabsorbs some CO2 from the atmosphere. Reabsorption is however small compared to the emissions from cement production10 and is not under con-trol of the legal entity that reports emissions from cement manufacturing. More CO2 is ab-sorbed throughout the lifetime of the concrete product, but very slowly. Consequently, recar-bonization of cement is not included as a CO2 sink in the protocol.
6 Performance Indicators
6.1 Introduction
The Cement CO2 Protocol aims to provide a flexible basis for CO2 emissions monitoring and reporting. The calculation of individual emission components as described above is quite straightforward. The definition of emission totals and ratio indicators, in contrast, is highly dependent on the reporting context and purpose, such as e.g.: input to national inventories, CO2 compliance regimes and emissions trading, industry benchmarking, etc. System boundaries for such reporting depend largely on conventions, rather than on scientific argu-ments.
With this background, a section on performance indicators has been added to the protocol. The section contains a number of indicators which are deemed most useful in the light of the current business and policy environment and associated reporting requirements.
10 See IPCC 1996, Vol. III, p.2.5

15
Generally, the section on performance indicators is conceived as a flexible vessel where companies can introduce additional parameters according to their needs, for instance differ-ent emission (sub-)totals.
6.2 Denominator for Specific, Unit-Based Emissions
From a sustainable development and business point of view, the reporting of CO2 efficiency – the specific emission per unit of product – is at least as important as the reporting of absolute emissions. This raises the question how the numerator and denominator of the specific emissions should be defined. In particular, how should direct clinker sales and clinker substi-tutes be taken into account?
The WGC recommends to calculate specific emissions as follows:
• numerator: direct gross or net emissions from the legal entity under consideration (as defined in Chapter 3);
• denominator: all clinker produced by the legal entity for cement making or direct clinker sale, plus gypsum, limestone and all clinker substitutes consumed for blending, plus all cement substitutes produced. For this denominator, the term cementitious products or binders is used, as it is a sum of clinker and mineral components. The denominator ex-cludes clinker bought from third parties for the production of cement, as it is already in-cluded in the inventory of the third party.
direct CO2 emission from cement manufacturingSpecific CO2per ton of
cementitious product
+ +clinker
bought &consumed
gypsum, limestone & clinker substitutes
consumedfor blending
cementsubstitutesproduced
+
=
ownclinker
consumed
ownclinker
sold directly+
Figure 1: Definition of specific (= unit-based) CO2 emission. Bought clinker is excluded from the denominator.
This denominator is considered the most appropriate basis for monitoring emissions per-formance and calculating national cement industry benchmarks. It is important to note that the denominator excludes the following:
• bought clinker, used for cement production;
• granulated slag which is sold to and ground by another company;
• cement volumes which are traded without any processing.
The denominator is consequently not necessarily equal to total cement sales. It is in line with the criteria specified in Chapter 2:

16
• It fully rewards use of clinker and cement substitutes as a CO2 emission reduction option.
• Intergrinding of mineral components with clinker to make blended cements (i.e. clinker substitution) or using the mineral components as a binder (i.e. cement substitution) are equally rewarded; i.e. there is no bias against any type of cement.
• Bought clinker does not reduce specific emissions; i.e. there is no incentive to dislocate clinker production to less regulated countries, and there is no unfair distortion of the clinker market.
Alternative options which include bought clinker in the denominator of specific emissions do not meet the criteria listed in Chapter 2:
• If bought clinker were included in the denominator instead of the direct clinker sales, clinker markets would be distorted: Net sellers of clinker would be punished because their (apparent) specific emissions would increase, endangering their compliance with specific CO2 targets. On the other hand, targets could easily be met by increasing the share of bought clinker, without any real benefit for the global climate.
• Including both bought and sold clinker in the denominator is not a feasible option be-cause it results in double-counting between companies.
Alternative options which exclude clinker substitutes or cement substitutes from the denomi-nator do not demonstrate the CO2 efficiency improvement resulting from product substitution.
6.3 Denominator for Other Ratio Indicators
For selected ratio indicators which do not use CO2 in the numerator, it is appropriate to in-clude bought clinker, and exclude sold clinker, from the denominator. This applies for:
• specific power consumption per tonne of cementitious product, which should take into account grinding of bought clinker;
• the clinker / cement factor, which should describe the ratio between total clinker con-sumption and total cement production. The proposed clinker / cement factor is shown in Figure 2. It has also been implemented in the protocol spreadsheet.
clinker consumedclinker / cement
factor =
+ +clinker
bought &consumed
gypsum, limestone & clinker substitutes
consumedfor blending
cementsubstitutesproduced
+own
clinkerconsumed
ownclinker
sold directly+
Figure 2: Definition of clinker / cement factor. Sold clinker is excluded from the denomi-nator, bought clinker is included.

17
6.4 Dealing with Stock Changes
Direct CO2 resulting from clinker production should be reported for the year in which it is emitted. To avoid distortion, specific emissions in the protocol are based on clinker produc-tion, irrespective of whether the produced clinker is consumed, sold, or stored.
Other ratio indicators such as specific electricity consumption and clinker / cement factors, in contrast, should be based on actual amounts of clinker (plus gypsum and MIC) consumed. To this end, accounting for clinker stock changes has been introduced in the protocol.
7 Accounting Issues
The following recommendations are in line with recommendations of the WRI / WBCSD GHG Protocol, unless stated otherwise. For more detailed accounting rules, please refer to the WRI / WBCSD GHG Protocol.
7.1 Which Installations Should Be Covered?
CO2 emissions result not only from kiln operations, but also from up- and downstream proc-esses, particularly from quarry operations and (indirectly) cement grinding. These facilities may be located at considerable distance. In addition, quarries, kilns and grinding stations are sometimes operated by separate legal entities. How should this be accounted for in a legal entity’s inventory?
There is at present no uniform answer to this question. However, the following points may provide some guidance:
• Generally, the inventory should cover the main direct and indirect CO2 emissions associ-ated with cement production. The protocol addresses upstream- and downstream opera-tions (e.g., fuel and power consumption in quarries and grinding stations).
• Separate facility inventories may be established for individual facilities as appropriate, for instance if they are geographically separated or run by distinct operators.11 The resulting CO2 emission impacts will tend to cancel out when emissions are consolidated on com-pany or group level.
• It should be clearly stated when relevant CO2 sources are excluded from the inventory. To this end, a section describing inventory boundaries has been introduced in the proto-col.
11 This may be required, for instance, if installations are defined according to the European Union’s IPPC directive.
18
7.2 Consolidating Emissions
The WRI / WBCSD GHG Protocol provides guidance on consolidating emissions which can be summarized as follows:
• Companies are generally encouraged to consolidate and report GHG emissions in two distinct ways: (i) based on management control, and (ii) based on ownership, i.e. equity share.
• Depending on the circumstances, companies may however choose to report only their controlled emissions, and not their equity share of emissions.
• In defining control, companies should follow, as closely as possible, their existing rules for financial reporting.
As a guidance on the definition of control, WRI / WBCSD state the following: „Control is de-fined as the ability of a company to direct the operating policies of another entity/facility. Usually, if the company owns more than 50 percent of the voting interests, this implies con-trol. The holder of the operating license often exerts control, however, holding the operating license is not a sufficient criterion for being able to direct the operating policies of an en-tity/facility. In practice, the actual exercise of dominant influence itself is enough to satisfy the definition of control with requiring any formal power or ability through which it arises.”
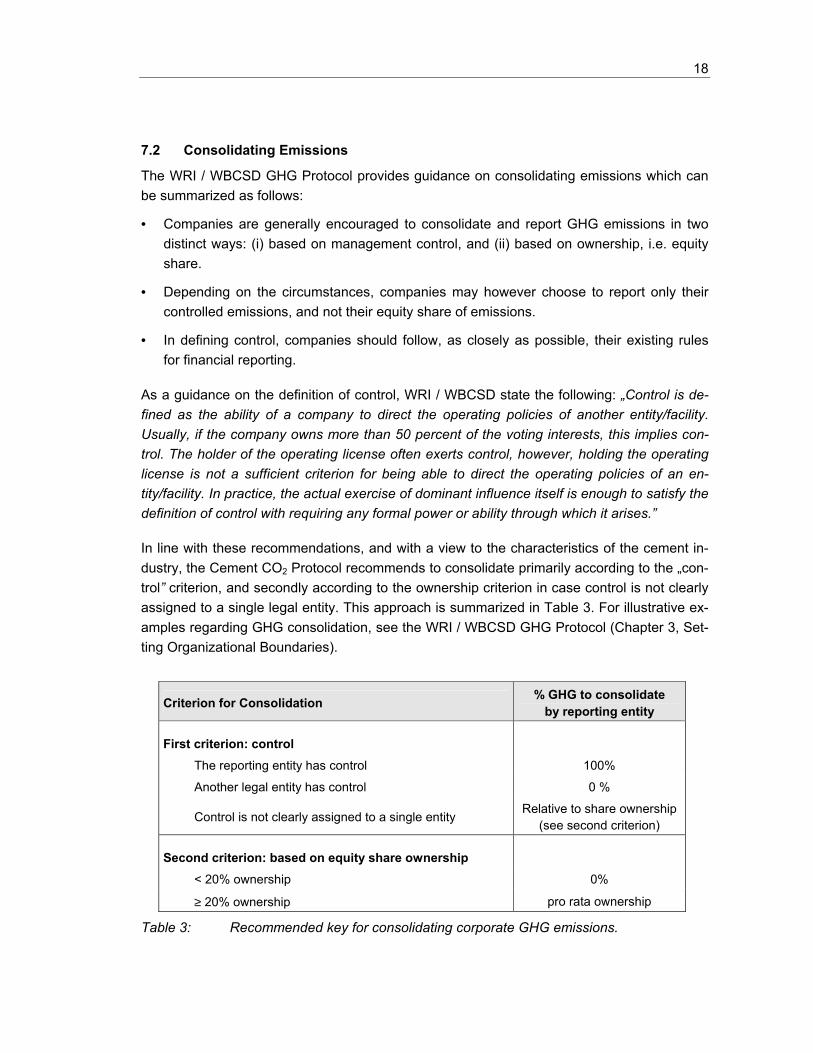
In line with these recommendations, and with a view to the characteristics of the cement in-dustry, the Cement CO2 Protocol recommends to consolidate primarily according to the „con-trol” criterion, and secondly according to the ownership criterion in case control is not clearly assigned to a single legal entity. This approach is summarized in Table 3. For illustrative ex-amples regarding GHG consolidation, see the WRI / WBCSD GHG Protocol (Chapter 3, Set-ting Organizational Boundaries).
Criterion for Consolidation % GHG to consolidate by reporting entity
First criterion: control
The reporting entity has control 100%
Another legal entity has control 0 %
Control is not clearly assigned to a single entity Relative to share ownership (see second criterion)
Second criterion: based on equity share ownership
< 20% ownership 0%
≥ 20% ownership pro rata ownership
Table 3: Recommended key for consolidating corporate GHG emissions.
19
7.3 Baselines, Acquisitions and Divestitures
CO2 emissions performance is often measured relative to a past reference year, or base year. As a default, the Kyoto base year 1990 can be used as a reference. In many cases however, the lack of reliable historical data justifies the use of a more recent reference year, especially when compliance or emissions trading is concerned. The choice of reference year will also depend on individual country regulations.
Acquisitions and divestitures, as well as opening or closing of plants, will influence a com-pany’s consolidated emissions performance, both in absolute and specific terms. To ensure consistency of baselines (= emissions in and after the reference year), WGC recommends to apply the following rules in a consistent way:
• Adjust the baseline12 for change by acquisition and divestiture: Consolidated emis-sions in past years should always reflect the current amount of shares held in a company. If a company is acquired, its past emissions, back to the reference year, should be in-cluded in the consolidated emissions of the reporting company. If a company is divested, past emissions should be removed from the consolidated emissions. These adjustments should be done in accordance with the consolidation rules (see Section 7.2).
• No baseline adjustment for „organic“ change: in case of organic growth of production, due to investment in new installations or improved capacity utilization, the baseline can-not be adjusted. In the same sense the baseline must not be adjusted for organic nega-tive growth: closure of kilns or decrease of production does not result in a change of the reference baseline.
For guidance regarding the choice of base year and baseline adjustment in accordance with these rules, see the WRI / WBCSD GHG Protocol.
8 Recommendations for Reporting
8.1 Reporting for Different Purposes
8.1.1 Background
CO2 emissions monitoring and reporting has multiple goals, such as e.g.: internal manage-ment of environmental performance, public environmental reporting, reporting for taxation schemes, voluntary or negotiated agreements, and emissions trading. Additional purposes are performance benchmarking and product life cycle assessment.
12 The WRI / WBCSD Protocol uses the term base year for the same purpose.

20
The Cement CO2 Protocol has been designed as a flexible tool to satisfy these different re-porting purposes, while always meeting the criteria described in Chapter 2. The information is structured in such a way that it can be aggregated and disaggregated according to differ-ent reporting scopes.
The aggregation of the information is normally governed by conventions, which can be uni-lateral in case of environmental reporting, or bilateral or multilateral in case of negotiated agreements, compliance and taxation regimes and emission trading regimes.
The following are generic recommendations for „best practice” reporting under different pur-poses, particularly with regard to CO2 emissions and indirect savings from alternative fuels. For more detailed reporting rules, including documentation and independent verification, see the WRI / WBCSD GHG Protocol.
8.1.2 Corporate Environmental Reporting
The objective of environmental reporting is to provide the reader with a fair picture of the en-vironmental footprint of the reporting entity. Hence, corporate environmental reporting should cover all relevant emission components:
• gross direct CO2 emissions of the reporting entity (calcination, conventional kiln fuels, alternative kiln fuels, non-kiln fuels, with biomass CO2 as a memo item);
• credits for indirect GHG savings, and resulting net emissions;
• main indirect emissions (off-site power generation, bought clinker).
Reporting should be in absolute (Mton CO2/year) as well as specific (kg CO2/ton cementi-tious material) units. Reporting of net emissions alone, omitting gross emissions, would not be acceptable.
8.1.3 Reporting to National GHG Inventories
Reporting to national GHG inventories should be compatible with IPCC guidelines. Hence, it should cover all direct CO2 emissions, including CO2 from fossil wastes. CO2 from biomass fuels should be reported as a memo item.
8.1.4 Reporting for Compliance and Taxation Schemes
CO2 compliance schemes (e.g., voluntary or negotiated agreements, emissions trading) and CO2 taxation schemes will have varying reporting requirements, depending on local conven-tions. The protocol provides a flexible basis for such reporting. In particular, it allows report-ing of gross emissions, net emissions and / or credits for indirect GHG savings through AFR, as appropriate.
21
8.2 Reporting Periods
Reporting GHG emissions based on financial years, rather than calendar years, can help to reduce reporting costs. From a GHG perspective, there is no problem to report based on financial years, provided that it is done consistently over time, with no gaps or overlaps. Changes in the reporting year should be clearly indicated. National regulations should be taken into account.
8.3 Scopes of WRI / WBCSD GHG Protocol
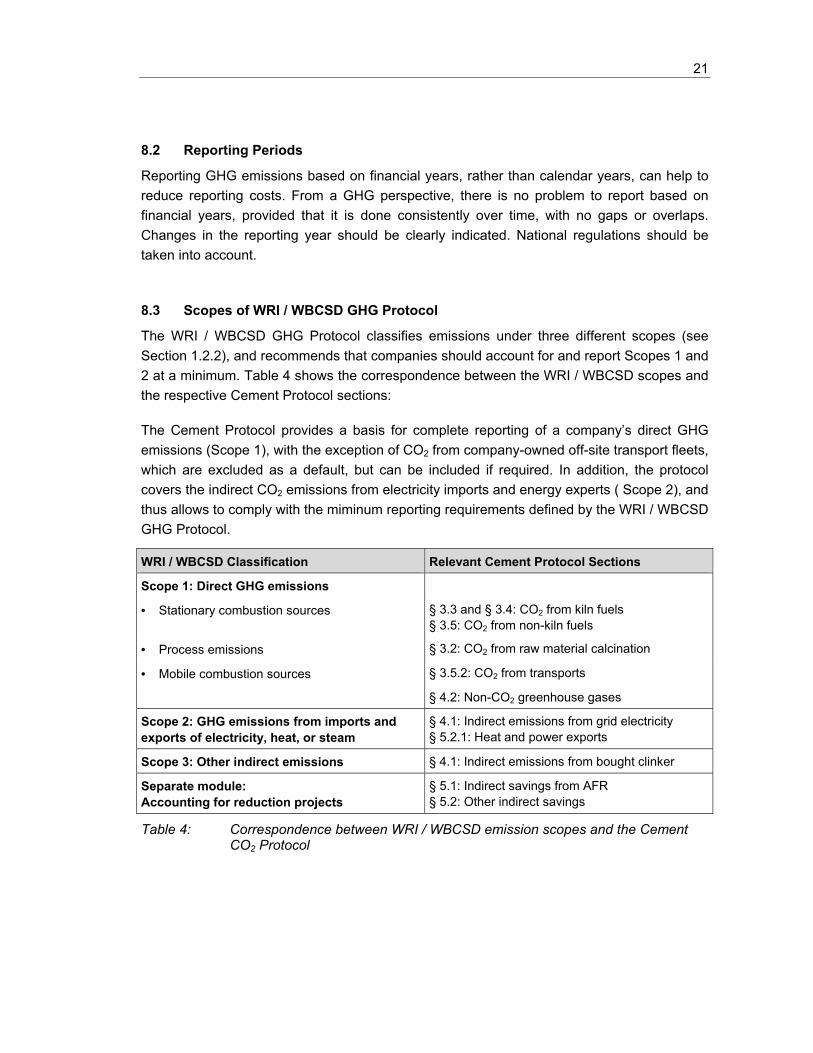
The WRI / WBCSD GHG Protocol classifies emissions under three different scopes (see Section 1.2.2), and recommends that companies should account for and report Scopes 1 and 2 at a minimum. Table 4 shows the correspondence between the WRI / WBCSD scopes and the respective Cement Protocol sections:
The Cement Protocol provides a basis for complete reporting of a company’s direct GHG emissions (Scope 1), with the exception of CO2 from company-owned off-site transport fleets, which are excluded as a default, but can be included if required. In addition, the protocol covers the indirect CO2 emissions from electricity imports and energy experts ( Scope 2), and thus allows to comply with the miminum reporting requirements defined by the WRI / WBCSD GHG Protocol.
WRI / WBCSD Classification Relevant Cement Protocol Sections
Scope 1: Direct GHG emissions
• Stationary combustion sources § 3.3 and § 3.4: CO2 from kiln fuels § 3.5: CO2 from non-kiln fuels
• Process emissions § 3.2: CO2 from raw material calcination
• Mobile combustion sources § 3.5.2: CO2 from transports
§ 4.2: Non-CO2 greenhouse gases
Scope 2: GHG emissions from imports and exports of electricity, heat, or steam
§ 4.1: Indirect emissions from grid electricity § 5.2.1: Heat and power exports
Scope 3: Other indirect emissions § 4.1: Indirect emissions from bought clinker
Separate module: Accounting for reduction projects
§ 5.1: Indirect savings from AFR § 5.2: Other indirect savings
Table 4: Correspondence between WRI / WBCSD emission scopes and the Cement CO2 Protocol

22
9 Further Information
For further questions, information or comments on the Cement CO2 Protocol, please contact:
Holcim Group Support (Brussels) SA Corporate Industrial Ecology Attn. Dr Bruno Vanderborght Vice President Environmental Research & Development Avenue Louise 489/12 1050 Brussels Belgium Phone: ++ 32 2 626 03 67 Fax: ++ 32 2 626 03 68 E-mail: [email protected] or Factor Consulting + Management AG Urs Brodmann, Partner Binzstrasse 18 CH-8045 Zurich Switzerland Phone: ++41 1 455 6100 Fax: ++41 1 455 6060 E-mail: [email protected] Website: http://www.factorag.ch

23
10 References
CIF 1998, Cement Industry Federation of Australia. Greenhouse Energy Management System (GEMS) Guidelines. CIF-GEMS-001, Revision 1, October
CORINAIR 1996. Joint EMEP/CORINAIR Atmospheric Emission Inventory Guidebook (First Edition). European Environment Agency, Kopenhagen
DETR 1999, Department of the Environment, Transport and the Regions. Environmental Reporting - guidelines for company reporting on greenhouse gas emissions. London
Ellis Jane 2000. Potential and Implications for Multi-Project Emission Baselines. Cement Case Study. OECD, Paris
EU DG-Env 2001, Economic evaluation of sectoral emission reduction objectives for climate change; bottom-up analysis, J. de Beer, D. Phylipsen, J. Bates, C. Hendriks, DG Environment, Euro-pean Commission, January 2001; http://europa.eu.int/comm/environment/enveco
IEA 1996, International Energy Agency. CO2 emissions from fuel combustion, 1971 – 1996. IEA Sta-tistics, Paris, ISBN 92-64-16138-4
IEA 1998, International Energy Agency. IEA Greenhouse Gas R&D Program: Emission Reduction of Greenhouse Gases from the Cement Industry; by C.A. Hendriks, E Worrell, D. de Jager, K. Blok, and P. Riemer; http://www.ieagreen.org.uk/prghgt42.htm
IPCC 1996, Intergovernmental Panel on Climate Change. Revised 1996 IPCC Guidelines for National Greenhouse Gas Inventories, Volumes I, II and III. IPCC, Bracknell UK
IPCC 2000, Intergovernmental Panel on Climate Change. Good Practice Guidance and Uncertainty Management in National Greenhouse Gas Inventories. IPCC / IGES, http://www.ipcc-nggip.iges.or.jp/
KPMG 2001. Independent reviewer’s report to the WBCSD Working Group Cement on the Cement CO2 monitoring and reporting protocol. London, UK, October
Lang, Th. & F. Lamproye 1996. Sources and Reduction of CO2-Emissions. 2nd "Holderbank" Course on Environment, September 2 to 13, 1996, Holderbank, Switzerland. CEA 96/7024/E.
QCL 1999, Queensland Cement Group of Companies. Greenhouse Energy Management System. April 1
Ruth, Michael, Lynn Price & Ernst Worrell 2000. Evaluating Clean Development Mechanism Projects in the Cement Industry Using a Process-Step Benchmarking Approach. Report No. LBNL-45346, Lawrence Berkeley National Laboratory, US
Thomas, Charles, Tessa Tennant & John Roles 2000. The GHG Indicator: UNEP Guidelines for Cal-culating Greenhouse Gas Emissions for Businesses and Non-Commercial Organisations. UNEP, Geneva, [email protected]
WRI & WBCSD 2001, World Resources Institute and World Business Council for Sustainable Devel-opment. The Greenhouse Gas Protocol. A Corporate Accounting and Reporting Standard. http://www.ghgprotocol.org/

24
11 Acronyms and Glossary
Absolute emission Absolute emission is the emission in a year expressed in quantity of CO2 per year (tonnes CO2 per year).
AFR Alternative fuels and raw materials used for fossil fuel substitution in clinker production. AFR are derived from waste.
Annex I Annex I to the UNFCCC lists the developed country Parties which have special responsibilities in meeting the objective of the Convention. They in-clude the OECD countries (excl. Mexico and Korea), the countries of East-ern Europe, Russia, and the European Union. Under the Kyoto Protocol, Annex I Parties have accepted quantified emissions limitation or reduction commitments for the period 2008–12.
Baseline Reference emission level. The term is used with different meanings in dif-ferent contexts. It can denote: – the historical emission level of an entity in a reference year, – the projected future emission level of an entity if no extra mitigation measures are taken (business-as-usual scenario), – the hypothetical emission level against which the climate benefits of JI and CDM projects are calculated.
Benchmarking Under benchmarking, some average emissions level, or a percentage thereof, is used as a uniform target for all emitters in the group for which the average applies.
Bypass dust Discarded dust from the bypass system dedusting unit of suspension pre-heater, precalciner and grate preheater kilns, consisting of fully calcined kiln feed material.
Climate-neutral Burning of climate-neutral fuels does not increase the GHG stock in the atmosphere over a relevant time span. Renewable AFR are climate-neutral because the CO2 emission is compensated by an equivalent absorption by plants.
CKD Discarded dust from long dry and wet kiln system dedusting units, consist-ing of partly calcined kiln feed material. Extraction and discarding of bypass dust and CKD serve to control excessive circulating elements input (alkali, sulfur, chlorine), particularly in cases of low-alkaline clinker production. The term „CKD“ is sometimes used to denote all dust from cement kilns, i.e. also from bypass systems.
CORINAIR Coordination d'information environnementale – aire
25
Direct emissions Direct GHG emissions are emissions from sources that are owned or con-trolled by the reporting entity, e.g., emissions from cement kilns, company-owned vehicles, quarrying equipment, etc.
GHG The greenhouse gases listed in Annex A of the Kyoto Protocol include: car-bon dioxide (CO2), methane (CH4), nitrous oxide (N2O), fluorocarbons (PFCs, HFCs) and sulfur hexafluoride (SF6).
Indirect emissions Indirect GHG emissions are emissions that are a consequence of the activities of the reporting entity, but occur from sources owned or controlled by another entity. Sources of indirect emissions, are, e.g., imported electric-ity, employee travel on vehicles not owned or operated by the company, product transport in vehicles not owned or controlled by the company, emissions occurring during the use of products produced by the reporting entity.
Inventory Data base of a legal entity obtained by using the CO2 emissions Protocol.
IPCC The Intergovernmental Panel on Climate Change is a global panel of ex-perts which provide the Conference of the Parties to the UNFCCC with es-tablished scientific information on climate change.
MIC Mineral components are natural or artificial mineral materials with hydraulic properties, used as a clinker or cement substitutes (e.g. blast furnace slag, fly ash, pozzolana). Gypsum can also be considered a MIC.
Parties Parties to the UNFCCC are those countries which have signed and ratified the convention. The European Union, in addition to each of the EU member states, is also a party to the convention. By analogy, Parties to the Kyoto Protocol are those countries which have signed and ratified the Protocol (no OECD country has yet ratified the Protocol, as of August 2000).
Protocol The methodology for calculating, monitoring and reporting GHG emissions.
Specific emissions Specific emissions are emissions expressed on a per unit output basis, for instance in kg or tonnes of CO2 per tonne of cement.
UNFCCC United Nations Framework Convention on Climate Change; Parties to the UNFCCC are those nations which have signed the Convention.
A1-1
Appendix 1: Cement CO2 Protocol: Structure and Instructions
A1.1 Structure of the Protocol
The Protocol is a MS Excel spreadsheet, containing the following worksheets:
1. Colour codes: This sheet explains the meaning of the different colours used in the worksheets.
2. Comments: This sheet gives a short explanation of every line of the Protocol.
3. Plants: One worksheet for each plant of a company.
4. Company: Consolidation to company level of the information of every plant.
5. Public: This sheet lists data which could be publicly accessible (subject to company decision).
6. Fuel CO2 factors: Default CO2 emission factors for fuels used in cement plants.
7. Calcination CO2: Auxiliary sheet to calculate the CO2 emission factor for the calcination of raw material.

A1-2
A1.2 Step by Step Instructions for Completing the Spreadsheet
„Plant” Worksheet
• Lines 1-7: Enter general plant information.
• Lines 7a-7h: Specify system boundaries of inventory.
• Lines 8-19b: Enter production and consumption data.
• Lines 22-24: Enter data on dust produced and landfilled. Enter plant-specifc CKD calcina-tion rate if available.
• Lines 25-29: Aggregate kiln fuel consumptions are calculated automatically from detailed data at the bottom of the spreadsheet:
- Lines 101-121: Enter kiln fuel consumption in tonnes per year.
- Lines 130-151: Enter kiln fuel heating values. Enter plant-specific fuel CO2 emission factors if available.
- Lines 161-231: Kiln fuel consumption in terajoules and CO2 emissions are calculated automatically.
• Lines 30-32: Aggregate non-kiln fuel consumptions are calculated automatically from detailed data at the bottom of the spreadsheet:
- Lines 301-304e: Enter non-kiln fuel consumption in tonnes per year.
- Lines 310-314e: Enter non-kiln fuel heating values. Enter plant-specific fuel CO2 emission factors if available.
- Lines 321-334e: Non-kiln fuel consumption in terajoules and CO2 emissions are cal-culated automatically.
• Lines 33a-33: Enter electric power consumed from internal (on-site) and external genera-tion. Enter CO2 per MWh produced externally (see Appendix 2 for default national grid factors). CO2 per MWh produced on-site is calculated automatically.
• Line 34: Enter waste heat supplied to external consumers.
• Lines 35-39: Enter plant-specific CO2 emission factor per tonne of clinker. Use auxiliary sheet „Calcination CO2” if required. CO2 from raw materials calcination is calculated automatically.
• Lines 40-43: CO2 from kiln fuels is calculated automatically at spreadsheet bottom.
• Lines 44-46: CO2 from non-kiln fuels is calculated automatically at spreadsheet bottom.
• Lines 48-62b: Parameters are calculated automatically.
A1-3
• Lines 65a-65b: Enter credits for indirect GHG savings achieved through use of alternative fuels. Specify basis for credit calculation (credit source).
• Lines 71-97: Parameters are calculated automatically.
„Company” Worksheet
• Lines 1-7: Enter general plant / company information.
• Lines 7a-7h: Specify system boundaries of inventory.
• Lines 8-334e: In „SUM” cells, enter consolidated company values (sum of plant data), taking into account consolidation rules. All other cells are calculated automatically (totals and company averages).
„Public” Worksheet
All data is taken automatically from „Company” worksheet.
„Calcination CO2” Auxiliary Worksheet
• Lines 1-3: Enter plant information.
• Lines 11-15: Molecular weights are constants.
• Lines 21-45: Enter tonnes and CaO-, MgO contents of different clinkers produced. Other parameters are calculated automatically. If additional lines for clinkers #3-n are added, formulas in lines 41-45 need to be adjusted manually.
• Lines 51-75: Enter tonnes and CaO-, MgO contents of different raw materials consumed. Other parameters are calculated automatically. If additional lines for raw materials #3-n are added, formulas in lines 71-75 need to be adjusted manually.
• Lines 81-85: Parameters are calculated automatically. Enter the corrected calcination factor (line 85) into the corresponding „Plant” spreadsheet (line 35).
A2-1
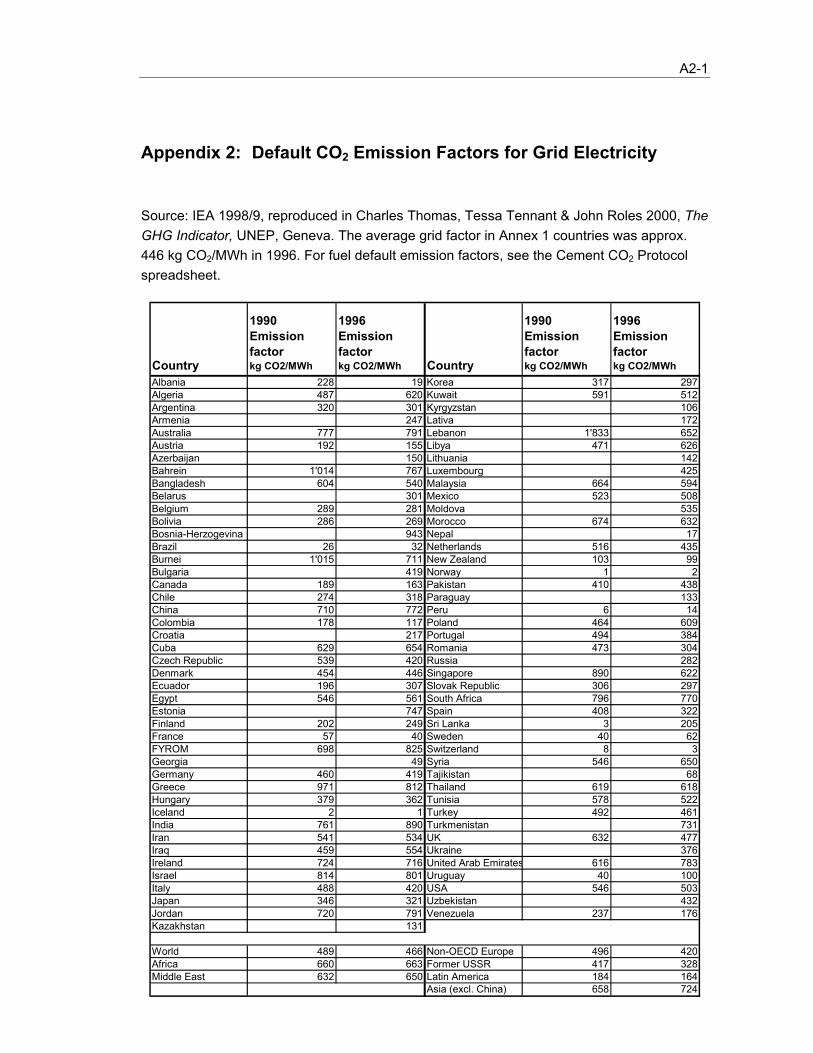
Appendix 2: Default CO2 Emission Factors for Grid Electricity
Source: IEA 1998/9, reproduced in Charles Thomas, Tessa Tennant & John Roles 2000, The GHG Indicator, UNEP, Geneva. The average grid factor in Annex 1 countries was approx. 446 kg CO2/MWh in 1996. For fuel default emission factors, see the Cement CO2 Protocol spreadsheet.
Country
1990 Emission factorkg CO2/MWh
1996 Emission factorkg CO2/MWh Country
1990 Emission factorkg CO2/MWh
1996 Emission factorkg CO2/MWh
Albania 228 19 Korea 317 297Algeria 487 620 Kuwait 591 512Argentina 320 301 Kyrgyzstan 106Armenia 247 Lativa 172Australia 777 791 Lebanon 1'833 652Austria 192 155 Libya 471 626Azerbaijan 150 Lithuania 142Bahrein 1'014 767 Luxembourg 425Bangladesh 604 540 Malaysia 664 594Belarus 301 Mexico 523 508Belgium 289 281 Moldova 535Bolivia 286 269 Morocco 674 632Bosnia-Herzogevina 943 Nepal 17Brazil 26 32 Netherlands 516 435Burnei 1'015 711 New Zealand 103 99Bulgaria 419 Norway 1 2Canada 189 163 Pakistan 410 438Chile 274 318 Paraguay 133China 710 772 Peru 6 14Colombia 178 117 Poland 464 609Croatia 217 Portugal 494 384Cuba 629 654 Romania 473 304Czech Republic 539 420 Russia 282Denmark 454 446 Singapore 890 622Ecuador 196 307 Slovak Republic 306 297Egypt 546 561 South Africa 796 770Estonia 747 Spain 408 322Finland 202 249 Sri Lanka 3 205France 57 40 Sweden 40 62FYROM 698 825 Switzerland 8 3Georgia 49 Syria 546 650Germany 460 419 Tajikistan 68Greece 971 812 Thailand 619 618Hungary 379 362 Tunisia 578 522Iceland 2 1 Turkey 492 461India 761 890 Turkmenistan 731Iran 541 534 UK 632 477Iraq 459 554 Ukraine 376Ireland 724 716 United Arab Emirates 616 783Israel 814 801 Uruguay 40 100Italy 488 420 USA 546 503Japan 346 321 Uzbekistan 432Jordan 720 791 Venezuela 237 176Kazakhstan 131
World 489 466 Non-OECD Europe 496 420Africa 660 663 Former USSR 417 328Middle East 632 650 Latin America 184 164
Asia (excl. China) 658 724
A3-1
Appendix 3: Greenhouse Gas Sources and Abatement Options in Cement Production
Overview of Cement Manufacturing Process
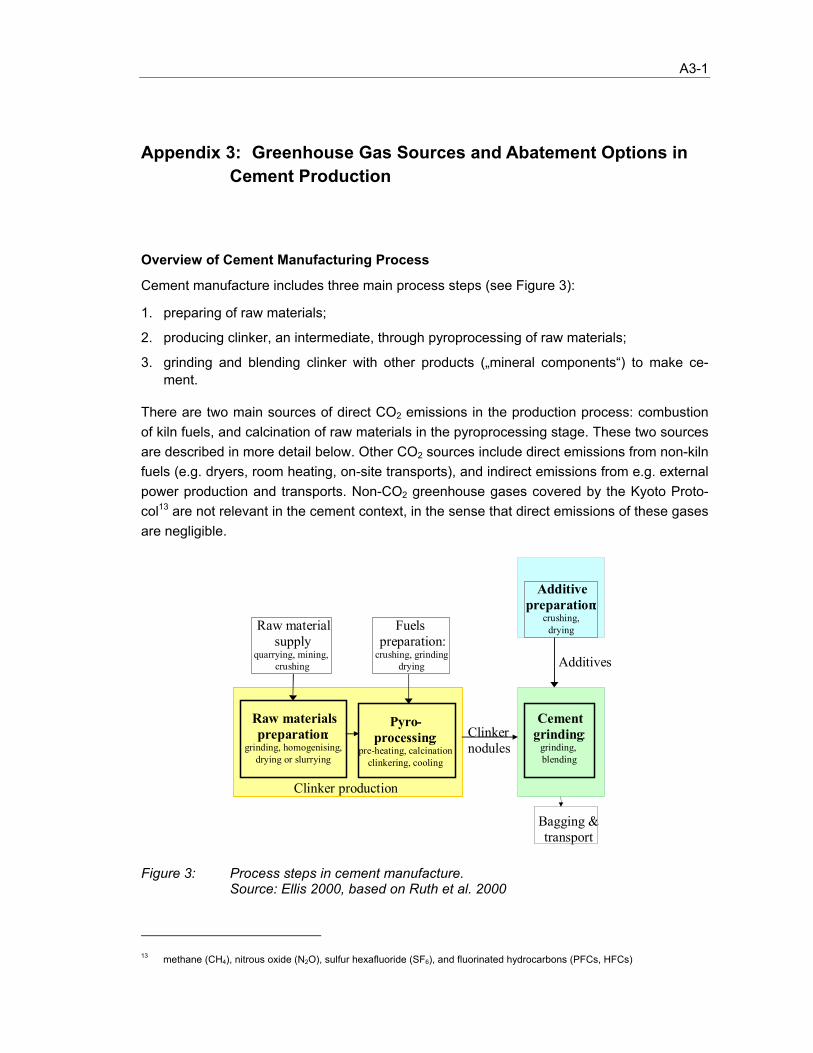
Cement manufacture includes three main process steps (see Figure 3):
1. preparing of raw materials;
2. producing clinker, an intermediate, through pyroprocessing of raw materials;
3. grinding and blending clinker with other products („mineral components“) to make ce-ment.
There are two main sources of direct CO2 emissions in the production process: combustion of kiln fuels, and calcination of raw materials in the pyroprocessing stage. These two sources are described in more detail below. Other CO2 sources include direct emissions from non-kiln fuels (e.g. dryers, room heating, on-site transports), and indirect emissions from e.g. external power production and transports. Non-CO2 greenhouse gases covered by the Kyoto Proto-col13 are not relevant in the cement context, in the sense that direct emissions of these gases are negligible.
Raw materialspreparation:
grinding, homogenising,drying or slurrying
Pyro-processing:
pre-heating, calcinationclinkering, cooling
Cementgrinding:
grinding,blending
Bagging &transport
Additivepreparation:
crushing,dryingFuels
preparation:crushing, grinding
drying
Raw materialsupply
quarrying, mining,crushing
Clinker production
Clinkernodules
Additives
Figure 3: Process steps in cement manufacture. Source: Ellis 2000, based on Ruth et al. 2000
13 methane (CH4), nitrous oxide (N2O), sulfur hexafluoride (SF6), and fluorinated hydrocarbons (PFCs, HFCs)
A3-2
CO2 from Calcination of Raw Materials
In the clinker burning process, CO2 is released due to the chemical decomposition of calcium carbonates (e.g. from limestone) into lime:
CaCO3 + heat → CaO + CO2.
This process is called „calcining“ or „calcination“. It results in direct CO2 emissions through the kiln stack. When considering CO2 emissions due to calcination, two components can be distinguished:
• CO2 from actual clinker production;
• CO2 from raw materials discarded (landfilled) as partly calcined cement kiln dust (CKD), or as fully calcined bypass dust.
CO2 from actual clinker production is proportional to the lime content of the clinker,14 which in turn varies little in time or between different cement plants. As a result, the CO2 emission factor per tonne of clinker is fairly stable (IPCC default: 510 kg CO2/t clinker).
Landfilling of kiln dust varies greatly with kiln types and cement quality standards, ranging from practically zero to over one hundred kilograms per tonne of clinker. The associated emissions are likely to be relevant in some countries.
CO2 from Fuels for Kiln Operation
The cement industry traditionally uses various fossil fuels to operate cement kilns, including coal, petroleum coke, fuel oil, and natural gas. In recent years, fuels derived from waste ma-terials have become important substitutes. These alternative fuels and raw materials (AFR) include fossil fuel-derived fractions such as e.g. waste oil and tires, as well as biomass-derived fractions such as waste wood and dried sludges from wastewater treatment.
Both conventional and alternative fuels result in direct CO2 emissions through the kiln stack. However, biomass fuels can be considered „climate-neutral“. Use of alternative (biomass- or fossil-derived) fuels may, in addition, lead to important emission reductions elsewhere, for instance from waste incineration plants or landfills.
14 A second, but much smaller factor is the CaO- and MgO content of the raw materials and addititves used.

A3-3
CO2 Abatement Options
CO2 emissions in the cement industry can be tackled by different measures. The main cate-gories of CO2 abatement potentials include:
• energy efficiency: technical and operational measures to reduce fuel and power con-sumption per unit clinker or cement produced;
• fuel switching: for instance, use of natural gas or AFR instead of coal;
• reduction of dust landfilling (cement kiln dust, bypass dust), where relevant landfilling occurs;
• MIC: use of mineral components to substitute clinker.
Mineral components (MIC) are natural and artificial materials with latent hydraulic properties. Examples of MIC include gypsum and natural pozzolanas, blast furnace slag, and fly ash. MIC are added to clinker to produce blended cement. In some instances, pure MIC are di-rectly added to the concrete mixer. MIC use leads to an equivalent reduction of direct CO2 emissions associated with clinker production, both from calcination and fuel combustion. Arti-ficial MIC are waste materials from other production processes such as, e.g. steel and coal-fired power production. Related GHG emissions are monitored and reported by the corre-sponding industry sector. Utilization of these MIC's for clinker or cement substitution does not entail additional GHG emissions at the production site. As a consequence, indirect emissions must not be included in the cement production inventory.
A4-1
Appendix 4: Details on Calcination CO2
Summary of IPCC Recommendations
IPCC recommends to calculate calcination CO2 based on the CaO content of the clinker pro-duced (0.785 t CO2/t CaO, multiplied with the CaO content in clinker). A default CaO content in clinker of 65% is recommended, corresponding to 510 kg CO2/t clinker.
CO2 from discarded kiln dust should be calculated separately, taking into account its degree of calcination. Where preciser data is not available, IPCC recommends to account for dis-carded dust by adding 2% to clinker CO2 by default, acknowledging that emissions can range much higher in some instances. IPCC does not distinguish between bypass dust and cement kiln dust (CKD).
The IPCC default for clinker is similar to the recommendations of the Australian Cement In-dustry Federation (518 kg CO2/t cli) and the American Portland Cement Association (522 kg CO2/ t cli), as well as to the older data on the “Holderbank” Group average (524 kg CO2/t cli). The difference is probably due to the fact that IPCC neglects CO2 from decomposition of MgCO3 (MgO content in clinker is usually about 2%). WGC recommends a default emission factor of 525 kg CO2/t clinker, which is the IPCC default corrected for MgCO3.15
Calculating CO2 from Cement Kiln Dust
Cement kiln dust (CKD) is usually not fully calcined. The CO2 emission factor for CKD can be derived from the mass balance between CKD, raw mix and released CO2:
(1) d*2CORawMixCKD T−=
where CKD = quantity of cement kiln dust produced (t) RawMix = amount of dry raw mix consumed (t) CO2T = total carbonate CO2 contained in raw mix (t) d = degree of CKD calcination (released CO2 as % of total carbonate CO2 in the raw mix)
The CO2 emission factor for CKD is:
(2) d*2CORawMix
d*2COCKD
d*2COEFT
TTCKD −
==
where EFCKD = emission factor for CKD (t CO2/t CKD)
15 Sources: IPCC recommendation: IPCC 2000, pp. 3.9ff; Australian average: CIF 1998, p.20; “Holderbank” average: Lang &
Lamproye 1996
A4-2
Since CO2T is proportional to the amount of raw mix, equation (2) can be re-written as:
(3) d*2CO%1d*2CO%EF
T
TCKD −
=
where %CO2T = percentage of carbonate CO2 in raw mix (% weight)
When the raw mix is fully calcined (d=1), EFCKD becomes the emission factor for clinker:
(4) T
TCli 2CO%1
2CO%EF−
= , or re-arranged:
(5) Cli
CliT EF1
EF2CO%+
=
where EFCli = emission factor for clinker (t CO2/t cli)
With the help of equation (5), equation (3) can be expressed as:
(6) d*
EF1EF1
d*EF1EF
EF
Cli
Cli
Cli
Cli
CKD
+−
+=
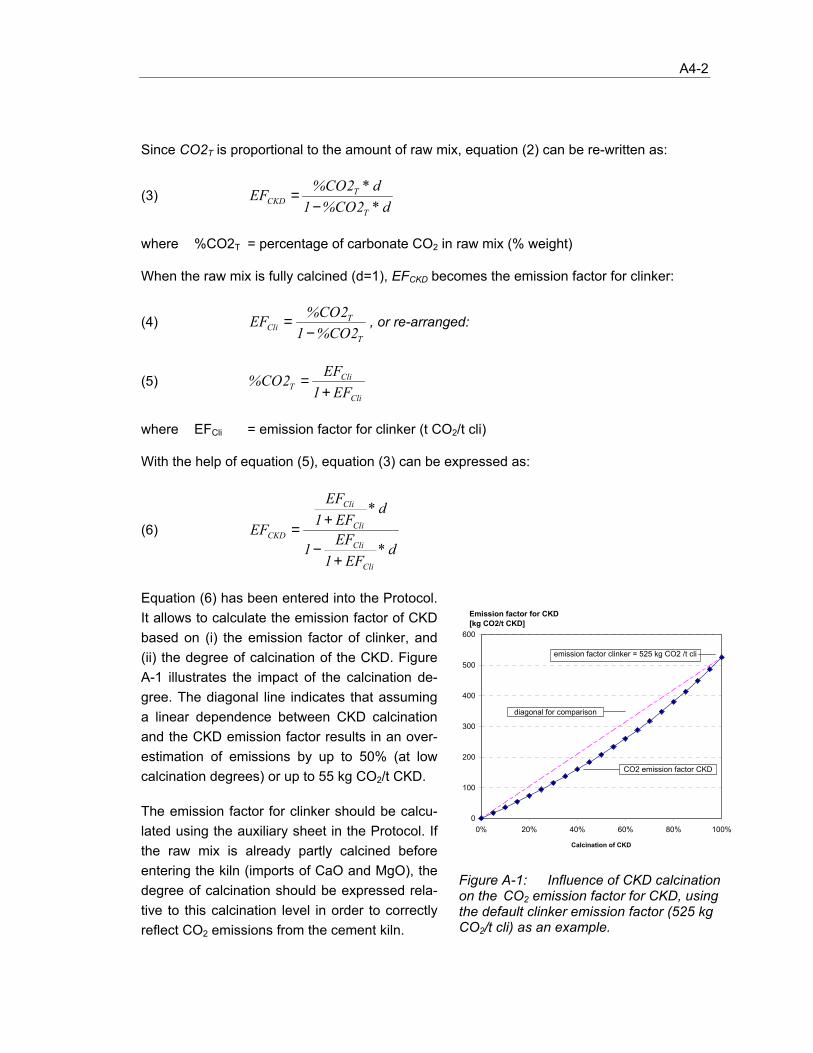
Equation (6) has been entered into the Protocol. It allows to calculate the emission factor of CKD based on (i) the emission factor of clinker, and (ii) the degree of calcination of the CKD. Figure A-1 illustrates the impact of the calcination de-gree. The diagonal line indicates that assuming a linear dependence between CKD calcination and the CKD emission factor results in an over-estimation of emissions by up to 50% (at low calcination degrees) or up to 55 kg CO2/t CKD.
The emission factor for clinker should be calcu-lated using the auxiliary sheet in the Protocol. If the raw mix is already partly calcined before entering the kiln (imports of CaO and MgO), the degree of calcination should be expressed rela-tive to this calcination level in order to correctly reflect CO2 emissions from the cement kiln.
0
100
200
300
400
500
600
0% 20% 40% 60% 80% 100%
Calcination of CKD
diagonal for comparison
CO2 emission factor CKD
emission factor clinker = 525 kg CO2 /t cli
Emission factor for CKD[kg CO2/t CKD]
Figure A-1: Influence of CKD calcination on the CO2 emission factor for CKD, using the default clinker emission factor (525 kg CO2/t cli) as an example.

A5-1
Appendix 5: Numeric Prefixes, Units and Conversion Factors
Prefixes and multiplication factors
Multiplication Factor Abbreviation Prefix Symbol 1 000 000 000 000 000 1015 peta P
1 000 000 000 000 1012 tera T
1 000 000 000 109 giga G
1 000 000 106 mega M
1 000 103 kilo k
100 102 hecto h
10 101 deca da
0.1 10-1 deci d
0.01 10-2 centi c
0.001 10-3 milli m
0.000 001 10-6 micro µ
Abbreviations for chemical compounds Units and abbreviations
CH4 Methane cubic metre m3
N2O Nitrous Oxide hectare ha
CO2 Carbon Dioxide gram g
CO Carbon Monoxide tonne t
NOx Nitrogen Oxides joule J
NMVOC Non-Methane Volatile Organic Compound degree Celsius °C
NH3 Ammonia calorie cal
CFCs Chlorofluorocarbons year yr
HFCs Hydrofluorocarbons capita cap
PFCs Perfluorocarbons gallon gal
SO2 Sulfur Dioxide dry matter dm
SF6 Sulphur Hexafluoride
CCl4 Carbon Tetrachloride
C2F6 Hexafluoroethane
Source: IPCC 1996, Revised 1996 IPCC Guidelines for National Greenhouse Gas Inventories.

A5-2
Conversion Factors
To convert from To Multiply bygrams (g) metric tons (t) 1 x 10 -6
kilograms (kg) metric tons (t) 1 x 10 -3
megagrams metric tons (t) 1gigagrams metric tons (t) 1 x 10 3
pounds (lb) metric tons (t) 4.5359 x 10 -4
tons (long) metric tons (t) 1.016tons (short) metric tons (t) 0.9072barrels (petroleum, US) cubic metres (m 3) 0.15898
cubic feet (ft 3) cubic metres (m 3) 0.028317litres cubic metres (m 3) 1 x 10 -3
cubic yards cubic meters (m 3) 0.76455gallons (liquid, US) cubic meters (m 3) 3.7854 x 10 -3
imperial gallon cubic meters (m 3) 4.54626 x 10 -3
joule gigajoules (GJ) 1 x 10 -9
kilojoule gigajoules (GJ) 1 x 10 -6
megajoule gigajoules (GJ) 1 x 10 -3
terajoule (TJ) gigajoules (GJ) 1 x 10 3
Btu gigajoules (GJ) 1.05506 x 10 -6
calories, kg (mean) gigajoules (GJ) 4.187 x 10 -6
tonne oil equivalent (toe) gigajoules (GJ) 41.86kWh gigajoules (GJ) 3.6 x 10 -3
Btu / ft 3 GJ / m 3 3.72589 x 10 -5
Btu / lb GJ / metric tons 2.326 x 10 -3
lb / ft 3 metric tons / m 3 1.60185 x 10 -2
psi bar 0.0689476
kgf / cm 3 (tech atm) bar 0.98o665atm bar 1.01325mile (statue) kilometer 1.6093ton CH4 ton CO2 equivalent 21ton N2O ton CO2 equivalent 310ton carbon ton CO2 3.664
Sources: International Energy Annual, 1998; http://www.eia.doe.gov/emeu/iea/convheat.html
BP Group Reporting Guidelines, 2000
Source: WRI / WBCSD GHG Protocol, Guideline for Stationary Fuel Combustion http://www.ghgprotocol.org