
THE CASE OF RWANDA’S ICT SECTOR - Fletcher...
54
H UMAN CAPITAL DEVELOPMENT FOR SMALL AND MEDIUM ENTERPRISES THE CASE OF RWANDA’S ICT SECTOR Master of International Business Capstone Project Submitted by Fumi Tataki August 5, 2016 © 2016 Fumi Tataki http://fletcher.tufts.edu
-
Upload
hoanghuong -
Category
Documents
-
view
218 -
download
2
Transcript of THE CASE OF RWANDA’S ICT SECTOR - Fletcher...
!
H U M A N C A P I T A L D E V E L O P M E N T F O R S M A L L A N D M E D I U M E N T E R P R I S E S
T H E C A S E O F R W A N D A ’ S I C T S E C T O R !
!!!!
Master of International Business Capstone Project
Submitted by Fumi Tataki
August 5, 2016
!
!
© 2016 Fumi Tataki !
http://fletcher.tufts.edu!
2
ABSTRACT'
Fumi Tataki: Human Capital Development for Small and Medium Enterprise Growth:
The Case of Rwanda’s ICT Sector (Under the direction of Professor Julie Schaffner and Professor Bernard Simonin)
The purpose of this research is to analyze human capital development for small and medium enterprises (SMEs) in Rwanda’s ICT sector by exploring the issue of the skills gap, a gap between the skills level employers expect of workers and the current skills level of workers. In order to increase productivity, SMEs need to reduce the skills gap by improving the skills of workers to meet the expected skills level. However, if the gap exists within firms, it may be the case that the gap is recognized only by employers and not by workers. This research aims to reveal whether a skills gap exists in the targeted SMEs of Rwanda’s ICT sector by asking employers and workers what skills they consider important for workers and whether they think skills gap exist in those skills. In order to understand whether skills gap exist in the sector, the author conducted a survey with employers and workers of SMEs in Kigali, Rwanda. The result of the survey supports the idea that both employers and workers consider soft skills as important as hard skills for workers. Furthermore, the result suggests that employers evaluate workers skills levels as less competent than workers do. The survey also supports the conclusion that workers tend to consider their relationships and communication with their employers as stronger than employers do.

3
Table of Contents
I. Introduction .......................................................................................................................... 4
II. The Role of SMEs in Development .................................................................................... 7 Definition of SMEs ............................................................................................................................ 7 SMEs’ Contribution to Economic Development ............................................................................ 8 Need for Improving Business Environment for Growth ............................................................... 9 Human Capital as Important Element of SMEs Growth ............................................................ 10
III. Background of Rwanda and SMEs ............................................................................... 11 Background of Rwanda .................................................................................................................. 11 SMEs in Rwanda ............................................................................................................................. 14
IV. Rwanda’s ICT Sector ...................................................................................................... 15
V. Research Methods ............................................................................................................. 19
VI. Results ............................................................................................................................... 24
VII. Implications .................................................................................................................... 37
VIII. Research Limitations and Future Research .............................................................. 38
IX. Conclusion ........................................................................................................................ 39
Appendix________________________________________________________________ 42
Bibliography ........................................................................................................................... 52 ! !
4
I. Introduction
Small and medium enterprises (SMEs) play a crucial role in economic development,
accounting for 90% of businesses worldwide and more than 50% of global employment
today.1 While recognition of the role SMEs can play in global economic development has
increased in recent years, human capital development remains a key challenge constraining
their growth.2 Human capital, as the major input to production besides economic capital, is
crucial to a firm’s performance and survival.3 4 Human capital generates the knowledge and
ability necessary for workers to learn the new competencies needed for firms to grow,
allowing firms to secure a competitive advantage.5 Since SMEs tend to lack the economic
capital that larger firms have, it is particularly important for SMEs to increase their human
capital.
SME managers are thought, however, to face major obstacles to human capital
development that are reflected in a Skills Gap., or a gap between the level of worker skills
that employers believe would allow their companies to achieve ideal productivity and growth
performance and the current skills level of their workers. Obstacles to training that give rise
to a Skills Gap reduce productivity and business growth.6,7 If a Skills Gap exists, tackling the
problems that underlie it may be crucial to SME development.
This study explores the issue of the Skills Gap in SMEs in Rwanda’s ICT sector, a
sector that has played a significant role in the country’s reconstruction since the 1994 !!!!!!!!!!!!!!!!!!!!!!!!!!!!!!!!!!!!!!!! !!!!!!!!!!!!!!!!!!!!!1 The International Finance Corporation, “IFC and Small and Medium Enterprises,” 2012. 2 For example, as recognition of the role SMEs can play in development, the World Bank Group approved more than $10 billion USD for assisting SME activities between 1998 and 2002 and $9.8 billion USD from 2006 to 2012. Piza Cravo et al., “The Impact of Business Support Services for Small and Medium Enterprises on Firm Performance in Low- and Middle-Income countries: A Systematic Review,” Campbell Systematic Reviews, 1 (2016): 11. 3 Lucia Rivas, Margarita Cano, and Flor de Maria Austria, “Need for Developing Human Capital Management in SMEs,” European Scientific Journal 1 (2013): 227. 4 Ganotakis Panagiotis, “Founders’ Human Capital and the Performance of UK New Technology Based Firms,” Small Business Economics 2, no 39 (2012): 499. 5 The OECD, “Multilingual Summaries: Skills for Innovation and Research,” 2011, 1. 6 Seamus McGuiness and Luis Ortiz, “Skill Gaps in the Workplace: Measurement, Determinants and Impacts,” Industrial Relations Journal 47, no. 3 (2016): 253. 7 Ibid, 272-273.

5
genocide and in which the government has prioritized the development of human capital.
Rwanda’s ICT development is incorporated in the National ICT Strategy and Plan (NICI), a
twenty-year ICT sector development strategy from 2000 to 2020. While the NICI I and II,
which were implemented from 2000 to 2010, led to infrastructure and institution
development to establish an ICT ecosystem, one of the main focuses under the NICI III is to
develop people’s skills to promote ICT service delivery.8 Given that the government has
designated human capital development in the ICT sector as the country’s reconstruction, it is
essential to examine how Rwanda’s ICT sector develops human capital. Is there a Skills Gap
in Rwanda’s ICT sector? If so, what should SMEs in Rwanda’s ICT sector do to tackle Skills
Gap? Since recognizing Skills Gap by both employers and workers is the first step to
addressing it, how well do workers and employers in the sector acknowledge Skills Gap?
This case study, which was motivated by my personal observations while working as
an SME consultant in Rwanda, examined these questions by surveying employers and
workers in ICT SMEs in Rwanda on their views on workers’ skill levels and relationships
between employers and workers. While in Rwanda in the summer of 2015, I observed
inconsistent views on skills that are essential for worker productivity by employers and
workers. In assessing the firm, employers shared their concern about a Skills Gap; they
wished their workers would recognize the deficiencies in their skills and work harder to
obtain the necessary skills. Employers mentioned that workers could learn to improve their
skills, particularly their hard skills, through sources such as the Internet. On the other hand,
workers expressed concerns that they wished to receive proper training to improve the skills
relevant to their jobs. Both groups appeared to be frustrated with each other. This experience
led me to believe that such inconsistencies would potentially create mistrust and discontent
within the firm.
!!!!!!!!!!!!!!!!!!!!!!!!!!!!!!!!!!!!!!!! !!!!!!!!!!!!!!!!!!!!!8 The Government of Rwanda. “National ICT Strategy and Plan NICI – 2015,” 6-7.
6
Thus, this research was conducted to analyze whether a Skills Gap exists in the SMEs
of the Rwanda ICT sector and whether there is a difference in views on Skills Gap between
employers and workers. The survey was conducted on 17 SMEs comprised of 31 employers
and 94 workers (125 in total) in Rwanda’s ICT sector and consisted of six parts. In the first
two portions, it asked what kind of skills employers considered important for their workers
and examined how competent employers considered their workers in those areas. The third
part of the study asked employers what they consider to be the most critical obstacle in
investing in worker skills training. The fourth part of the survey turned to workers’ views of
needed skill levels, allowing for a comparison between workers’ and employers’ views of
which skills are most important. The fifth portion of the survey asked the same workers how
competent they viewed themselves in each skill identified and explored how their views on
this compared with their employers’. Finally, the last portion of the study asked both
employers and workers about their perceptions of the quality of relationships and interaction
between the two groups.
The results of the survey confirmed that employers identify a Skills Gap in the SMEs
of Rwanda’s ICT sector, but revealed a key difference in how well workers acknowledged
this gap compared to employers. Although the workers and employers surveyed largely
agreed on what hard and soft skills were important to the firm,9 when it came to rating
competency, the employers believed that their workers were not equipped with the skills
listed, while the workers identified themselves as having a higher competency. The study
further revealed that the workers tend to have a positive impression of their working
environment and high level of trust in their employers, indicating that employers should not
hesitate to tell their workers that Skills Gap exists in order to help address the issue. In short,
an analysis of employers’ and workers’ views of skills levels revealed a discrepancy in
!!!!!!!!!!!!!!!!!!!!!!!!!!!!!!!!!!!!!!!! !!!!!!!!!!!!!!!!!!!!!9 Soft skills in the list are critical thinking, communication, creative thinking, teamwork, time management, and organizational skills.

7
recognition of Skills Gap, and an analysis of their views on work environments and
communication revealed a potential means to narrow this discrepancy and address Skills Gap.
This paper will first review the role of SMEs in development and describe the
background of SMEs in Rwanda’s ICT sector in order to place the survey in context. Next, it
will discuss the research methodology and describe the survey design and results in detail.
Finally, it will discuss research limitations, implications, and areas for further research before
concluding.
II. The Role of SMEs in Development
Definition of SMEs
There are various definitions of SMEs. For instance, SMEs can be defined in terms of
the number of employees and assets, turnover rate, capital investment, and industry type. The
International Finance Corporation (IFC) defines SMEs according to the chart below:10
Definition of
enterprise
Number of full-time employees Total assets Total annual sales
Micro Less than 10 employees <$100,000* <$100,000 Small 10-49 employees $100,000< <$3 million $100,000< <$3 million
Medium 50-300 employees $3 million < < $15 million $3 million < < $15 million
*$ in USD
Across these many definitions, SMEs can range from small shops that sell local products to
the community to medium-sized information technology enterprises that provide
telecommunication network services to an entire country. SMEs can also belong to formal or
informal sectors of the economy depending on whether they are legally registered and/or pay
taxes to the government.
!!!!!!!!!!!!!!!!!!!!!!!!!!!!!!!!!!!!!!!! !!!!!!!!!!!!!!!!!!!!!10 The International Finance Corporation, “Interpretation Note on Small and Medium Enterprise and Environmental and Social Risk Management,” 2000, 1.

8
SMEs’ Contribution to Economic Development
SMEs are an essential source of job creation, which is a driving force of growth for
developing economies such as Rwanda. Among OECD countries, SMEs account for 99% of
firms and 50-70% of value added across countries.11 Furthermore, it is estimated there are
420 to 510 million SMEs around the world, and 80-95% of these SMEs are in low- and
middle-income countries.12 Although some SMEs are neither labor intensive nor better at
creating jobs, expanding the SME sector is often considered a better alternative for
employment growth than expanding large firms, since SMEs are labor-intensive.13
There are a number of studies on the relationship between SMEs and economic
growth. By using cross-country 1990’s data gathered from 45 countries, Beck et al. (2005)
found that SMEs in manufacturing and GDP per capita are positively correlated. However,
the data suggests that this relationship is not robust in controlling for reverse causation and
simultaneity bias.14 This suggests that SMEs are an essential part of economic success but not
necessarily a cause.
Some studies suggest that the contribution of SMEs to economic growth is higher in
developed countries. Ayyagari et al. (2005) illustrates that countries with higher level of GDP
per capita have larger SME sector in terms of their contribution both to total employment and
GDP. Their findings illustrate that the richer a country becomes, the more employment
opportunities there are in small and medium manufacturing companies as compared to large
manufacturing companies, which results in a larger contribution to GDP.15 This is why the
Government of Rwanda has strived to promote SMEs growth in order to achieve
!!!!!!!!!!!!!!!!!!!!!!!!!!!!!!!!!!!!!!!! !!!!!!!!!!!!!!!!!!!!!11 The OECD, “SMEs, Entrepreneurship and Innovation,” 2010, 5. 12 The ILO, “Small and Medium-Sized Enterprises and Decent and Productive Employment Creation,” 5. 13 Carmen Pages, The age of Productivity: Transforming Economies From the Bottom Up (New York: Palgrave Macmillan, 2010), 210. 14 Thorsten Beck, Asli Demirguc-Kunt, and Ross Levine, “SMEs, Growth, and Poverty,” Journal of Economic Growth 10, no. 3 (2005): 222. 15 Meghana Ayyagar, Besk Thorsten, and Asli Demirguc-Kunt, “Small and Medium Enterprises across the Globe,” Small Business Economics 29, no.4 (2007): 418.

9
reconstruction and economic development of the country as the country is striving to become
a middle-income country by 2020.
Need for Improving Business Environment for Growth
The performance of SMEs depends on the work environment in which they conduct
business. Harrison et al. (2013) argue that a business environment detrimentally affects firm
productivity and growth rates of African countries. They highlight that though African
countries are not inherently disadvantaged, a lack of infrastructure, access to finance, and
trade credit negatively affects a firm’s productivity. The study demonstrates that when
controlled for crucial firm characteristics that would affect a firm’s productivity such as
geography, infrastructure, political and institutional factors, and access to finance,
manufacturing firms have a conditional advantage in productivity levels and growth and sales
growth.16 The study, therefore, demonstrates that improving the business environment for
SMEs by implementing coherent policies through a collective approach with other
stakeholders is fundamental to facilitate their growth.
In line with their study, Piza et al. (2016) state that institutions often constrain SMEs
from reaching their potential to grow. In their study, they find direct and indirect business
intervention support such as tax simplification and assistance on access to external markets
and technical job training and programs improve SMEs’ performance and productivity.
While SMEs face various institutional constraints and barriers, government interventions are
required to alleviate their constraints.17
Beck et al. (2001) also studied effects of business environment on SME growth by
using cross-sectional firm level survey in 54 countries of developed and developing countries.
They demonstrate that business environment such as financial, legal, and corruption issues
significantly affect SME growth rates in a negative way in SMEs. According to Beck et al., !!!!!!!!!!!!!!!!!!!!!!!!!!!!!!!!!!!!!!!! !!!!!!!!!!!!!!!!!!!!!16 Ann Harrison, Justin Lin, and Colin Xu, “Explaining Africa’s (Dis)Advantage: The Curse of Party Monopoly,” The World Bank, 2013, 74. 17 Piza at al., 11-12.
10
effects of SME growth rates depend on the size of SMEs, and the smallest SMEs (5-50
employees) are most affected by these constraints. These elements are a critical part of the
ecosystem in which SMEs conduct business, and their study shows that establishing an
efficient ecosystem is critical for performance and growth of firms.18 These studies explain
that, besides efforts made by SMEs themselves to grow their business, there is a need for
policies for building ecosystems that would help SMEs expand and improve business
transactions through partnerships with various stakeholders in countries such as Rwanda.
Human Capital as Important Element of SMEs Growth
Besides improving the business environment, improving workers’ skills is another
important factor in increasing SMEs’ productivity and facilitating SME growth. Haskel and
Martin (1993) argue that a Skills Gap lowers firms’ productivity in two ways. They define
the Skills Gap as the condition in which firms fail to adjust the wage properly and the wage
falls under a disequilibrium. First, the skills gap increases the cost of hiring skilled labor, as
firms replace less-skilled workers with higher skilled workers. Second, skilled workers gain
higher bargaining power, which allows them to choose an easier pace of work at the given
wage.19 Healy et al (2015) share some possibility that the Skills Gap and change in sale of
SMEs have a causal relationship. Although their study argues that the relationship between
the skills gap and change in sale is not always negative, at SMEs which experience a skills
gap, sales in year 2 and 3 (but not in year 1 when they start experiencing skills gap) turned
out to be negative. Though it cannot be proved that there is a negative causal relationship,
change in sale of SMEs may be negatively affected by lack of available skills depending on
!!!!!!!!!!!!!!!!!!!!!!!!!!!!!!!!!!!!!!!! !!!!!!!!!!!!!!!!!!!!!18 Beck Thorsten, Asli Demirguc-Kunt, and Vojislav Maksimovi, “Financial and Legal Constrains to Firm Growth: Does Size Matter?” The Journal of Finance 60, no.1 (2005): 170. 19 Jonathan Haskel and Christopher Martin. “Do skill shortages reduce productivity? Theory and Evidence from the United Kingdom,” 386-387.

11
the year measured.20 These studies suggest that improving skills of workers is important
element of SMEs’ productivity.
While there are few studies on approaches to reducing the Skills Gap, this research
argues that before providing skills training to reduce the Skills Gap, understanding the
shortcomings in their own skills is a way to improve workers’ skills. It is also important that
workers understand how much of a Skills Gap exists; how much they need to improve their
important skills. With understanding of these elements, workers are expected to utilize
trainings more efficiently with clear goals and purpose than without.
III. Background of Rwanda and SMEs
Background of Rwanda
The reconstruction of the country began after the genocide in 1994. After the
genocide which killed approximately 800,000 people, including 75% of the Tutsi population,
the entire country was devastated and left with no infrastructure or economic foundations.21
In a pursuit of reconstruction, the Rwandan government developed Vision 2020, a policy
framework which lays out key elements for economic development. Vision 2020 defines
short-term, mid-term, and long-term objectives for development and provides guidance for
the country to become a middle-income country (per capita income of about $900 USD per
year, from $290 USD today) by 2020.
One of the mid-term objectives shared by Vision 2020 is to establish a knowledge-
based economy, an economy that relies more on intellectual capability than natural resources.
Rwanda seeks to achieve this goal by transitioning itself away from an agricultural-dependent
economy. The shift to a knowledge-based economy is to be driven by two factors. First, !!!!!!!!!!!!!!!!!!!!!!!!!!!!!!!!!!!!!!!! !!!!!!!!!!!!!!!!!!!!!20 Joshua Healy, Kostas Mavromaras and Peter Sloane, “Adjusting to Skill Shortages in Australian SMEs,” 2484-2485. 21 Philip Verwimp, “Death and Survival During the 1994 Genocide in Rwanda,” Population Studies 58, no 2 (2004): 233.

12
Rwanda is a landlocked country that lacks natural resources. The government has urged to
expand non-agricultural industries to establish high-value and high-productivity sectors.
Second, about 40% of Rwanda's population is between the ages of 14 and 35. Thus, Rwanda
expects to build a knowledge-based economy especially in the ICT sector through
entrepreneurship and innovation led by its young population. Rwanda also expects to use its
geographical advantage of being situated between East and Central Africa to expand its trade
and investment. Vision 2020 emphasizes an importance in establishing policies and private
sector investments to achieve this goal.
The 1994 genocide also created a need for securing jobs for the country’s young
population. Due to the genocide, thousands of people fled to other counties to escape the
massacre. This resulted in a largely concentrated youth population, with 51.4% of Rwanda’s
population between the ages of 15-60.22 In the reconstruction process, it is very critical for
Rwanda to create jobs for its youth to promote economic growth through private sector and
entrepreneurship development. Job creation is also emphasized in Rwanda’s Second
Economic Development and Poverty Reduction Strategy 2 (EDPRS 2) as a key link between
economic growth and poverty reduction. The EDPRS 2 states that meeting the supply and
demand of the job market while giving individuals skills needed for employment which could
reduce poverty.23 In the EDPRS 2, Rwanda estimates the population will grow from 11.8
million to 13 million by 2020, indicating the necessity of creating 1.4 million jobs in the non-
agricultural sector.24
The long-term objective of Vision 2020 incorporates fostering the private sector as
the backbone for wealth and job creation. Vision 2020 states that private sector development
cannot be solely achieved by the state or by aid; a combination of the two is indispensable.
!!!!!!!!!!!!!!!!!!!!!!!!!!!!!!!!!!!!!!!! !!!!!!!!!!!!!!!!!!!!!22 The National Institute of Statistics of Rwanda, “Rwanda Demographic and Health Survey 2014-15 Final Report,” 14. 23 Rwanda Development Board, Economic Development and Poverty Reduction Strategy II, 2013, 58. 24 Republic of Rwanda Ministry of Finance and Economic Planning, “Vision 2020,” 2000, 17.

13
Vision 2020 defines private sector stimulation as the development of exports and
competitiveness, which is achieved by strengthening the financial sector and informational
technology. In light of this, Rwanda has developed a strong ecosystem for the private sector.
In the World Bank’s “Doing Business” report, which provides measures of business
regulations and their enforcement, Rwanda ranked 46th out of 189 countries in the 2015,
making the country the easiest place to do business in East and Central Africa and the 3rd
easiest place in Africa.25
Vision 2020 also identifies several important pillars to achieve economic
development. Among its pillars, two pillars that are the main focus of this research are human
resource development and private sector-led development. The first pillar emphasizes
education, especially vocational and technical training in fields such as technology,
engineering, and management. This pillar also emphasizes innovation; it points out how skills
development should particularly focus on young small-scale entrepreneurs since the youth
population are considered to be the drivers of innovation. It also reiterates that skills
development in the ICT sector is essential in order to foster qualified workers who can lead
technological innovations and facilitate a shift from an agricultural to an industrial- and
telecommunications-based economy.
The second pillar of private sector development reflects a need for promoting foreign
investment and local business. Rwanda envisions the private sector accelerating the
productivity and competitiveness of products and services, and the role of the government in
ensuring infrastructure, legal structures, and human resources is key for this purpose. This
pillar also highlights the government’s will to focus not only on the formal sector but also on
the informal sector which is one of the drivers of private sector development.
!!!!!!!!!!!!!!!!!!!!!!!!!!!!!!!!!!!!!!!! !!!!!!!!!!!!!!!!!!!!!25 Rwanda Development Board, “Rwanda Among Top 3 Easiest Places to Do Business in Africa.”!!

14
SMEs in Rwanda
The contribution by SMEs to the economy is immense. In 2010, SMEs comprised
98% of business and 41% of all private sector employment in Rwanda including the ICT
sector.26 The following chart demonstrates how the Government of Rwanda defines SMEs:
Size of enterprise Net capital investments
(million RwF)
Annual turnover (million RwF) Number of employees
Micro enterprise Less than 0.5 Less than 0.3 1 to 3 Small enterprise 0.5 to 15 0.3 to 12 4 to 30
Medium enterprise 15 to 75 12 to 50 31 to 100 Large enterprise More than 75 More than 50 More than 100
Source: Small and Medium Enterprises (SMEs) Development Policy27
According to the 2014 Establishment Census of Rwanda, about 90% of the total
number of establishments are micro enterprises and 8.7% are small enterprises.28 The number
of all sizes of enterprises has increased from 2011. Large establishments have the largest
percentage increase of 102.9%, followed by small establishments by 28.2%, micro by 24.1%,
and medium by 19.0%.29 Even though large establishments experienced the largest increase,
micro, small, and medium establishments still play a significant role in creating jobs and
stabilizing the economy. SMEs are also recognized as an economic development strategy to
create jobs and reduce trade imbalances by increasing the value-added exports to increase
export revenue.30
However, SMEs in Rwanda have met various challenges for growth. To reiterate the
challenges that Rwandan SMEs face, the Ministry of Trade and Industry in 2000 published
the Small and Medium Enterprises (SMEs) Development Policy.31 This policy identifies key
challenges to SMEs growth particularly a lack of time and resources to invest in human
capital building. They also lack access to market information and financial resources. The
!!!!!!!!!!!!!!!!!!!!!!!!!!!!!!!!!!!!!!!! !!!!!!!!!!!!!!!!!!!!!26 Ministry of Trade and Industry, “Small and Medium Enterprises (SMEs) Development Policy,” June 2010, 15. 27 Ibid., 7. 28 National Institute of Statistics Rwanda, “2014 Establishment Census,” 2014. 10 29 Ibid., 20 30 Ministry of Trade and Industry, “Small and Medium Enterprises (SMEs) Development Policy,” 2010. 5. 31 The report has not been updated, thus the data used in this study is not updated.

15
policy highlights how SMEs tend to depend on a single individual or a small group of people
to develop business ideas. This shows that SMEs operate in a very limited capacity in terms
of human and financial resources, which makes it difficult for them to advance their business.
The growth of SMEs in Rwanda not only creates wealth and jobs for the local
population, it also contributes to the decreasing trade imbalances. The country’s trade
imbalances which increased from $229 million USD to $770 million USD from 2005 to 2009
because the growth increases value-added exports to increase trade revenue. Value-addition
products by SMEs growth encompass agriculture, essential oils, business process outsourcing
(e.g. software development), agro-processing, light metal industries, and creative industries
(e.g. music, handicrafts),32 which implies a wide range of SMEs’ activities and contribution
in the country.
SMEs are also regarded as potential large sources of tax revenues, accumulating
RwF4.9 billion (approx. $6.27 million USD)33 annually. While external grants and borrowing
accounts for 48% of government revenue, tax revenues from SMEs would contribute to the
decreasing dependency in grant and aid. Though only 24% of currently registered SMEs pay
tax on a regular basis due to the fact that a lot of SMEs are not officially registered. SMEs are
still a potential source of revenue due to their size and key role in the national economy.34
IV. Rwanda’s ICT Sector
Among various business sectors, Rwanda has promoted the ICT sector based on a
mission of building a knowledge-based economy to modernize key sectors by using ICT. As
previously stated, the purpose of establishing a knowledge-based economy is to make
Rwanda a middle-income country by 2020. Based on this goal, Rwanda has sought to
!!!!!!!!!!!!!!!!!!!!!!!!!!!!!!!!!!!!!!!! !!!!!!!!!!!!!!!!!!!!!32 Ibid., 8. 33 Exchange rate: 1RwF=0.0013 USD 34 Ministry of Trade and Industry, “Small and Medium Enterprises (SMEs) Development Policy,” 2010, 5.

16
transform the country into an IT-literate nation by promoting deployment and utilization of
ICTs, improving infrastructure, transforming educational systems using ICTs, and improving
human resource development capacities to meet demands of the economy.35 In the process,
Rwanda has envisioned the country becoming a future regional ICT hub, aligning Rwanda
with other regional countries while providing its own people and countries with high quality
services.
The Government of Rwanda has implemented these strategies by formulating the
National ICT Strategy and Plan (NICI). NICI contains four sets of five-year plans which lay
out the country’s ICT development strategy from 2000 to 2020 under the auspices of the
African Information Society Initiatives of the United Nations Economic Commission for
Africa. The NICI process started with NICI-2005 (NICI I) with a time frame of 2001 to 2005
which focused on creating a necessary environment to promote the growth of the ICT sector.
This included building relevant institutions, laws, and a regulatory framework. It also
encompassed facilitating foreign investment in the telecommunication market and
establishing an effective implementation and coordination system.36
NICI-2010 (NICI II) focused on high quality communications infrastructure which
encompassed nationwide coverage of telecommunication and fiber networks and the
establishment of a national data center. Although a number of fixed telecommunication line
subscriptions increased about 10% during the implementation of NICI II, mobile
subscriptions and Internet subscriptions increased 217% and 1,000% respectively. 37
Moreover, in 2008, Korea Telecom, the largest telephone company in Korea, signed a
contract with the Rwandan government to build a new backbone telecommunication network
!!!!!!!!!!!!!!!!!!!!!!!!!!!!!!!!!!!!!!!! !!!!!!!!!!!!!!!!!!!!!35 The Government of Rwanda and Economic Commission for Africa, “A Review of the Implementation of the Rwanda ICT4D/NICI-2005 Plan,” 2005, 8. 36 The Government of Rwanda, “National ICT Strategy and Plan NICI – 2015,” 6. 37 UN ECOSOC, “Monitoring NICI Policies and Plans in Africa: The Rwandan Experience,” 16.

17
and later expanded its work to establish a national mobile LTE network, which facilitated
foreign direct investment in the ICT sector.38
Besides these improvements, NICI I and II emphasized human capacity development
as an important pillar. This is because the Government of Rwanda considered human capital
necessary to meet the changing demands of its economy. This led to educational reforms and
wider ICT usage in public and private sectors transactions. Skills development programs and
trainings to professionals and young adults were created to help develop marketable skills by
several institutions. These various institutions include the Rwanda Development Board
(RDB) initiated by the Entrepreneurship Development Program. This program aims to create
awareness of enterprises and provide entrepreneur skills.39 Recently, Rwanda concluded the
NICI-2015 (NICI III) which focused on developing and improving services in various sectors
through ICT. Compared to previous plans, NICI III is designed to connect ICT to the
development of the country: NICI III envisions carrying out “services development” by
having efficient government services to improve productivity and competitiveness within the
private sector. 40 These services include government services and private businesses to
improve efficiency, productivity, and competitiveness of the country’s economy.
The main objectives of NICI III were for ICT 1) to contribute significantly to GDP
growth; 2) to run efficient government services; 3) to improve business efficiency and
productivity; and 4) to be the foundation for long term and sustainable economic
competitiveness in the service economy. One of the recommendations for NICI III was to
create a monitoring system for projects and leadership to promote each pillar.
!!!!!!!!!!!!!!!!!!!!!!!!!!!!!!!!!!!!!!!! !!!!!!!!!!!!!!!!!!!!!38 The Government of Rwanda, “Rwanda 4G LTE Project Scoops Global Telecom Business Innovation Award,” May 15, 2015. 39 Rwanda Development Board, �Entrepreneurship Development Program,” http://www.rdb.rw/departments/human-capital-and-institutional-development/entrepreneurship-development-program.html!40 The Government of Rwanda, “National ICT Strategy and Plan NICI – 2015,” 6.

18
The five focus areas of NICI III addressed key challenges to achieve development of
several key services: skill development, private sector development, community
development, e-government, and cyber security. In particular, NICI III states that skill
development is indispensable for ensuring both the quality and quantity of skilled personnel
to drive development ICT sector and establish a knowledge-based economy. Through this
objective, NICI III aimed to empower people by gaining ICT competencies and improving
access to education and trainings through ICT.
Though the result of NICI III is not yet publicly available, Rwanda is in the process of
carrying out NICI-2020 (NICI IV), the last NICI plan for ICT development. NICI IV aims to
consolidate the NICI process to establish a middle-income country status and to transform
Rwanda into an information rich knowledge-based economy and society.41 Through NICI I
and NICI II, Rwanda was able to demonstrate to the international community its commitment
to becoming a regional ICT hub.
In addition, Rwanda is also committed to the Smart Rwanda Master Plan (SRMP)
which aims to establish a prosperous and knowledgeable society through SMART ICT. The
scope of SRMP is to secure national ICT execution capability, to expand ICT accessibility,
and to establish core networks to enhance economic growth. By achieving this, Rwanda aims
to become a long-term regional ICT hub to promote the country’s international reputation as
a knowledge-based and middle-income nation.42 Promoting the country as a regional ICT hub
requires further development of the sector by building new ICT products and platforms, and
this requires human capital-innovation-growth since innovation derives from needs and
ability of workers to grow. However, if workers are comfortable with the status quo, the
necessity of innovation may be less than workers who strive to learn and grow their
!!!!!!!!!!!!!!!!!!!!!!!!!!!!!!!!!!!!!!!! !!!!!!!!!!!!!!!!!!!!!41 Ibid., 17. 42 Republic of Rwanda, “SMART Rwanda Master Plan 2015-2020,” 27.

19
companies. Therefore, examining human capital development in the Rwanda ICT sector by
this research is important for the development of the sector as well as for the country.
V. Research Methods
The field survey was conducted for two weeks during the winter of 2015 in Kigali,
Rwanda. The survey was conducted with employers and workers of 17 different SMEs in the
ICT industry in Kigali. A total of 125 people including 31 employers and 94 workers were
surveyed. However, of the 94 workers, 12 had missing data in their responses, so all data
from these respondents was excluded from the statistical analysis. The survey participants
were either members of K-Lab, an open space lab for IT entrepreneurs in Kigali,43 or
introduced by the manager at K-Lab. After receiving permission from employers of each
SME, workers were also asked to participate in the survey with their consent. While the
survey was mostly conducted face-to-face by using online and paper-based surveys, for one
company, the participants took the survey online by themselves. The survey was translated
into Kinyarwanda for those who do not understand English; however, none of the participants
chose to respond in Kinyarwanda.
Though the number of SMEs surveyed was not a large sample of the total SMEs in
Rwanda, it was still not an easy task to find employers of SMEs in the sector to conduct a
survey. It was especially difficult to make appointments with employers remotely prior to the
trip. This is because SMEs employers in Rwanda ICT sector tend to wait to fix their
schedules until the last-minute. Their schedule also tends to change with other activities, thus,
several employers I contacted prior to visiting Kigali preferred to have contact again once I
arrive Kigali.
!!!!!!!!!!!!!!!!!!!!!!!!!!!!!!!!!!!!!!!! !!!!!!!!!!!!!!!!!!!!!43 K-Lab, http://klab.rw/

20
Skills that were selected in the survey are based on the survey conducted by the
Ministry of Advanced Education and Skills Development of Ontario, Canada, which was
chosen as a model because it offered the advantage of encompassing a wide range of skills
with more focus on soft skills as compared to other surveys.44 A disadvantage of this model,
however, is that it did not include specific hard skills, which this research on SMEs of
Rwanda’s ICT sector also did not address. Separately, the survey questions on the
relationship and communication between employers and workers were based on a work
environment survey conducted by the U.S. State of Connecticut, which was selected as a
model because its questions were found to be clear and concise.45
The skills in my survey were categorized into two groups: soft and hard skills. Two
categories of skills were created because, based on my conversation with employers and
workers of Rwanda ICT sector, they appeared to value hard skills more than soft skills due to
the nature of ICT sector but still think soft skills are important for their work. So, the survey
was designed to separate the two categories so that soft skills would not be ignored.
Acquiring soft skills is critical for business growth since workers often work in
groups, which requires skills that enable them to work with others. Soft skills are skills that
are generally interpersonal competencies which affect each worker as they communicate with
other workers, employers, and clients. The Secretary’s Commission on Achieving Necessary
Skills under the U.S. Department of Labor surveyed 400 employers from various industries
concerning their perceptions of basic skills (e.g. reading, writing, speaking) and competencies
of their workers: as skills required for their current and future workers, 92.6% of employers
rated soft skills such as thinking skills (e.g. reasoning, making decisions, thinking creatively)
and personal quality skills (e.g. responsibility, self-esteem, self-management) as the most
important skill, while 54.5% of employers rated technology competencies (hard skills) as the !!!!!!!!!!!!!!!!!!!!!!!!!!!!!!!!!!!!!!!! !!!!!!!!!!!!!!!!!!!!!44 The Ministry of Advanced Education and Skills Development of Ontario, “Appendix B: Employer Satisfaction Survey.” 45 Connecticut State Department of Education, “Work-Environment Questionnaire.”!

21
most important for employment. The study by the U.S. Department of Labor also suggests
that it is a significant challenge that workers possess the required level of basic skills, and a
lot of companies have implemented in-house trainings to improve basic skills for workers. 46
This illustrates that soft skills are considered one of the most important elements of
employable workers, and employers expect their workers to have a certain level of soft skills
in order to contribute to companies.
In this research, soft skills are defined as personality traits that are subjective in nature.
Skills listed as soft skills are communication, organization and planning, time management,
creative thinking, critical thinking, and teamwork skills. Hard skills represent technical skills
that are specific to occupations of workers. As hard skills vary, depending on the types of
work expected of workers, in this study, participants are asked to identify the types of hard
skill that are required for workers, unlike soft skills that are specifically given to them. For
hard skills, it was assumed that types of hard skill could be specific to the nature of
occupation for each worker, the survey did not list specific hard skills but rather asked
employers to identify important hard skills for their technical and support workers.
The survey was conducted in person because of the anticipated difficulty in defining
soft and hard skills and other questions. Problems that I encountered in conducting the survey
were whether survey participants would equally define soft and hard skills. This is because it
turned out to be difficult for some participants to distinguish the two types of skills since
types of skills categorized in either group depends on the types of occupation of workers.
Thus, prior to conducting the survey, the explanation of soft and hard skills was introduced to
the participants to make it easier for them to distinguish between the two types of skills.
Employers were asked to answer the same questions about two categories of workers:
technical and support workers. The reason for the division into two categories is that it was
!!!!!!!!!!!!!!!!!!!!!!!!!!!!!!!!!!!!!!!! !!!!!!!!!!!!!!!!!!!!!46 Greg Richens and Clifford McClain, “Workplace Basic Skills for the New Millennium,” Journal of Adult Education; 28, no. 1 (2000): 28.

22
expected that employers would answer differently about different types of workers. The
definitions of each category of worker were given to the survey participants prior to taking
the survey. Technical staff were defined as those who are engineers in technical areas and
supporting staff were defined as those who work in non-technical areas including marketing,
finance, and accounting.
The survey participants were not asked to identify types of occupation, sex, years of
service, SMEs size, or types of ICT business in order to protect their anonymity. This is
because the purpose of this research is to explore general views of employers and workers on
Skills Gap rather than the views of employers and workers within specific SMEs. The
questionnaires are attached to this research as an appendix.
In order to explore which skills employers consider important and whether there are
important Skills Gap at the firm level, first, employers were asked the following questions:
Question on Importance of skills:
Do you think the skills listed below are important for your employees to conduct their work effectively? Please rate each skill with a scale of 1 to 5.
In Section A in Appendix A, this question asked employers to grade each soft skill and hard
skills after identifying by themselves with 1 to 5 scale. The scale was 1) Not important, 2)
Somewhat important, 3) Neither important nor unimportant, 4) Important, 5) Very important.
Employers were also asked to choose the three most important skills from the list comprised
of soft and hard skills mentioned above.
Question on Satisfaction of skills:
How competent do you think your employees are in the skills listed below? Please rate each skill with a scale of 1 to 5. Please rate the following soft and hard skills on the same scaling basis.
The question is from Section B in Appendix A. The scale was 1) Not highly
competent, 2) Not competent, 3) Neither competent/not competent, 4) Competent, 5) Highly

23
competent. Employers were also asked to choose the three skills that they think their
employers (technical and support staff respectively) have the greatest deficiency.
Question on reasons for lack of training for skills: For [SOFT and HARD respectively] skill you identified47, which of the following, if any, prevent you from providing relevant trainings? How impactful are the following for preventing you from providing skill trainings? Please rate your answer on a scale of 1 to 5. Please grade each soft and hard skills on the same scaling basis.
Furthermore, questions on reasons for lack of skills training were asked and seven
potential reasons were provided: financial constraints, time constraints, not enough trainers,
not responsible of the company, lack of motivation among employees, fear of losing workers,
and training has limited impact.
Question on interaction and communication with each group:
Lastly, please answer questions about your general opinion about rapport (relationship, interaction) with your employees. Please grade your answer from scaling 1 to 5.
As detailed in Section B of Appendix A, after employers identify soft and hard skills
which employers are considered to be deficient with, employers were asked to grade the level
of potential obstacles by using 1 to 5 scale. The scale was 1) No impact, 2) Some impact, 3)
Neither impact/nor impact, 4) Impact, 5) Great impact.
In terms of degree of relationship and communication between employers and
workers, the survey had a separate category on general opinion on rapport (relationship,
interaction with employers and workers) and employers and workers were asked to rate their
relationship and level of interaction with each other by using a scale of 1 to 5. The scale was
1) Strongly disagree, 2) Disagree, 3) Neither agree or disagree, 4) Agree, 5) Strongly agree.
!!!!!!!!!!!!!!!!!!!!!!!!!!!!!!!!!!!!!!!! !!!!!!!!!!!!!!!!!!!!!47 They were asked to identify one skill for soft and hard skills respectively that they think their workers are in the greatest deficiency and asked to rate each potential reason for lack of training.

24
VI. Results
In short, the survey found that employers and workers had different views on the
Skills Gap and work environment. In the first part of the survey, employers graded soft and
hard skills listed as equally important. In the second portion, they said that their workers
lacked those skills. Thirdly, the employers identified financial constraints, time constraints
for employers, and not having enough trainers are obstacles to investing in their workers’
skills. In the fourth section of the survey, the workers’ identification of important skills was
similar to their employers’. In the fifth part, however, their rating for competency level of
those skills was higher than that of their employers,’ implying that there is a Skills Gap. In
the final portion of the survey on quality of communication between workers and employers,
workers indicated a higher level of trust and better views of their work environments than
their employers did. Overall, the survey findings support the conclusion that employers
recognize a Skills Gap in their firms but workers do not, indicating better communication is
needed to address Skills Gap and that employers can take advantage of their workers’
positive views of their work environments in order to initiate such communication.
Section 1: Employers’ Views on Importance of Skills for Technical and Support Workers
In order to identify whether there is a Skills Gap at a firm, or in other words whether
employers’ seeka higher level of skills from their workers than their workers currently have
to achieve ideal productivity and growth performance, it is necessary to first identify which
skills employers consider important. This question is particularly important to analyze what
types of skills (soft and hard skills) employers consider important for technical and support
workers. Table 1 illustrates levels of importance for each skill viewed by employers. The first
six skills given to participants to rate are soft skills. As stated earlier, the specific hard skills
are identified by employers, as it is expected that each employer will view the importance of
25
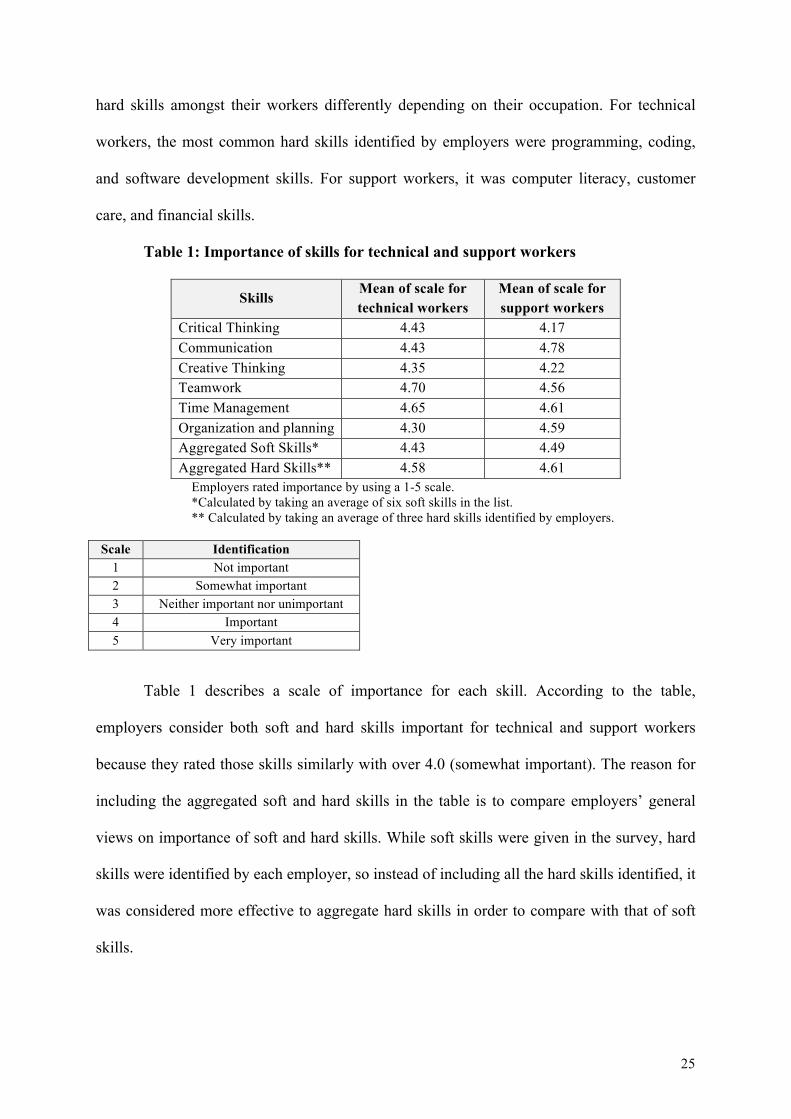
hard skills amongst their workers differently depending on their occupation. For technical
workers, the most common hard skills identified by employers were programming, coding,
and software development skills. For support workers, it was computer literacy, customer
care, and financial skills.
Table 1: Importance of skills for technical and support workers
Skills Mean of scale for technical workers
Mean of scale for support workers
Critical Thinking 4.43 4.17 Communication 4.43 4.78 Creative Thinking 4.35 4.22 Teamwork 4.70 4.56 Time Management 4.65 4.61 Organization and planning 4.30 4.59 Aggregated Soft Skills* 4.43 4.49 Aggregated Hard Skills** 4.58 4.61
Employers rated importance by using a 1-5 scale. *Calculated by taking an average of six soft skills in the list. ** Calculated by taking an average of three hard skills identified by employers.
Scale Identification 1 Not important 2 Somewhat important 3 Neither important nor unimportant 4 Important 5 Very important
Table 1 describes a scale of importance for each skill. According to the table,
employers consider both soft and hard skills important for technical and support workers
because they rated those skills similarly with over 4.0 (somewhat important). The reason for
including the aggregated soft and hard skills in the table is to compare employers’ general
views on importance of soft and hard skills. While soft skills were given in the survey, hard
skills were identified by each employer, so instead of including all the hard skills identified, it
was considered more effective to aggregate hard skills in order to compare with that of soft
skills.

26
Separately, employers were also asked to identify the most important skill for
technical and support workers. Table 2 and 3 below illustrate list of skills that employers
consider the most important for each types of workers. Employers were asked to choose the
three most important skills from soft and hard skills together. The tables show the number of
employers who selected each skill as one of the top three for their workers. The employers
were asked to identify those skills without putting an order of importance.
Table 2: Most important skills for technical workers
Category Skills
Number of employers who
selected skill as top three
Percent of employees choosing
skill as top three
Soft skill
Critical Thinking 10 0.48
Creative Thinking 10 0.48 Teamwork 9 0.43
Communication 7 0.33 Time Management 6 0.29
Organization and planning 6 0.29
Hard skill Hard skill 1 7 0.33 Hard skill 2 5 0.24 Hard skill 3 3 0.14
Table 3: Most important skills for support workers
Category Skills
Number of employers who
selected skill as top three
Percent of employees choosing
skill as top three
Soft skill
Communication 14 0.78 Organization and planning 9 0.50
Time management 7 0.39 Creative Thinking 5 0.28 Critical Thinking 4 0.22
Teamwork 3 0.17
Hard skill Hard skill 1 5 0.28 Hard skill 2 5 0.28 Hard skill 3 2 0.11

27
Table 2 explains that employers consider critical thinking and creative thinking skills
as the most important skills for technical workers. According to Table 3, communication is
most important for support staff. This data supports the fact that soft skills are chosen more
frequently than hard skills, which implies that for both technical and support workers, soft
skills are essential skills for workers.
Sec 2: Employers’ Views on Level of Competency for Technical and Support Workers
The data supports the idea that most of the employers this research surveyed with
believe that there are important skill shortages at their firms as none of the soft and hard skills
identified important by the employers are graded over 4 (competent).
In terms of level of competency, employers rated the current skill level of their
technical and support workers below competent (grade 4) level, according to Table 4. None
of the skills are rated over 4 (competent) for both technical and support workers. Particularly,
employers consider technical workers less equipped with hard skills than soft skills, skills
that employers identified most important for technical workers in the previous questions.
Table 4: Employers’ views on workers’ competence levels in soft and hard skills
Skills Mean of scale for technical workers
Mean of scale for support workers
Critical Thinking 3.40 3.41 Communication 3.35 3.53
Creative Thinking 3.30 3.12 Teamwork 3.70 3.82
Time Management 3.10 3.18 Organization and planning 3.20 3.29
Aggregated Soft Skills* 3.34 3.39 Aggregated Hard Skills** 2.85 3.04
Employers rated competency level of workers by using 1-5 scale. *Calculated by taking an average of six soft skills in the list. ** Calculated by taking an average of three hard skills identified by employers in sec 1 (importance of skills). The same hard skills are used in sec 2 (competency level)
Scale Identification 1 Not highly competent 2 Not competent
28
3 Neither competent nor in
competent 4 Competent 5 Highly competent
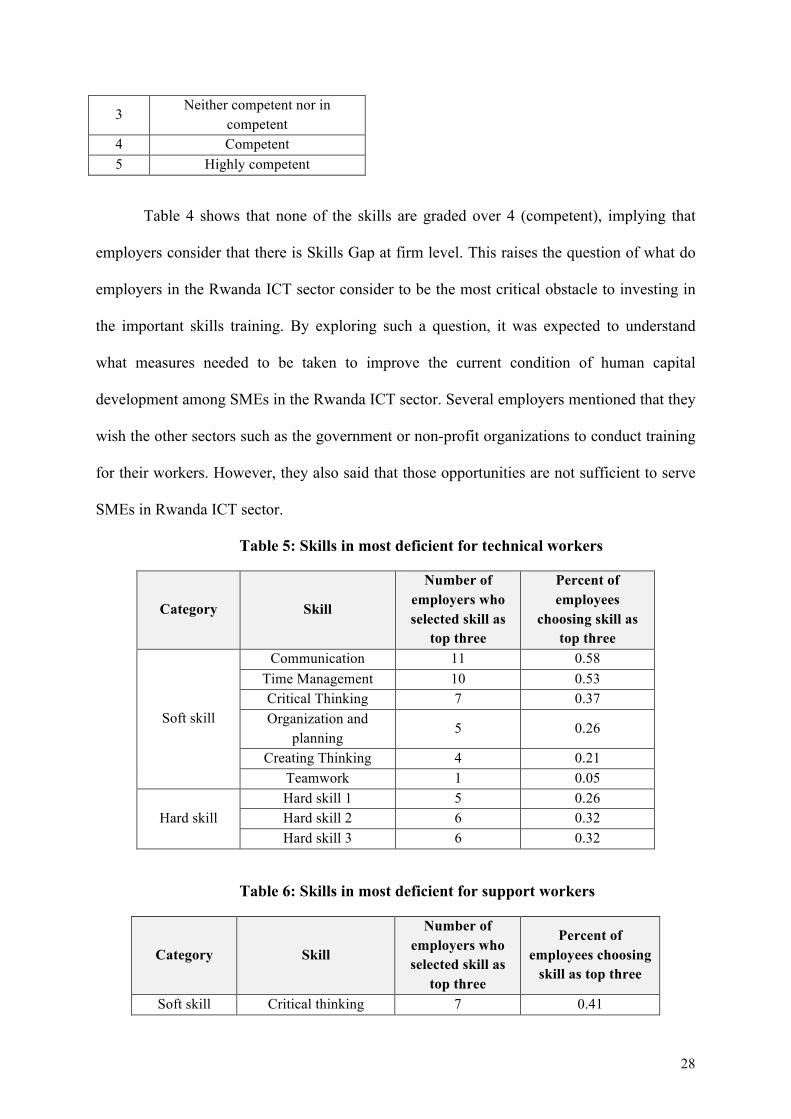
Table 4 shows that none of the skills are graded over 4 (competent), implying that
employers consider that there is Skills Gap at firm level. This raises the question of what do
employers in the Rwanda ICT sector consider to be the most critical obstacle to investing in
the important skills training. By exploring such a question, it was expected to understand
what measures needed to be taken to improve the current condition of human capital
development among SMEs in the Rwanda ICT sector. Several employers mentioned that they
wish the other sectors such as the government or non-profit organizations to conduct training
for their workers. However, they also said that those opportunities are not sufficient to serve
SMEs in Rwanda ICT sector.
Table 5: Skills in most deficient for technical workers
Category Skill
Number of employers who selected skill as
top three
Percent of employees
choosing skill as top three
Soft skill
Communication 11 0.58 Time Management 10 0.53 Critical Thinking 7 0.37 Organization and
planning 5 0.26
Creating Thinking 4 0.21 Teamwork 1 0.05
Hard skill Hard skill 1 5 0.26 Hard skill 2 6 0.32 Hard skill 3 6 0.32
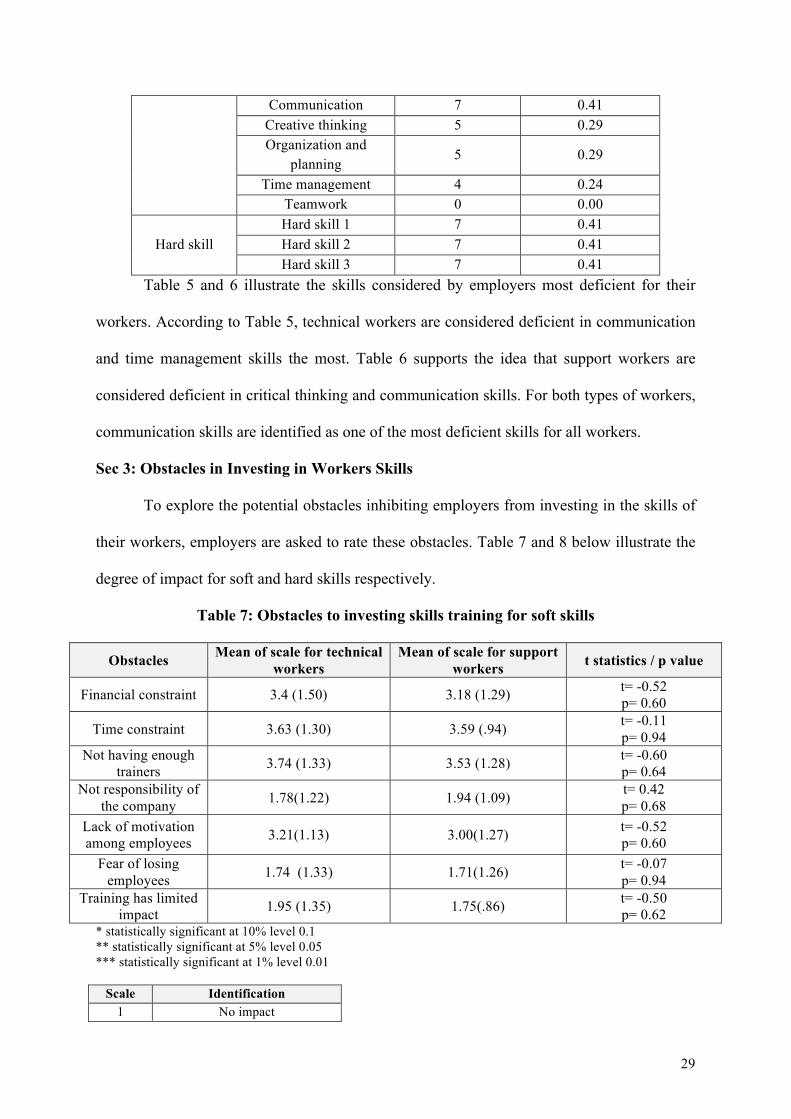
Table 6: Skills in most deficient for support workers
Category Skill
Number of employers who selected skill as
top three
Percent of employees choosing
skill as top three
Soft skill Critical thinking 7 0.41
29
Communication 7 0.41 Creative thinking 5 0.29 Organization and
planning 5 0.29
Time management 4 0.24 Teamwork 0 0.00
Hard skill Hard skill 1 7 0.41 Hard skill 2 7 0.41 Hard skill 3 7 0.41
Table 5 and 6 illustrate the skills considered by employers most deficient for their
workers. According to Table 5, technical workers are considered deficient in communication
and time management skills the most. Table 6 supports the idea that support workers are
considered deficient in critical thinking and communication skills. For both types of workers,
communication skills are identified as one of the most deficient skills for all workers.
Sec 3: Obstacles in Investing in Workers Skills
To explore the potential obstacles inhibiting employers from investing in the skills of
their workers, employers are asked to rate these obstacles. Table 7 and 8 below illustrate the
degree of impact for soft and hard skills respectively.
Table 7: Obstacles to investing skills training for soft skills
Obstacles Mean of scale for technical workers
Mean of scale for support workers t statistics / p value
Financial constraint 3.4 (1.50) 3.18 (1.29) t= -0.52 p= 0.60
Time constraint 3.63 (1.30) 3.59 (.94) t= -0.11 p= 0.94
Not having enough trainers 3.74 (1.33) 3.53 (1.28) t= -0.60
p= 0.64 Not responsibility of
the company 1.78(1.22) 1.94 (1.09) t= 0.42 p= 0.68
Lack of motivation among employees 3.21(1.13) 3.00(1.27) t= -0.52
p= 0.60 Fear of losing
employees 1.74 (1.33) 1.71(1.26) t= -0.07 p= 0.94
Training has limited impact 1.95 (1.35) 1.75(.86) t= -0.50
p= 0.62 * statistically significant at 10% level 0.1 ** statistically significant at 5% level 0.05 *** statistically significant at 1% level 0.01
Scale Identification 1 No impact
30
2 Somewhat impact 3 Neither impact nor impact 4 Impact 5 Greatly impact
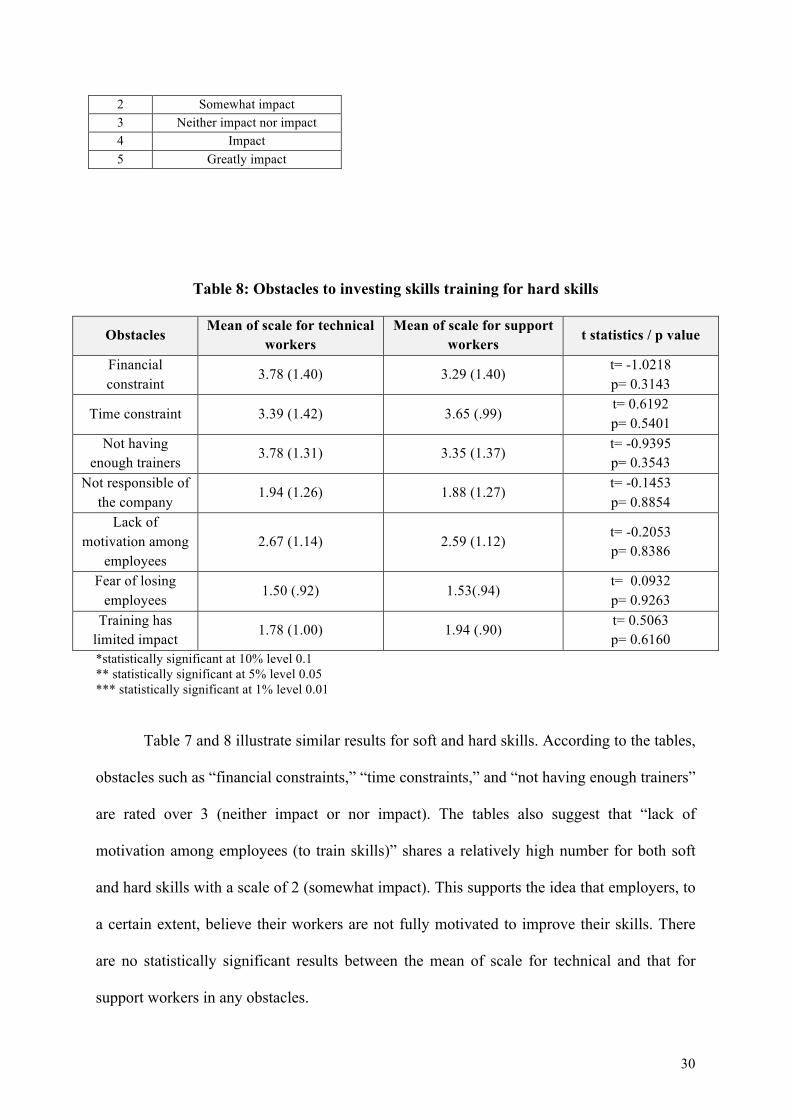
Table 8: Obstacles to investing skills training for hard skills
Obstacles Mean of scale for technical
workers Mean of scale for support
workers t statistics / p value
Financial constraint
3.78 (1.40) 3.29 (1.40) t= -1.0218 p= 0.3143
Time constraint 3.39 (1.42) 3.65 (.99) t= 0.6192 p= 0.5401
Not having enough trainers
3.78 (1.31) 3.35 (1.37) t= -0.9395 p= 0.3543
Not responsible of the company
1.94 (1.26) 1.88 (1.27) t= -0.1453 p= 0.8854
Lack of motivation among
employees 2.67 (1.14) 2.59 (1.12)
t= -0.2053 p= 0.8386
Fear of losing employees
1.50 (.92) 1.53(.94) t= 0.0932 p= 0.9263
Training has limited impact
1.78 (1.00) 1.94 (.90) t= 0.5063 p= 0.6160
*statistically significant at 10% level 0.1 ** statistically significant at 5% level 0.05 *** statistically significant at 1% level 0.01
Table 7 and 8 illustrate similar results for soft and hard skills. According to the tables,
obstacles such as “financial constraints,” “time constraints,” and “not having enough trainers”
are rated over 3 (neither impact or nor impact). The tables also suggest that “lack of
motivation among employees (to train skills)” shares a relatively high number for both soft
and hard skills with a scale of 2 (somewhat impact). This supports the idea that employers, to
a certain extent, believe their workers are not fully motivated to improve their skills. There
are no statistically significant results between the mean of scale for technical and that for
support workers in any obstacles.

31
Sec 4: Workers’ Views on Importance of Skills
Given that the employers surveyed believe their employees were not satisfied with
their employees’ skill levels, it is essential to explore the views of workers on skill gaps and
whether there is any difference in views between employers and workers. Workers are asked
to rate the level of importance of each skill for their occupation. As stated earlier, since most
of the workers who participated in the survey are technical workers, this analysis considers
data from technical workers.
Table 9: Comparison between employers’ and workers’ views on importance of skills
Skills
Mean of scale for employers
Mean of scale for workers
t statistics / p-value
Critical Thinking 4.43 (0.87)* 4.74 (.587)* t = 1.9509 p= 0.0539
Communication 4.43 (.746)* 4.71 (.577)* t = 1.8552 p= 0.0665
Creative Thinking 4.35 (.813) 4.51 (.724) t = 0.8767 p= 0.3828
Teamwork 4.70 (.470) 4.78 (.472) t = 0.6842 p= 0.4954
Time Management 4.65 (.489) 4.73 (.548) t = 0.5844 p= 0.5603
Organizational and planning skill
4.30 (.657)** 4.63 (.601)** t = 2.1568 p= 0.0334
Aggregated Soft Skills 4.43 (.490)*** 4.68 (.358)*** t = 2.7024 p= 0.0081
Aggregated Hard Skills 4.58 (.322) 4.63 (.382) t = 0.4765 p= 0.6348
*statistically significant at 10% level 0.1 ** statistically significant at 5% level 0.05 *** statistically significant at 1% level 0.01 Scale Identification
1 Not important 2 Somewhat important
3 Neither important nor
unimportant 4 Important 5 Very important
32
The question for employee to grade importance of each skill is based on Section A of
Appendix B. Table 9 suggests that, like employers, workers also consider soft and hard skills
important for their occupation. Among soft skills, both employers and workers consider
teamwork and time management skills important. Table 9 suggests that, except organization
and planning skills and aggregated soft skills, there are no significant gaps in views between
employers and workers with regards to importance of skills. This implies that they have the
similar understanding of what skills are important for (technical) workers. It is assumed that
the aggregated soft skills has a statistically significant result at 1 percent level while each soft
skill does not show any significance because various soft skill measures do not co-vary very
strongly.
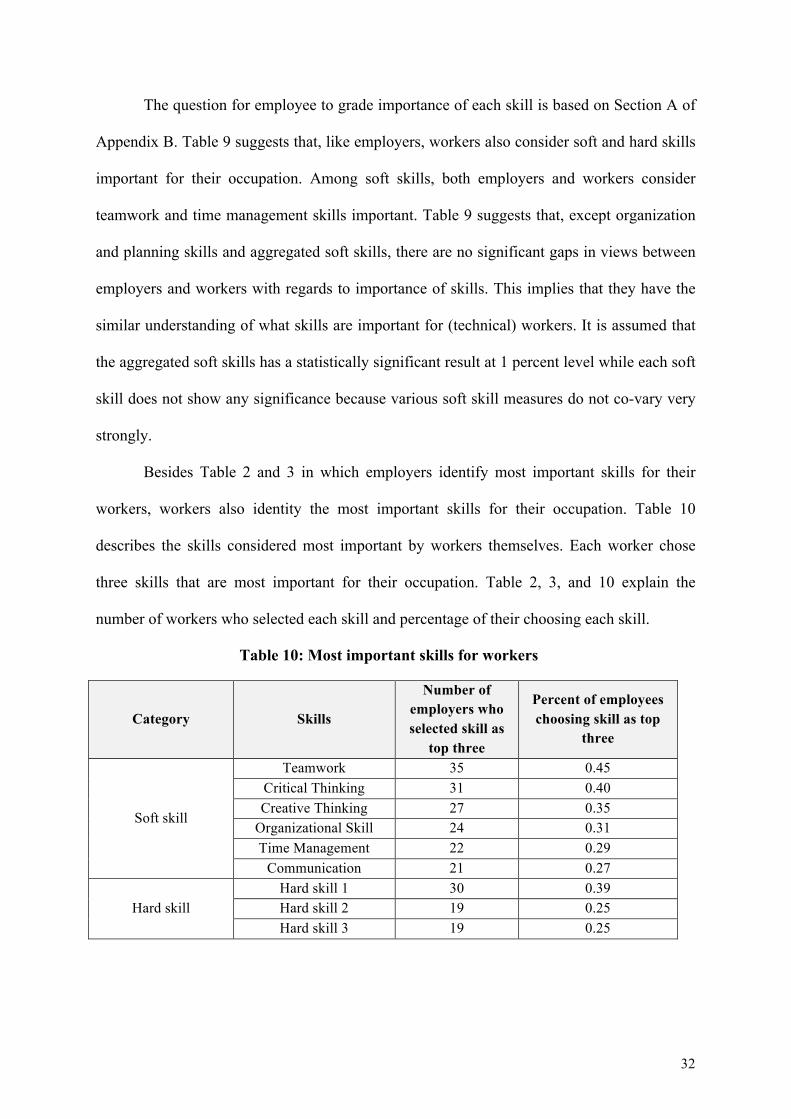
Besides Table 2 and 3 in which employers identify most important skills for their
workers, workers also identity the most important skills for their occupation. Table 10
describes the skills considered most important by workers themselves. Each worker chose
three skills that are most important for their occupation. Table 2, 3, and 10 explain the
number of workers who selected each skill and percentage of their choosing each skill.
Table 10: Most important skills for workers
Category Skills
Number of employers who selected skill as
top three
Percent of employees choosing skill as top
three
Soft skill
Teamwork 35 0.45 Critical Thinking 31 0.40 Creative Thinking 27 0.35
Organizational Skill 24 0.31 Time Management 22 0.29
Communication 21 0.27
Hard skill Hard skill 1 30 0.39 Hard skill 2 19 0.25 Hard skill 3 19 0.25

33
Among soft skills, teamwork, critical thinking, and creative thinking skills are the top
three important skills considered by technical workers. According to Table 2 and 3,
employers also rated critical thinking and creative thinking high for technical workers.
According to Table 2, 3, 10, it seems that employers and workers consider soft skills more
important than hard skills. Again, this suggests that views of employers and technical
workers are similar in terms of important skills.
Sec 5: Workers’ Views on Level of Competency
As seen in the data of employers in terms of skill competency level, employers
identify the current skill level of workers as below a competent level (scale 4). In order to
understand whether workers recognize the existence of a skill gap, it is essential to explore
the views of workers on their own level of competency for each skill.
Table 11: Comparison between employers’ and workers’ views on competency level of skills
Skills
Mean of scale for employers
Mean of scale for workers
t statistics / p value
Critical Thinking 3.40 (.995)*** 4.25 (.734)*** t = 4.29 p= 0.00
Communication 3.35 (.813)*** 4.10 (.752)*** t = 3.93 p= 0.00
Creative Thinking
3.30 (.979)*** 4.19 (.792)*** t = 4.26 p= 0.00
Teamwork 3.70 (1.03)*** 4.59 (.565)*** t = 5.26 p= 0.00
Time Management
3.10 (1.02)*** 4.25 (.783)*** t = 5.51 p= 0.00
Organizational Skill
3.20 (1.06)*** 4.22 (.725)*** t = 5.12 p= 0.00
Aggregated Soft Skills
3.34 (.769)*** 4.27 (.464)*** t = 6.90 p= 0.00
Aggregated Hard Skills
2.85 (.887)* 3.31 (1.05)* t = 1.74 p= 0.09
*statistically significant at 10% level 0.1 ** statistically significant at 5% level 0.05 *** statistically significant at 1% level 0.01
Scale Identification 1 Not highly competent
34
2 Not competent
3 Neither competent/not
competent 4 Competent 5 Highly competent
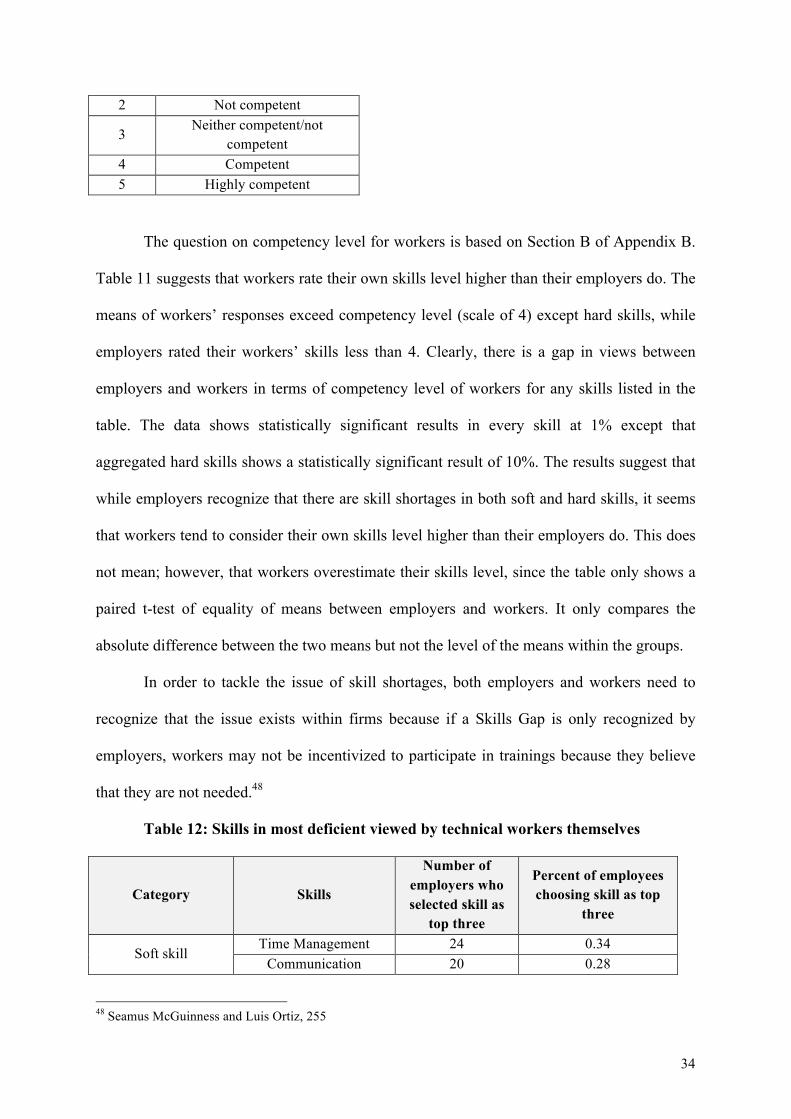
The question on competency level for workers is based on Section B of Appendix B.
Table 11 suggests that workers rate their own skills level higher than their employers do. The
means of workers’ responses exceed competency level (scale of 4) except hard skills, while
employers rated their workers’ skills less than 4. Clearly, there is a gap in views between
employers and workers in terms of competency level of workers for any skills listed in the
table. The data shows statistically significant results in every skill at 1% except that
aggregated hard skills shows a statistically significant result of 10%. The results suggest that
while employers recognize that there are skill shortages in both soft and hard skills, it seems
that workers tend to consider their own skills level higher than their employers do. This does
not mean; however, that workers overestimate their skills level, since the table only shows a
paired t-test of equality of means between employers and workers. It only compares the
absolute difference between the two means but not the level of the means within the groups.
In order to tackle the issue of skill shortages, both employers and workers need to
recognize that the issue exists within firms because if a Skills Gap is only recognized by
employers, workers may not be incentivized to participate in trainings because they believe
that they are not needed.48
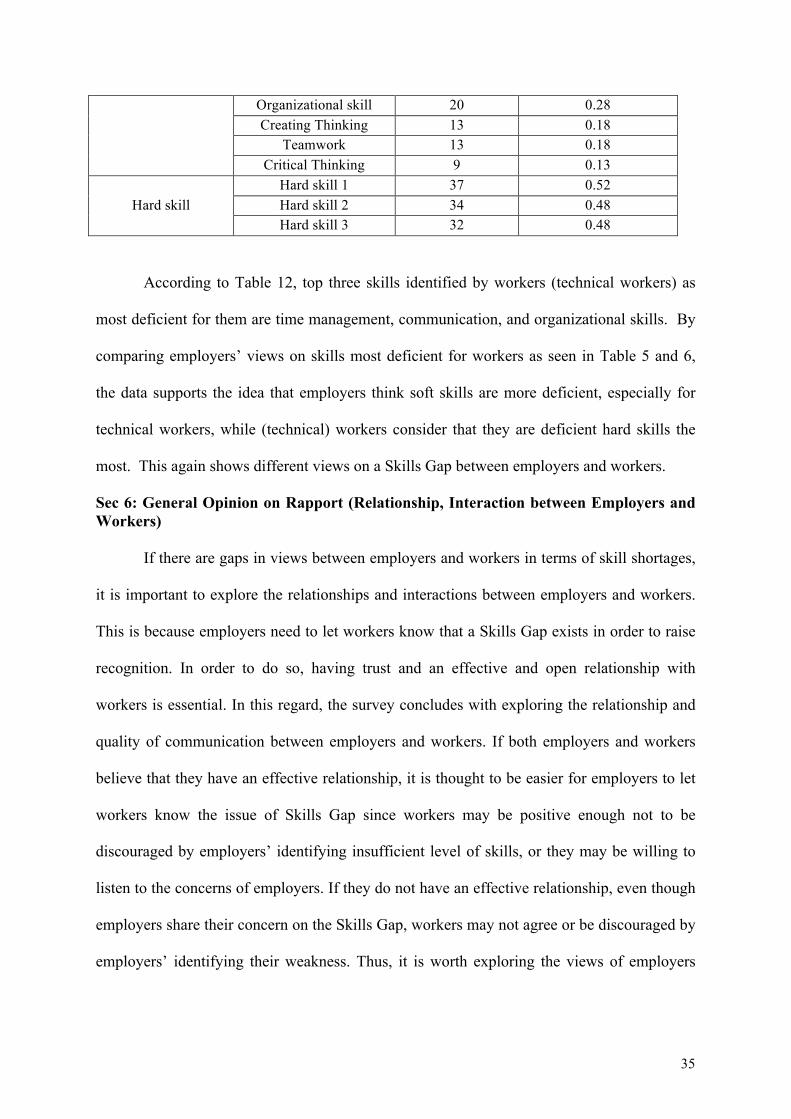
Table 12: Skills in most deficient viewed by technical workers themselves
Category Skills
Number of employers who selected skill as
top three
Percent of employees choosing skill as top
three
Soft skill Time Management 24 0.34
Communication 20 0.28
!!!!!!!!!!!!!!!!!!!!!!!!!!!!!!!!!!!!!!!! !!!!!!!!!!!!!!!!!!!!!48 Seamus McGuinness and Luis Ortiz, 255
35
Organizational skill 20 0.28 Creating Thinking 13 0.18
Teamwork 13 0.18 Critical Thinking 9 0.13
Hard skill Hard skill 1 37 0.52 Hard skill 2 34 0.48 Hard skill 3 32 0.48
According to Table 12, top three skills identified by workers (technical workers) as
most deficient for them are time management, communication, and organizational skills. By
comparing employers’ views on skills most deficient for workers as seen in Table 5 and 6,
the data supports the idea that employers think soft skills are more deficient, especially for
technical workers, while (technical) workers consider that they are deficient hard skills the
most. This again shows different views on a Skills Gap between employers and workers.
Sec 6: General Opinion on Rapport (Relationship, Interaction between Employers and Workers)
If there are gaps in views between employers and workers in terms of skill shortages,
it is important to explore the relationships and interactions between employers and workers.
This is because employers need to let workers know that a Skills Gap exists in order to raise
recognition. In order to do so, having trust and an effective and open relationship with
workers is essential. In this regard, the survey concludes with exploring the relationship and
quality of communication between employers and workers. If both employers and workers
believe that they have an effective relationship, it is thought to be easier for employers to let
workers know the issue of Skills Gap since workers may be positive enough not to be
discouraged by employers’ identifying insufficient level of skills, or they may be willing to
listen to the concerns of employers. If they do not have an effective relationship, even though
employers share their concern on the Skills Gap, workers may not agree or be discouraged by
employers’ identifying their weakness. Thus, it is worth exploring the views of employers
36
and workers on the degree of the relationship and the quality of communication both have
towards each other.
Given that there are gaps in the views of both employers and workers in terms of
Skills Gap, it is important to understand the degree of communication between employers
and workers since effective communication is thought to be a driving factor for reducing the
Skills Gap at firm level. By asking questions related to employer-worker relationships and
interaction, this research measures how employers and workers view the relationships they
have with each other.
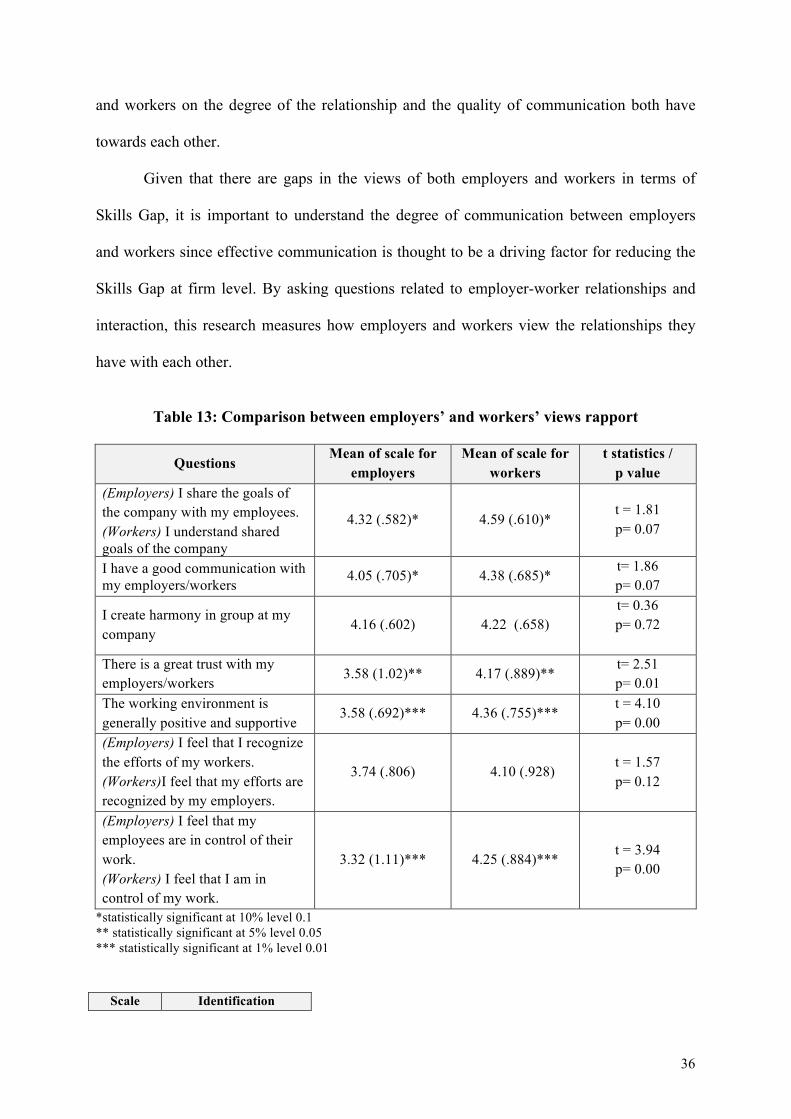
Table 13: Comparison between employers’ and workers’ views rapport
Questions Mean of scale for
employers Mean of scale for
workers t statistics /
p value (Employers) I share the goals of the company with my employees. (Workers) I understand shared goals of the company
4.32 (.582)* 4.59 (.610)* t = 1.81 p= 0.07
I have a good communication with my employers/workers
4.05 (.705)* 4.38 (.685)* t= 1.86 p= 0.07
I create harmony in group at my company
4.16 (.602) 4.22 (.658) t= 0.36 p= 0.72
There is a great trust with my employers/workers
3.58 (1.02)** 4.17 (.889)** t= 2.51 p= 0.01
The working environment is generally positive and supportive
3.58 (.692)*** 4.36 (.755)*** t = 4.10 p= 0.00
(Employers) I feel that I recognize the efforts of my workers. (Workers)I feel that my efforts are recognized by my employers.
3.74 (.806) 4.10 (.928) t = 1.57 p= 0.12
(Employers) I feel that my employees are in control of their work. (Workers) I feel that I am in control of my work.
3.32 (1.11)*** 4.25 (.884)*** t = 3.94 p= 0.00
*statistically significant at 10% level 0.1 ** statistically significant at 5% level 0.05 *** statistically significant at 1% level 0.01
Scale Identification

37
1 Strongly disagree 2 Disagree
3 Neither agree or
disagree 4 Agree 5 Strongly agree
Table 13 illustrates that for every question related to relationship and the quality of
communication, workers gave higher ratings than employers. For instance, questions in
which gaps between employers and workers are widely seen are those focused on trust and
working environment. The question related to “trust” asks employers and workers how much
trust they think there is with the other group. While the mean of employers’ responses is 3.58,
the mean of employees is 4.17, which is statistically significant at the 5% level. This implies
that workers believe there is higher trust than what employers believe. The question on
“working environment” asks the two groups on how much their working environment they
think is positive and supportive for them to work. Employers graded 3.58, while workers
graded 4.36, which is statistically significant at the 1% level. This also suggests that workers
tend to hold their work environment in higher regard than their employers do.
According to the data, since workers tend to believe that they have built trust with
their employers and they are positive about their work environment, it is advised that
employers should utilize these positive factors to reduce Skills Gap within firms. Reducing
Skills Gap requires effective communication between employers and workers, and if workers
think positively about their relationship with employers and work environment, this may
enable employers to share their concerns effectively.
VII. Implications
While the data were obtained from the small sample, the results are open to different
interpretation. One possible implication for employers is that they need not hesitate to tell

38
their workers that a Skills Gap exists in their firm, since the data provided by the survey
supports the idea that workers tend to have a positive impression on their working
environment and trust their employers. Thus, employers should utilize these positive factors
derived from their workers to alleviate the Skills Gap within firms. An implication for
workers is that they tend to consider their competency of skills more highly than their
employers. Thus, workers should make sure at what level their current skills are by taking
their employers’ views into consideration.
As for theoretical implication, as previous studies suggest that building proper
institutions and ecosystems are essential for SMEs growth, which can be tackled by
policymakers. This study adds to those studies by suggesting the importance of tackling the
issue of Skills Gaps within firms through communication channels. It is not only policy
makers but also SMEs themselves can strive to improve human capital and thus to increase
growth of firms. Since there are not sufficient studies with focus on internal measurements
taken by SMEs themselves to improve human capital, this study attempts to provide a new
perspective based on the case study conducted in Rwanda ICT sector.
VIII. Research Limitations and Future Research
This research is based on a field survey in the Rwanda ICT sector. One of the things
that were difficult in conducting the field survey was to maintain the same level of
interpretation on survey questions from survey participants. This was especially difficult in
terms of translating the definition of soft and hard skills. For instance, when soft skills were
given to the participants, they were asked to identify the hard skills that they thought were
important for their workers. Types of hard skills identified by employers and workers ranged
from programming to editing skills, thus, categorizing various skills into “hard skills” might
have caused the definition of hard skills in this research to be too broad. However, this

39
research emphasized the importance of soft skills compared to hard skills by classifying skills
into the two categories. Future research can analyze various skills not only by the two
categories but also by more detailed categories of skills (e.g. listening-based skills, writing-
based skills, or thinking-based skills).
Furthermore, this research categorized workers into separate categories of technical
and support workers, which was difficult for some employers. This is because some workers
had several positions or roles in the company, and thus they could be categorized as both
technical and support workers. Future research could narrow down target firms which have a
commonality in size and service areas or in participants who have the same years of service
within firms.
IX. Conclusion
Motivated by my personal observations on concerns related to skills development
shared by employers and workers in SMEs in Rwanda, this research explored the views on a
Skills Gap between employers and workers based on my case study of the Rwanda ICT
sector. Based on the idea that Skills Gap reflects the existence of obstacles to improved
productivity and growth the research was conducted to analyze whether a Skills Gap exist in
the SMEs of the Rwanda ICT sector and whether there is a difference in views on Skills Gap
between employers and workers at the firm level. The study confirmed that employers
believe there is Skills Gap, but there was a difference in how employers and workers
recognized this gap. The Skills Gap needs to be recognized not only by employers but also by
workers since recognition by workers would enable the firm to tackle the issue of Skills Gap
effectively. In order to do so, proper communication channels between employers and
workers are essential to reducing Skills Gap within firms by raising awareness among
workers.

40
The most critical potential obstacles towards investing in skill trainings identified by
employers are a lack of finances, time constraints of employers, lack of qualified trainers, and
lack of motivation from workers. While employers consider all the soft skills and hard skills
listed as important, workers also viewed those skills are important for themselves. However,
in terms of competency, while employers believe that their workers are not equipped with the
soft and hard skills listed, workers identify all the skills listed with a higher competency
level. This supports the idea that workers tend to consider their skill levels higher than their
employers consider it, while employers identify a Skills Gap within their firms.
The study also supports the idea that workers tend to consider the degree of
relationship and the quality of communication with employers more highly than employers.
Workers also tend to be more positive about their work environment than employers and
seem to believe that workers have more trust with employers than employers believe. Since
workers are considered to be positive about work environment and appear to trust their
employers, employers should not hesitate to identify the lack of skills each worker has.
Though this remain to be an assumption, having trust and positive feelings towards work may
enable employers to communicate with their workers more smoothly while sharing their
concerns including those related to Skills Gap.
Many SME employers from the Rwanda ICT sector I interviewed mentioned that they
wish their workers would improve their skills with training, which is very difficult for these
SMEs to secure, due to the cost of providing training.49 Based on the survey result and
conversations with SMEs employers, they mentioned the importance of having proper soft
skills in addition to hard skills. There is currently no systematic training program on soft
skills for Rwanda’s ICT sector. At a practical level, the Government of Rwanda could put
!!!!!!!!!!!!!!!!!!!!!!!!!!!!!!!!!!!!!!!! !!!!!!!!!!!!!!!!!!!!!49 Interviews with employers from the Rwanda ICT Sector, January 6 – 15, 2016.

41
more thoughts into policies to promote soft skills development for SMEs in Rwanda’s ICT
sector to reduce the Skills Gap.
However, prior to providing training, it is advised that both employers and workers
need to recognize Skills Gap in order to utilize trainings effectively because tackling the issue
of Skills Gap from both sides would maximize training opportunity. Recognizing Skills Gap
at firm level is the first step towards improving human capital development, and this is a
fundamental to the growth of SMEs of the Rwanda ICT sector. The case study of the Rwanda
ICT sector indicates that one of the ways in which SMEs of the sector can tackle the issue of
the Skills Gap in order to promote business competitiveness and productivity led by human
capital. It also suggests that to raise awareness toward the issue of Skills Gap, both employers
and workers need to encourage communication between the two groups by utilizing the
positive perspectives of workers toward employers and companies as a whole. Finally, the
government should seek to provide skills training on soft skills that are recognized as
important skills both by employers and employees in Rwanda’s ICT sector to reduce the
Skills Gap for the growth and development of the country.
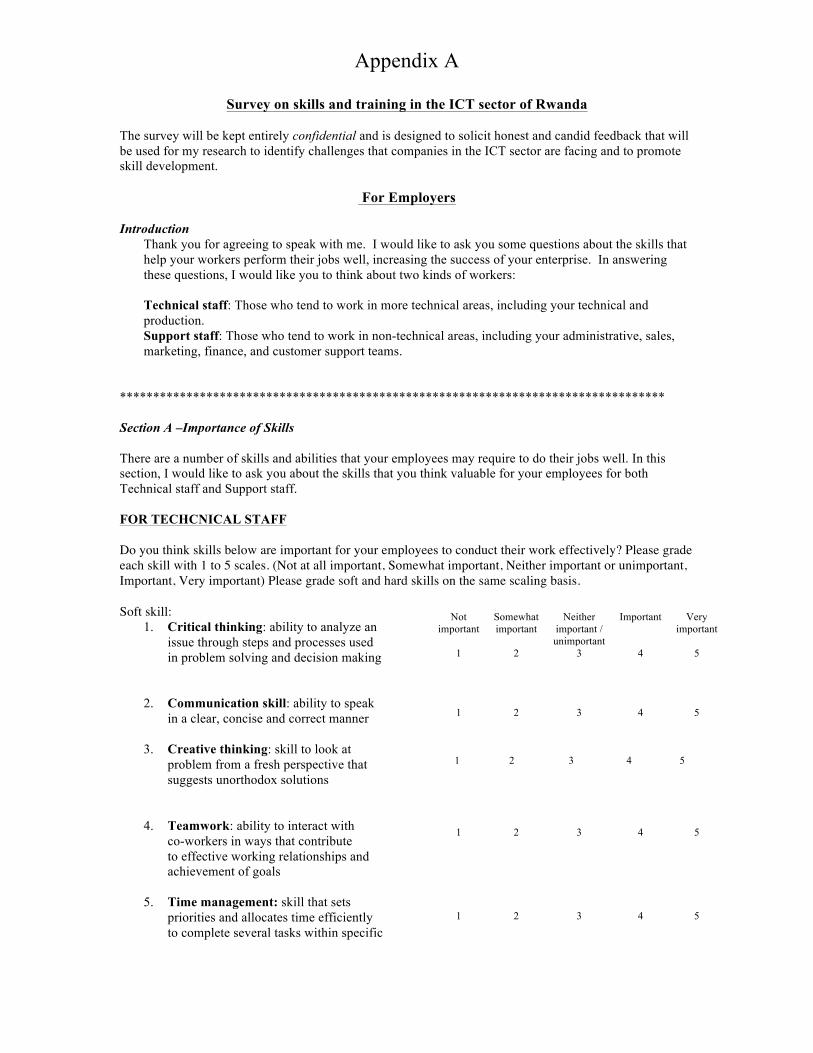
Appendix A
Survey on skills and training in the ICT sector of Rwanda The survey will be kept entirely confidential and is designed to solicit honest and candid feedback that will be used for my research to identify challenges that companies in the ICT sector are facing and to promote skill development.
For Employers Introduction
Thank you for agreeing to speak with me. I would like to ask you some questions about the skills that help your workers perform their jobs well, increasing the success of your enterprise. In answering these questions, I would like you to think about two kinds of workers: Technical staff: Those who tend to work in more technical areas, including your technical and production. Support staff: Those who tend to work in non-technical areas, including your administrative, sales, marketing, finance, and customer support teams.
**********************************************************************************
Section A –Importance of Skills There are a number of skills and abilities that your employees may require to do their jobs well. In this section, I would like to ask you about the skills that you think valuable for your employees for both Technical staff and Support staff. FOR TECHCNICAL STAFF Do you think skills below are important for your employees to conduct their work effectively? Please grade each skill with 1 to 5 scales. (Not at all important, Somewhat important, Neither important or unimportant, Important, Very important) Please grade soft and hard skills on the same scaling basis. Soft skill:
1. Critical thinking: ability to analyze an issue through steps and processes used in problem solving and decision making
2. Communication skill: ability to speak in a clear, concise and correct manner
3. Creative thinking: skill to look at
problem from a fresh perspective that suggests unorthodox solutions
4. Teamwork: ability to interact with co-workers in ways that contribute to effective working relationships and achievement of goals
5. Time management: skill that sets
priorities and allocates time efficiently to complete several tasks within specific
Not important
Somewhat important
Neither important / unimportant
Important Very important
1 2 3 4 5
1 2 3 4 5
1 2 3 4 5
1 2 3 4 5
1 2 3 4 5

Appendix A
deadlines
6. Organization and planning: ability to manage time effectively, accomplish day-to-day tasks using orderly approach
7. Others (Specify skill): ________________________
Hard skill: Please fill out three important hard skills for your employers (Technical workers). As you did in the previous section for soft skills, please indicate the importance of each hard skill with 1 to 5 scales.
1. Specify a hard skill
____________________
2. Specify a hard skill ____________________
3. Specify a hard skill
____________________ Among above soft ad hard skills, please select THREE skills from soft and hard skills above that you think is the most critical to your Technical staff. Skill 1: Skill 2: Skill 3: FOR SUPPORT STAFF Do you think skills below are important for your support staffs to conduct their work effectively? Please grade each skill with 1 to 5 scales. (Not at all important, Somewhat important, Neither important or unimportant, Important, Very important) Please grade soft and hard skills on the same scaling basis. Soft skill:
1. Critical thinking: ability to analyze an issue through steps and processes used in problem solving and decision making
2. Communication skill: ability to speak in a clear, concise and correct manner
3. Creative thinking: skill to look at
problem from a fresh perspective that suggests unorthodox solutions
1 2 3 4 5
1 2 3 4 5
Not important
Somewhat important
Neither important / unimportant
Important Very important
1 2 3 4 5
1 2 3 4 5
1 2 3 4 5
Not important
Somewhat important
Neither important / unimportant
Important Very important
1 2 3 4 5
1 2 3 4 5
1 2 3 4 5
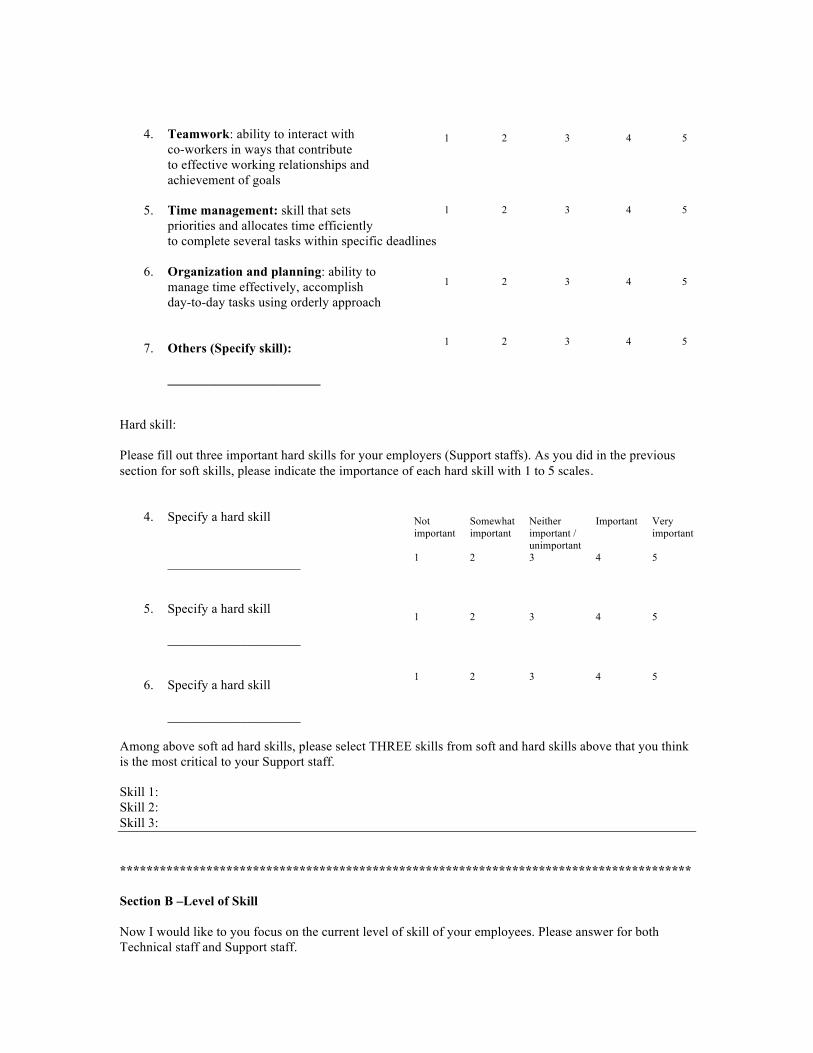
4. Teamwork: ability to interact with co-workers in ways that contribute to effective working relationships and achievement of goals
5. Time management: skill that sets
priorities and allocates time efficiently to complete several tasks within specific deadlines
6. Organization and planning: ability to manage time effectively, accomplish day-to-day tasks using orderly approach
7. Others (Specify skill): _______________________
Hard skill: Please fill out three important hard skills for your employers (Support staffs). As you did in the previous section for soft skills, please indicate the importance of each hard skill with 1 to 5 scales.
4. Specify a hard skill
____________________
5. Specify a hard skill
____________________
6. Specify a hard skill
____________________ Among above soft ad hard skills, please select THREE skills from soft and hard skills above that you think is the most critical to your Support staff. Skill 1: Skill 2: Skill 3: ************************************************************************************** Section B –Level of Skill
Now I would like to you focus on the current level of skill of your employees. Please answer for both Technical staff and Support staff.
1 2 3 4 5
1 2 3 4 5
Not important
Somewhat important
Neither important / unimportant
Important Very important
1 2 3 4 5
1 2 3 4 5
1 2 3 4 5
1 2 3 4 5
1 2 3 4 5

Appendix A
TECHNICAL STAFF How do you think your technical staffs are competent for skills below? Please grade each skill with 1 to 5 scales. (Highly competent, competent, neither competent or not competent, not competent, not highly competent) Please grade soft and hard skills on the same scaling basis. Soft skill:
1. Critical thinking: ability to analyze an issue through steps and processes used in problem solving and decision making
2. Communication skill: ability to speak in a clear, concise and correct manner
3. Creative thinking: skill to look at problem from a fresh perspective that suggests unorthodox solutions
4. Teamwork: ability to interact with
co-workers in ways that contribute to effective working relationships and achievement of goals
5. Time management: skill that sets
priorities and allocates time efficiently to complete several tasks within specific deadlines
6. Organization and planning: ability to manage time effectively, accomplish day-to-day tasks using orderly approach
7. Others (specify):_________________________
Hard skill: Please identify three hard skills that your Technical staff are not competent enough. Please grade each skill with 1 to 5 scales to identify two hard skills that your employees (Technical staff) are not competent. (Highly competent, competent, neither competent or not competent, not competent, not highly competent) Please grade soft and hard skills on the same scaling basis.
1. Specify a hard skill _______________
2. Specify a hard skill________________
3. Specify a hard skill________________
Please identify one soft skill and one hard skill that your employees from Technical staff are in the greatest deficiency from the skills above.
Not highly
competent
Not competent
Neither competent/not
competent
Competent Highly competent
1 2 3 4 5
1 2 3 4 5
1 2 3 4 5
1 2 3 4 5
1 2 3 4 5
1 2 3 4 5
1 2 3 4 5
1 2 3 4 5
1 2 3 4 5
Not highly
competent
Not competent
Neither competent/not
competent
Competent Highly competent
1 2 3 4 5
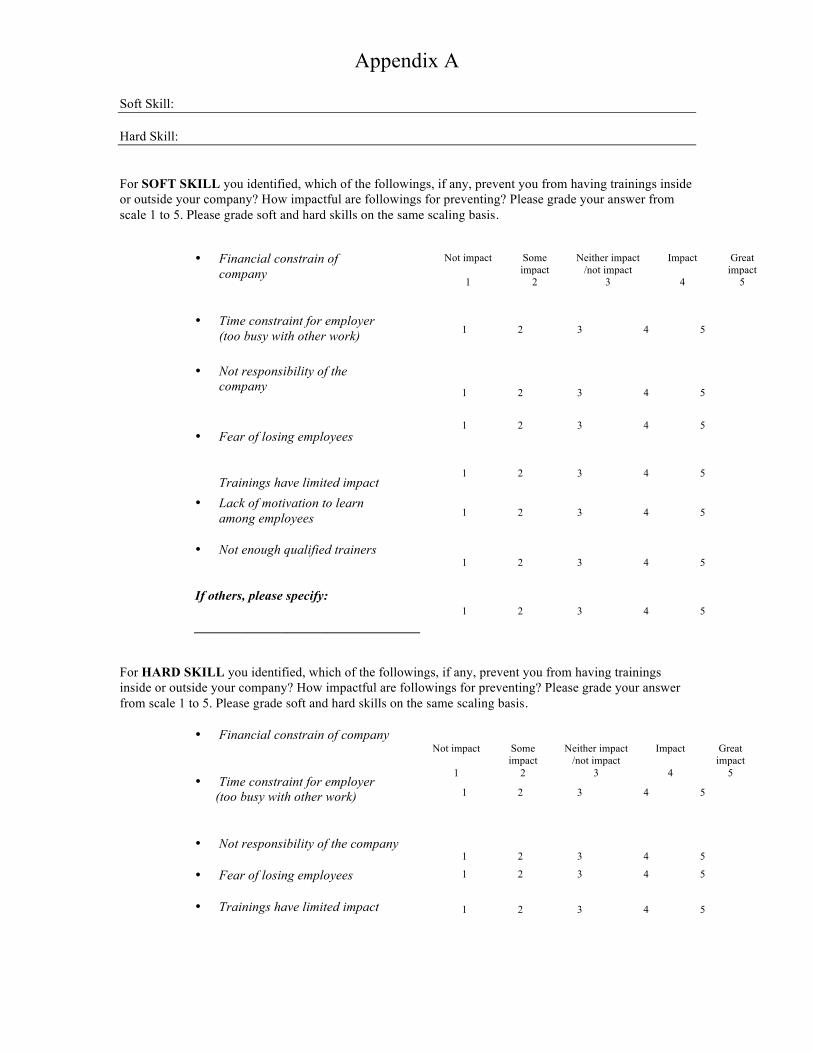
Appendix A
Soft Skill: Hard Skill: For SOFT SKILL you identified, which of the followings, if any, prevent you from having trainings inside or outside your company? How impactful are followings for preventing? Please grade your answer from scale 1 to 5. Please grade soft and hard skills on the same scaling basis.
• Financial constrain of
company
• Time constraint for employer
(too busy with other work) !
• Not responsibility of the company
!
• Fear of losing employees
Trainings have limited impact!
• Lack of motivation to learn
among employees
• Not enough qualified trainers
If others, please specify: __________________________________
For HARD SKILL you identified, which of the followings, if any, prevent you from having trainings inside or outside your company? How impactful are followings for preventing? Please grade your answer from scale 1 to 5. Please grade soft and hard skills on the same scaling basis.
• Financial constrain of company
• Time constraint for employer
(too busy with other work)
• Not responsibility of the company
• Fear of losing employees
• Trainings have limited impact
1 2 3 4 5
Not impact Some impact
Neither impact /not impact
Impact Great impact
1 2 3 4 5
1 2 3 4 5
1 2 3 4 5
1 2 3 4 5
1 2 3 4 5
1 2 3 4 5
1 2 3 4 5
Not impact Some impact
Neither impact /not impact
Impact Great impact
1 2 3 4 5
1 2 3 4 5
1 2 3 4 5
1 2 3 4 5
1 2 3 4 5
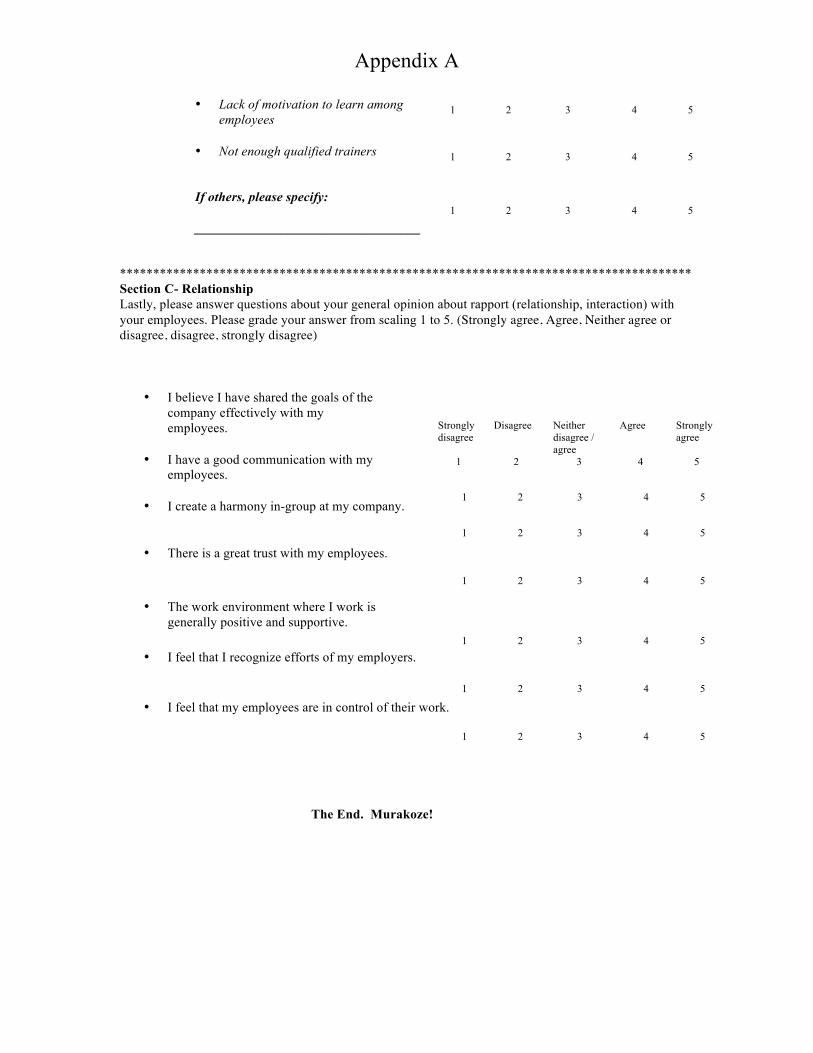
Appendix A
• Lack of motivation to learn among employees
• Not enough qualified trainers
If others, please specify: __________________________________
**************************************************************************************Section C- Relationship Lastly, please answer questions about your general opinion about rapport (relationship, interaction) with your employees. Please grade your answer from scaling 1 to 5. (Strongly agree, Agree, Neither agree or disagree, disagree, strongly disagree)
• I believe I have shared the goals of the company effectively with my employees.
• I have a good communication with my
employees.
• I create a harmony in-group at my company.
• There is a great trust with my employees. !
!• The work environment where I work is
generally positive and supportive. !
• I feel that I recognize efforts of my employers.
!• I feel that my employees are in control of their work.
The End. Murakoze!
1 2 3 4 5
1 2 3 4 5
Strongly disagree
Disagree Neither disagree / agree
Agree Strongly agree
1 2 3 4 5
1 2 3 4 5
1 2 3 4 5
1 2 3 4 5
1 2 3 4 5
1 2 3 4 5
1 2 3 4 5
1 2 3 4 5

Appendix B
Survey on skills and training in the ICT sector of Rwanda The survey will be kept entirely confidential and is designed to solicit honest and candid feedback that will be used for my research to identify challenges that companies in the ICT sector are facing and to promote skill development.
For Employees Introduction Thank you for agreeing to speak with me. I would like to ask you some questions about the skills that help you perform their jobs well, increasing the success of your enterprise.
**********************************************************************************
Section A –Importance of Skills There are a number of skills and abilities that you may be required to do your jobs well. In this section, I would like to ask you about the skills that you think valuable for you. Do you think skills below are important for you to conduct their work effectively? Please grade each skill with 1 to 5 scales. (Very important, Important, Neither important nor unimportant, Somewhat important, Not at all important) Please grade soft and hard skills on the same scaling basis. Soft skill:
1. Critical thinking: ability to analyze an issue through steps and processes used in problem solving and decision making
2. Communication skill: ability to speak in a clear, concise and correct manner
3. Creative thinking: skill to look at
problem from a fresh perspective that suggests unorthodox solutions
4. Teamwork: ability to interact with co-workers in ways that contribute to effective working relationships and achievement of goals
5. Time management: skill that sets
priorities and allocates time efficiently to complete several tasks within specific deadlines
6. Organization and planning: ability to
manage time effectively, accomplish day-to-day tasks using orderly approach
7. Others (Specify skill): ________________________
1 2 3 4 5
Not important
Somewhat important
Neither important / unimportant
Important Very important
1 2 3 4 5
1 2 3 4 5
1 2 3 4 5
1 2 3 4 5
1 2 3 4 5
1 2 3 4 5

Appendix B
Hard skill: Please identify three hard skills that are most important for you and please indicate the importance of each skill with 1 to 5 scales.
1. Specify skill: ____________________
2. Specify skill: ____________________
3. Specify skill: ____________________
Among above soft and hard skills, please select THREE skills that you think are the most critical to you. Skill 1: Skill 2: Skill 3: ************************************************************************************** Section B –Level of Skill
Now I would like to you focus on your current level of skill. How competent do you think you are for skills below? Please grade each skill with 1 to 5 scales. (Highly competent, competent, neither competent or not competent, not competent, not highly competent) Please grade soft and hard skills on the same scaling basis. Soft skill:
1. Critical thinking: ability to analyze an issue through steps and processes used in problem solving and decision making
2. Communication skill: ability to speak in a clear, concise and correct manner
3. Creative thinking: skill to look at problem from a fresh perspective that suggests unorthodox solutions
4. Teamwork: ability to interact with
co-workers in ways that contribute to effective working relationships and achievement of goals
5. Time management: skill that sets
priorities and allocates time efficiently to complete several tasks within specific deadlines
6. Organization and planning: ability to
Not important
Somewhat important
Neither important / unimportant
Important Very important
1 2 3 4 5
1 2 3 4 5
1 2 3 4 5
Not highly
competent
Not competent
Neither competent/not
competent
Competent Highly competent
1 2 3 4 5
1 2 3 4 5
1 2 3 4 5
1 2 3 4 5
1 2 3 4 5
1 2 3 4 5

Appendix B
manage time effectively, accomplish day-to-day tasks using orderly approach
7. Others (specify):_________________________
Hard skill: Please identify three hard skills that you think you are not competent with and please indicate your competence with 1-5 scales. (Highly competent, competent, neither competent or not competent, not competent, not highly competent) Please grade soft and hard skills on the same scaling basis.
1. Specify_____________________
2. Specify_____________________
3. Specify_____________________
Lastly, please answer questions about your general opinion about rapport (relationship, interaction) with your employers. Please grade your answer from scaling 1 to 5. (Strongly agree, Agree, Neither agree or disagree, disagree, strongly disagree)
x I have a good communication with my employers.
x I create a harmony in-group at my company.
x There is a great trust with my
employers.
x The work environment where I work is generally positive and supportive.
x I understand shared goals of the
company.
x I feel that my efforts are recognized by my employers.
x I feel that I am in control of my work.
1 2 3 4 5
1 2 3 4 5
Not highly
competent
Not competent
Neither competent/not
competent
Competent Highly competent
1 2 3 4 5
1 2 3 4 5
Strongly disagree
Disagree Neither disagree / agree
Agree Strongly agree
1 2 3 4 5
1 2 3 4 5
1 2 3 4 5
1 2 3 4 5
1 2 3 4 5
1 2 3 4 5
1 2 3 4 5

Bibliography
!
Ayyagari, Meghana, Thorsten Beck, and Asli Demirguc-Kunt. “Small and Medium Enterprises across the Globe.” Small Business Economics 29, no.4 (2007).
Beck, Thorsten, Asli Demirguc-Kunt, and Ross Levine. “SMEs, Growth, and Poverty.” Journal of Economic Growth 10, no. 3 (2005).
Beck, Thorsten, Asli Demirguc-Kunt, and Maksimovic Vojislav. “Financial and Legal Constraints to Firm Growth: Does Size Matter?” The Journal of Finance 60, no.1 (2005).
Connecticut State Department of Education. “Work-Environment Questionnaire.” http://www.sde.ct.gov/sde/lib/sde/pdf/. Accessed: January 28, 2016.
Ganotakis, Panagiotis. “Founders’ Human Capital and the Performance of UK New Technology Based Firms.” Small Business Economics 2, no 39 (2012). Harrison, Ann, Justin Lin, and Colin Xu. “Explaining Africa’s (Dis)Advantage: The Curse of Party Monopoly.” The World Bank, 2013. Hewitt-Dungas, Nola. “Resource and Capability Constraints to Innovation in Small and Large Plants.” Small Business Economics 26, no. 3 (2006).
Haskel, Jonathan and Martin, Christopher. “Do Skill Shortages Reduce Productivity? Theory and Evidence from the United Kingdom.” The Economic Journal 103, no. 417 (1993).
Healy, Joshua, Mavromaras, Kostas, and Sloane, Peter. “Adjusting to Skill Shortages in Australian SMEs.” Applied Economics 47, no. 24, (2015). Lenihan Helena, Bernadette Andreosso-O'Callaghan, and Mark Hart. “SMEs in a Globalised World: Survival and Growth Strategies on Europe’s Geographical Periphery.” Economic Geography 87, no. 3, (2011). http://www.e-elgar.com/shop/smes-in-a-globalised-world. Accessed: January 23, 2016.
McGuinness, Seamus and Luis Ortiz. “Skill gaps in the workplace: measurement, determinants and impacts.” Industrial Relations Journal 47, no. 3 (2016): 253, 272-273, 276.
National Institute of Statistics Rwanda. “2014 Establishment Census,” 2014. 10. http://statistics.gov.rw/file/4319/download?token=G1Nn-eEE. Accessed: March 4, 2016.
Pages, Carmen. The Age of Productivity: Transforming Economies From the Bottom Up. New York, Palgrave Macmillan, 2010.
Piza Cravo, Taylor Gonzalez, Musse Furtado, and Sierra Abdelnour. “The Impact of Business Support Services for Small and Medium Enterprises on Firm Performance in Low- and Middle-Income Countries: A Systematic Review.” Campbell Systematic Reviews 1, (2016).

Richens, Greg and Clifford McClain. “Workplace Basic Skills for the New Millennium.” Journal of Adult Education 28, no. 1 (2000): 28.
Rivas, Lucia, Margarita Gonzalez Cano, and Flor de Maria Mendoza Austria. “Need for Developing Human Capital Management in SMEs.” European Scientific Journal 1, (2013). ! Rwanda Development Board. Economic Development and Poverty Reduction Strategy II, (2013) 58. http://www.rdb.rw/uploads/tx_sbdownloader/EDPRS_2_Main_Document.pdf. Accessed: January 15, 2016.
Rwanda Development Board. “Rwanda among top 3 easiest places to do business in Africa.” http://www.rdb.rw/home/newsdetails/article/rwanda-among-top-3-easiest-places-to-do-business-in-africa.html. Accessed July 29, 2016.
Schneider Lutz, Jutta Gunther, and Bianca Brandenburg. “Innovation and skills from a Sectorial Perspective: A Linked Employer-Employee Analysis.” Economics of Innovation and New Technology 19, no.2 (2010). http://www.tandfonline.com.ezproxy.library.tufts.edu/doi/pdf/10.1080/10438590902872887. Accessed: March 1, 2016. The Government of Rwanda and Economic Commission for Africa. “A Review of the Implementation of the Rwanda ICT4D/NICI-2005 Plan,” 2005. http://www.musanze.gov.rw/fileadmin/templates/document/NICI_I_Plan__2001-2005_.pdf. 8
The Government of Rwanda. “National ICT Strategy and Plan NICI – 2015.” http://www.rdb.rw/uploads/tx_sbdownloader/NICI_III.pdf. Accessed: January 10, 2016.
The Government of Rwanda. “Rwanda 4G LTE Project Scoops Global Telecom Business Innovation Award.” May 15, 2015. http://www.gov.rw/news_detail/?tx_ttnews[tt_news]=1193. Accessed: July 23, 2016.
The International Finance Corporation. “IFC and Small and Medium Enterprises.” 2012. http://www.ifc.org/wps/wcm/connect/277d1680486a831abec2fff995bd23db/AM11IFC+IssueBrief_SME.pdf?MOD=AJPERES. Accessed: January 30, 2016.
The International Finance Corporation. “Interpretation Note on Small and Medium Enterprise and Environmental and Social Risk Management.” January 2000. http://www.ifc.org/wps/wcm/connect/de7d92804a29ffe9ae04af8969adcc27/InterpretationNote_SME_2012.pdf?MOD=AJPERES. Accessed: May 1, 2016.
The International Labour Organization. “Small and Medium-Sized Enterprises and Decent and Productive Employment Creation.” 2015. http://www.ilo.org/wcmsp5/groups/public/@ed_norm/@relconf/documents/meetingdocument/wcms_358294.pdf. Accessed: February 2, 2016.

The Ministry of Advanced Education and Skills Development of Ontario, “Appendix B: Employer Satisfaction Survey.” http://www.tcu.gov.on.ca/eng/document/serials/eprofile01-02/002e.pdf. Accessed: December 20, 2015.
The National Institute of Statistics of Rwanda. “Rwanda Demographic and Health Survey 2014-15 Final Report.” . http://www.statistics.gov.rw/publication/demographic-and-health-survey-20142015-final-report. Accessed: February 2, 2016.
The Organization for Economic Cooperation and Development. “Multilingual Summaries “Skills for Innovation and Research,” 2011. http://www.oecd-ilibrary.org/science-and-technology/skills-for-innovation-and-research_9789264097490-en. Accessed: July 1, 2016. The Organization for Economic Cooperation and Development. “Oslo Manual. Guidelines for Collecting and Interpreting Innovation Data.” 2005. https://www.oecd.org/berlin/44120491.pdf. Accessed: July 1, 2016.
The Organization for Economic Cooperation and Development. “SMEs, Entrepreneurship and Innovation.” 2010. http://www.oecd.org/cfe/smesentrepreneurshipandinnovation.htm. Accessed February 24, 2016.
The Republic of Rwanda, Ministry of Finance and Economic Planning. “Vision 2020.” 2000. http://www.sida.se/globalassets/global/countries-and regions/africa/rwanda/d402331a.pdf. Accessed: January 24, 2016.
The Republic of Rwanda, Ministry of Trade and Industry. “Small and Medium Enterprises (SMEs) Development Policy.” 2010. http://www.x.rw/uploads/tx_sbdownloader/SME_Devt_policy_V180610.pdf. Accessed: March 1, 2016.
The Republic of Rwanda. “SMART Rwanda Master Plan 2015-2020.” http://www.myict.gov.rw/fileadmin/Documents/Strategy/SMART_RWANDA_MASTER_PLAN_FINAL.pdf. Accessed: July 1, 2016.
The Republic of Rwanda. “Rwanda 4G LTE project scoops Global Telecom Business Innovation Award.” May 15, 2015. http://www.gov.rw/news_detail/?tx_ttnews%5Btt_news%5D=1193&cHash=20a177278a02e615b7520cdf478759dc
The United Nations, ECOSOC. “Monitoring NICI Policies and Plans in Africa: The Rwandan Experience.” http://repository.uneca.org/codist/sites/default/files/Monitoring%20NICI%20policies%20and%20plans%20(Rwanda).pdf. Accessed: May 1, 2016.
Verwimp, Phillip. “Death and Survival During the 1994 Genocide in Rwanda.” Population Studies 58, no 2 (2004).

http://www.jstor.org/stable/4148232?pqorigsite=summon&seq=1#page_scan_tab_contents. Accessed: January 20, 2016.