The Case of Kusile and Medupi - Economic Society of South...
38
An Economy-Wide Evaluation of New Power Generation in South Africa: The Case of Kusile and Medupi 1 Bohlmann, J.A., Bohlmann, H.R., Inglesi-Lotz, R. and Van Heerden, J. 2 ESSA 2015 Conference Paper Version Abstract The South African economy has suffered over the past decade due to a lack of adequate electricity supply. With two new coal-fired power stations, Kusile and Medupi, scheduled to come online over a six year period (2014-2019), their additional generation capacity is expected to restore electricity reserve margins and facilitate increased growth and investment in the local economy. In this paper, we use a dynamic CGE model for South Africa to evaluate the economy-wide impact that the additional power generation from these two stations will have across a broad range of macroeconomic and industry variables. In terms of the new power generation capacity, our findings suggest that the macroeconomic impact of Kusile and Medupi will be a definite positive. Results show that, in the medium term, investment expenditure is particularly sensitive to the building of these new power plants. Additional costly blackouts are also likely to be avoided, further promoting economic growth and investment. Once Kusile and Medupi are fully operational and able to provide its projected 9600MW of base load electricity supply, old coal-fired power plants may be decommissioned and replaced by cleaner and more efficient generation sources as outlined in the Department of Energy’s Integrated Resource Plan. Our analysis also suggests that this outcome provides a good balance between utilising modern clean coal technologies that are cost-effective while laying the foundation to improving our generation- mix and carbon emissions profile. JEL Codes: C68, Q41, Q43 Keywords: Computable general equilibrium, UPGEM, electricity supply, Kusile, Medupi 1 This research was published as Working Paper No. 524 in the ERSA Working Paper Series. The Authors acknowledge financial support from ERSA in publishing this research. 2 Department of Economics, University of Pretoria
Transcript of The Case of Kusile and Medupi - Economic Society of South...

An Economy-Wide Evaluation of New Power Generation in South Africa: The Case of Kusile and Medupi1
Bohlmann, J.A., Bohlmann, H.R., Inglesi-Lotz, R. and Van Heerden, J.2
ESSA 2015 Conference Paper Version
Abstract
The South African economy has suffered over the past decade due to a lack of
adequate electricity supply. With two new coal-fired power stations, Kusile and Medupi,
scheduled to come online over a six year period (2014-2019), their additional generation
capacity is expected to restore electricity reserve margins and facilitate increased growth
and investment in the local economy. In this paper, we use a dynamic CGE model for South
Africa to evaluate the economy-wide impact that the additional power generation from these
two stations will have across a broad range of macroeconomic and industry variables.
In terms of the new power generation capacity, our findings suggest that the
macroeconomic impact of Kusile and Medupi will be a definite positive. Results show that,
in the medium term, investment expenditure is particularly sensitive to the building of these
new power plants. Additional costly blackouts are also likely to be avoided, further promoting
economic growth and investment. Once Kusile and Medupi are fully operational and able to
provide its projected 9600MW of base load electricity supply, old coal-fired power plants
may be decommissioned and replaced by cleaner and more efficient generation sources as
outlined in the Department of Energy’s Integrated Resource Plan. Our analysis also
suggests that this outcome provides a good balance between utilising modern clean coal
technologies that are cost-effective while laying the foundation to improving our generation-
mix and carbon emissions profile.
JEL Codes: C68, Q41, Q43 Keywords: Computable general equilibrium, UPGEM, electricity supply, Kusile, Medupi
1 This research was published as Working Paper No. 524 in the ERSA Working Paper Series. The Authors acknowledge financial support from ERSA in publishing this research. 2 Department of Economics, University of Pretoria
2
1. Introduction The South African economy relies heavily on large-scale energy intensive sectors like
mining and manufacturing. However, the South African economy has faced an on-going
electricity crisis since the first series of blackouts occurred in 2008. Diminished electricity
reserve margins, brought on by a steady increase in demand relative to a stagnant supply,
have left the country’s electricity sector in desperate need of expansion in order to prevent
further catastrophe. Recognising the looming crisis, Eskom and the Department of Energy
launched the New Build Programme in 2005. 3 The first phase was to recommission
previously mothballed coal-fired power stations such as Camden and Grootvlei. The second
phase was the commissioning of two new modern coal-fired power stations, Kusile and
Medupi, with a generation capacity of around 4800MW each. Eventually, the New Build
Programme was absorbed into a comprehensive integrated resource plan (IRP) that aimed
to address the country’s long-term energy needs. However, given the long lag period
between the planning and building of new generation capacity, South Africa has continued
to feel the strain of tight electricity supply since the crisis started in 2008. This was again
highlighted at the end of 2014 when the collapse of a silo at Majuba power station triggered
large-scale rolling blackouts and load-shedding that has continued into 2015. Some analysts
suggest that the electricity problems that have plagued the country in recent years have
already cost the local economy around 10% of GDP (Roodt, 2014). With the first of Medupi’s
six units scheduled to go online in late 2014, there has been a great deal of interest from
both the public and policymakers as to what role Kusile and Medupi will play in alleviating
the country’s economic problems. Within this context, this paper analyses the contribution
that the additional electricity generation capacity of Kusile and Medupi will make to the South
African economy.
In order to conduct this study, we use a dynamic computable general equilibrium
(CGE) model of the South African economy. To isolate and measure the impact of Kusile
and Medupi, we run a policy simulation in which the additional generation capacity that is
scheduled to come from these new power stations between 2014 and 2019 is eliminated,
relative to a business-as-usual baseline projection in which they are brought online as
scheduled. Another way of looking at this simulation is to estimate what would happen to
the South African economy if Kusile and Medupi are simply never brought online. The
simulations are run over the period 2011-2030.
3 Refer to Appendix A for details on Eskom’s New Build Programme.

3
Whilst the supply shock in the policy run will no doubt cause a negative deviation in
the economy relative to the baseline, the absolute value of this deviation will give us a good
understanding of the contribution these new stations are expected to make in the economy
overall. For example, if a shirt manufacturer is expected to produce 1000 shirts in a year,
and we take away one of the machines in his factory and he subsequently ends up producing
only 900 shirts in the year, we may interpret the direct contribution of the machine that was
taken away as being 100 shirts. However, we may also look at any changes in employment
or prices that occurred as a result of the reduced level of production and attribute them to
the loss of the machine. Similarly, we expect Kusile and Medupi to influence a wide range
of economic variables. The economy-wide nature of the CGE model used in this paper gives
us a detailed picture of the role these new power generators are expected to play in the
economy in the coming years.
The remainder of this paper is structured as follows: Section 2 takes a look at energy
policy in South Africa and the debate surrounding the building of Kusile and Medupi. Section
3 justifies the use of CGE models in energy policy and infrastructure analysis by providing
a brief literature review on the application of this methodology in previous studies. Section
4 describes the CGE model used in this paper, including aspects of the model’s theory,
database and closures. Section 5 details the design of the various simulations required to
conduct our study and gives a careful analysis and interpretation of the policy results
produced by the model. Section 6 concludes the study with an overview of the findings.
2. Overview of the South African Energy Sector This section gives a background of the South African energy sector and its current
energy policy. This background aims to provide readers with a suitable context for the topic
of this paper and the simulations conducted later on.
South Africa’s chequered history has been well documented in the political and
economic literature (The Presidency, 2014). The South African economy is distinctly two-
tiered. For long the largest and most developed economy on the African continent, South
Africa features many institutions on par with the best in the world. However, despite
improving the lives of many, a number of challenges remain twenty years after achieving
democracy. Underwhelming economic growth, averaging just above 3 per cent since 1994,
has limited the government’s ability to successfully deal with the challenges it has been
presented. Given the importance of electricity generation in facilitating continued growth and
development, this paper investigates the contribution that scheduled increases in electricity

4
generation capacity in the form of the newly built Kusile and Medupi power stations will have
on the economy of South Africa.
As a relatively energy intensive economy, many industries such as mining and mineral
beneficiation depend on a reliable supply of base load electricity. The energy intensive
nature of these industries is largely as a result of historically cheap electricity – a direct
consequence of overinvestment in generation capacity during the 1970s and 1980s. South
Africa is blessed with an abundance of natural resources. It holds the world’s largest natural
reserves of gold, platinum group metals, chrome ore and manganese ore (UNEP, 2013).
South Africa also has the world's ninth-largest amount of recoverable coal reserves, holding
the majority of total coal reserves in Africa (EIA, 2013). It is therefore not surprising that
South Africa’s energy sector is coal intensive.
Eskom, the country’s state-owned electricity provider, generates around 95 per cent of
total electricity output in South Africa. As shown in Table 1, Eskom’s current fleet of ageing
coal-fired power stations produce 85 per cent of its total electricity output of around 44000
MW. Eskom’s generation-mix infrastructure, dominated by its 13 coal-fired power stations,
has contributed to making South Africa one of the largest carbon emitters amongst
developing nations (Alton et al, 2013; DBSA, 2012; DoE, 2013; Odeku, 2013; Winkler,
2007). Coal is furthermore expected to remain the dominant source of electricity generation
in South Africa until at least 2030 (DoE, 2013; StatsSA, 2012). Eskom and South Africa’s
energy policies have long been under scrutiny from environmental groups due to the obvious
pollution associated with coal-fired electricity generation. South Africa’s energy sector is not
unique in this regard though. According to EIA (2013) and Eskom (2013b; 2014d), the
extensive availability and relative low cost of coal, compared to other energy sources, still
makes coal the biggest individual primary energy source in the world. StatsSA (2012)
confirms the large-scale use and trade of coal in South Africa due to its abundance and low
cost by international standards.
On the consumption side, users of energy within the South African economy may be
divided into three main sectors: industrial, residential and transport. The industrial sector is
by far the largest consumer of electricity in the country, accounting for around 60 percent of
total electricity consumption. It follows that the energy sector represents a key input to
industrial growth and development as well as in providing electricity security and availability
to the community (Spalding-Fecher & Khorommbi, 2003).

5
Table 1: Eskom Power Plant Mix (2013) Type Stations Capacity Percentage
Coal-Fired 13 37780 MW 85.57 Gas 4 2426 MW 5.50 Hydroelectric 2 600 MW 1.36 Pumped Storage 2 1400 MW 3.17 Nuclear 1 1940 MW 4.39 Wind Energy 1 3 MW 0.01 Total 23 44149 MW 100.0 Source: Adapted from Eskom (2014c)
Historically, South Africa’s electricity-intensive industries such as manufacturing and
mining have been significant contributors towards economic growth in the country.
According to Deloitte (2013), the direct contribution of these relatively energy-intensive
primary and secondary activities is about 28 per cent of GDP. The non-ferrous metals and
gold mining industries are the single largest consumers of electricity in South Africa,
responsible for 25 per cent of total energy consumption. As such, growth in these industries
needs to be monitored as they are key in driving increased overall demand for electricity in
the country.
The question regarding the existence of so many energy intensive industrial users in
the South African economy can be traced back to the 1960s. During this period South Africa
experienced a boom in the mining and heavy metals industries, which led to significant
increases in energy demand. As a result, Eskom built a large number of power plants in a
short period of time to meet the present and future electricity needs of South Africa (Etzinger,
2013). Additional supply was built to the extent that, during the 1980s and 1990s, electricity
was in such oversupply that some existing power plants were mothballed and electricity sold
at very cheap rates to industrial consumers. In response to this oversupply, plans for the
construction of new power plants were completely shelved for almost two decades.
However, Eskom and the Department of Energy were lulled into a false sense of
security regarding South Africa’s electricity needs. As the economy boomed again during
the early 2000s and infrastructure development expanded rapidly, the large excess supply
and reserve margins once enjoyed in the electricity sector evaporated quickly. By 2004,
Eskom realised that the time had come to increase its generation capacity. However, various
delays in the planning and decision making phase of building new power generation ensued.
In 2008, with reserve margins at critical levels, unplanned maintenance to the power grid

6
caused major blackouts across the country. This caused severe damage to the local
economy and exacerbated the effects of the global financial crisis during this period
(Davidson et al., 2010; Etzinger, 2013; EIA, 2013). Essentially, this event may be viewed as
the point in time where decades of economic growth had finally managed to consume all the
surplus electricity built during the 1970s and 1980s.
Although too late to prevent the 2008 crisis, Eskom’s response to its declining reserve
margins was to implement the New Build Programme whereby it would build additional
power stations in order to meet rising electricity demand in South Africa (Eskom, 2014d).
This programme has subsequently become part of a much larger and comprehensive
Integrated Resource Plan (IRP) developed by the Department of Energy in conjunction with
various shareholders (DoE, 2013). The first Integrated Resource Plan (IRP) for the energy
sector in South Africa was approved in 2010 and subsequently updated in 2011 and 2013
(DoE, 2011; DoE, 2013). As suggested by its name, the IRP details an integrated long-term
strategy on energy generation and distribution up to 2030, and also provides various
generation-mix scenarios up to 2050. The IRP places particular emphasis on moving
towards a greener economy in the long run. Some of the generation-mix scenarios described
in the document see the share of coal-fired power generation reduced to well below 50 per
cent by 2050. In addition to all committed power plants inherited from the New Build
Programme, the IRP’s SO Low scenario, viewed by many as the most likely scenario,
includes the building and commissioning by 2030 of 9.6GW of nuclear energy, 6.3GW of
coal, 11.4GW of renewables including solar and wind, and 11GW of other generation
sources (DoE, 2013).
The building of two modern coal-fired power stations, Kusile and Medupi, each with a
generating capacity of around 4800 MW, formed the crown jewel in the initial New Build
Programme (Eskom, 2014d; DBSA, 2012). As part of the push towards a greener
environment, the role of Kusile and Medupi within the broader IRP framework is also to
provide enough cost-efficient base load, utilising the latest clean coal technologies, to allow
for the decommissioning of all older generation coal-fired plants by 2030. With economic
growth heavily constrained due to limited electricity supply in recent years, the arrival of
additional generation capacity in the form of these two new plants is expected to facilitate
improved levels of growth and development in the economy. However, various unanticipated
delays and a steep learning curve in building these plants have put their completion behind
schedule. Initially, Medupi was scheduled to start producing electricity in 2013 but has now
been pushed to start supplying energy by late 2014; Kusile was scheduled to start sending

7
power to the grid in 2014 but has now been delayed until 2016 (Eskom, 2014d). These two
power plants are now only expected to be fully operational by 2018 (EIA, 2013). The rest of
Eskom’s New Build Programme expansion is comprised of 1) the return to service of three
coal-fired plants, namely Camden, Grootvlei and Komati 4 ; 2) the building of Ingula, a
pumped storage scheme designed to supply energy during peak times; and 3) various small
solar power and wind projects.
The latest revision to the IRP plan, released in 2013, highlights recent developments
in the energy sector, including a downward revision in expected electricity use. One of the
major suggestions that followed was that the building of new nuclear capacity could be
delayed since its base load production will probably not be needed until 2025. This will allow
for the exploration of alternative options such as hydro and shale gas. However, recent
reports and studies commenting on the expected decline in demand for energy, compared
to earlier projections, due to increased electricity prices and other macroeconomic factors
must be carefully interpreted. These reports went on to question the need for building both
Kusile and Medupi given these new projections. Those projected declines are relative to a
baseline only, and should not be interpreted as a fall in the absolute level of electricity
demand relative to today’s levels. With continued economic and population growth expected
over time, our baseline projections suggests that electricity consumption is still expected to
increase substantially in absolute terms by 2030, provided that adequate electricity supply
is available.
As a middle-income developing country, South Africa faces the challenges of having
to promote economic growth while reducing its environmental impact. Being one of the most
carbon-intensive countries in the world, South Africa is under considerable pressure to
reduce its greenhouse emissions (World Bank, 2013). This paper represents an evaluation
of the impact of Kusile and Medupi as part of the New Build Programme in South Africa and
the economic growth that is being facilitated by the building of these new power plants.
However, it is important to note that this study does not focus on or measure the
environmental impact that Kusile and Medupi could have on the overall economy. The
environmental considerations of Kusile and Medupi fall outside the scope of the modelling
exercise conducted in this paper, but are planned for in future research.
4 Komati, Camden and Grootvlei were mothballed during the 1990s. However, due to the rapidly growing demand for electricity in South Africa, these coal-fired power stations were re-commissioned to add to the base load supply of electricity

8
3. CGE Models and Energy Related Literature This section highlights the relevance of using CGE models in policy analysis. It briefly
discusses the importance of CGE models in conducting energy and climate change related
policy evaluations and provides a brief literature review on the use of CGE models in
infrastructure and energy related research.
Due to its ability to provide detailed economy-wide explanations of the impact of a
specific policy, CGE models have been extensively used for policy analysis around the world
(Adams & Parmenter, 2013). CGE models allow policymakers to identify the winners and
losers that will arise from policy changes at industry, occupation, regional and household
level (Adams & Parmenter, 2013). The University of Pretoria General Equilibrium Model
(UPGEM) used in this study is based on the well-documented MONASH model (Dixon &
Rimmer, 2002; Dixon et al, 2013). MONASH-style CGE models have been widely used in
policy analysis for over three decades.
The literature on energy policies, energy consumption and the environmental concerns
of climate change in South Africa and other developing countries using various econometric
techniques is vast (Blignaut, 2012; Inglesi-Lotz and Blignaut, 2012a, 2012b; Odeku, 2013;
Spalding-Fecher & Khorommbi, 2003). However, to our knowledge, publicly available
studies focusing on electricity generation and the impact of increased energy supply (i.e. the
building of new power plants) in South Africa using computable general equilibrium (CGE)
methods are rare.
In energy and climate change policy evaluation, CGE models have emerged as useful
empirical tools that describe the scale of the economic impacts of energy and environmental
policies. Literature on this topic incorporating a wide range of policy instruments from taxes
on mitigations, quotas on the carbon contents of energy goods to economy-wide
improvements in energy efficiency has been growing significantly with many articles
published in peer-reviewed journals and working paper series (Jorgenson et al., 2013;
Winston, 2009). Many authors have highlighted that the main strength of analysing energy
policies using CGE models lies in the fact that they have very strong theoretical
underpinnings suitable for the treatment of changes in the economy resulting from policies,
allowing it to evaluate the net impact of the energy policy under consideration in great detail
(Adams & Parmenter, 2013; Allan et al., 2007).
The relevance of energy and climate change policy evaluation is growing worldwide.
The Global Trade Analysis Project (GTAP), the largest global CGE modelling network, has
recently developed a suite of models focussed on environmental and energy research that

9
facilitate the analysis of policy impacts, taking into consideration all the main linkages and
interactions that will occur in the global economy. Recognising the relevance of energy and
climate change research, recent GTAP projects have focussed on constructing global
energy datasets that will allow in-depth modelling and analysis related to greenhouse
emissions and biofuels that can be used in conjunction with CGE models (Burniaux &
Truong, 2002; Mc Dougall & Golub, 2007).
4. Methodology, Model and Assumptions This section aims to provide details of the model and methodology used in this paper.
Section 4.1 presents an overview of the UPGEM model and its main assumptions. Section
4.2 discusses the CGE methodology, the database and the model closure.
4.1 UPGEM Model Overview
To conduct this study we use the University of Pretoria General Equilibrium Model
(UPGEM) developed by the University’s Department of Economics in collaboration with the
Centre of Policy Studies in Melbourne, Australia. UPGEM is a recursive-dynamic
computable general equilibrium (CGE) model of the South African economy (Bohlmann et
al, 2014). UPGEM is implemented and solved using RunDynam in the GEMPACK suite of
software programs described in Harrison & Pearson (1996). The theoretical framework of
the UPGEM is based on the MONASH model originally published and documented in Dixon
and Rimmer (2002). The model is too large to be described in detail in this study – a
complete exposition of the model code and theoretical structure are provided in Dixon and
Rimmer (2002; 2005) and also more recently in Dixon et al (2013). However, readers of this
paper need not be familiar with the details of UPGEM or CGE modelling.
CGE models provide industry-level disaggregation in a quantitative description of the
whole economy. It typically postulates neo-classical production functions and price-
responsive demand functions, linked around a supply-use matrix in a general equilibrium
model that endogenously determines prices and quantities. The model’s base year data is
for 2011 and is based on the 2011 supply-use (SU) tables of South Africa published in
Statistics South Africa (2014). The database, in combination with the model’s theoretical
specification, describes the main real inter-linkages in the South African economy. The
theory of the model is then, essentially, a set of equations that describe how the values in
the model’s database – that also provide an initial solution to the model – move through time
and move in response to any given shock. The standard UPGEM database distinguishes
10
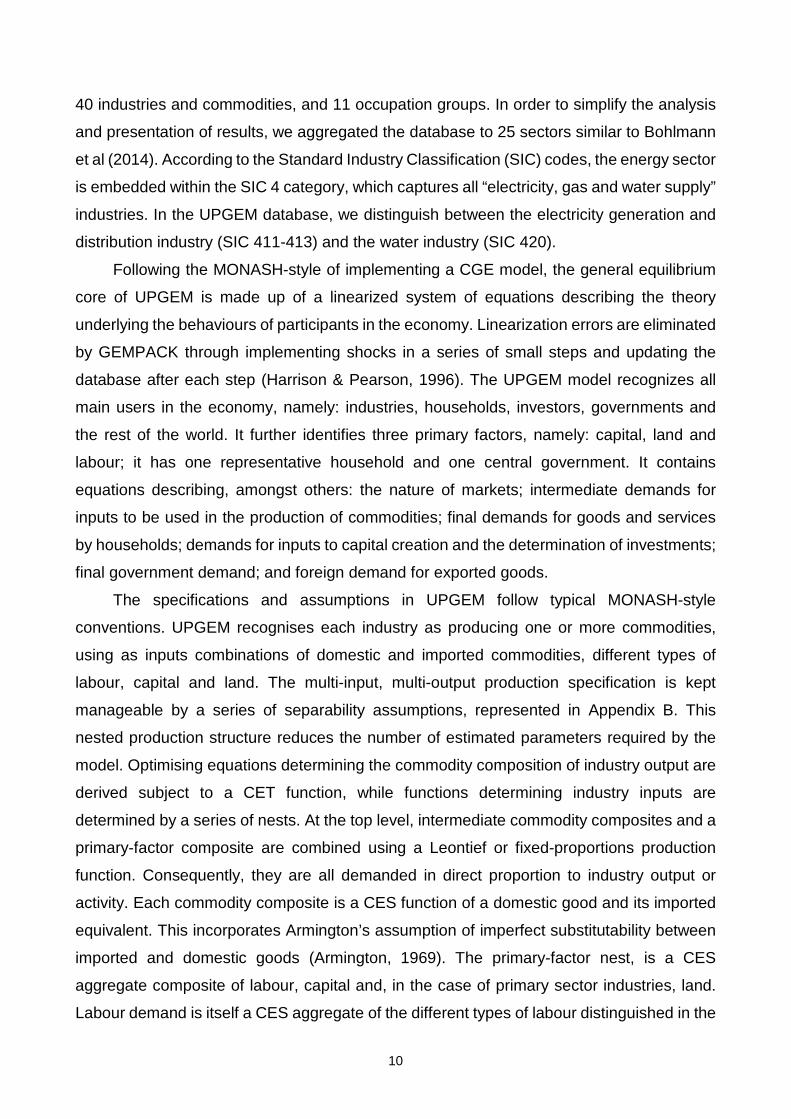
40 industries and commodities, and 11 occupation groups. In order to simplify the analysis
and presentation of results, we aggregated the database to 25 sectors similar to Bohlmann
et al (2014). According to the Standard Industry Classification (SIC) codes, the energy sector
is embedded within the SIC 4 category, which captures all “electricity, gas and water supply”
industries. In the UPGEM database, we distinguish between the electricity generation and
distribution industry (SIC 411-413) and the water industry (SIC 420).
Following the MONASH-style of implementing a CGE model, the general equilibrium
core of UPGEM is made up of a linearized system of equations describing the theory
underlying the behaviours of participants in the economy. Linearization errors are eliminated
by GEMPACK through implementing shocks in a series of small steps and updating the
database after each step (Harrison & Pearson, 1996). The UPGEM model recognizes all
main users in the economy, namely: industries, households, investors, governments and
the rest of the world. It further identifies three primary factors, namely: capital, land and
labour; it has one representative household and one central government. It contains
equations describing, amongst others: the nature of markets; intermediate demands for
inputs to be used in the production of commodities; final demands for goods and services
by households; demands for inputs to capital creation and the determination of investments;
final government demand; and foreign demand for exported goods.
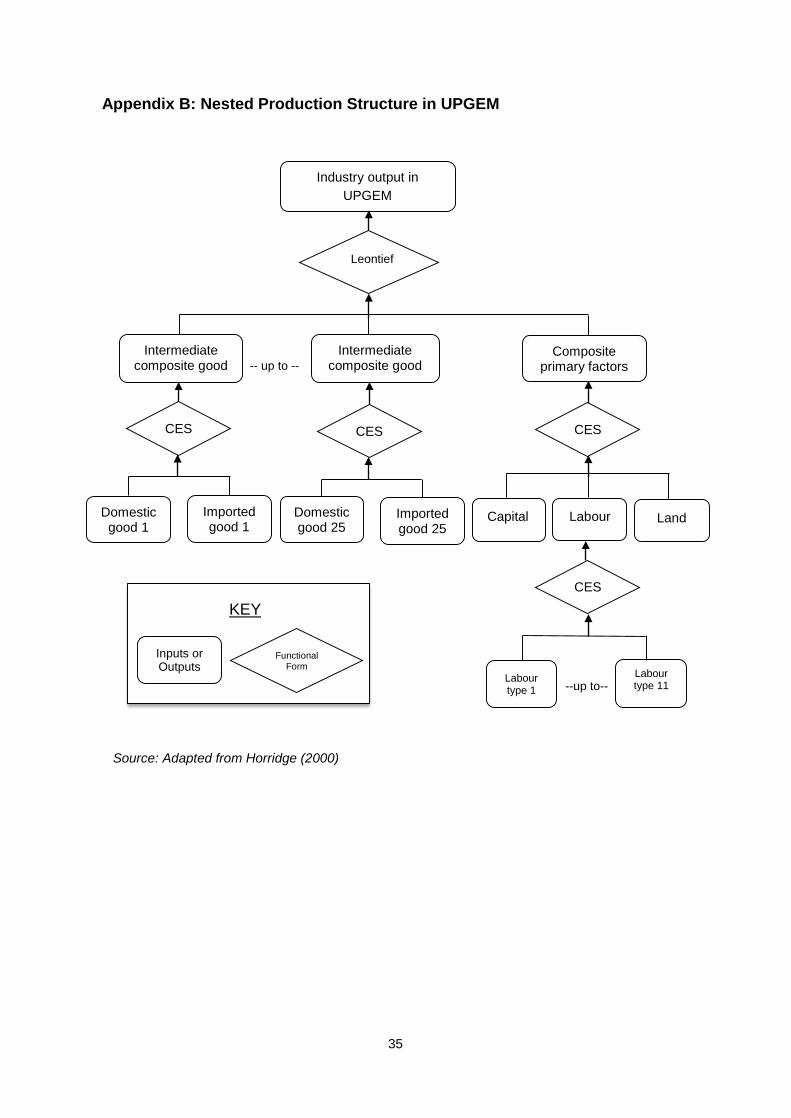
The specifications and assumptions in UPGEM follow typical MONASH-style
conventions. UPGEM recognises each industry as producing one or more commodities,
using as inputs combinations of domestic and imported commodities, different types of
labour, capital and land. The multi-input, multi-output production specification is kept
manageable by a series of separability assumptions, represented in Appendix B. This
nested production structure reduces the number of estimated parameters required by the
model. Optimising equations determining the commodity composition of industry output are
derived subject to a CET function, while functions determining industry inputs are
determined by a series of nests. At the top level, intermediate commodity composites and a
primary-factor composite are combined using a Leontief or fixed-proportions production
function. Consequently, they are all demanded in direct proportion to industry output or
activity. Each commodity composite is a CES function of a domestic good and its imported
equivalent. This incorporates Armington’s assumption of imperfect substitutability between
imported and domestic goods (Armington, 1969). The primary-factor nest, is a CES
aggregate composite of labour, capital and, in the case of primary sector industries, land.
Labour demand is itself a CES aggregate of the different types of labour distinguished in the
11
model’s database. In UPGEM, all industries share this common production structure, but
input proportions and behavioural parameters vary between industries based on available
base year data and econometric estimates, respectively.
The demand and supply equations in UPGEM are derived from the solutions to the
optimisation problems which are assumed to underlie the behaviour of private sector agents
in conventional neo-classical microeconomics. Each industry minimises cost subject to
given input prices and a constant returns to scale production function. Zero pure profits are
assumed for all industries. Households maximise a Klein-Rubin utility function subject to
their budget constraint. Units of new industry-specific capital are constructed as cost-
minimising combinations of domestic and imported commodities. The export demand for
any locally produced commodity is inversely related to its foreign-currency price.
Government consumption, typically set exogenously in the baseline or linked to changes in
household consumption in policy simulations, and the details of direct and indirect taxation
are recognised in the model. Various technological or preference change variables are also
specified in UPGEM.
The recursive-dynamic adjustment in UPGEM is modelled through equations defining:
physical capital accumulation; net liability accumulation in the national and government
financial accounts; and lagged adjustment processes in the labour market. Capital
accumulation is industry-specific and it is linked to industry-specific net investment in the
preceding period. Changes in industry-specific investment are positively related to industry-
specific rates of return on capital, that is, the price of capital rentals relative to the price of
capital creation. For the government’s fiscal accounts, a similar mechanism for financial
asset/liability accumulation is specified. Changes in the public sector debt are related to the
public sector debt incurred during a particular year and the interest payable on previous
debt. Adjustments to the national net foreign liability position of households are related to
the annual investment/savings imbalance, revaluations of assets and liabilities and
remittance flows during the year. In policy simulations, the labour market follows a lagged
adjustment path. In the short-run wages are sticky and therefore, market pressures are
shown as changes in employment. In the long-run wage rates respond to gaps between
demand and supply for labour across each of the different occupation groups.
12
4.2 CGE Methodology, Database and Model Closure
In order to isolate and measure the economy-wide impact of any proposed policy
change in UPGEM, we run two separate simulations. The first establishes a business-as-
usual (BAU) baseline forecast of the economy in the absence of the exogenous policy
change or shock under consideration. The second simulation imposes the exogenous policy
shock. Results are then reported as percentage deviations over time between the first
‘baseline’ simulation run and the ‘policy’ simulation run. The specifics of these simulations
will be discussed in Section 5.
One of the distinguishing features of the computational framework of modern
MONASH-style models such as UPGEM is its ability to cope with many, highly
disaggregated, dimensions. CGE modellers are therefore able to conduct simulations
across multiple industries, commodities, occupations and household types. Credibility
enhancing detail, such as the disaggregation of final purchaser’s prices into basic price,
margin cost and tax components, is easily added within this framework. A stylized
representation of the model’s core database, highlighting the potential amount of detail that
can be accommodated, is shown in Appendix C, with details of each cell described in
Horridge (2000).
CGE models contain more variables than equations, therefore, it is necessary to
specify and choose which of these variables will be determined endogenously within the
model and which variables will be determined exogenously. The assumptions concerning
the choice of these endogenous and exogenous variables are known as the model closure
and should be designed in a way that reflects the desired economic environment under
which the simulation is to be run (Dixon et al., 2013: 60-65). The model’s closure settings
are considerably different between the baseline and the policy runs. In the baseline,
variables for which reliable forecast information is available are typically set as a exogenous,
these exogenously set variables in the baseline run include all the main macroeconomic
variables, such as the components of GDP, population growth and forecasted inflation. In
the policy run we endogenize all the variables that are naturally endogenous and we typically
want to evaluate the impact of the policy change on. The baseline forecast and policy
closures used in these simulations follow the standard closure setup for each described in
Dixon and Rimmer (2002: 262-274). The nominal exchange rate is set as the numeraire in
the policy run for all scenarios.

13
5. Simulations and Interpretation of Results The main purpose of this paper is to provide an economy-wide evaluation of the
contribution that new power generation from Kusile and Medupi will make to the South
African economy over the coming years. We use UPGEM, a dynamic computable general
equilibrium (CGE) model of the South African economy, to conduct our analysis. As noted
in Section 4, to evaluate the impact of a specific policy using UPGEM, two simulations need
to be run. First is the baseline forecast, which is used to produce a business-as-usual (BAU)
projection of the future evolution of the economy. Second is the policy simulation, which
includes the exogenous shock or policy change in question. The impact of the exogenous
shock is then measured by calculating the percentage difference between the base run and
the policy run. This section focuses on describing these two simulations and the modelling
conducted to evaluate the economy-wide impact of Kusile and Medupi. Policy simulation
results in this section are expressed as percentage deviations relative to the baseline, unless
otherwise stated.
5.1 Business-As-Usual Baseline Forecast
The baseline forecast simulation aims to produce a believable business-as-usual
picture of the future evolution of the economy. Apart from the main macroeconomic
projections that are available, our baseline simulation also includes the expected growth in
the country’s electricity generation capacity up to 2030, as projected in the Department of
Energy’s latest Integrated Resource Plan (IRP) schedule. The purpose of the BAU forecast
is to provide a baseline against which to measure a counterfactual policy scenario. In order
to isolate and measure the contribution of Kusile and Medupi, our counterfactual policy
simulation eliminates the additional generation capacity of 9600MW that is scheduled to
come online from these two sources between 2014 and 2019. We are then able to interpret
the absolute values of the deviations in economic outcomes between the baseline and policy
simulations as the contribution of Kusile and Medupi.
The BAU baseline forecast incorporates available forecast data from institutions such
as Statistics South Africa, National Treasury, International Monetary Fund, CEPII, Eskom
and the Department of Energy (DoE). Since the UPGEM database represents 2011 data,
the baseline is simulated for the period 2012 to 2030. Exogenously specified variables in
the BAU baseline include all the main macroeconomic variables for which reliable forecasts
data exist (Treasury, 2014; CEPII, 2013) as well as projected changes in electricity
generation capacity and electricity tariffs (DoE, 2013). Forecasts related to electricity
14
generation capacity, embedded in the BAU forecast, follow that of the IRP’s SO Low
scenario (DoE, 2013: 77).
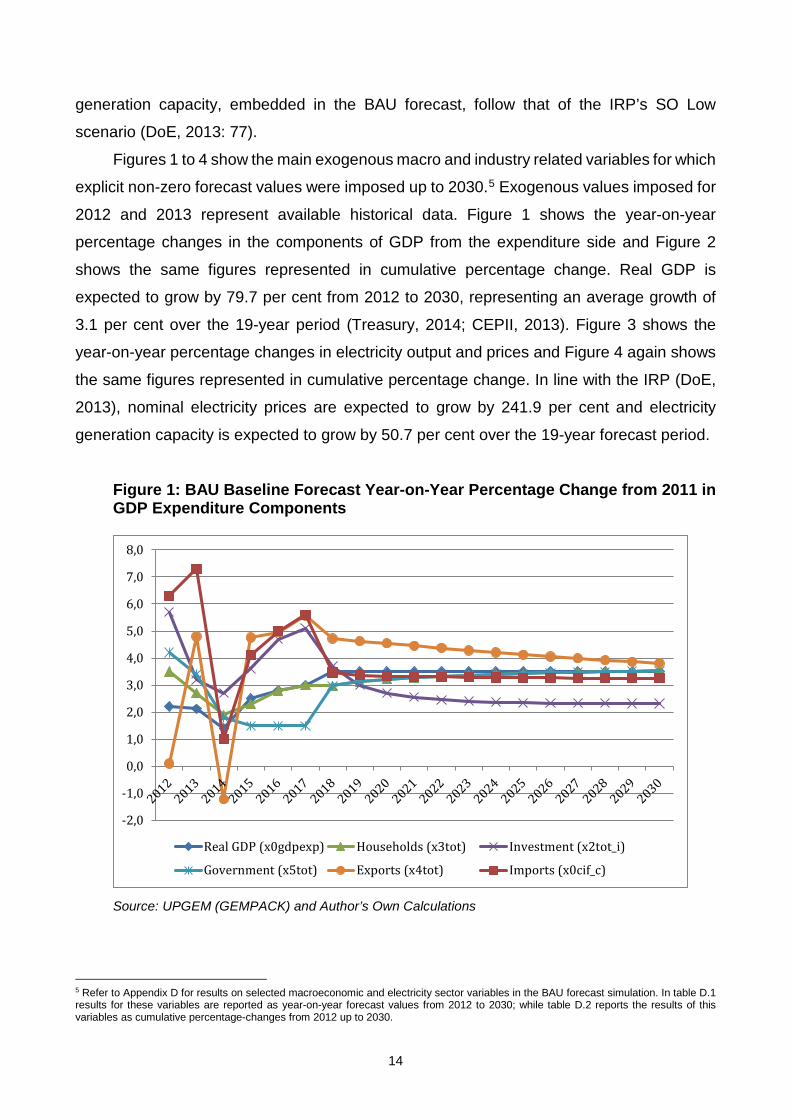
Figures 1 to 4 show the main exogenous macro and industry related variables for which
explicit non-zero forecast values were imposed up to 2030.5 Exogenous values imposed for
2012 and 2013 represent available historical data. Figure 1 shows the year-on-year
percentage changes in the components of GDP from the expenditure side and Figure 2
shows the same figures represented in cumulative percentage change. Real GDP is
expected to grow by 79.7 per cent from 2012 to 2030, representing an average growth of
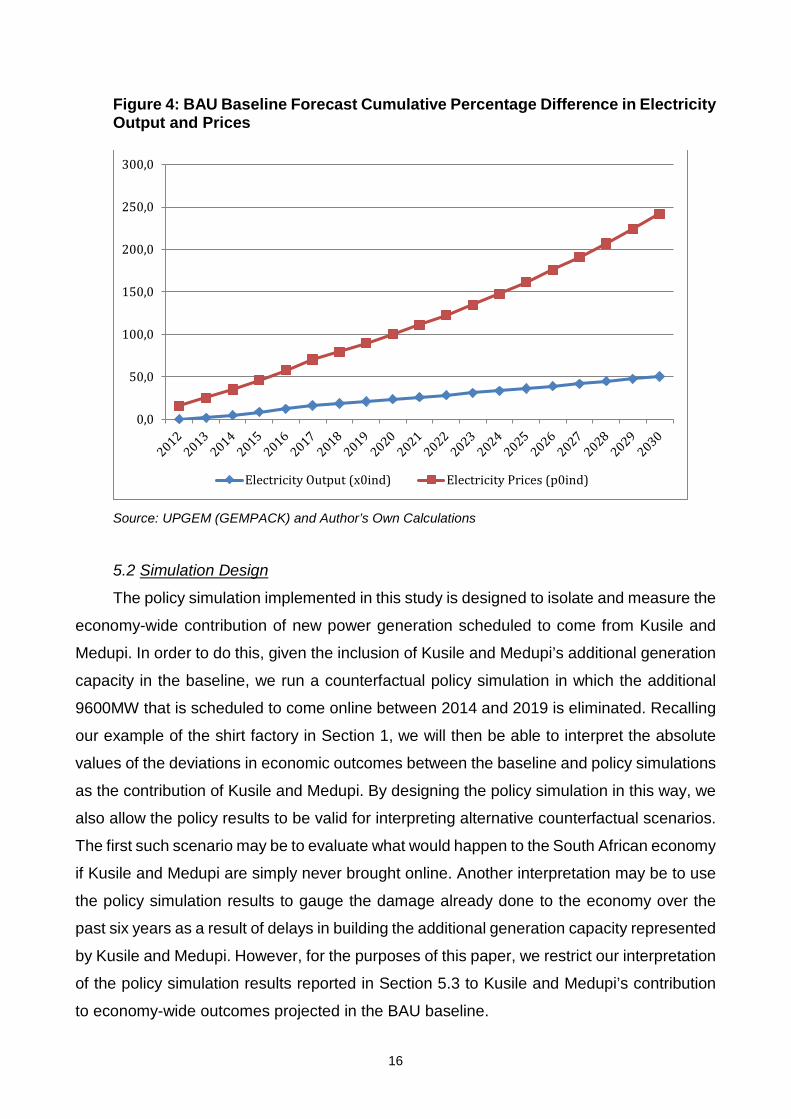
3.1 per cent over the 19-year period (Treasury, 2014; CEPII, 2013). Figure 3 shows the
year-on-year percentage changes in electricity output and prices and Figure 4 again shows
the same figures represented in cumulative percentage change. In line with the IRP (DoE,
2013), nominal electricity prices are expected to grow by 241.9 per cent and electricity
generation capacity is expected to grow by 50.7 per cent over the 19-year forecast period.
Figure 1: BAU Baseline Forecast Year-on-Year Percentage Change from 2011 in GDP Expenditure Components
Source: UPGEM (GEMPACK) and Author’s Own Calculations
5 Refer to Appendix D for results on selected macroeconomic and electricity sector variables in the BAU forecast simulation. In table D.1 results for these variables are reported as year-on-year forecast values from 2012 to 2030; while table D.2 reports the results of this variables as cumulative percentage-changes from 2012 up to 2030.
-2,0
-1,0
0,0
1,0
2,0
3,0
4,0
5,0
6,0
7,0
8,0
Real GDP (x0gdpexp) Households (x3tot) Investment (x2tot_i)
Government (x5tot) Exports (x4tot) Imports (x0cif_c)

15
Figure 2: BAU Baseline Forecast Cumulative Percentage Difference in GDP Expenditure Components
Source: UPGEM (GEMPACK) and Author’s Own Calculations
Figure 3: BAU Baseline Forecast Year-on-Year Percentage Change from 2011 in Electricity Output and Prices
Source: UPGEM (GEMPACK) and Author’s Own Calculations
0,0
20,0
40,0
60,0
80,0
100,0
120,0
Real GDP (x0gdpexp) Households (x3tot) Investment (x2tot_i)
Government (x5tot) Exports (x4tot) Imports (x0cif_c)
0,0
2,0
4,0
6,0
8,0
10,0
12,0
14,0
16,0
18,0
Electricity Output (x0ind) Electricity Prices (p0ind)
16
Figure 4: BAU Baseline Forecast Cumulative Percentage Difference in Electricity Output and Prices
Source: UPGEM (GEMPACK) and Author’s Own Calculations
5.2 Simulation Design
The policy simulation implemented in this study is designed to isolate and measure the
economy-wide contribution of new power generation scheduled to come from Kusile and
Medupi. In order to do this, given the inclusion of Kusile and Medupi’s additional generation
capacity in the baseline, we run a counterfactual policy simulation in which the additional
9600MW that is scheduled to come online between 2014 and 2019 is eliminated. Recalling
our example of the shirt factory in Section 1, we will then be able to interpret the absolute
values of the deviations in economic outcomes between the baseline and policy simulations
as the contribution of Kusile and Medupi. By designing the policy simulation in this way, we
also allow the policy results to be valid for interpreting alternative counterfactual scenarios.
The first such scenario may be to evaluate what would happen to the South African economy
if Kusile and Medupi are simply never brought online. Another interpretation may be to use
the policy simulation results to gauge the damage already done to the economy over the
past six years as a result of delays in building the additional generation capacity represented
by Kusile and Medupi. However, for the purposes of this paper, we restrict our interpretation
of the policy simulation results reported in Section 5.3 to Kusile and Medupi’s contribution
to economy-wide outcomes projected in the BAU baseline.
0,0
50,0
100,0
150,0
200,0
250,0
300,0
Electricity Output (x0ind) Electricity Prices (p0ind)

17
Using the RunDynam software, the policy shock is introduced in UPGEM as a ‘target
shock’ (tshock) to the change in the electricity industry’s output. In this application, the ‘target
shock’ command is used to directly set the growth of electricity supply, overriding any
projections made in the baseline, over the period 2014-2019. With new generation capacity
between 2014 and 2016 only expected to come from Kusile and Medupi (see Appendix A),
electricity supply growth is set to zero per cent in 2014, 2015 and 2016 in the policy run.
This simulates the elimination of the new generating capacity expected from Kusile and
Medupi over this period. From 2017 other sources of electricity generation, besides Kusile
and Medupi, are expected to come online. For the years 2017, 2018 and 2019 electricity
supply growth is set to 0.5 per cent. This simulates the elimination of Kusile and Medupi’s
new generating capacity, whilst retaining the other sources scheduled to come online over
this period, including the Ingula pumped storage scheme and other forms of renewable
energy (see Appendix A). From 2020 onward, no additional shocks are applied to the
economy in the policy run. That is, all variables, including electricity supply, are set to grow
at the rate projected or determined in the baseline simulation. In the case of electricity
supply, this represents an average annual growth rate of around 2 per cent between 2020
and 2030 as projected in the IRP.
5.3 Policy Simulation Results
This section focuses on the interpretation and analysis of the policy simulation results.
The policy results produced by UPGEM are reported as cumulative percentage deviations
away from the BAU scenario. Interpreting the results of our policy simulation requires special
attention in this study. Since we know that Kusile and Medupi will be built and brought online
over the period 2014-2019, and our aim is to better understand its role and contribution in
the economy, our counterfactual policy scenario eliminates the additional capacity
scheduled to come online from these two sources. The absolute value of the deviation from
the baseline, in the policy run, may then be interpreted as its contribution.
Three separate tables are used to present the results of the policy run. The first table,
Table 2, shows all the main macroeconomic variables including real GDP and its
components from both the income and expenditure side. The second table, Table 3, includes
industry level results. The third table, Table 4, provides a breakdown of the cumulative
industry activity deviations relative to the baseline in 2019 and 2030. This table decomposes
the total cumulative change in industry activity in these years between local demand

18
(LocalMarket), import substitution (DomShare) and export demand (Export) changes, on a
share-weighted basis. These tables are presented at the end of this section.
When using CGE models such as UPGEM, results are interpreted by comparing the
values of variables in the baseline to their values in the policy scenario. Deviations are
expressed as either percentage changes or ordinary changes (in millions of Rand terms)
from baseline values. Apart from the exogenous shock itself, only three sources of
information are considered when interpreting results from the model. The first is the
theoretical specification of the model, the second is the database, and the third is the
assumptions imposed via the model’s closure. To avoid tediousness in the reporting of the
policy simulation results, the negative impact on the economy that will no doubt arise with
the elimination of Kusile and Medupi’s capacity in the policy run will first be presented in an
unfiltered manner as produced by UPGEM. At the end of this section, we will interpret our
findings within the desired context of understanding and measuring the economy-wide
contribution Kusile and Medupi are expected to make in the coming years.
5.3.1 First Round of Impact of the Shock to the Electricity Industry Output
Figure 5 summarises the impact of the exogenous policy shock on electricity output for
the period under consideration. This figure shows the electricity output path in the baseline
forecast and policy simulation. With the elimination of Kusile and Medupi’s generation
capacity in the policy run, areas B and H may be viewed as the share in projected electricity
supply in the baseline expected to come from these two plants.

19
Figure 5: Electricity Output Deviation in Policy versus Base
Source: UPGEM (GEMPACK) and Author’s Own Calculations

20
In the baseline, electricity output grows from 44000 MW in 2011 to 53297 MW in 2019
and to 66268 MW in 2030. This represents an increase in electricity output of 21.1 per cent
between 2011 and 2019; and 50.6 per cent between 2011 and 2030. This growth path
follows the projections laid out in the latest IRP document (DoE, 2013). In the policy
simulation, electricity output grows from 44000 MW in 2011 to 45533 MW in 2019 and to
56615MW in 2030 and simulates the evolution of the economy minus the generation
capacity expected to come from Kusile and Medupi. All other sources of electricity
generation, outside of Kusile and Medupi, continue to come online in the policy run as
scheduled in the baseline. In the policy simulation, electricity output only grows 3.5 per cent
between 2011 and 2019 with the elimination of Kusile and Medupi’s capacity and by 28.7
per cent between 2011 and 2030. The small increase in electricity output capacity during
between 2017 and 2019 will come from Ingula and other renewable sources scheduled to
come online. As shown in Figure 5, UPGEM finds that restricting electricity output between
2014 and 2019 will reduce cumulative electricity output growth in 2030 by 14.5 per cent
relative to the baseline.
The next impact to be examined after the exogenous change to electricity output
capacity in the policy run should be electricity prices. In the baseline, electricity prices are
exogenously set according to the latest MYPD framework. In the policy run we allow
electricity prices to respond endogenously to the exogenous shock to electricity supply.
Despite the regulated pricing structure of electricity in South Africa, this closure setting is
required in order to achieve sensible simulation results within a general equilibrium model.
In the unlikely event that regulators do not allow electricity prices to change relative to the
baseline after such a large exogenous shock to electricity output, we may simply adjust our
interpretation of any changes to electricity prices predicted in the policy simulation as a
change in the excess demand for electricity.
Electricity prices start rising immediately after the imposition of our policy shock that
reduces electricity output. By 2030, electricity prices are cumulatively 118.4 percent higher
relative to the baseline. That is, by eliminating Kusile and Medupi’s additional power
generation, electricity prices would more than double relative to the baseline, if allowed to
move freely. This result is not surprising given our policy simulation design – the scarcer a
commodity becomes the higher its value is likely to become. Within the context of this paper
and the regulatory environment in South Africa, we may interpret this result, as showing that
Kusile and Medupi’s capacity will significantly reduce the excess demand for electricity, and
subsequent blackouts, in the economy over the simulation period.

21
The impact on macroeconomic and industry variables, explained next in sub-sections
5.3.2 and 5.3.3 respectively, follows directly from the exogenous shock imposed on
electricity output described in this section.
5.3.2 Macroeconomic Results
As shown in Table 2, the economy-wide macroeconomic impacts following the shock
to the electricity industry are generally negative, as may be expected given our simulation
design. Real GDP falls by 0.44 per cent in 2014 alone and cumulatively with 3.15 per cent
by 2019, relative to the baseline. The loss in real GDP by 2019 represents around R113
billion at 2011 prices. Post-shock, the economy recovers slightly to 1.0 per cent below the
baseline by 2030. Figure 6 illustrates this deviation in real GDP between the baseline and
policy simulations. The policy run’s gradual return to the baseline over time is to be expected
as the relative contribution of Kusile and Medupi is diluted by the building of other sources
of electricity generation over the simulation period. By interpreting the absolute values of
our results within the context of this study, it clearly shows the positive impact that adding
Kusile and Medupi’s generation capacity, as expected in the baseline, will have on the
economy.
In our policy run, the depressing effect caused by the fall in GDP initially reduces
inflation. However, the long-term impact of the supply-side constraints imposed in the policy
run ultimately increases inflation with 2.47 per cent by 2020 and 1.75 per cent by 2030,
relative to the baseline. The higher level of inflation is mainly caused by the general
equilibrium impact of the significantly higher price of electricity. With less electricity available
at higher prices, it is no surprise that this supply shock will cause inflation to rise. We can
therefore view the role of Kusile and Medupi as improving the productive capacity in the
country over the medium to long term, thereby reducing cost-push inflation in the long run.

22
Figure 6: Real GDP Deviation in Policy versus Base
Source: UPGEM (GEMPACK) and Author’s Own Calculations
As expected, with real GDP falling, all components from both the income and the
expenditure side also contract relative to the baseline. The exception is exports, which for
the period 2014-2018, increases relative to the baseline. Export prices decline for the years
2014-2018, in line with the lower rate of inflation. With import prices exogenous in the policy
run, the lower value of domestically produced goods explains the lower terms of trade and
real devaluation in the short to medium term. With downward sloping export demand curves,
this result explains the increase in aggregate exports and also why most export oriented and
tourism related industries are relative winners in the short term.
This sequence of events allows us to understand the increase in total export demand
of 1.30 per cent in 2014, by 1.65 per cent in 2015, by 1.87 per cent in 2016 and by 1.56 in
2017 relative to the baseline. From 2019 and beyond, export prices start rising on the back
of higher inflation and production costs, leading to total export demand declining by 1.49 per
cent relative to the baseline by 2030. Imports fall in line with a reduction in local
consumption. Imports decline by 1.69 per cent in 2014, by 2.68 per cent in 2015, by 3.82
per cent in 2016 and by 4.61 percent in 2017 relative to the baseline. Post-shock, imports
do recover somewhat in line with consumption, but as explained later, this result does not
represent all good news as it comes at the cost of lower savings and investment expenditure.
0,0
10,0
20,0
30,0
40,0
50,0
60,0
70,0
80,0
Real GDP Base Real GDP Policy

23
Over the medium term during which the policy shock is imposed, capital stocks are
expected to fall in line with GDP that is 3.15 per cent lower in 2019. With that much less
capital required investment expenditure must fall dramatically. Our results confirm this and
show that investment expenditure will decline by 7.85 per cent in 2016 and 9.94 per cent in
2019, relative to the baseline. Household consumption falls by 2.26 per cent in 2016, by
2.76 in 2019 and by 0.57 per cent in 2030 relative to the baseline. At the same time,
household’s average propensity to consume from its disposable income rises slightly
relative to the baseline. This result can be interpreted as an attempt from households to
buffer itself against the negative impact of the shock. The direct implication of rising average
propensity to consume when disposable income is falling is a decline in household savings.
By assumption, government expenditure falls in line with household consumption. With tax
revenues falling by an even larger percentage on the back of reduced economic activity, the
budget deficit widens relative to the baseline. When evaluating the results and recovery
seen by 2030, it is clear the part of this recovery involves substituting of capital creation for
higher consumption. That is, consumers are buying more consumer goods and allocating
fewer resources to the building of capital goods. This is likely to affect the economy’s growth
potential in the very long run.
The results regarding labour are also interesting. As may be expected with significantly
lower production and capital creation occurring in the short to medium term, employment
also falls in line with these variables initially. However, the biggest impact on the labour
market in the long run is due to reduced levels of productivity, stemming from the lack of
electricity generation capacity and investment expenditure. This causes real wages, often
seen as an indicator of labour productivity, to fall dramatically over the simulation period. By
2020 real wages are down 7.97 per cent and by 11.84 in 2030, relative to the baseline. The
slightly higher employment levels seen in 2030 should therefore be interpreted alongside
the outcome of significantly lower real wages. Should Kusile and Medupi be brought online
as expected in the baseline, its contribution on a macroeconomic level is therefore shown
as being unambiguously good for the economy.
5.3.3 Industry Results
As shown in Table 3, on an industry level, the electricity and construction industries
are the biggest contributors to the negative changes in overall industry output. This is
expected given that these are the two industries most directly affected by the shock imposed
in the policy simulation. The electricity industry is directly affected by the restriction in

24
electricity output growth imposed during the 2014-2019 period. The construction industry is
affected by the significant slowdown in investment activities that arises as a consequence
of the shock. This can also be associated with the adjustment of the economy to a lower
capital stock, which consequently causes a negative deviation in the ratio of investment
relative to GDP. The iron and steel industry, a heavy user of electricity as an intermediate
input, is also negatively affected by the policy, with industry prices significantly higher over
time relative to the baseline, leading to production and export demand in the industry
declining strongly relative to the baseline.
Export-oriented industries such as mining and tourism related services seem to be
taking advantage of the real devaluation of the currency immediately after the shock, and
do relatively well for the period 2014-2016, given the overall performance of the economy.
As confirmed in Table 4, the electricity and construction industries are the biggest losers
when looking at the domestic market effect in isolation. The electricity industry is down as a
consequence of the imposed shock. Since the electricity industry uses a lot of coal as inputs,
the coal ignite industry loses in the domestic market, which slightly depresses coal prices.
However, it is able to partially offset this loss in the domestic market with increased exports,
making coal a relative winner in overall net terms.
5.3.4 General Remarks
As noted throughout this section, the generally negative results found in the policy
simulation could be inverted if we wish to use our analysis to measure the expected
contribution of Kusile and Medupi in the South African economy. In this way, our results
clearly show the additional generation capacity scheduled to come from these new power
plants will improve the economy’s ability to grow and attract investment.

25


27

6. Conclusion and Policy Recommendations This paper analysed the economy-wide contribution that the additional electricity
generation capacity from Kusile and Medupi will bring to the South African economy in the
medium to long run. We used a dynamic CGE model to conduct our analysis. In order to
isolate and measure the contribution of Kusile and Medupi, we ran a counterfactual policy
simulation in which the additional generation capacity of 9600MW that is scheduled to come
from these new power stations between 2014 and 2019 is eliminated, relative to a business-
as-usual baseline simulation in which they are brought online as expected. We then
interpreted the absolute values of the deviations in economic outcomes between the
baseline and policy simulations as the contribution of Kusile and Medupi. The simulations
were run within the context of the Department of Energy’s Integrated Resource Plan and
projected economic growth figures for South Africa up to 2030. All additional electricity
capacity expansion, outside of Kusile and Medupi, were simulated to continue as planned.
Therefore, in the policy run, electricity supply available to the economy remained 9600MW
short of that projected in the baseline after 2020. The generation capacity of Kusile and
Medupi represents a relatively large share of projected electricity supply in 2020. Although
this share will gradually decline up to 2030 as other sources of electricity come online, its
contribution in terms of facilitating economic growth and investment is shown to remain
crucial throughout the simulation period. The environmental impacts of these two coal-fired
power stations were not explicitly accounted for in our CGE analysis.
The first conclusion that emerged from our analysis was that economic growth will be
severely harmed in the medium term without the additional electricity generation capacity
scheduled to be brought online through Kusile and Medupi. This supports the view that
inadequate electricity capacity in recent years has already cost the South African economy
billions of Rands. On a macro level, we found that investment expenditure, in particular, is
heavily dependent on the expected growth in electricity capacity and infrastructure. Up to
2019, around 10 per cent of investment activity is facilitated, directly or indirectly, by the
building of Kusile and Medupi. Given its close link to real investment expenditure on a macro
level, the construction industry gains the most from the additional activity allowed for by the
building of these two power stations over this period.
The second conclusion that emerged from the modelling simulations was that the
problem of excess demand relative to tight supply in the electricity market will be greatly
relieved once the additional capacity from Kusile and Medupi is installed. The current
conditions, which have contributed to widespread blackouts and load shedding in the

29
country since 2008, must be considered within the context of electricity’s regulated pricing
structure. Eskom is not allowed to raise electricity prices when demand exceeds supply, as
might be the case in other free market enterprises. The model shows us that if electricity
prices were subject to market forces, the building of Kusile and Medupi’s additional capacity
would have contributed to a significant slowdown in electricity price increases over the next
decade. Within the context of Eskom as a state-owned enterprise subject to regulated
pricing, we interpret this particular result as showing that the building of Kusile and Medupi
will lead to fewer blackouts as adequate reserve margins in the electricity sector are
restored.
Overall, the research presented in this study shows that the local economy will benefit
significantly through the new power generation scheduled to come from Kusile and Medupi.
The building of these new coal-fired power stations was challenged on two fronts. The first
relates to environmental concerns and the second to a possible over supply of electricity
and opportunity cost implications. On the first issue, it is widely recognised that coal is likely
to remain South Africa’s most abundant and cheapest option for electricity generation for
some time. By building new power plants based on clean coal technologies, such as Kusile
and Medupi, sufficient and cost-effective base load can be provided to the South African
economy whilst reducing its environmental footprint relative to supply from existing coal-
fired power stations. Once additional base load in the form of nuclear power is built,
supplemented by various renewable sources of electricity as outlined in the IRP, South
Africa’s fleet of old coal-fired plants can then be decommissioned. As a result, the country’s
overall electricity generation mix in 2030 is projected to be less dependent on coal-fired
technologies and friendlier to the environment. However, a coal-free energy mix is
unfortunately not an economically viable option in the near term, making the building of
modern coal-fired stations such as Kusile and Medupi a necessary evil – one that attempts
to strike a reasonable balance between the need to protect the environment and the
economic realities of the day.
On the second issue, our simulation results clearly show the need for both stations’
additional capacity in order to facilitate economic growth, prevent widespread blackouts and
reduce upward pressure on electricity prices. Our results also suggest that growth in
electricity demand will be large enough to warrant the building of Kusile and Medupi, despite
recent and projected increases in electricity prices. One exception applies to this projection.
In the event that significant technological progress in combination with appropriate economic
policy changes, as suggested in Inglesi-Lotz and Blignaut (2014), allows users to require or
30
demand much less electricity to fulfil their energy needs, leading to an improvement in
energy efficiency, the second of the two new coal-fired power stations may well prove to
deliver excess capacity to the economy. However, if we are to replace the existing fleet of
old coal-fired plants, the capacity of both new stations will be required in order to provide
adequate base load.
This paper only considered the economic impact of additional electricity capacity
scheduled to come online in South Africa through Kusile and Medupi. Further research is
required to get a more holistic view of the impact and requirements regarding South Africa’s
future electricity generation capacity and mix. Recent work on changing electricity price
elasticities and the role supply constraints may have played in this regard, environmental
considerations, the implementation of a carbon-tax, new technologies becoming viable and
cost implications of moving to renewable sources of electricity must all be carefully
considered within a detailed general equilibrium framework. The importance and need for
continued research in this field should not be underestimated.
Bibliography and References Adams, P.D. & Parmenter, B.R. (2013) ‘Computable General Equilibrium Modeling of Environmental Issues in Australia: Economic Impacts of An Emission Trading Scheme’. Chapter 9 in the Handbook of Computable General Equilibrium Modeling Dixon, P.B. & Jorgenson, D.W. (eds.), North-Holland, Amsterdam. Allan, G., Hanley, N., McGregor, P., Swales, K. & Turner, K. (2007) ‘The Impact of Increased Efficiency in the Industrial Use of Energy: A Computable General Equilibrium Analysis for the United Kingdom’, Energy Economics, 29:779-798. Alton, T., Arndt, C., Davies, R., Hartley, F., Makrelov, K., Thurlow, J. & Ubogu, D. (2013) ‘Introducing Carbon Taxes in South Africa’, Applied Energy, 116: 344-354. Armington, P.S. (1969) ‘A Theory of Demand for Products Distinguished by Place of Production’. International Monetary Fund Staff Papers, XVI:159-178. Blignaut, J.N. (2012) ‘Climate Change: The Opportunity Cost of Medupi and Kusile Power Stations’, Journal of Energy in Southern Africa, 23(4): 67-75. Bohlmann, H.R., Dixon, P.B., Rimmer, M.T. & Van Heerden, J.H. (2014) ‘The Impact of the 2014 Platinum Mining Strike in South Africa: An Economy-Wide Analysis’, ERSA Working Paper 478, November 2014. Burniaux, J.M. & Truong, T. (2002) ‘GTAP-E: An Energy-Environmental Version of the GTAP Model’, GTAP Technical Paper No. 16. Center for Global Trade Analysis, Purdue University.
31
CEPII (2012) The Great Shift: Macroeconomic Projections for the World Economy at the 2050 Horizon. CEPII Working Paper 2012-03. Centre D’Etudes Prospectives Et D’Informations Internationales, Paris. Davidson, O., Hirst, N. & Moomaw, W. (2010) ‘Recommendations to the World Bank Group on Lending to South Africa for Eskom Investment Support Project that Includes a Large Coal Burning Power Station at Medupi’, Report by Expert Panel. Deloitte (2013) The Economic Impact of Electricity Price Increases on Various Sectors of the South African Economy: A Consolidated View Based on the Findings of Existing Research, Report Prepared for Eskom, Deloitte, Johannesburg. Department of Energy (2011) Integrated Resource Plan for Electricity 2010-2030, Revision 2 March 2011, Department of Energy, Pretoria. Department of Energy (2013) Integrated Resource Plan for Electricity 2010-2030: Updated Report November 2013, Department of Energy, Pretoria. Development Bank of Southern Africa (2012) Infrastructure Barometer 2012: Progress in Infrastructure Development Since Democracy, Development Planning Division, Development Bank of Southern Africa, South Africa. Dixon, P.B., Koopman, R.B. & Rimmer, M.T. (2013) ‘The MONASH Style of Computable General Equilibrium Modeling: A Framework for Practical Policy Analysis’. Chapter 2 in the Handbook of Computable General Equilibrium Modeling. Dixon, P.B. & Jorgenson, D.W. (eds.). North-Holland, Amsterdam. Dixon, P.B. & Rimmer, M.T. (2002) Dynamic General Equilibrium Modeling for Forecasting and Policy: A Practical Guide and Documentation of MONASH, North-Holland, Amsterdam. Dixon, P.B. And Rimmer, M.T. (2005) ‘Reducing the Barriers to Entry in Dynamic CGE Modelling’, paper prepared for the 8th Annual Conference on Global Economic Analysis. Lübeck, Germany. Energy Information Administration (2013) International Energy Outlook: With Projections to 2040, Department of Energy, Washington DC. Eskom (2007) Build Programme in South Africa. Fact Sheet NB0001. Eskom Holdings SOC Limited, Pretoria. Eskom (2010) Kusile and Medupi Coal-Fired Power Stations Under Construction. Fact Sheet COP17. Eskom Holdings SOC Limited, Pretoria. Eskom (2013a) Integrated Report. Eskom Holdings SOC Limited: South Africa. Eskom (2013b) Supplementary and Divisional Report. Eskom Holdings SOC Limited: South Africa. Eskom (2014a) Coal in South Africa. Fact Sheet CO0007 (Rev 12). Generation Communication, Eskom Holdings SOC Limited, Pretoria, January 2014.

32
Eskom (2014b) Building a Coal Fired Power Station. Fact Sheet CO0003 (Rev 7). Generation Communication, Eskom Holdings SOC Limited, Pretoria, February 2014 Eskom (2014c) Generation Plant Mix. Fact Sheet GXO001 (Rev 14). Generation Communication, Eskom Holdings SOC Limited, Pretoria, May 2014 Eskom (2014d) New Build Programme Online Documentation. Eskom Holdings SOC Limited, Pretoria, Available online at: www.eskom.co.za/whatwearedoing/newbuild Etzinger, A. (2013) ‘Eskom Generation and Transmission Expansion Plans’, paper presented at the Steel Future Conference, Sandton Sun Hotel Conference Centre, Johannesburg. Harrison, W.J. & Pearson, K.R. (1996) ‘Computing Solutions for Large General Equilibrium Models Using GEMPACK’, Computational Economics, 9:83-127. Horridge, J.M. (2000) ‘ORANI-G: A General Equilibrium Model of the Australian Economy’. CoPS/IMPACT Working Paper OP-93. Centre of Policy Studies, Monash University. Inglesi-Lotz, R. & Blignaut, J.N. (2012a) ‘Electricity Intensities of the OECD and South Africa: A Comparison’, Renewable and Sustainable Energy Reviews, 16(2012): 4491-4499. Inglesi-Lotz, R. & Blignaut, J.N. (2012b) ‘Estimating the Opportunity Cost of Water for the Kusile and Medupi Coal-Fired Electricity Plants in South Africa’, Journal of Energy in Southern Africa, 23(4): 76-85. Inglesi-Lotz, R. & Blignaut, J.N. (2014) ‘Improving the Electricity Efficiency in South Africa Through a Benchmark-and-Trade System’, Renewable and Sustainable Energy Reviews, 30(2014): 833-840. Jorgenson, D.W, Goettle, R.J, Ho, M.S and Wilcoxen, P.J. (2013) ‘Energy, the Environment and US Economic Growth’. Chapter 8 in the Handbook of Computable General Equilibrium Modeling. Dixon, P.B. & Jorgenson, D.W. (eds.). North-Holland, Amsterdam. Mc Dougall, R. & Golub, A. (2007) ‘GTAP-E: A Revised Energy-Environmental Version of the GTAP Model’, GTAP Research Memorandum No. 15. Center for Global Trade Analysis, Purdue University. National Treasury (2014) Medium Term Budget Policy Statement 2014. National Treasury, Pretoria. Published on 22 October 2014, Available online at: www.treasury.gov.za Odeku, K. (2013) ‘Acting Responsibly and Promoting Sustainability: Eskom Strategic Initiatives to Reduce Carbon Dioxide Emissions’, Journal of Human Ecology, 43(3): 237-248. Roodt, D. (2014) The Next Ten Years: The Economist’s Perspective. Presentation delivered at the Expert Lecture Series, University of Pretoria, Pretoria, 18 November.

33
Spalding-Fecher, R. & Khorommbi, D. (2003) ‘Electricity and Externalities in South Africa’, Energy Policy, 31(2003): 721-734. Statistics South Africa (2012) Energy Accounts for South Africa: 2002-2009, Discussion Document D0405.1.1, Statistics South Africa, Pretoria. Statistics South Africa (2014) Gross Domestic Product, Fourth Quarter 2012, Statistical Release P0441, Statistics South Africa, Pretoria. The Presidency (2014) Twenty Year Review: South Africa 1994-2014, The Presidency Republic of South Africa, Pretoria. U.S. Energy Information Administration (EIA) (2013) South Africa Country Analysis, U.S. Department of Energy, Washington DC. United Nations Environment Program (2013) Green Economy Scoping Study: South African Green Economy Report (SAGEM) – Focus on Natural Resource Management, Agriculture, Transport and Energy Sectors, UNEP, Nairobi. Winkler, H. (2007) ‘Energy Policies for Sustainable Development in South Africa’, Energy for Sustainable Development, 11(1): 26-34. Winston, A. (2009) ‘Enhancing Agriculture and Energy Sector Analysis in CGE Modelling: An Overview of Modifications to the USAGE Model’, Centre of Policy Studies, General Paper No. G-180. World Bank (2013) World Development Indicators, World Bank, Washington DC. World Bank (2014) World Development Report 2014: Risk and Opportunity, World Bank, Washington DC.

34
Appendix A: Eskom’s New Build Programme 2014–2019
YearMedupi
(MW) (1)
Kusile (MW)
(2)
Ingula (MW)
Total (MW)
Kusile and Medupi Total Extra
Capacity (MW)
Kusile and Medupi % of
Total New Build Programme
2011 0 9600 87.82
2012 02013 02014 800 8002015 800 1332 21322016 1600 1600 32002017 800 800 16002018 800 1600 24002019 800 8002020 02021 02022 02023 02024 02025 02026 02027 02028 02029 02030 0
Total MW 4800 4800 1332 10932Source: Adapted from Eskom (2014b, 2014d)
1) Medupi has a total capacity of 4800MW, w ith 6 Units of 800MW each, here w e are assuming that the f irst unit w ill join the pow er grid in December 2014, w ith every extra unit being activated in 8 months intervals (as suggested by Eskom, 2014d)2) Kusile has a total capacity of 4800MW, w ith 6 units of 800MW each, here w e are assuming that the f irst unit w ill join the pow er grid in January 2016, w ith every extra unit being activated in 8 months intervals (as suggested by Eskom, 2014d)
New Build Coal
Notes:
35
Appendix B: Nested Production Structure in UPGEM
Source: Adapted from Horridge (2000)
--up to--
-- up to --
Labour type 1
Labour type 11
Domestic good 1
Imported good 1
Domestic good 25
Imported good 25
Industry output in UPGEM
Leontief
Intermediate composite good
Intermediate composite good
Composite primary factors
CES CES CES
CES
Labour
Land
Capital
EY Inputs or Outputs
Functional Form
KEY

36
Appendix C: Stylized representation of the core UPGEM database
Absorption Matrix 1 2 3 4 5 6 Producers Investors Household Export Government Inventories Size IND IND 1 1 1 1
1 Basic Flows CxS V1BAS V2BAS V3BAS V4BAS V5BAS V6BAS
2 Margins CxSxM V1MAR V2MAR V3MAR V4MAR V5MAR n/a
3 Taxes CxS V1TAX V2TAX V3TAX V4TAX V5TAX n/a
4 Labour OCC V1LAB C = Number of commodities IND = Number of industries S = Number of sources (domestic, imported) M = Number of commodities used as margins OCC = Number of occupation types
5 Capital 1 V1CAP
6 Land 1 V1LND
7 Production Taxes 1 V1PTX
8 Other Cost Tickets 1 V1OCT
Joint
Production Matrix
Tariffs
Size IND Size 1
C MAKE
COM V0TAR
Source: Adapted from Horridge (2000)

Appendix D: Results of the Business as Usual Scenario Table D.1: BAU Forecast for Selected Macroeconomic Variables (Year-on-Year Percentage Change from 2011)

38
Table D.2: BAU Forecast for Selected Macroeconomic Variables (Cumulative Percentage Change from 2011)