The case of Financiera Solución in Peru · The case of Financiera Solución in Peru ... SENATI...
49
Linking Business Development Services to Financial Services: The case of Financiera Solución in Peru March 2004 - Marieke de Ruijter de Wildt Document financed by the International Labour Organization
-
Upload
duongkhuong -
Category
Documents
-
view
215 -
download
0
Transcript of The case of Financiera Solución in Peru · The case of Financiera Solución in Peru ... SENATI...

Linking Business Development Services to Financial Services:
The case of Financiera Solución in Peru
March 2004 - Marieke de Ruijter de Wildt
Document financed by the International Labour Organization

ii
This is a work in progress that is distributed for comments and discussion. Contributions are warmly welcomed at the following directions: [email protected] and [email protected] The findings, interpretations and conclusions expressed here are those of the author and do not necessarily reflect the views of the International Labour Organization, and any remaining errors are the authors� alone.

i
Contents LIST OF ABBREVIATIONS.................................................................................................. ii LIST OF FIGURES............................................................................................................. ii
1 INTRODUCTION .........................................................................1
2 THE PERUVIAN CONTEXT............................................................3 2.1 SMALL ENTERPRISES IN PERU ......................................................................4 2.2 BUSINESS DEVELOPMENT SERVICES...............................................................5 2.3 FINANCIAL SERVICES .................................................................................6
3 FINANCIERA SOLUCIÓN............................................................10 3.1 THE ENTERPRISE ....................................................................................10 3.2 THE LINKAGE.........................................................................................12 3.3 IMPLEMENTATION ...................................................................................13 3.4 PERFORMANCE .......................................................................................14 3.5 COSTS AND BENEFITS ..............................................................................15
4 THE CLIENTS............................................................................17 4.1 ENTREPRENEURIAL PROFILE.......................................................................17 4.2 FINANCIAL CLIENT RELATION.....................................................................20 4.3 NON-FINANCIAL CLIENT RELATION..............................................................22 4.4 THE DIFFERENCE....................................................................................25 4.5 COSTS AND BENEFITS ..............................................................................29
5 LESSONS LEARNED...................................................................30 5.1 A GOOD PRACTICE MODEL? ......................................................................30 5.2 FURTHER RESEARCH................................................................................32
References.....................................................................................................................33
Annex A: Terms of Reference ..........................................................................................35 Annex B: Questionnaire ..................................................................................................37 Annex C: Financiera Solución...........................................................................................43 Annex D: Map of Peru.....................................................................................................44 Annex E: Selected Indicators IYB Course in 2002 ..............................................................45

ii
LIST OF ABBREVIATIONS
BCRP Banco Central de Reserva de Perú BDS Business Development Services CMAC Cajas Municipales de Ahorro y Crédito CMD Centre for Migration and Development CRAC Cajas Rurales de Ahorro y Crédito FS Financial Services GDP Gross Domestic Product IDESI Instituto de Desarrollo del Sector Informal IFP SEED InFocus Programme Boosting Employment through Small Enterprise Development ILO International Labour Office IMF International Monetary Fund INICAM Instituto de Investigación y Capacitación Municipal IPAE Instituto Peruano de Administración de Empresas IYB Improve Your Business MFI Micro Finance Institutions MITINCI Ministerio de Industrias, Turismo, Integración y Negociaciones Comerciales Intern. MTPE Ministerio de Trabajo y Promoción del Empleo MTPS Ministerio de Trabajo y Promoción Social NGO Non Governmental Organization PROMPYME Comisión de Promoción de la Pequeña y Micro Empresa SENATI Servicio Nacional de Adiestramiento Técnico Industrial SFP Social Finance Programme SME Small and Micro Enterprises
LIST OF FIGURES
Figure 2.1: Distribution of the Econmically Active Population in Peru 3 Figure 2.2: Distribution of formal and informal employment in Lima in 2001 4 Figure 2.3: Market participation in microfinance from banks 8 Figure 2.4: Participation in the regulated microcredit market of 627 million USD 9 Figure 2.5: Growth in microcredit portfolio per provider between august 2002 and 2003 9 Figure 3.1: Portfolio of Financiera Solución per type of credit 10 Figure 3.2: Number of clients per credit type 11 Figure 3.3: Performance of six IYB courses 14 Figure 4.1: Percentage enterprises per reason to embark on enterprising 18 Figure 4.2: Other sources of income besides the current enterprise 18 Figure 4.3: First and second problem area as experienced over the last year 19 Figure 4.4: Cause of the change in enterprise income per positive and negative change 19 Figure 4.5: Investments realised in the past year 20 Figure 4.6: Reason why choose for the services of Financiera Solución 20 Figure 4.7: Other microcredit providers 21 Figure 4.8: Opinion on the overall experience with Financiera Solución 21 Figure 4.9: Expressed need for training 22 Figure 4.10: Effect of IYB on the business 23 Figure 4.11: Reason to not participate IYB 24 Figure 4.12: Suggestions to improve service 24 Figure 4.13: Reason to have started current enterprise per client group 25 Figure 4.14: Main problem area in past year per client group 26 Figure 4.15: Distribution on cause of change in enterprise income per client group 27 Figure 4.16: Distribution per area of investment per client group 27 Figure 4.17: Distribution of expressed training need per client group 28

Chapter One
1
1 Introduction 1. Small enterprise development has two intervention areas: Financial Services (FS) and non-
financial services, recently known as Business Development Services (BDS). Although FS and BDS have largely been detached over the past decade, there is a renewed interest to explore the possible synergies between the two types of services. In early 2003, the International Labour Office (ILO)1 carried out a desk-research to identify existing linkages worldwide. It is the first attempt to systemise the different ways in which these services are linked and the desk-research explores the costs and benefits for the three different interest groups of FS providers, BDS providers and the small enterprise clients. The overall conclusion is that in practice, a good number of financial services are actually linked to BDS, but that little has been done to identify the applied models and to pinpoint the costs and benefits2. Obviously, this lack of adequate data impedes the development of a best practice model that could be of great value for practitioners in search of effective services delivery to small enterprises.
2. As a consequence, the ILO called for more in-dept research on the ins and outs of linkages and planned a case study that was to emphasise the costs and benefits for clients. This document presents the results of that case study that has been an assessment of Financiera Solución in Peru3. Financiera Solución is a commercial enterprise that by way of a bonus, freely offers the ILO-developed training �Improve Your Business� to its best clients. The case presented here portrays a pioneering example of linkage in one of the most developed microcredit markets of Latin America.
3. The objective of the case study was to identify costs and benefits of that linkage for Financiera Solución and its micro enterprise clients. Not only pinpointing the costs and benefits but also trying to get a greater picture of the real needs and demands of the entrepreneurs. Another part of the objective was to investigate the relation between the service demand and the entrepreneurial profile. Finally, the case study was to clarify whether Financiera Solución can be considered good practice and to draw lessons for the fields of FS and BDS. To answer that vital question whether it is a good practice model it should be realised that such question is essentially about good service delivery. Experiences and research worldwide have shown that a good service revolves around active ongoing interaction between suppliers and customers. Good delivery depends at least on five features: (1) responsiveness to client needs, (2) reliability of service delivery, (3) accessibility of the service, (4) communication and information with and to clients, (5) and the costs4. The case of Financiera Soluccion will be analysed accordingly. show how
1 The InFocus Program Boosting Employment through Small Enterprise Development (IFP SEED) and the Social Finance Programme (SFP) 2 For more details on the desk study, see the presentation of Sievers at the Fourth Annual BDS Seminar in Turin, Italy. http://training.itcilo.it/bdsseminar/ and the SEED Working Paper 64. 3 The Terms of Reference can be found in Annex A. 4 Schmidt, 1998 and Caniels, Romijn and de Ruijter de Wildt (unpublished). .

Chapter One
2
Methodology
4. The research took place in Lima, the capital of Peru, in the last three weeks of November 2003. The research team consisted of one international research-consultant and 4 national professional interviewers. Three research methodologies were used: questionnaires, in-depth interviews and focus group discussions5.On the supply side, interviews were held with a variety of actors: several staff members of Financiera Solución from the Marketing, Risk Management and Human Resources departments were consulted. Also other providers of both types of services, a federation of NGO, research institutions and regional experts have been interviewed. A focus group discussion was held with four credit agents of Financiera Solución that provide the IYB training. On the demand side, semi-structured in-depth interviews were held with at least 15 entrepreneurs, of which half were clients of Financiera Solución and half were not6. Also, two small enterprises associations were visited and interviewed. Another focus group discussion was held with 4 clients that had attended the IYB training. The qualitative methods served to understand the reality and verify the analysis of the questionnaire that was held amongst 114 clients of Financiera Solución to whom the IYB course was offered. The questionnaire can be found in Annex B. Approximately half of the survey size did not attend the training while the other half did (66 and 48). The data were analysed in SPSS with 10% significance. A one day visit was paid to the office of Financiera Solución in Chiclayo, in the northwest of Peru, in order to get a more balanced idea of Financiera Solución and its clients7.
5. The next chapter sets out the Peruvian context of small enterprises, against which background the case study will be assessed, and it portrays the markets of business development services and microcredit. Chapter three presents the case study. It depicts the financial characteristics of Financiera Solución, how the linkage came into being, how it functions within the organisation, and how it has been performing. The chapter ends by summing the costs and benefits of the training service for Financiera Solución. Chapter four is about the service user and presents the results of the survey. It gives a description of the clients characteristics and its financial and non-financial relation with Financiera Solución. It analyses the significant differences between those that decided to participate in the training and those that decided to not participate. In doing so, it reveals the different profiles of those that only use the credit service of Financiera Solución and those that use both the credit and the training service. Chapter four also pinpoints client ´s costs and benefits when a credit provider is offering training. Chapter five is the concluding chapter. It resumes the findings according to five important service features. Finally, lessons are drawn for the field of enterprise development and intervention strategies and for further research.
5 For more information on focus group discussions, see: http://www.mapnp.org/library/evaluatn/focusgrp.htm 6 These interviews followed the logic of the questionnaire 7 The winner of the premium of the Microemresario Solución of 2002 was visited here

Chapter Two
3
2 The Peruvian Context 6. Peru, the fourth largest country of Latin America, has 27 million inhabitants and is situated in
the West of South America. Half of the Peruvian population is living below the poverty line and some 25 percent is classified as extremely poor, living on less than a dollar a day. After a period of economic growth at the end of the nineties Peru went into a period of stagnation and current GDP per capita is close to 5000 USD. Invoked by El Nino, the financial crisis in Asia, and instability in neighbouring countries like Brazil, domestic unrest grew and led to the removal of the authoritarian president Fujimori in late 2000. The current Toledo administration that took seat in 2001 started out to create a more effective government and adopted a strategy of privatisation and foreign investment. The government deficit has been brought down considerably, it has been implementing tax reforms and fiscal decentralisation, and in 2003 inflationrate had been below 2 percent. Although the Toledo government lost popularity because of a number of blunders and moderate economic growth, GDP has been growing close to 4 percent, it seems committed to pro-poor growth8. The country seems to be in a moderate economic upturn, and as the IMF stated, �the macroframework is on track�9.
7. The service sector is the most important generator of GDP in Peru (65%), followed by industry (26%) and agriculture accounts for less than 10 percent of GDP. Economic growth depends predominanltly on domestic demand but typical export products are minerals and fish products. Imports have been increasing over the past years and a growing number of large supermarkets are settling in Lima what is having a negative effect on small retail enterprise10. As can be seen in the figure below, more than half of the urban labour force are working in the informal sector of which many are related to the retail sector. Despite the moderate economic advances, unemployment is still increasing and is passing the 9 percent and underemployment is widespread. Peru has a labour force of approximately 11 million persons11. Figure 2.1: Distribution of the Urban Econmically Active Population in Peru
Lima Coast Mountains Forest Informal 48% 55% 55% 56% Salaried 36% 27% 22% 20% Governmental 9% 10% 14% 12% Farmer 0% 3% 5% 8% Homeworker 5% 4% 3% 4% Idependent Profesionals 2% 1% 1% 0% 100% 100% 100% 100% Total EAP 3,157,355 1,814,943 1,340,544 616,443
Source: INEI 2000 (calculations based on numbers from 1998)
8 Banco Central de Reserva de Perú (http://www.bcrp.gob.pe/) and IMF (2003) 9 IMF, 2003, p.1 10 Banco Central de Reserva de Perú (http://www.bcrp.gob.pe/) 11 All numbers are of 2003. http://www.cia.gov/cia/publications/factbook/ and www.economist.com

Chapter Two
4
2.1 Small Enterprises in Peru
8. In Peru, small enterprises are vital for employment. There are over 3 million formal small enterprises12 in Peru that account for as much as 98 percent of the formal establishments and 80 percent of the economic active population13. Forty percent of the urban formal small enterprises are located in Lima14. Trade and services are the dominant sectors15. However, informal small eterprises are increasingly getting important as formal employment decreased over the last decade, mainly within the medium enterprise and government sectors. Current estimations of the informal sector indicate that the informal sector has grown from half in 1998 (see figure 2.2) to two third of total employment16. As figure 2.2 shows, informal self-employed businesses are the largest group of the Lima labour. The second largest group is those working in formal enterprises, then those working in informal enterprises and the smallest group are those who own a formal enterprise. Figure 2.2: Distribution of formal and informal employment in Lima in 2001 (Source: CMD, 2003)
9. Despite the importance for employment, small enterprises produce only 45 percent of the gross national product, indicating the low productivity of the sector. And although the average monthly income in the metropolitan area of Lima is estimated to be around 815 USD, the average income in the informal sector, entrepreneurs and employees, is less than half of that. Formal enterprises earn on average approximately 700 USD a month. It has been noted that the income gap between formal and informal and between small and large activities is growing. At one hand production costs are rising, like a recent increase in minimum wages and an overall rise in formal employment earnings. At the other hand, average monthly income for small enterprises has been decreasing over the last decade17. Small enterprises are progressively confronted with export promoting policies that favour larger enterprises and only certain sectors that are not typical small-scale sectors. Also, competition is increasing from large supermarkets and imports, what altogether puts more pressure on small enterprise�s income.
10. In conclusion, the informal sector is growing, absorbing redundancies from government but also from smaller enterprises that are often limited by financial and non-financial constraints 12 with less than10 employees 13 Pompyme, 2003 14 AIMS, 1999 15 Almost 75% of the EAP (CMD, 2003). 16 Chacaltana, 2001. 17 CMD, 2003
In fo rm a l e n te p r is e
3 6 %
F o rm a l e m p lo ym e n t
3 4 %
F o rm a l e n te rp r i s e
7 %
In fo rm a l e m p lo ym e n t
2 3 %

Chapter Two
5
to confront new challenges and enjoy the growth. Considering the sheer number, support to smaller enterprises seems a necessity. The case under study here, Financiera Solución, is one of the many service providers that offers its services to the enterprises that need to have access in order to survive and grown. The rest of this chapter identifies both the demand for and supply of FS and BDS in Peru as indicated in secondary sources.
2.2 Business Development Services
BDS Demand
11. A mayor problem area for small enterprises in Peru is sales. Other crucial problem areas are competition, taxation, shortage of capital, the general economic recession, and lack of clients. The chief interest of micro enterprises in training concerns sales, marketing, administration, technology and management. The number of enterprises that indicate a certain need for training also varies per city, between 5 and 20 percent. More demanded than training are tailor-made services, or technical assistance, that addresses sector specific issues predominantly in the areas of production technology, management and marketing18.
12. Actual BDS usage in Peru is moderate. Only 5 percent of the labour force in microenterprises in Lima received some sort of training between 1998 and 200019. Amongst entrepreneurs, approximately one fifth attended a BDS related training in 2000 of which most in technology, marketing, management or sales20. Even though research points out that training in Peru is an investment that does pay itself back and increases productivity21, many enterprises do not consider BDS to be a good investment22. They have negative experiences with rigid trainings that provide little space for practical and particular problems. It has been indicated that the thematic, the costs, good trainers and the timetable are crucial determinants in the valuation of training and technical assistance. Two hours in the evening once a week appears to be the most attractive format.23.
BDS Supply
13. Since the beginning of the nineties the Peruvian government and international cooperation agencies got increasingly concerned with the development of the small enterprise sector. This involvement has shaped a number of support programmes and invoked a fair offer of training and technical assistance geared towards smaller enterprises. The Peruvian government strives for a better small business environment by for example simplifying the formalization process. It also tries to improve small enterprise performance using a voucher programme for Business Development Services since 199924. In 1996 a roundtable was formed around the theme of SME development that included governmental and non-governmental agencies. In 1997, a 18 A survey held in 2001 amongst 2600 smaller enterprises in 13 different cities of Peru, IDESI, 2001 19 Based on national surveys (Chacaltana, 2001) 20 Compared to 15% of SME that consume BDS in El Salvador (Ruijter de Wildt, 21 Chacaltana and Garcia, 2001 22 IDESI, 2001 23 IDESI, 2001 24 The ministries involved with microenterprise development are MITINCI and MTPS, of industry and work respectively

Chapter Two
6
national commission for small and micro enterprises was put in place, PROMPYME, that has the mandate to coordinate, harmonize and promote enterprise development and to facilitate the functioning of small and micro enterprise markets25. In 2000, a law has been approved that defines the rules and regulation regarding SME. Service provision from the government is currently being decentralised, facilitated by PROMDE that is a consortium of the municipalities26, the ministry of work, Swisscontact and the ILO. The municipalities, the ministry of work, MTPE, and the ministry of trade and commerce, MITINCI, are the most recognised governmental agencies for BDS provision. MITINCI has Business Centres.
14. Then at the non-governmental side, COPEME is an important association of approximately 60 NGO that all direct services to SME. COPEME is a second tier organization that aims to strengthen the non-governmental delivery capacity of SME related organizations. Considering the documented service delivery, NGO have a strong position in the BDS market. Training is by far the most common service offered, followed by more specialised services like technical assistance, marketing and human resource management27. IDESI, CARE, and Swisscontact are amongst the most important providers in terms of outreach. Swisscontact, like MITINCI, has set up Business Centres.
15. Other BDS providers with significant market shares are also private sector institutes like the Peruvian institute for business management IPAE, the semi-governmental vocational training institute SENATI that mainly provides courses on skills and production technology, as well as several smaller technical institutes like the IST, universities, chamber of commerce, national technological institutes Most offer BDS free of charge, in order to bind clients and few seem sustainable in the long run.
16. Closer to enterprise reality are the associations that also offer BDS in areas like legalization, management and marketing. However, Peru counts very few associations and even less than 5 are officially registered in the whole country. Notice has also been taken of a good number of private small enterprises in Lima that offer services like accounting and marketing to other small enterprises28. Providers of inputs are perhaps most important in the BDS provision and considering the objective of this study, they come closest to linking financial services with non-financial services.
2.3 Financial Services
FS Demand
17. The main problem that Peruvian micro enterprises proclaim to experience is a lack of liquidity. However, as primer causes they mention bad economic policy, unfair competition, and the lack of liquidity in itself, and only as fourth, a difficult access to credit29. Peru and Bolivia have the most developed microfinance markets in Latin America. About ten percent of the formal microenterprises in Peru are currently having a credit from registered institutions. That implies that 2.7 million small enterprises still do not have a microcredit and
25 http://www2.prompyme.gob.pe/cebiche.php 26 INICAM 27 http://www.copeme.org.pe 28 Sievers, unpublished. 29 Centeno, 2001.

Chapter Two
7
the size of the microcredit market is growing vastly whereas the supply grew with 20 percent over 200230. The trade sector is by far the strongest demander.
18. A microcredit in Peru goes from 50 up to 1000 USD with an average loan period of 3 to 6 months. The annual effective interest rate has been nearing 60% in 200331. Nevertheless, the microfinance market is still in development: interest rates are falling and lending technologies are improving that shows in improved risk control and dropping default rates. Most institutions that offer microcredit require a business existence of at least 6 months, copies of identification, of properties when applicable, and of housing.
19. Compared to other Latin American countries, the application requirements for microcredit in Peru are relatively flexible as in some cases invoices and bills that mention the name of the enterprise, can substitute legal registration. However, often heard obstacles for micro enterprises are high interest rates and inflexibility loan schedules. Also, as most demand for credit is meant for working capital, quickness is important and there have been complaints that the issuing takes to much time32.
FS Supply
20. The provision of microcredit by non-banking institutions like NGO has been regulated since 1997 and shows clear signs of maturation. The amount of microcredit is growing while commercial credit has been decreasing. Although annual interest rates remain considerably high at a flat rate of 51 percent, it seems to be dropping. Microcredit is increasingly being provided by the regulated sector and market participation seems to be crystallising with less players that have more equal shares compared to 1999. The regulated market consists of Micro Finance Institutions (MFI) and banks, each presenting approximately half of approximately 700 million USD in 200333.
21. There are forty MFI in Peru that together allocated about 340 million USD in microcredit in 2003, referring to the �Cajas Municipales de Ahorro y Credito� (CMAC), the �Cajas Rurales de Ahorro y Credito� (CRAC), and EDPYMES, that are regulated NGO. Part of the maturation process is that MFI have been diversifying their portfolios with consumer, mortgage and commercial credits, though microcredit still accounts for half their portfolio. Very strong are the CMAC, the savings and credit banks of the municipalities that account for more than 70 percent of all MFI loans and registered a growth of 40% in credits in 2003. CMAC appear to be the most effective MFI in lending microcredit as well, showing the best indicators of all. The CRAC have the highest default rates and the EDPYMES that have the highest operational costs (17%), worst leverage and worst profitability. Nearly three fifth of the credit from MFI is borrowed to commercial enterprises34.
22. Microcredit is increasingly being provided by banks, what now presents 3 percent of their portfolio, up from 2 in 2002. At the closure of 2003, Peruvian banks had about 290 million USD allocated as microcredit. The most important banks are Banco de Trabajo, MiBanco and the Banco de Credito. It is important to realise that the latter has become full shareholder of 30 Stauffenberg, D. von, 2002 31 Effective interest rate is the nominal interest rate (53 % in 2003) corrected for interest payment 32 Ramirez Flores, 2001. 33 The non-regulated NGO are left out of scope here, tough in December 2002 their effective market share was estimated to be 20 percent (Copeme, 2003). Seen their non-regulated character, these are not considered to compete with the same market of Financiera Solución. 34 http://www.sbs.gob.pe/

Chapter Two
8
Financiera Solución at the beginning of 2004, as the graph hereunder shows that the Banco de Credito is rapidly embarking on microcredit, from providing less than 10 percent of the regulated microcredit market in 2001 to more than 20 percent in 2003. Financiera Solución will keep its own identity though. Figure 2.3: Market participation in microfinance from banks (2001-2003)
0%5%
10%15%20%25%30%35%
2001 2002 2003
Share MiBanco
Share Banco de Credito
Share Banco de Trabajo
Source: Superintendencia de Banca y Seguros de Perú
23. The Banco the Credito de Peru is the largest bank that provides 33 percent of all direct credit in Peru. It is also the most diversified bank and offers a wide range of financial products with a professional service. Unlike the other banks, it is not explicitly promoting microcredit but is entering the microfinance market rather rapidly through its many clients. The Banco de Trabajo gained the largest market share because of its low interest rate of 46%, its geographical spread, and its quick service. Though principally directed at workers, it is increasingly targeting small enterprises and sell themselves as a people�s bank that aims at those that have no access to the traditional financial system. The bank has 72 offices all over the country with only half of its credits in Lima. The trade sector seems their main concern, being a sector in need of quick working capital, and is now offering a continuous credit-line to their good-paying clients. Nevertheless, it offers relatively rigid lending schemes and has the reputation of disinterest in the client�s enterprise, offering nothing like BDS. MiBanco has been the first Peruvian private bank to dedicate its services to micro enterprises, the second in Latin America. In 1998, one of the most successful NGO in microfinance Accion Comunitaria del Peru (ACP) of ACCION International, evolved into MiBanco that had been active in microcredit since 1982. Its only product is microcredit and charges the highest interest rate of 65 percent. Currently, MiBAnco is focusing on the metropolitan area with 80 percent of its credit and 23 of its 27 agencies allocated in Lima. MiBanco also offers training to all its clients in the form of DIME that stands for Programa Diplomado en Microempresa. Basically, it are presentations on certain themes like marketing or rights that are offered free of charge. MiBanco is strongest in identifying itself with microenterprises, has the most flexible lending schemes and promotes itself with personalised attention, easy accessibility, fastness and training and consultancies.

Chapter Two
9
Figure 2.4: Participation in the regulated microcredit market of 627 million USD (August 2003)
F in a n c ie ra S o lu c ió n11%
B a n c o d e C ré d it o8 %
M i B a n c o11%B a n c o W ie s e
5 %B a n c a M u lt ip le
6 %
C R A C 6 %
E D P Y M E S 8 %
B a n c o d e T ra b a jo
13 %
C M A C 3 2 %
Figure 2.5: Growth in microcredit portfolio per provider between august 2002 and 2003
9 %
8 2 %
5 4 %
3 6 %2 9 % 2 8 % 2 6 %
1 8 %
8 %1 %
TOTAL
ME RC
ADO
Ban co d
e Cré
dito
B an co d
el Tra
bajo
Mi B
an co
Finan cie
r a S
o luci ó
n
EDPYMES ( 1
4)
Ba nco W
iese
CRAC (1
2)
CMAC (1
4 )
Banca M
u l tipl e
(5)
Sources: Superintendencia de Banca y Seguros de Perú
24. Financiera Solución is strictly speaking not a bank and will be discussed in the next chapter, but as can be seen in figure 2.2, provides more than 10 percent of the market, of the total portfolio. Although Financiera Solución claims that the CMAC are their strongest competition, it seems that both the Banco de Credito and the Banco de Trabajo are rapidly gaining ground.

Chapter Three
10
3 Financiera Solución 25. After having described the market in which Financiera Solución is operating, this chapter will
depict the case-study. It describes a bit of its history, how it became primarily a microfinance bank, its portfolio and its client. After explaining how the linkage with training came into being and how it has been performing, the last part sets apart the costs and benefits for the microfinance provider.
3.1 The Enterprise
26. Financiera Solución is one of the four finance companies that operate in Peru and the only one that offers microcredit to small enterprises. The company was founded in 1996 by the Banco de Credito del Peru and a Chilean Bank35. It focused on low-income clients and entered the market with only consumer credit. However, it soon noticed that microcredit was a much better business and started to target small enterprises in 1999. Rapidly microcredit became its most important product: the share of microcredit in its portfolio almost doubled in 2 years time, from 36% in 1999 to almost 80 percent in 2002. The profitability of Financiera Solución depends on the microcredit business.
27. Financiera Solución offers 6 different credit products, of which 3 are specifically directed at small enterprises and 2 at consumers, and 1 is a credit card. Most important is the revolving credit line for small enterprises that is different to other banks in that it is an active account and interest are only charged over the used amount. If regularly paying, the client can easily extend or enlarge the amount. This product is linked to the Improve Your Business training. All products require regular identity copies of both person and enterprise, collateral and the enterprise should be older than 1 year. Crecer, what means grow, is credit directed only at commercial enterprises and in stead of enterprise registration, requires that the entrepreneur is associated in a market. Crecer is not an account but a fixed amount. The third product is Equipa that is meant to purchase equipment. As can be seen in the figure hereunder, these three products together account for 83 percent of its total credit portfolio of 87 million USD in 2003. Figure 3.1: Portfolio of Financiera Solución per type of credit (in million USD)
Source: SBS
35 Banco de Credito e Inversiones de Chili
0
1 0
2 0
3 0
4 0
5 0
6 0
7 0
8 0
9 0
2 0 0 1 2 0 0 2 2 0 0 3
C o n s u m e r c r e d i t
M i c r o c r e d i t

Chapter Three
11
28. If the clients of microcredit are compared to those of consumptive credit there are only two characteristics that stand out: there are more women and the level of education is considerably higher amongst the microcredit clients. There are more females amongst the small enterprise credit holders than amongst its consumer clients, respectively presenting 52 and 38 percent36.
29. Though the microfinance sector as a whole grew with 9 percent, the microcredit portfolio of Financiera Solución grew with 32 percent in 2002 and 20 percent in 200337. In comparison to the other financial enterprises in the microcredit market, Financiera Solución has high administration costs but one of the best portfolios in terms of default rate: 2 to 3 percent of the microcredit portfolio is considered to be in risk, which is reasonable, and reached a profitability of 7.3 million USD in 2003. See annex C.
30. Financiera Solución is not the cheapest credit provider, nor the quickest but is competitive on its service quality. In the beginning of 2004 the Banco de Credito bought all shares of Financiera Solución and they will gradually integrate with the aim to unite strengths and synergies and reduce operational costs. That makes it likely that their microcredit interest rates will drop, as the Banco de Credito operates with lower rates, and that delivery will improve.
31. An important factor in its growth is its extensive geographical outreach as only 42 percent of the credits are in Lima whilst the rest is spread over the different departments, contrary to the Banco de Credito that has 80 percent in Lima. Taking into account that indebtedness is higher in the provinces, the risk management of Financiera Solución can be considered effective. Financiera Solución has 32 branches, of which 10 in Lima, and being part of the largest national bank it uses the infrastructure of de Banco the Credito with more than 200 branches and 425 ATM. See annex D for a map of Peru with the offices. It currently has approximately 1000 employees38 and half of its approximately 80.000 clients are small enterprises. Figure 3.2: Number of clients per credit type (in thousands)
Source: Annual Report Financiera Solución 2002
32. Financiera Solución seems to have a stable market niche as the number of clients by and large stays stable, while its portfolio is steadily growing. Its main competition in the provinces comes from the CMAC and the CRAC, while the metropolitan competitors are MiBanco and 36 Annual report 2002 37 While its consumer credit respectively decreased with 12 and 13 percent. 38 500 less than in 2002 what might be due to the merger with the Banco de Credito.
0
10
20
30
40
50
60
70
80
90
1 999 2 00 0 2 0 01 2 002
C ons um e rS m a l l en t ep ris es

Chapter Three
12
the Banco de Trabajo. To more or lesser extent they compete on loan flexibility, quickness and or interest rate. The competitive advantage of Financiera Solución however seems to be its personalised service and aims to be identified with small though growth oriented entrepreneurship. Unlike for example the Banco del Trabajo, it visits every new enterprise39. Apart from its financial services, it offers non-financial services aimed at small enterprises. It publishes a magazine �Tiempo de Pymes� that gives institutional information, news over microfinance in general and it shares success stories of clients. Also, their website includes a freely accessible consulting page with tips and tricks for improved enterprise performance40. However, more important is that it is the only bank that freely offers business training.
3.2 The Linkage
33. In short, Financiera Solución offers a training package to clients of the revolving credit line for small enterprises, only to those that have a good paying record. A selection of their own credit agents have been trained and give the training to the clients. It is an example of a unified voluntary service provision since both FS and BDS are unified in the same organisation and voluntary as clients can opt to assist, with the particularity that the service is offered only to a selected group41.
34. At the end of 2000, Financiera Solución organized Focus Groups Discussions with some of its better clients. It wanted to implement a stimulus for good payment behaviour and consulted them on attractive possibilities. Amongst some regular ideas like gifts, they also suggested business training what because of its win-win potential, immediately convinced Finaciera Solución and it started to look for trainings. The training had to fit the needs of small enterprises, including those in the provinces where half of its clients are. They deliberated over different offers from universities and private training institutes but most were expensive and not applicable to the reality of small enterprises. Finally, Finaciera Solución chose for the Improve Your Business (IYB) package and the Business Game with COPEME, that is the institution responsible for the distribution and development of the ILO training package in Peru.
35. IYB is a basic training package that has been development by the ILO and is being applied in more than 80 countries. IYB, oriented to existing small enterprises, assists entrepreneurs to improve their current operation in terms of production, control and management and provides tools to plan towards the future. The teaching methodology does not require high levels of education and is practical with simulation games. It contains 6 modules that gradually lead the participant to formulate an investment project, that can concern the existing enterprise or an expansion into new areas. The first course is marketing, followed by buying, stock control, costing, accounting and it ends with business planning. Each module is supposed to take 2 sessions of 3 hours each, giving a total of 36 to 40 hours. The Business Game is an integral part of the IYB training, it is a simulation game that gives the opportunity to apply and experience the learned.
39 See annex E for its vision and mission 40 http://www.Solución.com.pe/07_asesora/index.asp 41 See the classification of the desk study (Sievers, in print)

Chapter Three
13
3.3 Implementation
36. After a pilot project in 2001 in which COPEME directly trained 20 clients, Financiera Solución stood for the choice to continue to subcontract COPEME, or to train its own staff. It opted for the last option because it was cheaper, allowed to maintain quality control and to strengthen its relation with its clients. It aimed to train two credit agents in each of its 32 offices, which were selected at branch level.
37. The IYB package is only offered to the better clients that are selected on four criteria: they should have a microenterprise credit, the enterprise should have more than 1 year of existence, show a good paying history with no record of default nor appear in Credit Bureau of other banks, and have an active credit line. Those that meet the requirement are invited by invitation and informative talks at branch level. In general, the risk department is responsible for the evaluation of the clients and makes the selection, while marketing is responsible for the actual invitation and the general dissemination. For example, it developed a folder that explains the why�s and the how�s of IYB, directed at its own staff in order to stimulate the outreach to its clients. The trainers have to register and inform marketing about the participants that actually participate, who in turn report further to risk. The IYB trainers, together with the head of public relations in each branch, are responsible for the execution of the course, meaning that they have to find a place and the resources. The format is set to three sessions per week of 3 hours with groups of about 20 persons. At the end, the investment projects that are developed during the training are sent to the risk department where they are evaluated and judged for financing. After the course is finished, the trainers should maintain contact to monitor change and should stimulate continuous exchange between the participants.
38. In 2002, Financiera Solución started to issues a premium for the best micro-entrepreneur of the year of 2800 USD, complementary to the training. The micro-entrepreneur of the year is selected out of those IYB participants that received approbation for the credit to finance the investment project. All enterprises that ever participated in IYB and got the credit will be considered, taken the assumption that enterprise performance is monitored. The project can refer to improvements in the existing enterprise, expansion into other areas or the purchase of assets and all participants from former years as well, automatically participate. A special committee selects a number of enterprises from each sector (trade, production and services), based on the level of creativity, ability to face challenges, the product quality, the growth path the enterprise as gone through and its competitive strategy. Then, analysts form the risk department will visit, evaluate and rank the pre-selected enterprises thoroughly on eight business criteria42, two criteria linked to their relation with Financiera Solución43 and two related to their community44. Then the committee receives the ten enterprises with the highest scores that are once more checked in external and internal data bases for their credit history, and finally the committee selects the micro-entrepreneur of the year. In august 2003 the second Micro-entrepreneur of the year was nominated.
39. The motivation for the premium had been to recognise and support entrepreneurial investment behaviour amongst small-scaled entrepreneurs and to contribute to a healthy competitive environment. For Financiera Solución itself, the benefits they are aiming at are to 42 (1) growth of the enterprise, (2) innovation and creativity, (3) quality of its products and services, (4) efficiency in management, (5) originality of the business concept, (6) future potential, (7) marketing strategy, and (8) capacity to confront and surpass crisis. 43 (1) compliance with payment schemes and (2) other activities that are projected 44 (1) active participation in their neighborhood, (2) creation of employment

Chapter Three
14
strengthen client�s fidelity and to improve its portfolio as the premium should stimulate good-paying small enterprises to invest and enlarge their credits. Another purpose is to strengthen their brand name in the microcredit market, since Financiera Solución is positioned a bank lender that is concerned with the development of micro enterprises. The winner is extensively promotion on posters, television and newspapers.
3.4 Performance
40. Financiera Solución started to give IYB in 2001 and has trained 81 of its staff members and given 6 trainings since45. Figure 3.3 shows the most important numbers. Up to date, Financiera Solución has invited 9140 clients of which almost 30 percent participated, an improvement compared to the pilot training in which 200 clients had been invited and only 10 percent participate. In total it has trained 2600 entrepreneurs, about 7 percent of all its micro enterprise clients, and almost 60 percent of them have been trained in 2002. The 6 courses were held synchronically in several offices. The first time, 26 of the 32 braches participated with an average of 25 participants per office. The other times it was roughly the same situation only in the fifth round in 2002, there were only three offices involved. On average, 17 percent of the IYB participants submitted an investment project (443 of the 2609 participants) but that ranged from 63 to 9 percent between the six courses. If compared to another case study of IYB linked to microcredit where 20 percent submitted a business plan to a financial institution, it seems regular performance46. One third of these 443 projects has been approved what amounted to a total credit increase of 462 thousand USD. The average size of the financed projects is about 3000 USD. The large majority of the projects concerned working capital and only 16 percent was meant for investment in fixed assets (see annex E). Figure 3.3: Performance of six IYB courses
Year 2001 2002 2003 Month Nov Jan May Jul Nov Feb umber of staff trained 20 30 31 Courses I II III IV V VI TOTAL Number of offices 26 21 30 18 3 25 Invited clients 2187 1489 2548 973 400 1543 9140 Participants 656 521 637 292 40 463 2609 Invited that participated (%) 30% 35% 25% 30% 10% 30% 29% Average participants per office 25 25 21 16 13 19 21 Number of presented projects 110 119 60 65 25 64 443 Participants that presented (%) 17% 23% 9% 22% 63% 14% 17% Number of approved projects 47 25 24 28 11 24 159 Approved projects (%) 43% 21% 40% 43% 44% 38% 36% Amount approved (USD) 115,108 58,020 77,639 101,969 40,233 68,732 461,701 Average project (USD) 2,449 2,321 3,235 3,642 3,658 2,864 2,904
Source: Financiera Solución
41. The fact that in 2003 they only realized one training is mainly due to internal reorganisation, the integrating with the Banco de Credito de Peru. The expectation is that in the course of 2004 the number of trainings will pick up again. Concerning the best Micro-entrepreneur of 45 Though another study of Herrera (2003) mentions 8 trainings, but there were no reaffirming data within Financiera Solución 46 http://www.ilosiyb.co.zw/linkages_to_finance.html

Chapter Three
15
2003, the risk department had pre-selected 78 projects, presenting half of the approved projects, that led to the short list of ten and the final nomination of a small retailer in august 2003.
3.5 Costs and Benefits
42. According to Financiera Solución, it invested to date a total amount of 78 thousand USD in the training: 18 in the development of the material, as much as 50 in advertisement, and 10 in operational costs. It did not further specify, but the cost of COPEME intervention only must have been around 25 thousand USD when taking the price COPEME claims to charge. That includes the training of their credit agents, summing to 11.106 USD47, Business Games for each office that comes to 1.600 USD (50 USD times 32 offices), and the training material for the clients that had a cost of 4.5 USD per head, mounting to a total of 11.741 USD48. Perhaps Financiera Solución negotiated a better price in the end and for example did not pay for all training material for each of the 2609 participants, it is still unlikely that 18 thousand covers all development cost. On the other hand, the high advertisement costs, presenting more than half of their indicated investment, serve the overall marketing of Financiera Solución and not merely IYB cost. It has been impossible to get a more accurate picture of the actual costs, but it seems reasonable that the costs without the invested hours of the credit agents, are around 78 thousand dollars. However, this still excludes the salaries of the 81 credit agents when they were trained themselves, probably their travel costs from the offices into Lima what in the case of Peru often will be by air, and their time when giving the training to the clients49.
43. Non-financial costs could come from not-invited clients that might leave the bank just because of its policy of exclusion. However, no such signs were found. Another cost could concern staff motivation, getting the extra responsibilities without extra compensation. Yet again, no sign seem to point to less motivation. On the contrary, to be trained seems regarded as an honour and motivates staff because of the more direct contact and prestige with clients that, as will be seen in the next chapter, highly appreciate their training service. Another important aspect that could be mentioned as a cost is the rigidity in expanding into follow-up and more advanced trainings. Financiera Solución clearly expressed an interest to both COPEME and to the ILO in more training, in IYB but more even in advanced courses. However, since COPEME is depending on one single ILO certified master trainer that at the moment of the research had left the country, it cannot provide more training. Clearly, the Training of Trainers system as functioning in Peru is too rigid to react to market signals.
44. Concerning the financial benefits, between 2001 and 2003 the profit leverage of 1 USD direct credit was 0.0950. It is hence very likely that every dollar that was approved as a result of IYB generates at least 9 dollar cents. At least, because compared to the total credit portfolio the IYB clients are amongst the better clients of Financiera Solución, the projects have been evaluated thoroughly, and they have completed the IYB. Then, the IYB training will have leveraged at least the total of the financed investment projects (462 thousand USD) times 0.09, what comes close to 42 thousand USD. Hence, if indeed the training has cost 78 47 26 USD for the modules times 81 trainees, plus 3 times 3000 USD for trainer fees in three training sessions 48 Financiera Solución, 2001. 49 Training of credit agents: 81 times 50 hours=4050 hours. Providing training: 123 courses times 40 hours=5000 hours in total. The renting costs for a locality and refreshments are left aside in this calculation as each office is responsible to look for additional funds that cover that. 50 Total net profit divided by total direct credit portfolio

Chapter Three
16
thousand USD, it is very likely that more than half of the investment has been directly covered by the profits leveraged by the increase in credit, in about two years time.
45. Then concerning the increase in loyalty of its clients the results look very promising. Trainers are supposed to hand out an evaluation form at the end of every training. That evaluation pointed out that the participants are very satisfied. All are very content on the content of the course, the large majority thinks the examples are practical, and that if something is not understood, most of the time it is explained again. On the quality of the trainers the participants appear to be very positive as well, and all say that IYB will improve their business. Only 6 percent had not been satisfied with the modules, mainly because of a lack of time. The most useful modules had been costing, stock control and marketing. Two fifth opted for more modules, mainly in the areas of marketing, taxation and human resource management. As much as 95 percent would recommend the course to others51. Also, since it is the same credit agents that is also giving the course, relation between client and Financiera Solución is strengthened, improving overall accessibility, what specifically in the provinces is a competitive advantages.
46. Another benefit that will be better measurable after more time and a more constant training performance, concerns the portfolio quality. It is likely that if Financiera Solución indeed manages to fully institutionalise the IYB training and pick up its activities, the portfolio quality will increase as the �V.I.P.� clients are successfully stimulated to further increase their credit. Particularly so if taken into account that Financiera Solución has a strong presence in the provinces where default rates are significantly higher than in the urban areas. The potential for added value of the IYB training is higher than in urban areas as rural training supply is weak.
47. An important benefit of the best micro-entrepreneur of the year is the emphasised link between successful entrepreneurship and Financiera Solución. It strengthens clients fidelity as they see that Financiera Solución organises something extra for them. And, it is not only a stimulus for the enterprises, but obviously also for the branches and the IYB trainers in particular to get recognition at national level.
48. Financiera Solución is the only institute in Peru that received IYB from COPEME. Other training products from the ILO sold by COPEME aim at illiterate enterprises and are more popular amongst non-profit organisations52. The fact that Financiera Solución has 40.000 microenterprise clients, of which not even 10% is trained as yet, implies that there is good scope for increasing the already substantial outreach.
49. The IYB training seems to increase staff motivation as it is something extra to their job that receives a lot of recognition from both employer and clients. For example, one trainer would split the group into wholesalers and retailers in the costing module because he found the differences too large and people were loosing interest. Another would organise a dinner at the beginning of the course in order to feed the group dynamics. The trainers are challenged to maximize the impact of the training because of the link between the investment project and the premium of the entrepreneur of the year. Overall, Financiera Solución appears very content with the effects of IYB on the enterprise. A crucial aspect the linkage is that it improves the proximity between service provider and clients, enabling a successful customer-driven service strategy that, what will become clear in the next chapter, keeps clients satisfied.
51 Financiera Solución 52 Herrera (2003)

Chapter Four
17
4 The Clients 50. This chapter presents the results of a survey amongst 114 Financiera Solución clients in Lima
with the objective to understand the costs and benefits for clients of linking financial and non-financial services. All interviewed had been send an invitation for the IYB course, hence considered good client, however half actually participated while the other half not. Besides the costs and benefits for both groups, the objective was to analyse whether there was any significant difference between those two groups. The survey had four parts: it drew a personal profile, an enterprise profile, a financial-client profile about the credit relation with Financiera Solución, and a non-financial-client profile that stipulated the experience with IYB. This order will be followed in the remainder of this chapter. First, the entrepreneurial profile will be described by the personal and enterprise characteristics, then the relation with Financiera Solución what is followed by the non-financial. Until then, the whole survey is taken as one and serves to describe the type of microfinance client and its relation with Financiera Solución. Then, the differences are depicted between those that had decided to participate in the IYB course and those that for some reason had not, providing insight in characteristics and motivation that influence the decision to invest time in entrepreneurial training. Finally, the actual costs and benefits are highlighted for the Financiera Solución clients offering them training. The results are presented in percentages, however it should be realised that for example 5% of the whole survey refers to 6 microenterprise clients.
4.1 Entrepreneurial Profile
51. The personal profile in the survey of the 114 enterprises indicates that the sample presents regular Financier Solución customers in terms of gender, civil status and education53. In the whole survey there were a bit more women (53%), 80 percents was married, and women had a slightly lower level of education then men. Half of the clients have high school as highest education level and almost thirty percent university. About one fifth (18%) had received an entrepreneurial training before, other than IYB, what is considered typical for small enterprises in a market as Lima, compared to other Latin American countries54. The largest group received the training from private enterprises (55%), then government institutes (25%), cooperatives (15%) and only a few from universities (5%). The majority of those had done a general course like accounting or marketing, only 30 percent had done a specialised course for example in technology. Just 4 of the 20 enterprises (18%) had done two courses. For the large majority (86%) the enterprise is the most important source of income. Almost half of the survey had gained entrepreneurial experience before starting the current enterprise, 30 percent in family businesses and 17 percent in a business that they had owned. Concerning age however, the survey clients are not typical Financiera Solución clients as the average age is rather high with 48 years, ranging from 25 to 73, but forty percent is over 50. In conclusion, the clients in the survey are mid-aged urban entrepreneurs of both genders, rather well educated, that are familiar with entrepreneurial training, and have a lot of experience in enterprises.
53 Compared to studies and data on their clients from Financiera Solución 54 De Ruijter de Wildt, 2003.

Chapter Four
18
52. About the enterprise profile, 12 percent has another associate that in most cases are family members. The average age of the enterprises is 11 years. When asked the reason why they started the enterprise, as much as 45 percent said that they wanted their independence, almost 30 percent because they wanted to increase their income, for 14 percent is was family tradition, 8 percent because of unemployment and 4 percent because they saw a market opportunity. The surveyed clients are hence rather independent, growth oriented entrepreneurs. Figure 4.1: Percentage enterprises per reason to embark on enterprising
Source: Survey
53. Only 2 percent of the enterprises are not registered in the national system. The large majority is active in the trade sector (74%), then services is the most important group (24%) and only few are in production (2%). It are small enterprises in term of employees, 6 percent is self-employed, what can be considered few, and almost 90 percent has 5 or less employees. The enterprises are tightly linked to the family as half of the enterprises employ full-time family labour and seventy percent of all the employees in all 114 enterprises are family, part time and full time. The average monthly sales are around 4000 USD and average profits around 1000 USD, although 50 percent has a profit of less than 500 USD. So, the enterprise clients can indeed be considered small. What is outstanding is that though the enterprise is the most important source of income, 60 percent has other sources of income. For 45 percent that is another business. Figure 4.2: Other sources of income besides the current enterprise
45
14
29
84
market oportunity
unemployment
increase income
family tradition
independence
other family income
4%
employment7%
pension4%
no40%
other enterprise
45%

Chapter Four
19
54. If asked about their main problem faced in the past year, about one fourth said to have had no problem whatsoever. More than half though had problems of competition for example loosing clients, 15 percent indicated finance as main problem area, like shortage of capital or too high interest rates. Some had problems in the enterprise due to bad administration or other management issues, together 5 percent, and another small cluster of 4 percent mentioned as first problem area the institutional environment like security and authorities. If asked about their second most important problem, competition is considerable less dominant, credit and management are increasingly mentioned as problem areas and mainly environmental issues show a strong increase. Still, in general competition is felt as the most important problem, to a lesser extent the access to credit and least even, internal enterprise issues as management issues. Figure 4.3: First and second problem area as experienced over the last year
Pr ob le m 1 Pro b lem 2
Mana gemen tIns itu tiona l En v iro nme n t
Cr ed itCo mpe tition
No
0
10
2 0
30
40
5 0
60
Source: Survey
55. A few questions dealt with the perceived situation of the enterprise and overall perceptions are rather positive. The smallest group, about 21 percent of the interviewed clients, opinion that the income from the enterprise has been decreasing over the past year, 36 percent think it has remained the same, and as much as 43 percent experience an increase in income. The large majority of those that had experienced a positive change in the past year ascribed the change to internal factors like enterprise management (92%). However, two third of those that experienced a negative trend in income perceived the national economic situation as the main causing factor, and roughly one third blamed increasing competition for the downturn. Only 6 percent ascribe it to internal causes. Hence, there is a significant tendency that clients that perceive current enterprise situation worse than the year before, attribute that to external factors. Figure 4.4: Cause of the change in enterprise income per positive and negative change
P o s i tve N e g a tive
e n te rp r is e m a n a g e m e n t
c o m p e ti tio n
n a tio n a l e c o n o m y
0 %
2 0 %
4 0 %
6 0 %
8 0 %
1 0 0 %

Chapter Four
20
56. Asking about past investments, eleven percent of the enterprises said that they employed more people in the last year. In total, 12 fulltime and 7 part-time jobs were created. One third expanded in last year their assets. Almost half in machinery, one fourth in personnel, two fifth invested in its locality and 8 percent in vehicles. Almost half (48%) added a new product to its assortment, and 40 percent improved its products, 18 percent said that they reduced production costs over the past year, and 18 percent claimed to have started new projects in order to let the enterprise grow. In conclusion, there is a tendency of growth amongst the interviewed Financiera Solución clients. Figure 4.5: Investments realised in the past year
0% 10% 20% 30% 40% 50% 60% 70% 80% 90% 100%
new employment
new assests
new products
improve product quality
reduce production cost
no
yes
Source: Survey
4.2 Financial Client Relation
57. All enterprises have had a credit with Financiera Solución and 80 percent had an active credit at the time of interviewing. On average, the clients had been with Financiera Solución for 3 years, ranging from 1 to 7 years, and currently had had an average of three credits with Financiera Solución. One fourth of the interviewed had choose for the services of Financiera Solución because of its service quality. To many others, Financiera Solución had been recommended, another important motivation had been the promotional visits of Financiera Solución and 15 percent found the credit offer most appropriate. A smaller group had been client of Ser Banco, a microcredit bank that went bankrupt which portfolio was bought by Financiera Solución, so automatically became client. And another reason to choose for Financiera Solución had been its proximity. Figure 4.6: Reason why choose for the services of Financiera Solución
15%
22%
23%
9%
27% service quality
proximity
ex Ser Banco
recommended
FS visited
competitive credit
Source: Survey

Chapter Four
21
58. Almost half applied for the credit because they were in need of working capital (47%), 42 percent needed investment, 5 percent wanted to use it for family issues, 3 percent needed to pay debts and anther 3 percent wanted to use it for another enterprise. The largest group indeed used the credit for working capital (44%), and 44 percent for investment. Then 10 percent used it for family spending and 2 for the payment of other loans. Hence, working capital and investment are equally important. Further it can be mentioned that, despite being V.I.P. clients, as much as 80 percent had had payment difficulties. That does not mean that they were overdue, but that they found it difficult to meet the payment schedule. Only 13 percent used other services from Financiera Solución, mainly credit cards and some consumption credit. The remaining 87 percent only had microcredit. However, more typical for such a develop microfinance market as Peru, almost half had a credit with another provider, at the same time. Most important competition came from MiBanco and the Banco de Trabajo. Figure 4.7: Other microcredit providers
0% 10% 20% 30% 40% 50% 60%
No other credit
MiBanco
Banco de Trabajo
Banco de Credito
CMAC and CRAC
NGO
Other banks
Source: Survey
59. In general, the interviewed clients were content with Financiera Solución. Only 5 percent had had bad, to very bad experiences against 70 percent that had good to very good experiences. Figure 4.8: Opinion on the overall experience with Financiera Solución
25%
67%
very good
good
regular
bad
very bad
Source: Survey

Chapter Four
22
4.3 Non-financial Client Relation
60. And as was said earlier, 18 percent of the clients had had an enterprise-related training before with other, mostly private institutions. However, when the clients were asked about any need for training, as much as 83 percent indicated that they indeed wanted training in some area, only 17 percent did not. Management was by far the most mentioned area of training needs, followed by marketing, and then technological areas. Hence, there seems to be a real need for IYB-like courses. Figure 4.9: Expressed need for training
8%
30%
46%
sales
cash flow management
export
planification and projection
management
marketing
purchase input
technology
Source: Survey
61. More than half, 58 percent of the sample never participated in the IYB training, and in 14 percent of the cases it was somebody else that had participated. Hence, 28 percent of the 114 interviewed participated in the IYB training directly. In the cases of �others� that participated it were mainly close family member like the partner and in many cases, the invited could not go because of time constraints. Sixty percent had done the IYB course in 2002, thirty in 2003, and ten percent in 2001 what reasonably represents the frequency of courses as given by Financiera Solución. For half of those that participated, the reason to do so was because of the invitation. The other half participated because they wanted to improve (19%), because they needed consultancy (17%), for 6 percent it seemed useful and 4 percent needed credit.
62. As much as 65 percent was very happy with the format, the others had no opinion. When asked for suggestions to improve the format, 60 percent had none, 17 suggested a different time, 8 percent on the place, and 6 percent suggested to give it a continuous format. Some single remarks were made on the number of participants that should be more, a better link with credit and a new bulletin. Twenty percent had doubts when they decided to do the training, mainly on the content and relevance, the connection with credit and the timing. Only 35 percent of the interviewed participants could participate in all modules. The 65 percent that did miss one or two modules did so because of sickness, travel difficulties, timing and replacement problems. Two percent dropped out because they were disappointed in the link with credit that was not that direct as they had hoped for.

Chapter Four
23
63. Although the evaluation forms that are filled in right after the training suggested that costing, stock control and marketing are the most important modules, when asked which of the different IYB modules had been most interesting, one third of the participants did not know. However, the other largest group (23%) said that all had been important. Marketing (17%) and business planning (10%) were the most popular modules. Only 6 percent thought record keeping was most interesting, and stock control, buying and costing were least appreciated, what is particular if considered that the largest articulated area of training need had been management55.
64. When asked if they had any suggestion to improve the content of the course, 73 had none. Interestingly, 10 percent suggested to amplify the course, 4 percent suggested to differentiate between different sectors and again some loose remarks were that it should be more practical, that other should be allowed to participate in the training as well, improve the quality of the trainer, that it should be shorter and more compact, that it should be offered more often, and a last comment was that they should provide follow-up and monitoring. Only 4 percent had received any form of follow-up. In general, the clients were very positive on the content of IYB. Only 2 percent had found it regular, while 65 percent found it good to very good and the rest had no opinion. About the costs, 67 percent said they no cost at all. The 33 percent that did made some cost, 30 had costs in transportation and a 3 in replacements, of 15 USD on average.
65. As much as sixty percent had the opinion that the course had a positive effect on their business. As can be seen in figure 4.10, most mentioned an overall improve in business management. Management, cash-flow and sales were other important areas where an impact was felt. Six percent of those that had done the course said they employed extra people as a result of the course. The majority (56%) remained in contact with the other participants. Strongly underpinned in the Focus Group discussions, contact with the other participants was one of the most import aspects of the course. Not only to learn from another�s experience, but a feeling of recognition with people who had been in similar situations was felt as a stimulation factor. Figure 4.10: Effect of IYB on the business
s ta rte d o th e r p ro ye c t
a cce ss to c re d it
ca sh flo w
c lie n t tre a tm e n t
sa le s
a d m in is tra t io n
o ve ra ll m a n a g e m e n t
Source: Survey 55 A plausible explanation is that the term administration in Spanish is and can be understood as general management.

Chapter Four
24
66. Quite a large group of those that did not participate (36%) did not know why they had not participated, that is to say, had no particular reason. The most important reason (35%) to decide not to participate was time. Strangely enough, as much as 24 said they did not receive an invitation. If Financiera Solución indeed send the invitation, the only reasons can be that the invitations got lost in the enterprise, or was wrongly written. However, it stands out that only 5 percent was convinced that they did not need the course or were not interested. Figure 4.11: Reason to not participate IYB
no need , 5% no reason , 36%
not received invitation,
24%
no time, 35%
Source: Survey
67. When asked what they thought about a microcredit provider that also gave training, 76 percent was had the opinion that training was always good, 5 percent mentioned a win-win situation for client and bank, 4 percent emphasised that it was for free, and 7 percent thougt it was not necessary. The other 18 percent had no opinion. Only 8 percent had an answer when asked if there were any disadvantages on the linkage, 3 percent thought in this respect that the training was too general, 2% thought the place was wrong, 2% thought so about the timing and 1% did not consider it the responsibility of the bank. Obviously, the combination credit-training is experienced positive as 82 percent said so, 11 percent had no opinion on that and only 8 percent thought the combination was not good. The final question, how they thought that Financiera Solución could improve its service, gave mainly ideas on its financial service as can be seen in figure 4.12, specifically on the payment schemes (75%). Some 6 percent though Financiera should improve its relation with the clients, 5 percent had the opinion that they should institutionalise the training in a more permanent way, and 3 percent suggested it should provide more specialised training. The rest had no suggestion. Figure 4.12: Suggestions to improve service
improve realtion with client
institutionalise training
specialise course
enhance payment scheme
nothing
Source: Survey

Chapter Four
25
4.4 The Difference
68. Part of the objective of this research was to find out whether there those attracted by the training have different profiles than those clients that after the invitation, for some reason decided not to participate. If the two groups of IYB participants and no-participants are compared, there are indeed a number of significant56 differences in entrepreneurial profile, in their financial relation and, of course, in their non-financial relation with Financiera Solución. A differentiating personal characteristic is age, IYB seems to attract the elder clients as many are over 50 (44% is over 50 against 39% amongst those who did not participate). Those that decided to participate in IYB have higher levels of education (35% had a university degree against 23% of those who did not) what indicates that it is regarded a supplement to higher education. The fact that there are more women amongst the IYB participants (60% against 47%) is strange though as women in general have lower levels of education. However, it seems that the women with higher levels of education are most inclined to participate in IYB (35% of women that participated had a university degree against 16% of women that did not). There are significantly fewer IYB participants that had entrepreneurial experience before they started their enterprise (60% had no experience against 49% amongst those who did not participate), so IYB seems more attractive to those with less experience, what confirms the idea that it is seen as a supplemental training with practical value.
69. The enterprises that were subjected to IYB are typically between 5 and 10 years of age (46% against 33%), while the non-participants are more likely to own either younger or older enterprises. An interesting difference is the initial motivation to have started the current enterprise. Amongst those IYB participants, the most common argument was to augment income while for the other group it was to become independent. Also interesting, as can be seen in the graph below, is that those that started the enterprise because of a business opportunity are more likely to participate in the IYB. Hence, it are clearly the growth oriented entrepreneurs that decided to participate in the training. Figure 4.13: Reason to have started current enterprise per client group
n o IY BIYB
s aw pos ibility
unem ploym entfam ily trad ition
augm ent inc om eindependenc e
0 %
1 0 %
2 0 %
3 0 %
4 0 %
5 0 %
6 0 %
Source: Survey
56 10%

Chapter Four
26
70. The level of dependency on the enterprise is significantly higher amongst IYB participants (44% of them have no other income, against 38% of those non-participants). In line with the relative low level of entrepreneurial experience amongst IYB participants, those that received the training are less likely to have another business, while half of those who did not take the course have another enterprise activity as source of income (38% against 49%). This can be interpreted as a strategy of diversification that is less noticeable amongst IYB trainees who seem more concentrated on the enterprise with the microcredit.
71. Another difference is the size of the enterprise, the IYB enterprises are significantly smaller in terms of average sales (3600 against 4400 USD), however their average monthly profit is slightly, though significantly, higher (1100 against 900 USD). Although there is no reason to ascribe that to the training, it is a fact that the ex-participants get more profit out of lesser sales.
72. Concerning the perception of current enterprise situation there are significant differences too. First, when identifying the most important problem experienced in the past year, the ex IYB participants show more variation in their answers. As 71 percent of those who did not participated complained about the increase in competition, 64 percent of the ex IYB clients did so. After credit (19 and 20%) the third common problem area for ex IYB participants had been the institutional environment (11 against 2%), while for the other group internal management issues were felt to be more problematic (6 against 8%). Figure 4.14: Main problem area in past year per client group
no IYBIYB
Insitutional Environment
ManagementCredit
Competition
0%
10%
20%
30%
40%
50%
60%
70%
80%
Source: Survey
73. When asked whether current enterprise income had increased, stayed equal, or decreased in the past year, ex-IYB clients were significantly more positive as 27 percent felt it had been increasing while 17 percent of those who had not participated claimed that income had been increasing. In the same line, although half of those who had not participated considered a decline in income, only 35 percent of the ex-IYB participants had felt a decline. The share of those who thought that income had remained the same was comparable (38% of those who ad participated and 35% of those who had not). When asked about the main cause for the perceived trend in enterprise income, the IYB participants mainly see enterprise management as a main cause while the other group ascribe the change to external factor, the national economy. This is interesting since ex-IYB trainees look for internal factors rather than

Chapter Four
27
external, implying that they feel less subjected to the changes in the external environment than those who did not participate. Figure 4.15: Distribution on cause of change in enterprise income per client group
0% 20% 40% 60% 80% 100%
no IYB
IYB
national economy competition enterprise management Source: Survey
74. Concerning investment behaviour in the past year, ex-IYB participants invested significantly more in all areas that were included in the questionnaire. An important conclusion for the ILO is that ex-participants significantly created more jobs than those who did not. As much as 19 percent of the ex-participants had added jobs in the past year (6% directly ascribed that to the course, see page 23) against 5 percent of them who had not participated57. IYB hence attracted job-creating enterprises or at least enterprise with the potential to do so. As seen in the figure below, the percentage of ex-IYB participants that experienced improvements in their fixed assets, in product portfolio, product quality and the production process is significantly higher than amongst those who did not participate. Since there is no control group or baseline study about the situation of the IYB trainees, this research can not draw any conclusion on the causality between investment behaviour and IYB training. However, it can safely be said that those that took the training are enterprises with a potential to invest. Figure 4.16: Distribution per area of investment per client group
employment
assets
new products
product quality
production process
no IYBIYB0%
10%
20%
30%
40%
50%
60%
70%
Source: Survey
57 For the whole survey it is 11 percent that had added new jobs in the past year.

Chapter Four
28
75. The fact that only 6 percent of the IYB trained applied the credit for other purposes than the enterprise underlines again the idea that the clients who participated in the training are growth oriented clients. As much as 14 percent of the other group said to have applied the credit for other purposes like family spending and payment of debts. In both groups 42 percent said to have applied the credit for investment. However, more than half of the ex-IYB participants (52%) applied the credit for working capital what in the other group presents 44 percent58. In conclusion, ex IYB participants appear to be more focused on improvement in the current enterprise than those that did not participate.
76. A question on the current need for training shows again significant discrepancies between those who participated and those who did not. Of the ex-IYB participants, 85 percent expressed a need for training, only a little bit higher than the other group in which 82 percent said to be in need of training. However, the ex-IYB trainees show a more diversified expression on their need for training and express stronger needs for more specialised training. As can be seen in the figure hereunder, the strongest differentiation is seen in the area of management. Amongst ex-IYB participants 32 percent that expressed a need in training, mentioned management as primary area whereas in the other group management present even more than half of the training need. Also, the area of planning and projection has been identified by 15 percent of the ex-IYB participants that were in need of training, though was not even mentioned once by the other group. Then, the need for technical training presents 10 percent of the ex-IYB participants need while 7 percent of the other group. The expressed demand for marketing training is for both groups around 30 percent of the need for training. Although it is impossible to determine whether the expressed needs are causally related to IYB, it is obvious that ex-IYB trainees have a more refined need for training. Figure 4.17: Distribution of expressed training need per client group
no IYB IYB
sales
cash flow management
export
planification and projection
administration
marketing and marketinformationpurchase input
technology
Source: Survey
77. Until so far the differences in the entrepreneurial profiles. The data also showed significant difference between the two groups in their credit relation with Financiera Solución. Those that participated in the IYB are significantly more likely to currently have a credit than those who did not participate, indicating a more active relation between IYB client and Financiera Solución. This seems underlined by the fact that 67 percent of the IYB client had a credit relation with Financiera Solución of more than 2 years, while only 52 percent of the other group did so. And, the likeliness that ex-IYB clients have more than 2 credits is significantly larger than amongst those who did not participate. Clients in the ex-IYB trainee group are more likely than clients of the other group to use different financial services of Financiera
58 Interesting to note here is that there is no significant difference between the groups in terms of actual usage of the credit.

Chapter Four
29
Solución (19% of ex-IYB clients has other services against 9%). In conclusion, the financial relation with Financiera Solución is without doubt stronger amongst those who did participate in the IYB training. Seen the earlier conclusion that this are also the more growth minded enterprises, the IYB training seems to be attractive for good paying clients that have an intensive credit relation.
78. However, interesting is that although the IYB training is meant as a bonus that should have a positive effect on client�s opinion, the perception of service quality is not significantly different. Ex IYB participants are slightly more positive: 6 percent of ex-IYB participants thought its service was very good and none in the other group. Slightly less ex-IYB participants experienced its service as regular (23 against 27%) and 4 percent of ex-IYB participants thought it was bad to very bad, while that was 6 percent in the other group. The fact that these differences are not significant might be due to the large number of content customers, 67 percent of both groups though its service was good. Nevertheless, it gives no certainty in whether the IYB training improved the clients� opinion. That brings in the subject of the last part of this chapter, the costs and benefits for the clients of the combined service delivery.
4.5 Costs and Benefits
79. The direct financial costs that the ex-IYB clients mentioned in the survey were few. As said earlier, only one third of the ex IYB participants could think of a cost they had made, of which almost all mentioned transportation and only 3 percent replacement costs. It ranged from 3 to 30 USD with an average of 15 USD, amongst those that did mention any cost at all. In general, the training is perceived free of any cost, what during the focus group discussions was signalled as a great advantage over other trainings. However, a more widespread and far more influencing cost is time. Time is the main influencing cost in the decision whether or not to participate and appeared to be the largest impediment, both mentioned by the entrepreneurs in various parts of the questionnaires59, as well as in the focus group discussions. The only expressed reasons to not participate were time (35%) and no need for the offered training, what represents only 5 percent of those that did not participate. Apart from the direct cost of transportation and indirect cost of time, no other cost was mentioned neither in the questionnaire nor in the focus group discussions. Worth mentioning here is that it became clear during the focus group discussions that Financiera Solución is not considered a training institute, but a partner in business, and therefore expected to have better quality training than those of government institutes or NGO, that are also often free of charge.
80. Both in the questionnaire as in the focus group discussions, the large majority of clients mentioned only benefits. IYB is without doubt considered as an added value to the financial service. As much as sixty percent of the ex-IYB participants actually felt that the training had had a real impact on their business in different areas. The persistent significant difference that ex-IYB had invested more in the past year than those who did not participate, might be an indication of that impact. A clear outcome of the group discussions was that the trust relation between client and financial service provider strengthened because of the training, that showed an interest in the growth of their enterprise. Again, the linkage of IYB to microcredit seems to enhance the proximity between service provider and clients that improves client�s satisfaction.
59 Being the main reason for not participating, for sending somebody else in stead of the invited, for missing out on modules, and it was the dominant area for suggestions to improve the training format.

Chapter Five
30
5 Lessons Learned
5.1 A Good Practice Model?
81. If concluding the previous two chapters, it is most likely that the benefits of linking training to microcredit outweigh the costs for both the credit provider as well as for the clients. More than 90 percent of the 114 clients that were interviewed saw benefits in the linkage as developed by Financiera Solución. A fact is that more than 80 percent of the total survey indicated a need for training. Only 5 percent of those 66 that did not attend the training did not do so because they felt they did not need the training. Those 48 microenterprise clients that had taken the IYB training were more positive on the current situation of the enterprise, saw their own management as one of the main tools to influence performance, and importantly, had added more jobs than those who did not take the IYB training. Without doubt, those that attended the training are more growth oriented than those that did not. The nature of the research could not verify whether growth orientation is a result of the training or whether the linkage automatically selects growth oriented enterprises to attend, but two third of the IYB trained mentioned that it did have noticeable positive effects on their business.
82. For Financiera Solución the linkage seems to improve motivation of the staff and clients fidelity. The IYB training attracts those microenterprise clients that are growth-oriented, with an investment potential and with an intense credit relation in terms of time, number of credits and financial products. It gives Financiera Solución an image related to successful entrepreneurship and although it is likely that half of the costs are paid back in two years time, the training seems a long term investment that improves the proximity between service provider and user.
83. Taking into account that 13 percent of those that had been invited said they did not receive the invitation60 makes it likely that if Financiera Solución puts more effort to direct invitations, the return on investment will increase. However, that does not necessarily make it a good service. According to general service theories there are at least five basic features that determine the quality of a service. A good service should be responsive to clients needs, in both content and in format. A service should be reliable, providing what is promised and adhere to policy and standards. It should be accessible and have appropriate facilities like infrastructure. There should be good communication between provider and client, and the cost should be reasonable and charged according to the client�s potential. Whether the model as developed by Financiera Solución is a so-called good-practice model, depends much on the state of these features.
84. A vital quality of service delivery is responsiveness to clients needs. Financiera Solución decided to offer training as a result of focus group discussion in which they asked what they wanted, showing responsiveness to clients need. Despite the rigidity of a pre-determined training module like IYB, trainers said they felt space to adapt the training to the reality of their clients. Taking into account that the trainers are microcredit agents at the same time, they are not only familiar with the reality of small enterprises in Lima but more importantly, represent the interest of a microfinance institution. Hence, able to pick some fruits from growing businesses and likely to keep customers satisfied and meet their needs as long as it concerns their business. The fact that the large majority was very happy with both the format 60 Equals 24 percent of those that had been invited and did not participate

Chapter Five
31
and the content of the course, indicates that the model applied by Financiera Solución is sufficiently responsive to clients needs. It is important to realise that the consideration to offer IYB was a purely commercial one, without donor involvement.
85. However, a definite weakness has been the responsiveness to clients demand after the IYB training. Both in group discussion and in the questionnaire, clients expressed their need for follow-up and for more specialised trainings. Trainers however confronted a time constraints to combine their daily job as credit agent and trainer with also monitoring and providing follow-up. Concerning the specialised training, the training of trainers system as executed by COPEME and the ILO is seriously limited in its responsiveness.
86. A second aspect of service delivery is the reliability of service delivery. If the case study here is compared to another study in Zimbabwe in which they discuss the link between credit and IYB it springs out that the model of Financiera Solución is more successful in delivery61. In the Zimbabwe case, training was delivered by private trainers and credit by commercial banks, linked only by an assumed shared interest in enterprises getting trained. The certificate given by the trainer should serve as guarantee for the banks. However, the private trainers were not always providing the expected quality and banks would not always safeguard credit. The model was not always successful partly because responsibilities for credit and BDS were separated. Contrary in the case of Financiera Solución that has all responsibility towards the client, and is favoured too by reliable delivery. The fact that Financiera Solución provides both the credit and the training, safeguards delivery.
87. The critical point here concerns again the follow up to IYB, what is part of a reliable delivery as clients asked for further training. Financiera Solución is in that respect depending on COPEME for advanced trainings that have the same format. COPEME in its turn depends on the master trainer that at the moment of this research was absent. As in the Zimbabwe case, the master trainer is a definite limit to reliable constant delivery that responds to increased demand.
88. A third characteristic of good service delivery concerns accessibility and facilities of the service. The applied model in the case of Financiera Solución offers the training only to those that are considered good paying clients, hence excluding those that defaulted once and not accessible to just anyone. On the other hand it is worth mentioning that exclusiveness can also foster learning amongst participants during the training, as the group discussions pointed out that the levels of interest were not too divers. Concerning the facilities, the courses were held in localities like restaurants or hotels, in general very reachable with the basic facilities, and no complaints were heard.
89. A fourth factor that determines the quality of a service is the communication and information with and to clients. Financiera Solución developed good promotion material about IYB both for within its own organisation as for its clients. It has a general magazine for all of its microcredit clients, and as the focus group that was had in 2001 shows, it takes certain actions to communicate with and inform clients. The suggestion made by one of the interviewed to develop a newsletter only for ex-IYB trainees might be worth a thought.
90. A final aspect of a good service that is taken into account here is the cost. Since the training has been offered free of charge, it is obviously comfortable. The fact that Financiera Solución pre-selects its clients and presents the training as a bonus, seems to outcast indifferent clients and enhance motivation.
61 ILO, 2003.

Chapter Five
32
91. The answer to the bottom question, whether it is a successful model, appears to be yes. Nevertheless, it seems that the model as such has not totally matured as yet. The implementation is not as regular as was planned, evaluation and monitoring are still weak, and there is a problem concerning the responsiveness to more specialised training. It is highly questionable whether credit agents could and should provide those more specialised trainings. A more adequate solution would be when Financiera Solucion would act as a facilitator between their client and existing BDS providers in various areas, facilitating market access for growth oriented enterprises.
5.2 Further Research
92. There are still important questions that need more investigation, partly because of the nature of the linkage as it has been developed by Financiera Solución. On of those issues concerns the supposed benefit of outreach when offering BDS through a microfinance institution. Although the outreach of IYB offered through Financiera Solución seems considerable, it has been limited by two factors. Firstly, this particular BDS is purposely offered to a selected clientele and secondly, the training capacity is limited by a master trainer. It would be interesting to analyse a linkage that does not have these limitations, as then outreach will be even more.
93. Another vital question that could not be fully answered here, is whether the training improved the default rate of the portfolio. Financiera Solución offered the IYB training primarily to improve client�s loyalty, to offer something extra to good paying clients, and selected those clients that had no default history at all. Because these clients were stimulate to increase their credit by submitting investment projects during the training, most probably the healthy portfolio grew faster than it would have done otherwise, but this research could not quantify the extra impulse. In order to address many of those questions on the causality of linkage and enterprise performance it requires a control group or baseline study.
94. It needs to be realised that many of those questions go beyond the investigation into the costs and benefits of linking training to microcredit. Training is only one of the many services that have a potential to enhance small enterprise performance, these questions concern unresolved and largely undressed issues in small enterprise development in general. The causality between services and improved enterprise performance is often assumed but rarely researched. For example, those who did the IYB training have significantly better profit margins than those who did not do the IYB training, a difference that asks for further research. Since Financiera Solución keeps good track of its clients and their enterprise performance, the case study here offers an opportunities to pinpoint the pure training effect in a more accurate manner.

References
33
References
Assessing the Impact of Microenterprise Services (AIMS) (1999) Microfinance Clients in Lima, Peru: Baseline Report for AIMS Core Impact Assessment. Washington D.C, U.S.A.
Banco Central de Reserva de Perú (BCRP) (2003) Resumen Informativo. Nº 48-5 diciembre de 2003. Caniëls M.C.J., H.A. Romijn and M. de Ruijter de Wildt (Submitted to Development in Practice) Can
Business Development Services practitioners learn from theories on innovation and services marketing?
Centeno, V.P. (2001). The role of the micro enterprises as engine of economic development: the Peruvian
Case. Presentation at the IFUP 4th International Conference, Marrakesh, Marrocco. October 16-19th 2001.
Centre for Migration and Development (CMD) El Sector Informal en Lima Metropolitana. CMD
Working Paper Nº 03-15m. Princeton University. Equipo Ciudad Centro Alternativa. Lima, Peru.
Chacaltana, J. and N. García (2001) Reforma laboral, capacitación y productividad. La experiencia
Peruana. Documento de trabajo Nº 139. Oficina Internacional del Trabajo, oficina regional para América Latina y el Caribe. Lima, Perú.
Chacaltana, J. (2001) Políticas Publicas y Empleo en las Pequeñas y Microempresas en el Perú. Oficina
Internacional de Trabajo. Lima, Perú. Cohen, M. and E. Dunn (1999) Microfinance clients in Lima, Peru: Baseline report for aims core impact
assessment. Assessing the Impact of Microenterprise Services (AIMS) Washington, USA. COPEME (2003) Microfinanzas en el Perú. Año 4, numero 9, edición semestral. Lima, Perú Financiera Solución (2001) Programa de capacitación con la metodología �Mejore su Negocio� de la
Organización Internacional del Trabajo dirigida a clientes de Solución Financiera de Crédito del Perú. S.A.. Lima, Perú.
Financiera Solución (2002) Annual Report 2002. Lima, Perú. GTZ (2002) Estudios de casos de buró de crédito seleccionados en varios países latinoamericano.
División 41, seccion desarrollo del sistema financiero y servicios bancarios. Eschborn, Germany.
Herrera, D (2003) Start and Improve Your Business Programme in the Andean Countries and Central
America. ILO. Lima, Perú. Instituto de Desarrollo del Sector Informal (IDESI) (2001) Mercado para servicios de desarrollo
empresarial en el Perú. Lima, Perú.

References
34
Instituto de Desarrollo del Sector Informal (IDESI) (2002) Competitividad de la Micro y Pequeña Empresa.. Lima, Perú.
Instituto Nacional de Estadística e Informática (INEI) (2000) Sectores de Trabajo, Productividad y
Dinámica Ocupacional. Lima, Peru. http://www.inei.gob.pe/web/BiblioInei/ListaItemByTemaPalabra.asp?c=7&tt=Empleo%20e%20Ingreso
International Labour Organization (ILO) (2003) Start and improve your business linkage to finance program: the Zimbabwe case. ILO/SIYB Regional Project Office. Harare, Zimbabwe.
International Monetary Fund (IMF) (2003) Peru: Third Review Under the Stand-By Arrangement-Staff
Report: Staff Supplement. Press Release on the Executive Board Discussion and Statement by the Executive Director for Peru. Country Report No. 03/355. http://www.imf.org/external/pubs/cat/longres.cfm?sk=17029.0
Instituto Nacional de Estadística e Informática (INEI) (2000) Determinantes del empleo adecuado en las
micro y pequeñas empresas en el Perú 1995-1998. Lima, Perú. Ramírez Flores, J.A. (2001) Principios de Tecnología Crediticia para PYMES. In: Seminario Virtual:
Tecnología Crediticia aplicable a las PYMES en Peru. CINSEYT. Lima, Peru Ruijter de Wildt, M, de. Commercial business development services in Central America: Pioneering
providers. ILO. San Jose, Costa Rica. Sievers, M. and Vanderberg P. (2004) Synergies through linkages: who benefits from linking Financial
and Business Development Services. SEED Working Paper No. 64. ILO. Geneva, Switzerland.
Sievers, (unpublished) Private provision of Business Development Services in Lima. ILO, august 2002.
Geneva, Switzerland. Schmidt, F. (1998) Client Satisfaction Surveying: A Managers Guide. Citizen-Centred Service Network.
Canandian Centre for Management Development. Canada. Stauffenberg, D. von (2002). Trends in Latin American Microfinance. Microbanking Bulletin, November
2002. Miehlbradt, A.O. and M. McVay (2002) Developing commercial markets for Business Development
Services: �Are �how-to-do-it� recipes possible?�. Seminar Reader of the third Annual Seminar. 9-13 September. ILO. Turin, Italy.

Annex A
35
Annex A: Terms of Reference
Background and rationale Traditional SME-development programs often started off by theoretically defining �a-priori� the needs of MSEs in developing countries. Interventions were then tailored to meet the expectations of those that had designed interventions from their HQ desk without taking into account the existing local demand for services and without having a look at local delivery mechanisms of these services. Indigenous forms of financial as well as business development services exist in most developing and transition countries, but donors often didn�t take the time to do a proper market analysis. This is why traditional interventions often delivered a package of training and credit that was not adapted to local demand. Local MSEs saw themselves obliged to take a training while all they wanted was a credit and vice versa. At the same time the institutions set up by donors were not able to become sustainable because they were not selling a service that was adequate to demand and because their cost structures were not based on local costs. Probably the institutions were also doing to many things at a time not gaining a real competency in either delivering BDS or financial services.
IFP SEED and SFP jointly developed a desk-research on linking BDS with financial services. The objective of this research was to give abroad overview about the existing synergies resulting of linking financial and non-financial services and the cost and benefits for the three main groups of actors: MSEs, BDS providers and financial service providers. The overview also categorized the different types of linked supply and spelled out the questions for future research proposals. The main results of this research were presented in the Fourth Annual BDS seminar in Turin in September 2003. The study shows that there is a big potential for increasing outreach to clients with BDS at a relatively low cost for institutions if the BDS can be linked to the financial service. It also indicates that information feedback (market signals) crucial for success, because the client can send stronger signals about what service is useful and how much he/she is willing to contribute to the service.
The study also showed that there was a need to go more in depth on questions concerning the real demand of MSEs for both types of services and whether different client segments could be distinguished. Furthermore, little evidence of a best practice model was found and little is still known about the different client segments that demand financial and BDS services. In order to find out more in depth about the costs and benefits are for the three main groups pf providers SEED now is planning to do one in depth assessment of the linked delivery of services in one country that would mainly look at the client side of costs and benefits.
Due to the existing collaboration between the ILO office in Lima and Financiera Solución and the existing knowledge about the institution, the research team decided to do a case study about Financiera Solución and the linked delivery of BDS and financial services. Financiera Solución is using the ILO developed SIYB to gain a marketing advantage over the competition in Peru and to retain clients.
Issues to be addressed by the case study should include:
MSEs: Types of demand; Types of clients that ask for both services/client segments; Reasons for taking the training; Costs for clients (including transaction costs); Benefits and impact on the enterprise.
Financial Institution: Methodology of provision; Quality of the service; Responsiveness of the institution to client demand; Cost of providing BDS Benefit of providing BDS

Annex A
36
General: How demand driven is the process? Can it be considered good practice? Is there a potential of replication of the model? What aspects should be the centre of analysis in case studies and action research?
2. Main tasks The main tasks of the consultant would include:
�Establish contacts and work together with ILO-Lima office �Suggest an Outline of the case study �Suggest a Questionnaire for bank clients that received both services (and those that decided not to take them?) �Interview Financiera Solución managers, trainers and credit officers �Interview clients of Financiera Solución that received both types of services �Interview further Experts in Peru, including interviews with similar financial institutions (e.g. MiBanco) �Guide two Peruvian co-interviewers that will continue interviewing clients of Financiera Solución �Write the case study based on the results
3. Methodology In preparation of the mission the expert will review the existing reports and documents. In the field, the expert will work in close collaboration with the Sub-Regional office of the ILO in Lima (SRO-Lima)
After proposing an outline and questionnaires in order to establish what the benfits and cost are for clients and for the financial institution and finishing them in consultation with the ILO, the expert will conduct interviews with Financiera Solución managers, SIYB trainers and credit officers and will conduct interviews with clients of Financiera Solución. The consultant will also guide two Peruvian interviewers that will continue interviewing Financiera Solución clients based on the proposed questionnaire. The Peruvian interviewers will interview an approximate number of 100 Clients. Out of these clients 50 should at least have attended the training and another 50 to whom the training was offered but who did not take it.
In the end of September 2003 a mission of Merten Sievers made contacts with Aldo Mongilardi, Sub-Gerente de Recursos Humanos, who will help in preparing the mission of the consultant to Lima. The SRO-Lima will help with the preparation.
4. Scope of work The research will mainly address the costs and benefits for: the clients of Financiara Solución and for the institution Financiera Solución
The mission to Lima is scheduled from the 8th to the 22nd of November 2003 (10 working days). For the preparation and the writing of the report 6 working days are allocated.

Annex B
37
Annex B: Questionnaire
Fecha:
Número de encuesta:
1 Si Encuestador: Cliente de MESUN:
2 No
Revisada, codificada y digitada: Valido:
Información de la base de datos: Información actualizada:
Dirección Laboral Z1 Edad Z2 ............... años ............... años Sexo Z3 1 Masculino 2 Femenino 1 Masculino 2 Femenino
Estado civil Z4 Soltero Casado / Conviviente Viudo / Divorciado
1 Soltero 2 Casado / Conviviente 3 Viudo / Divorciado
PERFIL PERSONAL
A.1 ¿Quién conduce el negocio?: 1 = la persona entrevistada 2= otra(especifique)....................................................
A.2 ¿Cuál es su nivel y año de educación (el último año aprobado) alcanzado?
1 = Sin instrucción 2 = Primaria ...................años 3 = Secundaria............... años
4 = Instituto Técnico......... años 5 = Sup. Universitario....... años 6 = Otro (especifique)................
.......................................
A.3 ¿Ha recibido alguna capacitación con relaciona su negocio? 1 = No 2 = Si (especifique):
Instituto Área de capacitación
A.4 ¿Tenia experiencia empresarial con algún otro negocio antes de involucrarse en el negocio actual?
1 = Si, en un negocio familiar 2 = Si, en un negocio propio 3 = No
A.5 ¿Cuál es su fuente principal de ingresos?...................................................................
1 = Este negocio 2 = Por alquiler 3 = Sueldo de otro trabajo
4 = Otro negocio 5 = Aportes de familiares
6 = Otro (especifique) .................................. 99 = No se
PERFIL EMPRESARIAL
B.1 ¿En su empresa o negocio, tiene otro(s) socio(s): 1 = No 2 = Si, (cuantos).............
B.2 ¿Cuántos años tiene este negocio? _____ meses ____ años
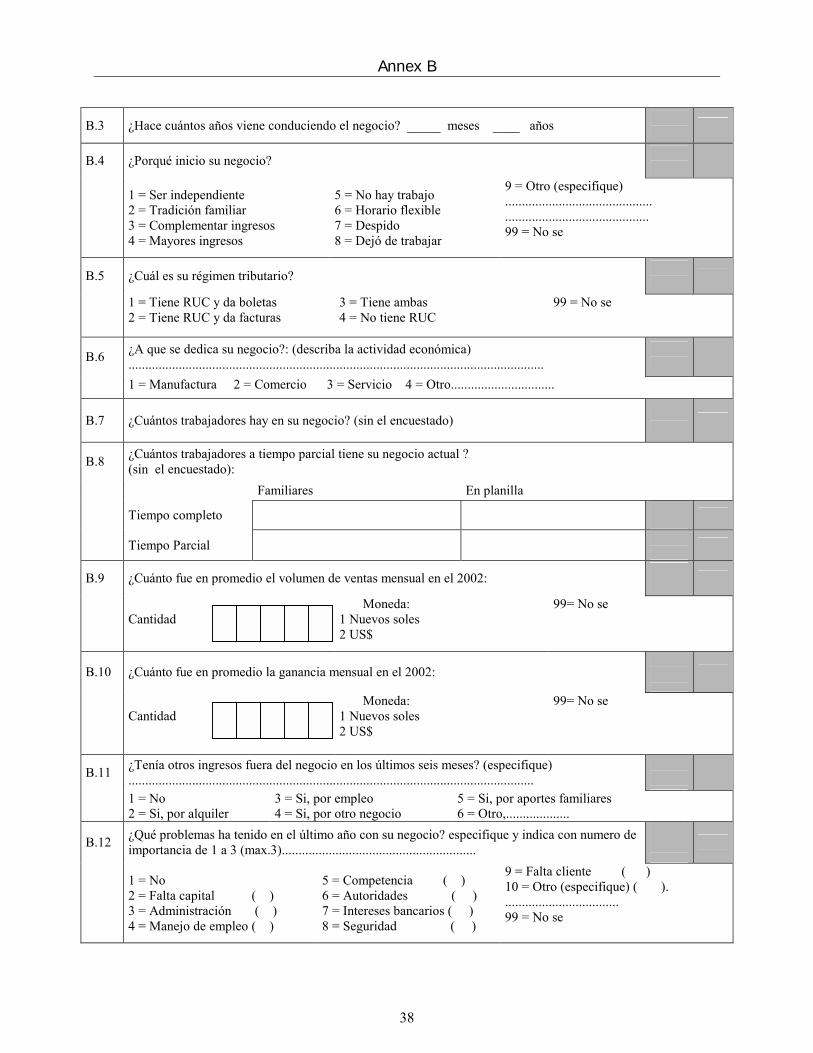
Annex B
38
B.3 ¿Hace cuántos años viene conduciendo el negocio? _____ meses ____ años
B.4 ¿Porqué inicio su negocio?
1 = Ser independiente 2 = Tradición familiar 3 = Complementar ingresos 4 = Mayores ingresos
5 = No hay trabajo 6 = Horario flexible 7 = Despido 8 = Dejó de trabajar
9 = Otro (especifique) ............................................ ........................................... 99 = No se
B.5 ¿Cuál es su régimen tributario?
1 = Tiene RUC y da boletas 2 = Tiene RUC y da facturas
3 = Tiene ambas 4 = No tiene RUC
99 = No se
B.6 ¿A que se dedica su negocio?: (describa la actividad económica) ............................................................................................................................
1 = Manufactura 2 = Comercio 3 = Servicio 4 = Otro...............................
B.7 ¿Cuántos trabajadores hay en su negocio? (sin el encuestado)
B.8 ¿Cuántos trabajadores a tiempo parcial tiene su negocio actual ? (sin el encuestado):
Familiares En planilla
Tiempo completo
Tiempo Parcial
B.9 ¿Cuánto fue en promedio el volumen de ventas mensual en el 2002:
Cantidad
Moneda: 1 Nuevos soles 2 US$
99= No se
B.10 ¿Cuánto fue en promedio la ganancia mensual en el 2002:
Cantidad
Moneda: 1 Nuevos soles 2 US$
99= No se
B.11 ¿Tenía otros ingresos fuera del negocio en los últimos seis meses? (especifique) .........................................................................................................................
1 = No 2 = Si, por alquiler
3 = Si, por empleo 4 = Si, por otro negocio
5 = Si, por aportes familiares 6 = Otro,...................
B.12 ¿Qué problemas ha tenido en el último año con su negocio? especifique y indica con numero de importancia de 1 a 3 (max.3)..........................................................
1 = No 2 = Falta capital ( ) 3 = Administración ( ) 4 = Manejo de empleo ( )
5 = Competencia ( ) 6 = Autoridades ( ) 7 = Intereses bancarios ( ) 8 = Seguridad ( )
9 = Falta cliente ( ) 10 = Otro (especifique) ( ). .................................. 99 = No se

Annex B
39
B.13 En comparación con el año pasado, los ingresos totales del negocio han:
1 = Diminuido 2 = Sigue igual (→B15)
3 = Aumentado 99 = No se (→B15)
B.14 ¿Por qué razón principal? (especifique) .............................................................. ............................................................................................................................
1 = Situación en el negocio 2 = Situación del entorno
3 = Competencia 4 = Situación familiar
5 = Situación económico nacional 6 = Otro,.......................................
B.15 ¿En el último año ha contratado a más personal? 1 = Si, ................. empleo permanente y .............. temporal 2 = No
B.16 ¿En el último año ha aumentado los activos del negocio? (especifique) .......................................................................................................
1 = No 2 = Si, maquinaria
3 = Si, vehículo 4 = Si, local
5 =Si, equipo 6 = Otro,..........................
B.17 ¿En el último año ha incluido productos nuevos al negocio? 1 = Si, (especifique)................................................................................. 2 = No
B.18 ¿En el último año ha mejorado la calidad y/o el valor agregado de los productos? 1 = Si,(especifique)................................................................................... 2 = No
B.19 ¿En el último año ha reducido los costos de producción, o los costos en la compra de mercadería o de insumos? 1 = Si (especifique).................................................................................. 2 = No
B.20 ¿En el último año ha desarrollado nuevos proyectos para hacer crecer el negocio? 1 = Si, (especifique)................................................................................ 2 = No B20
B.21 ¿Usted cree que necesita capacitación para el mejor manejo de su negocio, en el caso que si en cual área? ............................................................................................. B21
1 = No 2 =Tecnológico 3 =Compra de insumos
4 = Mercadeo 5 = Administración 6 = Planificación
7 = Otro,............................... .............................................. 99 = No se
RELACION FINANCIERA CON FINANCIERA SOLUCIÓN
C.1 ¿Tiene un préstamo con Financiera Solución? 1 = Si, actualmente 2 = Si, hace un tiempo 3 = No, nunca C1
C.2 ¿Cuál fue el motivo principal para solicitar este préstamo? ...................... ........................................................................................................................... C2
1 = Inversión en empleo 2 = Inversión en el local 3 = Inversión en producción 4 = Compra de mercadería
5 =Compra de mat. Prima 6 = Otros créditos 7 = Otro negocio 8 = Gastos familiares
9 = Otro (especifique) .................................... ................................... 99 = No se
C.3 ¿Porqué eligió Financiera Solución?:............................................................ .........................................................................................................................

Annex B
40
1 = Tasa de interés 2 = Monto 3 = Plazo 4 = Tipo de garantía
5 = Cercanía / distancia 6 = Agilidad 7 = Atención personal 8 = Conocimiento al técnico
9= Acceso a capacitación 10 = Ex cliente de SerBanco 11 = Me lo recomendaron 12 = Otro (especifique)
C.4 ¿Hace cuánto tiempo usa los servicios de F.S? _____ meses
C.5 ¿Cuántos préstamos ha tenido con F.S.? _____ préstamos
C.6 ¿En que utilizó el ultimo préstamo? (mencione lo mas importante)
1 = Capital de trabajo 2 = Inversiones
3 = Cancelación de créditos 4 = Gastos familiares
5 = Otros (especifique) 99 = No se
C.7 ¿Hasta ahora, tenía alguna dificultad para cancelar su crédito?
1 = No 2 =Si, ............. veces 99 = No se
C.8 ¿Aparte del préstamo, ha usado otro tipo de servicio de F. S.? 1 = Si 2 = No (→C10)
C.9 ¿Qué otro servicio de Financiera Solución ha utilizado?
1 = Crecer 2 =Crédito para Pendientes
3 = Tarjeta de Crédito 4 = Equipa
5 = Otros (especifique) 99 = No se
C.10 ¿En términos generales, su experiencia con Financiera Solución ha sido?
1 = Muy malo 2 = Malo 3 = Regular 4 = Buena 5 = Excelente
C.11 ¿Tiene algún préstamo con otra institución?
1 = Si, (especifique el préstamo y con quien).................................... ............................................................................................................. 2 = No
RELACION NO-FINANCIERA CON FINANCIERA SOLUCIÓN
D.1 ¿Alguien de su negocio participó en la capacitación MESUN? Apuntalo arriba en la primera hoja!!:
1 = Si, yo en el año ............................................................................. 2 = Si, yo con otra persona de mi negocio en el año ...................... 3 = Si, otra persona de mi negocio en el año................................... (→D17) 4 = No .............................................................................................. (→D17)
D.2 ¿Por qué razón participó en MESUN? (descríbala)...................................... ........................................................................................................................
1 = Curiosidad 2 = Pareció útil 3 = Quería mejorarme
4 = Quería asesoría 5 = Quería acceso al financiamiento
6 = para mi currículo 7 = Otro (especifique) .................................... 99= No se

Annex B
41
D.3 ¿Qué le pareció la forma en que se desarrolló la capacitación?
1 = Muy malo 2 = Malo 3 = Regular 4 = Buena 5 = Excelente
D.4 ¿Alguna sugerencia para mejorar la forma de MESUN?........................... ..........................................................................................................................
1 = No 2 = Relacionado al Lugar
3 = Relacionado al Horario 4 = Relacionado al Entrenador
5 = Relacionado al Material 6 = Otro,...................
D.5 ¿Tenia alguna duda sobre MESUN antes de participar en la capacitación? (descríbala)..........................................................................................................
1 =No 2 =Si, la necesidad
3 =Si, la duración 4 = Si, la relevancia
5 = Otro,............ ...........................
D.6 ¿Ha asistido a todos los módulos de MESUN? 1 = Si (→D8) 2 = No
D.7 ¿Por que NO ha asistido a todos los módulos? (especifique).................... .......................................................................................................................
1 = tiempo 2 = viaje 3 = reemplazo 4 =Otro,............................. 99 = No se
D.8 ¿Cuál de los módulos de MESUN considera el más útil?
1 = Costos 2 = Compras 3 = Registro Contable
4 = Control de Existencias 5 = Mercadeo 6 = Planeamiento del Negocio
7 = Todos igual 99 = No se
D.9 ¿Alguna sugerencia para mejorar el contenido de MESUN? ..................... ............................................................................................................................
D.10 ¿Recibió visitas de un técnico de F.S. después de la capacitación para asesorarlo en la implementación de lo aprendido?
1 = Si, una vez 2 = Si, algunas veces
3 = Si, con frecuencia de................(indique)
4 = No 99 = No se
D.11 ¿Cómo califica el contenido de MESUN?
1 = Muy malo 2 = Malo 3 = Regular 4 = Buena 5 = Excelente
D.12 ¿Cuál ha sido el efecto más importante de MESUN en su negocio? (especifique y registre en orden de importancia)............................................. ..........................................................................................................................
1 = mejoró administración ( ) 2 = aumentó la venta ( ) 3 = incrementó conocimiento ( ) 4 = mejoró manejo del negocio ( ) 5 = mejoró el flujo de caja ( )
6 = invirtió en nuevo proyecto ( ) 7 = mejoró mi pago (...) 8 = aumentó acceso crédito (...) 9 = Otro (especifique.............................. (...) 99 = No sé
D.13 ¿Ha contratado más trabajadores, debido a lo aprendido en MESUN? 1= Si 2 = Tal vez 3= No 99 = No se

Annex B
42
D.14 ¿Mantiene contacto con los otros participantes? 1 = Si 2 = No
D.15 ¿Ha tenido algún gasto adicional para asistir a la capacitación? 1 = Si 2 = No (→D17)
D.16 ¿Qué ocasiono el gasto adicional y cuál fue el monto?
Motivo del gasto Sí Monto (S/.) No No sé
D 16.1 Reemplazo 1 2 99 D161
D 16.2 Transporte 1 2 99 D162
D 16.3 Otro ........................... 1 2 99 D163
D.17 ¿Si aplica, por qué razón NO participó en la capacitación MESUN (y envió a otra)? (descríbala)......................................................................................................... .......................................................................................................................................
D17
1 = No lo sabia 2 = No me han ofrecido 3 = No tenia confianza
4 = No me interesaba 5 = No lo necesitaba 6 = No tenia tiempo
7 = Otro (especifique) .............................................. 99= No se
D.18 ¿Puede mencionar ventajas de que Financiera Solución ofrezca MESUN? D18
Especifique: ................................................................................................... ........................................................................................................................ ........................................................................................................................
D.19 Puede mencionar desventajas de que Financiera Solución ofrezca MESUN? D19
Especifique: ................................................................................................... ........................................................................................................................ ........................................................................................................................
D.20 ¿Valora capacitación como un valor agregado a un servicio de crédito? 1 = No 2 = Si 99 = No se D20
D.21 ¿Tiene alguna sugerencia para Financiera Solución para que mejore sus servicios a los empresarios como Usted?. D21
................................................................................................................................................................................................................................................................

Annex C
43
Annex C: Financiera Solución
Mission: Provide financial services to low�income socioeconomic groups, satisfying our
customers needs efficiently and profitably. As well as complying with our stockholders and workers� expectations.
Vision: To become the leader of financial services that satisfies our customers by rendering high quality, creative, innovative services and products thus achieving the best efficiency and profitability.
Table E1: Financial Products of Financiera Solución Period
(months) Minimal amount (usd)
Maximum amount (usd)
Consumption credit 6-36 150 3500 Microentrepreneur 6-24 300 10500 Grow 6-12 300 1500 MyHouse 12-240 3000 31000 Equipment 6-48 500 10000 Credit card
2001 2002 2003 SO L V E N C IA A palancam ien to G lobal ( N ° de veces ) 4 .39 4 .72 4 .9 Pasivo Total / C ap ital Social y R eservas ( N ° de veces ) 4 .81 4 .93 4 .1
C A L ID A D D E A C T IV O S C artera A trasada / C réditos D irectos 1.85 1 .82 2 .54 C réd itos R efinanciados y R eestructu rados / C réd itos D irectos 1 .5 0 .95 0 .91 Provisiones / C artera A trasada 157.44 137 .61 138 .67 A ctivo R en tab le / A ctivo Total 94.22 93 .44 91 .29
E FIC IE N C IA Y G E ST IÓ N G astos de A dm inistración / A ctivo R en tab le 17.31 20 .22 23 .99 G astos de A dm inistración / Ingresos Totales 46.85 50 .78 49 .56 C réd itos D irectos / Personal ( S/. M iles ) 165 186 315 D epósitos / N úm ero de O ficinas ( S /. M iles ) 8 ,061 8,176 5,449
N ° de Sanciones a la E m presa - - -
N ° de Sanciones a A ccion istas, D irectores y Trabajadores - - -
R E N T A B IL ID A D R O E 26.57 28 .92 28 .35 R O A 5.87 6 .41 7 .21 M argen Financiero B ruto / Ingresos Financieros 76.69 82 .1 86 .3 Ingresos Financieros / Ingresos Totales 94.87 94 95 .92 Ingresos Financieros / Activo R en table 35.06 37 .44 46 .43
L IQ U ID E Z R atio de Liqu idez en M .N . 41.84 31 .36 17 .08 R atio de Liqu idez en M .E . 9 ,666.28 17 ,673 .01 1 ,586 .86

Annex D
44
Annex D: Map of Peru
Distribution direct credit portfolio on 31 of December 2003
Anca
sh
Areq
uipa
Ayac
ucho
Cajam
arca
Calla
o
Cusc
o
Huán
uco
Ica
Junín
La Li
berta
d
Lamb
ayeq
ue
Lima
Lore
to
Moqu
egua
Piura
Puno
San M
artín
Tacn
a
Tumb
es
Ucay
ali
TOTA
L (e
n m
iles d
e nu
evos
so
les)
3.48
3.64
1.19
1.58
2.78
2.79
1.45
5.98
3.49
5.93
5.20
41.49
2.67
1.38
4.05
2.35
3.27
2.47
1.99
2.81
314,704

Annex E
45
Annex E: Selected Indicators IYB Course in 2002
Total performance of the four IYB in 2002 (USD) Number of clients invited 5410Number of Microenterprise clients 41000Percentage of Invited 13%Number of participants 1490Percentage of Participants 28% Number of presented projects 269Number of approved projects 88Percentage of approved projects 33% Amount of credit approved 277861Average amount per participant 3158Total microcredit portfolio 60498000Percentage of total microcredit portfolio 0.50% Leveraged credit 277861Profit leverage per credit dollar* 0.09Estimated profit leveraged by IYB credit 25,007 Total investment IYB 2001 - 2003 78,000Total number of participants 2,609Cost per participant 30Cost in 2002 with 1490 participants 44,700 Net loss 19,693Percentage of total costs 44%
Source: Financiera Solución
* Total net profit over 2002 divided by total credit portfolio