The Case of Cambodia - hermes-ir.lib.hit-u.ac.jp
147
Essays on Emerging Issues in Financial Development of a Developing Country The Case of Cambodia 邦題 「カンボジアの金融発展とその課題についてのミクロ計量分析」 by Daiju Aiba Submitted in partial fulfillment of the requirements for the degree of Doctor of Philosophy in Economics Graduate School of Economics Hitotsubashi University July 5, 2017
Transcript of The Case of Cambodia - hermes-ir.lib.hit-u.ac.jp
Essays on Emerging Issues in Financial Development of a Developing Country
The Case of Cambodia
邦題
「カンボジアの金融発展とその課題についてのミクロ計量分析」
by Daiju Aiba
Submitted in partial fulfillment of the requirements for the degree of
Doctor of Philosophy in
Economics
Graduate School of Economics Hitotsubashi University
July 5, 2017
1
Preface In the literature of economic development, financial development is thought of as one of the
significant factors which drive economic growth in a country (Levine, 2008). Development of financial system largely depends on historical and institutional backgrounds of each country. In last decades, many of developing and developed countries have introduced a series of reforms in their financial systems to foster financial development and stability. Since then, financial systems across countries have been developed through different paths, and some of developing countries faces emerging issues in their financial systems.
This dissertation empirically investigates important issues in financial development of the Cambodian financial market. Cambodia has also unique historical and institutional backgrounds in its financial sector. After Cambodia started to transform from a planned economy into a market-oriented one in early 1990s, its financial sector became open to allow both domestic and foreign private banks to operate in Cambodia. Therefore, even though Cambodia is still a low-income country and has low depth of the financial market, the growths of its economy and financial sector have been outstanding and have attracted foreign direct investments and the other forms of capital. This Cambodia’s unique growth trajectory provide unique issues which might have important implications for financial development from both of the academic and policy-making perspective. One of the unique environments in Cambodian financial sector is immaturity of regulatory frameworks in its financial sector. Although there has been a number of new local and foreign-owned entrants in its banking sector, there is a rising concern about overbanking. However, the Cambodian government has still imposed a few restrictions on bank’s behaviors, and there exist no quantitative evaluations. Another uniqueness in its financial sector is “dollarization.” At the same time when Cambodia started to transform, a flood of USD currency flowed into Cambodia in the form of development aids. The Cambodian economy has since been highly dollarized and economic agents somehow manage to live in the environment of multiple currencies circulating. Although a lot of existing studies point to the risk of the dollarization against financial resilience, why households and firms choose USD instead of local currency remains unclear in the literature, and there are only a few studies done in other dollarized countries.
In this dissertation, we devote ourselves to investigate the Cambodia financial market from the various aspects, such as households, firms, and financial institutions. Even though the Cambodian financial sector has a lot of uniqueness, there is almost no studies which empirically investigate the Cambodian financial market. Using unique micro data, we empirically investigate the behaviors of those economic agents. In brief, we can divide our dissertation largely into two parts: (1) efficiency and fragility of the Cambodian banking sector; (2) dollarization in households and firms. Both topics are centered on financial issues in developing countries, and the accumulation of empirical evidences is still low.
In Chapter 1, we present the overview of the Cambodian financial market. We describe historical development and the current situation of Cambodian economy and financial system. Furthermore, we also present the general introduction of the dollarization issue in Cambodia, for better understanding of the background of Chapter 4 and 5.
In Chapter 2 and 3, we investigate the Cambodian banking system from the perspectives of efficiency and fragility of financial institutions.
In Chapter 2, we investigate the efficiency of major financial institutions in Cambodia. The rapid growth of Cambodian economy has attracted the foreign direct investments, and its banking sector has an increasing number of entrants in recent years. Despite its importance, there is no studies on the efficiency of financial institutions. Regarding the competition and efficiency in the banking sector, the literature shows
2
the mixed results, and whether or not foreign banks have a positive effect is still unclear. In this regard, we attempt to investigate the operational efficiency of individual financial institutions in Chapter 2. To do so, we employ the econometric approaches which is called as data envelopment analysis, and further examine potential factors which could affect the efficiency. We empirically show the evolution of technical efficiency from 2006 to 2013 in Cambodian financial institutions, and further examine the relationship between technical efficiency and characteristics of financial institutions.
In Chapter 3, we study the potential vulnerability in the Cambodian financial system by investigating the depositor’s behaviors in the case of the large deposit withdrawals. The large deposit withdrawals were triggered by a rise in political uncertainty, shortly after the national election was held in 2013. We empirically test the hypotheses which explain depositors’ behaviors during the event by exploiting the unique data of regional deposit amounts of individual financial institutions on a quarterly basis. The results reveal that the deposit withdrawals happened regardless of whether or not banks have good fundamentals, suggesting that the deposit withdrawals in 2013 could be classified as a type of coordinate failure problem. Furthermore, we find that the regional election results also affected the extent of deposit withdrawals, implying that people are more likely to run if they expect the future incidents of conflicts or macroeconomic shock due to an increase in political uncertainty. This result also suggests the deposit withdrawals triggered by political instability was inefficient, and could be potential vulnerability in financial sector. Therefore, a certain preventative measure is required to reduce the potential risks of bank failure.
In Chapter 4 and 5, we focus on dollarization, which is one of the distinctive characteristics of the Cambodian financial market. Although Cambodia is exceptionally highly dollarized even compared with other dollarized economies, there is no studies which analyzes micro data. Therefore, the real picture of household’s and firm’s behavior which are essential factors of the dollarization is unclear.
In Chapter 4, we study foreign currency borrowing behaviors by Cambodian households. We investigate determinants of foreign currency borrowing by Cambodian households using household survey data; this allowed us to use the currency-wise information in households’ financial activities. As a result of our analysis, we find that Cambodian households are engaged in risk-hedging behaviors against exchange rate risks and likely to borrow in foreign currency if foreign currency makes up the major portion of their income stream. We also find that expectation of depreciation of local currency leads households to take out local currency loans in line with prediction from the previous theoretical models. Furthermore, we find that education plays a role in the choice of currency in loans, and the better educated households are more likely to engage in risk-hedging behaviors by matching the currency composition between loans and income than the low educated are. The results might suggest that the financial literacy works to enhance the risk-hedging behaviors against exchange rate risks for Cambodian households.
In Chapter 5, given a paucity of empirical analysis on Cambodian firms, we study how and where firms borrow their debt in the highly dollarized economy. In particular, we focus on how the dollarized environment affect the firm’s capital structure, in addition to the factors explained by the traditional theory in corporate finance literature, such as trade-off theory, agency cost approach, and pecking order hypothesis. Specifically, we hypothesize that local currency income might prevent firms from raising capital due to the exchange rate risk, since there is no local currency loan available for firms and there is no other hedging instruments. As a result, we find that the traditional factors can explain well about how the Cambodian firms take out bank loans. On the other hand, we couldn’t find the strong evidence to support our hypothesis that foreign currency income affects the firm’s borrowing behaviors, although we find that firms tend to care the currency mismatch risks only if firm’s profitability is high. The results suggest that the long-lasting exchange rate stability makes firms with low-profitability careless to the exchange rate risks.

3
In Chapter 6, we summarize the insights drew from Chapter 2-5, and concludes this dissertation.
Acknowledgement
This dissertation is compiled from my research papers I worked on during my Ph.D study at the Graduate School of Economics at Hitotsubashi University. Over the past three years, I have received supports and encouragements from a great number of individuals. I am not able to list all those individuals here, but I would like to show great thanks and respects to particularly those who gave me great supports during my Ph.D study.
I would like to express my sincere gratitude to my supervisor, Prof. Hidenobu Okuda for his valuable and continuous supports and instruction on my Ph.D study and my related researches. Without his supports and encouragements, I would never have completed this dissertation. I also wish to thank Mr. Ken Odajima from JICA Research Institute for his insightful suggestion and comments. I thank Dr. Vouthy Khou, Mr. Leng Soklong, Mrs. Pagna Sok, and Mr. Tha Rannareth from National Bank of Cambodia for their helpful comments and valuable discussion on my researches. I appreciate Prof. Masaharu Hanasaki for his constructive instruction and comments. I also thank Prof. Yukari Matsuzuka, Prof. Takashi Shinzato, Prof. Maki Kato, and Dr. Yusaku Kamura from Mori Arinori Center for Higher Education and Global Mobility, Hitsubashi University, for their great encouragements.
I acknowledge financial supports from JICA Research Institute under the project “Empirical Study on the Promotion of Home Currency in Cambodia,” and from Asahi Grass Co., LTD. under its scholarship program. A financial support from Grand-in-Aid from Japan Society for Promotion of Science is also greatly acknowledged.
Finally, I am deeply grateful to my mother, Noriko Aiba, for her emotional and financial support. I greatly thank my father, Shigeru Aiba, who has always believed in me and been pleased with my achievement.
Daiju Aiba
July 5, 2017
4
Preface .......................................................................................................................................................... 1
Chapter 1: Overview of Cambodian Economy and Financial System ................................................... 7
1. Introduction ....................................................................................................................................... 7
2. Recent development and the Current Situation of Cambodian Economy and Financial system ...... 7
2.1 The Recent Economic and Financial Development ........................................................................ 7
2.2 The Banking Sector ....................................................................................................................... 11
2.3 International Comparison of Financial Development and Structure ............................................. 14
3. Dollarization in Cambodia .............................................................................................................. 15
3.1. What is Dollarization? ............................................................................................................ 15
3.2. History of Dollarization in Cambodia ..................................................................................... 16
3.3 The Current Situation of Dollarization in Cambodia .................................................................... 17
4. Conclusion ...................................................................................................................................... 20
Reference ................................................................................................................................................ 21
Chapter 2: Efficiency and Total Factor Productivity of Financial Institutions .................................. 23
1. Introduction ..................................................................................................................................... 23
2. Estimation Methods ........................................................................................................................ 25
2.1 Measuring Efficiency .............................................................................................................. 26
2.2 Productivity Change Measurement ......................................................................................... 28
2.3 Data and Definition of Input and Output Variables ................................................................ 29
2.4 Determinants of Bank Efficiency and Productivity ................................................................ 34
3. Empirical Results ............................................................................................................................ 37
4. Discussion ....................................................................................................................................... 40
5. Conclusions ..................................................................................................................................... 42
Reference ................................................................................................................................................ 43
Appendix A: Algorithm of Bootstrapping DEA Regression ................................................................... 46
Appendix B: List of banks used in this study .......................................................................................... 48
Chapter 3: Depositors’ Behaviors under the Political Turbulence ...................................................... 49
1. Introduction ..................................................................................................................................... 49
2. Institutional background and event description .............................................................................. 51
2.1 The Cambodian financial sector in 2013 ................................................................................ 51
2.2 Large deposit withdrawals after the 2013 national election .................................................... 52

5
3. Determinants of the Extent of Deposit Withdrawals ...................................................................... 54
3.1 Fundamental-related vs. Non-fundamental-related bank runs ................................................ 54
3.2 Perception of too-big-to-fail .................................................................................................... 55
3.3 Transaction costs and sizes of deposit balances ...................................................................... 56
3.4 Regional factors ...................................................................................................................... 56
4. Data Description ............................................................................................................................. 57
5. Methodology ................................................................................................................................... 59
5.1 Empirical strategy ................................................................................................................... 59
5.2 Explanatory variables .............................................................................................................. 60
6. Results ............................................................................................................................................. 61
7. Concluding remarks ........................................................................................................................ 66
Reference ................................................................................................................................................ 67
Appendix A: List of Top 40 Financial Institutions in Cambodia (Loan sizes) ....................................... 70
Appendix B: Definition of Variables Used in Estimation and Data Sources .......................................... 71
Appendix C: Descriptive statistics of variables used in estimation ........................................................ 72
Appendix D: Correlation Matrix ............................................................................................................. 72
Appendix F: Impacts of deposit withdrawals on the economy. ............................................................. 73
Chapter 4: Foreign Currency Borrowing and Household’s Risk-Hedging Behaviors ....................... 79
1. Introduction ..................................................................................................................................... 79
2. Determinants of Foreign Currency Borrowing ................................................................................... 82
2.1 The Portfolio View ........................................................................................................................ 82
2.3 Heterogeneity in Risk-Hedging Behavior Against Exchange Rate Risks ..................................... 83
3. Data Description.................................................................................................................................. 84
4. Empirical Methodology ...................................................................................................................... 88
5. Empirical Results ................................................................................................................................ 91
5.1 Baseline Models ............................................................................................................................ 91
5.2 Effects of Education Level on Borrowing Behaviors .................................................................... 94
5.3 Robustness Check of Effect of Financial Literacy ........................................................................ 97
6. Conclusion and Policy Implications .................................................................................................... 99
Reference .............................................................................................................................................. 101
Appendix A: Definitions of Variables used in Regression .................................................................. 104
Appendix B: Descriptive Statistics of Variables used in Estimation. ................................................... 105
Appendix C: Correlation Matrix of Variables used in Estimation ........................................................ 106
6
Appendix D: Representativeness of HH sample .................................................................................. 107
Appendix E: Robustness check on potential endogeniety..................................................................... 112
Chapter 5: Firm’s Borrowing Behaviors in a Highly Dollarized Economy ....................................... 114
1. Introduction ................................................................................................................................... 114
2. Previous Researches ...................................................................................................................... 115
3. Dollarization and Corporate Finance in Cambodia ....................................................................... 116
4. Determinants of the Capital Structure of Cambodian Firms ............................................................. 122
4.1 Determinants of debt financing ................................................................................................... 123
4.2 Additional determinants related to FX borrowing ....................................................................... 125
5. Methodology ..................................................................................................................................... 127
5.1 Estimation strategy ...................................................................................................................... 127
5.2 Explanatory variables .................................................................................................................. 128
5.3 Sample selection bias due to borrowing constraints .................................................................... 129
6. Empirical Results .............................................................................................................................. 130
7. Conclusion ........................................................................................................................................ 133
Reference .............................................................................................................................................. 135
Appendix A: Difference between firms with bank loans and firms with no loans .............................. 138
Chapter 6: Conclusion ............................................................................................................................ 141
1. Summary and direction of future study of Chapter 2 (Efficiency of Cambodian banks) ............. 142
2. Summary and direction of future study of Chapter 3 (Deposit withdrawals) ............................... 143
3. Summary and direction of future study of Chapter 4 (HH FX currency borrowing) .................... 144
4. Summary and direction of future study of Chapter 5 (Firm borrowing behavior in a highly dollarized economy) .............................................................................................................................. 145
Reference .............................................................................................................................................. 146
7
Chapter 1: Overview of Cambodian Economy and Financial System
1. Introduction Even though Cambodia has been growing at a prominently rapid pace in the past two decades, there
are still remaining and growing issues in financial system. The rapid expansion of financial sector in recent years seemed to lead the economic growth, but the supervising ability of the central bank is still low, and the Cambodian financial system experienced occasional large-scale deposit withdrawals. Therefore, some well-designed restrictions and policy measures on the financial market are still needed to foster the stability and efficiency in financial market. In particular, evaluation of efficiency of financial institutions and examining factors of efficiency are important, because there is a concern that the recent increasing number of entries of foreign-owned banks did not necessarily contribute to improvement in efficiency of financial markets.
Besides, there remains an issue of dollarization in Cambodia. While Cambodia started to transit from the socially planned economy to the market-oriented one, it experienced macroeconomic instability, such as high inflation, and high volatility in exchange rates. As a result, Cambodia started to be dollarized in its financial market, and even in its domestic transactions. Although once the macroeconomic conditions recover, dollarization in general becomes lower, Cambodia still suffers from persistent heavy dollarization even while macroeconomic conditions are getting stable, and currently its dollarization level is 95 percent in terms of the ratio of FX deposits to total deposits. In the context of a highly dollarized economy, the effectiveness of monetary policy is constrained, and the central bank loses its ability to act as the lender of last resort. In Cambodia, currently, the monetary policy instruments used to achieve price stability is only to set reserve requirement rate and to conduct foreign exchange intervention.
In this dissertation, we investigate those growing and remaining issues in Cambodian financial markets. Before presenting our analyses on those issues, this chapter provides the historical and institutional backgrounds of Chapter 2-5. In the rest of this chapter, we describe the recent development and the current situation of Cambodian banking system in section 2. Furthermore, we present the brief introduction of dollarization in Cambodia in section 3. Finally, section 4 concludes.
2. Recent development and the Current Situation of Cambodian Economy and Financial system
2.1 The Recent Economic and Financial Development Cambodia has experienced a rapid economic growth from the result of peace, national unification
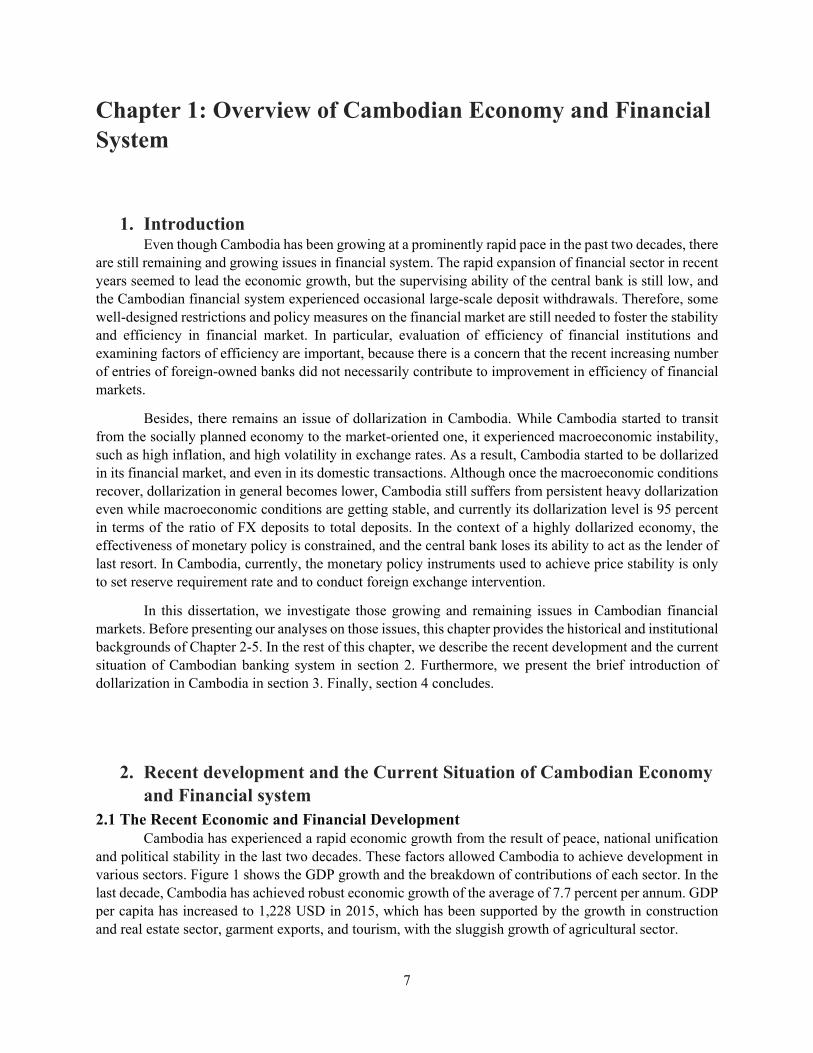
and political stability in the last two decades. These factors allowed Cambodia to achieve development in various sectors. Figure 1 shows the GDP growth and the breakdown of contributions of each sector. In the last decade, Cambodia has achieved robust economic growth of the average of 7.7 percent per annum. GDP per capita has increased to 1,228 USD in 2015, which has been supported by the growth in construction and real estate sector, garment exports, and tourism, with the sluggish growth of agricultural sector.
8
Along with the rapid growth, there have been changes in Cambodia’s industrial structure. While agricultural sector has dominantly contributed to the GDP growth in a last decade (for example, 4.5 percent out of 13.3 percent of the entire GDP growths in 2005), its composition of GDP has decreased to 0.2% in 2015. The Cambodian industrial structure shifted toward the secondary or service sectors. However, according to Hill and Menon (2014), the economic activities of Cambodia still remain narrowly based on a few sectors despite the rapid economic growth. The non-agricultural sector is dominated by tourism, export-oriented garments, and construction.1 Particularly, the tourism and garment sector contribute 71 percent of export of goods and services in 2014 (Hill and Menon, 2014). Those immaturity of the industrial diversification challenges for the further growth of the Cambodian economy.
Figure 1: Economic Growths and Contributions from 2004-2015
Source: National Institute of Statistics and Author’s Calculation
1 Tourism includes hotels, restaurants, transport, and personal services.
10.3%
13.3%
10.8% 10.2%
6.7%
0.1%
6.0%
7.1% 7.3% 7.4% 7.1% 7.0%
-5.0%
0.0%
5.0%
10.0%
15.0%
2004 2005 2006 2007 2008 2009 2010 2011 2012 2013 2014 2015
Agriculture Garment Construction Hotel & Restaurants Others Real GDP Growth

9
Figure 2: Poverty headcount ratio (2007-2015)
Source: Data provided by National Bank of Cambodia, and author’s calculation
Cambodia is categorized as low-income economy according to World Bank. However, there was a great improvement in poverty in the past decade (Figure 2). The poverty headcount ratio decreased from 47 percent in 2007 to 17 percent in 2014, although the poverty rate is still high compared to other Asian countries. Cambodia still challenges the immature infrastructure, such as water supply, public transportation and quality of electricity. Reflecting its history of conflicts, other social indicators are also low, such as education, and heath.
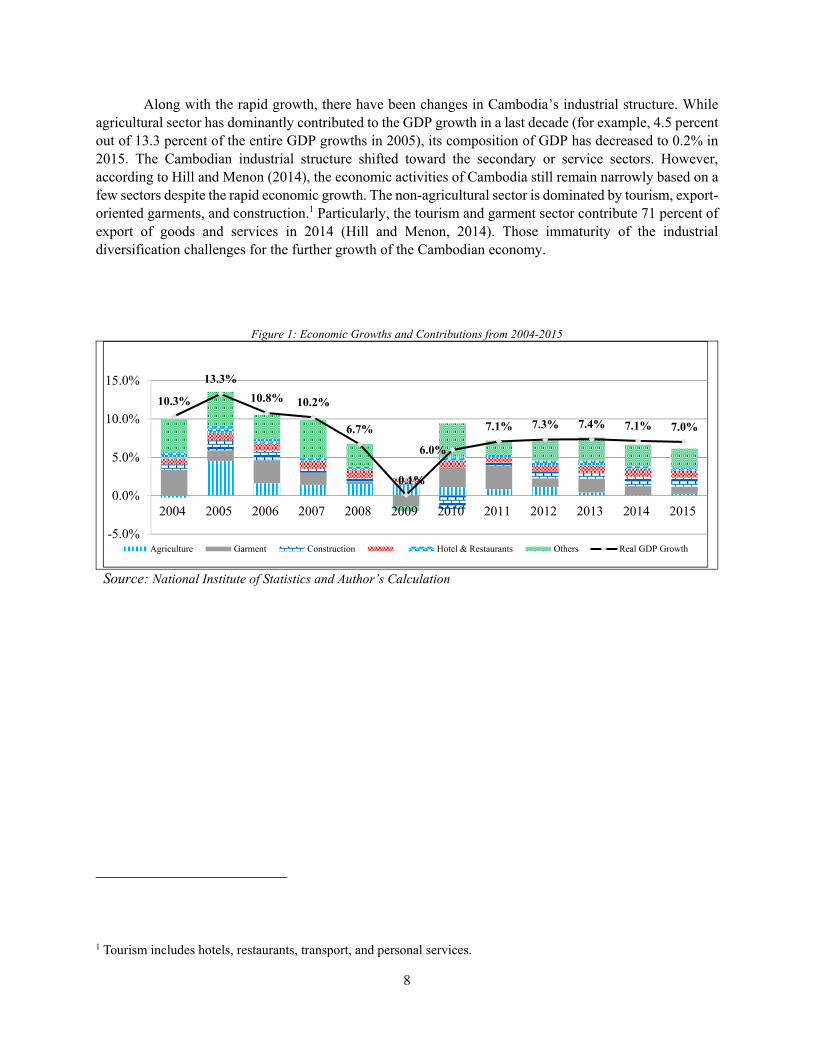
The stability in prices and exchange rates has been contributing significantly in maintaining macroeconomic stability with the inflation rate, except for a spike in 2008 (Figure 3). The price instability in 2008 was brought about by large capital inflows in asset prices due to the international economic downturns in this period, and also was the results of cost-push pressure, which mainly came from food prices (Hill and Menon, 2013). However, the price stability was recovered in 2010, and has continued to be stable until recently.
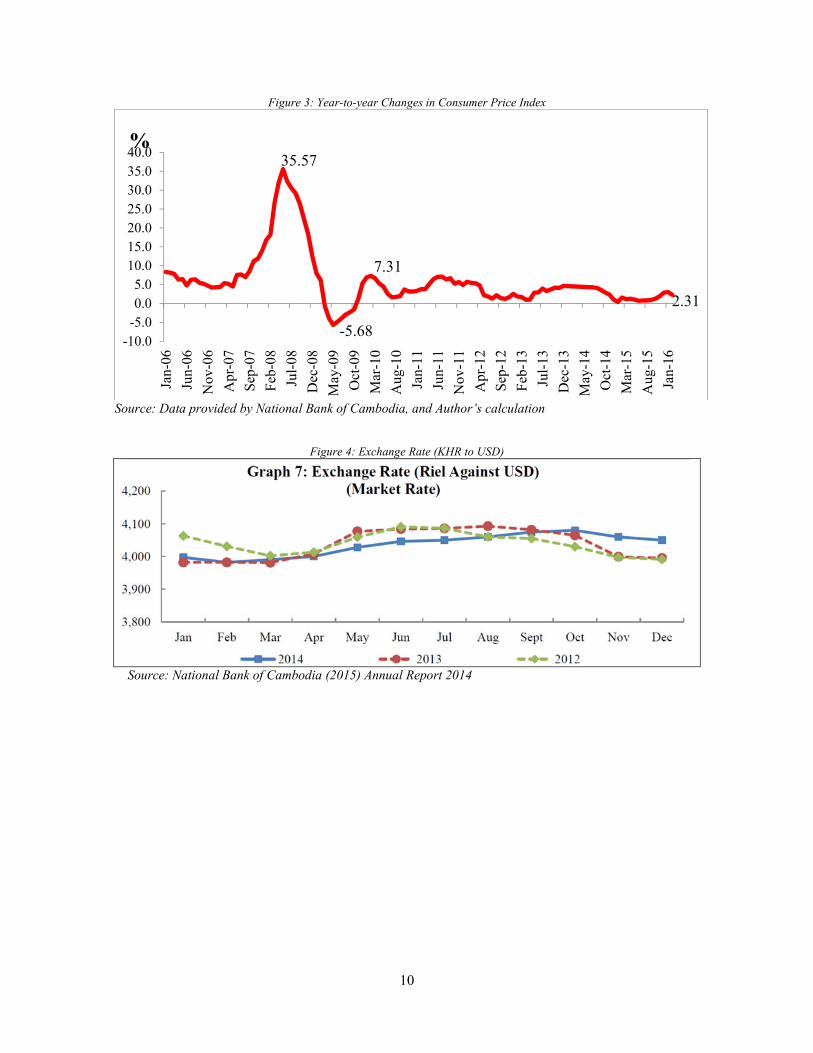
The exchange rate of local currency against USD remains stable, averaging at 4,050 KHR/USD. It has fluctuated at about 1-2 percent on a monthly basis, and shows seasonal changes in recent years (Figure 4). The seasonality in exchange rate fluctuation is generated partly due to the regular tax payments in March. The Cambodian government only allows paying tax in local currency.
Recently, the exchange rate of KHR/USD has had a tendency to appreciate, while the government often intervened in the foreign exchange market. Figure 5 shows the amounts of buying and selling USD by NBC from 2009 to 2014. In total, the amounts of buying USD in the foreign exchange market is more than those of selling USD every year, and in the recent two years, the net of buying USD has increased rapidly. It indicates that there is rising demands for the local currency in the recent years, although the government attempted to keep the exchange rate value fixed around 4000 KHR/USD.
48%
30%
23% 21% 20% 19% 18% 17% 15%
0%
10%
20%
30%
40%
50%
60%
2007 2008 2009 2010 2011 2012 2013 2014 2015 (Est.)
10
Figure 3: Year-to-year Changes in Consumer Price Index
Source: Data provided by National Bank of Cambodia, and Author’s calculation
Figure 4: Exchange Rate (KHR to USD)
Source: National Bank of Cambodia (2015) Annual Report 2014
35.57
-5.68
7.31
2.31
-10.0-5.00.05.0
10.015.020.025.030.035.040.0
Jan-
06
Jun-
06
Nov
-06
Apr
-07
Sep
-07
Feb
-08
Jul-
08
Dec
-08
May
-09
Oct
-09
Mar
-10
Aug
-10
Jan-
11
Jun-
11
Nov
-11
Apr
-12
Sep
-12
Feb
-13
Jul-
13
Dec
-13
May
-14
Oct
-14
Mar
-15
Aug
-15
Jan-
16
%

11
Figure 5: The amounts of parchasing USD in the market
Source: National Bank of Cambodia (2015) Annual Report 2014
2.2 The Banking Sector2
The National Bank of Cambodia (NBC) was established on December 23, 1954, after the country gained independence from the French government. From 1975 to 1979, under the Pol Pot regime, the banking sector was destroyed and the local currency, the Riel, was abolished. In 1979, after the collapse of the Pol Pot regime, the NBC was rebuilt as the central bank of Cambodia. At the same time, the Foreign Trade Bank was reestablished as a state-owned bank providing commercial banking services; in the following year, Khmer riel (KHR) was reintroduced as the new Cambodian currency. After an initial period of stabilization, starting in 1991, Cambodia began a transformation from a planned economy to a market-oriented economy. Afterward, private commercial banks were established, either as branches of foreign banks or through joint ventures with the NBC. By 1998, thirty-two licensed commercial banks had been established in Cambodia, with almost all of them merged with foreign-capital banks.
From 1998 to 2001, legal reforms and increased regulation of the financial sector initiated by the NBC resulted in the classification of financial institutions into three categories: commercial banks, with a minimum paid-up capital of $13 million; specialized banks, with a minimum paid capital of up to $2.5 million; and registered microfinance institutions (MFIs). Following this, the NBC also implemented programs to strengthen Cambodian banks through consolidation and disposition of nonperforming loans. By 2001, many banking licenses were revoked due to the increase in minimum paid-up capital, and these reorganization programs reduced the number of financial institutions to about half.
The banking sector in Cambodia has been growing in scope and scale in recent years. This sector has been increasing competitiveness, integrated, and playing a more important role in contributing to
2 Chapter 2 attempts to examine whether foreign-owned banks are more efficient than local banks in Cambodia.
12
economic growth. Evidently, the banking sector’s assets to GDP increased to 128 percent in 2015 (an increase of 16 percent compared to 2014). Financial deepening reached 64 percent (increasing by 6 percent). Financial intermediation increased consecutively, coupled with the continuous capital inflows from abroad into the banking system and had pushed up credit to the private sector by 28 percent while deposits increased by 18.9 percent, compared to that of last year. The proportion of foreign currency deposit was 83 percent of the broad money (FCD/M2) which has remained stable since 2002 reflected the high degree of dollarization.
In Cambodia, under the Law on Banking and Financial Institutions, three types of banking operations are defined: (1) credit operations, including leasing, guarantees, and commitments under signature; (2) collection of deposits from the public; and (3) provision and processing of means of payment to customers in either national currency or foreign currency. Institutions which are able to carry out all three banking activities are defined as commercial banks (CB), while institutions carrying out only one of these three basic activities are classified as specialized banks. In practice, specialized banks in Cambodia are only involved in lending activities. Microfinance institutions (MFIs) also engage in banking activities through the soliciting of deposits and the granting of credit, but their scope of operation is limited to certain thresholds in order to separate the banking and microfinance markets. Furthermore, while the Law on Banking and Financial Institutions legally defines Cambodian banks as either locally incorporated banks or foreign banks, in practice locally incorporated banks are varied and may include wholly foreign-owned banks, joint-venture banks with local capital banks, or subsidiaries of foreign banks.
As of 2015, commercial banks had about 84 percent and MFIs had 16 percent of total assets in banking sector, while specialized banks had less than 1 percent (NBC, 2016). In particular, MFIs can be divided into two entities: deposit-taking MFIs (MDIs) and non-deposit-taking MFIs. About 90 percent of total assets of the microfinance sector are owned by MDIs.3
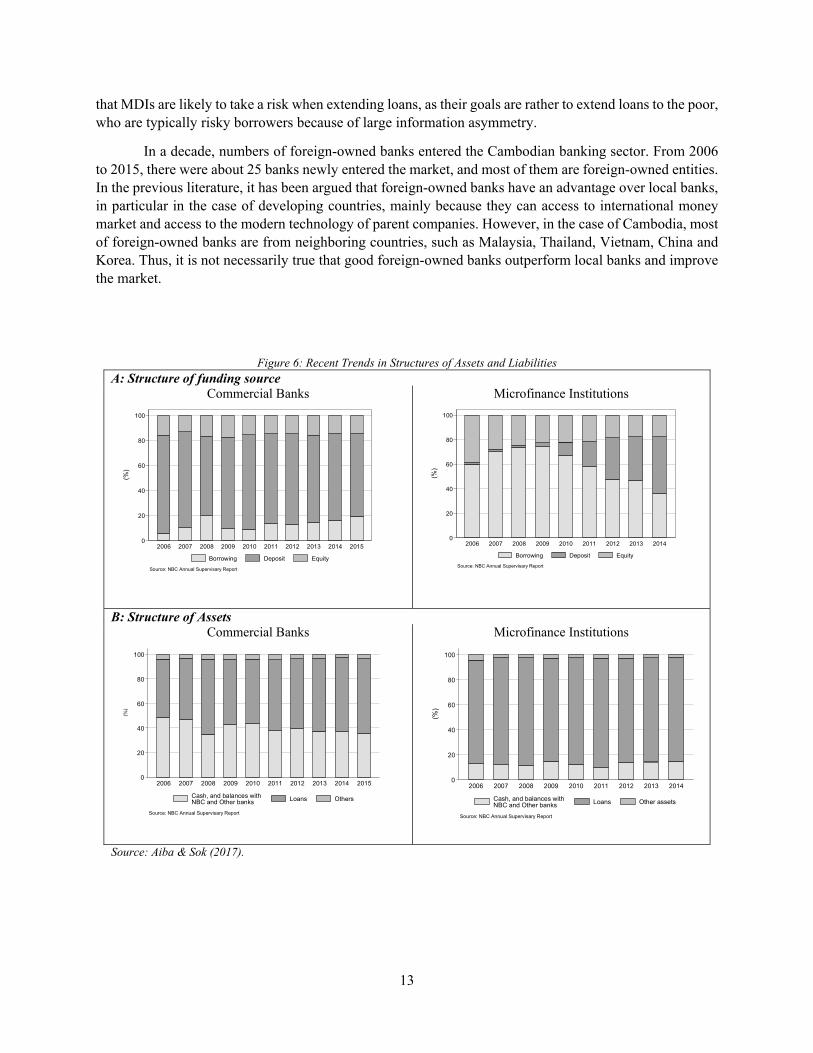
Figure 1 shows the recent trends in the structure of assets and liabilities for CBs and MDIs. Overall, MDIs have experienced significant changes in the composition of their liabilities from 2006 to 2014 The figures also suggest that the trends in changes of capital structure are different between CBs and MDIs. As is the case in other developing countries, deposits dominate the majority of funding sources for CBs, while borrowings are more important funding sources for MDIs. However, in recent years, deposits as percentages of total liabilities have been increasing in MDIs, suggesting that MDIs have transformed to sustainability-oriented entities, with more emphasis on commercial funding sources such as deposits.
In addition, there are differences in the composition of assets between CBs and MDIs. CBs have high liquidity in their asset sides, which fluctuates from 35 to 50 percent over the period studied, while MDIs consistently keep liquidity assets of less than 20 percent over the period. Compared to MDIs, CBs are risk-averse and tend to keep massive liquidity in their assets. There are a lot of possible causes for this high liquidity in CBs, such as the absence of deposit insurance. However, it might also be because dollarization incurs additional risks on the operation of banks, as Deléchat et al. (2012) show through cross-country evidence. Since the lenders of last resort are unlikely to work under the dollarized economy, banks have to prepare for entire liquidity shocks on their own. In addition, the low liquidity of MDIs might imply
3 Chapter 3 focus on the MDIs to investigate the depositor’s behaviors during the large deposit withdrawals.
13
that MDIs are likely to take a risk when extending loans, as their goals are rather to extend loans to the poor, who are typically risky borrowers because of large information asymmetry.
In a decade, numbers of foreign-owned banks entered the Cambodian banking sector. From 2006 to 2015, there were about 25 banks newly entered the market, and most of them are foreign-owned entities. In the previous literature, it has been argued that foreign-owned banks have an advantage over local banks, in particular in the case of developing countries, mainly because they can access to international money market and access to the modern technology of parent companies. However, in the case of Cambodia, most of foreign-owned banks are from neighboring countries, such as Malaysia, Thailand, Vietnam, China and Korea. Thus, it is not necessarily true that good foreign-owned banks outperform local banks and improve the market.
Figure 6: Recent Trends in Structures of Assets and Liabilities A: Structure of funding source
Commercial Banks
Microfinance Institutions
B: Structure of Assets Commercial Banks
Microfinance Institutions
Source: Aiba & Sok (2017).
0
20
40
60
80
100
(%)
2006 2007 2008 2009 2010 2011 2012 2013 2014 2015
Source: NBC Annual Supervisary Report
Borrowing Deposit Equity
0
20
40
60
80
100
(%)
2006 2007 2008 2009 2010 2011 2012 2013 2014
Source: NBC Annual Supervisary Report
Borrowing Deposit Equity
0
20
40
60
80
100
(%)
2006 2007 2008 2009 2010 2011 2012 2013 2014 2015
Source: NBC Annual Supervisary Report
Cash, and balances withNBC and Other banks Loans Others
0
20
40
60
80
100
(%)
2006 2007 2008 2009 2010 2011 2012 2013 2014
Source: NBC Annual Supervisary Report
Cash, and balances withNBC and Other banks Loans Other assets
14
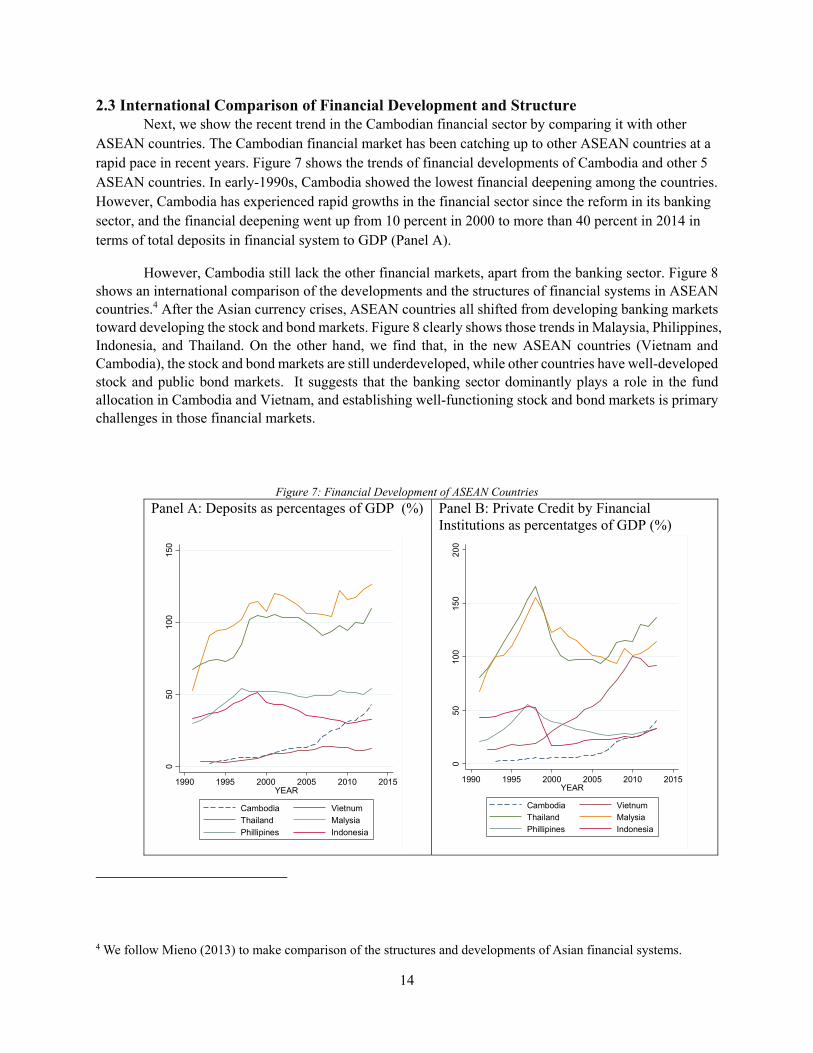
2.3 International Comparison of Financial Development and Structure Next, we show the recent trend in the Cambodian financial sector by comparing it with other
ASEAN countries. The Cambodian financial market has been catching up to other ASEAN countries at a rapid pace in recent years. Figure 7 shows the trends of financial developments of Cambodia and other 5 ASEAN countries. In early-1990s, Cambodia showed the lowest financial deepening among the countries. However, Cambodia has experienced rapid growths in the financial sector since the reform in its banking sector, and the financial deepening went up from 10 percent in 2000 to more than 40 percent in 2014 in terms of total deposits in financial system to GDP (Panel A).
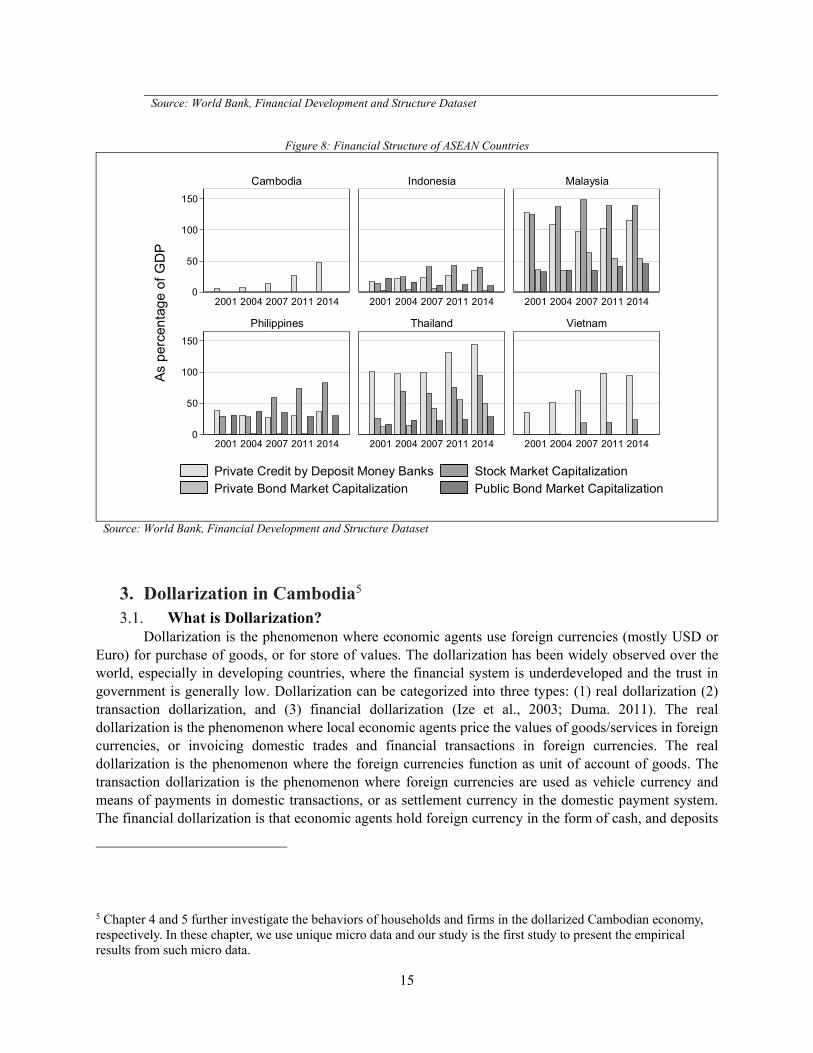
However, Cambodia still lack the other financial markets, apart from the banking sector. Figure 8 shows an international comparison of the developments and the structures of financial systems in ASEAN countries.4 After the Asian currency crises, ASEAN countries all shifted from developing banking markets toward developing the stock and bond markets. Figure 8 clearly shows those trends in Malaysia, Philippines, Indonesia, and Thailand. On the other hand, we find that, in the new ASEAN countries (Vietnam and Cambodia), the stock and bond markets are still underdeveloped, while other countries have well-developed stock and public bond markets. It suggests that the banking sector dominantly plays a role in the fund allocation in Cambodia and Vietnam, and establishing well-functioning stock and bond markets is primary challenges in those financial markets.
Figure 7: Financial Development of ASEAN Countries
Panel A: Deposits as percentages of GDP (%)
Panel B: Private Credit by Financial Institutions as percentatges of GDP (%)
4 We follow Mieno (2013) to make comparison of the structures and developments of Asian financial systems.
05
01
00
15
0
1990 1995 2000 2005 2010 2015YEAR
Cambodia Vietnum
Thailand Malysia
Phillipines Indonesia
050
100
150
200
1990 1995 2000 2005 2010 2015YEAR
Cambodia Vietnum
Thailand Malysia
Phillipines Indonesia
15
Source: World Bank, Financial Development and Structure Dataset
Figure 8: Financial Structure of ASEAN Countries
Source: World Bank, Financial Development and Structure Dataset
3. Dollarization in Cambodia5 3.1. What is Dollarization?
Dollarization is the phenomenon where economic agents use foreign currencies (mostly USD or Euro) for purchase of goods, or for store of values. The dollarization has been widely observed over the world, especially in developing countries, where the financial system is underdeveloped and the trust in government is generally low. Dollarization can be categorized into three types: (1) real dollarization (2) transaction dollarization, and (3) financial dollarization (Ize et al., 2003; Duma. 2011). The real dollarization is the phenomenon where local economic agents price the values of goods/services in foreign currencies, or invoicing domestic trades and financial transactions in foreign currencies. The real dollarization is the phenomenon where the foreign currencies function as unit of account of goods. The transaction dollarization is the phenomenon where foreign currencies are used as vehicle currency and means of payments in domestic transactions, or as settlement currency in the domestic payment system. The financial dollarization is that economic agents hold foreign currency in the form of cash, and deposits
5 Chapter 4 and 5 further investigate the behaviors of households and firms in the dollarized Cambodian economy, respectively. In these chapter, we use unique micro data and our study is the first study to present the empirical results from such micro data.
0
50
100
150
0
50
100
150
2001 2004 2007 2011 2014 2001 2004 2007 2011 2014 2001 2004 2007 2011 2014
2001 2004 2007 2011 2014 2001 2004 2007 2011 2014 2001 2004 2007 2011 2014
Cambodia Indonesia Malaysia
Philippines Thailand Vietnam
Private Credit by Deposit Money Banks Stock Market CapitalizationPrivate Bond Market Capitalization Public Bond Market Capitalization
As
per
cen
tag
e o
f G
DP
16
for the purpose of store of values, or financial institutions hold foreign currency in their assets and liabilities. In the case of Cambodia, all the three types of financial dollarization are observed even in rural areas (Khou, 2012; Aiba & Tha, 2017; Aiba & Sok, 2017; Odajima & Khou, 2017).
Dollarization has hysteresis as one of its important characteristics. Once dollarization is prevailed in the country, it generally persists for a long time, even though trust in government and stability in macroeconomic conditions recover (Kokenyne et al, 2010; Valve, 2010). Hysteresis of dollarization partly comes from the psychological factor (Stix, 2010). Once local people experience the negative impact on the trust in local currency or macroeconomic conditions, they tend to avoid having the local currency even after the recovery of trust in the local currency and macroeconomic conditions. In addition, the existence of network externalities of currency is also a factor which cause the hysteresis of dollarization (Valve, 2010, Samreth, 2011). Once majority of population starts to use foreign currency, the network externalities accelerates benefits from keeping the foreign currency in the forms of cash and financial assets and from using in transactions.
The previous literature of dollarization points out largely four causes of breakout of dollarization in a country (Duma, 2011, Mecagni et al., 2015). Firstly, large macroeconomic imbalance and hyperinflation could end up in dollarization in a country (the cases of Chile, Colonbia, and Peru). In this case, dollarization occurrs following the periods of macroeconomic instability and high inflation that result in the substitution of the domestic currency for foreign currencies (Galindo and Leiderman, 2005; Herrera and Valdés, 2005; Kokenyne, Ley, and Veyrune, 2010; Reinhart, Rogoff, and Savastano, 2003). Secondly, financial repression and capital controls could induce dollarization ( the cases of Nigeria, República Bolivariana de Venezuela, and many sub-saharan African countries). In the second case, dollarization occurrs after the introduction of policies that repress financial transactions and impose capital controls (Reinhart, Rogoff, and Savastano, 2003). Thirdly, the appeal of the U.S. dollar as an anchor of macroeconomic stability could result in high-level dollarization (the cases of El Salvador and Ecuador). In this case, foreign currencies were adapted as a legal tender so as to complement a long history of problems with monetary and exchange rate policy and following a deep economic and political crisis, respectively (Berg and Borensztein, 2000). The third case is generally called as official dollarization. Fourthly, the underdevelopment of financial markets could also be the factor to drive dollarization (the case of east Asian countries). In the fourth case, firms with accessibility to international financial markets borrow in foreign currency, since they cannot gain enough funds in local currency due to incomplete domestic financial market (Allayanis et al., 2003).
3.2. History of Dollarization in Cambodia When the civil war ended with the Khmer Rouge taking office in April 1975, the Khmer Rouge
regime introduced an extreme revolutionary program. It included bans on banking and even on money, including the local currency. The central bank was closed, and the financial infrastructure was completely destroyed. After the Khmer Rouge regime was ended in 1979, the central bank was reestablished, and in March 1980, the local currency, KHR, was reintroduced.
Since the reestablishment of the NBC, the banking system had been a mono-banking system, that is, a state-owned mono-bank with central, commercial, and development banking roles. The Foreign Trade Bank was established simultaneously inside the NBC to provide commercial banking services. USD started to flow into the country in the mid-1980, as the United Nations (UN) dispatched humanitarian and emergency aid, international non-governmental organizations (NGOs) were allowed to operate, and remittances from abroad resumed. During the 1980s, the country achieved only limited monetization and
17
most domestic transactions were based on barter, with gold being the universal commodity for transacting and hoarding (De Zamaroczy and Sa 2002).
From 1989, the country started to seek the two-tier banking system, which was a gradual reform to separate the commercial banking function from the NBC. Nonetheless, lack of confidence in local currency, hyperinflation, and massive exchange rate devaluation of KHR against USD during 1988–1991 occurred and discouraged the public from holding their KHR-denominated assets (Pum and Vanak 2010).
The use of USD was further facilitated by large inflows during the operation of the United Nations Transitional Authority in Cambodia (UNTAC). During 1991–92, UNTAC brought US$1.7 billion, equivalent to about 75 percent of GDP at that time, mostly spent for rent and local services for its peacekeeping operation (De Zamaroczy and Sa 2002; Hill and Menon, 2014; World Bank, 2015). FX deposits became an important component for the bank deposit base (Rumbaugh et al., 2000). Under the two-tier banking system, the first privately owned commercial bank, Cambodian Commercial Bank, was established as a joint venture between Siam Commercial Bank and the NBC in July 1991 to attract investors and serve the activities of UNTAC (Pum and Vanak 2010).
3.3 The Current Situation of Dollarization in Cambodia Since then, dollarization has been prevailed in the Cambodian economy until now (Figure 10) As
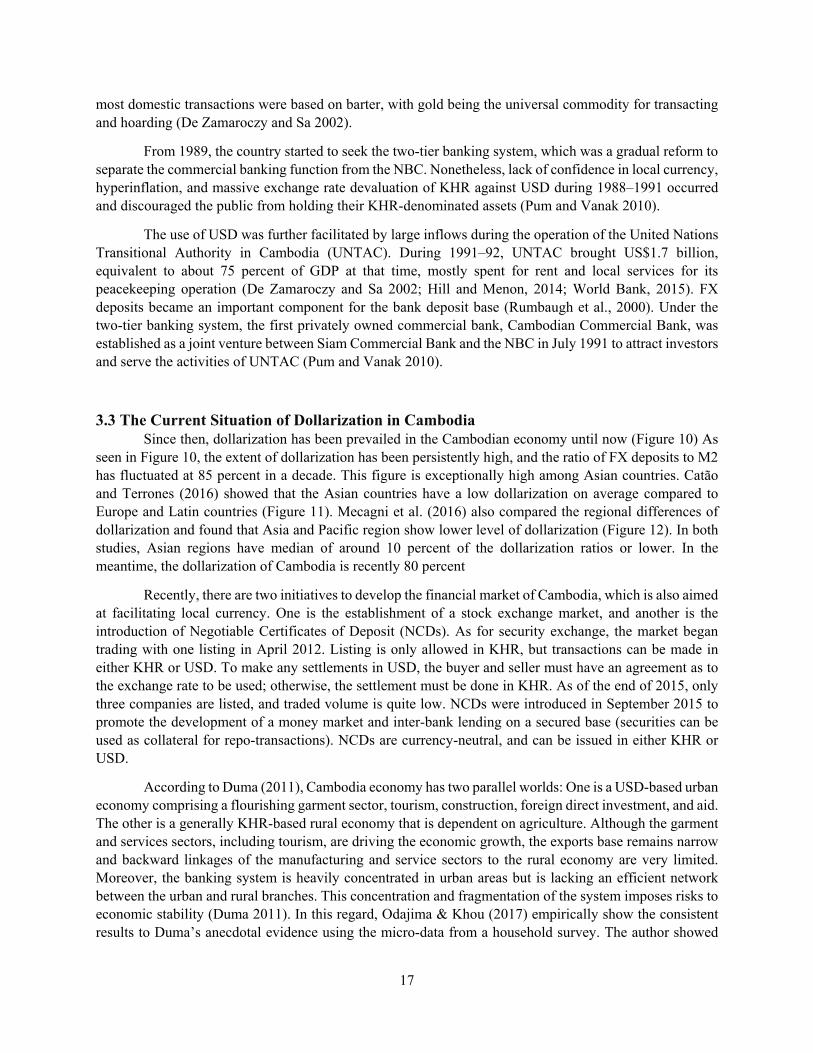
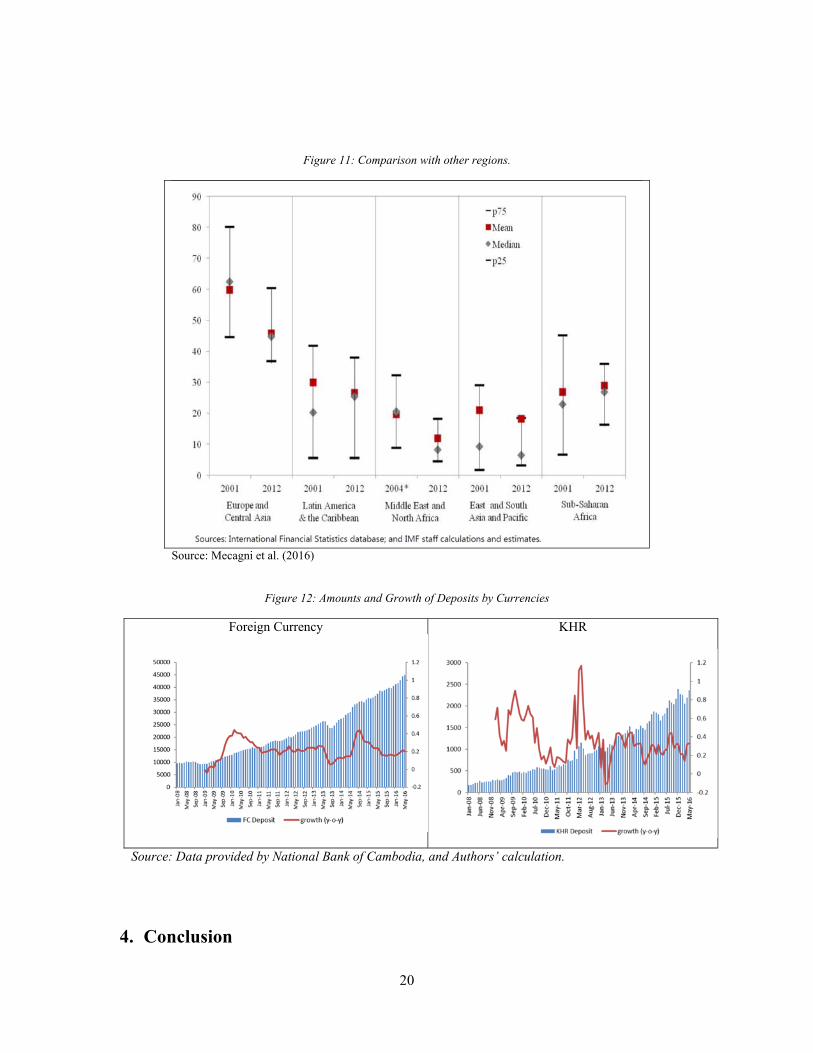
seen in Figure 10, the extent of dollarization has been persistently high, and the ratio of FX deposits to M2 has fluctuated at 85 percent in a decade. This figure is exceptionally high among Asian countries. Catão and Terrones (2016) showed that the Asian countries have a low dollarization on average compared to Europe and Latin countries (Figure 11). Mecagni et al. (2016) also compared the regional differences of dollarization and found that Asia and Pacific region show lower level of dollarization (Figure 12). In both studies, Asian regions have median of around 10 percent of the dollarization ratios or lower. In the meantime, the dollarization of Cambodia is recently 80 percent
Recently, there are two initiatives to develop the financial market of Cambodia, which is also aimed at facilitating local currency. One is the establishment of a stock exchange market, and another is the introduction of Negotiable Certificates of Deposit (NCDs). As for security exchange, the market began trading with one listing in April 2012. Listing is only allowed in KHR, but transactions can be made in either KHR or USD. To make any settlements in USD, the buyer and seller must have an agreement as to the exchange rate to be used; otherwise, the settlement must be done in KHR. As of the end of 2015, only three companies are listed, and traded volume is quite low. NCDs were introduced in September 2015 to promote the development of a money market and inter-bank lending on a secured base (securities can be used as collateral for repo-transactions). NCDs are currency-neutral, and can be issued in either KHR or USD.
According to Duma (2011), Cambodia economy has two parallel worlds: One is a USD-based urban economy comprising a flourishing garment sector, tourism, construction, foreign direct investment, and aid. The other is a generally KHR-based rural economy that is dependent on agriculture. Although the garment and services sectors, including tourism, are driving the economic growth, the exports base remains narrow and backward linkages of the manufacturing and service sectors to the rural economy are very limited. Moreover, the banking system is heavily concentrated in urban areas but is lacking an efficient network between the urban and rural branches. This concentration and fragmentation of the system imposes risks to economic stability (Duma 2011). In this regard, Odajima & Khou (2017) empirically show the consistent results to Duma’s anecdotal evidence using the micro-data from a household survey. The author showed

18
that Cambodian households in rural areas have a larger share of KHR in their currency composition of income, and expenditure, than those in urban areas, especially Phnom Penh. 6 Aiba & Tha (2017) empirically investigated the dollarization in Cambodian enterprises using data from a survey conducted in the same period as Odajima & Khou (2017). Aiba & Tha show that the dollarization in enterprise sector is higher than households, and the extent of dollarization is different across industries, across regions, and across sizes of firms.
Previous studies have argued that the recent dollarization in Cambodia is not explained by currency substitution, since local currency deposits have been growing at the same pace as foreign currency deposits (Menon, 2008; Duma, 2011; Khou, 2012). The amounts and year-on-year growth rates of aggregated bank deposits by currencies are shown in Figure 12. Panel C reveals that the local currency deposits have been increasing rapidly along with foreign currency deposits, although the growth rates of local currency deposits are much more volatile than foreign currency deposits. Therefore, the current expansion of dollarization is not the consequence of distrust in the local currency, but is instead caused by the massive inflow of foreign currency. Aiba & Sok (2017) empirically investigated branch-level and bank-level dollarization using the data from a survey on branches of 15 Cambodian financial institutions. The authors found that the KHR deposits have increased from 2009 to 2013, in particular for deposits of microfinance institutions. Since the microfinance institutions have large branch-network over the countries, and recent improvement in financial inclusion helps the poor, who mainly use KHR, to have deposits. The authors argue that financial inclusion may help the de-dollarization in Cambodia.
6 Chapter 4 investigated the Cambodian household’s FX borrowing behaviors using the data from Odajima & Khou (2017).

19
Figure 9: The Exchange Rate and Dollarization
Source: Hill and Menon (2014)
Figure 10: Deposit Dollarization by regions
Source: Catão and Terrones (2016) Note: The figure shows box charts of the ratio of FX deposits to total deposits.
20
Figure 11: Comparison with other regions.
Source: Mecagni et al. (2016)
Figure 12: Amounts and Growth of Deposits by Currencies
Foreign Currency KHR
Source: Data provided by National Bank of Cambodia, and Authors’ calculation.
4. Conclusion

21
In this chapter, we presented the history and institutional background of Cambodian financial markets. Cambodia has grown at rapid pace in two decades. However, there are remaining and emerging issues in its financial market. Low efficiency and vulnerability of financial markets are potentially one of the most important growing issues, and dollarization is one of the important remaining issues in the Cambodian financial markets. Given a paucity of empirical evidences on these issues, the following chapters provide empirical analyses by using set of unique data, and give policy implications on those issues in the Cambodian financial markets.
Reference Aiba, D., & Ranareth, Tha. (2017) Dollarization and Enterprise's Behaviors: The Case of Cambodia.
Hitotsubashi Economics, 10(2), 49-80.
Aiba, D., & Sok, P., (2017) Financial Dollarization: Evidence from a Survey on Branches of Cambodian Financial Institutions. Hitotsubashi Economics, 10(2), 81-116.
Catão, L. A.V., and Terrones, M. (2016). Financial De-Dollarization; A Global Perspective and the Peruvian Experience (No. 16/97). International Monetary Fund.
Duma, N. (2011). Dollarization in Cambodia: causes and policy implications. IMF Working Papers, 1-25.
Khou V. (2012) Functionality of multiple currencies in circulation in Cambodia. Doctoral Thesis of
Hill, H., & Menon, J. (2013). Cambodia: rapid growth with weak institutions. Asian Economic Policy Review, 8(1), 46-65.
Hill, H., & Menon, J. (2014). Cambodia: Rapid Growth in an Open, Post‐conflict Economy. The World Economy, 37(12), 1649-1668.
Mecagni, M. M., Corrales, M. J. S., Dridi, M. J., Garcia-Verdu, M. R., Imam, P. A., Matz, M. J., & Narita, M. M. (2015). Dollarization in Sub-Saharan Africa: Experiences and Lessons. International Monetary Fund.
Menon, J. (2008). Cambodia’s Persistent Dollarization: Causes and Policy Options. ASEAN Economic Bulletin, 25 (2). pp. 228–37.
Mieno, F. (2013) Financial Systems in the four South-east Asian countries. [Published in Japanese] 三重
野文晴. (2013). 東南アジア 4 カ国の金融システムをどうとらえるか: アジア金融統合への基本
視角. Rim: 環太平洋ビジネス情報, (49), 21-40.
Odajima, K., & Khou, V. (2016) Foreign Currency Usage and Perception: Evidence from a Survey on Cambodian Households. Hitotsubashi Economics, 10(2), 9-48.
Pum, H. and Vanak, K. (2010). Cambodia: Coping with Dollarization. in Capanneli, G., and Menon, J. (Ed.) DEALING WITH MULTIPLE CURRENCIES IN TRANSITIONAL ECONOMIE: The scope for Regional Cooperation in Cambodia, the Lao People’s Democratic Republic, and Viet Nam, Asian Development Bank, Manila,
Rumbaugh, T., Ishi, K., Liang, H., and Masuda, A. (2000). Cambodia: Selected issues. IMF Staff Country Report. No. 00/135. Washington, DC: International Monetary Fund.
22
De Zamaróczy, M., & Sa, S. (2002). Macroeconomic adjustment in a highly dollarized economy: The case of Cambodia. IMF Working Paper, No. 02/92.
Samreth, S. (2011). An empirical study on the hysteresis of currency substitution in Cambodia. Journal of Asian Economics, 22(6), 518-527.
World Bank. 2015. Cambodia economic update : maintaining high growth. Cambodia economic update. Washington, D.C. : World Bank Group.
23
Chapter 2: Efficiency and Total Factor Productivity of Financial Institutions An Application of a Bootstrapping DEA Approach1
1. Introduction
The gradual opening of the Cambodian financial sector has resulted in rapid growth, with both new foreign and local financial institutions entering the industry.2 Despite the rapid growth of the industry, with many new recent entrants, according to the International Monetary Fund (IMF) (IMF, 2011), there are some problems as to whether Cambodia is overbanked compared to its regional neighbors and other countries at similar stages of development. Claessens & Laeven (2004) support the view that, unlike in other industries, competition in the banking industry is related less to the number of banks and more to its transparency and the quality of supervision. Therefore, the rapid growth of the Cambodian banking sector calls for a systematic evaluation of the effect of increased participation on efficiency.
In this regard, we investigate the determinants of both the technical efficiency and total factor productivity (TFP) changes in Cambodia. Okuda, Poleng, & Aiba (2014) have conducted a data envelopment analysis (DEA), a nonparametric econometric method for measuring the efficiency and the TFP changes of individual financial institutions, in the Cambodian banking sector using microdata of individual financial institutions. They find that Cambodian financial institutions experienced a deterioration of productivity from 2006 to 2011, but note that the efficiency gap between the most efficient financial institutions and the inefficient financial institutions had decreased. In addition, they find a difference in the mean of efficiency among financial institutions having different characteristics such as operation size, ownership structure, and business specification by using DEA. However, they do not take into account other factors such as the size of the financial institutions or the risks that may affect efficiency, and furthermore, their study does not look at the correlation among independent variables. In the Cambodian financial sector, as well as in other developing countries (Sufian, 2009), some bank characteristics are correlated with other variables, such as size and ownership structure.3 Thus, it is necessary to take into account this relationship when examining what makes financial institutions more efficient or what affects
1 This chapter is written, based on Okuda & Aiba (2016) Determinants of Technical efficiency and Total Factor Productivity Change of Major Cambodian Financial Institutions: A Data Envelopment Analysis During 2006–13. Emerging Markets Finance and Trade, 52(6), 1455-1471. 2 Throughout this chapter, the term “financial institutions” is used to refer to three types of intermediators: commercial banks, specialized banks, and microfinance institutions. 3 For example, most foreign-owned banks are small, and there is an apparent correlation between bank size and bank ownership.

24
their productivity in order to gain a more precise understanding of their technical efficiency. Our study builds on this DEA work by identifying specific factors that influence the technical efficiency of financial institutions in Cambodia.
Although the Cambodian financial sector has experienced rapid growth, available data on the sector remain limited and present a challenge for the systematic study of the technical efficiency of financial institutions. Because DEA is a nonparametric estimation procedure, it is well suited to small-sample investigation and so was adopted in this study. Other previous studies about financial sectors in emerging and developing countries, such as Ozekan-Gunay et al. (2013), investigate the efficiencies of financial institutions. In order to not only examine technical efficiency but also to identify its determinants, we conduct a two-stage DEA procedure. First, we estimate the technical efficiencies of financial institutions and their total productivity (TFP) changes, and then we regress the obtained efficiency score and Malmquist index to find the determinants, using a conventional panel data estimation. The two-stage method to estimate the determinants of efficiency and TFP changes is commonly used in the study of financial institutions (e.g., Banker et al., 2010; Delis et al., 2011; Hou et al., 2013; Lee & Chin, 2013). In addition, we apply the robust procedure proposed by Simar &Wilson (2007) to regress the technical efficiency and TFP change in variables related to the operational environment and characteristics of the financial institutions. We use data compiled from the financial statements of individual financial institutions in the period 2006–13 published by the National Bank of Cambodia.
Our results suggest that (1) the efficiency of large financial institutions is higher and more stable than that of small financial institutions, and larger financial institutions have experienced higher growth in financial technology; (2) financial institutions with foreign capital comprising more than half of total capital are significantly inferior to local financial institutions with respect to technical efficiency, while there is no difference in TFP growth between foreign-owned and local institutions; (3) financial institutions with a lower solvency risk make more profit in the long term, while those with a higher solvency risk attempt to expand their loan portfolios to make short-term profits; and (4) the more diversified financial institutions are, the more efficient they are, and financial institutions with higher diversification are likely to make progress in financial technology.
One of our contributions to the literature is to provide an evidence whether the foreign-owned bank is more efficient than local ones. The efficiency of foreign-owned entities has shown mixed results in the literature. In the most of studies in developing countries, foreign-owned banks which come from developed countries outperform local banks, possibly because of its advanced technology and accessibility to international funding sources. However, in the case of Cambodia, most of foreign entrants came from neighboring countries, such as Thailand, Malaysia, Vietnam and Korea. Thus, there is doubt whether foreign-owned banks outperform the local banks, and whether foreign entrants improve the efficiency of intermediation of the banking sector in Cambodia. Our findings show that foreign-owned banks do not outperform local banks in terms of both value-added and operating approaches.
Furthermore, our study is the first study to investigate the efficiency of the Cambodian financial institutions. Thus, this study can be the benchmark for further advanced studies on Cambodian banks behaviors. In addition, we believe that the results of this study may be also useful from policy-making perspective.

25
The rest of this chapter is organized as follow. In section 2, we present the empirical methodology to estimate the efficiency and its determinants. In section 3, we present the results of our analysis. Section 4 concludes.
2. Estimation Methods
While the Cambodian financial sector has experienced rapid growth in recent years, there has been few researches done on the efficiency of the Cambodian banking system. Okuda, Poleng, & Aiba (2014) examine the efficiency of the entire Cambodian banking system using DEA and find that Cambodian financial institutions have experienced deterioration in their productivity and that foreign banks are more efficient than local banks. However, they do not investigate the determinants of efficiency and productivity in Cambodian financial institutions, and so this study builds on this work to identify these determinants.
We focus on two measures of bank performances: efficiency and TFP changes, and estimate those measures by a DEA model. Developing countries present a challenge for econometric investigation due to data limitation. DEA, which uses nonparametric assumption, is a suitable solution for the small sample issue because of the lower data requirements compared to parametric approaches. The DEA model has been used widely in the study of efficiency in banking and other industries. For example, Drake, Hall, & Simper (2006) adopt the DEA model to estimate the efficiency of Taiwanese banks, and Özkan-Günay, Günay, & Günay (2013) estimate the average efficiencies of commercial banks by sizes in Turkey as well. Both of their findings reveal that there has been a size-efficiency relationship in the banking sector. In other words, the largest financial institutions likely outperform their smaller competitors.
In this study, we use a two-stage estimation procedure of DEA in order to estimate the determinants of efficiency and TFP changes of individual financial institutions. The two-stage estimation procedure of DEA has been adopted to analyze the specific determinants of the efficiency and TFP changes of banks. Grigorian & Manole (2002), for example, conduct a two-stage method using DEA to study determinants of efficiency of banks in transition countries using cross-country data and find that foreign ownership and bank restructuring both enhance bank efficiency, even after controlling market power of banks. Barry et al. (2010) and Casu & Molyneux (2003) study banking efficiency in six Asian countries and the European Union, respectively, and find that the ownership structure is a crucial determinant of bank efficiency. In previous studies on financial institutions in developing countries, Sufian (2009, 2011) studies technical efficiency and TFP change by using a two-stage application of DEA in Malaysia, and Jeffry et al. (2007) investigates the determinants of TFP changes in countries of the India subcontinent such as Bangladesh, India, and Pakistan.4
4 The banking sectors in these Asian countries are less developed as well, although mostly different in many aspects, such as number of banks, banking law, and the roles of public banks and foreign-owned banks. In contrast
26
In the two-stage estimation procedure, we consider that technical efficiency is determined by the following structure:
where θit represents the efficiency of bank i at time t and is written as a function of the environmental vector zit, which also includes bank characteristic variables, such as firm size and the ratio of total equity to total assets. In the first stage, we estimate the by the DEA approach. In the second stage, the estimated efficiency score θit is regressed on .
To estimate the coefficients of variables in the second stage, we employ the estimation method proposed by Simar & Wilson (2007). Previous studies have found some problems, such as complicated serial correlation, in the two-stage method using DEA and point out that the inference from the standard approach could be invalid.5 To deal with this problem, Simar & Wilson (2007) develop a two-stage DEA approach with bootstrapping, and a lot of recent studies have applied their approach to banking sector analyses (Brissimis, Delis, & Papanikolaou, 2008; Delis et al., 2011). Furthermore, Simar & Wilson (2007) provide simulation evidence that shows a truncated regression model can lead to a theoretically clearer inference than a censored regression model, which has conventionally been used for the regression of bank technical efficiency. Thus, we employ the truncated regression model in the estimation of the determinants of technical efficiency, while ordinary least squares (OLS) with bootstrapping is employed in TFP changes measured using the Malmquist index (We describe Malmquist index in section 3.2). In the Appendix, we describe the procedure in detail.
2.1 Measuring Efficiency
Because technical efficiency is important to the success of firms, it is not surprising that the measurement of efficiency has a long history, beginning with Farrell (1957), who draws upon the work of Debreu (1951) and Koopmans (1951) to define a simple measure of the efficiency of a firm that could account for multiple inputs. Farrell (1957) proposes that the efficiency of a firm consists of two components: technical efficiency, which reflects the ability of the firm to obtain maximal output from a given set of inputs, and allocative efficiency, which reflects product prices and the production technology. These two
to these countries, the banking sector in Cambodia has less regulation. 5 In general, ordinary least squares (OLS), a censored model, and a truncated model are mainly used in the literature on the two-stage DEA approach.

27
measures are then combined into a measure of total economic efficiency. Following these seminal studies, Färe, Grosskopf, & Lovell (1985, 1994) and Lovell (1993) have contributed to the development of modern efficiency measurement.
In contemporary efficiency theory, there are two main approaches to measuring the efficiency of firms: stochastic frontier analysis (SFA) and data envelopment analysis (DEA). While SFA assumes a parametric functional form, DEA is a nonparametric approach to solving linear programming problems by identifying a set of best-practice frontier observations. In contrast to SFA, which depends on a large-sample assumption to estimate parameters, DEA makes no such assumption and so can work with small samples. This is especially important in studies of the banking industry, as the number of banks in many countries has decreased due to mergers and acquisitions, and so in many countries, it is becoming difficult to estimate bank efficiency by parametric means. Thus the number of studies adopting DEA has been increasing in recent years, and this study likewise adopts the DEA approach to estimating technical efficiency due to the small available sample size in Cambodia.
There are two assumptions in the DEA model: (1) constant returns to scale (CRS) and (2) variable returns to scale (VRS). The CRS assumption is only appropriate when all firms are operating at an optimal scale. Imperfect competition, constraints on finance, and other likely situations may cause a firm not to operate at optimal scale. Banker, Charnes, and Cooper (1984) thus suggest an extension of the CRS model to account for variable returns to scale (VRS) situations, and the extended model is generally called the BCC-DEA. To discuss DEA in more technical terms, let us assume that there are data on k inputs and m outputs for each N firm. For the ith firm, these are represented by input vector xi = (xi1, xi2,…, xik) and output vector yi = (yi1, yi2, …, yim), respectively.
min,
s. t.
∑ 1, … , ∑ 1, … ,
∑ 1 0, 1, … ,
0
where θ is a scalar and λ is an N × 1 vector of constants. The value of θ is the technical efficiency score for the ith firm. It will satisfy θ ≤1, with a value of 1 indicating a point on the frontier and hence a technically efficient firm according to the Farrell (1957) definition. The linear programming problem must be solved n times, once for each firm in the sample. A value of θ is then obtained for each firm.

28
2.2 Productivity Change Measurement
In this section, we introduce the indicator of total factor productivity (TFP) changes, which has been employed in previous studies (Delis, Molyneux, & Pasiouras 2011; Sufian, 2011). As well as estimation of determinants of technical efficiency, we examine the possible determinants of total factor productivity in Cambodia. This indicator is supposed to capture the growth of productivity and of financial institutions and is regressed on characteristics of financial institutions in the second stage.
To estimate the TFP changes, we suppose that each sample, separated by year, represents a single frontier that is constructed on the assumption of the same technology. Therefore, a comparison of efficiency measures of a firm over a given period cannot be interpreted as technical progress; rather, it refers to changes in efficiency (Canhoto & Dermine 2003). The concept of comparing the inputs of a firm over two periods (period t and period t + 1), whereby the input in one period can be decreased while maintaining the same level of output in the second period, forms the basis of the Malmquist productivity index (MPI). We measure TFP by calculating the MPI composed of all components of technology change (innovation), efficiency change (the catch-up effect), pure technical change, and scale efficiency change. Specifically, the definition of MPI is given as follows:
, ⋅ ,, ⋅ ,
where yt and xt represent the input and out variables, respectively; . denotes the function that projects the distance from the frontier to an observation in the period t. The MPI of total factor productivity (TFP) change is the geometric mean of the two indexes based on the technology used in periods t and t + 1, respectively.6 In other words, MPI can be decomposed as MPI = E * T, where E is the change in efficiency from period t to t + 1, and T is the measure of technical progress measured by shifts in the frontier from period t to t + 1. Any variation in the reference technology affects the interpretation of the index. When the reference technology is based on period t, then MPI > 1 implies an increase in productivity.
We illustrate the brief concept of DEA and MPI in Figure 1. In this analysis, we assume that the production frontier can change over the period, because of progress or regress in technology adopted by banks. As shown in Panel A of Figure 1, the DEA method is statically capture the distance from the frontier to a bank in each period. In other words, DEA gauges bank’s management efficiency each year. In the meantime, as shown in Panel B, MPI gauges a TFP change over the period by summing up both of a change in distance from the frontier to a bank and a change in the production frontier. Changes in distances from a bank to the frontier represent changes in bank efficiency, while changes in the frontier represent the
6 For a decomposition of the Malmquist productivity index, see Lovell (1993).

29
progress/regress in bank’s technology. An important property of MPI is that the TFP change measured by MPI mixes both effects of changes in the frontier and changes in the efficiency.
As well as the stochastic frontier approach, DEA approach also capture the scale and economies of scope in the shape of its frontier. Accordingly, the measured efficiency and TFP changes reflect the managerial efficiency and productivity which affect the relationship between input and output, instead of the scope and scale of economies. 7
Figure 1: Concept of DEA and Malmquist Productivity Index Panel A: The concept of technical efficiency
Panel B: The concept of Malmquest Index
2.3 Data and Definition of Input and Output Variables
In Cambodia, where the institutional infrastructure is underdeveloped and information asymmetry is serious, rapid expansion of bank operations would lead to deterioration in the quality of credit and customers. Therefore, it would be more realistic to assume that banks operate in a way of input minimization. Thus, we adopt the BCC-DEA model, which is based on the assumption that banks could reduce excessive use of inputs keeping the present level of bank output.
Regarding definition of bank output and input variables, in recent studies (Barry et al., 2010; Grigorian & Manole, 2002; Sufian, 2009), two approaches— the operating approach and the value-added approach—are used to explore the differences in productivity among financial institutions. We adopt a
7 Some of previous studies focus on estimating the economies of scope using DEA method. Arocena (2008) proposed the empirical method to measure the economies of scope using DEA. Cummins et al (2010) employ DEA approach to test the existence of economies of scope in an insurance sector. They use a two-stage approach in which they estimate the efficiency score in the first stage using DEA approach, and in the second stage, they regress the estimated efficiency score on the indicator of economies of scope.
30
value-added and operating approach in order to measure the efficiency of banks operating in such market circumstances. Some of previous studies employ the intermediation approach. The intermediation approach focuses on the conventional business operations of banks; that is, transforming deposits to loans, and the quantitative activity of banks to extend loans and to collect deposits. This approach is suitable for the underdeveloped banking sector before financial liberalization. While the Cambodian economy is underdeveloped, its financial sector is highly liberalized, and many foreign banks conduct fee-based business rather than loan business. Therefore, the intermediation approach does not fit in the Cambodian context.8
In our study, we follow the selection criteria of input and output variables used in Sufian (2009).9 The operating approach focuses on efficiency with respect to revenue, whereas the value-added approach focuses on efficiency in terms of the amount of financial intermediation. In other words, the operating approach captures the activities of the income statement, whereas the value-added approach captures balance-sheet activities—although these two activities are closely related. Accordingly, for each approach, three input and two output variables were chosen. In the operating approach, the input variables used are interest expense (X1), the number of branches (X2), and the number of staff members (X3); while interest income (Y1) and noninterest income (Y2) are used as the output variables. In the value-added approach, the same inputs are adopted as in the operating approach, but the outputs are total deposits (Y1) and gross loans (Y2). Tables 1 and 2 present summaries of data used to construct the efficiency frontiers. Descriptive statistics and the correlation matrix of input and output variables are reported in Tables 1 and 2, respectively.1011
8 As we will show in Table 7, the diversification ratio in Cambodia is relatively high on average. 9 Although the intermediation approach was used in previous studies, value-added and operating approaches are better in Cambodia because some Cambodian banks, especially those that have newly entered the sector, tend to rely on equity to expand their loan portfolios. Thus it is likely that the efficiency scores would be overestimated if we were to adopt the intermediation approach. 10 In the calculation of efficiency with DEA, we converted the negative values in non-interest income into zero. 11 The variables used in the DEA model vary slightly across recent studies, even though these studies use the same concepts to define the input and output variables in bank activity. This is mainly a result of the limitations in available data for each country.

31
Table 1:Descriptive statistics of input and output variables in data envelopment analysis (DEA)
Variable Observations MeanStandard deviation
Minimum Maximum
Number of staff 216 595.50 1,300.3 3 9,537
Number of offices 216 51.05 69.7 1 374
Interest expenses 216 18064.08 33,069.7 0 204,676
Noninterest income 216 9776.68 17,956.6 −2,712.2 99,466
Interest income 216 58482.42 106,220.3 344.02 799,395
Loans 216 436616.50 812,415.8 3,726.10 5,295,591
Deposits 216 536374.50 1,050,438.0 0 5,917,840
Table 2. Correlation matrix of input and output variables in data envelopment analysis (DEA) (1) (2) (3) (4) (5) (6) (7)
(1) Number of staff 1
(2) Number of offices 0.679 1
(3) Interest expenses 0.705 0.357 1
(4) Non-interest income 0.623 0.139 0.816 1
(5) Interest income 0.853 0.461 0.936 0.856 1
(6) Loans 0.694 0.280 0.949 0.923 0.955 1
(7) Deposits 0.589 0.137 0.891 0.940 0.876 0.950 1
Note : Interest rate, interest income, noninterest income, loans, and deposits are adjusted for inflation.
In our study, we estimate the technical efficiency and TFP change by means of the two approaches mentioned. We collected data on financial institutions from the National Bank of Cambodia, 2006–2013. Financial institutions are listed in Appendix B. To obtain the balanced panel data required to calculate the MPI, we reduce the sample to 22 individual financial institutions in the period 2006–13. Table 3 shows the average of those indicators over time in Cambodia. On the whole, technical efficiency has been higher in locally incorporated financial institutions than in foreign-owned entities. This result is in contrast to previous studies that have investigated the financial sector in developing countries. Most previous studies find that foreign-owned financial institutions outweigh local financial institutions due to the advantage of accessibility to higher technology and funds from their parent firms (for example, Berger et al. 2005). However, a lot of foreign-owned financial institutions have entered the Cambodian financial market in recent years, and most of them are still small. There is the possibility that size has a significant relationship with efficiency. In the second stage, we clarify the relationship between ownership and technical efficiency by controlling size and other correlated factors.

32
Table 3. Average scores of technical efficiencies
All sample Foreign-owned banks
Year VAA OP VAA OP
2006 Observations 27 27 11 11
Mean 0.585 0.747 0.494 0.701
Std. dev. 0.373 0.296 0.357 0.238
2007 Observations 27 27 12 12
Mean 0.631 0.781 0.513 0.786
Std. dev. 0.352 0.272 0.353 0.239
2008 Observations 27 27 12 12
Mean 0.635 0.83 0.463 0.839
Std. dev. 0.359 0.215 0.364 0.196
2009 Observations 27 27 13 13
Mean 0.62 0.839 0.462 0.853
Std. dev. 0.4 0.246 0.396 0.176
2010 Observations 27 27 13 13
Mean 0.569 0.764 0.44 0.767
Std. dev. 0.403 0.265 0.408 0.193
2011 Observations 27 27 13 13
Mean 0.588 0.709 0.464 0.69
Std. dev. 0.399 0.298 0.399 0.237
2012 Observations 27 27 13 13
Mean 0.589 0.78 0.408 0.709
Std. dev. 0.388 0.248 0.359 0.218
2013 Observations 27 27 16 16
Mean 0.574 0.734 0.449 0.703
Std. dev. 0.389 0.268 0.378 0.262
Total Observations 216 216 103 103
Mean 0.599 0.773 0.46 0.754
Std. dev. 0.378 0.264 0.366 0.223
Notes : VAA = value-added approach. OP = operating approach.
Table 4 shows the results of calculations performed to clarify how major Cambodian financial institutions changed from 2006 to 2013. Since the interest of our study is the TFP change from year to year, we only show the results of TFP change, the catch-up effect, and frontier shift. TFP changes were measured by the MPI. An indicator greater than 1 means an improvement in productivity, whereas a coefficient
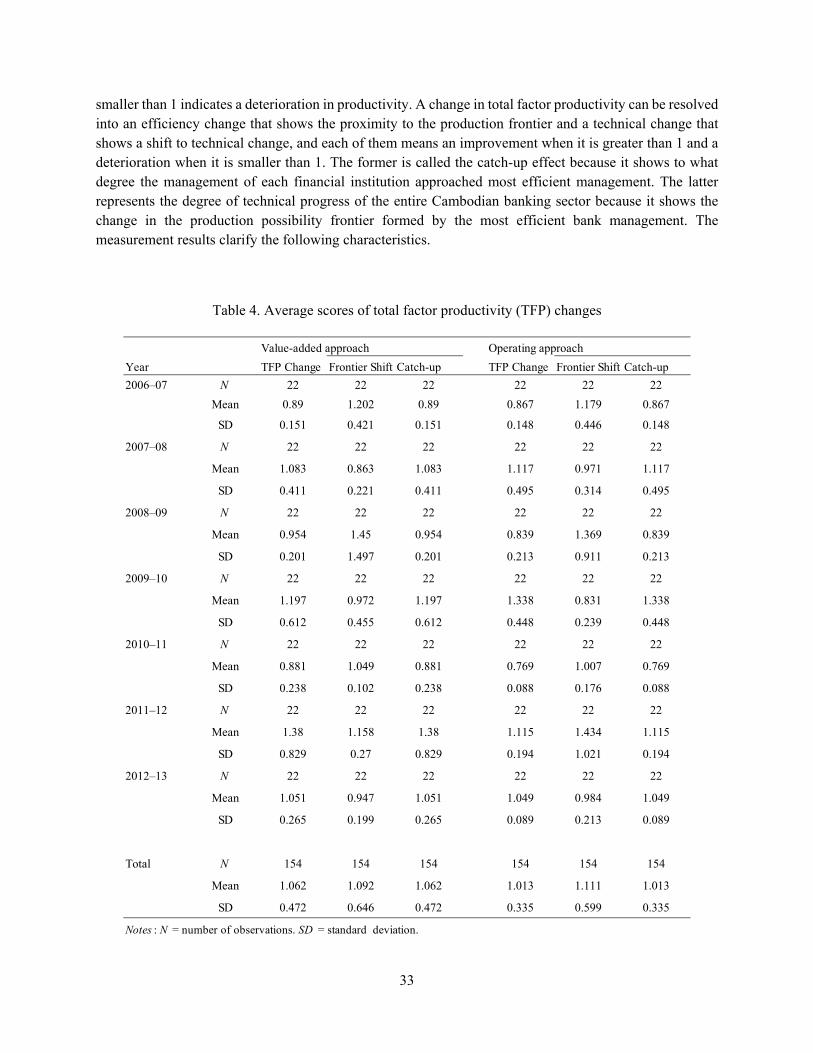
33
smaller than 1 indicates a deterioration in productivity. A change in total factor productivity can be resolved into an efficiency change that shows the proximity to the production frontier and a technical change that shows a shift to technical change, and each of them means an improvement when it is greater than 1 and a deterioration when it is smaller than 1. The former is called the catch-up effect because it shows to what degree the management of each financial institution approached most efficient management. The latter represents the degree of technical progress of the entire Cambodian banking sector because it shows the change in the production possibility frontier formed by the most efficient bank management. The measurement results clarify the following characteristics.
Table 4. Average scores of total factor productivity (TFP) changes
Value-added approach Operating approach
Year TFP Change Frontier Shift Catch-up TFP Change Frontier Shift Catch-up
2006–07 N 22 22 22 22 22 22
Mean 0.89 1.202 0.89 0.867 1.179 0.867
SD 0.151 0.421 0.151 0.148 0.446 0.148
2007–08 N 22 22 22 22 22 22
Mean 1.083 0.863 1.083 1.117 0.971 1.117
SD 0.411 0.221 0.411 0.495 0.314 0.495
2008–09 N 22 22 22 22 22 22
Mean 0.954 1.45 0.954 0.839 1.369 0.839
SD 0.201 1.497 0.201 0.213 0.911 0.213
2009–10 N 22 22 22 22 22 22
Mean 1.197 0.972 1.197 1.338 0.831 1.338
SD 0.612 0.455 0.612 0.448 0.239 0.448
2010–11 N 22 22 22 22 22 22
Mean 0.881 1.049 0.881 0.769 1.007 0.769
SD 0.238 0.102 0.238 0.088 0.176 0.088
2011–12 N 22 22 22 22 22 22
Mean 1.38 1.158 1.38 1.115 1.434 1.115
SD 0.829 0.27 0.829 0.194 1.021 0.194
2012–13 N 22 22 22 22 22 22
Mean 1.051 0.947 1.051 1.049 0.984 1.049
SD 0.265 0.199 0.265 0.089 0.213 0.089
Total N 154 154 154 154 154 154
Mean 1.062 1.092 1.062 1.013 1.111 1.013
SD 0.472 0.646 0.472 0.335 0.599 0.335
Notes : N = number of observations. SD = standard deviation.

34
As shown in Table 4, the TFP of major Cambodian financial institutions improved remarkably during the eight years from 2006 to 2013. The average TFP of financial institutions is greater than 1, both in the value-added approach, which focuses on the amount of financial intermediation, and in the operating approach, which focuses on profitability. The latter is higher than the former, and this is interpreted as being because the management skill of Cambodian financial institutions has been growing faster than that of traditional banking businesses.
If the improvement in TFP is resolved into efficiency change and technical change, the former surpasses the latter both in the measurement in the value-added approach and in the measurement in the operating approach. In particular, the improvement in TFP measured in the operating approach is mostly caused by a change in efficiency.
2.4 Determinants of Bank Efficiency and Productivity
We regress the technical efficiency and TFP change estimated in the first stage in the way that Simar and Wilson (2007) recommend. The detailed estimation procedure is described in Appendix A. The variables that are considered as potential determinants of technical efficiency and productivity of financial institutions are (1) dummy variables to identify the ownership structure; (2) logarithms of total assets to control the effect of the size of a financial institution; (3) a Z-score to identify the soundness of operation of financial institutions;12 (4) diversification rate; and (5) dummy variables that represent specializations of financial institutions such as commercial banks, specialized banks, and microfinance institutions.
Size of Financial Institutions
We use a logarithm of total assets as the variable for the size of financial institutions. In many previous studies, the results of the effects of the size of financial institutions on technical efficiency have been mixed and the causality has been unclear. Although Berger et al. (2005) and Brissimis, Delis, and Papanikolaou (2008) find a positive relationship between bank efficiency and bank size, Bonin, Hasan, and Wachtel (2005) find that larger banks are less efficient in transition economies. In addition, Havrylchyk (2006) finds that the performance of Polish banks has no significant relation to bank size. Generally, large financial institutions may have a large market share and may more easily grow a large client base, which in banking leads to an outsized profit and enables the financial institutions to collect deposits and create loans more easily. In addition, large financial institutions can make an investment in technology, in particular intellectual technology such as automated teller machines. It is possible that the size of the financial
12 This proxy is a combination of indicators of profitability, leverage, and return volatility. If this variable increases, it indicates a decrease in overall risk exposure and an increase in the stability of financial institutions (Ariss 2010).
35
institution may also have a positive effect on changes in financial technology. Thus the TFP change may be positively correlated with the size indicators of financial institutions.
Ownership Structure
To investigate the effect of ownership structure on performance, we use dummy variables to distinguish whether financial institutions are foreign owned or local. In this study, we establish a foreign-owned dummy to take 1 if the foreign share of paid-up capital exceeds 50 percent of total paid-up capital. Although many previous studies have examined the difference between private and public owners, we cannot similarly categorize financial institutions in this study as there are no public financial institutions in Cambodia. Most studies find that in developing countries, foreign-owned financial institutions are more efficient than local financial institutions (Bonin, Hasan, & Wachtel 2005; Grigorian & Manole 2002). The reasoning follows that in developing countries, foreign-owned financial institutions from developed countries may have access to superior technologies, particularly information technologies and procedures for assessing complex quantitative information. However, foreign-owned financial institutions may have some disadvantages compared to local financial institutions in assessing soft information about local firms (Berger et al. 2005). Havrylchyk (2006) studies Polish banks and finds that greenfield foreign-owned banks are more efficient than foreign-owned banks that were originally local banks and acquired by foreign banks entering the market. His finding suggests that the type of foreign-owned financial institution affects technical efficiency. Thus, to account for this, we test whether there is a significant difference in the types of foreign-owned financial institutions. This test verifies whether the result that we saw in the stage of estimating the efficiency score was due to the ownership attributes or other factors such as size. Furthermore, we assume that the ownership structure is also important in the TFP change and offers an advantage in growing the financial technology as foreign ownership can help them access funds, sophisticated technologies, and knowledge.
Soundness of Financial Institutions
The Z-score represents the soundness and quality of the management of financial institutions.13 This variable shows whether financial institutions consistently make a profit and whether they tend to take high risks. We follow Schaeck & Čihák (2008) and Ariss (2010) in the calculation of the Z-score, which is calculated as follow:
13 This indicator has been widely used in many recent studies (Boyd and De Nicole 2005; Schaeck & Čihák, 2007; Ariss 2010). However, although the variable of equity should be the market values, no Cambodian banks are listed in the stock markets and we can not obtain the market values. Therefore, we use book value of equity instead.
36
⁄
where represents the standard deviation of return on assets (ROA) of individual financial institutions in the period 2006-13. A number of previous studies have tried to identify the soundness of a financial institution as one of the characteristics of financial institutions. Resilient and stable financial institutions may easily collect deposits from their customers; that is, they need fewer resources to produce the products of financial institutions, and they can reduce waste because of less uncertainty in their operations. Accordingly, this variable is expected to be positively correlated with efficiency. Brissimis, Delis, and Papanikolaou (2008) and Grigorian and Manole (2002) analyze the relation of resilience to bank efficiency in transition economies, and Chortareas, Girardone, and Ventouri (2013) investigate bank efficiency in twenty-seven EU countries. These studies all find bank resilience has a significantly positive correlation with bank efficiency.14 However, it is unclear how the resilience of financial institutions affects the technical efficiency of financial institutions in developing countries.
We also expect that the TFP change has a positive relation to resilience as it is easier for financial institutions that have stable profit to make an extra investment in equipment for their future profitability.
Diversification Ratio
A number of previous studies have mainly investigated the relationship between diversification and risks, or market value in financial institutions (for example, Baele, De Jonghe, and Vennet 2007), but to our knowledge there is little evidence of a link between the efficiency of financial institutions and diversification. Theoretically, it is unclear whether the benefit from diversification exceeds the cost. Diversifying bank business is supposed to increase the complexity of the operation of financial institutions, while modernized financial institutions may likely have efficient management system. Thus, we add this variable to our regression models in order to clarify the linkage between diversification and technical efficiency and between diversification and TFP change. In addition to that reason, as the diversification rate is generally higher in foreign-owned financial institutions, it is necessary to include the extent of diversifying the business domain in addition to the traditional intermediation business.
14 These studies use the ratio of equity to total assets to investigate the relationship between resilience and efficiency. However, it is vague as to what the ratio represents as an increase in the ratio of equity assets also implies an increase in payments to shareholders. Sometimes the payment to shareholders as a percentage of total equity becomes higher than payments to borrowing as a percentage of total borrowing. Thus, an increase in the ratio of equity to total assets does not always mean an increase in the resilience of bank operation. Furthermore, Cambodian banks generally have a high capital adequacy ratio due to the dollarized operational environment, and they already have a sufficiently high capital adequacy ratio.
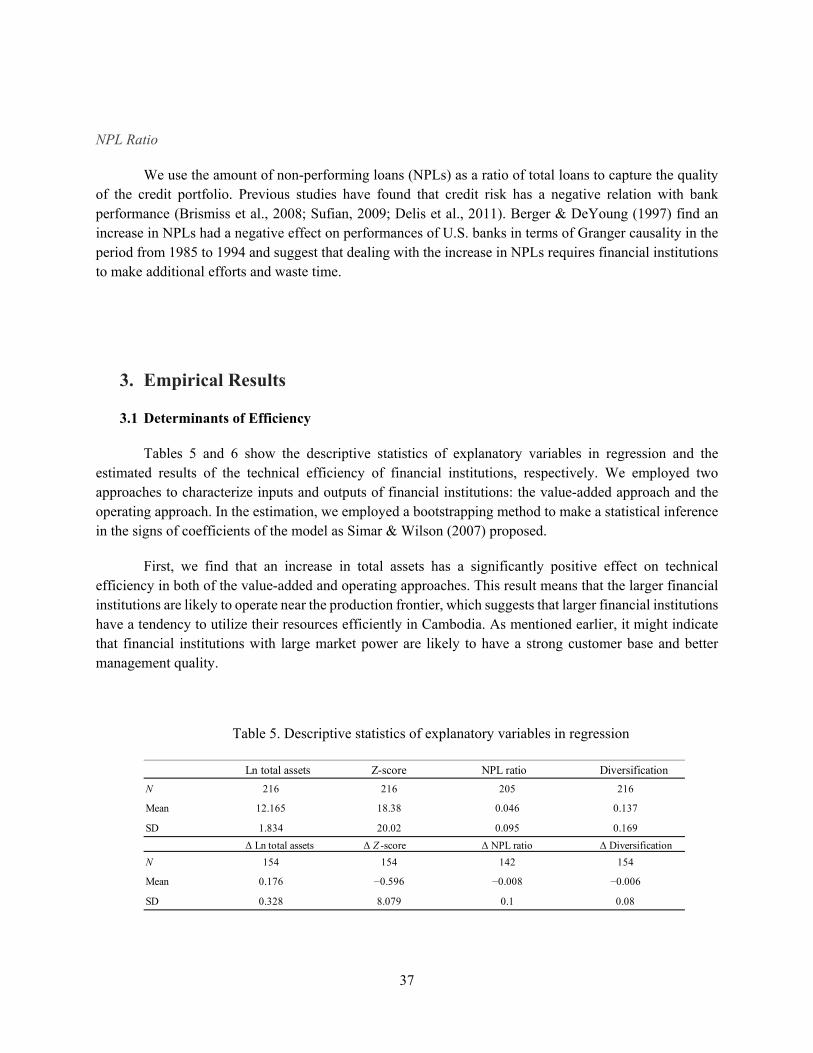
37
NPL Ratio
We use the amount of non-performing loans (NPLs) as a ratio of total loans to capture the quality of the credit portfolio. Previous studies have found that credit risk has a negative relation with bank performance (Brismiss et al., 2008; Sufian, 2009; Delis et al., 2011). Berger & DeYoung (1997) find an increase in NPLs had a negative effect on performances of U.S. banks in terms of Granger causality in the period from 1985 to 1994 and suggest that dealing with the increase in NPLs requires financial institutions to make additional efforts and waste time.
3. Empirical Results
3.1 Determinants of Efficiency
Tables 5 and 6 show the descriptive statistics of explanatory variables in regression and the estimated results of the technical efficiency of financial institutions, respectively. We employed two approaches to characterize inputs and outputs of financial institutions: the value-added approach and the operating approach. In the estimation, we employed a bootstrapping method to make a statistical inference in the signs of coefficients of the model as Simar & Wilson (2007) proposed.
First, we find that an increase in total assets has a significantly positive effect on technical efficiency in both of the value-added and operating approaches. This result means that the larger financial institutions are likely to operate near the production frontier, which suggests that larger financial institutions have a tendency to utilize their resources efficiently in Cambodia. As mentioned earlier, it might indicate that financial institutions with large market power are likely to have a strong customer base and better management quality.
Table 5. Descriptive statistics of explanatory variables in regression
Ln total assets Z-score NPL ratio Diversification
N 216 216 205 216
Mean 12.165 18.38 0.046 0.137
SD 1.834 20.02 0.095 0.169
Δ Ln total assets Δ Z -score Δ NPL ratio Δ Diversification
N 154 154 142 154
Mean 0.176 −0.596 −0.008 −0.006
SD 0.328 8.079 0.1 0.08

38
Table 6. Estimation Results of Determinants of Technical Efficiency
Value-added approach Operating approach
Estimated coefficient Estimated coefficient
Ln total assets 0.119*** 0.078***
Z-score −0.002** 0.001
Foreign dummy −0.203*** −0.126**
NPL_ratio 0.042 0.031
Diversification 0.543*** 0.653**
Specilization
Specialized banks dummy
0.283* 0.396***
MFIs dummy −0.149* 0.283***
Year dummy Yes Yes
Constant −0.937* −0.563**
Observations 189 189
Notes: As we made a statistical inference from 2,000 bootstrap replications, information such as the t-value is not described in this table. *Significant at the 10 percent level; **significant at the 5 percent level; ***significant at the 1 percent level.
We find that the coefficient of the Z-score is significantly negative in the value-added approach, while there is no significant result in the operating approach. This means that financial institutions with a higher insolvency risk make loans and deposits with fewer managerial resources in Cambodia. This result seems to be counterintuitive, but a possible interpretation is that they tend to increase returns in the short term at expense of an increase in a risk. This result is contrary to previous results. For example, Grigorian & Manole (2002) investigate bank efficiency in transition countries and find a positive relationship between resilience and the technical efficiency of financial institutions. Furthermore, Brissimis, Delis, and Papanikolaou (2008) find a positive relationship as well.
We find that foreign-owned financial institutions are significantly less efficient than local financial institutions in both of the value-added and operating approaches. These results are in contrast with most studies which have found that foreign-owned financial institutions are superior to local financial institutions in developing countries as they have an advantage in terms of access to new technologies. These results suggest that foreign-owned financial institutions are not as efficient as local financial institutions, as the disadvantages of foreign-owned financial institutions exceed the advantages. In other words, such financial institutions have no effective technical advantages, and disadvantages such as difficulties in collecting soft information on local firms and having to struggle to operate in different environments from their home countries outweigh the advantages.

39
The estimated coefficient of the diversification ratio is significantly positive in both approaches. In other words, financial institutions whose business is more diversified exhibit significantly higher overall technical efficiencies in Cambodia. This result is consistent to the earlier findings, such as Suffian (2009) in Malaysian banks. This result might suggest that the benefits derived from diversification in financial activities exceed the cost, and that more diversified financial institutions lend more and encourage more deposits. In other words, Cambodian financial institutions might efficiently utilize the resources used and information collected from financial intermediation activity in other activities, and they exploit the information from other activities in financial intermediation activities.
3.2 Determinants of TFP
Table 7 summarizes the results of a regression analysis of determinants of total factor production changes in both the operating approach and the value-added approach. We used the same explanatory variables as for the regression of technical efficiency, although the variables are transformed into changes over time, as the dependent variable reflects changes. In the estimation, we also employed bootstrapping method to make a statistical inference in the signs of coefficients as Simar & Wilson (2007) proposed.
Most of the results are similar to those for the regression of technical efficiency in the earlier section, although some results are opposite. The size of financial institutions is significantly and positively associated with the TFP changes of financial institutions in both of the value-added approach and the operating approach. It suggests that larger financial institutions are more likely to experience the TFP growth. It is a natural to assume that to some extent the market power is required to allow financial institutions to invest in the adoption of new technology or invest in existing technology which other efficient peers adopted. Furthermore, in both of the value-added and operating approaches, the coefficients of diversification are statistically significant and positive as seen in the estimation of technical efficiency. These results mean that modernization of the management of Cambodian financial institutions has increased total factor productivity in both the profitability and value-added approach.
In the meantime, some of coefficients are estimated differently compared to the estimation of determinants of technical efficiency. First, the coefficient of the Z-score is significantly negative with is estimated as significantly positive in the operating approach, although this coefficient in the model of technical efficiency (Table 6) is insignificant in the value-added approach. This result is in line with the literature on the relationship between resilience and performance in financial institutions (Delis et al. 2011).
The foreign dummy that represents ownership attributes is statistically insignificant in Table 7, although the estimated sign is significantly negative in the model of technical efficiency in Table 6. It suggests that the difference in ownership structure does not affect the TFP changes.

40
Table 7. Estimation Results of Determinants of TFP Changes
Value-added approach
Operating approach
Estimated coefficient
Estimated coefficient
D. Ln total assets 1.160*** 0.480***
D. Z-score 0.019 0.234***
Foreign dummy −0.004 −0.069
D. NPL_ratio −0.689** −0.405**
D. Diversification 0.937*** 1.109***
Specilization
Specialized banks dummy 0.277*** 0.178***
MFIs dummy −0.081 0.205
Year dummy Yes Yes
Constant −0.563** −0.937*
Observations 142 142
Notes: As we made a statistical inference from 2,000 bootstrap replications, information such as the t-value is not described in this table. *Significant at the 10 percent level; **significant at the 5 percent level; ***significant at the 1 percent level.
Finally, the coefficient that is supposed to capture the effect of the quality of a loan portfolio is estimated as a negative value in both the value-added approach and the operating approach. This result suggests that financial institutions that take risks in making loans or that have poor screening ability have a tendency to fail to facilitate their TFP growth. This finding is consistent with the findings of previous studies (Brissimis, Delis, and Papanikolaou, 2008; Sufian, 2011).
4. Discussion This section discusses the possible interpretation of our estimation results. Although the causal
links between the bank efficiency/TFP changes and bank characteristics are difficult to identify, we attempt to draw several implications for the Cambodian banking sector.
First, we found that the bank sizes have a positive relation with both bank efficiency and TFP changes. However, the relationship between bank sizes and bank efficiency/TFP could have endogeneity, as efficient banks are likely to survive the market, and, eventually they might grow in asset size relative to new entrants. Meanwhile, in the Cambodian financial market, there was only one bank which exited from the market. Accordingly, the bias of the reverse causality could be small in the estimation. Thus, facilitating banks to be larger or promoting M&A could lead to improvement in managerial efficiency of Cambodian banks, in both of volume of intermediation and profitability. This argument might be in line with IMF (2012), which point out the overbanking issue in the recent Cambodian banking sector.
41
We found that foreign dummy was positively correlated to the bank efficiency, while there was no significant correlation with TFP changes. The results might suggest that as illustrated in Figure 1 (Section 3), the TFP changes are also accompanied by the effect of efficiency changes over the period aside from technology changes. Therefore, the results in Table 7 might reflect that the progress in technology offset the negative effect of efficiency changes for foreign-owned banks. In fact, a strand of literature points out an advantage of foreign ownership in adoption of advanced technology (Bonin, 2005). A further investigation is required to examine the effect of ownership on progress in technology, but negative management efficiency in foreign-owned financial institution is still to be addressed by some regulatory framework.15 The negative effect of foreign ownership might reflect the recent influx of foreign-owned banks from neighboring countries due to the low restriction in the Cambodian banking sector. As pointed out by Claessens & Laeven (2004), the promoting competition in a banking sector requires adequate regulation rather than the number of financial institutions. Then, the Cambodian banking sector may need additional restriction on entry of foreign financial institutions.
In our results, the insolvency risk affected bank efficiency and bank productivity in different ways. The results might mean that financial institutions with lower solvency risk could make more profit in the long-term, while financial institutions with higher solvency risk are likely to expand their loan portfolio to make a short-term profit. However, the insolvency risk and bank management efficiency could be simultaneously determined as suggested by DeYoung (1998), Koetter & Porath (2007), and Brissmis et al.
(2008). Generally, a bad management, that is low efficiency, could cause an increase in the insolvency risk. However, the possible reverse causality might work to underestimate the negative effect of insolvency risk on bank technical efficiency, while our results still show a significance in the negative effect of this variable. Thus, our results possibly reflect the impact of a rise in risks on bank efficiency. It implies that, as Cambodia still needs to strengthen regulations and enforcement in the financial sector, this result may suggest that financial institutions have not had enough restrictions applied to them to avoid taking risks.
We found that the strong negative correlation between NPL ratio and TFP changes in both of the value-added and operating approaches, while there was no significant relation of NPL ratio with technical efficiency. Again, there might be potential simultaneity bias between credit risk and efficiency/TFP changes as well as insolvency risks. Then, the result might mean that having low quality of loans is also accompanied with inferior technology and low efficiency somehow, or it might reflect that the low technology lead to the high risks since such financial institutions need to extend loans to customers with low profitability due to low competitiveness. However, in the literature, the existences of both directions of causality are supported by evidence (Berger & DeYong, 1998), suggesting that the facilitation of either of reduction of NPLs or management efficiency/technology adoption sequentially alleviate another one. Thus, our results confirm some linkage between TFP changes and NPLs, and it might imply that facilitating the reduction of NPLs in the banking sector possibly has positive feedback on the promotion of higher TFP changes through active adoption of advanced technology and improvement in technical efficiency.
15 As illustrated in Section 2, MPI can be decomposed into efficiency changes and changes in technology. However, the investigation in changes in bank technology is beyond the scope of our study.
42
We found the strong significant association of diversification ratio in both technical efficiency and TFP changes. Since the economies of scope is supposedly reflected in the shape of frontier, the positive effect of diversification in bank activities on technical efficiency and TFP changes might reflect that the modernized financial institutions are likely to have better management system and the benefit exceeds the complexity of diversified activities of financial business. Although it is still unclear how diversification leads to higher efficiency on the lending and borrowing sides, our finding implies that diversification potentially has a great benefit for the Cambodian economy by intermediating more efficiently and adopting advanced financial technology as the Cambodian banking sector apparently needs more financial deepening.
5. Conclusions
In this study, we investigated the determinants of the technical efficiency and TFP changes of financial institutions in Cambodia using annual data in the period 2006–13. To the best of our knowledge this is the first attempt to conduct a regression analysis regarding the determinants of efficiency and TFP changes in Cambodian financial institutions. Banking reform is currently underway in Cambodia, and the facts we found in this study can potentially prove useful to policy makers.
The results of this chapter reveal that (1) the efficiency of large financial institutions is higher and more stable than that of small ones, and larger financial institutions have experienced higher growth in financial technology; (2) financial institutions with foreign capital comprising more than half of total capital are significantly inferior to local financial institutions with respect to technical efficiency, while there is no difference in TFP growth between foreign-owned and local institutions; (3) financial institutions with a lower solvency risk make more profit in the long term, while those with a higher solvency risk attempt to expand their loan portfolios to make short-term profits; and (4) the more diversified financial institutions are, the more efficient they are, and financial institutions with higher diversification are likely to make progress in financial technology.
However, there are some limitations in this study which will need to be addressed in future studies. Firstly, the estimations include data of foreign-owned institutions that have no specialty in terms of technical ability or experience. In other words, financial institutions whose parent firms do not engage in the banking business are mixed in with financial institutions whose parent firms are engaged in banking services and have a banking specialty, which potentially affected the estimation results. We need to divide the ownership structure in more detail in order to advance the analysis of the relationship between ownership structure and the management of financial institutions.
Secondly, our study still fails to capture the other possible factors of bank efficiency and productivity. For example, there has been a long line of previous studies which suggest the linkage between
43
the bank managerial efficiency and competition, although the direction of the effects of competition on efficiency is still unclear. 16
Thirdly, Cambodia is one of the most dollarized economies in the world. Such a complicated environment affects financial business and possibly influences technical efficiency of financial institutions. In fact, in a dollarized economy, foreign financial institutions do not need to collect local currency deposits, and financial institutions generally face the risk of a currency mismatch. It is important to address this point in future studies.
Reference
Ariss, R. T. 2010. On the implications of market power in banking: Evidence from developing countries. Journal of Banking & Finance 34 (4):765–75.
Baele, L., O. De Jonghe, and R. V. Vennet. 2007. Does the stock market value bank diversification? Journal of Banking & Finance 31 (7):1999–2023.
Banker, R. D., H. Chang, and S.-Y. Lee. 2010. Differential impact of Korean banking system reforms on bank productivity. Journal of Banking & Finance 34 (7):1450–60.
Banker, R. D, A. Charnes, and W. Cooper. 1994. Some models for estimating technical and scale efficiencies in data envelopment analysis. Management Science 30:1078–92.
Barry, T. A., L. Lepetit, A. Tarazi, and S. J. Dacanay III. 2010. Ownership structure and bank efficiency in six Asian Countries. Philippine Management Review (Special Issue) 18:19–35.
Berger, A. N., G. R. Clarke, R. Cull, L. Klapper, and G. F. Udell. 2005. Corporate governance and bank performance: A joint analysis of the static, selection, and dynamic effects of domestic, foreign, and state ownership. Journal of Banking & Finance, 29 (8–9): 2179–221.
Berger, A. N., and R. DeYoung. 1997. Problem loans and cost efficiency in commercial banks. Journal of Banking & Finance 21 (6):849–70.
Bonin, J. P., I. Hasan, and P. Wachtel. 2005. Bank performance, efficiency and ownership in transition countries. Journal of Banking & Finance 29 (1):31–53.
Boyd, J. H., and G. De Nicoló. 2005. The theory of bank risk taking and competition revisited. The Journal of Finance 60 (3):1329–43.
16 In a body of the literature, the competition-Inefficiency hypothesis have long been argued (Schaeck & Čihák, 2008). The hypothesis suggests that the negative relationship between efficiency and competition, since the competition could lead to risk-taking behaviors of banks and increase a risk of insolvency. In the meantime, there has been the competition-efficiency hypothesis, which suggests the positive relationship, since competition makes it harder for inefficient banks to survive in the market.
44
Brissimis, S. N., M. D. Delis, and N. I. Papanikolaou. 2008. Exploring the nexus between banking sector reform and performance: Evidence from newly acceded EU countries. Journal of Banking & Finance 32 (12):2674–83.
Canhoto, A., and J. Dermine. 2003. A note on banking efficiency in Portugal, new vs. old banks. Journal of Banking and Finance 27:2087–98.
Casu, B., and P. Molyneux. 2003. A comparative study of efficiency in European banking. Applied Economics 35 (17):1865–76.
Chortareas, G. E., C. Girardone, and A. Ventouri. 2013. Financial freedom and bank efficiency: Evidence from the European union. Journal of Banking & Finance 37 (4):1223–31.
Claessens, S., and L. Laeven. 2004. What drives bank competition? Some international evidence. Journal of Money, Credit and Banking 36:563–83.
Debreu, G. 1951. The coefficient of resource utilization. Econometrica 19 (3):273–92.
Delis, M. D., P. Molyneux, and F. Pasiouras. 2011. Regulations and productivity growth in banking: Evidence from transition economies. Journal of Money, Credit, and Banking 43 (4):735–64.
Delis, M. D., and N. I. Papanikolaou. 2009. Determinants of bank efficiency: Evidence from a semi-parametric methodology. Managerial Finance 35 (3):260–75.
DeYoung, R. (1998). Management quality and X-inefficiency in national banks. Journal of Financial Services Research, 13(1), 5-22.
Drake, L., M. J. Hall, and R. Simper. 2006. The impact of macroeconomic and regulatory factors on bank efficiency: A non- parametric analysis of Hong Kong’s banking system. Journal of Banking & Finance 30 (5):1443–66.
Efron, B., and R. J. Tibshirani. 1993. An introduction to the bootstrap. London: Chapman & Hall.
Färe, R., S. Grosskopf, and C. A. K. Lovell. 1985. The measurement of efficiency of production. Boston, MA: Kluwer. Färe, R., S. Grosskopf, and C. A. K. Lovell. 1994. Production Frontiers. Cambridge, UK: Cambridge University Press.
Farrell, M. J. 1957. The measurement of productive efficiency. Journal of the Royal Statistical Society. Series A (General) 120 (3):253–81.
Grigorian, D. A., and V. Manole. 2002. Determinants of commercial bank performance in transition: An application of data envelopment analysis. IMF Working Paper, WP/02/146, International Monetary Fund, Washington, DC.
Havrylchyk, O. 2006. Efficiency of the Polish banking industry: Foreign versus domestic banks. Journal of Banking & Finance, 30 (7):1975–96.
Hou, X., K. Chang, Q. Wang, and C. Li. 2013. State ownership, foreign minority shareholders, and the efficiency of Chinese commercial banks. Emerging Markets Finance and Trade 49 (s2):70–90.
International Monetary Fund. 2011. Cambodia: Staff report for the 2010 article IV consultation. IMF Country Report 45 (11).
45
Jaffry, S., Y. Ghulam, S. Pascoe, and J. Cox. 2007. Regulatory changes and productivity of the banking sector in the Indian sub-continent. Journal of Asian Economics 18 (3):415–38.
Koetter, M., & Porath, D. (2007). Efficient, profitable and safe banking: an oxymoron? Evidence from a panel VAR approach. Deutsche Bundesbank Discussion Paper Series 2: Banking and Financial Studies No 02/2007.
Koopmans, T. 1951. Activity analysis of production and allocation. New York: John Wiley & Sons.
Lee, T.-H., and S.-H. Chih. 2013. Does financial regulation enhance or impede the efficiency of China’s listed commercial banks? A dynamic perspective. Emerging Markets Finance and Trade 49 (s4):132–49.
Lovell, C. A. K. 1993. Production frontiers and productive efficiency, in The measurement of productive efficiency, H. O. Fried,
C. A. K. Lovell, and S. S. Schmidt (Eds.), New York: Oxford University Press, 3–67.
Lovell, C. A. K. 2003. The decomposition of Malmquist productivity indexes. Journal of Productivity Analysis 20:437–58. National Bank of Cambodia. 2006–2011. Annual supervision report. Phnon Penh, Cambodia: Author.
Okuda, H., C. Poleng, and D. Aiba. 2014. Technical efficiency and productivity change of major Cambodian financial institutions: During the 2006-2011 period. International Journal of Business and Information 9 (3):335–60.
Özkan-Günay, E. N., Z. N. Günay, and G. Günay. 2013. The impact of regulatory policies on risk taking and scale efficiency of commercial banks in an Emerging Banking Sector. Emerging Markets Finance and Trade 49 (s5):80–98.
Simar, L., and P. W. Wilson. 2007. Estimation and inference in two-stage, semi-parametric models of production processes. Journal of Econometrics 136 (1):31–64.
Sufian, F. 2009. Determinants of bank efficiency during unstable macroeconomic environment: Empirical evidence from Malaysia. Research in International Business and Finance 23 (1):54–77.
Sufian, F. 2011. Banks total factor productivity change in a developing economy: Does ownership and origins matter? Journal of Asian Economics 22 (1):84–98.
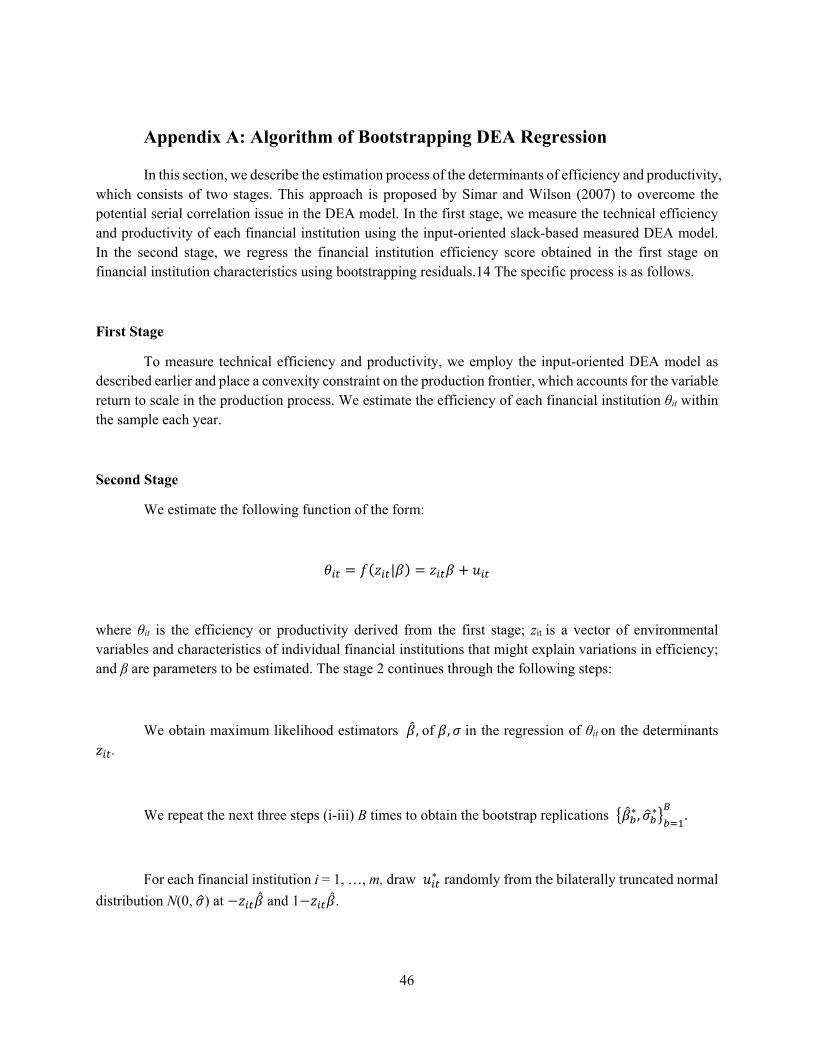
46
Appendix A: Algorithm of Bootstrapping DEA Regression
In this section, we describe the estimation process of the determinants of efficiency and productivity, which consists of two stages. This approach is proposed by Simar and Wilson (2007) to overcome the potential serial correlation issue in the DEA model. In the first stage, we measure the technical efficiency and productivity of each financial institution using the input-oriented slack-based measured DEA model. In the second stage, we regress the financial institution efficiency score obtained in the first stage on financial institution characteristics using bootstrapping residuals.14 The specific process is as follows.
First Stage
To measure technical efficiency and productivity, we employ the input-oriented DEA model as described earlier and place a convexity constraint on the production frontier, which accounts for the variable return to scale in the production process. We estimate the efficiency of each financial institution θit within the sample each year.
Second Stage
We estimate the following function of the form:
|
where θit is the efficiency or productivity derived from the first stage; zit is a vector of environmental variables and characteristics of individual financial institutions that might explain variations in efficiency; and β are parameters to be estimated. The stage 2 continues through the following steps:
We obtain maximum likelihood estimators ,of , in the regression of θit on the determinants .
We repeat the next three steps (i-iii) B times to obtain the bootstrap replications ∗, ∗ .
For each financial institution i = 1, …, m, draw ∗ randomly from the bilaterally truncated normal
distribution N(0, ) at and 1 .

47
Again, for each financial institution i = 1, …, m, compute ∗ as ∗ ∗ .
Use maximum likelihood method to regress ∗ on using the selection model described above
to obtain bootstrap replications ∗, ∗ .
Using bootstrap replications ∗, ∗ obtained above, construct the estimated confidence
interval of each estimate. We find the value of ∗, ∗ as Pr ∗ ∗ ∗ 1 π . This
approximation improves to ∗ ∗ ∗ =1 π as B becomes large and leads to the
confidence intervals of jth coefficient ∗, ∗ . In this study, we set B=2000.
This estimation strategy enables us to estimate the determinants of a financial institution’s efficiency in a robust manner. Simar & Wilson (2007) place an emphasis on the data generation process of the DEA model and suggest that specification truncated distribution model fit in the data generation process. Since the efficiency score estimated from the DEA model always takes between 0 and 1, the censored regression model might be invalid.
However, regarding the productivity change (TFP change) estimated Malmquist index, it is not necessary to choose the truncated model as the score does not come from the interval from 0 to 1, and it can take any value. Thus, we use the OLS model with bootstrapping in the second stage when we regress TFP changes.

48
Appendix B: List of banks used in this study Name of Bank Specilization Ownership
1 Acleda Bank Plc. Commercial banks Local
2 Advanced Bank of Asia Ltd. Commercial banks Local
3 ANZ Royal Bank (Cambodia) Ltd. Commercial banks Foreign owned
4 Cambodia Asia Bank Ltd. Commercial banks Foreign owned
5 Cambodia Mekong Bank Public Ltd. Commercial banks Local
6 Cambodian Commercial Bank Ltd. Commercial banks Foreign owned
7 Cambodian Public Bank Commercial banks Foreign owned
8 Canadia Bank Plc. Commercial banks Local
9 Foreign Trade Bank of Cambodia Commercial banks Local
10 Singapore Banking Corporation Commercial banks Foreign owned
11 Union Commercial Bank Plc. Commercial banks Foreign owned
12 Vattanac Bank Ltd. Commercial banks Local
13 Anco Specialized Bank Specialized banks Local
14 First Investment Specialized Bank Specialized banks Local
15 Specialized Bank Peng Heng S.M.E. Ltd. Specialized banks Local
16 Rural Development Bank Specialized banks Local
17 AMRET Microfinace institution Foreign owned
18 Angkor Mikroheranhvatho (Kampuchea) Microfinace institution Foreign owned
19Cambodian Business Intergrated in Rural Development
Microfinace institution Local
20 KREDIT Microfinace institution Foreign owned
21 Hatthakaksekar Microfinace institution Local
22 Intean Poalroath Rongroeung Microfinace institution Local
23 MAXIMA Mikroheranhvatho Microfinace institution Local
24 PRASAC Microfinace institution Local
25 SEILANITHIH Microfinace institution Local
26 Thaneakea Phum (Cambodia) Microfinace institution Foreign owned
27 Vision Fund Cambodia Microfinace institution Foreign owned
49
Chapter 3: Depositors’ Behaviors under the Political Turbulence During Nation-Wide Deposit Withdrawals After the National Election in Cambodia1
1. Introduction The banking sector plays a vital role in fund mobilization, particularly in developing countries
where other formal financial markets, such as stock and debt markets, are generally either immature or absent. However, compared to developed countries, banking sectors in emerging and developing countries are fragile to external shocks, and have often experienced large deposit withdrawals during periods of economic or political turbulence (Schumacher, 2000; Martinez-Peria and Schmukler, 2001; Khwaja and Mian, 2008; Iyer and Puri, 2012). A number of previous studies have documented evidence that crises in the banking sector incur real costs on the economy (Dell’Ariccia et al., 2008). In particular, negative shocks in bank deposits could hamper growth in the real economy through lending behaviors.2 Therefore, the stability of bank deposits is important for economic growth.
Due to underdeveloped equity market, Cambodia has heavily relied on its banking sector to mobilize domestic and foreign funds to support the growth of economic activities, in addition to foreign direct investment. Although Cambodia’s banking system has been developed in the last 15 years, its banking sector has been exposed to sudden shocks from both domestic and international economies. In addition, domestic political uncertainty has been also a factor which threatens the stability of its banking sector. For instance, the Cambodian financial sector has regularly experienced deposit withdrawals during its national elections. In particular during the national election of 2013, the extent of the withdrawals—10 percent of deposits in the entire banking sector—was significantly larger than it has ever experienced. This was a result of political uncertainty in the period when the opposition party boycotted the national assembly for a year (Human Right Watch, 2015).3 During this period, the Cambodian banking system exhibited its vulnerability as it was exposed to the risk of a banking crisis.
However, to our knowledge, there has been no study to investigate the fragility of Cambodian banking sector.4 From the policy-making perspective, it is important to understand the factors forcing depositors to withdraw money, in order to mitigate the risk of financial crisis. For example, it is important to understand whether deposit withdrawals are a consequence of bad management of the banks, or random
1 This chapter is based on the joint work with Leng Soklong (National Bank of Cambodia), which was presented in the spring convention of Japan Association of Asian Study on June 18, 2016. 2 Khwaja and Mian (2008) find that banks in Pakistan have experienced a drop in deposits reduced bank credit growth in the same time period. 3It is reported that there were some incidents of violence relating to political activities (Human Right Watch, 2015). 4 Several studies have investigated the Cambodian banking sector. For example, Okuda and Aiba (2016) examined the operational efficiency of individual financial institutions. However, they exclusively focus on the efficiency aspects of the operations of financial institutions. No studies have focused on the financial fragility of the Cambodian banking sector.
50
events that occur despite the banks’ good fundamentals. In the former case, depositors provide a mechanism of market discipline with financial institutions and facilitate the resilience in the banking sector. In such a case, the bank run could be considered efficient since a “cleansing effect” would be expected to work.5 However, in the latter case, withdrawals could lead to an inefficient crisis, and the government would be required to intervene in the market to prevent such behaviors. Theoretically, depositors are expected to discipline bank’s managements by withdrawing money from their accounts or demanding higher interest rates on deposits (Allen & Gale 1998; Diamond & Rajan, 2001), and several empirical studies find supporting evidence for this (Schumacher, 2000; Gosh & Das 2003). Although there is evidence that deposit insurance schemes diminish the effects of market discipline (Karas et al., 2013), the Royal Government of Cambodian has not yet introduced these schemes to financial institutions. In addition, Cambodia’s deeply dollarized economy makes it difficult for its central bank to take an active role of the lender of last resort. Accordingly, it is expected that any market discipline by depositors would likely work strictly, since depositors with small balances are not secured as well as depositors with large balances.
Meanwhile, recent empirical studies have found that increases in uncertainty of macroeconomic conditions are likely to trigger random deposit withdrawals (Levy-Yeyati et al., 2010). Such depositor behaviors are caused either by the expectation of destruction of the government’s solvency and capacity to serve as a lender of last resort, or a decrease in the value of assets held by individual banks. The political uncertainty might also make people expect for an incident of future civil conflicts or collapse of current institutions, and those perceptions would lead to the increase in uncertainty of macroeconomic conditions and stability of financial system, and then inefficient bank run might be brought about (coordination failure). There is a study which points out that the ruling party in Cambodia has been spreading the propaganda that if the opposite party win the election, conflicts would occur. (Yamada, 2013) Thus, the expectation of conflicts might likely rise in the period of elections in Cambodia.
Our research questions are as follows: are bank’s fundamentals related to the extent of deposit withdrawals? What other factors affect depositors’ withdrawing behaviors? How do depositors behave in the absence of explicit deposit insurance? In this paper, we take advantage of a unique natural experiment in which we examine data of financial institutions to investigate large deposit withdrawals during the political turbulence. Since no one anticipated that the withdrawals would be so substantial, there should be no biases from reverse causality between the extent of deposit declines and bank characteristics.
To the best of our knowledge, in the literature examining bank runs, our paper is the first attempt to use the deposit amounts of individual financial institutions by regions. Since large deposit withdrawals are typically unexpected and abrupt, capturing the depositors’ behavior through deposit data requires both high frequency in time horizon6 and a large number of cross-sectional observations of the data, which is often unavailable. Furthermore, there could exist heterogeneity in depositors’ behaviors across regions. Estimations from individual bank data could be subject to biases from unobserved factors, such as the location of branch networks. The data from an individual bank’s balance sheets or regional deposit amounts is typically only available on an annual basis. Previous studies, therefore, have been limited to use annual individual bank deposit data, or even if more detailed data is available, such as deposit account data, they have collected data from a single bank (Iyer & Puri, 2013). Meanwhile, our data allows us to investigate
5 A cleansing effect refers to the removal of bad banks during a bank run, while good banks remain in the market (Degryse et al. 2009). 6 For example, the data is usually needed to be on a monthly or quarterly basis.

51
financial institutions that are engaged in all microfinance business and taking deposits from the public, and to examine the relationship between bank strategies and depositors’ withdrawing behavior at the region-level. Since our data includes microfinance institutions, it covers rural areas and enable us to investigate the depositor’s behaviors comprehensively.
Our main findings are as follows: First, we found that depositors with smaller deposits are less likely to run during the crisis period even in the absence of explicit deposit insurance, while depositors with larger deposits are more likely to run. Second, the better bank fundamentals do not necessarily lead to the less extent of deposit withdrawals. Third, regional factors also affect the deposit withdrawals. Especially, we found that population density preventively affects the extent of deposit withdrawals. Furthermore, the regional election results were significantly associated with the extent of deposit withdrawals.
Our findings do not support the hypothesis of efficient bank run in the case of large deposit withdrawals in Cambodia, but support that the large deposit withdrawals were rather random possibly due to the increase in the risk of future conflict or any damage on the economic conditions. In addition, we show that the “too-big-to-fail” perception did not work in this period, while prior researches find this behavioral bias works in other countries (Oliveira et al., 2015). Furthermore, our study reveals that an increase in political instability could make depositors more likely to withdraw their money from the banking system. Our study provides unique evidence in the literature of bank run, and we believe that those are helpful both for understanding financial fragility and also for making policy decisions.
The rest of our paper is organized as follows: In section 2, we describe the institutional background and the large-scale deposit withdrawals that occurred in 2013. In section 3, we develop the analytical framework to capture depositors’ behaviors during the event of large deposit withdrawals. Section 4 describes our data. Section 5 provides our empirical strategy, and section 6 shows and discusses the results. Lastly, section 7 concludes.
2. Institutional background and event description 2.1 The Cambodian financial sector in 2013
Cambodia’s banking system consists of commercial banks, specialized banks, microfinance institutions (MFIs, hence force) and micro credit operators (known as NGOs), while the regulatory and supervisory authority of the system is under the responsibility of the National Bank of Cambodia (NBC), the central bank. At the end of 2013, there were 35 commercial banks, 8 specialized banks, 36 MFIs7 (NBC, 2014), and 60 credit operators or thereabouts.8 Each type of institution operates under different regulations, requirements, and restrictions. Banking operations include 1) credit operations for valuable consideration, including leasing, guarantees, and commitment under signature; 2) the collection of non-earmarked deposits from the public; and 3) the provision and processing of means of payment for customers in national currency or foreign exchange (Article 2, LBFI, 1999). By law, commercial banks are allowed to engage in all three banking operations, while specialized banks can provide only one of the mentioned functions, which could include lending to businesses or offering a means of payment and foreign exchange for businesses. There is only one state-owned bank, which is categorized as a specialized bank, and the rest of the financial
7 As of the end of 2013 MFIs consist of 7 which take deposits and 29 which do not. 8 Also see Chapter 1, for the detail of the Cambodian banking system.

52
institutions are all private. MFIs have been classified into two categories: those that are not allowed to collect deposits and those that are, namely Microfinance Deposit-Taking institutions (MDIs). MDIs are more like commercial banks—performing all the three banking operations, yet dealing with small transactions—though regulations and reserve and capital requirements on them are looser than those on commercial banks.
In Cambodia, commercial banks can also engage in microfinance business. Financial institutions engaging in microfinance business have a nation-wide branch network in both rural and urban areas, while commercial banks which do not involve in microfinance business generally concentrate on urban areas. For example, Acleda bank, which is the largest commercial bank and is engaged in microfinance business, has branches in all provinces, while Canadia bank, which is the second largest commercial bank, has about a half of all its branches in the capital city of Phonm Penh and the rest of its branches in other urban areas.
Even though the main targets of MFIs are the poor, and small- and medium-sized enterprises, the influence of MFIs on the Cambodian economy should not be overlooked. The total assets of all microfinance institutions amounted to $1.566 billion in 2013, which is approximately 10 percent of the total assets of all commercial banks. Furthermore, the size of asset of the largest MFI was ranked 9th and the second largest MFI at 15th among all financial institutions in 2013.9 Recently, deposits have become one of the main sources of funds: as of the end of 2013, around 40 percent of their total liabilities are customer deposits and savings, while in 2009 these funds accounted for only 3 percent of liabilities. Thus, the amount of deposits held by MFIs is significant, and there is an apparent trend toward the financially self-sufficiency and sustainability of MFIs. It is reported that more than 1.5 million customers put their savings in MFIs as of 2015, up from around 0.3 million in 2011.
2.2 Large deposit withdrawals after the 2013 national election Cambodia adopted a free market economy and had its first National Election in 1993. Since then,
it has seen a lot of political and economic reforms. Foreign investment flowed into this small nation; trade with the rest of the world accelerated while the development of the banking sector began to quickly pick up. People started to use banking services such as loans, transfers, and payments and so forth. Particularly, the public’s confidence has increased, which is reflected via the gradual increase of deposits in the banking system. It should be noted that Cambodia had experienced the Genocide Regime from 1975 to 1979, under which money and the financial system were completely abolished. While Cambodia’s citizens have put a lot of faith in the banking system over the last two decades, it seems that their confidence lessened during the national elections, but bounce back after the elections ended. So far, Cambodia has held 5 national elections which were in 1993, 1998, 2003, 2008 and 2013. During each one, deposits in the banking system had regularly declined. For instance, according to data obtained from the NBC, in 2008, around $250 million of deposits was withdrawn during the national election, while in 2013 this figure was even notably larger.
The national election of 2013 resulted in the triumph of Cambodia People Party (CPP), which has been the ruling party since 1993. However, the number of votes obtained by Cambodia National Rescue Party (CNRP) was very close to that of CPP. As a result, CPP obtained a total of 3,235,969 votes (48.83%
9 We calculated those figures from the data obtained from NBC (2014a).
53
of total votes), and CNRP obtained 2,946,176 votes (44.46%).10 Regarding the number of seats, out of a total of 123 seats, CPP obtained 68 seats and CNRP obtained 55 seats. After the election, the opposite party boycotted the National Assembly for a year to refuse to accept the result. The political turbulence started to be widespread over the country. The government imposed bans even on peaceful protests, including strikes by trade unions campaigning for increased wages. In some cases, protesters were engaged in attacks in response to security force repression. (Human Right Watch, 2015)
The political instability also triggered the deposit withdrawals in the banking sector. More than $600 million in deposits were withdrawn as deposits dropped from $6.75 billion to $6.13 billion between the end of June and September 2013. Panel A of Figure 1 shows this decline. While the aggregated deposit amount has constantly grown until 2013Q2, we can see huge decline in aggregated deposit amount in 2013Q3. Since Cambodia is one of the most dollarized economies, and 90 percent of deposits and loans were in foreign currency, the decline was found in the amounts of foreign currency deposits. The amount of deposit withdrawal over the period of the third quarter of 2013 accounted for 10 percent of all deposits in the entire Cambodian banking sector, although deposit growth recovered to the previous rate by October 2013 (IMF, 2014). Furthermore, in this period, the deposit withdrawals might not be anticipated to become an exceptionally large scale. As shown in Panel B in Figure 1, excess reserves in the banking sector were stable at 20 percent before July, while they declined drastically to 10 percent in July. This suggests that most banks did not prepare for this event in advance by withdrawing excess reserves and holding cash in their own banks for deposit withdrawals.
This event highlighted the fragile confidence in the banking sector. During this time, banks suffered from low liquidity availability, although no bank failed because of this liquidity shock. In fact, Acleda bank, which is the largest commercial bank in Cambodia, stated that it increased lending rates to maintain its profit in the face of liquidity shock, leading to a decline of $2.8 million in its consumer lending in the third quarter of 2013 (Carteret, 2013a). This decline accounted for 0.1 percent of the total outstanding loans, but given the previous exponential growth rate of loans, this decline could have seriously influenced the real sector at that time.
The large deposit withdrawal during that time was not specific to banking sector, as MFIs also experienced declines in their deposit amounts. It was reported that the amount of deposits in MFIs’ accounts dropped from $378 million in June 2013 to $365 million the following quarter (Kimsay, 2014). In particular, deposits of the largest MFI, Prasac, dropped by 40 percent.
10 Also see The Committee of Free and Fair Election in Cambodia (2013), for the detail of the national election 2013.
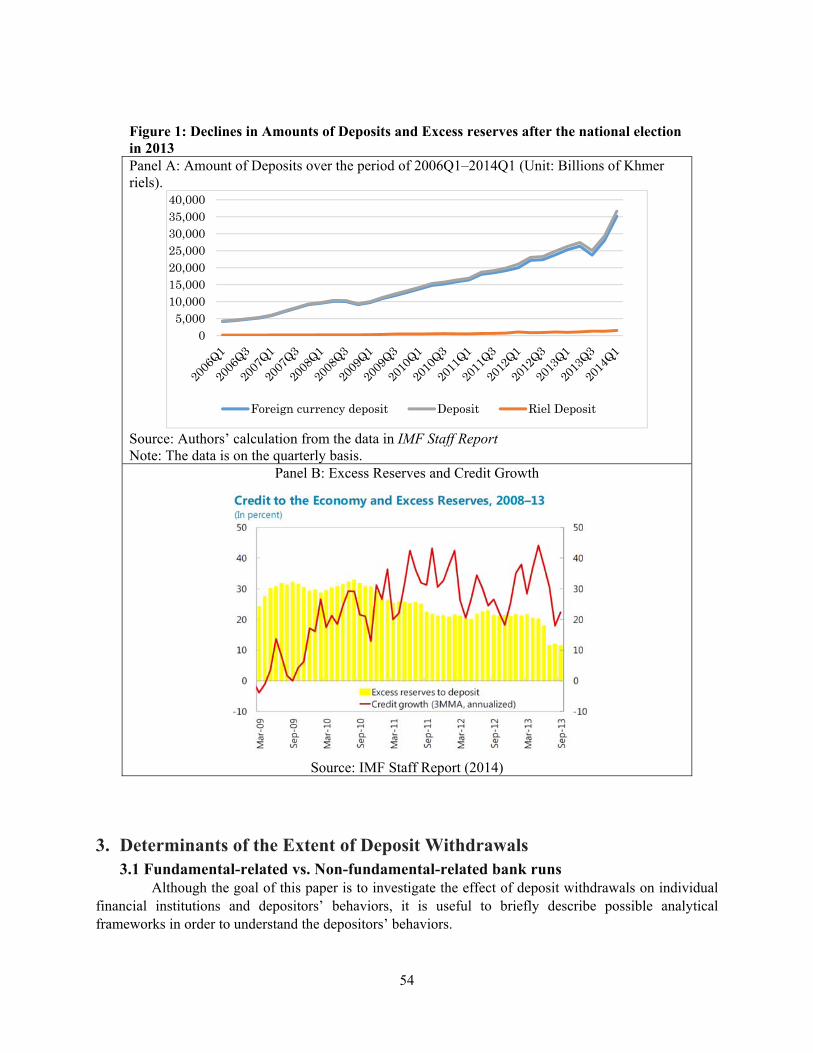
54
Figure 1: Declines in Amounts of Deposits and Excess reserves after the national election in 2013 Panel A: Amount of Deposits over the period of 2006Q1–2014Q1 (Unit: Billions of Khmer riels).
Source: Authors’ calculation from the data in IMF Staff Report Note: The data is on the quarterly basis.
Panel B: Excess Reserves and Credit Growth
Source: IMF Staff Report (2014)
3. Determinants of the Extent of Deposit Withdrawals 3.1 Fundamental-related vs. Non-fundamental-related bank runs
Although the goal of this paper is to investigate the effect of deposit withdrawals on individual financial institutions and depositors’ behaviors, it is useful to briefly describe possible analytical frameworks in order to understand the depositors’ behaviors.
05,000
10,00015,00020,00025,00030,00035,00040,000
Foreign currency deposit Deposit Riel Deposit

55
Historically, the banking sector was vulnerable to unanticipated deposit withdrawals. There is substantial literature exploring why such fragile institutions exist and whether or not a bank run is efficient, of which Diamond and Dybvig (1983) is the seminal paper. As documented by Diamond and Dybvig (1983), bank deposits can serve as state-contingent security to increase social welfare in exchange for the risk of a self-fulfilling run. Allen and Gale (1998) further developed Diamond and Dybvig’s model to show that a bank run is caused by deterioration in bank fundamentals, such as a liquidity shortage or low capital, rather than by random deposit withdrawals that are unrelated to macroeconomic conditions or bank fundamentals.
A number of empirical studies find evidence that depositors are likely to run from distressed banks during a bank run (Schmukler, 2000; Martinez Peria & Schmukler ,2001; Ghosh & Das, 2003; Brown et al., 2013).11 The Royal Government of Cambodian has yet to introduce deposit insurance schemes to banks, and its highly dollarized economy makes it difficult for its central bank to take an active role as the lender of last resort. Thus, in the situation of Cambodia, depositors with small balances are not secured as well as those with large balances, and depositors incur the entire risk for the loss of deposits. It is expected that the market discipline by depositors is likely to work severely in Cambodia.
Meanwhile, there is another point of view of bank run. Levy-Yeyati et al. (2010) found that a deterioration in macroeconomic conditions could trigger deposit withdrawals regardless of whether a bank’s condition is good or bad. During a period of political turbulence, people are likely to expect future incidences of civil conflict and destruction of personal and social capital, as civil conflict after following an election is common in developing countries (Dupas & Robinson, 2012). It is possible that such a risk of deterioration in macroeconomic conditions could lead to deposit withdrawals even in banks with sufficient liquidity and good management. In this case, the bank’s fundamentals are not related to the extent of large deposit withdrawals.
It is difficult to predict whether the deposit withdrawals are caused by depositors who are aware of the deterioration of a bank’s fundamentals, or by depositors’ self-fulfilling behaviors. In order to determine this, we carefully assess the large deposit withdrawals in response to political uncertainty in Cambodia.
3.2 Perception of too-big-to-fail There is another strand of literature explaining depositors’ behaviors during the crisis period. In
general, large financial institutions may experience fewer deposit withdrawals, since people expect governments to inject capital into big banks due to the potentially major impact of bank failures on the economy. Oliveira et al. (2015) examine large deposit withdrawals in the Brazilian banking system caused by the international downturn of 2008, and have found supporting evidence that a bank run can be explained by the perception of a too-big-to-fail policy rather than by bank fundamentals. Beck et al. (2006) also found similar results from the cross-country study on incidences of financial crisis. The authors found that financial crises are less likely to happen in countries whose banking sector is dominated by the biggest four banks. Further, trust in or the popularity of those financial institutions could mitigate depositors’ running
11 Brown et al. (2013) found evidence from a household survey in Switzerland that households were more likely to run from banks with higher credit and liquidity risks than non-distressed banks during the period of global financial crisis from 2008–2009.
56
behaviors. Thus, the size of the bank may mitigate the extent of deposit withdrawals, if the too-big-to-fail also works in the Cambodian financial sector.
3.3 Transaction costs and sizes of deposit balances We conjecture that the size of deposit that each depositor keeps in a bank account could affect the
running behavior even in the absence of an explicit deposit insurance scheme. It is natural that depositors would keep most of their liquid assets in the form of bank deposits as the total amount of their liquid assets increases, since deposits are generally safe assets in terms of both the stability of their value and their protection from robbery. In particular, developing countries lack a developed security market, and depositors are less likely to have any other choice except bank deposits when they prefer to protect large amounts of money rather than keeping it under the mattress.12 Among households that prefer to keep their assets mostly in bank, those with larger deposit amounts should be more likely to withdraw assets when they fear a bank failure. This is because the larger deposits comprise more of the depositor’s liquid assets, and therefore the larger their loss relative to total liquid assets becomes. Thus, the amounts of deposits may increase the probability of running by depositors. On the other hand, transportation costs and some opportunity costs can discourage depositors from withdrawing their deposits.
In the empirical literature on bank runs, Brown et al. (2013) find that switching costs decreased the probability of depositors’ running during a banking crisis.13 If this is the case, in the wake of increasing fears of bank failure those costs relating to the withdrawal of deposits would deter depositors with small amounts from running, although depositors with large amounts of money would still run.
Deposit amount per depositor might be an important factor to drive withdrawing deposits in Cambodia. Since Cambodia lacks of diversified financial products and services, people seem to have limited choices for investments as well as safe places to keep their assets and liquidity. Thus, it is possible that depositors with large amounts of deposits are the ones who keep most of their liquid assets in their bank accounts.
3.4 Regional factors Most of previous studies on the empirical literature of bank run have focused on the relationship
between the extent of deposit withdrawals and depositor’s characteristics (Iyer & Puri, 2012; Brown et al., 2013), or the relationship between the extent of deposit withdrawals and bank’s fundamentals (Schumacher, 2000; Martinez-Peria & Schmukler, 2001; Levy-Yayeti et al., 2010). There is no previous study addressing the questions whether regional factors affect the extent of deposit withdrawals. However, there could be potential regional factors to affect depositor’s behaviors. One of possible factors is the regional economic development. Regional economic developments lead to the better education level and better infrastructure
12 Stix (2013) empirically finds evidence for households’ preference for deposits over cash using survey-based household data in developing countries. The author finds that income levels of the households matter and that households with high income are likely to prefer to have deposits rather than cash as assets. 13 The authors find that households are 16 percentage points more likely to withdraw deposits from a distressed bank than from a non-distressed bank. The propensity to withdraw deposits from a distressed bank is substantially reduced by household-level switching costs. This means that households that rely on a single deposit account, do not live close to a non-distressed bank, or maintain a credit relationship with the distressed bank are significantly less likely to withdraw deposits.
57
of information network. Since most of financial institutions have no explicit problem with their fundamentals before the election, and there was no bank failure in the period of deposit withdrawals, better higher levels in literacy and better information networks may prevent the herding behaviors, leading to the lower extent of deposit withdrawals.14 Thus, the regional development is also expected to affect the depositor’s behaviors through literacy levels or better information network. 15
In addition, the political instability could affect the people’s expectation for future macroeconomic shock or incidents of conflicts. According to Yamada (2013), Cambodia People’s Party has been spreading propaganda that some conflicts would occur if an opposite party wins the election. Then, it is likely that Cambodian people hold an expectation of conflicts during every election period. If the results of election are close between opposite and ruling party, or the opposite party wins in the region, it would be more likely that depositors expect an incident of the protest activities. It would increase risks of conflicts and shocks in macroeconomic condition. Thus, the opposite party’s votes or seats are expected to be associated with the extent of deposit withdrawals in the region.16
Motivated by the recent literature on the stability of banking sectors, we further investigate the relationship between the extent of deposit withdrawals and the structure of markets across regions.17 Demirgüç-Kunt, & Detragiache (2002) empirically find that a banking crisis is less likely to happen in the countries where banking systems are more concentrated even after controlling for regulatory and macroeconomic conditions. However, it is still unclear if the regional market structure within a country exerts any effect, and which effect is observed in within a country.
4. Data Description Our investigation is based on a detailed bank-regional panel dataset. The dataset is mainly
composed of five data sources: (1) data on quarterly amounts of deposits and loans by region is obtained from the website of Cambodian Microfinance Association (CMA henceforth), (2) financial statements of individual financial institutions comes from National Bank of Cambodia (NBC) (2011-2014a), (3) branch location information of financial institutions is obtained from NBC (2014b), (4) regional population data come from the Economic Census conducted in 2010, and (5) the results of the national election in 2013 are
14 Goedde-Menke et al. (2010) empirically studied the relationship between depositor’s financial knowledge and financial crisis, based on the survey data. 15 Or, another possible explanation is that the younger generations who did not experience the conflicts before 1991 were not affected by the propaganda of the ruling party that insists that some conflicts would occur if an opposite party wins the election, as Yamada (2013) mentions. Developed areas are likely to have higher ratios of younger generations, and then their financial systems are not likely to be affected by the election results. 16 The Cambodian banking sector has also experienced the negative growth right after the national election in 2008, although the link between the election and decline in deposits was not clearly mentioned (IMF, 2009). It suggests that there might be the political factors which affect the depositors’ behaviors, 17 Lagoarde-Segot and Leoni (2013) hypothesize that “competition-fragility” predicts that larger banks can develop informational rents with their borrowers and better screen borrowers, which minimizes portfolio risk (Cetorelli & Peretto, 2000). On the other hand, the “competition-stability” hypothesis argues that oligopolistic banks charge higher interest rates, leading to riskier portfolios due to usual moral hazard and adverse selection problems (Boyd & De Nicol, 2005).
58
obtained from The Committee for Free and Fair Elections in Cambodia (2013). CMA publicly opens the information of the amounts of deposits by region, outstanding loans, and the number of customers of individual financial institutions at the district-level. The data, reported on a quarterly basis, includes all the financial institutions engaged in the microfinance business. The financial data of individual financial institutions provides information on income statements and balance sheets of registered financial institutions on an annual basis. NBC (2014b) provides comprehensive data on branch locations of all the financial institutions in Cambodia, covering location information for all branches of registered financial institutions at the commune-level, including the commercial banks, specialized banks, microfinance institutions, and non-governmental organizations. Finally, we obtained the regional population from the Economic Census which provides all individual firms’ information, such as the number of employees in Cambodia. Since there is no other data source which provide the information of district-level population in 2013, we use the number of employees in the district as the estimated number of regional population in 2013.
One shortcoming of our dataset is that our analysis does not include the financial institutions which do not engage in microfinance business since bank-regional data of amounts of deposits and loans are only available for the financial institutions which are engaged in microfinance business. In addition, our analysis only includes the financial institutions which collect deposits. Our dataset includes one financial institution from the banking sector and seven financial institutions from the microfinance sector.18 Thus, our dataset includes information from 194 districts of 8 financial institutions, which amounts to a total of 1552 samples from one cross-section. However, the largest commercial bank in Cambodia is included in our dataset, and in the entire banking system (total of 80 banks), the second largest financial institutions in our dataset is ranked at 6th, and the third one is ranked at 11th, in terms of loan sizes.19 In addition, there are no regulation on the deposits of microfinance institutions. The deposit products those They provide saving accounts and fixed-term deposit accounts as commercial banks do, although the interest rates on deposits are set higher than those of commercial banks. Furthermore, the financial institutions which are engaged in microfinance business have a nation-wide branch network covering rural areas and mobilize funds throughout Cambodia. Therefore, our dataset is informative enough to enable us to comprehensively investigate the difference in the extent of deposit withdrawals among all regions.
To show the extent of deposit withdrawals during the period of political turbulence using our dataset, we show changes in deposit growth before and after the election. Figure 2 shows the growth rates of aggregated deposit amounts from 8 individual financial institutions by regions before and after the national election. This reveals that about a half of the operation areas of financial institutions in our sample experienced a decline in the amount of deposits after the national election. Since almost all the regions experienced increase in the deposit amounts before the election, declines might be in large part due to
18 According to NBC (2014), the Cambodian banking sector can be divided into three sectors. The first is the commercial banking sector, the second is the specialized banking sector, and the third is the microfinance sector. In Cambodia, most microfinance institutions do not take deposits. 19 See Appendix D, for the detail of ranking of loan sizes of Cambodian financial institutions.
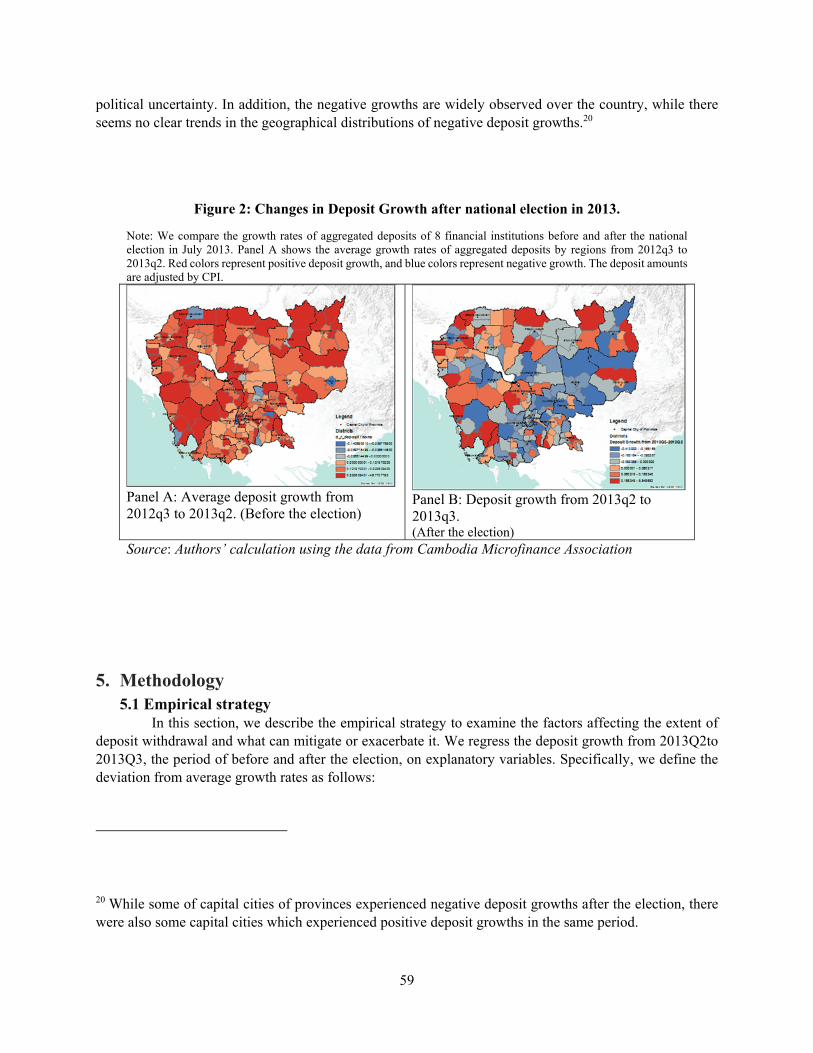
59
political uncertainty. In addition, the negative growths are widely observed over the country, while there seems no clear trends in the geographical distributions of negative deposit growths.20
Figure 2: Changes in Deposit Growth after national election in 2013.
Note: We compare the growth rates of aggregated deposits of 8 financial institutions before and after the national election in July 2013. Panel A shows the average growth rates of aggregated deposits by regions from 2012q3 to 2013q2. Red colors represent positive deposit growth, and blue colors represent negative growth. The deposit amounts are adjusted by CPI.
Panel A: Average deposit growth from 2012q3 to 2013q2. (Before the election)
Panel B: Deposit growth from 2013q2 to 2013q3. (After the election)
Source: Authors’ calculation using the data from Cambodia Microfinance Association
5. Methodology 5.1 Empirical strategy
In this section, we describe the empirical strategy to examine the factors affecting the extent of deposit withdrawal and what can mitigate or exacerbate it. We regress the deposit growth from 2013Q2to 2013Q3, the period of before and after the election, on explanatory variables. Specifically, we define the deviation from average growth rates as follows:
20 While some of capital cities of provinces experienced negative deposit growths after the election, there were also some capital cities which experienced positive deposit growths in the same period.
60
, ,
, , , , ,
(1)
where represents the deposit amounts of bank i in region j in the time t. Before calculating growth rates,
we adjusted inflation rates using the consumer price index. is a vector of variables which represent
regional bank-specific characteristics of bank i in region j at the time before the crisis period. is a vector of variables which represent bank-specific characteristics of bank i in the time before the crisis period. , are the region-specific characteristics of region j. Since our dataset cover the We also estimate the models in which we assign individual dummies to each financial institution i and regional dummies to each region j in order to control for the potential bank-specific and region-specific factors which all financial institutions face in the region.
Presumably, our estimation is less subject to endogeniety problems, compared to former studies. Since the large decline in deposits amounts after the election of 2013 was unexpected and sudden, financial institutions did not prepare for this shock. Therefore, our estimation should be less biased by a reverse causality, which has been potentially a problem in the previous studies which investigate the relationship between deposit growths and bank’s financial conditions. Since deposit growth also affects a bank’s strategy toward asset allocation and interest rates on deposits and loans, simple estimation of determinants of deposit growth could be in general biased. However, our estimation could overcome the biases from reverse causality, and can provide more reliable results.
We employ OLS to estimate the parameters and calculate the standard deviations with a clustering method within districts. Note that some financial institutions did not operate in some regions, and we winsorized the sample at 3 percent of the sample distribution of deposit growth between 2013Q2 and 2013Q3 in order to reduce potential biases from outliers. The final sample is reduced to 857.
5.2 Explanatory variables Here, we describe the variables used in our estimation. In our empirical model, three types of
variables are used: bank-region specific ( ), bank specific ( , and region specific variables ( , ). Bank-region specific variables capture variation both among financial institutions and among regions, which should gauge the differences in the branch-level strategy of each financial institution.21 Bank specific variables capture the variation among regions and among financial institutions, which may affect depositors’ behaviors at the country level. In bank-region specific variables, , we include the deposit amounts per depositor in order to test if deposit amounts per depositor affect the depositor’s behaviors. If the depositor has larger amounts on average in the districts, branches in the districts would experience larger deposit withdrawals. Thus, we expect the coefficient of this variable to be negative.
21 See Appendix B for the detail of definitions of variables used in the estimation. Since the data sources are different from variable to variable, the time when variables are taken varies.

61
To control for the potential bank-region specific effect on the deposit withdrawals, we include the dummy variable which represents the existence of branches of the bank i in region j. There might be regional differences in transaction costs relating to deposit withdrawing. The low quality of infrastructure—including road, public transportation, and networks of ATMs—make it costly for depositors to withdraw their money. Those high switching costs or transportation costs can prevent depositors from running. However, there exists an opposite theoretical prediction on the effect of distance. Theoretically, if the information asymmetry is significant, it is possible that an increase in the physical distance between branches or absence of branch office may augment the extent of information asymmetry between banks and customers. Depositors may fear the financial institutions which are less transparent, which may exacerbate the extent of deposit withdrawals during the period of crisis. We capture the effect of the extent of information asymmetry in order to reduce the bias in the estimation by including the dummy of whether the office is located in the region.
To test whether depositors are likely to run from distressed banks or not, we include the variables which stands for the resilience of financial institutions in bank-specific variables : NPL ratio, Z-score, and liquidity ratio. If uninsured depositors know financial institutions are exposed to a risk of default, they might run or penalize the bank by withdrawing their deposits. Thus, we expect this variable should be correlated to the extent of deposit decline if market discipline works in the crisis period. Furthermore, to investigate the effect of too-big-to-fail perceptions, we include the logarithm of total loans and the logarithm of total assets and loans of financial institutions.
In region-specific variables, , we include the population density in the explanatory variables in order to capture the difference in the extent of deposit withdrawals between economically developed areas and less developed areas. Furthermore, we include the number of branches of all existing financial institutions including commercial banks, specialized banks, microfinance institutions, and NGOs in order to capture the difference in structures of financial markets.
Finally, to assess whether election results in the regions affect the depositor’s behaviors, we employ the variables which represent how the opposite party (CNRP) obtained the votes against the ruling party (CPP). We collected the data from The Committee for Free and Fair Elections in Cambodia (CFFEC) (2013). Since CFFEC reported the results of the national election in 2013 by provinces, we can only create variables about election results at province-level. We use four indicators: (1) the ratio of CNRP's votes to total votes, (2) the ratio of CNRP's votes to CPP's votes, (3) the ratio of the number of CNRP's seats to total number of seats, and (4) the ratio of the number of CNRP's seats to the number of CPP's seats. If the variables are large, it is assumed that the political instability is higher in the region. We expect that, under the unstable political situation, people are likely to expect the incidents of conflict, leading to the deposit withdrawals.
6. Results In Table 1, we present the estimation results of different specifications in columns 1–6. In column
1, we estimated a benchmark model including both of the regional dummies and individual bank dummies, which should be the most robust among the models we estimated. In columns 2–6, in order to examine the effect of financial conditions and the size of individual financial institutions, we exclude the individual bank dummies, and included bank-specific variables which represent the financial conditions and asset
62
sizes of each financial institution. In column 7, we excluded the regional dummies, and included the region-specific variables to test possible hypotheses relating to regional characteristics22.
First of all, we do not find evidence that bank with worse fundamentals experience the more severe extent of deposit withdrawals (in column 2-4). More surprisingly, we find a negative effect of bank’s fundamentals (the coefficient of Z-socre in columns 4), which contradicts our hypotheses. This suggests that depositors withdraw their deposits from the banks with better fundamentals during this time period. We do not find evidence of depositors’ behaviors providing market discipline in this event. However, this finding is consistent with the results of Levy-Yeyati et al. (2010), who empirically find that an increase in the risk of deterioration in macroeconomic conditions weakens the relationship between deposit withdrawals and bank’s fundamentals. Given that the large deposit withdrawals in Cambodia were caused by an increase in political uncertainty, there was possibly no deteriorations in banks’ fundamentals prior to the crisis period. Accordingly, our results might support the hypothesis that an increase in risks and deterioration in macroeconomic conditions triggers random deposit withdrawals. In this case, political uncertainty might increase the risks of deterioration in macroeconomic conditions, since people were more likely to expect the incidents of conflicts in the future. This finding might have important policy implications that depositor’s reaction to political turbulence could be the risk of inefficient bank panic.23
Regarding the perception of too-big-to-fail, we do not find evidence supporting the idea that bigger financial institutions were more stable during the period of large deposit withdrawals. Again, the signs of coefficients of bank sizes are negatively estimated, and the results are opposite from our predictions (columns 5–6). The results may suggest that large financial institutions are likely to be exposed to risks of deposit withdrawals in the case of political uncertainty.
Another goal of this paper is to examine the relationship between the extent of deposit withdrawals and deposit amounts per depositor. We find that the coefficients of the amounts of deposits per depositor are significantly negative in all specifications. This suggests that if the deposit amounts of each depositor are small on average in the districts, the bank branches in those districts are likely to experience a greater decline in their deposit growth in the period of crisis. These results are consistent to previous studies, such as Iyer and Puri (2012), and Brown et al. (2013), which found that depositors with larger balances are likely to run during bank panic in countries even with explicit deposit insurance. Given the absence of explicit deposit insurance in Cambodia, this finding might be counterintuitive. However, it can be explained by fears of the loss of deposits relative to depositor’s total liquid assets or costs relating to withdrawing deposits. This finding suggests that it is better for Cambodian financial institutions to expand their customer bases and diversify their deposit portfolio. In particular, our results revealed that depositors with smaller balances are less likely to withdraw money. Thus, the expansion of deposits to less developed areas might foster financial stability in the Cambodian banking sector.24 Furthermore, our empirical results might have
22 For the descriptive statistics and correlation of variables used in the estimation, see Appendix C and D. 23 Otherwise, our results might reflect that Cambodia’s banks had sufficient liquidity to absorb the sudden shift of deposit demand. Since Cambodia is a dollarized economy, the central bank’s inability to serve as the lender of last resort encourages banks to keep large liquidity, as was true of the Tequila shock in Argentina (Schmukler 2000). 24 However, it cannot be ruled out that there still remains a possibility of endogeneity issues in our estimation because of difficulty to address the omitted biases. For example, depositors with large amounts could be wealthy and well-educated people. Therefore, if depositors’ running behaviors could be related to depositors’ financial literacy (Goedde-Menke et al., 2014), there might be the omitted variable biases. However, it is difficult to pursue further clear identification of the effects, and it is a bit out of the scope of our paper. Even if the causal linkage is still not completely clear, the significant correlation between deposit amount per capita and

63
important implications for the implementation of a deposit insurance scheme in emerging economies. The results imply that the low insurance limit may be ineffective, since the depositors with lower balances are unlikely to withdraw money even in the absence of deposit insurance. Therefore, the implementation of deposit insurance could only lead to banks’ moral hazard issues, instead of stabilizing the financial sector.
We find that the extent of deposit withdrawals was related to regional factors (column 7). Regarding the region-specific variables, we find that regions with high population density experienced deposit withdrawals to a lesser extent. Presumably, population density may represent regional economic development. Thus, the result seems to suggest that economic developments may enhance the financial stability, possibly through higher literacy levels of people in the region. However, we need to be aware of the fact that deposit amount per depositor induces deposit withdrawals. Given that the economic development may increase deposit amounts through an income effect, it is difficult to say that the entire effect of economic development is positive, even if the direct effect of economic development is positive.25 In the meantime, we do not find that the density of financial institution has any significant effect on the extent of deposit withdrawals.
Finally, in order to answer the question whether regional political uncertainty affects the depositor’s behaviors after the national election, we estimated the effect of election results on the extent of deposit withdrawals. Table 3 shows the results of our estimations. Here, we used four indicators which represents how the opposite party gained the votes/seats against the ruling party. We controlled for bank-specific factors by including dummies for financial institutions. Aside from indicators for political disorders, we confirm the similar results in other bank-region specific and region specific variables. In addition, all of the indicators of political instability are significantly and negatively associated with the deposit growth after the election, suggesting that if the political instability increases, the depositors are likely to withdraw their deposits. These findings also suggest that the regional factor is important to determine the extent of deposit withdrawals. Furthermore, these findings support the view of Levy-Yetagi et al. (2010), since the extent of deposit withdrawals are associated with the macro-level variables in the region. In particular when the uncertainty in macroeconomic increases due to the political instability, the extent of deposit withdrawals becomes worse in the region. Eventually, it could lead to the larger extent of deposit withdrawals.
the extent of deposit withdrawals does not come from the reverse causality. 25 The correlation between deposit amount per depositor and population density was not low (0.39). See in Appendix C.
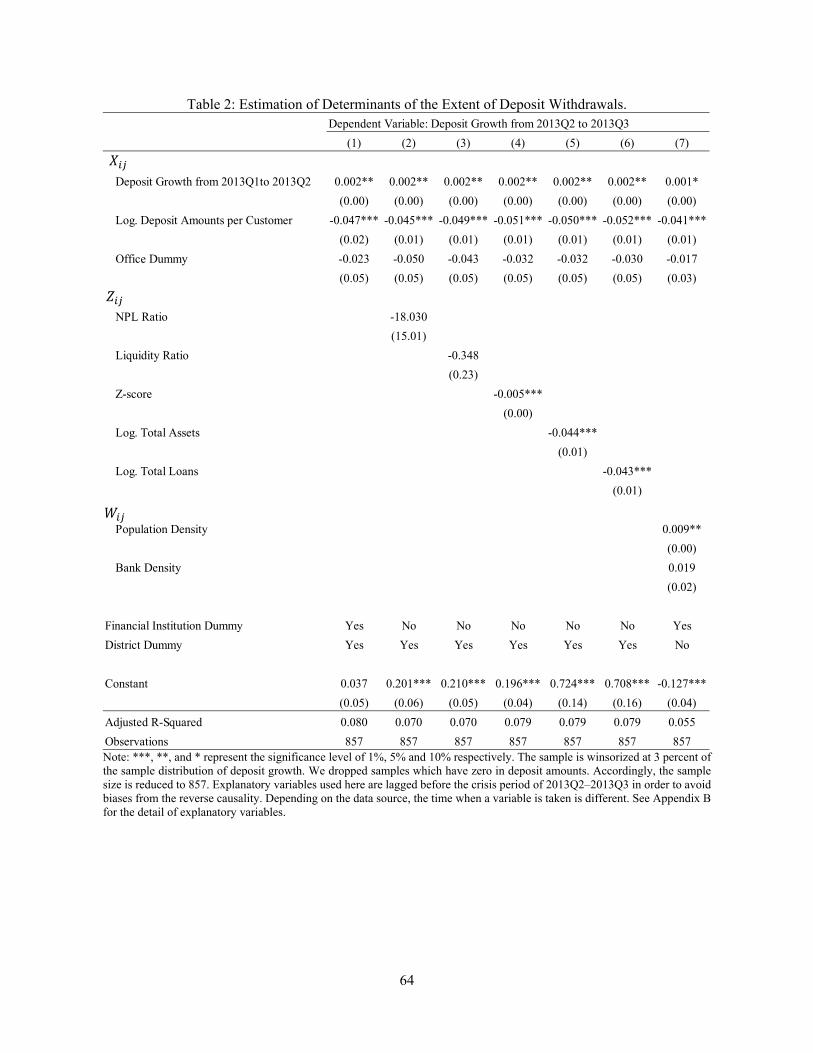
64
Table 2: Estimation of Determinants of the Extent of Deposit Withdrawals. Dependent Variable: Deposit Growth from 2013Q2 to 2013Q3
(1) (2) (3) (4) (5) (6) (7)
Deposit Growth from 2013Q1to 2013Q2 0.002** 0.002** 0.002** 0.002** 0.002** 0.002** 0.001*
(0.00) (0.00) (0.00) (0.00) (0.00) (0.00) (0.00)
Log. Deposit Amounts per Customer -0.047*** -0.045*** -0.049*** -0.051*** -0.050*** -0.052*** -0.041***
(0.02) (0.01) (0.01) (0.01) (0.01) (0.01) (0.01)
Office Dummy -0.023 -0.050 -0.043 -0.032 -0.032 -0.030 -0.017
(0.05) (0.05) (0.05) (0.05) (0.05) (0.05) (0.03)
NPL Ratio -18.030
(15.01)
Liquidity Ratio -0.348
(0.23)
Z-score -0.005***
(0.00)
Log. Total Assets -0.044***
(0.01)
Log. Total Loans -0.043***
(0.01)
Population Density 0.009**
(0.00)
Bank Density 0.019
(0.02)
Financial Institution Dummy Yes No No No No No Yes
District Dummy Yes Yes Yes Yes Yes Yes No
Constant 0.037 0.201*** 0.210*** 0.196*** 0.724*** 0.708*** -0.127***
(0.05) (0.06) (0.05) (0.04) (0.14) (0.16) (0.04)
Adjusted R-Squared 0.080 0.070 0.070 0.079 0.079 0.079 0.055
Observations 857 857 857 857 857 857 857 Note: ***, **, and * represent the significance level of 1%, 5% and 10% respectively. The sample is winsorized at 3 percent of the sample distribution of deposit growth. We dropped samples which have zero in deposit amounts. Accordingly, the sample size is reduced to 857. Explanatory variables used here are lagged before the crisis period of 2013Q2–2013Q3 in order to avoid biases from the reverse causality. Depending on the data source, the time when a variable is taken is different. See Appendix B for the detail of explanatory variables.
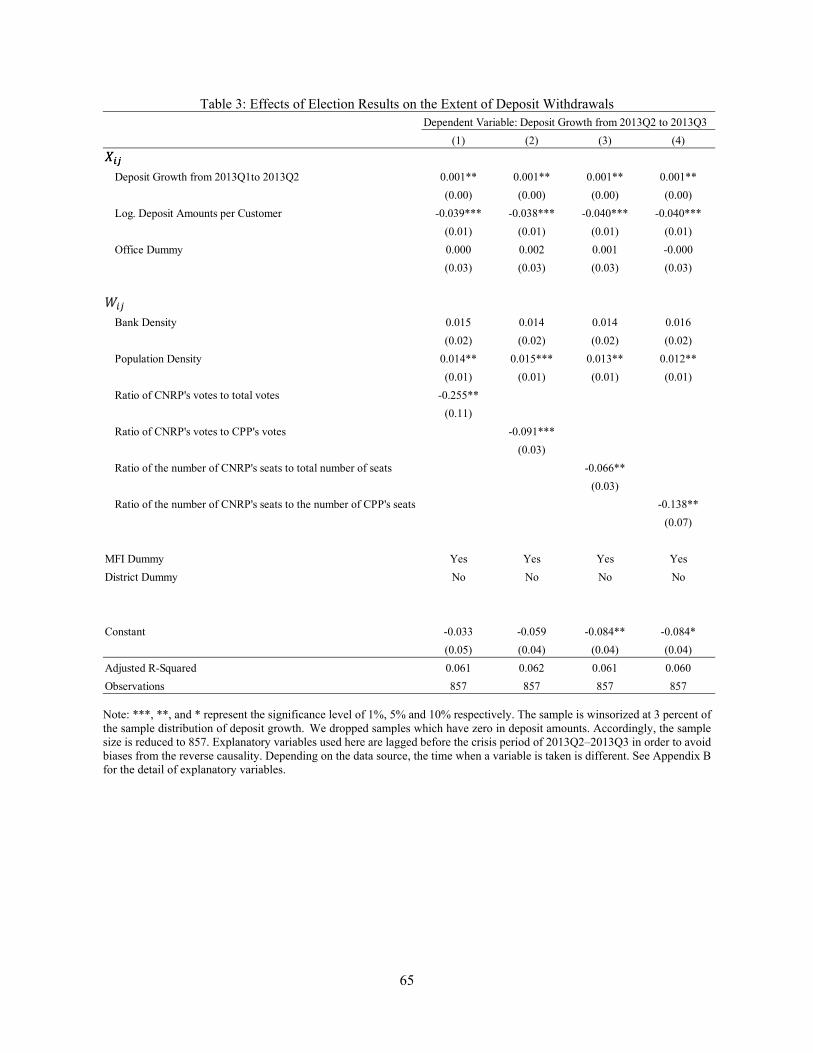
65
Table 3: Effects of Election Results on the Extent of Deposit WithdrawalsDependent Variable: Deposit Growth from 2013Q2 to 2013Q3
(1) (2) (3) (4)
Deposit Growth from 2013Q1to 2013Q2 0.001** 0.001** 0.001** 0.001**
(0.00) (0.00) (0.00) (0.00)
Log. Deposit Amounts per Customer -0.039*** -0.038*** -0.040*** -0.040***
(0.01) (0.01) (0.01) (0.01)
Office Dummy 0.000 0.002 0.001 -0.000
(0.03) (0.03) (0.03) (0.03)
Bank Density 0.015 0.014 0.014 0.016
(0.02) (0.02) (0.02) (0.02)
Population Density 0.014** 0.015*** 0.013** 0.012**
(0.01) (0.01) (0.01) (0.01)
Ratio of CNRP's votes to total votes -0.255**
(0.11)
Ratio of CNRP's votes to CPP's votes -0.091***
(0.03)
Ratio of the number of CNRP's seats to total number of seats -0.066**
(0.03)
Ratio of the number of CNRP's seats to the number of CPP's seats -0.138**
(0.07)
MFI Dummy Yes Yes Yes Yes
District Dummy No No No No
Constant -0.033 -0.059 -0.084** -0.084*
(0.05) (0.04) (0.04) (0.04)
Adjusted R-Squared 0.061 0.062 0.061 0.060
Observations 857 857 857 857
Note: ***, **, and * represent the significance level of 1%, 5% and 10% respectively. The sample is winsorized at 3 percent of the sample distribution of deposit growth. We dropped samples which have zero in deposit amounts. Accordingly, the sample size is reduced to 857. Explanatory variables used here are lagged before the crisis period of 2013Q2–2013Q3 in order to avoid biases from the reverse causality. Depending on the data source, the time when a variable is taken is different. See Appendix B for the detail of explanatory variables.

66
7. Concluding remarks Bank runs have attracted a great deal of attention from both policy makers and academia since they have important implications for the financial markets and long- and short-term economic growth. However, the rarity of a bank run and the low availability of data capturing depositors’ behaviors during the crisis period have made it difficult to empirically test the existing hypotheses.
In this section, we investigated depositor’s running behaviors triggered by the political turbulence in Cambodia in 2013. Using a unique dataset constructed from the administrative data from Cambodian financial institutions made publicly available by the Cambodia Microfinance Association and National Bank of Cambodia, we tested the hypotheses of depositors’ running behaviors by exploiting the unanticipated confusion after the national election as natural experiment on depositors’ behaviors.
Our main findings are as follows: First, we found that depositors with larger amounts of deposits are likely to run during the crisis period even in the absence of explicit deposit insurance. Second, the extent of deposit withdrawals was negatively associated to the fundamentals of banks. Finally, we found that the regional factors were important to explain the extent of deposit withdrawals. Especially, the election results were significantly associated with the extent of deposit withdrawals. These findings suggest that all financial institutions are possibly exposed to a sudden deposit decline regardless of whether their management is good or bad. In addition, the results seem to suggest that the diversification of customers, especially an increase in low-income customers, can effectively reduce the risks of deposit withdrawals. Finally, we found that regional factors can mitigate the extent of deposit withdrawals, suggesting that regional economic development might foster financial stability during periods of political uncertainty in Cambodia.
Furthermore, from those results, we could draw several important conclusions. First, regarding deposit insurance in emerging markets, our results might imply that a deposit insurance scheme with a low insurance limit could be ineffective, since depositors with lower balances are unlikely to withdraw money even in the absence of explicit deposit insurance. Thus, the implementation of deposit insurance may only lead to instability in the financial sector by inducing a moral hazard issues of banks. Second, our analysis revealed that the regional election results also affected the extent of deposit withdrawals. In particular, if the opposite party obtained more votes/seats in the region, the extent of deposit withdrawals became worse. This finding suggests that the political instability in the region affect the depositor’s behaviors possibly because they are likely to expect the conflict or some damage on the economic condition in the future. Thus, stability in the political situation is also crucial for realization of a stable financial market. We believe that our findings in this paper are useful for making policies relating to financial stability in emerging markets.
However, even though we exploited the advantage of natural experiment to identify the effects of region- and bank-specific variables, there possibly remain biases caused by omitted potential variables. For example, depositors with large amounts of deposits could be the well-educated and financially literate people, and it is natural to assume that those people are likely to run when fears of bank failure increase. However, it is hard to separate those factors using the current dataset, in great part due to data availability in Cambodia. Furthermore, the sample in our dataset is composed of only eight financial institutions, particularly those that are engaged in microfinance business. Thus, it is still unclear that our results may truly reflect the entire Cambodian banking sector. Addressing this identification problem and small sample problem are required to be dealt with in the future research.

67
Reference Allen, F., & Gale, D. (1998) Optimal Financial Crises. Journal of Finance, 53(4), 1245-1284.
Anginer, D., Demirgüç-Kunt, A., & Zhu, M. (2013). How does bank competition affect systemic stability? Journal of Financial Intermediation.
Armendáriz, B., & Morduch, J. (2010). The economics of microfinance. Cambridge, MA: MIT Press.
Ariss, R. T. (2010). On the implications of market power in banking: Evidence from developing countries. Journal of Banking & Finance, 34(4), 765-775.
Boyd, J. H., and G. De Nicoló. 2005. The theory of bank risk taking and competition revisited. The Journal of Finance 60 (3):1329–43.
Brown, M., Guin, B., & Morkoetter, S. (2013). Switching costs, deposit insurance and deposit withdrawals from distressed banks. Swiss Institute of Banking and Finance, Working Paper on Finance, (2013/19).
Carteret, Daniel de. (15 Octorber, 2013a) Acleda sees record decline. Phnom Penh Post. Retrieved from http://www.phnompenhpost.com/business/acleda-sees-record-decline.
Carteret, Daniel de. (7 November, 2013b) Withdrawals top hundreds of millions. Phnom Penh Post. Retrieved from http://www.phnompenhpost.com/business/withdrawals-top-hundreds-millions.
Degryse, H., Kim, M., & Ongena, S. (2009). Microeconometrics of banking: methods, applications, and results. City: Oxford University Press.
Demirgüç-Kunt, A., & Detragiache, E. (2002). Does deposit insurance increase banking system stability? An empirical investigation. Journal of Monetary Economics, 49(7), 1373-1406.
Demirgüç-Kunt, A., & Kane, E. J. (2002). Deposit insurance around the globe: Where does it work? Journal of Economic Perspectives, 175-195.
Diamond, D. W., & Dybvig, P. H. (1983). Bank runs, deposit insurance, and liquidity. The Journal of Political Economy, 401-419.
Diamond, D. W., & Rajan, R. G. (2005). Liquidity shortages and banking crises. The Journal of Finance, 60(2), 615-647.
Disli, M., Schoors, K., & Meir, J. (2013). Political connections and depositor discipline. Journal of Financial Stability, 9(4), 804-819.
Dupas, P., & Robinson, J. (2012). The (hidden) costs of political instability: Evidence from Kenya's 2007 election crisis. Journal of Development Economics, 99(2), 314-329.
Freixas, X., & Rochet, J. C. (2007). Microeconomics of banking (Vol. 2). Cambridge, MA: MIT Press.
Ghosh, S., & Das, A. (2003). Market discipline in the Indian banking sector: An empirical exploration. NSE Research Initiative, NSE: Mumbai, 1-19.
Goedde-Menke, M., Langer, T., & Pfingsten, A. (2014). Impact of the financial crisis on bank run risk–Danger of the days after. Journal of Banking & Finance, 40, 522-533.

68
Han, R., & Melecky, M. (2013). Financial inclusion for financial stability: access to bank deposits and the growth of deposits in the global financial crisis. World Bank Policy Research Working Paper, (6577).
Hasan, I., Jackowicz, K., Kowalewski, O., & Kozłowski, Ł. (2013). Market discipline during crisis: Evidence from bank depositors in transition countries. Journal of Banking & Finance, 37(12), 5436-5451.
Honohan, P. (2008). Cross-country variation in household access to financial services. Journal of Banking & Finance, 32(11), 2493-2500.
Human Rights Watch. (2015) World Report. Human Rights Watch, USA.
Iyer, R., & Puri, M. (2012). Understanding Bank Runs: The Importance of Depositor-Bank Relationships and Networks. American Economic Review, 102(4), 1414-1445.
Iyer, R., Puri, M., & Ryan, N. (2013). Do depositors monitor banks? (No. w19050). National Bureau of Economic Research.
Karas, A., Pyle, W., & Schoors, K. (2013). Deposit insurance, banking crises, and market discipline: Evidence from a natural experiment on deposit flows and rates. Journal of Money, Credit and banking, 45(1), 179-200.
Khwaja, A. I., & Mian, A. (2008). Tracing the impact of bank liquidity shocks: Evidence from an emerging market. The American Economic Review, 1413-1442.
Kimsay, Hor (May 5, 2014) Deposits rally after election outflows. Phnom Penh Post. Retrieved from http://www.phnompenhpost.com/business/deposits-rally-after-election-outflows
Kimsay, Hor (August 22, 2013) After poll, deposits at microfinance institutions down. Phnom Penh Post. Retrieved from http://www.phnompenhpost.com/business/after-poll-deposits-microfinance-institutions-down
Lagoarde-Segot, T., & Leoni, P. L. (2013). Pandemics of the poor and banking stability. Journal of Banking & Finance, 37(11), 4574-4583.
International Monetary Fund. (2014) 2013 ARTICLE IV CONSULTATION, IMF Country Report No. 14/33.
Law on Banking and Financial Institutions (LBFI), 1999
Levy-Yayati, E., Martinez-Peria, M. S., & Schmukler, S. L. (2010). Depositor behavior under Macroeconomic risk: Evidence from bank runs in emerging economies. Journal of Money, Credit and Banking, 42(4), 585-614.
Martinez Peria, M. S., & Schmukler, S. L. (2001). Do depositors punish banks for bad behavior? Market discipline, deposit insurance, and banking crises. The Journal of Finance, 56(3), 1029-1051.
National Bank of Cambodia (2011) Annual supervisory report 2010. National Bank of Cambodia, Phnom Penh
National Bank of Cambodia (2012) Annual supervisory report 2010. National Bank of Cambodia, Phnom Penh

69
National Bank of Cambodia (2013) Annual supervisory report 2012. National Bank of Cambodia, Phnom Penh
National Bank of Cambodia (2014a) Annual supervisory report 2013. National Bank of Cambodia, Phnom Penh
National Bank of Cambodia (2014b) Review of the National Bank of Cambodia, No .46 , National Bank of Cambodia, Phnom Penh.
Oliveira, R. D. F., Schiozer, R. F., & Barros, L. A. D. C. (2015). Depositors’ Perception of “Too-Big-to-Fail”. Review of Finance, 19(1), 191-227.
Okuda, H., & Aiba, D. (2016). Determinants of Operational Efficiency and Total Factor Productivity Change of Major Cambodian Financial Institutions: A Data Envelopment Analysis During 2006–13. Emerging Markets Finance and Trade, 52(6), 1455-1471.
The Committee for Free and Fair Elections in Cambodia. (2013) 2013 National Assembly Elections Final Assessment and Report.
Schumacher, L. (2000). Bank runs and currency run in a system without a safety net: Argentina and the tequila shock. Journal of Monetary Economics, 46(1), 257-277.
Stix, H. (2013). Why do people save in cash? Distrust, memories of banking crises, weak institutions and dollarization. Journal of Banking & Finance, 37(11), 4087-4106.
Yamada, H. (2013) Cambodia People’s Party faces pressure on a change in its regime. [Published in Japanese] 邦題: 山田裕史 (2013) 「変革を迫られる人民党一党支配体制」『アジ研ワールドトレンド』219: 4-7.

70
Appendix A: List of Top 40 Financial Institutions in Cambodia (Loan sizes) Amounts of Loans (Millions of KHR)
*1 Acleda Bank Commercial banks 5,840,089
2 Canadia Bank Commercial banks 4,229,610
3 Cambodian Public Bank Commercial banks 2,903,230
4 ANZ Royal Bank(Cambodia) Commercial banks 1,644,496
5 ICBC Commercial banks 1,524,468
*6 Prasac Microfinance Microfinace institution (Deposit-taking) 1,508,744
7 Bank for Investment and Development of Cambodia Commercial banks 1,482,518
8 Foreign Trade Bank of Cambodia Commercial banks 1,043,140
9 May Bank Commercial banks 1,043,114
10 Bank of China Commercial banks 939,399
*11 Amret Microfinace institution (Deposit-taking) 825,464
12 Union Commercial Bank Commercial banks 784,964
*13 Sathapana Microfinace institution (Deposit-taking) 731,388
14 Advanced Bank of Asia Commercial banks 700,014
15 First Commercial Bank Commercial banks 625,818
*16 Hattha Kaksekar Microfinace institution (Deposit-taking) 584,729
17 RHB Indochina Bank Commercial banks 558,417
18 CIMB Bank Commercial banks 528,658
19 SHB Commercial banks 501,312
20 Phnom Penh Commercial Bank Commercial banks 469,943
21 Vattanac Bank Commercial banks 467,217
22 Shinhan Khmer Bank Plc. Commercial banks 332,433
23 Saigon Thuong Tin Bank(Cambodia) Commercial banks 330,923
*24 Angkor Mikroheranhvatho Kampuchea Microfinace institution (Deposit-taking) 318,496
25 Mega International Commercial Bank Commercial banks 305,208
26 Thaneakea Phum Microfinace institution 303,953
*27 KREDIT Microfinance Institution Microfinace institution (Deposit-taking) 299,579
28 Maruhan Japan Bank Commercial banks 285,014
*29 Visionfund Microfinace institution (Deposit-taking) 248,078
30 Rural Development Bank Specialized banks 220,679
31 Kookmin Bank Cambodia Commercial banks 207,345
32 Cambodian Commercial Bank Commercial banks 198,413
33 MB Bank Commercial banks 191,221
34 Krung Thai Bank Public Commercial banks 171,316
35 Cathay United Bank Commercial banks 159,245
36 Cambodia Asia Bank Commercial banks 154,595
37 Hwang DBS Commercial Bank Commercial banks 128,999
38 Agri Bank Commercial banks 126,541
39 Cam Capital Specialized Bank Specialized banks 123,857
40 Cambodia Mekong Bank Public Commercial banks 88,662 Note: An asterisk represents the bank which is included in our dataset. In the entire banking sector, there are a
total of 80 financial institutions registered in the central bank of Cambodia. Source: National Bank of Cambodia (2014a) Annual supervisory report 2013.

71
Appendix B: Definition of Variables Used in Estimation and Data Sources Name of variables Definition Source
Bank-region specific variables
Amount of deposits per depositor
Amounts of deposits per depositor in region j. The values at the 2013Q2 is used in the estimation.
Cambodia Microfinance Association’s website (CMA)
Office dummy It takes one if there is bank i’s office in the region j at 2013Q2 NBC (2014b) Bank-specific variables Z-score
We calculate this variable as , where d stands
for the standard deviation of ROA of individual banks over the past three years. This variable is taken at the end of 2012. For details, see Ariss (2010).
National Bank of Cambodia (2010-2013)
Liquidity ratio The ratio of liquidity assets, such as cash, deposits in other banks, and deposits in a central bank to total assets at the end of 2012.
National Bank of Cambodia (2013)
Log. Total assets Logarithm of total assets. The values are taken at the end of 2012. National Bank of Cambodia (2013)
Log. Total loans Logarithm of total amounts of outstanding loans at the end of 2012.
National Bank of Cambodia (2013)
Region-specific variables Population density Total number of population per 1 km2 in the district. The number
was calculated as total number of employees in the district from census data of all enterprises in Cambodia.
Economic census 2011
Bank Density Number of financial institutions’ branches per 1,000 people in the region j.
NBC (2014b)
Ratio of CNRP's votes to total votes
The ratio of the number of votes obtained by the biggest opposite party, CNRP, to total number of votes in the region. Note that this variable is at province-level.
The Committee of Free and Fair Election in Cambodia (2013)
Ratio of CNRP's votes to CPP's votes
The ratio of the number of votes obtained by the biggest opposite party, CNRP, to total number of votes obtained by the ruling party, CPP, in the province. Note that this variable is at province-level.
The Committee of Free and Fair Election in Cambodia (2013)
Ratio of CNRP's seats to total seats
The ratio of the number of seats obtained by the biggest opposite party, CNRP, to total number of seats in the province. Note that this variable is at province-level.
The Committee of Free and Fair Election in Cambodia (2013)
Ratio of CNRP's seats to CPP's seats
The ratio of the number of seats obtained by the biggest opposite party, CNRP, to total number of seats obtained by the ruling party, CPP, in the province. Note that this variable is at province-level.
The Committee of Free and Fair Election in Cambodia (2013)
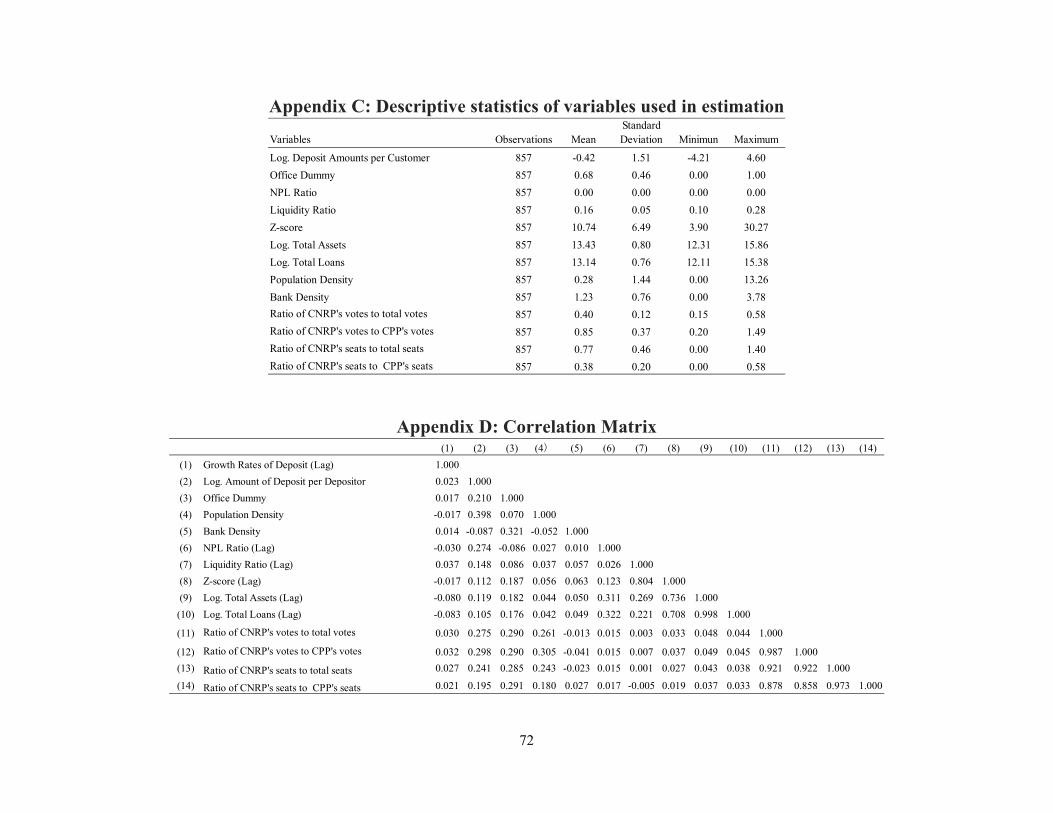
72
Appendix C: Descriptive statistics of variables used in estimation
Variables Observations MeanStandard Deviation Minimun Maximum
Log. Deposit Amounts per Customer 857 -0.42 1.51 -4.21 4.60
Office Dummy 857 0.68 0.46 0.00 1.00
NPL Ratio 857 0.00 0.00 0.00 0.00
Liquidity Ratio 857 0.16 0.05 0.10 0.28
Z-score 857 10.74 6.49 3.90 30.27
Log. Total Assets 857 13.43 0.80 12.31 15.86
Log. Total Loans 857 13.14 0.76 12.11 15.38
Population Density 857 0.28 1.44 0.00 13.26
Bank Density 857 1.23 0.76 0.00 3.78
Ratio of CNRP's votes to total votes 857 0.40 0.12 0.15 0.58
Ratio of CNRP's votes to CPP's votes 857 0.85 0.37 0.20 1.49
Ratio of CNRP's seats to total seats 857 0.77 0.46 0.00 1.40
Ratio of CNRP's seats to CPP's seats 857 0.38 0.20 0.00 0.58
Appendix D: Correlation Matrix (1) (2) (3) (4) (5) (6) (7) (8) (9) (10) (11) (12) (13) (14)
(1) Growth Rates of Deposit (Lag) 1.000
(2) Log. Amount of Deposit per Depositor 0.023 1.000
(3) Office Dummy 0.017 0.210 1.000
(4) Population Density -0.017 0.398 0.070 1.000
(5) Bank Density 0.014 -0.087 0.321 -0.052 1.000
(6) NPL Ratio (Lag) -0.030 0.274 -0.086 0.027 0.010 1.000
(7) Liquidity Ratio (Lag) 0.037 0.148 0.086 0.037 0.057 0.026 1.000
(8) Z-score (Lag) -0.017 0.112 0.187 0.056 0.063 0.123 0.804 1.000
(9) Log. Total Assets (Lag) -0.080 0.119 0.182 0.044 0.050 0.311 0.269 0.736 1.000
(10) Log. Total Loans (Lag) -0.083 0.105 0.176 0.042 0.049 0.322 0.221 0.708 0.998 1.000
(11) Ratio of CNRP's votes to total votes 0.030 0.275 0.290 0.261 -0.013 0.015 0.003 0.033 0.048 0.044 1.000
(12) Ratio of CNRP's votes to CPP's votes 0.032 0.298 0.290 0.305 -0.041 0.015 0.007 0.037 0.049 0.045 0.987 1.000
(13) Ratio of CNRP's seats to total seats 0.027 0.241 0.285 0.243 -0.023 0.015 0.001 0.027 0.043 0.038 0.921 0.922 1.000
(14) Ratio of CNRP's seats to CPP's seats 0.021 0.195 0.291 0.180 0.027 0.017 -0.005 0.019 0.037 0.033 0.878 0.858 0.973 1.000

73
Appendix F: Impacts of deposit withdrawals on the economy.
Influence of deposit withdrawals on lending behaviors
In order to reinforce our understanding of the deposit withdrawals in 2013, we investigate to what extent the deposit withdrawals have impact on the economy in this appendix. Here, we show whether the deposit withdrawals following the national election in July of 2013 affected the lending behaviors of financial institutions. First, we show the changes in growth of loans and deposits between before and after the national election 2013. Table F.1 shows the growth of loans and deposits by financial institutions. The deposits growths of each financial institution confirm the significant decline after the election (2013Q2-2013Q3). All of 7 financial institutions have experienced decline in deposit growths after the election, compared to deposit growths before the election. However, the impact of these shocks on lending behaviors seemed limited. For the loan side, some of financial institutions have not experienced declines in loan growths, although loan growths of Acleda, PRASAC, AMRET, and KREDIT have declined after the election (2013Q2-2013Q3). It might be because the microfinance institutions have another funding sources, such as borrowing from some institutional lenders, and then they could complement the decline funding with those different sources.
Table F.2 shows the changes in loan-to-deposit ratio from 2012Q4 to 2013Q3. We find that the loan-to-deposit ratios rose in 2013Q3, suggesting financial institutions suffered the decline in deposits.
Changes in interest rates on loans and deposits in the period from 2011Q1 to 2014Q4
Next, we show changes in interest rates on deposits and loans after the national election 2013, in order to investigate how much deposit withdrawals impact the economy. Although we couldn’t obtain the data covering interest rates of MFIs, we instead collected interest rates of 41 individual commercial and specialized banks on a quarterly basis. The data is obtained from the Licensing Department of National Bank of Cambodia, which oversees the commercial banks and specialized banks in Cambodia.1 The data covers the interest rates of all of commercial banks and specialized banks from 2012Q1 to 2015Q4 on a quarterly basis.
Here, we show the results of our investigation of how much and which banks raised the interest rate in response to the deposit withdrawals in 2013. Since USD deposits were mainly withdrawn after the national election, we only investigated the changes in USD deposits and loans. In the period of 2013Q3, we find that six financial institutions have raised interest rates on at least one of deposit products they provided. 2 In Figure F.1, we present the financial institutions which raised interest rates on deposits after the election (2013Q1). Although we observe the rises in interest rates in different period from 2013Q3, the sharp increases in 2013Q3 might reflect the depositor’s withdrawing in response to the nation-wide confusion after the election. On the other hand, we find that five banks raised the interest rates on lending
1 We couldn’t obtain the data of interest rates of MFIs in this period. 2 The financial institutions which raised the interest rates were Acleda Bank, ANZ Royal Bank, Shinhan Khmer Bank, Phnom Penh Commercial Bank, HwangDBS, AGRI Bank Cambodia.
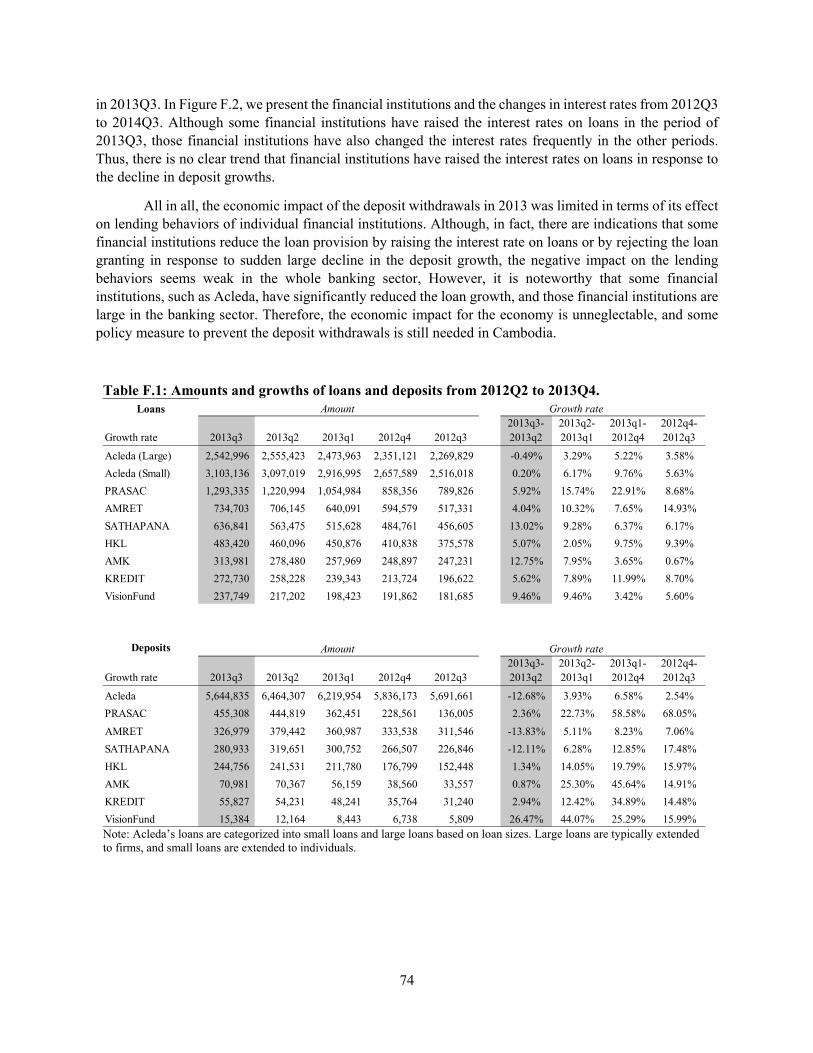
74
in 2013Q3. In Figure F.2, we present the financial institutions and the changes in interest rates from 2012Q3 to 2014Q3. Although some financial institutions have raised the interest rates on loans in the period of 2013Q3, those financial institutions have also changed the interest rates frequently in the other periods. Thus, there is no clear trend that financial institutions have raised the interest rates on loans in response to the decline in deposit growths.
All in all, the economic impact of the deposit withdrawals in 2013 was limited in terms of its effect on lending behaviors of individual financial institutions. Although, in fact, there are indications that some financial institutions reduce the loan provision by raising the interest rate on loans or by rejecting the loan granting in response to sudden large decline in the deposit growth, the negative impact on the lending behaviors seems weak in the whole banking sector, However, it is noteworthy that some financial institutions, such as Acleda, have significantly reduced the loan growth, and those financial institutions are large in the banking sector. Therefore, the economic impact for the economy is unneglectable, and some policy measure to prevent the deposit withdrawals is still needed in Cambodia.
Table F.1: Amounts and growths of loans and deposits from 2012Q2 to 2013Q4. Loans Amount Growth rate
Growth rate 2013q3 2013q2 2013q1 2012q4 2012q32013q3-2013q2
2013q2-2013q1
2013q1-2012q4
2012q4-2012q3
Acleda (Large) 2,542,996 2,555,423 2,473,963 2,351,121 2,269,829 -0.49% 3.29% 5.22% 3.58%
Acleda (Small) 3,103,136 3,097,019 2,916,995 2,657,589 2,516,018 0.20% 6.17% 9.76% 5.63%
PRASAC 1,293,335 1,220,994 1,054,984 858,356 789,826 5.92% 15.74% 22.91% 8.68%
AMRET 734,703 706,145 640,091 594,579 517,331 4.04% 10.32% 7.65% 14.93%
SATHAPANA 636,841 563,475 515,628 484,761 456,605 13.02% 9.28% 6.37% 6.17%
HKL 483,420 460,096 450,876 410,838 375,578 5.07% 2.05% 9.75% 9.39%
AMK 313,981 278,480 257,969 248,897 247,231 12.75% 7.95% 3.65% 0.67%
KREDIT 272,730 258,228 239,343 213,724 196,622 5.62% 7.89% 11.99% 8.70%
VisionFund 237,749 217,202 198,423 191,862 181,685 9.46% 9.46% 3.42% 5.60%
Deposits Amount Growth rate
Growth rate 2013q3 2013q2 2013q1 2012q4 2012q32013q3-2013q2
2013q2-2013q1
2013q1-2012q4
2012q4-2012q3
Acleda 5,644,835 6,464,307 6,219,954 5,836,173 5,691,661 -12.68% 3.93% 6.58% 2.54%
PRASAC 455,308 444,819 362,451 228,561 136,005 2.36% 22.73% 58.58% 68.05%
AMRET 326,979 379,442 360,987 333,538 311,546 -13.83% 5.11% 8.23% 7.06%
SATHAPANA 280,933 319,651 300,752 266,507 226,846 -12.11% 6.28% 12.85% 17.48%
HKL 244,756 241,531 211,780 176,799 152,448 1.34% 14.05% 19.79% 15.97%
AMK 70,981 70,367 56,159 38,560 33,557 0.87% 25.30% 45.64% 14.91%
KREDIT 55,827 54,231 48,241 35,764 31,240 2.94% 12.42% 34.89% 14.48%
VisionFund 15,384 12,164 8,443 6,738 5,809 26.47% 44.07% 25.29% 15.99%Note: Acleda’s loans are categorized into small loans and large loans based on loan sizes. Large loans are typically extended to firms, and small loans are extended to individuals.
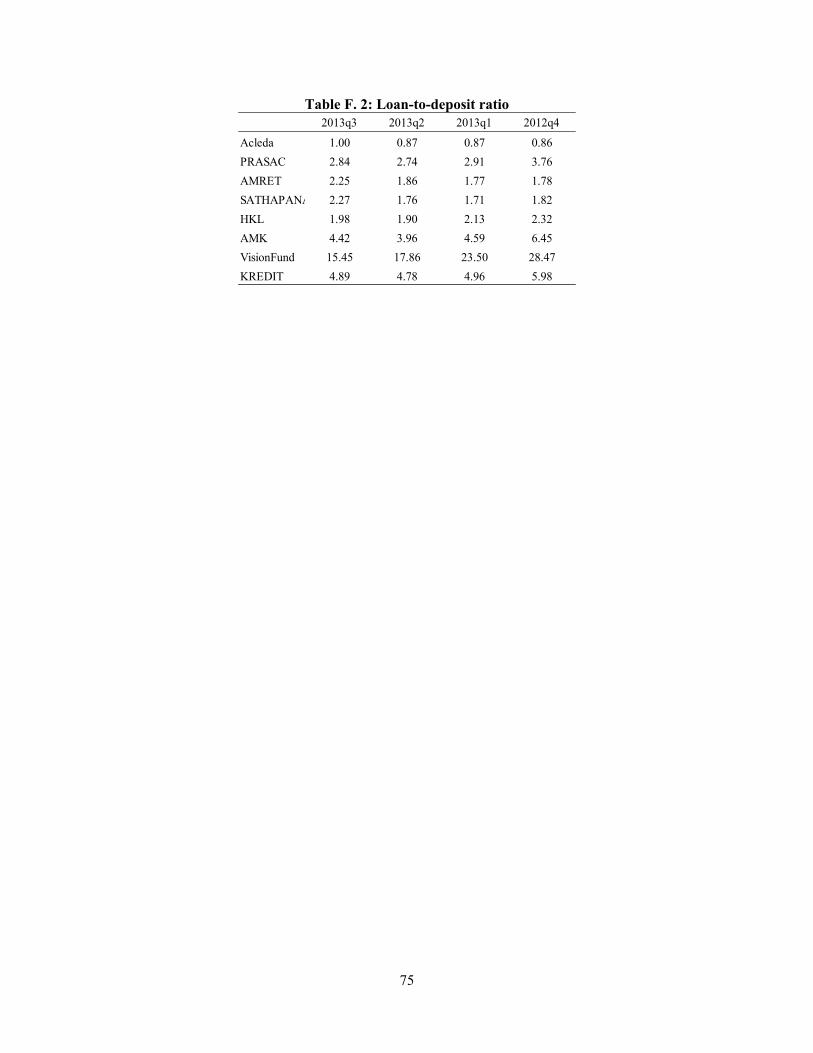
75
Table F. 2: Loan-to-deposit ratio 2013q3 2013q2 2013q1 2012q4
Acleda 1.00 0.87 0.87 0.86
PRASAC 2.84 2.74 2.91 3.76
AMRET 2.25 1.86 1.77 1.78
SATHAPANA 2.27 1.76 1.71 1.82
HKL 1.98 1.90 2.13 2.32
AMK 4.42 3.96 4.59 6.45
VisionFund 15.45 17.86 23.50 28.47
KREDIT 4.89 4.78 4.96 5.98

76
Figure F. 13. Changes in interest rates on USD deposits
Acleda Bank
ANZ Royal Bank
Shinhan Khmer Bank
Phnom Penh Commercial Bank
HwangDBS
AGRI Bank Cambodia
Note: saving_usd: interest rates on saving accounts depost_usd_1: interest rates on fixed deposits (1 month) depost_usd_3: interest rates on fixed deposits (3 months) depost_usd_6: interest rates on fixed deposits (6 months) depost_usd_12: interest rates on fixed deposits (more than12 months)
0.0
1.0
2.0
3.0
4.0
5
2012q3 2013q1 2013q3 2014q1 2014q3yq
saving_usd deposit_usd_1deposit_usd_3 deposit_usd_6deposit_usd_12
0.0
1.0
2.0
3.0
4
2012q3 2013q1 2013q3 2014q1 2014q3yq
saving_usd deposit_usd_1deposit_usd_3 deposit_usd_6deposit_usd_12
0.0
1.0
2.0
3.0
4
2012q3 2013q1 2013q3 2014q1 2014q3yq
saving_usd deposit_usd_1deposit_usd_3 deposit_usd_6deposit_usd_12
.01
.02
.03
.04
.05
.06
2012q3 2013q1 2013q3 2014q1 2014q3yq
saving_usd deposit_usd_1deposit_usd_3 deposit_usd_6deposit_usd_12
.01
.02
.03
.04
.05
.06
2012q3 2013q1 2013q3 2014q1 2014q3yq
saving_usd deposit_usd_1deposit_usd_3 deposit_usd_6deposit_usd_12
0.0
1.0
2.0
3.0
4.0
5
2012q3 2013q1 2013q3 2014q1 2014q3yq
saving_usd deposit_usd_1deposit_usd_3 deposit_usd_6deposit_usd_12

77
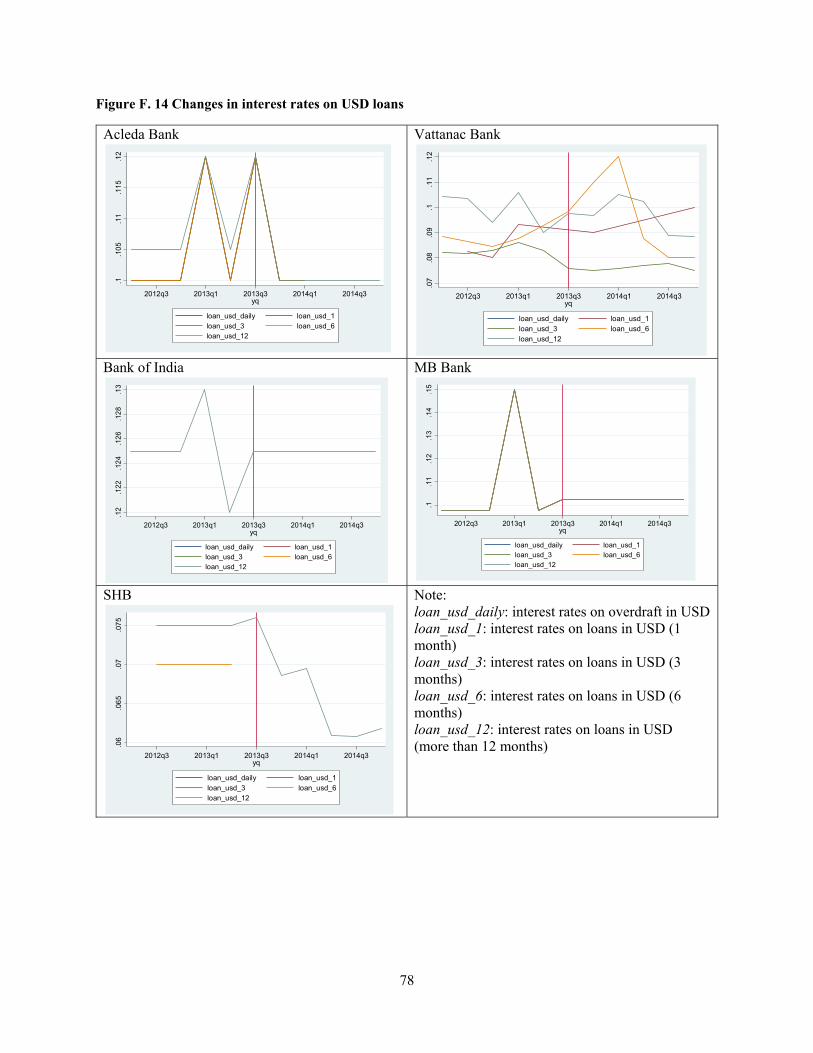
78
Figure F. 14 Changes in interest rates on USD loans
Acleda Bank
Vattanac Bank
Bank of India
MB Bank
SHB
Note: loan_usd_daily: interest rates on overdraft in USD loan_usd_1: interest rates on loans in USD (1 month) loan_usd_3: interest rates on loans in USD (3 months) loan_usd_6: interest rates on loans in USD (6 months) loan_usd_12: interest rates on loans in USD (more than 12 months)
.1.1
05
.11
.11
5.1
2
2012q3 2013q1 2013q3 2014q1 2014q3yq
loan_usd_daily loan_usd_1loan_usd_3 loan_usd_6loan_usd_12
.07
.08
.09
.1.1
1.1
2
2012q3 2013q1 2013q3 2014q1 2014q3yq
loan_usd_daily loan_usd_1loan_usd_3 loan_usd_6loan_usd_12
.12
.12
2.1
24
.12
6.1
28
.13
2012q3 2013q1 2013q3 2014q1 2014q3yq
loan_usd_daily loan_usd_1loan_usd_3 loan_usd_6loan_usd_12
.1.1
1.1
2.1
3.1
4.1
5
2012q3 2013q1 2013q3 2014q1 2014q3yq
loan_usd_daily loan_usd_1loan_usd_3 loan_usd_6loan_usd_12
.06
.06
5.0
7.0
75
2012q3 2013q1 2013q3 2014q1 2014q3yq
loan_usd_daily loan_usd_1loan_usd_3 loan_usd_6loan_usd_12
79
Chapter 4: Foreign Currency Borrowing and Household’s Risk-Hedging Behaviors Evidence from a Household Survey in Cambodia1
1. Introduction In recent years, dollarization2 has been one of the growing issues for developing and emerging
countries, under current increasing globalization. In general, dollarization could limit the range of effective monetary policy and impose serious problems on the economy and financial sectors, although dollarization could attract capital inflows and facilitate high levels of openness by eliminating the exchange rate risk (Levy-Yeyati, 2006; Ranciere et al., 2010; Brown et al., 2014, World Bank, 2015).
Among dollarized economies, Cambodia is exceptionally heavily dollarized. Cambodia has been dollarized since it started to recover from historical turmoil and transited from a centrally planned economy to a market-oriented one in the early 1990s. According to the World Bank (2015), the ratio of US dollar deposits to the commercial bank’s total deposits has ranged from 92% to 98% over the last 20 years. Not only the deposit side, but also the loan side, is highly dollarized in Cambodia. According to the National Bank of Cambodia (NBC), about 95 % of loans provided by commercial banks are denominated in US dollars. In addition to the US dollar, other foreign currencies, such as the Thai baht and the Vietnamese dong, are also used for means of payment or store of value near the borders between Cambodia and the relevant countries (NBC, 2012). Menon (2008) and Duma (2011) find that the recent growth rates of local currency deposits were as high as those of FX deposits, suggesting that current dollarization in Cambodia is unique, and not the consequence of currency substitutions, but possibly caused by massive inflow of foreign currency through foreign direct investments, bank and money market flows, overseas development aids. However, there is currently no study which investigates the choice of currency in economic and financial activities of economic agents at micro levels in Cambodia. Thus, the actual situation of Cambodian dollarization at micro level is still unclear, which makes it difficult to implement specific administrative measures.
In the present paper, we investigate the factors behind households’ FX borrowing. In the context of Cambodia, loans are more common financial products than deposit for households in Cambodia. According to World Bank’s Global Findex, only 4% of Cambodian households had formal savings as of 2014, while 28% had formal loans.3 It might reflect recent development in microfinance institutions (MFIs)
1 This Chapter is written based on Aiba, Odajima, & Khou (2017) “Foreign Currency Borrowing and Risk-Hedging Behaviors: Evidence from a Household Survey in Cambodia.” JICA-RI Working Paper No. 143. 2 The term “dollarization” is used in a broad sense and includes the substitution of local currency by any foreign currency in means of store value, payment, and unit of account. 3 World Bank’s Global Findex also reveals that penetration of accounts of formal financial institutions is 22% in Cambodia. In line with those indicators, the data used in our study shows that 459 households had deposit accounts of any formal financial institutions out of 2,273 total of households in 2014, while the 634 households had loans.
80
which aim at extending loans to the poor rather than collecting deposits. Therefore, although currency choices of deposits are also important to understand the dollarization mechanism in Cambodia, currency choices in borrowing has more implications for monetary policies and regulations on financial sector. Furthermore, when significant exchange rate fluctuation occurs, unhedged borrowers may result in default and it would lead to deterioration in financial soundness of commercial banks and MFIs. Despite its importance, there is little knowledge about motivations and characteristics of household engaged in FX borrowing.
Using a unique and comprehensive micro survey data of household’s economic and financial activities, we examined the relationship between a household’s characteristics and the currency denomination of their loans by using Probit model for a household’s choice of loan currency. The data was collected through a survey carried out by the JICA Research Institute (JICA-RI) and the National Bank of Cambodia (NBC) from October 2014 to January 2015, and it allows us to use the currency composition and actual amounts of households’ financial and economic variables, including income, expenditure, savings, and loans. Most of the previous studies have investigated the factors behind dollarization using macro-level aggregated data. Even when investigating dollarization in relation to the behavior of economic agents, the macro-aggregated data have been used due to the limited availability of survey-based micro data. In contrast to the aggregated data, micro data is suitable for researchers to use when analyzing the behavior of economic agents in detail, particularly when looking at the motive behind their currency choice. In recent years there has been an increase in the literature on foreign currency usage within households and firms, though most of those studies have focused on households in European countries using micro data (Pellényi and Bilek, 2009; Beer et al., 2010; Brown et al., 2011; Fidrmuc et al., 2013; Brown and Stix, 2014; Beckman and Stix, 2015).
As a result of our empirical analysis, we find that Cambodian households are engaged in risk-hedging behaviors against exchange rate changes and likely to borrow in foreign currency if foreign currency makes up the major portion of their income stream. We also find that expectation of depreciation of local currency leads households to take out local currency loans, in line with prediction from the previous theoretical models of the portfolio view (Ize and Levy-Yetagi, 2003; Jeanne, 2005). Furthermore, we find that there is a heterogeneity in the intensity of risk-hedging behaviors against currency mismatch risks. Especially, education plays a role, and the better-educated households are more likely to engage in risk-hedging behaviors by matching the currency composition between loan and income than the lower-educated are.
Our study complements to the literature of dollarization by showing the evidence that Cambodian households behaviors of FX currency borrowing fit in the portfolio selection frameworks, such as Ize and Levy-Yetagi (2003) and Jeanne (2005). We find that Cambodian households take risk-hedging behaviors against exchange rate risks in their portfolio, and they also choose the currency in loans which they expect to depreciate in order to maximize the return on their portfolio. In the previous literature, Beer et al. (2010) argue that the retail loans in FX currency is taken by the households who seek lower interest rates and do not take exchange rate risks. However, our findings support the hypothesis that FX borrowing can be explained by the risk-hedging behaviors as one of the factors, suggesting that dollarization in Cambodian households is not necessarily caused by small men’s carry-trade behaviors argued by Beer et al.
Therefore, our data is consistent to the previous survey in terms of financial inclusion.

81
Furthermore, by comparing with the results of previous studies (Fidrmuc et al, 2013), we show that the factors which are significant in European households are also important factors to drive Cambodian households to take FX loans. We believe that our study sheds a light on future policy planning for coping with dollarized economies in Cambodia.
Our study is the first study to point out and empirically demonstrate that there is a heterogeneity in the intensity of risk-hedging behaviors by households against the currency mismatch risks. Even though some previous studies have found that the relationship between currency in income/assets and the FX borrowing (Fidrmuc et al., 2013), there is no studies which point out the heterogeneity in the intensity of the risk-hedging behaviors. In fact, some previous studies point out that there could be different reasons to choose FX currency aside from risk-hedging purposes. Odajima & Khou (2017) has studied the usage of currency by Cambodian household, and found that some households answered that they chose FX currency because they would use FX currency in their transaction. In this regard, we empirically demonstrate that the intensity of risk-hedging behaviors against currency mismatch risks differ among households, and we find that education levels have an impact on the intensity of risk-hedging behaviors. Specifically, our results reveal that better-educated households are more likely to choose the loan currency which has larger portion in their income, while lower-educated households choose the loan currency which is used more for purchase of goods, rather than currency which dominates income or savings, possibly because of behavioral biases. Furthermore, our study is the first one to address the question of how transaction dollarization affects loan dollarization, and to point out that this is the consequence of non-risk-hedging behaviors against exchange rate risks by lower- educated households.
Our findings also complement the literature of FX currency borrowing and financial literacy which has been developed by Beckman and Stix (2015). Beckman and Stix argued that expectation of depreciation is more important to determine the loan currency if households are better financially literate, and they showed an empirical evidence using data of European households. As well as expectation of depreciation, our study shows that households risk-hedging behaviors in terms of currency mismatch risks are also enhanced by levels of education attainments, which is likely to be correlated with financial literacy.4 Our results might suggest that the knowledge about exchange rate risks or about risk-hedging against exchange rate risks, i.e. financial literacy, might be an important factor to explain the currency choice in loans for households. We also conducted the set of robustness checks on the potential effect of financial literacy. We found that the variables relating to usage of financial literacy are also significantly associated with the intensity of risk-hedging behaviors.
The rest of this paper is structured as follow. In Section 2, borrowed from previous literature, we describe and develop the possible hypotheses in household foreign currency borrowing behaviors. We describe the data we used in the empirical analysis contained in Section 3. Section 4 explains the empirical strategy used to test our hypothesis and Section 5 presents and discusses the results. In Section 6, we present our conclusions.
4 There are innumerous number of studies which empirically find the positive relationship between financial literacy and education attainments (Van Rooji et al., 2011a; Lusardi & Mitchell, 2014 ; Potrich, 2015).
82
2. Determinants of Foreign Currency Borrowing 2.1 The Portfolio View
We review possible determinants of choice of loan currency by households in the context of Cambodia, based on the previous theoretical arguments and existing evidences. In the literature of dollarization, one of the important theoretical models is the one which is proposed by Ize and Levy-Yetagi (2003). Their model is based on the assumption that economics agents are rational and has risk-averse utility function. Given that risks and returns profiles on the asset and borrowings depend on currency denomination due to the exchange rate, inflation rate, and country risk premium, the economic agents choose an optimal level of FX borrowings and FX assets in their portfolio. In the vein of this portfolio view in the literature of dollarization, Jeanne (2005) also theoretically shows that the economic agents with foreign currency income have incentive to choose foreign currency loans as optimal hedging strategies. An important prediction from those models is economic agents would hedge the risk of exchange rate changes by matching the currency composition between assets and liabilities or between income stream and liabilities.
If Cambodian households are risk-averse and rational, they should be engaged in the risk-hedging behavior so as to reduce the risk of exchange rate changes or other potential currency mismatch risks related to their portfolio selection. Therefore, we expect that households would choose FX (local) currency in a loan, if FX (local) currency has larger share in the income or assets (Hypothesis 1). Fidrmuc et al. (2013) empirically examine the relationship between foreign currency borrowing behavior and the availability of hedging instruments, such as remittance and income in a foreign currency. The authors find that availability of those hedging instruments had a significant effect on foreign currency borrowing, and if households have one of the hedging instruments they are more likely to borrow in a foreign currency.
Another important prediction from Ize and Levy-Yetagi (2003) is that economic agents choose the currency which makes a higher return, as others else equal. Based on this framework, it is expected that economic agents would choose the currency in loans which is predicted to depreciate in the future, since the repayment for the loan will decrease, so that they can increase their future return (Hypothesis 2). There are several empirical studies in the previous literature which support this theory. Pellenyi and Bilek (2009) found that foreign currency borrowers in Hungary were likely to believe that depreciation can decrease the cost of taking out loans in the local currency. On the other hand, there is the possibility that expectations do not affect choices of loan currency. Fidrmuc et al. (2013) did not find strong evidence of effects of expectation for depreciation on foreign currency borrowing, while Beckman & Stix (2015) found that lower financial literacy, in particular lower recognition of exchange rate risk weakened the effect of expectation of exchange rate changes.
As will be shown in a later section, Cambodian households are living in an environment of multiple currency co-circulation, where households receive income and hold their financial assets in multiple currencies. Thus, the value of their income or financial assets would vary along with exchange rate fluctuation. They are, therefore, inherently exposed to the risk of exchange rate changes. This environment would motivate Cambodian households to engage in risk-hedging behavior.
In the vein of the portfolio view, interest rate differentials between FX and local currency loans are also found as a significant factor (Ize and Levy-Yetagi, 2003). A previous empirical study confirmed that country-level interest rate differentials significantly affect the borrower’s choice of currency (Fidrmuc et al., 2013). However, since the present paper only deals with a study case of a single country, the country-
83
level interest rate differentials are supposed to uniformly affect all borrowers in Cambodia. Thus, we do not explicitly handle the interest rate differentials in the present paper.5
2.3 Heterogeneity in Risk-Hedging Behavior Against Exchange Rate Risks Previous studies point out that household behaviors are complicated to explain, and
theoretical models often fail to fit in real data in both of developing and developed countries. Recent previous studies have argued that financial literacy is a key to solve the complication of household behaviors (Lusardi and Mitchell, 2014). Disney and Gathergood (2013) empirically find that households with poor understanding of price of consumer credit are likely to have costly consumer credits. In the literature of dollarization, Beckman and Stix (2015) point out that financial literacy about exchange rate risks play a significant role in choice of currency in borrowing. Specifically, they argue that financially literate households are likely to behave as a theoretical model predicts. Then they empirically demonstrate that within households which expect for depreciation of foreign currency, those with better knowledge about exchange rate risks tend to borrow in foreign currency. Their findings suggest that lack of financial knowledge is also a determinant of choice of currency in borrowing.
As the previous literature of household finance suggests, financial decision-making is subject to the behavioral biases (Cole et al. 2014). Odajima & Khou (2017) find that some households might borrow in FX currency for the reason that they use FX currency in payments. His finding suggests that a portion of Cambodian households do not necessarily take loans for the risk-hedging purpose. There is likely to be heterogeneity in risk-taking behaviors, because of behavioral biases and financial literacy.
We expect that financial literacy also can explain the household risk hedging behaviors in choice of currency. Specifically, we formulate the hypothesis that households are more likely to choose a loan currency which has a larger share in their income or assets if their financial literacies are higher (Hypothesis 3). Although Beckman and Stix (2015) examine if households choose a currency which are households expect a higher return, our interest is whether or not Cambodian households choose a loan currency which supposed to minimize risks, and why.6 Furthermore, we conjecture that, when borrowing, low literate households would be likely to choose a currency which they use to purchase goods, rather than a currency which dominates their income or savings (Hypothesis 4). As we will describe later, the FX currency is widely used even in payments for goods for Cambodian households. Since lower financially literate households are likely short-sighted (myopic), then their choices of currency in borrowing is possibly more linked to the currency for purchase without considering currency mismatch risk between income/asset and debts.
5 Nevertheless, the interest rate differentials could differ among lenders and among regions even within a single country. We control for the potential effect of interest rate differential by setting the lender dummies and region dummies in the analysis. 6 In our empirics, we also attempted to test the relationship between expectations of depreciation and financial literacy, as Beckman and Stix (2015) did. However, we found that the number of households answered to the question of future exchange rate was low in our sample, probably because in general Cambodian households are less financially literate and also due to long-lasting stable exchange rates in Cambodia. Thus, we do not examine the differential effect of financial literacy on expectation of depreciation in this paper.

84
In sum, we test the following four hypotheses:
H1. Households would choose FX (local) currency in a loan, if FX (local) currency has a larger share in the income or assets.
H2. Economic agents would choose the currency in loans which is expected to depreciate in the future.
H3. Households are more likely to be engaged in risk-hedging behaviors if their financial literacies are higher.
H4. Low financially literate households would likely choose a currency which they commonly use to purchase goods, rather than a currency which have a large share in their income streams or savings.
Our paper has an advantage of testing household risk-hedging behavior over previous studies for several reasons. First, while Fidrmuc et al. (2013) simply used the dummy variable as a proxy for whether having foreign currency income or not, our dataset allows us to use a detailed currency composition of income, financial assets, and also expenditure. Second, , the previous studies mostly dealt with central and eastern European countries, where dollarization/euroization has been prevalent mainly in households’ loans and deposits. Meanwhile, the dollarization is also prevalent in income and expenditure sides in the case of Cambodia. Lastly, the regulatory framework of Cambodia has an advantage to study household’s behavior in a dollarized enviroment since in fact there is no restriction on providing FX deposits and FX loans for financial institutions in Cambodia. Several European countries pose some restrictions on FX loans and FX deposits (Brown et al., 2011). Such regulatory framework with some restrictions may affect and bias the borrower’s dicisions, and makes it difficult to analyze factors affecting currency choice including the risk-hedging behaviors of other economic agents. Thus, studying the Cambodian case is suitable for testing our hypotheses on FX borrowing for households.
3. Data Description We employ survey-based data which was collected under the joint project carried out by JICA
Research Institute (JICA-RI) and National Bank of Cambodia (NBC) from October 2014 to January 2015. In this survey, 2,273 households from all of 25 provinces were sampled in a random manner.7 The survey questionnaire covers several economic activities and financial activities, such as income, expenditure, savings and borrowings, and breakdowns of those items by currencies as of the end of September 2014.8 Furthermore, it includes attributes of households, such as education levels, ages of household heads, and perceptions about future exchange rates.
The information on outstanding loans is covered in the survey. Out of a total 2,273 respondents, 674 outstanding loans were identified from 634 households (about a third of all samples). The survey data on outstanding loans covers current outstanding amounts, information on interest rates, duration, types of lenders, choices of loan currency, and the initial amount of the loan. The detailed information on outstanding loans enables us to investigate the borrowing behavior of households at loan-level data, and to find factors relating to the choice of borrowing currency.
7 For the detail of the survey description, see Odajima & Khou (2017). 8 The questionnaire is available on request.
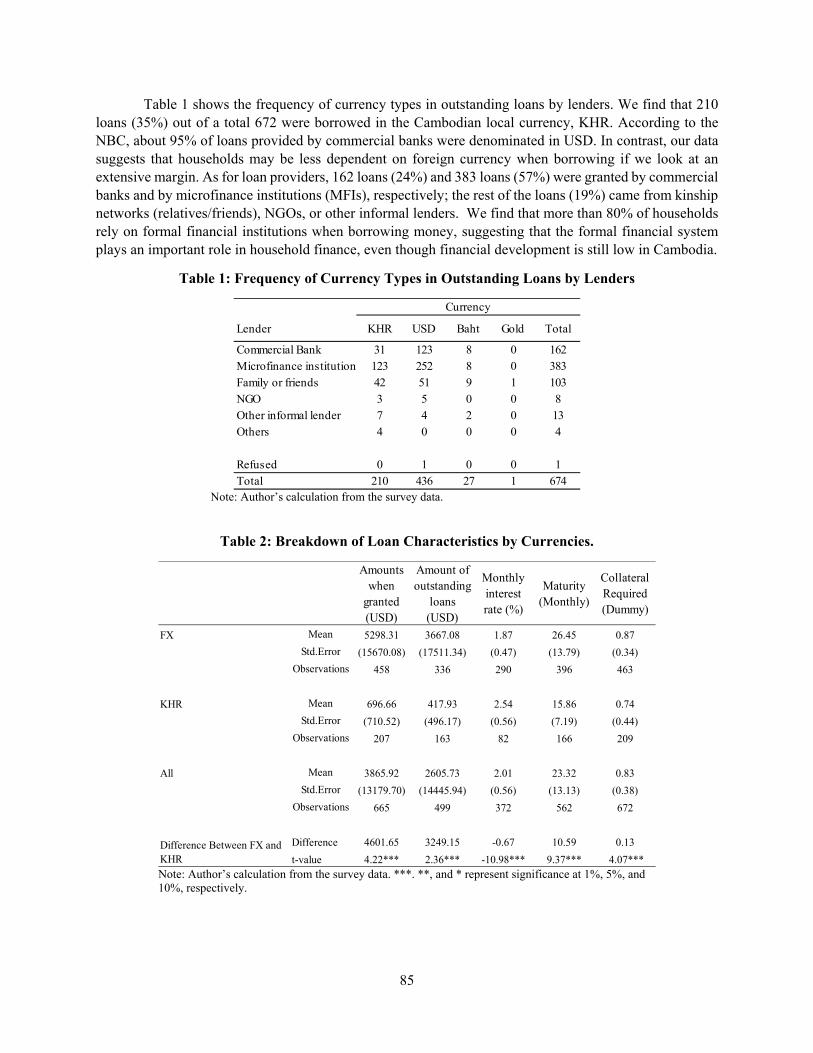
85
Table 1 shows the frequency of currency types in outstanding loans by lenders. We find that 210 loans (35%) out of a total 672 were borrowed in the Cambodian local currency, KHR. According to the NBC, about 95% of loans provided by commercial banks were denominated in USD. In contrast, our data suggests that households may be less dependent on foreign currency when borrowing if we look at an extensive margin. As for loan providers, 162 loans (24%) and 383 loans (57%) were granted by commercial banks and by microfinance institutions (MFIs), respectively; the rest of the loans (19%) came from kinship networks (relatives/friends), NGOs, or other informal lenders. We find that more than 80% of households rely on formal financial institutions when borrowing money, suggesting that the formal financial system plays an important role in household finance, even though financial development is still low in Cambodia.
Table 1: Frequency of Currency Types in Outstanding Loans by Lenders
Currency
Lender KHR USD Baht Gold Total
Commercial Bank 31 123 8 0 162Microfinance institution 123 252 8 0 383
Family or friends 42 51 9 1 103
NGO 3 5 0 0 8Other informal lender 7 4 2 0 13
Others 4 0 0 0 4
Refused 0 1 0 0 1
Total 210 436 27 1 674 Note: Author’s calculation from the survey data.
Table 2: Breakdown of Loan Characteristics by Currencies.
Amounts when
granted (USD)
Amount of outstanding
loans (USD)
Monthly interest rate (%)
Maturity (Monthly)
Collateral Required (Dummy)
FX Mean 5298.31 3667.08 1.87 26.45 0.87
Std.Error (15670.08) (17511.34) (0.47) (13.79) (0.34)
Observations 458 336 290 396 463
KHR Mean 696.66 417.93 2.54 15.86 0.74
Std.Error (710.52) (496.17) (0.56) (7.19) (0.44)
Observations 207 163 82 166 209
All Mean 3865.92 2605.73 2.01 23.32 0.83
Std.Error (13179.70) (14445.94) (0.56) (13.13) (0.38)
Observations 665 499 372 562 672
Difference 4601.65 3249.15 -0.67 10.59 0.13
t-value 4.22*** 2.36*** -10.98*** 9.37*** 4.07***Difference Between FX and KHR Note: Author’s calculation from the survey data. ***. **, and * represent significance at 1%, 5%, and 10%, respectively.
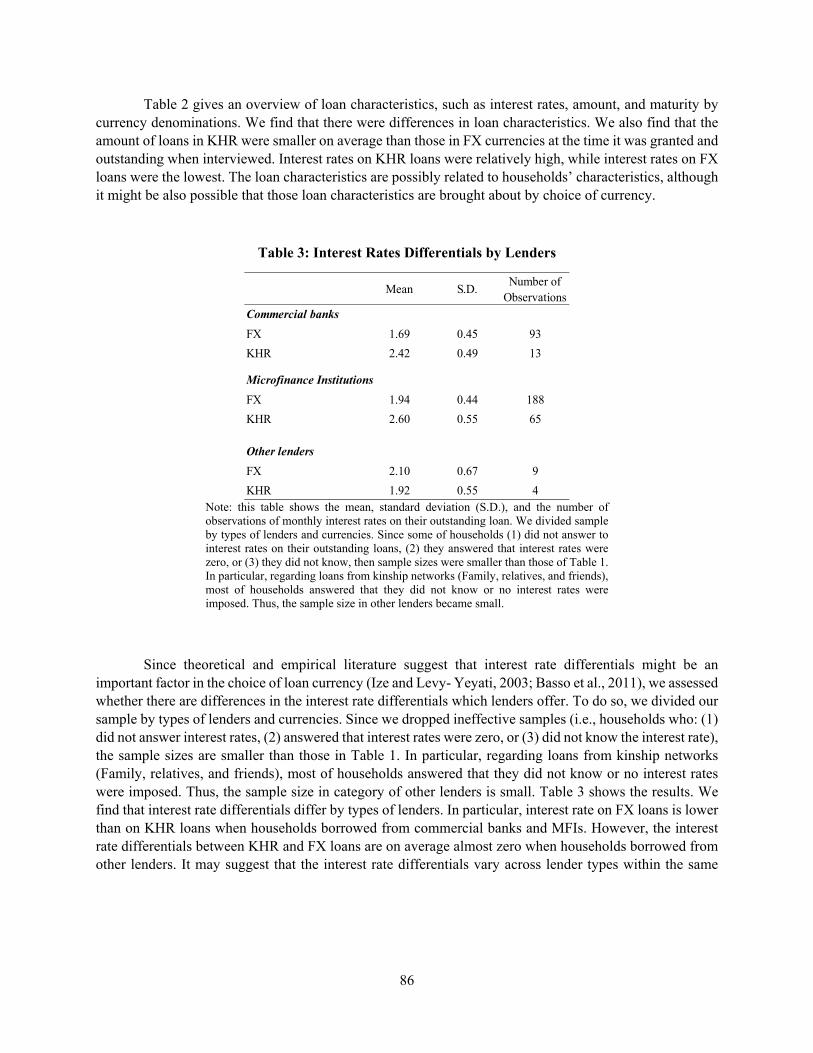
86
Table 2 gives an overview of loan characteristics, such as interest rates, amount, and maturity by currency denominations. We find that there were differences in loan characteristics. We also find that the amount of loans in KHR were smaller on average than those in FX currencies at the time it was granted and outstanding when interviewed. Interest rates on KHR loans were relatively high, while interest rates on FX loans were the lowest. The loan characteristics are possibly related to households’ characteristics, although it might be also possible that those loan characteristics are brought about by choice of currency.
Table 3: Interest Rates Differentials by Lenders
Mean S.D.Number of
ObservationsCommercial banksFX 1.69 0.45 93
KHR 2.42 0.49 13
Microfinance InstitutionsFX 1.94 0.44 188
KHR 2.60 0.55 65
Other lendersFX 2.10 0.67 9
KHR 1.92 0.55 4 Note: this table shows the mean, standard deviation (S.D.), and the number of observations of monthly interest rates on their outstanding loan. We divided sample by types of lenders and currencies. Since some of households (1) did not answer to interest rates on their outstanding loans, (2) they answered that interest rates were zero, or (3) they did not know, then sample sizes were smaller than those of Table 1. In particular, regarding loans from kinship networks (Family, relatives, and friends), most of households answered that they did not know or no interest rates were imposed. Thus, the sample size in other lenders became small.
Since theoretical and empirical literature suggest that interest rate differentials might be an important factor in the choice of loan currency (Ize and Levy- Yeyati, 2003; Basso et al., 2011), we assessed whether there are differences in the interest rate differentials which lenders offer. To do so, we divided our sample by types of lenders and currencies. Since we dropped ineffective samples (i.e., households who: (1) did not answer interest rates, (2) answered that interest rates were zero, or (3) did not know the interest rate), the sample sizes are smaller than those in Table 1. In particular, regarding loans from kinship networks (Family, relatives, and friends), most of households answered that they did not know or no interest rates were imposed. Thus, the sample size in category of other lenders is small. Table 3 shows the results. We find that interest rate differentials differ by types of lenders. In particular, interest rate on FX loans is lower than on KHR loans when households borrowed from commercial banks and MFIs. However, the interest rate differentials between KHR and FX loans are on average almost zero when households borrowed from other lenders. It may suggest that the interest rate differentials vary across lender types within the same
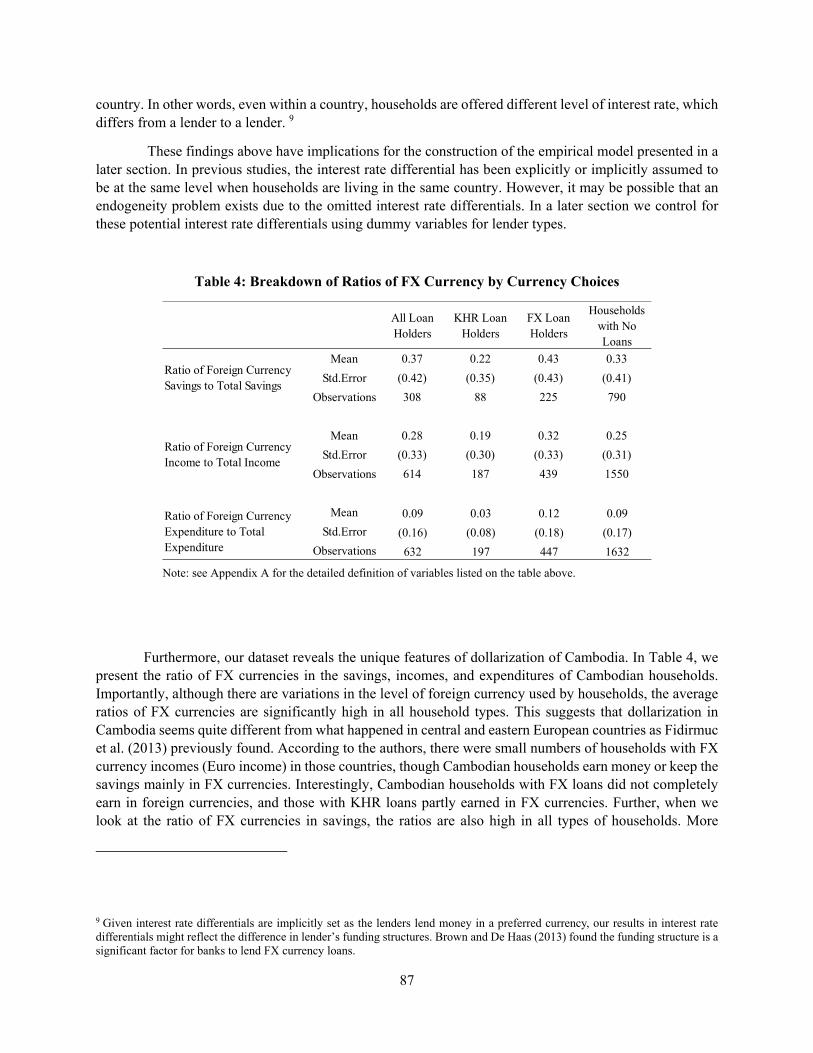
87
country. In other words, even within a country, households are offered different level of interest rate, which differs from a lender to a lender. 9
These findings above have implications for the construction of the empirical model presented in a later section. In previous studies, the interest rate differential has been explicitly or implicitly assumed to be at the same level when households are living in the same country. However, it may be possible that an endogeneity problem exists due to the omitted interest rate differentials. In a later section we control for these potential interest rate differentials using dummy variables for lender types.
Table 4: Breakdown of Ratios of FX Currency by Currency Choices
All Loan Holders
KHR Loan Holders
FX Loan Holders
Households with No Loans
Mean 0.37 0.22 0.43 0.33
Std.Error (0.42) (0.35) (0.43) (0.41)
Observations 308 88 225 790
Mean 0.28 0.19 0.32 0.25
Std.Error (0.33) (0.30) (0.33) (0.31)
Observations 614 187 439 1550
Mean 0.09 0.03 0.12 0.09
Std.Error (0.16) (0.08) (0.18) (0.17)
Observations 632 197 447 1632
Ratio of Foreign Currency Savings to Total Savings
Ratio of Foreign Currency Income to Total Income
Ratio of Foreign Currency Expenditure to Total Expenditure
Note: see Appendix A for the detailed definition of variables listed on the table above.
Furthermore, our dataset reveals the unique features of dollarization of Cambodia. In Table 4, we present the ratio of FX currencies in the savings, incomes, and expenditures of Cambodian households. Importantly, although there are variations in the level of foreign currency used by households, the average ratios of FX currencies are significantly high in all household types. This suggests that dollarization in Cambodia seems quite different from what happened in central and eastern European countries as Fidirmuc et al. (2013) previously found. According to the authors, there were small numbers of households with FX currency incomes (Euro income) in those countries, though Cambodian households earn money or keep the savings mainly in FX currencies. Interestingly, Cambodian households with FX loans did not completely earn in foreign currencies, and those with KHR loans partly earned in FX currencies. Further, when we look at the ratio of FX currencies in savings, the ratios are also high in all types of households. More
9 Given interest rate differentials are implicitly set as the lenders lend money in a preferred currency, our results in interest rate differentials might reflect the difference in lender’s funding structures. Brown and De Haas (2013) found the funding structure is a significant factor for banks to lend FX currency loans.
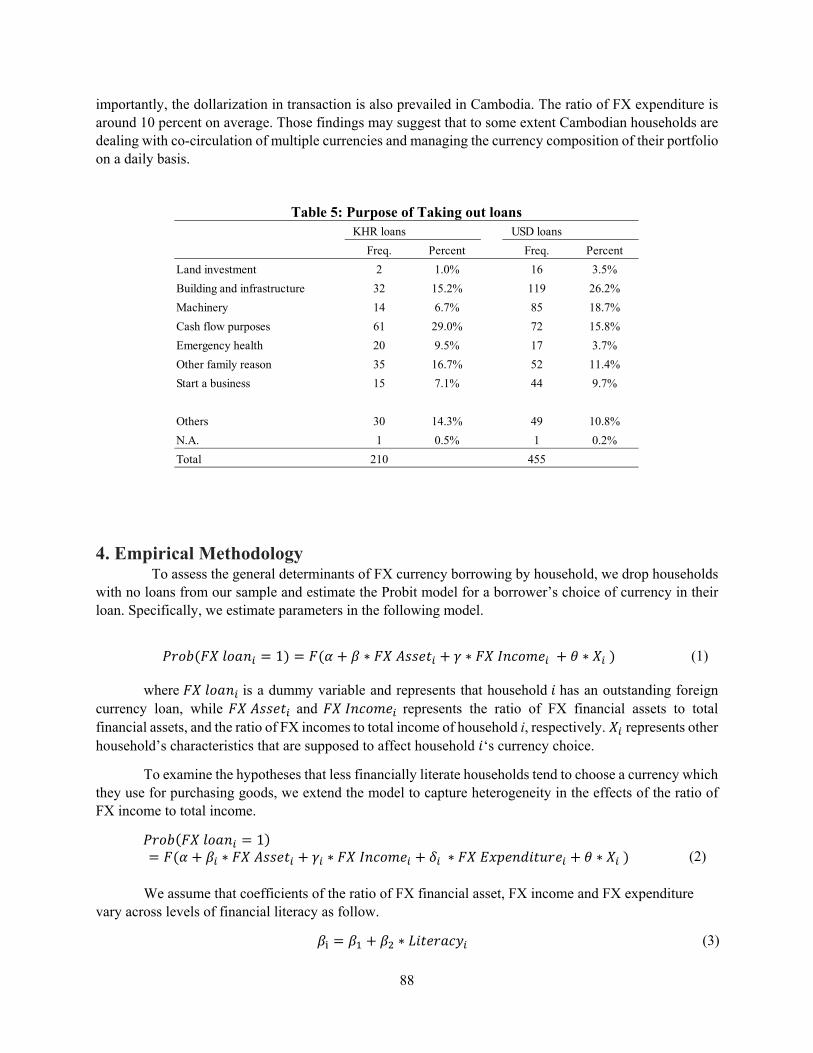
88
importantly, the dollarization in transaction is also prevailed in Cambodia. The ratio of FX expenditure is around 10 percent on average. Those findings may suggest that to some extent Cambodian households are dealing with co-circulation of multiple currencies and managing the currency composition of their portfolio on a daily basis.
4. Empirical Methodology To assess the general determinants of FX currency borrowing by household, we drop households
with no loans from our sample and estimate the Probit model for a borrower’s choice of currency in their loan. Specifically, we estimate parameters in the following model.
1 ∗ ∗ ∗
(1)
where is a dummy variable and represents that household has an outstanding foreign
currency loan, while and represents the ratio of FX financial assets to total financial assets, and the ratio of FX incomes to total income of household i, respectively. represents other household’s characteristics that are supposed to affect household ‘s currency choice.
To examine the hypotheses that less financially literate households tend to choose a currency which they use for purchasing goods, we extend the model to capture heterogeneity in the effects of the ratio of FX income to total income.
1 ∗ ∗ ∗ ∗
(2)
We assume that coefficients of the ratio of FX financial asset, FX income and FX expenditure vary across levels of financial literacy as follow.
∗ (3)
Table 5: Purpose of Taking out loans KHR loans USD loans
Freq. Percent Freq. Percent
Land investment 2 1.0% 16 3.5%
Building and infrastructure 32 15.2% 119 26.2%
Machinery 14 6.7% 85 18.7%
Cash flow purposes 61 29.0% 72 15.8%
Emergency health 20 9.5% 17 3.7%
Other family reason 35 16.7% 52 11.4%
Start a business 15 7.1% 44 9.7%
Others 30 14.3% 49 10.8%
N.A. 1 0.5% 1 0.2%
Total 210 455

89
∗
(4)
∗
(5)
where represents the level of financial literacy for household i. In estimation, we use interaction terms to capture the effect of financial literacy on the coefficients of , and . In our hypothesis, better literate households are more likely to be engaged in a risk hedging behavior. Thus, we expect 0, 0, and 0, which means that and are higher and is lower for better literate households. We compare the marginal effects of those variables at means for lower financially literate households with those for higher financially literate households.
Based on models above, we examine whether Cambodian households behave in a way that they aim to maximize their expected return and whether they are engaged in risk-hedging behavior in borrowing transactions. We test the relationships between foreign currency borrowing and the expected value of the exchange rate in the future. We also test whether households are engaged in risk hedging behavior by matching the currency composition of income and/or financial assets with that of loans.
To test the effects of expectations for the future exchange rate changes on choice of borrowing currency, we use a quantitative measure of the respondent’s perception to the question: “In 6 months from now, what do you think the USD/KHR exchange rate will be?” We use a dummy variable which takes one if the respondents answered more than 4100 KHR, and the dummy is supposed to represent depreciation in local currency if it takes one.10 We expect that if their expectation for the future exchange rate of the KHR to USD is to depreciate, the probability of taking out a foreign currency loan would also be higher. Presumably, depreciation of the local currency would make it more attractive for households to take out local currency loans. However, probably in part due to the relatively stable exchange rate in Cambodia of late, the number of respondents who answered the exact value of the future exchange rate was low. Thus, we include the dummy variable which takes one if the respondents answered “Don’t know” to the question above. Beckman and Stix (2015) find a significantly negative correlation between expectation of depreciation in local currency and the foreign currency borrowing behavior of households in Central and Eastern European countries.
In order to test whether the choice of foreign currency loans is a consequence of hedging behavior, we match the currency in loans with the currency composition of the respondents’ financial assets and income stream. If the households wish to reduce the risk of exchange rate fluctuations on assets, they would borrow in the currency which makes the largest part of their assets so as to reduce the default risks. To test this hypothesis, we include the proportion of foreign currency savings to total savings and the proportion of foreign currency income to total income in the model. 11 We expect positive values in the coefficients of ratios of foreign currency in savings and in that of income streams, if households are risk averse and, thus,
10 The exchange rate of KHR to USD was 4076 KHR/USD at the end of October, 2014, and it was 4060 KHR/USD at the end of January, 2015. 11 Also, savings can be interpreted as the current liquid assets for payment of debt. The ratio of foreign currency income may be correlated to the currency composition of any future income stream and can be interpreted as a proportion of the foreign currency in future assets.
90
optimize their portfolio in terms of returns and risk as predicted by the theoretical models of the portfolio view.
As well as the question about exchange rate change, we found that 307 out of 634 households with loans reported that they had no savings at the time they were interviewed. To avoid reducing the sample size, we set the variable of proportion of FX savings as zero values if the households had no savings, and we included a dummy variable which takes the value one if the household had no savings in explanatory variables. By doing so, the samples which have no savings can be included and the selection bias can be reduced.
We use education levels as a proxy variable for the financial literacy levels of household, since the dataset does not include the variables which directly measure the financial literacy. Even though the education level is not necessarily equivalent to financial literacy level, Lusardi and Mitchell (2014) and Beckman and Stix (2015) provide empirical evidences that financial literacy about exchange rate changes is correlated with education levels12. In our data, there is the information of education attainments of household heads. We categorize the education attainments of household’s heads into two levels: a low level of education, which represents “no schooling;” “primary school,”; a high level of education, which represents households which attained “secondary school;” “high school,” “a bachelor degree,” or higher. However, in some cases, respondents were not the head of the household but were the wife or another member of the household, and therefore some households answered “Don’t know” to the question about educational attainments of their household head. We drop those households which answered “Don’t know” from the sample.
Following the previous literature on foreign currency borrowing by households, we estimate the possible effects of a household’s other demographic and economic characteristics, such as income level, age, and self-employee (business ownership) on probability of borrowing in foreign currency (Pellényi and Bilek, 2009; Beer et al., 2010; Fidrmuc et al., 2013; Beckman and Stix, 2015). We include the logarithm of total income, older dummy which represent whether a household head is older than 40, and self-employee dummy.
In order to capture the effect of types of lenders, we also include a dummy variable which takes one if households borrowed from formal financial institutions, that is, commercial banks and MFIs. Even though previous papers emphasize country-level interest rate differentials (Fidrmuc et al., 2013), there could be difference in the extent of interest rate differentials among lenders. As pointed out by Basso et al. (2011), lenders could use the interest rate differentials as one of instruments to give borrowers an incentive to choose a currency which lenders prefer to lend loans in. In other words, the lenders could encourage borrowers to choose the currency which the lenders prefer by offering lower interest rates on loans in the currency.13 In Cambodia, the formal financial institutions seem to offer lower interest rates on foreign currencies than local currency as seen in the earlier section. Therefore, households should be motivated to borrow in foreign currencies if they borrowed from formal financial institutions, as other else equal. Although Fidrmuc et al. (2013) conducted international comparative studies and found evidence that
12 Several studies also find that general knowledge level (educational attainments) and specific knowledge (financial literacy) both affect the financial decision (Lusardi and Mitchell, 2011; Lusardi and de Bassa Scheresberg, 2013). 13 Compared to kinship networks or informal lenders, formal financial institutions collect fund from a wide range of areas inside and outside the country in the forms of deposits, borrowings, and equity. Thus, their liabilities are prone to be dominated in US dollars, and fear of currency mismatch makes them to provide loans in a foreign currency.
91
household’s choices of currency are dependent on the country-level interest rate differentials. However, no previous studies have considered the fact that interest differentials differ across lender type possibly because of their different funding structures. Our specification is supposed to reduce the bias associated with the interest rate differentials at individual lender-level.
Since the development of financial infrastructure and the structure of major economic activities are different from urban to rural areas, their preference with regard to currency choice may be also different. We also control for the region-specific effect by using region dummies. Our region dummies are defined at province level in accordance to National Institute of Statistics (NIS), Cambodian national statistical office.14
5. Empirical Results 5.1 Baseline Models
Before we present the results with interaction terms with education levels, we show the results of regression without interaction terms as baseline results, in order to see simple relationship between explanatory variables and choices of a loan currency, and to compare our results in Cambodia with prior studies in European countries, such as Pellényi and Bilek (2009), Beer et al. (2010), Fidrmuc et al. (2013) and Beckman and Stix (2015). Table 6 shows the results of estimated coefficients of the equation (1) and presents the marginal effects of each explanatory variable at a mean value. From column (1) to (6), we present the results of various combinations of shares of FX currency in savings, income, and expenditure. In order to control a potential residual correlation within regions, we estimated all specifications with a clustered estimator of standard errors at province-level. We find that some of respondents reported too large amount of total income. In the estimation, we winsorized the sample at 1% of the distribution of total income to reduce the bias from outliers. Then, the size of final sample is reduced to 617. The variables used in the regressions are defined in Appendix A, and the descriptive statistics and the correlation matrix are reported in Appendix B and C, respectively.
First, we find that the ratio of FX currency in income is statistically significantly associated with the likelihood of borrowing in foreign currency. This result support the hypothesis that households are likely to match the currency composition of loans with assets and income stream for risk-hedging against exchange rate risks (Hypothesis 1).15 However, the statistical significance of the ratio of FX savings disappeared in column 6. It may suggest that, rather than the currency in savings, households are likely to borrow in a currency which has large shares in their income stream. Given most of households in Cambodia are relatively poor, it might be more important to adjust the loan currency to the currency in income stream than current financial assets. Or we might interpret that household with outstanding loans has not much
14 There are four administrative division levels in Cambodia: the province, district, commune, and village levels. Provinces are first-level administrative divisions in Cambodia, and as of the end of 2014, there are 25 provinces. 15 In this analysis, the households with loans are exclusively selected. There is a possibility that households with loans are likely to be more rational than households without loans. Thus, rational households could be selected in the sample. And our sample is concentrated in the urban area. Thus, there is also a potential bias toward rational households. Therefore, there is a caveat when interpreting the results.
92
saving so as to use it as effective hedging measure for loans. They normally borrow money because of shortage of normal financial assets.
We next find that expectation of depreciation of local currency is significantly negative in all specifications except as in column 1. The results in general are in line with the one of the hypothesis of the portfolio view (Hypothesis 2) and confirm with previous empirical findings by Beckman and Stix (2015). Note that the model in column 1 lacks significant variables, such as ratios of income and expenditure, which might reduce the significance of the expectation of depreciation in column 1. The results in column 2-6 mean that households tended to take out local currency loans if they expected for exchange rates of KHR/USD to rise in the future. These results are in line with the one of hypotheses of the portfolio view (Hypothesis 2), and in line with previous empirical findings by Beckman and Stix (2015). It may suggest that Cambodian households are quite rational and choose the currency in borrowing to maximize their future return on portfolio. In other words, the conventional theoretical model also fits in the borrowing behaviors of Cambodian households. Furthermore, the economic impact of the expectation of depreciation is also large. If households expect for depreciation in the future, the likelihood of borrowing in foreign currency decrease by around 20%. This result also indicates that the expectation of exchange rates is a significant factor to explain loan dollarization in the household sector.
The ratio of FX currency in expenditure was also statistically significant and positively correlated to currency choice of a loan (column 3, 5 and 6). The results are in line with Fidrmuc et al. (2013) and Beckman and Stix (2015).16 Interestingly, this result cannot be explained by the theoretical models of the portfolio view. Apart from risk-hedging behaviors and expectation of depreciation, the currency which they use for purchase of goods is also a significant factor to explain the household behaviors in FX borrowing.
Regarding other dependent variables, the logarithm of total income is significantly positive in all specifications, and the economic impact of change in this variable is strong. We find that a standard-deviation increase in this variable (1.125) leads to about a-9-percentage-point increase in the likelihood of taking out foreign currency loans. The results suggest that income level is crucial for explaining foreign currency borrowing. In the study cases of other countries, Fidrmuc et al. (2013) did not find the significant correlation between income levels and FX borrowing in the EU or weakly euroized countries, while they found the strong correlation in non-EU or strongly euroized countries. Cambodia is also a strongly dollarized country, and our finding is in line with Fidrmuc et al. (2013). Since euorized or non-EU countries likely have immature financial system as well as Cambodia, this finding is also interesting and may have important policy implication. Assuming that households with higher income level generally borrow the larger amounts, this results might reflect that those richer households choose FX currency loan to obtain large funds due to the limitation on amounts of loans they are able to borrow in local currency.17 In other words, imperfection in the financial market might cause difficulty in borrowing large amounts of money in local currency.
16 Their variable is household’s perception of the usage of foreign currency in daily transaction, and not the direct measure of FX expenditure of households. However, currency usage in transaction is affected by transactions of other households. 17 Jeanne (2000) and Brown, Ongena, & Yeşin (2014) constructed the theoretical model to incorporate market imperfection by modeling information asymmetry in the currency composition of income between lender and borrowers. They demonstrated that the economic agents with local currency also have an incentive to apply to foreign currency loans to signal that they have an ability to repay debt.

93
We also find that dummy for rural areas is significant and negative in all specifications, meaning that households living in rural areas tends to choose local currency, even if the FX shares in income, savings, or expenditures are controlled. It may suggest that difference in conditions on access to financial institutions affects the household’s choices. Furthermore, the dummy for types of lenders are also significant in all specification. It may suggest that formal financial institutions discourage borrowers from taking out local currency loans, possibly by offering higher interest rates or by setting other disadvantages in local currency loans. 18
Table 6: Estimation Results of Baseline Models (1) (2) (3) (4) (5) (6)
Ratio of FX Savings 0.145** 0.114* 0.093
(0.06) (0.06) (0.06)
Ratio of FX Income 0.230*** 0.217*** 0.197*** 0.188***
(0.07) (0.07) (0.07) (0.07)
Ratio of FX Expenditure 0.749*** 0.665** 0.639**
(0.29) (0.27) (0.27)
Higher in Education Level 0.102* 0.106** 0.075 0.103** 0.076 0.074
(0.05) (0.05) (0.05) (0.05) (0.05) (0.05)
No Saving Dummy 0.015 0.019 0.017
(0.05) (0.05) (0.05)
Log. Total Income 0.088*** 0.084*** 0.081*** 0.082*** 0.076*** 0.075***
(0.02) (0.02) (0.02) (0.02) (0.02) (0.02)
Expectation for Depreciation -0.173 -0.228** -0.190* -0.219** -0.231** -0.223**
(0.11) (0.10) (0.11) (0.10) (0.10) (0.10)
Don't Know (Exchange rates) -0.013 -0.020 -0.016 -0.016 -0.018 -0.014
(0.05) (0.05) (0.05) (0.05) (0.05) (0.05)
Self Employee 0.021 0.048 0.015 0.050 0.046 0.047
(0.06) (0.06) (0.06) (0.06) (0.07) (0.07)
Older (More than 40) 0.014 0.008 -0.000 0.017 0.005 0.013
(0.04) (0.04) (0.04) (0.04) (0.04) (0.04)
Rural Dummy -0.116*** -0.117*** -0.104** -0.110*** -0.100** -0.095**
(0.04) (0.04) (0.04) (0.04) (0.04) (0.04)
Borrowed from formal FI 0.204*** 0.206*** 0.220*** 0.201*** 0.214*** 0.208***
(0.04) (0.05) (0.04) (0.05) (0.05) (0.05)
Province Dummies Yes Yes Yes Yes Yes Yes
Observations 553 545 553 545 543 543
18 We also run the regression without the formal financial institution dummy. We find that the results are largely same as the results with this dummy variable.
94
Note: ***, **, * represent significance level at 1, 5, and 10 percent, respectively. The values in parenthesis represent the standard errors. In the estimation, we winsorized the sample at 1% of the distribution of total income to reduce the bias from outliers. Them, the size of final sample is
5.2 Effects of Education Level on Borrowing Behaviors From baseline models above, we confirmed that the currency composition of incomes and expenditures are both significant factors to explain the choice of a loan currency. However, why is loan currency also linked to the currency usage in purchase of goods? Risk-hedging behaviors against exchange rate risks cannot explain this linkage. Thus, we argue that the results might reflect that there are both households who manage to deal with currency mismatch risk and those who do not engage in risk-hedging in Cambodia. In other words, those results might come from the heterogeneity across households, in particular, across levels of financial knowledge. To further investigate the households’ behaviors, we examine two hypotheses as we described in an earlier section: (1) households with better financial literacy would be more likely to engage in risk-hedging behaviors (Hypothesis 3); (2) households with less financial literacy would be more likely to choose a loan currency which they commonly use for purchase of goods (Hypothesis 4).
To examine the hypotheses above, we estimated the equation (2) using education-level dummies for higher education level as a proxy for better financially literate households. In Table 7, we present the estimated marginal effect of each explanatory variable at a mean value. For ratios of FX currency in savings, income, and expenditure, we present the marginal effects when dummy for education level is 0 (low level) and 1 (high level), respectively, and other explanatory variables are at mean values. As well as baseline models, in order to control a potential residual correlation within regions, we estimated all specifications with a clustered estimator of standard errors at province levels. Since our assumption is that financial literacy indirectly affects the borrowing behaviors by affecting the intense of currency marching behaviors, our preferred results are column 1-3, which only include interaction terms of the education levels, and do not include dummy for education levels itself. However, in last three columns (column 4-6), we present the results which further include the dummy for education dummy in the regressors. We confirmed that statistical significances of results do not change even if we include the education dummy itself, and the direct effects of education level are not robust. As well as baseline results, we winsorized the sample at 1 % of the distribution of total income to reduce the biases from outliers before running the regression.
Interestingly, we find that effect of the ratio FX income is different between low and high in education levels. In the case of column 1, the marginal effect of the ratio of FX income for households with low education level is not significant and much lower than that for households with high education level. Furthermore, in all specification, the estimated marginal effects of the ratio of FX income for the better educated are higher than those for the lower educated. It means that better financially literate households tend to choose the currency in loans to match the currency composition of their income stream, while lower financially literate households do not take such a behavior. The results are in line with our hypothesis that financially literate households are more likely to engage in risk-hedging behaviors against the exchange rate risks (Hypothesis 3). However, the ratio of FX savings is not significant in all specifications, suggesting that even well-educated Cambodian households rather adjust currency of loans with income streams.
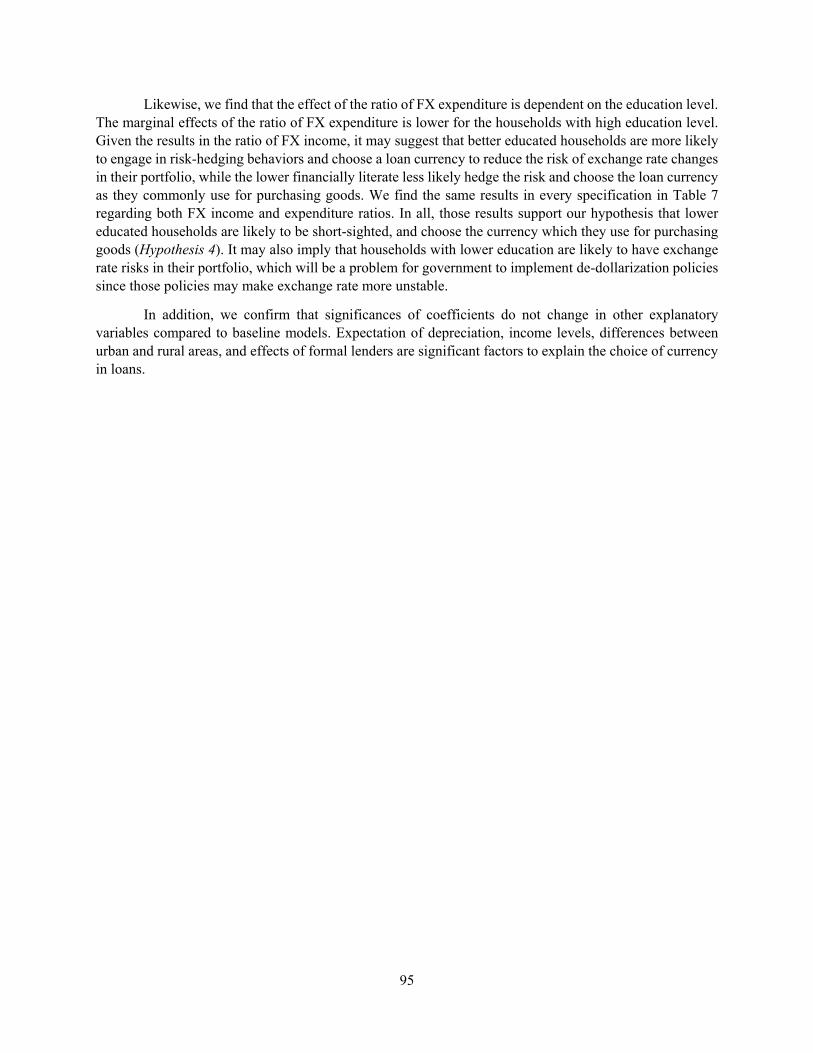
95
Likewise, we find that the effect of the ratio of FX expenditure is dependent on the education level. The marginal effects of the ratio of FX expenditure is lower for the households with high education level. Given the results in the ratio of FX income, it may suggest that better educated households are more likely to engage in risk-hedging behaviors and choose a loan currency to reduce the risk of exchange rate changes in their portfolio, while the lower financially literate less likely hedge the risk and choose the loan currency as they commonly use for purchasing goods. We find the same results in every specification in Table 7 regarding both FX income and expenditure ratios. In all, those results support our hypothesis that lower educated households are likely to be short-sighted, and choose the currency which they use for purchasing goods (Hypothesis 4). It may also imply that households with lower education are likely to have exchange rate risks in their portfolio, which will be a problem for government to implement de-dollarization policies since those policies may make exchange rate more unstable.
In addition, we confirm that significances of coefficients do not change in other explanatory variables compared to baseline models. Expectation of depreciation, income levels, differences between urban and rural areas, and effects of formal lenders are significant factors to explain the choice of currency in loans.
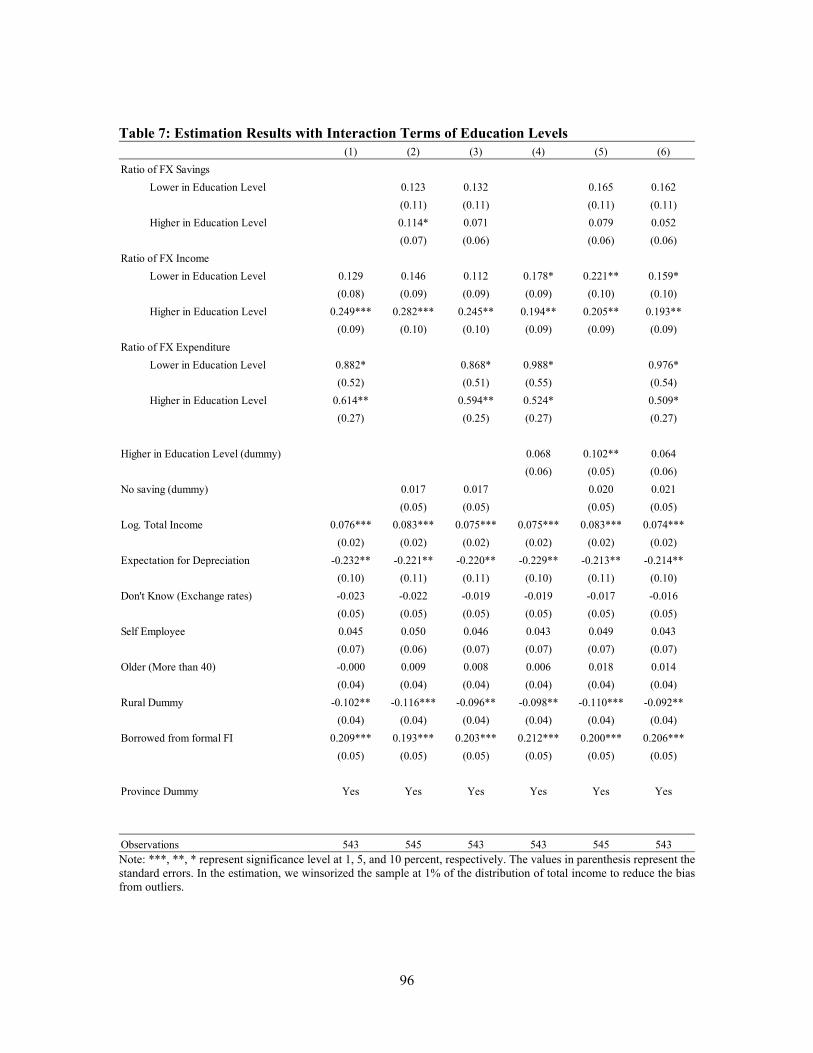
96
Table 7: Estimation Results with Interaction Terms of Education Levels (1) (2) (3) (4) (5) (6)
Ratio of FX Savings
Lower in Education Level 0.123 0.132 0.165 0.162
(0.11) (0.11) (0.11) (0.11)
Higher in Education Level 0.114* 0.071 0.079 0.052
(0.07) (0.06) (0.06) (0.06)
Ratio of FX Income
Lower in Education Level 0.129 0.146 0.112 0.178* 0.221** 0.159*
(0.08) (0.09) (0.09) (0.09) (0.10) (0.10)
Higher in Education Level 0.249*** 0.282*** 0.245** 0.194** 0.205** 0.193**
(0.09) (0.10) (0.10) (0.09) (0.09) (0.09)
Ratio of FX Expenditure
Lower in Education Level 0.882* 0.868* 0.988* 0.976*
(0.52) (0.51) (0.55) (0.54)
Higher in Education Level 0.614** 0.594** 0.524* 0.509*
(0.27) (0.25) (0.27) (0.27)
Higher in Education Level (dummy) 0.068 0.102** 0.064
(0.06) (0.05) (0.06)
No saving (dummy) 0.017 0.017 0.020 0.021
(0.05) (0.05) (0.05) (0.05)
Log. Total Income 0.076*** 0.083*** 0.075*** 0.075*** 0.083*** 0.074***
(0.02) (0.02) (0.02) (0.02) (0.02) (0.02)
Expectation for Depreciation -0.232** -0.221** -0.220** -0.229** -0.213** -0.214**
(0.10) (0.11) (0.11) (0.10) (0.11) (0.10)
Don't Know (Exchange rates) -0.023 -0.022 -0.019 -0.019 -0.017 -0.016
(0.05) (0.05) (0.05) (0.05) (0.05) (0.05)
Self Employee 0.045 0.050 0.046 0.043 0.049 0.043
(0.07) (0.06) (0.07) (0.07) (0.07) (0.07)
Older (More than 40) -0.000 0.009 0.008 0.006 0.018 0.014
(0.04) (0.04) (0.04) (0.04) (0.04) (0.04)
Rural Dummy -0.102** -0.116*** -0.096** -0.098** -0.110*** -0.092**
(0.04) (0.04) (0.04) (0.04) (0.04) (0.04)
Borrowed from formal FI 0.209*** 0.193*** 0.203*** 0.212*** 0.200*** 0.206***
(0.05) (0.05) (0.05) (0.05) (0.05) (0.05)
Province Dummy Yes Yes Yes Yes Yes Yes
Observations 543 545 543 543 545 543 Note: ***, **, * represent significance level at 1, 5, and 10 percent, respectively. The values in parenthesis represent the standard errors. In the estimation, we winsorized the sample at 1% of the distribution of total income to reduce the bias from outliers.

97
5.3 Robustness Check of Effect of Financial Literacy We found that there is heterogeneity in the risk-hedging behavior against currency mismatch risk
as mentioned before. The dummy for higher education, used for a proxy for level of financial literacy, is significantly and positively correlated to the degree of intensity of the risk-hedging behaviors. However, since some of previous studies point out that education levels do not necessarily reflect the financial literacy levels, we conducted a set of robustness checks using alternative proxy variables for financial literacy levels as we do not have direct measurement of the financial literacy.
It is well known that level of financial literacy affects people’s usage of several financial services. Using formal financial services involve nonpecuniary barriers, such as financial literacy (Claessen, 2006). Van Rooji et al. (2011) empirically demonstrated that financially literate people are more likely to participate in a stock market. In the context of developing countries, Honohan and King (2012) empirically find that financial knowledge is significantly correlated to whether or not having a bank account. Given the previous findings, as alternative variable we use (1) experience of borrowing in the past, (2) possession of bank account in financial institution, (3) experience in using formal bank transfer, or (4) possession of any type of financial assets. Detailed definitions of these variables are in Appendix A. We run the regression of the specification in column (1) in Table 7, using dummies for usage of these financial services instead of the dummy for higher education. The results are in in Table 8.
Regarding the proxies of financial literacy on the risk-hedging behaviors against exchange rate risks, we find the same significant results in all specifications as in Table 8. We find that borrowers with experience of using these financial services are likely to match the loan currency with the currency composition of income. In addition, the effect of ratio of FX expenditures is lower for those with the experience than for those without them. We confirm that our hypotheses are also supported by alternative proxy variables for financial literacy (Hypothesis 3 and 4).
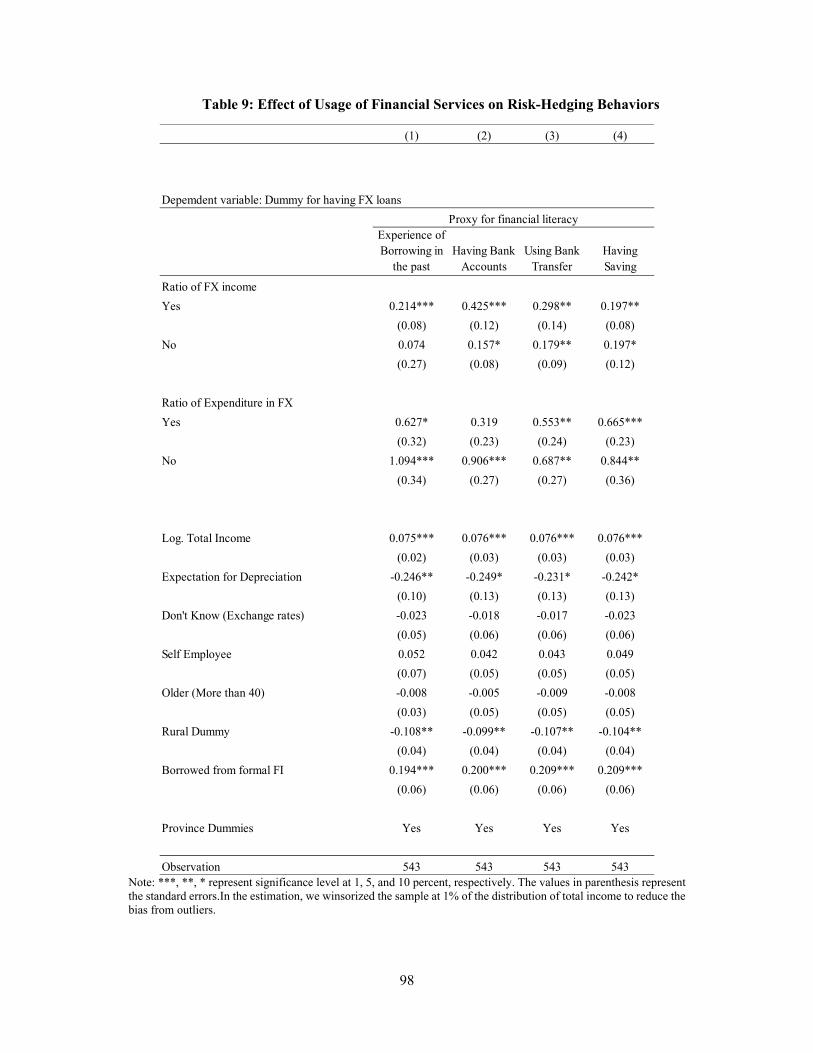
98
Table 9: Effect of Usage of Financial Services on Risk-Hedging Behaviors
(1) (2) (3) (4)
Experience of Borrowing in
the pastHaving Bank
AccountsUsing Bank
TransferHaving Saving
Ratio of FX income
Yes 0.214*** 0.425*** 0.298** 0.197**
(0.08) (0.12) (0.14) (0.08)
No 0.074 0.157* 0.179** 0.197*
(0.27) (0.08) (0.09) (0.12)
Ratio of Expenditure in FX
Yes 0.627* 0.319 0.553** 0.665***
(0.32) (0.23) (0.24) (0.23)
No 1.094*** 0.906*** 0.687** 0.844**
(0.34) (0.27) (0.27) (0.36)
Log. Total Income 0.075*** 0.076*** 0.076*** 0.076***
(0.02) (0.03) (0.03) (0.03)
Expectation for Depreciation -0.246** -0.249* -0.231* -0.242*
(0.10) (0.13) (0.13) (0.13)
Don't Know (Exchange rates) -0.023 -0.018 -0.017 -0.023
(0.05) (0.06) (0.06) (0.06)
Self Employee 0.052 0.042 0.043 0.049
(0.07) (0.05) (0.05) (0.05)
Older (More than 40) -0.008 -0.005 -0.009 -0.008
(0.03) (0.05) (0.05) (0.05)
Rural Dummy -0.108** -0.099** -0.107** -0.104**
(0.04) (0.04) (0.04) (0.04)
Borrowed from formal FI 0.194*** 0.200*** 0.209*** 0.209***
(0.06) (0.06) (0.06) (0.06)
Province Dummies Yes Yes Yes Yes
Observation 543 543 543 543
Depemdent variable: Dummy for having FX loans
Proxy for financial literacy
Note: ***, **, * represent significance level at 1, 5, and 10 percent, respectively. The values in parenthesis represent the standard errors.In the estimation, we winsorized the sample at 1% of the distribution of total income to reduce the bias from outliers.
99
6. Conclusion and Policy Implications Using the survey-based data, we examined the possible factors which were thought to induce
households to borrow in a foreign currency. Our study first attempted to investigate the determinants of household foreign currency borrowing behavior in Cambodia, as there have been no previous studies investigating dollarization in Asian countries at the household level. Furthermore, we used detailed information of currency composition of households’ financial activities compared to previous studies. Therefore, we believe our study can provide robust results and give insights for factors behind foreign currency borrowing of households.
Since its economy started to transition from a socio-planning economy to a market-oriented one in the early 1990s, Cambodia has suffered from deep dollarization. Dollarization in Cambodia shows different trend from other dollarized economies. Dollarization has been constantly growing despite its recent stable macroeconomic conditions. Thus, investigation on the factor of foreign currency usage in the Cambodian case is helpful to make appropriate administrative measures. There is, however, a scarcity of econometric studies that investigate this dollarization, particularly through uses of micro data. We therefore believe that our study also contributes to policy design of promotion of usage of local currency in Cambodia.
We found that Cambodian households are engaged in risk-hedging behaviors against exchange rate changes and likely to borrow in foreign currency if foreign currency makes up the major portion of their income stream. We also found that expectation of depreciation of local currency leads households to take out local currency loans in line with prediction from the previous theoretical model. Furthermore, we found that there is a heterogeneity in the intensity of risk-hedging behaviors. In particular, we found education level, and usage of financial literacy have significant effect on the intensity of risk-hedging behaviors. Our findings might suggest that the financial literacy has a potential to improve the risk-hedging behaviors for Cambodian households.
From the results of our study, we can draw some policy implications on dollarization issues and de-dollarization strategy for the household sector. Firstly, promotion of local loans should be implemented along with the promotions of wage payments in local currency. In the previous literature, Beer et al. (2010) empirically demonstrated that Hungarian households take out FX loans as the consequence of carry-trade behaviors. On contrary, our results suggest that some households take out FX loans for the purpose of risk-hedging against their FX income. Therefore, simply promoting those households to take out in local currency loans may incur currency mismatch risks on their balance sheets. Thus, the promotion of wage payments in local currency should be taken along with the promotion of local currency loans. In addition, our results also suggest that lower financially literate households are likely not to take out FX loans for risk-hedging purpose, but because they need FX currency to purchase goods. Therefore, reducing FX currency in households’ incomes and expenditures leads to shift toward local currency borrowing by households.
Secondly, government should facilitate financial literacy during the process of de-dollarization. Our findings highlight the importance of education relating to exchange rate risks on FX currency borrowing behaviors, i.e. financial literacy. In particular, in the case of Cambodia, the effect of financial literacy seems much important. We found that better educated households are more likely to choose a loan currency for the risk-hedging purposes, and lower educated households are not engaged in risk-hedging and seem to make short-sighted decision to choose a loan currency. Since it is expected that exchange rate will be more or less unstable after implementing the de-dollarization measures, the lower financially literate households would likely suffer from loss due to their currency mismatch in balance sheets. Therefore, for
100
pursuing a policy that promotes the use of KHR in loan, it may be necessary to enhance widespread financial literacy in order to make them to understand risk associated with net open position in longer term. Facilitating households to manage their portfolio helps reduce the damage of de-dollarization on the economy.
Thirdly, foreign currency borrowing behavior is related to a household’s expectations of future exchange rate changes. Households choose loans in an FX currency if they expect that the FX currency will depreciate, since repayments will be lower in the future. Households who provided answers on the future expected value of exchange rates are behaving rationally when taking out loans. Meanwhile, it may well say that the authority should reconsider the negative effect associated with current stable exchange rate since households tend to underestimate the exchange rate risk by the relatively stable KHR exchange rate, which hide the threats and risks of exchange rate fluctuations. It is a common phenomenon that economic agents underestimate the exchange rate risks related to foreign currency loans where local currency exchange rates are relatively stable (Fiorante 2011).
Lastly, dollarization of transaction might affect financial dollarization. In other words, if currency choice in payments for goods shift to foreign currency, foreign currency loan would become widespread. We argued that there is a possibility that currency usage in expenditure may also be linked to the currency choice in a loan, and in the empirical analysis, we found an evidence that lower educated households are likely to choose a loan currency which they use for purchase of goods. Currency choices in transactions are generally subject to network externalities, which induce the hysteresis in asset and transaction dollarization (Valve, 2010; Samreth, 2011). In other words, if the foreign currency is widely used and dominates the currency composition of expenditures for some households, the other households also tend to use foreign currency for the payments of goods. Accordingly, once the foreign currency starts to be used in payments, the currency choice of loans would possibly become foreign currency in the banking system. This expenditure channel to loan dollarization can be another factor to explain the hysteresis of dollarization in the Cambodia. The important implication for policy making is that government should reduce the foreign currency in expenditure to prevent the hysteresis of loan dollarization if the education level or financial literacy level is lower on the whole in a country.
However, there remain some limitations and challenges on our study. First, we used the dummy of education attainment as a proxy for the levels of financial literacy because of data limitation. Even though there might be the correlation among education attainments, usages of financial services, and levels of financial literacy, our results could reflect another potential effects relating to education levels apart from the effect of financial literacy. While measuring the financial literacy is complicated, using direct measure of financial literacy is required and to evaluate the actual effect of increment of financial literacy for the policy making. Second, we could not address the endogeneity issues in the regression between the actual choice of loan currency and household characteristics, as pointed out by Fidrmuc et al. (2013) and Beckman and Stix (2015). It is due to the limitation on the data availability in our study. Our data does not cover the household’s preference on currency in future borrowing. 19Third, we could not capture the potential borrowers in our model, in the sense that some of households might be discouraged or rejected despite their demand for loans. Some of variables relating a repayment ability or transparency, such as income level, could affect whether households are rejected or discouraged from accessing to loans, and tis sample
19 Nonetheless, because education attainment could be thought of as the exogenous in our setting, the estimated effect of the difference in education attainment on risk-hedging behaviors could at least reflect the causal link.

101
selection could cause biases. However, those potential biases might affect the results to underestimate the effects of the variables. In this regard, for income come levels, we found the consistently significant results in all specification despite the sample selection biases, although the other variables such as self-employee might be underestimated. Therefore, the future study on Cambodian household’s FX borrowing should address this issue.
Reference Aiba, Odajima, & Khou (2017). Foreign Currency Borrowing and Risk-Hedging Behaviors: Evidence from
a Household Survey in Cambodia. JICA-RI Working Paper No. 143.
Allayannis, G., Brown, G.W., & Klapper, L.F. 2003. Capital Structure and Financial Risk: Evidence from Foreign Debt Use in East Asia. Journal of Finance 58, 2667-2709.
Barajas, A., & Armando Morales, R. (2003). Dollarization of Liabilities: Beyond the Usual Suspects. IMF Working Paper No. 03/11 (January).
Basso, H. S., Calvo-Gonzales, O., & Jurgilas, M. 2007. Financial Dollarization: The Role of Banks and Interest Rates. ECB Working Paper No. 748 (May).
Basso, H.S., Calvo-Gonzales, O., & Jurgilas, M. 2011. Financial dollarization and the role of foreign owned banks and interest rates. Journal of Banking & Finance 35, 794–806.
Beckmann, E., & Stix, H. 2015. Foreign currency borrowing and knowledge about change rate risk. Journal of Economic Behavior & Organization 112, 1-16.0.
Beer, C., Ongena, S., & Peter, M. 2010. Borrowing in foreign currency: Austrian households as carry traders. Journal of Banking & Finance 34(9), 2198-2211.
Broda, C., & Levy Yeyati, E. 2006. Endogeonous Deposit Dollarization. Journal of Money, Credit and Banking 38 (4), 963-988 (June).
Brown, M., Ongena, S., & Yeşin, P. 2011. Foreign currency borrowing by small firms in the transition economies. Journal of Financial Intermediation 20(3), 285-302.
Brown, M., & Stix, H. 2014. The euroization of bank deposits in Eastern Europe. Economic Policy eiu002.
Brown, M., De Haas, R., & Sokolov, V. 2015. Regional Inflation and Financial Dollarization. Institute of Economic Research, Hitotsubashi University.
Brown, M., Kirschenmann, K., & Ongena, S. 2014. Bank Funding, Securitization, and Loan Terms: Evidence from Foreign Currency Lending. Journal of Money, Credit and Banking 46(7), 1501-1534.
Burnside, C., Eichenbaum, M., & Rebelo, S. 2001. Hedging and Financial Fragility in Fixed Exchange Rate Regimes. European Economic Review 45 (7), 1151-1193.
Csajbok, A., Hudecz, A., & Tamasi,B. 2010. Foreign Currency Borrowing of Households in New EU Member States. MNB Occasional Papers 87.2010. Magyar Nemzeti Bank
Colacelli, M., & Blackburn, D. J. 2009. Secondary currency: An empirical analysis. Journal of Monetary Economics 56(3), 295-308.
102
De Nicoló, G., Honohan, P. & Ize, A. 2003. Dollarization in the Banking System: Good or Bad?, World Bank Policy Research Working Paper No. 3116 (August).
Duma, N. 2011. Dollarization in Cambodia: Causes and Policy Implications. IMF Working Paper (WP/11/49), IMF.
Eichengreen, B., & Hausmann, R. 1999. Exchange Rates and Financial Fragility. NBER Working Paper No. 7418 (November).
Fidrmuc, J., Hake, M., & Stix, H. 2013. Households’ foreign currency borrowing in Central and Eastern Europe. Journal of Banking & Finance 37(6), 1880-1897.
Fiorante, A. 2011. Foreign currency indebtedness: A potential systemic risk in emerging Europe. European Credit Research Institute (ECRI) Commentary No. 8, (21 November).
Gelos, G.R. 2003. Foreign Currency Debt in Emerging Markets: Firm-Level Evidence from Mexico. Economics Letters 78, 323–327.
Hake, M., Lopez-Vicente, F., & Molina, L. 2014. Do the drivers of loan dollarization differ between CESEE and Latin America? A meta-analysis. Focus on European Economic Integration 2014/Q1, Oesterreichische Nationalbank, 8-35.
Ize, A., & Levy-Yeyati E. 2003. Financial Dollarization. Journal of International Economics 59, 323-347.
Jeanne, O. 2000. Foreign currency debt and the global financial architecture. European Economic Review 44(4), 719-727.
Jeanne, O. 2005. Why do emerging economies borrow in foreign currency? In: B., Eichengreen, & R. Hausmann (Eds.), Other People’s Money. The University of Chicago Press, Chicago (pp190-217).
Kolozsi, P.P., Banai, A., & Vonnak B. 2015. Phasing Out Household Foreign Currency Loans: Schedule and Framework. Financial and Economic Review Vol. 14 Issue, 3 60—87. Magyar Nemzeti Bank.
Levy Yeyati, E. 2006. Financial Dollarization: Evaluating the Consequences. Economic Policy 21 (45), 61-118 (January).
Louviere, J. J., Hensher, D. A., & Swait, J. D. 2000. Stated choice methods: analysis and applications. Cambridge University Press.
Luca, A., & Petrova, I. 2008. What drives Credit Dollarization in Transition Economies? Journal of Banking and Finance 32, 858-869.
Mora, N., Neaime, S., & Aintablian, S. 2013. Foreign currency borrowing by small firms in emerging markets: When domestic banks intermediate dollars. Journal of Banking & Finance 37 (2013), 1093–1107.
National Bank of Cambodia. 2012. Supervision Annual Report. Phnom Penh, Cambodia.
Odajima, K., & Khou, V. (2017). Foreign Currency Usage and Perception: Evidence from a Survey on Cambodian Households. Hitotsubashi Economics, 10 (2), 9-48.
Pellényi, G., & Bilek, P. 2009. Foreign currency borrowing: The case of Hungary. (No. 5.4). DIW Berlin, German Determinants of Foreign Currency Borrowing in the New Member States of the EU.Institute for Economic Research.

103
Rosenberg, C. B. & Tirpák, M. 2008. IMF Working Paper No. 08/173 (July).
Steiner, K. 2011. Households’ Exposure to Foreign Currency Loans in CESEE EU Member States and Croatia. Foucus on European Economic Integration Q1/11, Oesterreichische Nationalbank.
Stix, H. 2011. Euroization: what factors drive its persistence? Household data evidence for Croatia, Slovenia and Slovakia. Applied Economics 43(21), 2689-2704.
Valev, N. T. 2010. The hysteresis of currency substitution: currency risk vs. network externalities. Journal of International Money and Finance 29(2), 224-235.
World Bank. 2015. Cambodia economic update: maintaining high growth. Cambodia Economic Update. Washington, D.C. World Bank Group.
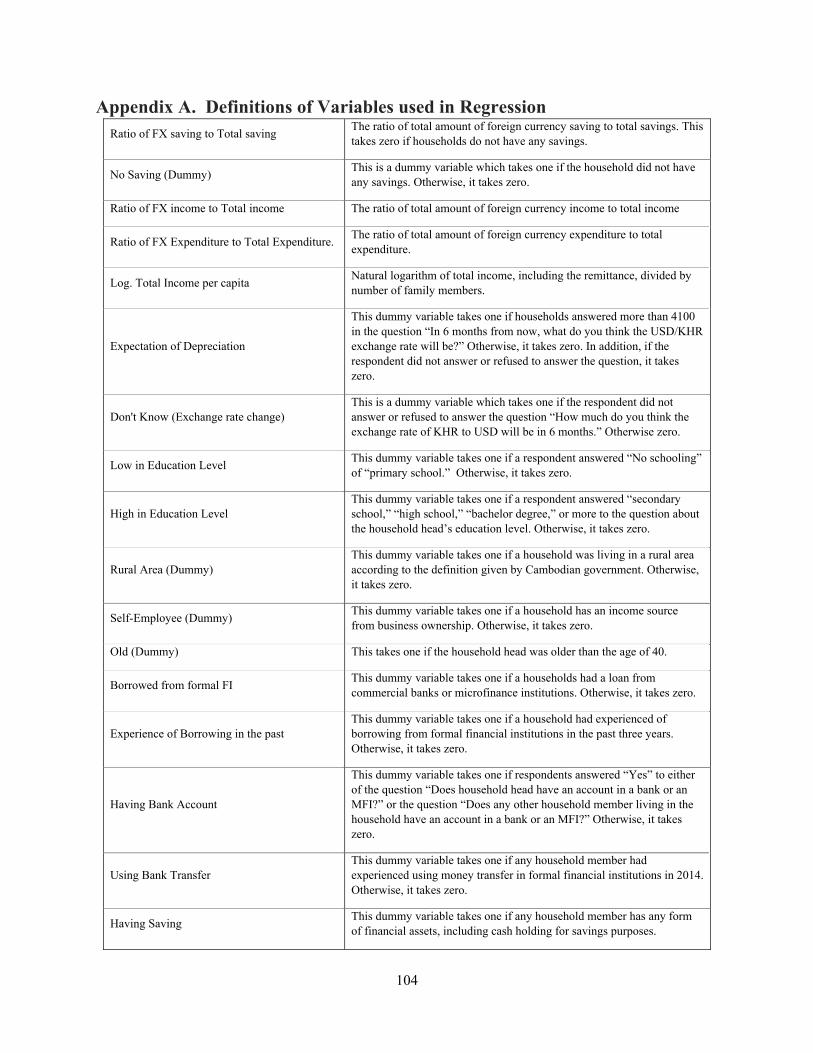
104
Appendix A. Definitions of Variables used in Regression Ratio of FX saving to Total saving
The ratio of total amount of foreign currency saving to total savings. This takes zero if households do not have any savings.
No Saving (Dummy) This is a dummy variable which takes one if the household did not have any savings. Otherwise, it takes zero.
Ratio of FX income to Total income The ratio of total amount of foreign currency income to total income
Ratio of FX Expenditure to Total Expenditure. The ratio of total amount of foreign currency expenditure to total expenditure.
Log. Total Income per capita Natural logarithm of total income, including the remittance, divided by number of family members.
Expectation of Depreciation
This dummy variable takes one if households answered more than 4100 in the question “In 6 months from now, what do you think the USD/KHR exchange rate will be?” Otherwise, it takes zero. In addition, if the respondent did not answer or refused to answer the question, it takes zero.
Don't Know (Exchange rate change) This is a dummy variable which takes one if the respondent did not answer or refused to answer the question “How much do you think the exchange rate of KHR to USD will be in 6 months.” Otherwise zero.
Low in Education Level This dummy variable takes one if a respondent answered “No schooling” of “primary school.” Otherwise, it takes zero.
High in Education Level This dummy variable takes one if a respondent answered “secondary school,” “high school,” “bachelor degree,” or more to the question about the household head’s education level. Otherwise, it takes zero.
Rural Area (Dummy) This dummy variable takes one if a household was living in a rural area according to the definition given by Cambodian government. Otherwise, it takes zero.
Self-Employee (Dummy) This dummy variable takes one if a household has an income source from business ownership. Otherwise, it takes zero.
Old (Dummy) This takes one if the household head was older than the age of 40.
Borrowed from formal FI This dummy variable takes one if a households had a loan from commercial banks or microfinance institutions. Otherwise, it takes zero.
Experience of Borrowing in the past This dummy variable takes one if a household had experienced of borrowing from formal financial institutions in the past three years. Otherwise, it takes zero.
Having Bank Account
This dummy variable takes one if respondents answered “Yes” to either of the question “Does household head have an account in a bank or an MFI?” or the question “Does any other household member living in the household have an account in a bank or an MFI?” Otherwise, it takes zero.
Using Bank Transfer This dummy variable takes one if any household member had experienced using money transfer in formal financial institutions in 2014. Otherwise, it takes zero.
Having Saving This dummy variable takes one if any household member has any form of financial assets, including cash holding for savings purposes.

105
Appendix B: Descriptive Statistics of Variables used in Estimation. Variable Obs Mean Std. Dev. Min Max
FX loan 617 0.715 0.452 0 1
No saving (dummy) 617 0.514 0.500 0 1
Ratio of FX Savings 617 0.185 0.351 0 1
Ratio of FX Sales 606 0.283 0.327 0 1
Ratio of FX Expenditure 615 0.094 0.162 0 0.909
Log. Total Income 617 6.608 0.997 3.912 9.086
Expectation for Depreciation (dummy) 617 0.024 0.154 0 1
Don't Know (Exchange rates) 617 0.776 0.417 0 1
Self Employee (dummy) 617 0.527 0.500 0 1
Older (More than 40) 617 0.627 0.484 0 1
Rural Dummy 617 0.485 0.500 0 1
Borrowed from formal FI 617 0.827 0.379 0 1
Experience of Borrowing in the past 617 0.844 0.363 0 1
Having Bank Account 617 0.201 0.401 0 1
Using Bank Transfer 616 0.183 0.387 0 1
Having Saving 617 0.567 0.496 0 1 Note: the sample used in estimation are only households with loans, and we excluded the households which had no loans when interviewed. We also winsorized the sample at 1% of the distribution of total income to reduce the bias from outliers.
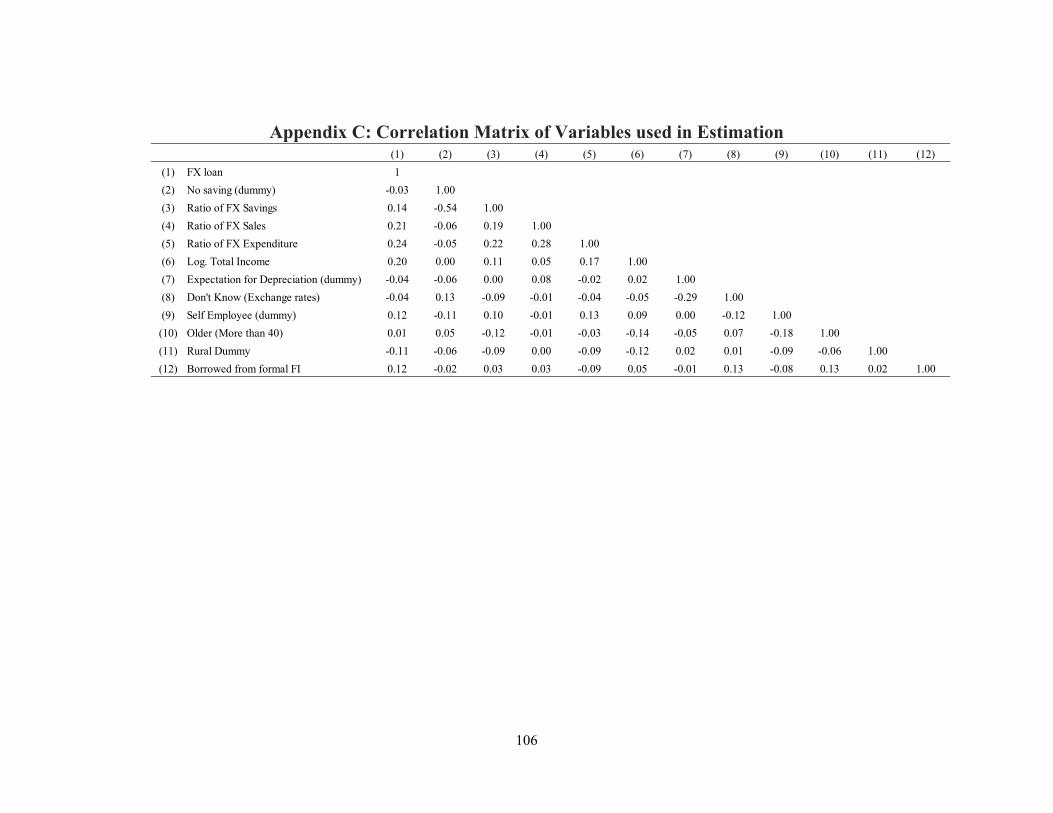
106
Appendix C: Correlation Matrix of Variables used in Estimation (1) (2) (3) (4) (5) (6) (7) (8) (9) (10) (11) (12)
(1) FX loan 1
(2) No saving (dummy) -0.03 1.00
(3) Ratio of FX Savings 0.14 -0.54 1.00
(4) Ratio of FX Sales 0.21 -0.06 0.19 1.00
(5) Ratio of FX Expenditure 0.24 -0.05 0.22 0.28 1.00
(6) Log. Total Income 0.20 0.00 0.11 0.05 0.17 1.00
(7) Expectation for Depreciation (dummy) -0.04 -0.06 0.00 0.08 -0.02 0.02 1.00
(8) Don't Know (Exchange rates) -0.04 0.13 -0.09 -0.01 -0.04 -0.05 -0.29 1.00
(9) Self Employee (dummy) 0.12 -0.11 0.10 -0.01 0.13 0.09 0.00 -0.12 1.00
(10) Older (More than 40) 0.01 0.05 -0.12 -0.01 -0.03 -0.14 -0.05 0.07 -0.18 1.00
(11) Rural Dummy -0.11 -0.06 -0.09 0.00 -0.09 -0.12 0.02 0.01 -0.09 -0.06 1.00
(12) Borrowed from formal FI 0.12 -0.02 0.03 0.03 -0.09 0.05 -0.01 0.13 -0.08 0.13 0.02 1.00
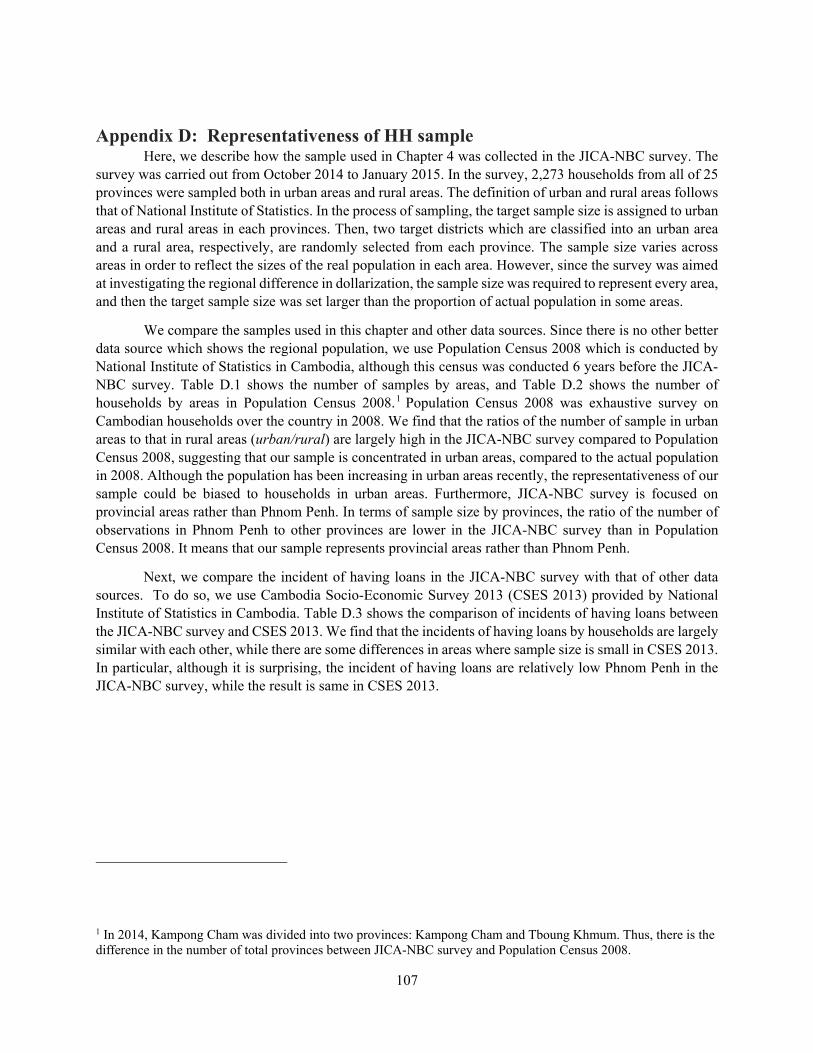
107
Appendix D: Representativeness of HH sample Here, we describe how the sample used in Chapter 4 was collected in the JICA-NBC survey. The
survey was carried out from October 2014 to January 2015. In the survey, 2,273 households from all of 25 provinces were sampled both in urban areas and rural areas. The definition of urban and rural areas follows that of National Institute of Statistics. In the process of sampling, the target sample size is assigned to urban areas and rural areas in each provinces. Then, two target districts which are classified into an urban area and a rural area, respectively, are randomly selected from each province. The sample size varies across areas in order to reflect the sizes of the real population in each area. However, since the survey was aimed at investigating the regional difference in dollarization, the sample size was required to represent every area, and then the target sample size was set larger than the proportion of actual population in some areas.
We compare the samples used in this chapter and other data sources. Since there is no other better data source which shows the regional population, we use Population Census 2008 which is conducted by National Institute of Statistics in Cambodia, although this census was conducted 6 years before the JICA-NBC survey. Table D.1 shows the number of samples by areas, and Table D.2 shows the number of households by areas in Population Census 2008.1 Population Census 2008 was exhaustive survey on Cambodian households over the country in 2008. We find that the ratios of the number of sample in urban areas to that in rural areas (urban/rural) are largely high in the JICA-NBC survey compared to Population Census 2008, suggesting that our sample is concentrated in urban areas, compared to the actual population in 2008. Although the population has been increasing in urban areas recently, the representativeness of our sample could be biased to households in urban areas. Furthermore, JICA-NBC survey is focused on provincial areas rather than Phnom Penh. In terms of sample size by provinces, the ratio of the number of observations in Phnom Penh to other provinces are lower in the JICA-NBC survey than in Population Census 2008. It means that our sample represents provincial areas rather than Phnom Penh.
Next, we compare the incident of having loans in the JICA-NBC survey with that of other data sources. To do so, we use Cambodia Socio-Economic Survey 2013 (CSES 2013) provided by National Institute of Statistics in Cambodia. Table D.3 shows the comparison of incidents of having loans between the JICA-NBC survey and CSES 2013. We find that the incidents of having loans by households are largely similar with each other, while there are some differences in areas where sample size is small in CSES 2013. In particular, although it is surprising, the incident of having loans are relatively low Phnom Penh in the JICA-NBC survey, while the result is same in CSES 2013.
1 In 2014, Kampong Cham was divided into two provinces: Kampong Cham and Tboung Khmum. Thus, there is the difference in the number of total provinces between JICA-NBC survey and Population Census 2008.
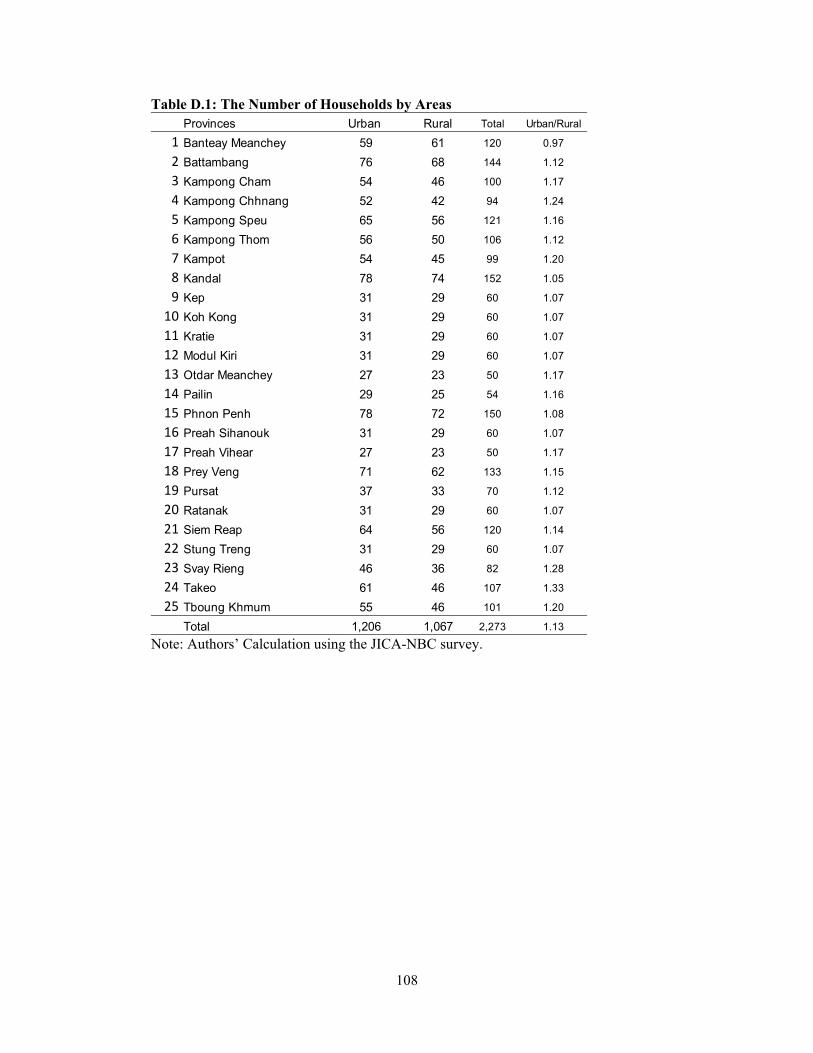
108
Table D.1: The Number of Households by Areas Provinces Urban Rural Total Urban/Rural
1 Banteay Meanchey 59 61 120 0.97
2 Battambang 76 68 144 1.12
3 Kampong Cham 54 46 100 1.17
4 Kampong Chhnang 52 42 94 1.24
5 Kampong Speu 65 56 121 1.16
6 Kampong Thom 56 50 106 1.12
7 Kampot 54 45 99 1.20
8 Kandal 78 74 152 1.05
9 Kep 31 29 60 1.07
10 Koh Kong 31 29 60 1.07
11 Kratie 31 29 60 1.07
12 Modul Kiri 31 29 60 1.07
13 Otdar Meanchey 27 23 50 1.17
14 Pailin 29 25 54 1.16
15 Phnon Penh 78 72 150 1.08
16 Preah Sihanouk 31 29 60 1.07
17 Preah Vihear 27 23 50 1.17
18 Prey Veng 71 62 133 1.15
19 Pursat 37 33 70 1.12
20 Ratanak 31 29 60 1.07
21 Siem Reap 64 56 120 1.14
22 Stung Treng 31 29 60 1.07
23 Svay Rieng 46 36 82 1.28
24 Takeo 61 46 107 1.33
25 Tboung Khmum 55 46 101 1.20
Total 1,206 1,067 2,273 1.13 Note: Authors’ Calculation using the JICA-NBC survey.
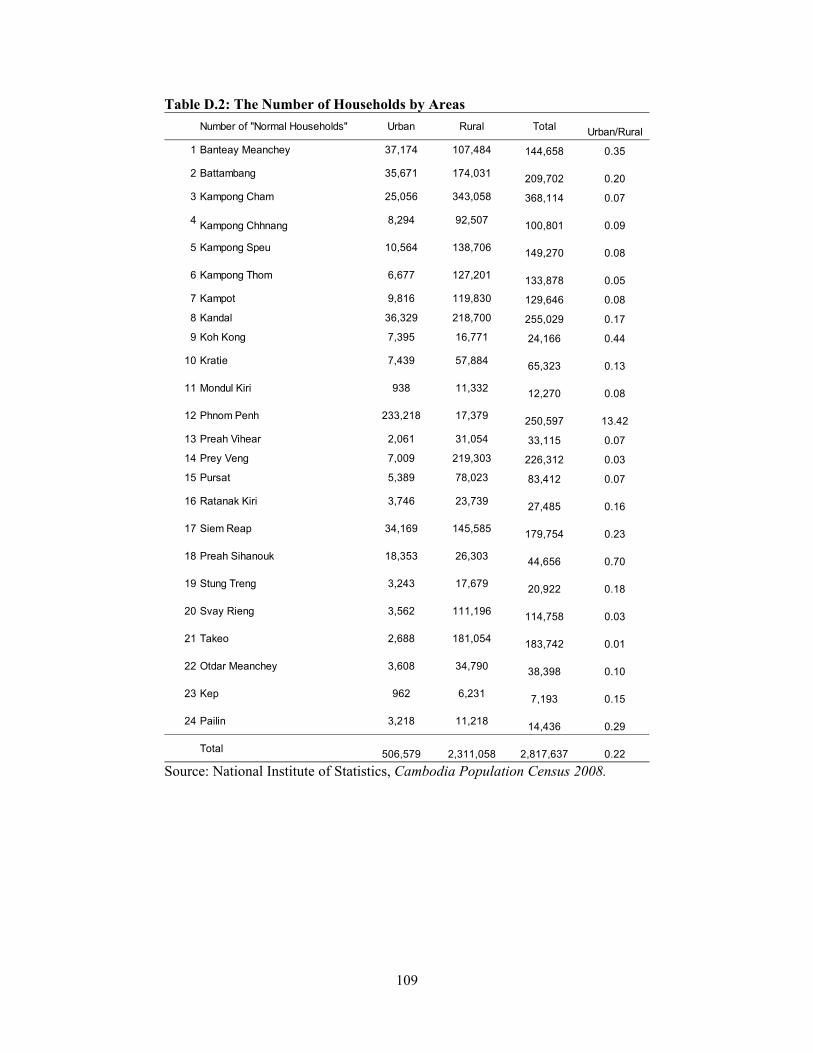
109
Table D.2: The Number of Households by Areas
Number of "Normal Households" Urban Rural Total Urban/Rural
1 Banteay Meanchey 37,174 107,484 144,658 0.35
2 Battambang 35,671 174,031 209,702 0.20
3 Kampong Cham 25,056 343,058 368,114 0.07
4 Kampong Chhnang 8,294 92,507 100,801 0.09
5 Kampong Speu 10,564 138,706 149,270 0.08
6 Kampong Thom 6,677 127,201 133,878 0.05
7 Kampot 9,816 119,830 129,646 0.08
8 Kandal 36,329 218,700 255,029 0.17
9 Koh Kong 7,395 16,771 24,166 0.44
10 Kratie 7,439 57,884 65,323 0.13
11 Mondul Kiri 938 11,332 12,270 0.08
12 Phnom Penh 233,218 17,379 250,597 13.42
13 Preah Vihear 2,061 31,054 33,115 0.07
14 Prey Veng 7,009 219,303 226,312 0.03
15 Pursat 5,389 78,023 83,412 0.07
16 Ratanak Kiri 3,746 23,739 27,485 0.16
17 Siem Reap 34,169 145,585 179,754 0.23
18 Preah Sihanouk 18,353 26,303 44,656 0.70
19 Stung Treng 3,243 17,679 20,922 0.18
20 Svay Rieng 3,562 111,196 114,758 0.03
21 Takeo 2,688 181,054 183,742 0.01
22 Otdar Meanchey 3,608 34,790 38,398 0.10
23 Kep 962 6,231 7,193 0.15
24 Pailin 3,218 11,218 14,436 0.29
Total 506,579 2,311,058 2,817,637 0.22 Source: National Institute of Statistics, Cambodia Population Census 2008.

110
Table D.3: Comparison of households with loans between CSES 2013 and JICA-NBC survey CSES2013 JICA-NBC survey
ProvincesHouseholds with loans
Total Number of
Households Percent.Households with loans
Total Number of
Households Percent.
Banteay Meanchey 65 220 30% 37 120 31%
Battambang 110 280 39% 30 144 21%
Kampong Cham 152 420 36% 25 100 25%
Tboung Khmum N.A N.A N.A. 33 101 33%
Kampong Chhnang 28 120 23% 26 94 28%
Kampong Speu 69 170 41% 43 121 36%
Kampong Thom 72 160 45% 45 106 42%
Kampot 50 140 36% 16 99 16%
Kandal 93 280 33% 50 152 33%
Kep 7 20 35% 10 60 17%
Koh Kong 7 20 35% 13 60 22%
Kratie 35 90 39% 9 60 15%
Mondul Kiri 2 20 10% 24 60 40%
Oddar Meanchey 22 60 37% 11 50 22%
Pailin 0 0 N.A. 23 54 43%
Phnom Penh 93 760 12% 30 150 20%
Preah Sihanouk 24 80 30% 12 60 20%
Preah Vihear 12 40 30% 24 50 48%
Prey Veng 97 260 37% 36 133 27%
Pursat 35 80 44% 22 70 31%
Ratanak Kiri 4 20 20% 14 60 23%
Siemreap 99 260 38% 36 120 30%
Stung Treng 2 10 20% 9 60 15%
Svay Rieng 30 130 23% 16 82 20%
Takeo 83 200 42% 40 107 37%
Total 1,191 3,840 31% 634 2,273 28%
Sample selection bias in the main analysis
Since our interest is factors behind currency choices in loans, our analysis in this chapter is exclusively focused on the households which have loans. Thus, sample selection biases could arise in our estimation in the sense that our results are not directly applicable to households with no loans. Generally, the geographic location could be impediment for borrowing, even though microfinance institutions are widely penetrated into rural areas. Therefore, it is expected that households in rural areas are less likely to be excluded from the sample for our estimation, and the selection bias could arise from exclusion of those households.
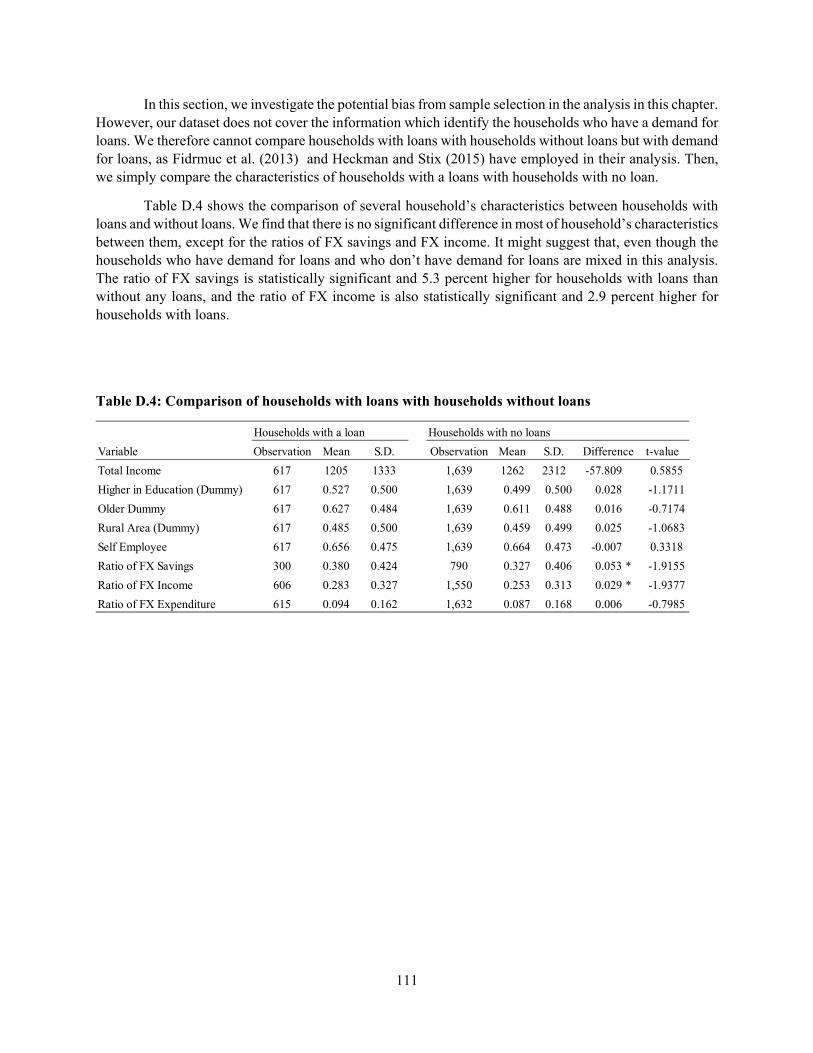
111
In this section, we investigate the potential bias from sample selection in the analysis in this chapter. However, our dataset does not cover the information which identify the households who have a demand for loans. We therefore cannot compare households with loans with households without loans but with demand for loans, as Fidrmuc et al. (2013) and Heckman and Stix (2015) have employed in their analysis. Then, we simply compare the characteristics of households with a loans with households with no loan.
Table D.4 shows the comparison of several household’s characteristics between households with loans and without loans. We find that there is no significant difference in most of household’s characteristics between them, except for the ratios of FX savings and FX income. It might suggest that, even though the households who have demand for loans and who don’t have demand for loans are mixed in this analysis. The ratio of FX savings is statistically significant and 5.3 percent higher for households with loans than without any loans, and the ratio of FX income is also statistically significant and 2.9 percent higher for households with loans.
Table D.4: Comparison of households with loans with households without loans
Households with a loan Households with no loans
Variable Observation Mean S.D. Observation Mean S.D. Difference t-value
Total Income 617 1205 1333 1,639 1262 2312 -57.809 0.5855
Higher in Education (Dummy) 617 0.527 0.500 1,639 0.499 0.500 0.028 -1.1711
Older Dummy 617 0.627 0.484 1,639 0.611 0.488 0.016 -0.7174
Rural Area (Dummy) 617 0.485 0.500 1,639 0.459 0.499 0.025 -1.0683
Self Employee 617 0.656 0.475 1,639 0.664 0.473 -0.007 0.3318
Ratio of FX Savings 300 0.380 0.424 790 0.327 0.406 0.053 * -1.9155
Ratio of FX Income 606 0.283 0.327 1,550 0.253 0.313 0.029 * -1.9377
Ratio of FX Expenditure 615 0.094 0.162 1,632 0.087 0.168 0.006 -0.7985

112
Appendix E: Robustness check on potential endogeniety There remain some issues that the analysis in this chapter is biased by endogeneity. One of the possible endogeneity problem is the reverse causality between taking out loans and the currency composition of income, and assets. Here, we attempt to check the robustness of our regression in this chapter by assuming that currency composition of household’s income is endogenous variable in the estimation.
We employ two variables as instrument variables for the ratio of FX income: (1) dummy for households of which wage is from a banking and finance sector, and (2) dummies for households of which wage is from public sector. Those variables take one if there is a member who earn money from those wages. In the case of Cambodia, all of formal financial institutions provide their workers with wages in FX currency. Thus, the first variable could positively affect the ratio of FX income for the household. In addition, the public servants generally have salary in local currency. Accordingly, the second variable could negatively affect the ratio of FX income. Those two variables are potentially uncorrelated to the currency choice in loans.
Table E.1 shows the results of IV Probit regression using the same variable in Table 6. We find that the ratio of FX income remains significant in column (1), where the dummy for wages from a banking and finance sector is used as an instrumental variable. We confirm that the ratio of FX income has a significant effect even if we assume that this variable is endogenous. However, there is a caveat to conclude that there is a causality. We find that the significance in the coefficient of the ratio of FX income disappears in column (2), where the dummy for wages from public sector. Presumably, the wages from a banking and finance sector generally high so that it affects the currency composition of household’s income significantly, and then we obtain the significant results in the IV Probit regression. In the meantime, it is possible that the dummy for wages from public sector is not an appropriate instrument variable since the wages from public sector are not so high to affect the currency composition significantly. All in all, the results depend on the choice of instrument variables. Thus, we only find the weak evidence of causality of the impact of the ratio of FX income on currency choice in loans.

113
Table E.1: IV Probit estimation (1) (2)
IVDummy for wages from a banking and finance sector
Dummy for wages from public sector
Ratio of FX Income 3.647** 0.715
(1.62) (1.13)
Ratio of FX Expenditure -0.008 0.020***
(0.08) (0.01)
Higher in Education Level -0.035 0.214
(0.83) (0.13)
Log. Total Income -0.110 0.214**
(0.92) (0.08)
Expectation for Depreciation -0.665 -0.707*
(3.12) (0.43)
Don’t Know (Exchange rate) -0.089 -0.069
(0.20) (0.17)
Self Employee 0.587 0.162
(0.55) (0.24)
Older 0.148 0.036
(0.17) (0.14)
Rural Dummy 0.073 -0.299**
(1.24) (0.13)
Borrowed from formal FI -0.226 0.625***
(2.49) (0.19)
Province Dummies Yes Yes
Observations 549 549 Note: ***, **, * represent significance level at 1, 5, and 10 percent, respectively. The values in parenthesis represent the standard errors. In the estimation, we winsorized the sample at 1% of the distribution of total income to reduce the bias from outliers.
114
Chapter 5: Firm’s Borrowing Behaviors in a Highly Dollarized Economy1
1. Introduction
As globalization of the world economy continues, many emerging markets economies have adopted dollarization. In these countries, the proportion of foreign currency funds (mainly in US dollars) in firms would increase, while there are growing concerns that it could escalate currency mismatches in the balance sheets of firms and financial institutions. In recent years, an increasing number of countries in Eastern Europe have taken steps to avoid exposing their financial systems to the risk of increased foreign currency debt; for example, countries such as Ukraine have banned dollar-based borrowings (Brown et al., 2011). In this context, numerous studies in Eastern European and Latin American countries have examined the determining factors for raising the foreign capital of firms.
In Cambodia, as well as households, firms are also using the foreign currency in their operation (Aiba & Tha, 2017). 2 However, there have been quite limited number of studies focusing on the microeconomic behaviors of economic entities such as households, firms, and financial institutions, while Cambodia’s dollarization has been examined by several studies from macroeconomic view point. As far as the authors know, there has been no study that empirically examined the firms’ fund procurement behaviors under dollarization in Cambodia.
In this chapter, we attempt to empirically investigate the firm’s fund raising behaviors by using a unique survey-based data that was corrected by the joint project of the National Bank of Cambodia (NBC) and Japan International Cooperation Agency (JICA). The main contribution of this chapter has two folds. Firstly, this is the first attempt to analyze the borrowing behaviors of Cambodian firms by adopting the corporate financing theory to the Cambodia’s highly dollarized environments. Secondly, this study developed the analytical framework examining the Cambodia’s distinctive circumstances where firms can raise external funds only in USD denomination. Previous studies on dollarization conventionally analyzed the selection problem of whether a firm borrow in FX currency or local currency (Brown et al. 2011; Brown et al., 2014), or choices of capital structure of firms which can raise funds both in local and FX currency (Allayannis et a., 2003). In the meantime, o study examines the firm’s capital structure choice in the highly dollarized environment where firms can only raise external funds in FX currency, and further examines the selection problem of whether a firm access FX-denominated loans, or has no borrowing. The analytical approach adopted in this study will be useful when considering how the firms borrow in the markedly
1 This chapter is based on Okuda & Aiba (2016) Fund Procurement of Firms in Highly Dollarized Economy: A Case Study of Cambodia. Discussion Paper Series, No.2016-8, Graduate School of Economics, Hitotsubashi University. 2 Also see Chapter 4 for the dollarization in households.
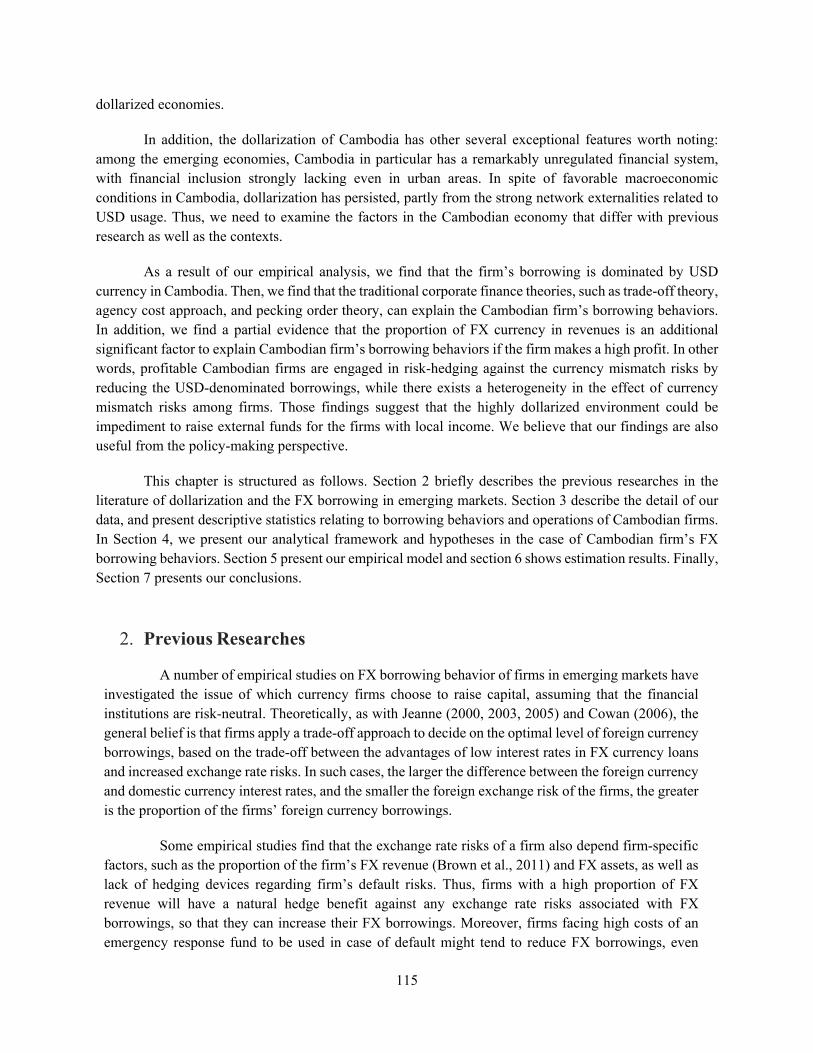
115
dollarized economies.
In addition, the dollarization of Cambodia has other several exceptional features worth noting: among the emerging economies, Cambodia in particular has a remarkably unregulated financial system, with financial inclusion strongly lacking even in urban areas. In spite of favorable macroeconomic conditions in Cambodia, dollarization has persisted, partly from the strong network externalities related to USD usage. Thus, we need to examine the factors in the Cambodian economy that differ with previous research as well as the contexts.
As a result of our empirical analysis, we find that the firm’s borrowing is dominated by USD currency in Cambodia. Then, we find that the traditional corporate finance theories, such as trade-off theory, agency cost approach, and pecking order theory, can explain the Cambodian firm’s borrowing behaviors. In addition, we find a partial evidence that the proportion of FX currency in revenues is an additional significant factor to explain Cambodian firm’s borrowing behaviors if the firm makes a high profit. In other words, profitable Cambodian firms are engaged in risk-hedging against the currency mismatch risks by reducing the USD-denominated borrowings, while there exists a heterogeneity in the effect of currency mismatch risks among firms. Those findings suggest that the highly dollarized environment could be impediment to raise external funds for the firms with local income. We believe that our findings are also useful from the policy-making perspective.
This chapter is structured as follows. Section 2 briefly describes the previous researches in the literature of dollarization and the FX borrowing in emerging markets. Section 3 describe the detail of our data, and present descriptive statistics relating to borrowing behaviors and operations of Cambodian firms. In Section 4, we present our analytical framework and hypotheses in the case of Cambodian firm’s FX borrowing behaviors. Section 5 present our empirical model and section 6 shows estimation results. Finally, Section 7 presents our conclusions.
2. Previous Researches
A number of empirical studies on FX borrowing behavior of firms in emerging markets have investigated the issue of which currency firms choose to raise capital, assuming that the financial institutions are risk-neutral. Theoretically, as with Jeanne (2000, 2003, 2005) and Cowan (2006), the general belief is that firms apply a trade-off approach to decide on the optimal level of foreign currency borrowings, based on the trade-off between the advantages of low interest rates in FX currency loans and increased exchange rate risks. In such cases, the larger the difference between the foreign currency and domestic currency interest rates, and the smaller the foreign exchange risk of the firms, the greater is the proportion of the firms’ foreign currency borrowings.
Some empirical studies find that the exchange rate risks of a firm also depend firm-specific factors, such as the proportion of the firm’s FX revenue (Brown et al., 2011) and FX assets, as well as lack of hedging devices regarding firm’s default risks. Thus, firms with a high proportion of FX revenue will have a natural hedge benefit against any exchange rate risks associated with FX borrowings, so that they can increase their FX borrowings. Moreover, firms facing high costs of an emergency response fund to be used in case of default might tend to reduce FX borrowings, even
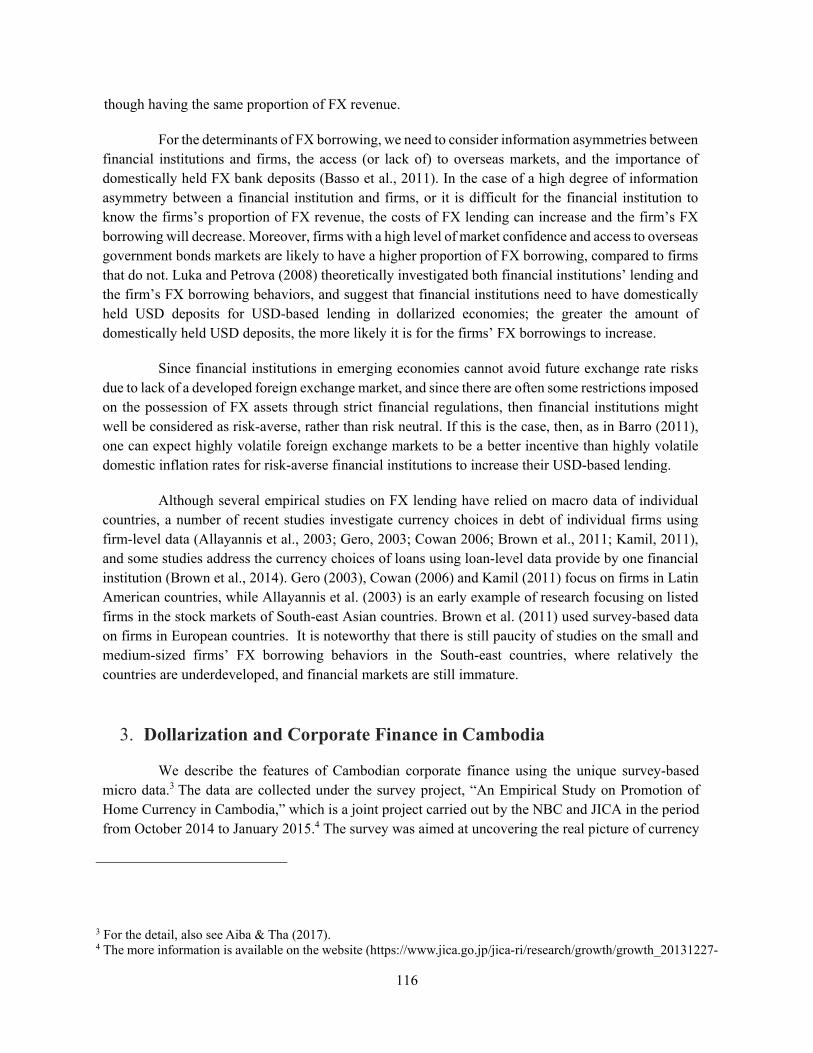
116
though having the same proportion of FX revenue.
For the determinants of FX borrowing, we need to consider information asymmetries between financial institutions and firms, the access (or lack of) to overseas markets, and the importance of domestically held FX bank deposits (Basso et al., 2011). In the case of a high degree of information asymmetry between a financial institution and firms, or it is difficult for the financial institution to know the firms’s proportion of FX revenue, the costs of FX lending can increase and the firm’s FX borrowing will decrease. Moreover, firms with a high level of market confidence and access to overseas government bonds markets are likely to have a higher proportion of FX borrowing, compared to firms that do not. Luka and Petrova (2008) theoretically investigated both financial institutions’ lending and the firm’s FX borrowing behaviors, and suggest that financial institutions need to have domestically held USD deposits for USD-based lending in dollarized economies; the greater the amount of domestically held USD deposits, the more likely it is for the firms’ FX borrowings to increase.
Since financial institutions in emerging economies cannot avoid future exchange rate risks due to lack of a developed foreign exchange market, and since there are often some restrictions imposed on the possession of FX assets through strict financial regulations, then financial institutions might well be considered as risk-averse, rather than risk neutral. If this is the case, then, as in Barro (2011), one can expect highly volatile foreign exchange markets to be a better incentive than highly volatile domestic inflation rates for risk-averse financial institutions to increase their USD-based lending.
Although several empirical studies on FX lending have relied on macro data of individual countries, a number of recent studies investigate currency choices in debt of individual firms using firm-level data (Allayannis et al., 2003; Gero, 2003; Cowan 2006; Brown et al., 2011; Kamil, 2011), and some studies address the currency choices of loans using loan-level data provide by one financial institution (Brown et al., 2014). Gero (2003), Cowan (2006) and Kamil (2011) focus on firms in Latin American countries, while Allayannis et al. (2003) is an early example of research focusing on listed firms in the stock markets of South-east Asian countries. Brown et al. (2011) used survey-based data on firms in European countries. It is noteworthy that there is still paucity of studies on the small and medium-sized firms’ FX borrowing behaviors in the South-east countries, where relatively the countries are underdeveloped, and financial markets are still immature.
3. Dollarization and Corporate Finance in Cambodia
We describe the features of Cambodian corporate finance using the unique survey-based micro data.3 The data are collected under the survey project, “An Empirical Study on Promotion of Home Currency in Cambodia,” which is a joint project carried out by the NBC and JICA in the period from October 2014 to January 2015.4 The survey was aimed at uncovering the real picture of currency
3 For the detail, also see Aiba & Tha (2017). 4 The more information is available on the website (https://www.jica.go.jp/jica-ri/research/growth/growth_20131227-
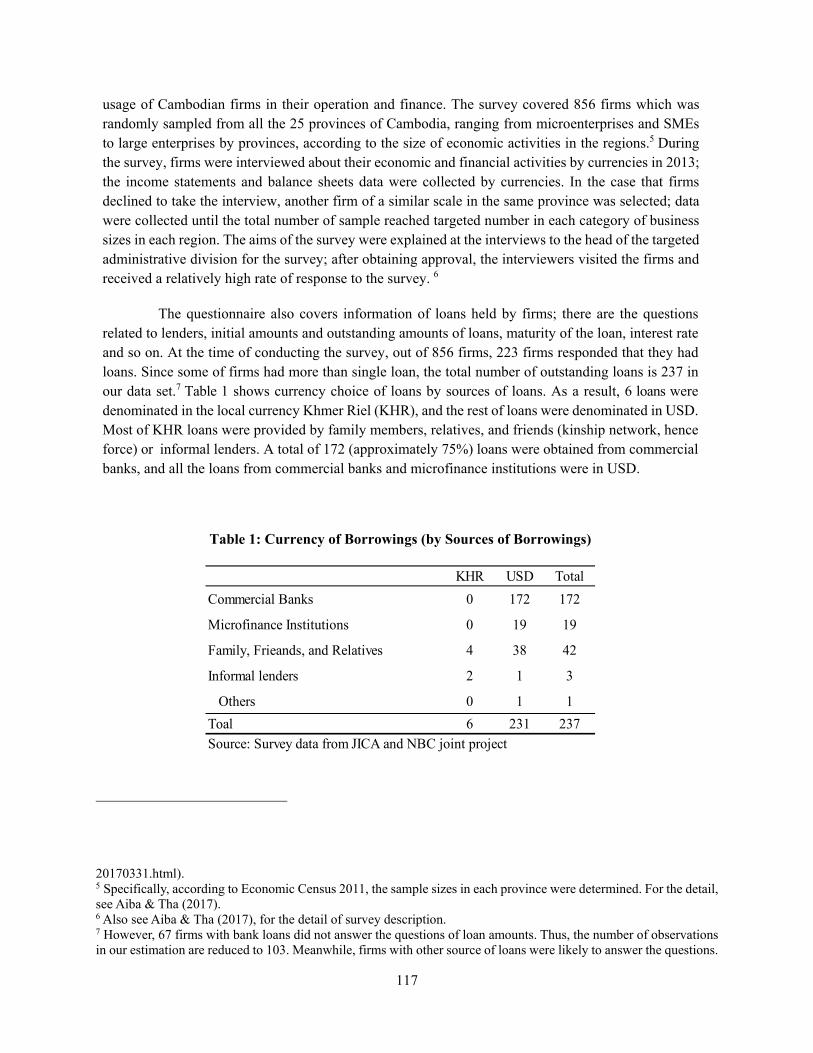
117
usage of Cambodian firms in their operation and finance. The survey covered 856 firms which was randomly sampled from all the 25 provinces of Cambodia, ranging from microenterprises and SMEs to large enterprises by provinces, according to the size of economic activities in the regions.5 During the survey, firms were interviewed about their economic and financial activities by currencies in 2013; the income statements and balance sheets data were collected by currencies. In the case that firms declined to take the interview, another firm of a similar scale in the same province was selected; data were collected until the total number of sample reached targeted number in each category of business sizes in each region. The aims of the survey were explained at the interviews to the head of the targeted administrative division for the survey; after obtaining approval, the interviewers visited the firms and received a relatively high rate of response to the survey. 6
The questionnaire also covers information of loans held by firms; there are the questions related to lenders, initial amounts and outstanding amounts of loans, maturity of the loan, interest rate and so on. At the time of conducting the survey, out of 856 firms, 223 firms responded that they had loans. Since some of firms had more than single loan, the total number of outstanding loans is 237 in our data set.7 Table 1 shows currency choice of loans by sources of loans. As a result, 6 loans were denominated in the local currency Khmer Riel (KHR), and the rest of loans were denominated in USD. Most of KHR loans were provided by family members, relatives, and friends (kinship network, hence force) or informal lenders. A total of 172 (approximately 75%) loans were obtained from commercial banks, and all the loans from commercial banks and microfinance institutions were in USD.
Table 1: Currency of Borrowings (by Sources of Borrowings)
KHR USD Total
Commercial Banks 0 172 172
Microfinance Institutions 0 19 19
Family, Frieands, and Relatives 4 38 42
Informal lenders 2 1 3
Others 0 1 1
Toal 6 231 237
Source: Survey data from JICA and NBC joint project
20170331.html). 5 Specifically, according to Economic Census 2011, the sample sizes in each province were determined. For the detail, see Aiba & Tha (2017). 6 Also see Aiba & Tha (2017), for the detail of survey description. 7 However, 67 firms with bank loans did not answer the questions of loan amounts. Thus, the number of observations in our estimation are reduced to 103. Meanwhile, firms with other source of loans were likely to answer the questions.

118
In order to reveal which currency those Cambodian firms with loans mainly use in their operation, we look into the results of the question “Which currency does your enterprise mainly use?” Table 2 shows the results within firms with loans, and show. We find that although the majority of firms with loans responded that they used USD, 60 firms (about 27%) responded that they mainly used KHR. These results of Table 1 and 2 mean that even the firms in need of local currency have loans in USD. Although the firms required loans in KHR, they were not able to borrow the loan in that currency, indicating that the currency choice of loans might be decided based on financial institution’s requirements rather than the firms’ needs. The results might also suggest that the firms in need of local currency could be exposed to currency mismatch risks between loans and operations.
Table 2: Main Currencies Used by Borrowing Companies
Frequency Percent.
KHR 60 26.91USD 126 56.5Other currency 15 6.73N.A. 21 9.42Don't Know 1 0.45
Total 223 100
Source: Survey data from JICA and NBC joint project
In Table 3, we present the descriptive statistics of firm’s management indexes by sizes in order to examine how the Cambodian firms raise funds. Since our dataset does not include the variable which allow us to confirm whether firms faced liquidity constraints, we reduced the sample to the firms having loans at the time of conducting survey. The firms are divided by sizes into four size categories: microenterprises, small firms, medium-sized firms, and large firms, based on asset sizes. 8 First, regarding the dummy variable for whether firms would borrow from a bank, we find that larger firms were more likely to to borrow from commercial banks when they borrowed money. Moreover, larger firms had the large amount of loans, suggesting that larger firms need the larger amount of capital needed.
8 Following the survey module, we defined (1) large firms as firms of which asset sizes are more than 500,000USD, (2) medium-sized firms as firms of which asset size are ranged from 250,000 USD to 500,000 USD, (3) small firms as firms of which asset sizes are ranged from 50,000 USD to 250,00 USD, and (4) microenterprises as firms of which asset sizes are below 50,000 USD.
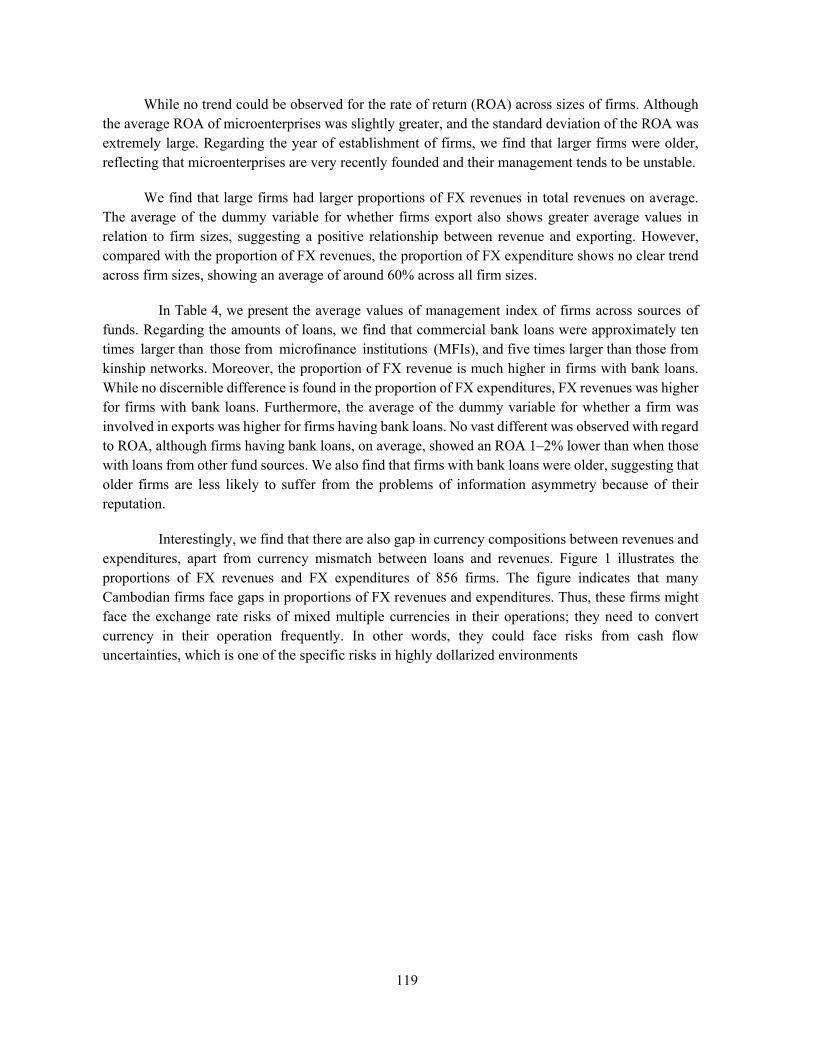
119
While no trend could be observed for the rate of return (ROA) across sizes of firms. Although the average ROA of microenterprises was slightly greater, and the standard deviation of the ROA was extremely large. Regarding the year of establishment of firms, we find that larger firms were older, reflecting that microenterprises are very recently founded and their management tends to be unstable.
We find that large firms had larger proportions of FX revenues in total revenues on average. The average of the dummy variable for whether firms export also shows greater average values in relation to firm sizes, suggesting a positive relationship between revenue and exporting. However, compared with the proportion of FX revenues, the proportion of FX expenditure shows no clear trend across firm sizes, showing an average of around 60% across all firm sizes.
In Table 4, we present the average values of management index of firms across sources of funds. Regarding the amounts of loans, we find that commercial bank loans were approximately ten times larger than those from microfinance institutions (MFIs), and five times larger than those from kinship networks. Moreover, the proportion of FX revenue is much higher in firms with bank loans. While no discernible difference is found in the proportion of FX expenditures, FX revenues was higher for firms with bank loans. Furthermore, the average of the dummy variable for whether a firm was involved in exports was higher for firms having bank loans. No vast different was observed with regard to ROA, although firms having bank loans, on average, showed an ROA 1–2% lower than when those with loans from other fund sources. We also find that firms with bank loans were older, suggesting that older firms are less likely to suffer from the problems of information asymmetry because of their reputation.
Interestingly, we find that there are also gap in currency compositions between revenues and expenditures, apart from currency mismatch between loans and revenues. Figure 1 illustrates the proportions of FX revenues and FX expenditures of 856 firms. The figure indicates that many Cambodian firms face gaps in proportions of FX revenues and expenditures. Thus, these firms might face the exchange rate risks of mixed multiple currencies in their operations; they need to convert currency in their operation frequently. In other words, they could face risks from cash flow uncertainties, which is one of the specific risks in highly dollarized environments
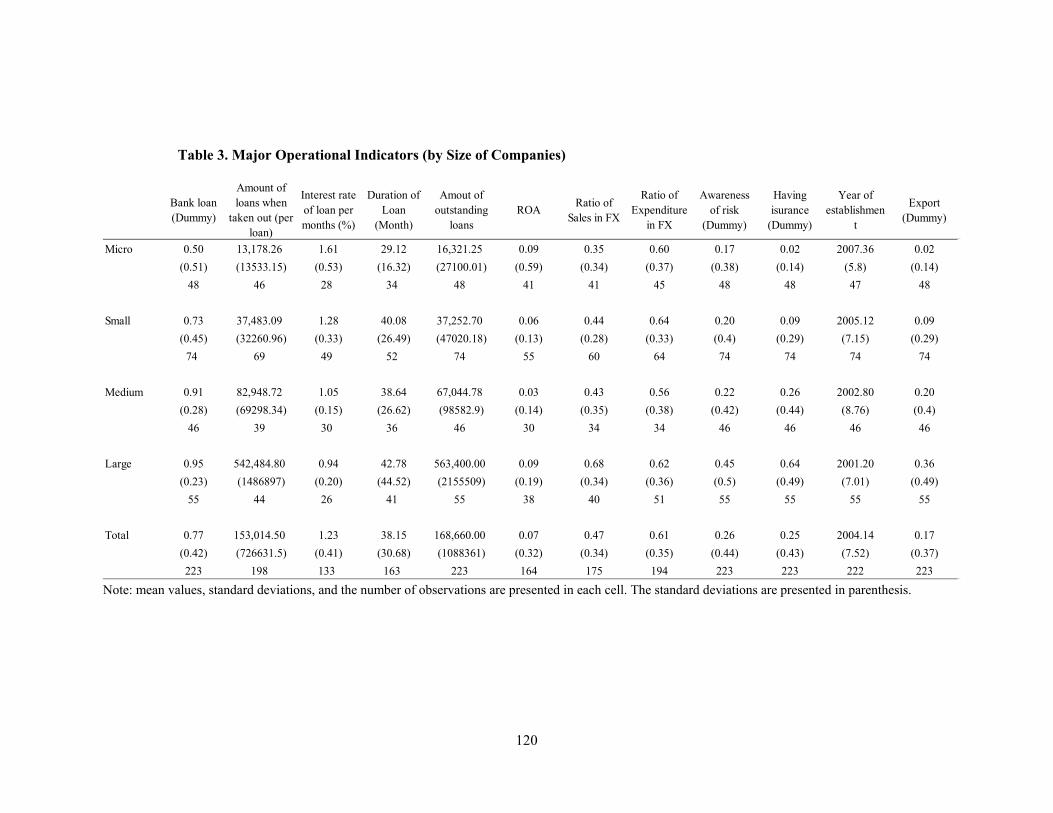
120
Table 3. Major Operational Indicators (by Size of Companies)
Bank loan (Dummy)
Amount of loans when
taken out (per loan)
Interest rate of loan per months (%)
Duration of Loan
(Month)
Amout of outstanding
loans ROA
Ratio of Sales in FX
Ratio of Expenditure
in FX
Awareness of risk
(Dummy)
Having isurance
(Dummy)
Year of establishmen
t
Export (Dummy)
Micro 0.50 13,178.26 1.61 29.12 16,321.25 0.09 0.35 0.60 0.17 0.02 2007.36 0.02
(0.51) (13533.15) (0.53) (16.32) (27100.01) (0.59) (0.34) (0.37) (0.38) (0.14) (5.8) (0.14)
48 46 28 34 48 41 41 45 48 48 47 48
Small 0.73 37,483.09 1.28 40.08 37,252.70 0.06 0.44 0.64 0.20 0.09 2005.12 0.09
(0.45) (32260.96) (0.33) (26.49) (47020.18) (0.13) (0.28) (0.33) (0.4) (0.29) (7.15) (0.29)
74 69 49 52 74 55 60 64 74 74 74 74
Medium 0.91 82,948.72 1.05 38.64 67,044.78 0.03 0.43 0.56 0.22 0.26 2002.80 0.20
(0.28) (69298.34) (0.15) (26.62) (98582.9) (0.14) (0.35) (0.38) (0.42) (0.44) (8.76) (0.4)
46 39 30 36 46 30 34 34 46 46 46 46
Large 0.95 542,484.80 0.94 42.78 563,400.00 0.09 0.68 0.62 0.45 0.64 2001.20 0.36
(0.23) (1486897) (0.20) (44.52) (2155509) (0.19) (0.34) (0.36) (0.5) (0.49) (7.01) (0.49)
55 44 26 41 55 38 40 51 55 55 55 55
Total 0.77 153,014.50 1.23 38.15 168,660.00 0.07 0.47 0.61 0.26 0.25 2004.14 0.17
(0.42) (726631.5) (0.41) (30.68) (1088361) (0.32) (0.34) (0.35) (0.44) (0.43) (7.52) (0.37)
223 198 133 163 223 164 175 194 223 223 222 223
Note: mean values, standard deviations, and the number of observations are presented in each cell. The standard deviations are presented in parenthesis.
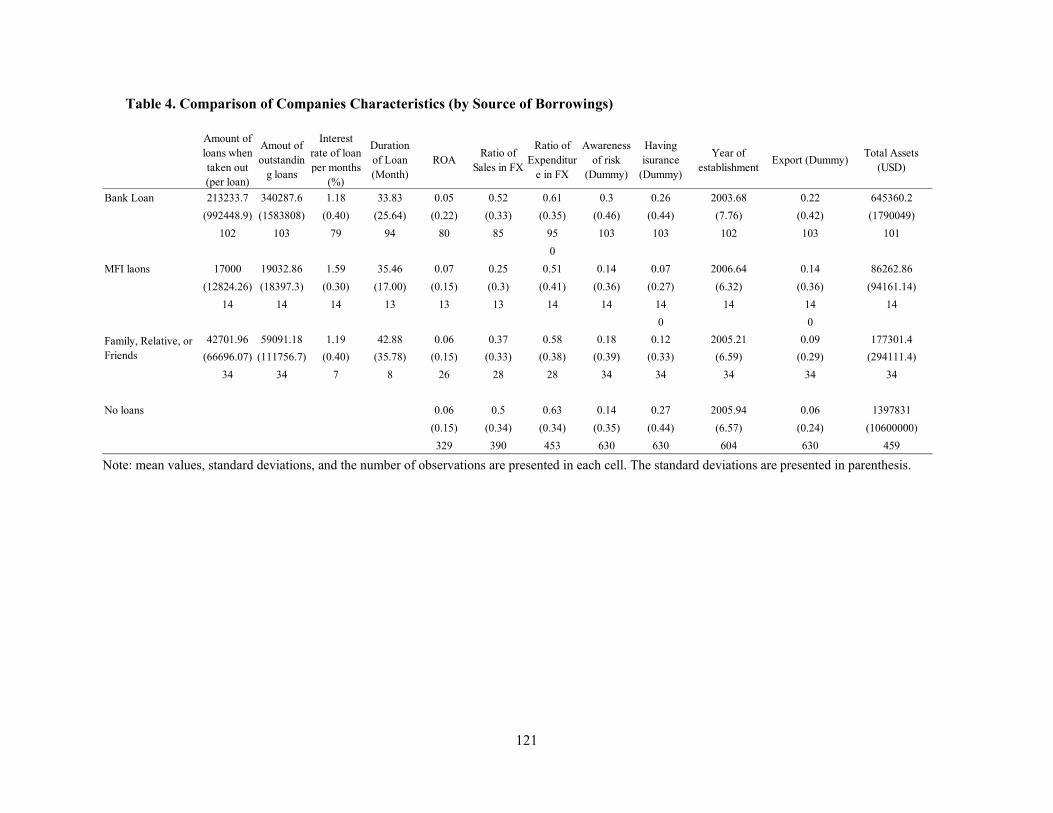
121
Table 4. Comparison of Companies Characteristics (by Source of Borrowings)
Amount of loans when taken out (per loan)
Amout of outstandin
g loans
Interest rate of loan per months
(%)
Duration of Loan (Month)
ROA Ratio of
Sales in FX
Ratio of Expenditur
e in FX
Awareness of risk
(Dummy)
Having isurance
(Dummy)
Year of establishment
Export (Dummy)Total Assets
(USD)
Bank Loan 213233.7 340287.6 1.18 33.83 0.05 0.52 0.61 0.3 0.26 2003.68 0.22 645360.2
(992448.9) (1583808) (0.40) (25.64) (0.22) (0.33) (0.35) (0.46) (0.44) (7.76) (0.42) (1790049)
102 103 79 94 80 85 95 103 103 102 103 101
0
MFI laons 17000 19032.86 1.59 35.46 0.07 0.25 0.51 0.14 0.07 2006.64 0.14 86262.86
(12824.26) (18397.3) (0.30) (17.00) (0.15) (0.3) (0.41) (0.36) (0.27) (6.32) (0.36) (94161.14)
14 14 14 13 13 13 14 14 14 14 14 14
0 0
42701.96 59091.18 1.19 42.88 0.06 0.37 0.58 0.18 0.12 2005.21 0.09 177301.4
(66696.07) (111756.7) (0.40) (35.78) (0.15) (0.33) (0.38) (0.39) (0.33) (6.59) (0.29) (294111.4)
34 34 7 8 26 28 28 34 34 34 34 34
No loans 0.06 0.5 0.63 0.14 0.27 2005.94 0.06 1397831
(0.15) (0.34) (0.34) (0.35) (0.44) (6.57) (0.24) (10600000)
329 390 453 630 630 604 630 459
Family, Relative, or Friends
Note: mean values, standard deviations, and the number of observations are presented in each cell. The standard deviations are presented in parenthesis.

122
Figure 1: The Ratios of Foreign Currency Income and Expenditure
Note: The figure shows the ratio of FX currency in revenues and expenditures, respectively. The x-axis represents the ratio of FX currency in expenditure, and the y-axis represents the ratio of FX currency in revenues.
4. Determinants of the Capital Structure of Cambodian Firms
In this section, we present the analytical framework and hypothesis in firm’s borrowing behaviors in the case of Cambodia. As seen in section 3, most of borrowing is in USD, indicating that the Cambodian firms can only raise external funds in FX currency.1 In the previous empirical literature of FX borrowing, it has been found that firms typically raise funds using both FX loans and FX denominated loans, and there is a wide dispersion in the ratios of FX loans in liabilities. On the other hand, as observed in section 3, the tendency in usage of FX loans in Cambodian firms is different. In particularly, loan from commercial banks, which might be firms’ important sources of borrowing, are almost entirely issued in USD. Accordingly, the conventional estimation of the determinants of the FX
1 As shown in Supplementary Figure 1, almost 100% of bank loans in Cambodia are US dollar-denominated. Furthermore, as in Supplementary Figure 2, banks keep a large amount of their capital reserves in the National Bank of Cambodia, and the banks’ investment posture is considered discretionary.
123
loan ratio to total loans, which appear frequently in prior research, is not applicable to the case of Cambodia.
Therefore, since they cannot choose the currency in loans as they want to, then Cambodian firm’s capital structure problem could involve another additional determinant, apart from conventional corporate finance theories, such as trade-off theory, agency cost approach, and pecking order theory. In practice, the financing sources for the Cambodian firms consist of three choices: internal funds, loans from non-banking sources, and FX bank loans. This issue has two aspects: how much external credit they use, and how much FX loans they borrow. In other words, the Cambodian firms with local currency revenues might face the currency mismatch risks when they access to loans. That currency mismatch risk rises in the case of corporate finance in Cambodia. In the following section, we develop the theory and hypotheses for the determinants of capital structure, based on the context of a highly dollarized economy.
4.1 Determinants of debt financing
4.1.1 Trade-off approach
Modigliani and Miller (1958, 1963) argued that in the case of a perfect capital market without information asymmetry, which means there are no transaction costs, and there are no corporate taxes or risk of corporate insolvency, corporate value would not rely on capital structure, and the method of corporate financing would not impact corporate value. In the real world with corporate tax, however, debt financing can provide a tax shield against corporate tax. Thus, firms have an incentive to raise the debt ratio to increase corporate value. However, the merits of debt tax shields weaken when a firm can use various tax deduction and preferential systems besides corporate tax systems, such as systems related to depreciation, investment incentives, and the like (called non-debt tax shields). In Cambodia, there is little awareness of the use of debt tax shields, because knowledge of corporate accounting is poor except for some companies, and the government’s ability to collect taxes is weak. Moreover, in practice, firms do not use non-debt tax shield frameworks, not only because knowledge of accounting and the tax system is not widespread, but also because the Cambodian government follows almost laissez-faire policies.
In practice, according to Feridhanusetyawan (2014), there exist two tax regime in Cambodia: the real regime and estimated regime.2 The real tax regime is focused on large taxpayers and companies which are not sole proprietorship, and includes the value-added tax, standard corporate income tax, and so on (DFDL, 2014).3 In the meantime, the estimated regime is anchored by a 2 percent of turnover tax and a profit tax. The number of the taxpayers of the estimated regime is large compared to those of
2 In 2015, under a December 2015 amendment of the Law on Taxation, the estimated regime was eliminated, and all taxpayers are required to follow the real regime. 3 According to DFDL (2014), the standard rate for the corporate income tax is 20 percent of its profit. Under the real regime, firms are also required to charge the value-added tax at the standard rate of 10 percent on taxable supplies. For the detail of other applicable taxation, see DFDL (2014)
124
the real regime. Furthermore, since most of Cambodian firms are not registered and the law enforcement is low, it is difficult for tax office to collect information and estimate precise amounts of tax from the taxpayer of the estimated regime.4 Thus, one can expect to see practically no debt tax shield effect on financing behavior.
On the other hand, companies do have the incentive to lower insolvency risk by lowering their debt ratio because when their dependence on debt increases, the insolvency risk rises due to exposure to exogenous shocks. One can expect a lower debt ratio because the cost of debt financing rises as the firm’s insolvency risk rises (Rajan and Zengles, 1995; Koksal, and Orman, 2015).5 Moreover, because companies with higher rates of return have less operational risk due to their larger cash flows, these companies may have an incentive to take out larger amounts of debt financing.
Hypothesis 1: As firms’ business risks increase, the leverage ratio of firms will decrease.
4.1. 2 Agency cost approach
In a world with information asymmetry and imperfect contracts, firms may encounter the agency problem, characterized by the conflict of interests among the firm’s stakeholders, including shareholders, managers, and creditors. In Cambodia, few hostile takeovers occur, firstly because high concentration ownership is normal, not only for micro enterprises and medium-sized enterprises, but also for large companies; and secondly because there is no well-established stock market. On the other hand, there is a large information gap between external creditors such as financial institutions and firms, and high costs to screen and monitor investment targets, which is an impediment for firms to seek external financing (Allayannis et al., 2003). The low level of business acumen and the slow adoption of bookkeeping systems make it difficult for external creditors to evaluate the operational standing of a firm.6 Thus, the issue of agency costs involved in Cambodian firms is likely to occur between large shareholders who also serve as management and external creditors.
The firm can resolve agency issues between external creditors and managers by providing collateral (Allayannis et al., 2003). Significant problems exist related to information asymmetry in new projects for small-scale firms and firms with high growth potential (Clark et al., 2008). Therefore, one can expect that it becomes easier to secure financing from external creditors as the firm acquires more fixed assets to use as collateral or the firm grows in size.
4 According to Economic Census 2011, the firms which are registered are only 3.44 percent of all the surveyed firms in 2010. 5 Desai et al. (2008) empirically verify that firms adjust the size of risk by adjusting the capital composition for large management risks. On the other hand, Booth (2001) empirically analyzes the relationship between the capital composition among Asian countries and the standard deviation of sales as management risk, and finds differing results, which are in the positive or negative direction depending on the country. 6 According to an exhaustive survey of the company census performed in 2011, close to 99% of Cambodian companies operate informally, without operating licenses from the supervising government agency.
125
Hypothesis 2: As information asymmetry between firms and creditors increases, firms’ leverage ratio will decrease.
4.1.3 Financial hierarchy
Under conditions of information asymmetry between a lender and a borrower, the cost of financing will depend on its source (Fazzari et al., 1988: Froot et al., 1993). In Cambodia, there are large differences in information asymmetry depending on the financing source. Therefore, in line with the suppositions of the financial hierarchy theory, one can also assume that companies will first secure financing from their own funds and from related parties with which there is little information asymmetry, and then will seek financing from micro finance firms with which there is relatively little information asymmetry, and will finally secure financing through bank loans, which have the highest information asymmetry.7 Generally, the sufficiency of a company’s internal reserves increases as its potential retained earnings increases. Since companies with high rates of profit have higher amounts of internal reserves available for financing, these companies are not likely to secure access to external funding. In other words, the higher a company’s rate of profit, the smaller its debt ratio is expected to be.
Hypothesis 3: As availability of firms’ internal funds increases, the leverage ratio will decrease.
4.2 Additional determinants related to FX borrowing
When debt in foreign currency are procured additional insolvency risk factors and agency costs could arise, compared to procuring debt in the local currency. It is important to make adjustments for the situation in Cambodia with regard to such risks and issues.
4.2.1 Currency mismatch risks between cash inflow and debts
In Cambodia, in addition to regular insolvency risks, there is also the potential for insolvency arising from a mismatch between currencies due to dollarization in the economy. In developing countries in which dollarization has occurred, the interest rate on US dollar-denominated debt is generally lower than that on national-currency denominated debt. When a company that has national-currency denominated revenues uses US dollar loans, it has an advantage in that the loan interest rate is lower than that for national-currency denominated loans. However, there is also the disadvantage of higher costs in case of financial ruin due to the currency mismatch between revenue and loans repayable.
7 Presenting objective information is crucial for a creditability evaluation for bank loans. More than half of micro and small enterprises cannot access bank loans because they cannot submit documents to allow for an objective evaluation.
126
Jeanne (2005) and Cowan (2006) theoretically revealed that in the case that the aforementioned trade-off relationship exists, risk-averse firms tend to have more FX loans if the ratio of FX revenue to total revenue is higher. Luca and Petrova (2008) also provided a theoretical model including both of banks and firms in order to support this theory. They demonstrated that firms with a high level of risk aversion tend to match denomination of loans with the currency in revenues. Meanwhile, Gelos (2003), Allayannis et al. (2003), Aguiar (2005), Brown et al. (2011), Mora et al. (2011), and Kamil et al. (2012) empirically verified that when firms choose a loan currency, they match the currency composition of debts and revenues.8 As these studies show, as the ratio of FX revenue to total revenue increases, the ratio of FX debt to total debt is expected to increase, as all others else equal.
Hypothesis 4: If a firms has a larger share of FX currency in the revenue, the leverage ratio of firm will rise.
4.2.2 Agency cost problems and debt in FX currency
Prior researches also find an additional agency costs related to FX currency borrowing. Allayannis et al. (2003) uncovered a relationship in which as firms own higher amounts of fixed assets, the more likely they are to use foreign currency credit. This suggests that the company’s ability to provide collateral is an important variable as a determinant for loans, even when the economy has shifted to US dollars. In addition, Allayanniset et al. (2003) revealed that the firms were inclined to have a higher debt ratio as their use of US dollar debt increased. This suggests that companies that use foreign currency debt have information asymmetry with external creditors that differs from that of other firms, and that there is a propensity for these companies to find it easier to access financing. Moreover, according to Brown et al. (2014), when information is insufficient for external creditors to verify the currency composition of company revenues, there could be an adverse selection of companies with local currency revenues choosing FX debt because FX debt financing has a lower interest rate than local currency debt. This view also derives the Hypothesis 2 in the context of Cambodia.
4.2.3 Difference in sensitivity to currency mismatch risks
As pointed out in the previous literature, the extent of corporate risk management could be different among firms (Froot et al., 1993; Allayannis et al., 2003). In other words, there possibly exists heterogeneity in hedging behaviors against the currency mismatch risks. In the highly dollarized countries, where FX currency borrowings are only available for external funds, borrowing money always comes along with the additional cost as currency mismatch risks, particularly for the firms with
8 Accordingly, the export company dummy used as a representative variable for foreign currency revenue has a significantly positive relationship with the probability of selecting US dollar debt, and this evidence supports the argument of firms’ risk averse actions in selecting the currency denomination of debt.

127
local currency income. In this regards, the hedging behaviors against currency mismatch risks could differ among the firms depending on firm’s characteristics.
We conjecture that availability of internal funds could be a factor to derive the heterogeneity in hedging behaviors against the currency mismatch risks. In the case that a marginal benefit of external funds exceeds cost of hedging, firms would choose not to hedge the risk in borrowing. As previous study suggests that increase in the cost of funds will lead to an increase in values for firms to take a hedging behavior (Froot et al., 1993), it is natural to assume that firms would likely adjust the risk of currency mismatches to take out external funds. In the meantime, the marginal benefit of external funds depends on the availability of internal funds. Therefore, firms with smaller internal funds would likely ignore the currency risk, since the benefit of obtaining sufficient funds outweighs the currency mismatch risk. Accordingly, since there is only FX currency available for external funds in Cambodia, firms would borrow less if they have less FX currency in income, due to the currency mismatch risk. Meanwhile, firms with insufficient internal funds would likely borrow no matter how much they have FX currency in income.
Hypothesis 5: As availability of internal funds decreases (increase), the sensitivity to currency mismatch risks would decrease (increase).
5. Methodology 5.1 Estimation strategy As mentioned earlier, firms with debts are likely to choose commercial banks, and debts from commercial banks are on average much larger than those from other funding sources. 9 Given that borrowings from kinship network and MFIs has different characteristics and in practice can be seen as a type of internal funding, the bank borrowing is only significant external funding source for firm’s financing in Cambodia. Based on these findings above, we examine what factors affect firm’s asset structure in Cambodia, which is one of the most dollarized economies, using the survey-based data. In our study, we regress the ratios of bank loans to total assets on the firm’s characteristics. Specifically, we estimate the following equation (1):
ln / 1
9 In fact, we run several regressions with MFI loans and loans from kinship network as dependent variable instead of bank loans. Most of the results in coefficients were different from the bank loans. These results are available on request.

128
where / represents the ratio of bank loans to total assets of firm i in industry
j.10 represents a vector of firm characteristics of firm i in industry j. It is natural to assume that the debt
dependency varies across industries. Therefore, we control for the effect by including industry dummies in the model. In this study, we categorize into four industries; the manufacturing sector, the retail and wholesale trade sector, the tourism sector, and others.
It is noteworthy that all of bank loans of firms in our sample are denominated in USD. Thus, our regression model does not only capture the conventional factors in relationship between capital structure and firm’s characteristics, but also capture the additional factor in the relationship between foreign currency borrowing and firm’s characteristics, in particular currency mismatch risks.
5.2 Explanatory variables First, we employ a volatility of monthly sales as an indicator of firm’s operational risks, in order to
test the Hypothesis 1 of the trade-off theory. Specifically, in our dataset, there are respondent’s self-evaluation for changes in sales of each of 12 months, as five categories: “No sales”, “Decrease”, “Stable”, “increase”, and “Highest”. We treat the variable as a continuous variable from 1 to 5, and calculate a standard deviation of the variable as the volatility of monthly sales for each firm.
In addition, we further control for the effect of having insurance, in order to capture the extent of operational risks of enterprises, since having insurance generally decreases the risk of unanticipated expenditures. Furthermore, those firms are likely to pay attention to risk management, and likely to manage to mitigate operational risks. The survey data includes answers to the question, “do you have any following insurance?: (1). Health insurance, (2) liability/accident insurance, (3) car/motorbike insurance, (4) other business insurance, (5) agricultural insurance, (6) director liability insurance, (7) others.” We use the insurance dummy which takes one if firms have an insurance for their operation. We expect that this variable would positively affect amounts of bank loans.
Secondly, we test if the agency cost hypothesis fit in Cambodian firms by examining following three variables. To test the Hypothesis 2, we proxy the ratio of fixed assets to total assets for collateral values of firms, which are considered to reduce information asymmetry problem between firms and lenders (Booth, 2001; Allayannis et al., 2003). Regarding the Hypothesis 3, we employ the profitability which is supposed to reflect the availability of firm’s internal funds. In order to capture the profitability, we include a return on assets (ROA). ROA is created by subtracting the amount of expenditure from the total income and dividing it by total assets.
In order to investigate the effects of additional business risks stemming from dollarized environments, we use a ratio of foreign currency income to total income in the model to examine the relationship between foreign currency borrowing and the currency composition of revenues (Hypothesis 4). In previous studies, dummies for export firms, or a ratio of income from exporting to total income have been used as a proxy for the foreign currency income due to limitation on the data availability (Brown et
10 We found that bank loans were all denominated in USD in our dataset.
129
al., 2011; Mora et al., 2011). However, in the case of Cambodia, since a lot of firms use foreign currency in domestic transactions as well as local currency, it is inappropriate to use income from exporting as a proxy for foreign currency income. Accordingly, we employ the ratio of foreign currency income. However, since there is the possibility that export firms tend to have larger loans, we also estimate the model with an exporter dummy to control for the effect.
Finally, it is expected that the extent of information asymmetry and operational risks could differ among industries. Since in Cambodia, the financial system is immature as well as other developing countries, it is likely that the differences may severely affect the firm’s decision. Thus, we control for the differences by using industry dummies. Furthermore, to control for the regional differences in financial deepening and accessibility to finance, we use the rural areas dummy which represent whether firms are located in rural areas or urban areas. 11
5.3 Sample selection bias due to borrowing constraints In Cambodia, it is likely that firms with demand for loans can hardly access to commercial bank
loans, due to the informationally opaqueness and low abilities of banks to extend loans to such firms.12 Cambodia is categorized into low-income country and most of extant firms are small or medium-sized. Furthermore, there is no explicit standard for accounting and many firms do not keep official accounting records. Therefore, firms are likely to be screened out by commercial banks instead of their demand for loans.
Firms which only borrows from microfinance institutions (MFIs) and kinship network might face the financial constraints. We found that some of firms in our dataset only borrowed from MFIs, or their families and relatives (kinship networks), instead of commercial banks. It might be easier for firms to borrow from MFIs than from commercial banks, since MFIs use specific lending scheme to lend to the poor and small/medium-sized enterprises by exploiting soft information, while commercial banks mainly use hard information to screen out firms, such as financial statements. Kinship networks are the fund sources which firms can easily access because information asymmetry is smallest among others. On the other hand, it is more difficult to borrow large amounts of money and more likely to suffer from insufficient amount of fund from MFIs or kinship networks than that of from commercial banks. In addition, the interest rates on loans from MFIs are likely to be higher than commercial banks. Therefore, it is natural to assume that firms would borrow from the commercial banks if firms can finance from commercial banks, and firms which have only loans from MFIs and kinship networks are likely to face borrowing constraints.
Accordingly, estimating the equation (1) can be subject to sample selection biases due to firms which are not able to borrow from commercial banks despite their demand for external fund. To carry out
11 Firm size is excluded from the determinants of bank borrowing, since firm sizes are usually used for the proxy of operational risks and we already control for it by including other risk indicators (Yu & Aquino, 2011; Chang et al., 2014) 12 According to World Bank Global Findex, financial inclusion rates in Cambodia are 28% as percentages of people at age of over 15 in terms of the number of formal borrowing, 22% in terms of the number of accounts in formal financial institutions, and 4% in terms of the number of formal savings.
130
the unbiased estimation, it is necessary to consider the sample selection process in the estimation, that is, the process of whether firms access to commercial bank loans or not. However, our dataset does not cover the information of which firms are exactly facing borrowing constraints or screened out (rejected) by banks. Thus, we assume that firms with debt from MFIs or kinship networks were not able to borrow from commercial banks, and they borrowed from MFIs or kinship networks. Under such an assumption, we run the selection equation below.
1 0 2
where represents the dummy variable which take on one if the firm i in
industry j borrowed from commercial banks and zero if they borrowed from MFIs or kinship networks.
and are vectors of variables which are determinants of accessibility to bank loans. We use the same
variables used in equation (1) as , and use variables which satisfy the exclusive restriction as . For
the variable which satisfy the exclusive restriction, we employ firm size. Hardlock and Pierce (2010) study the determinants of borrowing constraints for firms, and find that firm size is one of the significant factors to determine whether firms can access to financial institutions to borrow more. This is also likely to be the case in Cambodia, since the lender which can provide large funds is limited to commercial banks in
Cambodia. We use the logarithm of total assets as . 13
6. Empirical Results As describe earlier, the number of firms with loans are 223 in our dataset. However, since ewe dropped sample which have missing values in amounts of loans and explanatory variables, the sample size became 103 firms. Out of 103, firms which borrowed from commercial banks are 70 and those which borrowed from family/relatives or MFIs are 33.
Table 5 shows the results of the estimation of determinants of Cambodian firm’s capital structure. In the estimation, we employed two-step Heckman model. First, we estimated equation 2 using Probit
13 In the previous studies which investigate the capital structure of firms, some studies assume that firms with no loans (firms with zero in amounts of outstanding loans) are the ones which did not have demand, and includes such firms in the sample by employing Tobit model. However, accounting for the immaturity of stock market and the low achievement in financial inclusion of in Cambodia, it is likely that there are a number of firms which cannot borrow from banks despite their demand for loans, since bank give up to produce information on firms due to high information asymmetry. Those firms are not able to choose the optimal capital structure. In fact, we estimated the equation (1) with Tobit mode by including the firms with no loans, and we found that the results are different from the results from OLS estimation with the sample which exclude the firms with no loans, and also different from the results in the section 6. Therefore, we believe that model with the section equation fit in the context of the Cambodian firms.
131
model, and calculated the inverse Mill’s ratio. Finally, using OLS, we estimated the equation 1 including the inverse Mill’s ratio in regressors. In Table 5, we presented the estimation results both of equation 1 (Main equation) and equation 2 (Selection) from three different models. Model 1 is presented as the baseline model. In Model 2, we included an exporter dummy which takes on one if firms export goods. In Model 3, we included an interaction term of the ratio of USD in sales and ROA. In Model 4, in order to take into account the regional difference in the accessibility to financial markets, we included a rural dummies which takes on one if firms are located in rural areas.14
In Table 5, we find that the inverse Mill’s ratios are significantly and positively estimated in main equation of all models. We also find that the coefficients of logarithm of total assets, which we included as the exclusive restriction in equation 2, are significantly positive. Those results suggest that the sample selection bias which comes from borrowing constraints affects the estimation of the simple OLS method. The results also indicate that the firm size is important factor to determine the firm’s access to bank loans in Cambodia.
Regarding firm’s borrowing behaviors, the results are mostly consistent to our hypotheses (Hypothesis 1-2). Firstly, we find that the coefficient of the ratio of fixed assets to total assets (Ratio of Fixed Assets) is significant and positive in all models. In line with Booth et al. (2001) and Allayannis et al. (2003), the results indicate that firms with more fixed assets can easily borrow when borrowing from commercial banks. Accordingly, the results imply that whether or not firms have non-financial and collateralizable assets is an important factor to determine whether firms can borrow from commercial banks, due to high information asymmetry in commercial bank’s loan markets as well as other developing countries.15
14 For the industrial dummies, we defined the categories of industrial sectors as (1) manufacture, (2) retail and wholesale, (3) hotel and tourism sectors, and (4) others. We made dummy variables which represent sectors above, respectively. 15 We also regressed the total-loans-to-asset ratio which includes loans from MFIs or kinship networks. In that case, we did not find the significant signs with the ratio of fixed assets. It might suggest that the collateralizable assets are not the determinants of firms’ borrowing from MFIs and kinship network, possibly because of low information asymmetry when borrowing from those sources. The results are available on requirement.
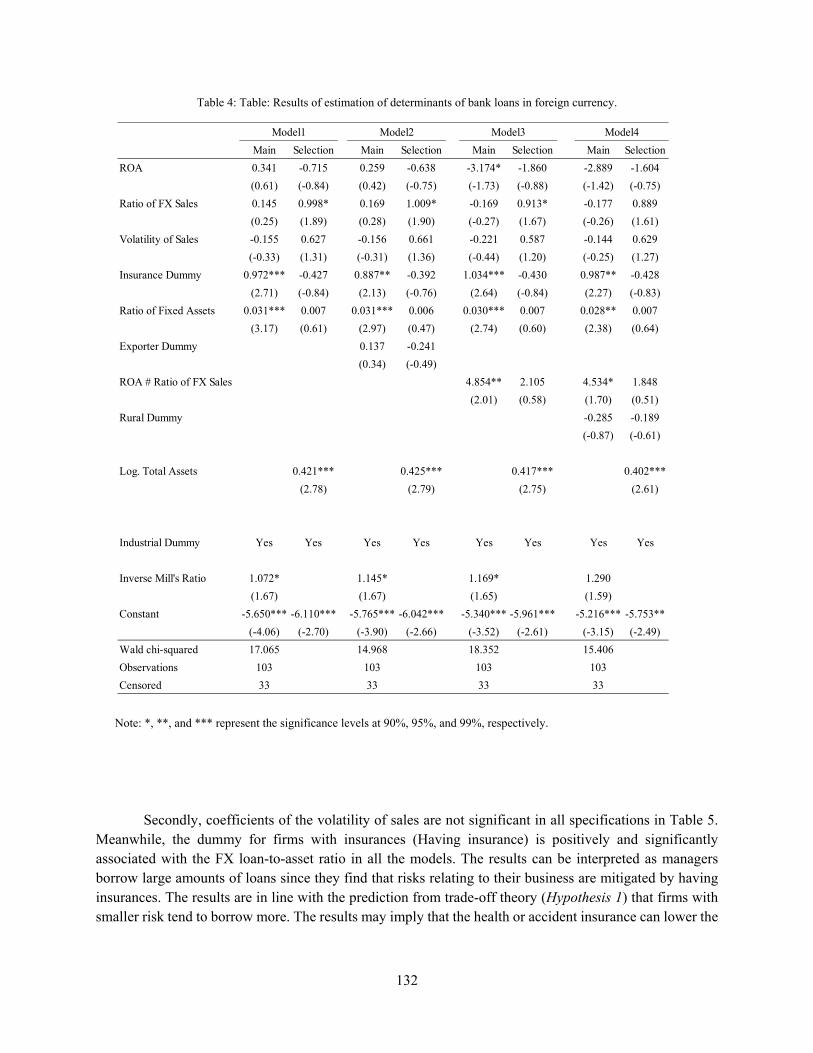
132
Table 4: Table: Results of estimation of determinants of bank loans in foreign currency.
Main Selection Main Selection Main Selection Main Selection
ROA 0.341 -0.715 0.259 -0.638 -3.174* -1.860 -2.889 -1.604
(0.61) (-0.84) (0.42) (-0.75) (-1.73) (-0.88) (-1.42) (-0.75)
Ratio of FX Sales 0.145 0.998* 0.169 1.009* -0.169 0.913* -0.177 0.889
(0.25) (1.89) (0.28) (1.90) (-0.27) (1.67) (-0.26) (1.61)
Volatility of Sales -0.155 0.627 -0.156 0.661 -0.221 0.587 -0.144 0.629
(-0.33) (1.31) (-0.31) (1.36) (-0.44) (1.20) (-0.25) (1.27)
Insurance Dummy 0.972*** -0.427 0.887** -0.392 1.034*** -0.430 0.987** -0.428
(2.71) (-0.84) (2.13) (-0.76) (2.64) (-0.84) (2.27) (-0.83)
Ratio of Fixed Assets 0.031*** 0.007 0.031*** 0.006 0.030*** 0.007 0.028** 0.007
(3.17) (0.61) (2.97) (0.47) (2.74) (0.60) (2.38) (0.64)
Exporter Dummy 0.137 -0.241
(0.34) (-0.49)
ROA # Ratio of FX Sales 4.854** 2.105 4.534* 1.848
(2.01) (0.58) (1.70) (0.51)
Rural Dummy -0.285 -0.189
(-0.87) (-0.61)
Log. Total Assets 0.421*** 0.425*** 0.417*** 0.402***
(2.78) (2.79) (2.75) (2.61)
Industrial Dummy Yes Yes Yes Yes Yes Yes Yes Yes
Inverse Mill's Ratio 1.072* 1.145* 1.169* 1.290
(1.67) (1.67) (1.65) (1.59)
Constant -5.650*** -6.110*** -5.765*** -6.042*** -5.340*** -5.961*** -5.216*** -5.753**
(-4.06) (-2.70) (-3.90) (-2.66) (-3.52) (-2.61) (-3.15) (-2.49)
Wald chi-squared 17.065 14.968 18.352 15.406
Observations 103 103 103 103
Censored 33 33 33 33
Model1 Model2 Model3 Model4
Note: *, **, and *** represent the significance levels at 90%, 95%, and 99%, respectively.
Secondly, coefficients of the volatility of sales are not significant in all specifications in Table 5. Meanwhile, the dummy for firms with insurances (Having insurance) is positively and significantly associated with the FX loan-to-asset ratio in all the models. The results can be interpreted as managers borrow large amounts of loans since they find that risks relating to their business are mitigated by having insurances. The results are in line with the prediction from trade-off theory (Hypothesis 1) that firms with smaller risk tend to borrow more. The results may imply that the health or accident insurance can lower the

133
risks in business, and have a positive effect on firm management by reducing the borrowing constraints in Cambodia.
We find that the estimated coefficients of the ratio of FX currency in sales (Ratio of FX sales) are not significant in main equation of all models, although Cambodia is one of the most dollarized economy. The results do not support our hypothesis that firms with more FX currency in sales borrow more FX loans. Interestingly, it might seem that firm’s FX currency borrowing are not affected by the FX currency ratio even in the heavily dollarized economy. Meanwhile, we find interesting results in Model 3 and 4, which both include the interaction term of ratio of FX currency in sales and ROA. Firstly, we find that the ROA is negatively estimated in Model 3. In line with our hypothesis from the pecking order theory (Hypothesis 3), the results suggest that firms with a plenty of internal funds are unlikely to have external funds, possibly due to the high cost of external funds. Secondly, we find that the interaction term of ratio of FX currency in sales and ROA is positively and significantly associated with the FX loan-to-asset ratio. It means that the relationship between the ratio of FX currency in sales and FX loan-to-asset ratio differ depending on the availability of internal funds. In other words, the firms with more internal funds tend to adjust the currency mismatch risk, while the firms with less internal funds do not take care of such a risk. Therefore, the results are in line with our hypothesis (Hypothesis 5), and further provide an important implication that there exists the heterogeneity in firm’s behaviors relating to currency mismatch, and the insignificant results in Model 1 and 2 might come from the misspecification of heterogeneity.
Furthermore, the ratios of FX sales are significantly positive in equation 2 (Model 1-3), suggesting that firms with large shares of FX currency in sales are more likely to be able to access to bank loans. Those results may suggest that firms with larger share of FX currency in sales are more likely to have lower likelihood to face borrowing constraints from accessing to bank loans. In addition, when including an exporter dummy (Exporter Dummy), we find the same results, which implies that whether or not the firms are exporter does not affect the capital structure. It is possibly because the domestic transactions are heavily dollarized in Cambodia.
Regarding the reginal differences in financial development, we find that the dummy for firms located in rural areas are not significant. As argued in the section 2, firms which have commercial bank loans have operated for a longer period. Therefore, there is a possibility that the information asymmetry are low, and financial institutions recognize the managements of such firms and also their loan demand even though firms are located in rural areas. Thus, there is no significant difference in firm’s location as other thighs equal.
7. Conclusion In this paper, we empirically investigated the determinants of firm’s borrowing behaviors in a
highly dollarized economy, using the micro data collected in the survey carried out by JICA-RI and National Bank of Cambodia (NBC) in 2014. We used the financial information of 223 firms which have a loan in the period, and examined the relationship between the firm’s characteristics and a ratio of FX currency loans to total assets. Our contribution is that our study first empirically investigated the firm’s financial behaviors in Cambodia using the large-scale survey-based data. In addition, our study first focused on the borrowing behavior in the highly dollarized environment where only FX currency is available for external funds, while most of previous studies in the literature of dollarization investigated currency choice in loans.

134
Moreover, we took into account the selection problem of whether firms can access to bank borrowing, which is likely to rise in emerging and developing countries. Our findings in Cambodian firms may be helpful for understanding of firm’s financial behaviors in the heavily dollarized environments of other emerging economies. In recent years, dollarization has widespread and increased across countries around the world, and the demands for FX loans have also increased. We believe that the findings in this paper can provide the useful information for further discussion on the global trend in dollarization.
Our empirical results reveal the several interesting facts. Firstly, Cambodian firm’ behaviors are rational and in line with the predictions from the conventional economic theories. In particular, the ratio of fixed assets (availability of a collateral) has a large effect on firm’s FX borrowing from commercial banks. It suggests that provision of collaterals is a significant factor to reduce the agency costs. In other words, the immature financial market may worsen the information asymmetry between banks and firms.
Secondly, whether or not having an insurance (proxy of operational risks) has a significant effect on firm’s FX borrowing from banks. It might be because verifying whether having an insurance is easier for firms, and insurances have efficacy on reduction of operational risks.
Thirdly, an increase in ROA (the availability of internal funds) can reduce the ratio of bank loans. This finding also suggests that, due to significant information asymmetry, there exists clear difference in funding cost between internal and external funds in Cambodia.
Fourthly, as a specific feature in heavily dollarized economies, the interaction term of the ratio of FX currency in sales (the proxy for currency mismatch) and ROA has a positive sign, while the ratio of FX currency in sales per se does not affect the FX borrowing. It means that there is a heterogeneity in firm’ hedging behaviors against currency mismatch risks, and firms with a plenty of internal finds are likely to borrow less FX loans if they have less FX currency in sales. Furthermore, the results imply that firms with less internal funds potentially have the currency mismatch risks in return for obtaining the external funds. In other words, there is a possibility that this firms’ reckless behaviors in borrowing can be a potential risk to Cambodian financial market,
Fifthly, the estimation results indicate that sample selection biases are significant if we run simple OLS model. It suggests that some of firms cannot access to bank loans, and this is an indication of immaturity of the Cambodian financial market.
From those findings above, we can draw several implications for policy issues. Firstly, it is required to reduce information asymmetry between firms and external funders. The results that having a collateral and having insurances have significant effects on firm borrowing behaviors indicates that there exists significant information asymmetry in the Cambodian financial market. In order to reduce the information asymmetry, it is required to develop the bank’s capacity of screening, and for firms to make a decent accounting record and to organize their financial information. Furthermore, it is required for governments to establish the accounting standard and develop financial markets.
Secondly, it is necessary to facilitate firm’s use of a collateral and an insurance in their business. Although land title is most commonly used as a collateral, the land registration is still insufficient in Cambodia. Promotion of the land registration is required to enable firms to acquire enough funds. Furthermore, since Promotion of property insurance and workmen's compensation insurances are also

135
effective to enhance corporate finance, then corporate works of industrial associations, governments, and financial institutions are required.
Thirdly, it is required to deal with currency mismatch risks in dollarized economies. Although Cambodia is one of the most dollarized economies, the ratio of FX currency in sales widely varies across firms, and also there are mismatches in currency compositions between sales and expenditures and between sales and debts. Although the exchange rate of USD to KHR has been stable in recent years, there are potential risks of exchange rate changes in the firm’s operation. Even though it is unrealistic to stop the use of FX currency in a short run, it is important for firms and financial institutions to pay attention to this potential serious issue.
Finally, it is noteworthy that there are still limitations on our study due to data availability. Since our dataset has missing values in several variables, there are constraints on our analysis. For example, the data collected by JICA-NBC only covers the information of outstanding loans. Therefore, it is difficult to distinguish between firms which face borrowing constraints and firms which are not in need of funds. Accordingly, although we used sample selection model to reduce the biases from borrowing constraints, there is still a problem in selection of the firms which face borrowing constraints. The information of whether or not firms have applied to loans in the past is needed to truly examine the selection biases, while we obtained the results which are consistent to our hypotheses despite these problems. In addition, it is difficult to examine the currency mismatches between assets and liabilities using our dataset, since the data does not cover currency denomination of all financial assets. In those regards, the future work will take into consideration how to capture the relevant data, and the design of the next JICA-NBC survey should reflect on those results from our analysis.
Reference Aiba, D & Tha, R. (2017). Dollarization and Enterprise's Behaviors: The Case of Cambodia. Hitotsubashi
Economics, 10(2), 49-80.
Allayannis, G., Brown, G. W., & Klapper, L. F. (2003). Capital structure and financial risk: Evidence from foreign debt use in East Asia, Journal of Finance, 58(6), 2667-2710.
Basso, H. S., Calvo-Gonzalez, O., & Jurgilas, M. (2011). Financial dollarization: The role of foreign-owned banks and interest rates. Journal of Banking & Finance, 35(4), 794-806.
Bodnár, K. (2009). Exchange rate exposure of Hungarian enterprises-Results of a survey (No. 80). MNB Occasional Papers.
Booth, L., Aivazian, V., Demirguc‐Kunt, A., & Maksimovic, V. (2001). Capital structures in developing
countries, Journal of Finance, 56(1), 87-130.
136
Brown, M., Ongena, S., & Yeşin, P. (2011). Foreign currency borrowing by small firms in the transition economies, Journal of Financial Intermediation,20(3), 285-302.
Brown, Martin, Steven Ongena, and Pinar Yeşin, (2014). Information asymmetry and foreign currency borrowing by small firms, Comparative Economic Studies 56, 110-131.
Brown, M., Kirschenmann, K., & Ongena, S. (2014). Bank Funding, Securitization, and Loan Terms: Evidence from Foreign Currency Lending. Journal of Money, Credit and Banking, 46(7), 1501-1534.
Chang, C., Chen, X., & Liao, G. (2014). What are the reliably important determinants of capital structure in china?. Pacific-Basin Finance Journal, 30, 87-113.
Cowan, K. (2006). Firm level determinants of dollar debt?. Central Bank of Chile, Working Paper.
Desai, M. A., Foley, C. F., & Hines, J. R. (2008). Capital structure with risky foreign investment, Journal of Financial Economics, 88(3), 534-553.
DFDL. (2014) LEGAL, TAX & INVESTMENT GUIDE CAMBODIA: 2014. DFDL. Phnom Penh.
Fazzari, S. M., Hubbard, R. G., Petersen, B. C. (1988). Financing constraints and corporate investment. Brookings papers on economic activity, 1988(1), 141-206.
Feridhanusetyawan, T. (2014). Raising Funds for the Future : The Case for an Integrated Revenue Mobilization Strategy. Unteroberdoerster, O. (Ed.) Cambodia: Entering a New Phase of Growth. International Monetary Fund.
Froot, K., Scharfstein, D., & Stein, J. (1993). Risk Management: Coordinating Investment and Financing Problems, Journal of Finance, 48(1), 629-1.
Ize, A. and Levy Yeyati, E. (2003) Financial dollarization, Journal of International Economics, 59, 323-347.
Hadlock, C. J., & Pierce, J. R. (2010). New evidence on measuring financial constraints: Moving beyond the KZ index. Review of Financial studies, 23(5), 1909-1940.
Jeanne, O. (2000). Foreign currency debt and the global financial architecture. European Economic Review, 44(4), 719-727.
Jeanne, M. O. (2003). Why do emerging economies borrow in foreign currency? IMF Working Paper Series (No. 3-177). International Monetary Fund.
Kamil, H. (2012). How Do Exchange Rate Regimes Affect Firms' Incentives to Hedge Currency Risk? Micro Evidence for Latin America. IMF Working Paper, International Monetary Fund.
Luca, A. Petrova, I. (2008) What drives credit dollarization in transition economies? Journal of Banking & Finance, 32, 858-869.
Mackay, P., & Phillips, G. M. (2005). How does industry affect firm financial structure? Review of Financial Studies, 18,1433–1466.
137
Mora, N., Neaime, S., & Aintablian, S. (2013). Foreign currency borrowing by small firms in emerging markets: When domestic banks intermediate dollars, Journal of Banking & Finance,37(3), 1093-1107.
Rajan, R. G., & Zingales, L. (1995). What do we know about capital structure? Some evidence from international data. Journal of Finance, 50(5), 1421-1460.
Ranciere, R., Tornell, A., & Vamvakidis, A. (2010). Currency mismatch, systemic risk and growth in emerging Europe. Economic Policy, 25(64), 597-658.
Reinhart, C., K. Rogoff and M. Savastano (2003). Addicted to dollars, NBER Working Paper No. 10015.
Yu, D. D., & Aquino, R. Q. (2009). Testing capital structure models on Philippine listed firms. Applied Economics, 41(15), 1973-1990.
World Bank. (2015). Cambodia economic update: maintaining high growth. Cambodia economic update. Washington, D.C.: World Bank Group.

138
Appendix A: Difference between firms with bank loans and firms with no loans
Here, we investigate the difference between firms with bank loans and firms with no loans. Our analysis was focused on the firms which have at least one outstanding loans in the period.16 However, representativeness of the firms which have loans is vague. In this appendix section, we investigate the potential biases in our analysis of this chapter, and draw some limitations in our analysis.
First, we compared several firm characteristics between firms with bank loans and firms with no loans (Table A1). When we compare firms with bank loans to those with no loans, there are no significant difference in dollarization indicators, such as the ratio of FX currency in sales and expenditures. Meanwhile, we find statistically significant differences in exporter dummy, sales, and years of establishment. Average amounts of sales of those with bank loans are larger than firms with no loans. It might indicate that larger firms are likely to access to external funds. We find that exporters are also likely to access to external funds. Furthermore, older firms are more likely to borrow from external finance sources. It might indicate that information asymmetry is intense or the ability of banks to extend loans to opaque firms is low in Cambodia. It means that the sample in our analysis are biased to the firms which are likely to be transparent and large.
Next, we compared the sample distribution in terms of economic sectors, provinces, and firm sizes, between them. Table A2, A3 and A4 shows the results of the comparison, respectively. Compared to firms with no loans, we find difference in the distribution of economic sectors in firms with bank loans (Table A2). The percentages of “manufacturing” and “wholesale and retail” are larger in firms with bank loans than those of firms with no loans. It suggests that those sectors are more likely to be dependent on external finance, and our representativeness are biased to those sectors. Furthermore, in terms of sample distributions of provinces and firm sizes, we find some differences between firms with no loans and with bank loans. We find that sample of firms with bank loans are biased to provincial areas. The percentages of firms with bank loans in Phnom Penh is 9 percent, while that of firms with no loans is 25%. It means that firms in Phnom Penh are unlikely to access to external finance. It might be because the firms in Phnom Penh can manage to finance the project by using their own internal funds. Again, we find that firms with bank loans are larger in asset sizes than firms with no loans (Table A4).
16 Therefore, our results could be biased due to the selection bias that some firms with demand for loans are excluded from our regression, even though we attempted to reduce selection biases in our regression by using two-step Heckman selection model under the strong assumption that firms with loans from kinship network and MFIs are screened out from banks and then they face the borrowing constraint.
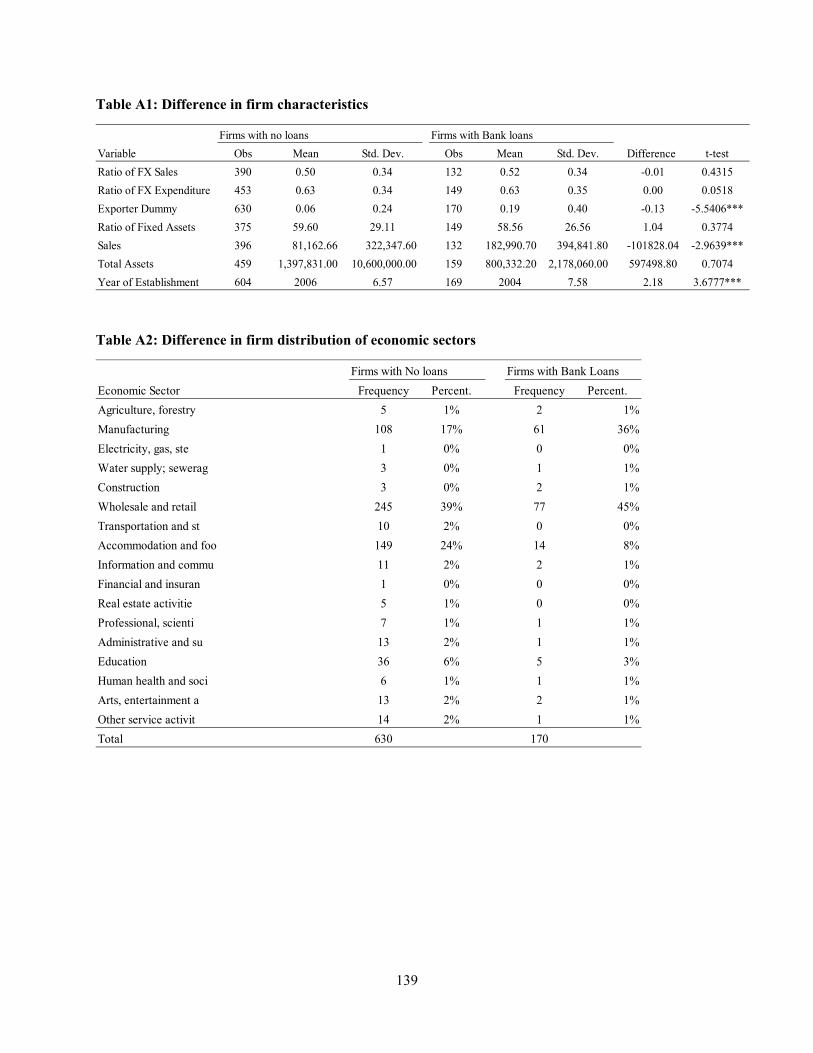
139
Table A1: Difference in firm characteristics
Firms with no loans Firms with Bank loans
Variable Obs Mean Std. Dev. Obs Mean Std. Dev. Difference t-test
Ratio of FX Sales 390 0.50 0.34 132 0.52 0.34 -0.01 0.4315
Ratio of FX Expenditure 453 0.63 0.34 149 0.63 0.35 0.00 0.0518
Exporter Dummy 630 0.06 0.24 170 0.19 0.40 -0.13 -5.5406***
Ratio of Fixed Assets 375 59.60 29.11 149 58.56 26.56 1.04 0.3774
Sales 396 81,162.66 322,347.60 132 182,990.70 394,841.80 -101828.04 -2.9639***
Total Assets 459 1,397,831.00 10,600,000.00 159 800,332.20 2,178,060.00 597498.80 0.7074
Year of Establishment 604 2006 6.57 169 2004 7.58 2.18 3.6777***
Table A2: Difference in firm distribution of economic sectors
Firms with No loans Firms with Bank Loans
Economic Sector Frequency Percent. Frequency Percent.
Agriculture, forestry 5 1% 2 1%
Manufacturing 108 17% 61 36%
Electricity, gas, ste 1 0% 0 0%
Water supply; sewerag 3 0% 1 1%
Construction 3 0% 2 1%
Wholesale and retail 245 39% 77 45%
Transportation and st 10 2% 0 0%
Accommodation and foo 149 24% 14 8%
Information and commu 11 2% 2 1%
Financial and insuran 1 0% 0 0%
Real estate activitie 5 1% 0 0%
Professional, scienti 7 1% 1 1%
Administrative and su 13 2% 1 1%
Education 36 6% 5 3%
Human health and soci 6 1% 1 1%
Arts, entertainment a 13 2% 2 1%
Other service activit 14 2% 1 1%
Total 630 170

140
Table A3: Difference in firm distributions of provinces
Firms with No loans Firms with Bank Loans
Provinces Frequency Percent. Frequency Percent.
Banteay Meanchey 31 5% 10 6%
Battambang 50 8% 23 14%
Kampong Cham 27 4% 8 5%
Kampong Chhnang 24 4% 12 7%
Kampong Speu 33 5% 7 4%
Kampong Thom 18 3% 5 3%
Kampot 19 3% 3 2%
Kandal 26 4% 11 6%
Kep 8 1% 1 1%
Koh Kong 9 1% 2 1%
Kratie 12 2% 1 1%
Modul Kiri 6 1% 3 2%
Otdar Meanchey 7 1% 1 1%
Pailin 8 1% 1 1%
Phnon Penh 159 25% 15 9%
Preah Sihanouk 18 3% 2 1%
Preah Vihear 6 1% 3 2%
Prey Veng 31 5% 13 8%
Pursat 10 2% 8 5%
Ratanakiri 10 2% 3 2%
Siem Reap 45 7% 12 7%
Stung Treng 9 1% 3 2%
Svay Rieng 21 3% 5 3%
Takeo 22 3% 10 6%
Tboung Khmum 21 3% 8 5%
Total 630 170
Table A4: Difference in firm distributions of firm sizesFirms with No loans Firms with Bank Loans
Provinces Frequency Percent. Frequency Percent.
Micro 170 27% 24 14%
Small 176 28% 53 31%
Medium 136 22% 41 24%
Large 148 23% 52 31%
Total 630 170 Note: Firm sizes represent the amounts of total assets, as classified in this chapter.

141
Chapter 6: Conclusion
This dissertation explores the new findings related to the several topics of financial markets in developing countries, from various aspects of financial institutions, households, and firms. The developing countries experienced the rapid growths in a decade, but they still have a lot of challenges in the financial sector. Particularly, the financial sector in developing countries commonly have the vulnerabilities to external shocks and political instability. While most of studies on banking, household finance, and corporate finance have mostly dealt with developed countries, financial systems in developing countries tend to lack rigid empirical investigation into its financial sector, mainly because of limitation on the data availability.
In this regard, our unique data allowed us to empirically investigate the issues in Cambodian financial sector. The Cambodian financial sector has distinct institutional features, and provides a lot of unique environments to study controversial topic in the literature of finance. In this dissertation, we picked four topics which are commonly big problems in developing and emerging countries: (1) efficiency of banks, (2) vulnerability in the banking sector, (3) foreign currency borrowing by households, and (4) foreign currency borrowing by firms.
In this dissertation, we provided an institutional setting of the Cambodian financial sector and brief introduction of emerging issues of Cambodian financial sector in Chapter 1. Especially, we described the problems stemming from the recent rapid expansion of the banking sector and vulnerability to external shocks, and the issues of dollarization. In the following Chapter 2-5, we attempted the empirical analyses on those issues in the Cambodian financial sector, and drew several implications for financial development of a developing countries. We found that in the Cambodian financial market, which is the low-regulated financial system, the foreign-owed banks exhibit lower efficiency, and the Cambodian financial institutions are exposed to risks of deposit withdrawals caused by political instability. Those findings suggest that the Cambodian banking sector needs some restriction on entry and some measures for financial stability. In addition, we found the empirical evidence that Cambodian dollarization in households is the consequence of risk-hedging behaviors, and firms face difficulty in managing currency mismatch risks since they can only borrow in USD from commercial banks. Those findings are different from the previous studies, and might suggest that, in de-dollarization process, the Cambodian government should not only promote the local currency loans, but also they should facilitate firms to provide wages in local currency. And regarding firms, it is needed to develop local currency loan market to make it easier for firms to manage their currency mismatch risks in raising funds.
Most of our analyses in this dissertation are pioneering works in the Cambodian financial sector, while most of previous studies have relied on macro-level data. We therefore hope that the results of our studies might provide the foundation of future researches on the Cambodian financial markets. In fact, there have been improvements in the data availability of Cambodian financial institutions. The central bank of Cambodia has constantly elaborated to make more data publicly open in order to make its banking sector transparent and to facilitate resilience. As well, there has been significant development in data availability of households and firms, which is initiated by the national statistical office of Cambodia. Those facts indicate that the Cambodian economy would attract more attention from academics for studies of banking, corporate and household finance, and also economic development.
Even though we investigated several topics in the Cambodian financial markets, there are still interesting topics left for academic researchers and policy makers. For example, regarding the dollarization,

142
the central bank of Cambodia finally started to implement concrete policy measures to promote the local currency in December 2016. They started to regulate all the registered financial institutions to possess more than 10% of loan portfolio in local currency1, and still the government is seeking a room to promote the local currency in its financial sector. Therefore, it is expected that more firms will be able to borrow in local currency from banks in the future. According to our results in Chapter 5, it will become easier for firms with local currency to raise funds because they can mitigate the currency mismatch risks. Thus, it is interesting to investigate the firm borrowing in the future research, and to see how firms raise funds when they can choose both of currencies in loans. In addition, efficiency and stability in financial institutions are also required since dealing with multiple currencies will impose costs and risks on financial institutions. Thus, how the financial institutions deal with currency mismatch in balance sheets and how they should maintain the efficiency in fund mobilization under such a situation are necessary to be studied in the future.
In the rest of this chapter, we close this dissertation by summarizing the results and insights that have been illustrated in the main previous four chapters and by providing directions for future researches.
1. Summary and direction of future study of Chapter 2 (Efficiency of Cambodian banks)
The Cambodian financial sector has experienced a rapid growth, along with numbers of entries of foreign-owned financial institutions. In the previous literature, although the results are still mixed, it is argued that foreign-owned banks outperform the local banks and entry of foreign-owned banks will contribute to improvement in the efficiency of the financial market. In this regard, we attempted to investigate the efficiency of major financial institutions in the Cambodian banking sector. We collected the data from the Annual report of National Bank of Cambodia, the central bank in Cambodia. We employ the data envelopment analysis to measure the efficiency of individual financial institutions, and also investigate the determinants of efficiency using an advanced approach, bootstrapping-DEA regression, which is proposed by Simer and Wilson (2007).
We found that the foreign ownership did not improve the efficiency, and the banks with foreign ownership are inferior to the banks with local ownership. The results may suggest that the recent entries of foreign-owned banks do not lead to improvement of the Cambodian banking sector, probably because those foreign-owned banks mainly came from the neighboring countries, such as Thailand, Korea, Vietnamese, and Malaysia, not from developed countries. Furthermore, in Cambodia, there are two types of financial institutions whose parent firms do not engage in the banking business and financial institutions whose parent firms are engaged in banking services and have a banking specialty. Those different origins of banks might reflect in our results. Secondly, sizes of financial institutions positively affect the efficiency, which
1 The detail of an announcement about this new regulation is available on the website of National Bank of Cambodia. (https://www.nbc.org.kh/download_files/legislation/prakas_eng/Prakas-on-providing-KHR-credit-eng.pdf)

143
implies that facilitating the M&A may improve the efficiency in the Cambodian banking sector, and promote the further fund allocation.
However, our empirical analysis still has some issues in empirical method. Firstly, our method cannot strictly identify the causality. In particular, the estimated size effect is possibly affected by endogeneity problem, since there is a possibility that efficient banks survive the market and end up in bigger banks. Those reverse causality is difficult to solve, but the future research challenge this problem by finding the instrument variables, or the situation which we can take as natural experiments for changes in bank sizes.
Secondly, we did not take into account other important feature in the Cambodian banking sector, such as dollarization issues, when building our empirical models. Some of prior researchers found that dollarization induces the high excess liquidity in banking sector. The excess liquidity possibly distorts the ideally efficient managements of banks. Estimating what extent of dollarization affect the efficiency of financial institutions will give an insight and have useful policy implications for the persistent Cambodian dollarization issues. Thirdly, DEA approach has some limitations on the analysis of the behaviors of financial institutions, due to its non-parametric assumption. Since the DEA do not assume any specific functional form in estimation, although this could be the advantage of DEA model over other models, DEA model cannot test the existence and extent of economies of scale and economies of scope, as Okuda and Hashimoto (2004) investigated the bank behaviors in the Malaysian banking sector. Thus, the future study should challenge another approach to estimate the efficiency and determinants with the functional form of the bank business, using the parametric models, such as the stochastic frontier model.
2. Summary and direction of future study of Chapter 3 (Deposit withdrawals)
The Cambodian financial sector is still vulnerable to the external and domestic shocks. In particular, it often experiences deposit withdrawals, and the deposit withdrawals in 2013 was exceptionally large. In this chapter, we empirically investigated depositor’s running behaviors during the large-scale deposit withdrawals which happened shortly after the general election in 2013. In the empirical analysis, we employed unique micro data of regional deposit amounts of Cambodian commercial banks and microfinance institutions.
As a result of empirical analysis, some of our findings were consistent to our hypotheses and previous findings. In line with our prediction, we found that depositors with smaller amounts are less likely to withdraw the money from bank accounts during the period even in the absence of an explicit deposit insurance scheme. As well, we found that regional election results affected the extent of deposit withdrawals and if opposition party obtained more votes/seats, larger deposit withdrawals were likely to occur in the region. However, the indicators of resilience or the sizes of financial institutions showed different relation to the extent of deposit withdrawals from what we expected. These findings suggest that all financial institutions are possibly exposed to a sudden deposit decline regardless of whether their management is good or not, and diversification of their customer bases, and especially an increase in low-income customers, might be effective to reduce the risks of deposit withdrawals.
In addition, our empirical results might have important implications for the implementation of a deposit insurance scheme in emerging economies. A deposit insurance scheme with low insurance limits

144
may be ineffective, since the depositors with lower balances are unlikely to withdraw money even in the absence of deposit insurance. Furthermore, we found that regional factors can mitigate the extent of deposit withdrawals, suggesting regional economic development might be effective to foster financial stability in Cambodia, possibly through the literacy levels.
However, our analysis has limitations. Firstly, our data only include one banks from commercial banks, and seven banks from microfinance deposit-taking institutions (MDIs). In the observed periods, there are 32 commercial banks and 7 MDIs which takes deposit services in the Cambodian banking sector. Thus, our results do not necessarily represent the entire banking sector. Nonetheless, there are relatively large banks in our sample. The largest commercial bank is included in our data, and even in the entire banking sector in terms of loan sizes, the second largest financial institution in our data is ranked at 6th, and the third largest one is 11th, and the fourth one is ranked at 15th. Moreover, in terms of branch network, MFIs have much larger networks than commercial bank, which mainly operate only in Phnom Penh. Thus, in order to further investigate the entire banking sector, it is needed to include another commercial banks in the future study. Secondly, our data set does not allow us to examine the effect of other region-specific information, apart from population and number of banks. The future study should be extended to include the other variables, such as more exact measure of economic developments.
3. Summary and direction of future study of Chapter 4 (HH FX currency borrowing)
Foreign currency borrowing, a phenomenon sometimes referred to as financial dollarization, is a growing issue in developing and emerging countries. In this chapter, we investigated determinants of foreign currency borrowing behaviors of households in Cambodia. We employed comprehensive household survey data, which allowed us to use the currency-wise information in households’ financial activities. As a result of our empirical analysis, firstly, we found that Cambodian households are engaged in risk-hedging behaviors against exchange rate risks and likely to borrow in foreign currency if foreign currency makes up the major portion of their income stream. In other words, FX borrowing by households could be the consequence of the risk-hedging behaviors against exchange rate risks by the households with foreign currency income.
Secondly, we also found that expectation of depreciation of local currency leads households to take out local currency loans in line with prediction from the previous theoretical model. Thirdly, we found that education plays a role in the choice of currency in loans, and the better educated households are more likely to engage in risk-hedging behaviors and to match the currency composition between loan and income than the low educated are. The results might suggest that the financial literacy works to enhance the risk-hedging behaviors against exchange rate risks for Cambodian households.
However, our analysis has several limitations. Firstly, we did not directly measure levels of financial literacy. We used education level as a proxy variable for financial literacy. Thus, there is a possibility that other factors relating to education levels affect the results, rather than financial literacy.
Secondly, we implicitly assumed that bank’s behaviors did not affect household behaviors, so that we interpreted that the results were not distorted by endogeniety issues. Some of previous studies avoid this problem by using the preference on currency in borrowing in the future, instead of loans households had at the time of survey conducted. But our dataset does not cover the preference on currency of future borrowing.
145
Thirdly, we also assume that currency composition of income, savings and expenditures are exogenous variables. Although currency composition of income stream can be taken as exogenous, there might exist the endogeniety between loan currency and currency in financial assets and between loan currency and expenditure. Nonetheless, since the education levels are strong exogenous variable in our model, our results at least indicate clear differences in sensitivity of currency compositions between loan and expenditure, depending on the education levels. However, to make a clear policy implication, the future study should find the instrument variables on the currency composition of financial assets and expenditures. Otherwise, experimental research should be conducted in the future.
4. Summary and direction of future study of Chapter 5 (Firm borrowing behavior in a highly dollarized economy)
Although Cambodia has been heavily dollarized for decades, the debate on dollarization has long relied on the measure of FX deposits over M2 or total deposits. There is no study to investigate the borrowing behaviors of Cambodian firms. The dollarized environment might affect the Cambodian firm’s borrowing behaviors, as some of previous studies found that firm’s FX borrowing is the consequence of hedging against currency mismatch risks between revenues and liabilities, and also the imperfection of domestic financial markets. Our study is the first attempt to systematically investigate the features and determinants of dollar-denominated financing of firms in the highly dollarized Cambodian economy, by using the questionnaire survey conducted by the National Bank of Cambodia and JICA.
By adopting sample selection models, we estimated the determinants of the dollar-denominated bank borrowing ratios of firms. The major results of the estimation are as follows: Firstly, we found that conventional corporate finance theory largely fit in the borrowing behaviors of Cambodian firms. We found that firms with property and casualty insurance have higher bank borrowing ratios, suggesting that reduction in risks facilitate bank borrowing, in line with the trade-off theory. Furthermore, we found that the bank borrowing ratios depended positively on how much collateral they could provide. The results indicate that the agency cost theory can explain the borrowing behaviors of Cambodian firms.
Secondly, the bank borrowing ratios of firms were not affected by dollar-denominated income ratio itself. However, we found that there was heterogeneity in the firm’s behaviors relating to the currency mismatch risks. We found that firms with higher internal funds are more likely to adjust the currency mismatch risks, and they avoid bank borrowing if their revenues are in local currency.
These results suggest that, in dollarized economies with underdeveloped financial systems such as that in Cambodia, (1) additional business risk accompanied with dollarization makes it more difficult for firms to use external funds, (ii) external fund procurement of firms heavily depends on how much collateral they can provide, and (iii) banks have balance sheet risks caused by the currency mismatch between the revenues and borrowings.
Our study in this chapter is still subject to several limitations and challenges. Firstly, instead of direct measurement for the borrowing constraints, we assume that firms which borrowed from microfinance and kinship networks are facing borrowing constraints from bank borrowings. Then, we employ the two-stage Heckman model to reduce the biases from borrowing constraints. However, some of firms which borrowed from microfinance or kinship networks might possibly prefer to borrow from those quasi internal funding source over borrowing from commercial banks, since they can obtain enough money from those

146
funding source. Nonetheless, we believe that our estimation in the chapter is better to reduce the biases than OLS estimation. However, the future study should challenge to find better way to identify whether firms face limitation on access to bank borrowings.
Secondly, our data set does not cover the information of trade credits between firms. Thus, some of firms with external funds are mistaken for firms with no loans and excluded from the estimation. The future study should take into account and come over this bias, and a design of the next survey on firm financing behaviors should reflect and capture this form of firm’s financing.
Reference Okuda, H., & Hashimoto, H. (2004). Estimating cost functions of Malaysian commercial banks: The differential effects of size, location, and ownership. Asian Economic Journal, 18(3), 233-259.
Simar, L., and Wilson, P. W. (2007). Estimation and inference in two-stage, semi-parametric models of production processes. Journal of Econometrics 136 (1):31–64.