The Case for Gradualism in Policies to Reduce Inflation
28
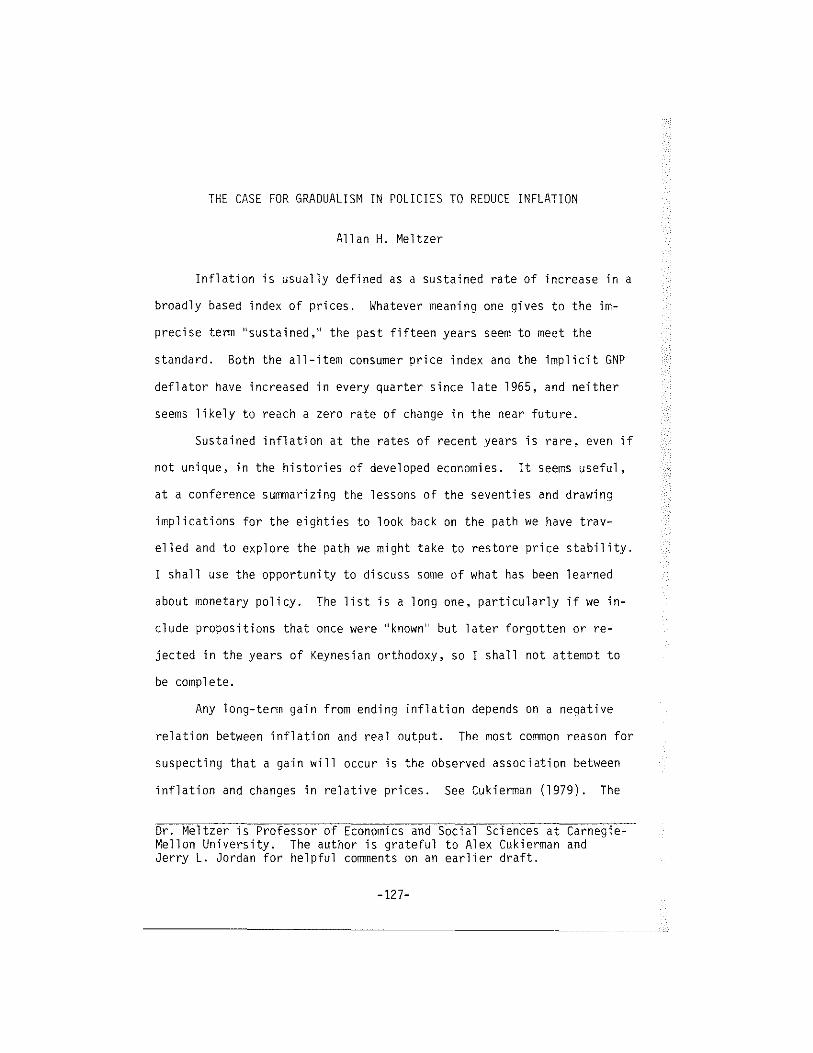
THE CASE FOR GRADUALISM IN POLICIES TO REDUCE INFLATION Allan H. Meltzer Inflation is usually defined as a sustained rate of increase in a broadly based index of prices. Whatever meaning one gives to the im- precise term sustained, the past fifteen years seem to meet the standard. Both the all—item consumer price index and the implicit GNP deflator have increased in every quarter since late 1965, and neither seems likely to reach a zero rate of change in the near future. Sustained inflation at the rates of recent years is rare, even if not unique, in the histories of developed economies. It seems useful, at a conference summarizing the lessons of the seventies and drawing implications for the eighties to look back on the path we have trav- elled and to explore the path we might take to restore price stability. I shall use the opportunity to discuss some of what has been learned about monetary policy. The list is a long one, particularly if we in- clude propositions that once were known but later forgotten or re- jected in the years of Keynesian orthodoxy, so I shall not attempt to be complete. Any long-term gain from ending inflation depends on a negative relation between inflation and real output. The most common reason for suspecting that a gain will occur is the observed association between inflation and changes in relative prices. See Cukierman (1979). The Or. Meltzer is Professor of Economics and Social Sciences at Carnegie- Mellon University. The author is grateful to Alex Cukierman and Jerry L. Jordan for helpful comments on an earlier draft. —127—
Transcript of The Case for Gradualism in Policies to Reduce Inflation
THE CASE FOR GRADUALISM IN POLICIES TO REDUCE INFLATION
Allan H. Meltzer
Inflation is usually defined as a sustained rate of increase in a
broadly based index of prices. Whatever meaning one gives to the im-
precise term sustained, the past fifteen years seem to meet the
standard. Both the all—item consumer price index and the implicit GNP
deflator have increased in every quarter since late 1965, and neither
seems likely to reach a zero rate of change in the near future.
Sustained inflation at the rates of recent years is rare, even if
not unique, in the histories of developed economies. It seems useful,
at a conference summarizing the lessons of the seventies and drawing
implications for the eighties to look back on the path we have trav-
elled and to explore the path we might take to restore price stability.
I shall use the opportunity to discuss some of what has been learned
about monetary policy. The list is a long one, particularly if we in-
clude propositions that once were known but later forgotten or re-
jected in the years of Keynesian orthodoxy, so I shall not attempt to
be complete.
Any long-term gain from ending inflation depends on a negative
relation between inflation and real output. The most common reason for
suspecting that a gain will occur is the observed association between
inflation and changes in relative prices. See Cukierman (1979). The
Or. Meltzer is Professor of Economics and Social Sciences at Carnegie-Mellon University. The author is grateful to Alex Cukierman andJerry L. Jordan for helpful comments on an earlier draft.
—127—

principal problem for monetary policy at present is to achieve this
gain by ending inflation at minimum transitional loss of output.
Every six months, I join with my colleagues on the Shadow Open Market
Committee in recommending a policy of pre-announced, gradual, sustained
reductions in the growth of money as a means of restoring price stabil-
ity. A clear statement of the reasons for a policy of this kind —-
often called gradualism -- has not been provided. I will try to par-
tially fill that gap and to relate the case for gradualism to some of
the lessons we have learned from recent experience with sustained in-
flation.
The history of recent inflation is surrounded by myths that ob-
scure the origins of the inflation and the reasons for its persistence.
I begin with an account of the origin and an explanation of persist-
ence. Much of the case for gradualism depends on the way in which in-
dividuals form anticipations of the future. I present one view of
rational expectations, in the sense of Muth (1961), and use this model
of expectations to show how Federal Reserve policy procedures can con-
vert real shocks into permanent changes in the rate of price change.
Then I present the case for gradualism in a world in which persistent
and transitory changes in monetary policy cannot be identified quickly.
THE ORIGIN AND PERSISTENCE OF CURRENT INFLATION
The most enduring myth about the origins of the current infla-
tion is that the inflation started during the Vietnam war. According
to a standard version of history, President Johnson rejected the recom-
mendations of his advisers by refusing to choose between “guns and
butter.” The President delayed asking Congress for increased taxes
-128-

(or for smaller expenditures for redistribution) and allowed the budget
deficit to overstimulate the economy in 1967. Since 1967, inflation
has been intractable. According to some estimates, ten or more years
of recession would be required to eliminate inflation by monetary and
fiscal policies.1
The facts do not correspond to this capsule history. The rate of
increase of consumer prices reached the 3 to 4% range at least a year
before the Vietnam deficits. Spending by the federal government in dol-
lars of constant purchasing power remained 3 to 5% below the 1962 level
during most of 1965. Budget deficits and government spending did not
start the inflation or encourage the Federal Reserve to expand in 1965
or 1966. The budget had a small surplus in 1965, and a small deficit if
1966. The Federal Reserve slowed the growth rate of the monetary base
late in 1966 in a sudden burst of concern about rising inflation. The
1967 deficit of more than $13 billion comes after these first steps to
slow inflation and much too late to explain the start of the inflation.
A surtax was added to the income tax in 1968, SO the Vietnam def-
icit proved to be temporary. By late 1968, the budget again was in
surplus, and the surplus persisted in 1969. The 1969 surplus of $8.5
billion is one of the largest of the past thirty years in real as well
as in nominal terms.
To sustain the thesis that the Vietnam deficits started the cur-
rent inflation, one must not only ignore the problem of the timing of
1See Perry (1978) for a more complete statement of this view andfor an extreme form of the argument that inflation is intractable.Perry’s Phillips curve implies that it costs $200 billion dollars ofreal output for each percentage point reduction in the rate of infla-tion.
—129—

the start of inflation, on which I conniented earlier, but must accept
the improbable proposition that six quarters of wartime deficit gener-
ated anticipations that were irreversible. Credulity is strained
further when the 1967 deficit is expressed in constant dollars to com-
pare with the deficits in earlier and later years. The 1967 deficit is
almost identical to the 1958 deficit when both are expressed in dollars
of the same purchasing power. The 1958 deficit did not initiate years
of sustained inflation. On the contrary, inflation fell from the 3 to
4% range of 1956-57 to the 1 to 2% range in 1958—59 and to less than 1%
by 1961.
The 1975 nominal budget deficit of $70 billion is four times
larger than the deficits of 1958 and 1967 when the three are expressed
in dollars of comparable purchasing power. The 1975 deficit is not
followed by a balanced budget or a surplus but by sustained deficits.
Yet, most broad measures of the rate of price change declined in 1976.
The GNP deflator rose by less than 4.5%, on average, for the first
three quarters of the year. and the consumer price index rose by less
than 5% for the year as a whole.2
The proximate cause of the start of the current inflation is the
monetary policy of the early 196Os. Inflation persists because policy
continues to sustain anticipations of future inflation by producing
persistent inflation. Bursts of anti-inflation policy, and announce-
ments of firm congnitments to reduce inflation, are not followed by
policies that reduce money growth.
2The decline in the rate of inflation affected more than justfood prices as is sometimes claimed. The wholesale price indexes ofconsumer finished goods rose by less than 2.5% for the year.
—130—

Rat
eof
Gro
wth
ofth
eM
onet
ary
Bas
e(3
yr.
mov
ing
avg.
)ro
(iJ
-Is
—4CD
0b
bo
b5
o5
oI
I‘
II
II
I01 01
0 CD
(0o
ot A
G)
CD
°
~1
—
(0
CD—
~
or
—tO
ED
-a (0<
0—
4 otO
0(D
~—
‘C-a (0
w-.4
0c_
flCD
-a (0 CD 0

Chart 1 uses a twelve quarter moving average of the growth of the
adjusted monetary base as a measure of the long—term effect of monetary
policy. Using this measure as an index of the sustained thrust of
monetary policy. we can divide the monetary history of the past twenty—
five years into five episodes. The first, from 1955 to 1960, has a low
average rate of monetary growth, 1.1%. The second is a three—year
transition. The twelve quarter moving average rises steadily toward
the 5.5% range. In the third period, 1964-71, the growth of the base
remains in the neighborhood of 5.5%. The fourth period is a one—year
transition, 1972, during which the maintained growth of the base moves
from about 5.5% to 8.5%. Since 1973, the moving average of the base
has grown at a maintained rate of about 8.5%.
A number of studies, including my own Meltzer (1977), suggest
that inflation follows money growth with an average two-year lag. The
mean of the three—year moving average ending in year t, shown in Chart
1, is an unweighted average centered in year t—l - If we impose a two-
year lag, inflation in year t+1 is influenced by the twelve quarter
rate of growth of the monetary base ending in year t. To measure per-
sistence, I have computed the standard deviation of the percentage
rates of change of the consumer price index and the percentage rate of
change of money wages for the years 1956-61, 1965—72 and 1974—78 that
correspond to the two-year lag of prices behind the maintained growth
of the monetary base.3 The data are shown in Table 1.
3The rates of price and wage change are one-year averages of theall—item consumer price index for six—month spans and average hourlyearnings over six-month spans from BCO. Wage data are not availablebefore 1965.
—132-

TABLE 1
Mean (p) and Standard Deviations (cv)
Years (t) Growth of Adjusted Rate of Price Rate of WageMonetary Base in t Change t+l Change t+l
p cv p cv p cv
1955-60 1.1 .18 1.9 1.00 N.A.
1964—71 5.7 .44 4.0 1.26 5.9 1.13
1973-78 8.4 .31 7.5 2.42 8.0 .79
Omitting 1974 6.4 .85 7.7 .36
The data show a tendency for the standard deviation of the rates
of change of money and wages to fall in recent years. Removing the
effects of the oil shock, by omitting 1974, further reduces the stand-
ard deviations. The standard deviations of the rates of change of
wages and prices are not startlingly different from the standard devia-
tions of the maintained growth of the adjusted base. The persistence
of rates of price change from year to year appears to be related to the
persistence of maintained rates of money growth.
To examine further the relation between the persistence of money
growth and the persistence of inflation, Table 2 compares the two
quarter average rates of growth of base money to the quarterly averages
of the rates of change of prices and wages used in Table 1. As before,
I imposed a two-year lag of rates of price change behind rates of money
growth. The data now suggest that the variability of base money growth
is of approximately the same magnitude as the variability of the rate
of wage change.4 The standard deviations of the rate of price change,
4The time periods for the base differ from those in Table 1 be-cause Table 1 has a three-year moving average. I have kept the periodsfor rates of price and wage change the same as in Table I.
—13 3—

however, are not closely related to the standard deviations of rates
of base money growth. Short-term variability of the rate of price
change reflects more than the variability of monetary growth.
TABLE 2
Mean (ci) and Standard Deviations (ci)
Two quarter Standard Deviations (ci)
moving average quarterly averageof growth of rate of change
Period monetary base Period over six—month spans
Consumer Moneyprices wages
t p ci t+2 p ci p ci
1954—59 1.1 0.87 1956—6] 1.5 1.61
1963-70 5,7 1.10 1965-72 4.00 1.34 5.9 1.19
1972—76 8.2 0.91 1974—78 8.2 2.61 8.0 0.90
The data for 1953-70 and 1972—76 include several periods in which
inflation was given ‘highest priority as a goal of public policy.
Careful inspection of the data shows that periods of slower growth of
the base coincide with these announcements in 1966, 1969-70 and 1974—75,
but none of these periods of slower growth is long enough to have any
marked effect on the ~tandarddeviation of the growth rate of the base.
Table 2 shows that the standard deviation of the two quarter moving
growth rates is independent of the rate of growth of the base and not
very different in the three sample periods.
The data suggest two reasons for the persistence of inflation and
the slow response of inflation to changes in the growth rate of money.
First, short—term rates of price change are relatively variable, so
people have difficulty separating the effects of money growth from
other influences on short-term price changes. This is particularly the
—134—

case for recent years, when announced changes in oil prices have had
considerable influence on measured rates of price change and their
variability. Second, the commitment to anti-inflation policies does
not last. People are unwilling to buy long-term contracts based on the
assumption that the slower rate of money growth will persist long
enough to reduce the trend rate of inflation. In the next section, I
offer an explanation of the relation between the variability of money
growth and the persistence of inflation.
THE BASIC INFERENCE PROBLEM5
Each week the Federal Reserve reports the growth rates of various
monetary aggregates. Market participants try to infer the future
course of money growth, interest rates, prices and exchange rates from
the announcement. Their problem, and ours as economists, is to sepa-
rate transitory changes in money growth (or other variables) from per-
sistent changes. I call this problem of separating permanent or per-
sistent changes from ephemeral or transitory changes the basic infer-
ence problem because it arises for most economic variables and is a
major problem for people making decisions.
To illustrate the problem, suppose that in a given week the an-
nounced change in money is large relative to past changes. Few ob-
servers will use the observation for a single week to predict the
growth path, and fewer still will predict an equiproportionate change
in the rate of inflation. Let the increased rate of money growth per-
sist, for a month or two, and the balance of opinion will start to
5This section owes a large debt to Brunner, Cukiernan and Meltzer(1979).
—135—

change. More observers will infer that there has been a persistent
change in the growth rate of money.
The effect of the first week’s observation on market prices,
interest rates and exchange rates differs from the effects of a change
that is perceived to be permanent. Although the change in money is re-
ported, and therefore is known, the correct inference to be drawn from
the information is uncertain because the content of the information is
uncertain. A rational investor who uses all available information,
must first decide what he knows; that is to say, he must decide how
much of the changes he has observed can be expected to persist.
This view of the world in which monetary and other policies
operate differs in an important way from the usual model of rational
expectations developed by Lucas (1975) and others. There, people are
uncertain about whether the changes they observe are the result of
shocks that change relative prices or shocks that change the absolute
price level; once information becomes available, there is no doubt
about its meaning.
Given the speed with which information becomes available, the
confusion between aggregative and relative changes cannot be the prin-
cipal source of confusion. The main aggregates in our models -— money,
debt and deficits or GNP, prices and output -— are observed within a
month or a quarter. Once they are observed, the confusion between ab-
solute and relative changes disappears.
The permanent-transitory confusion does not disappear when data
are published. The principal uncertainty that individuals face arises,
in this model, from an inability to properly interpret information, not
from lack of information. People observing the price index must decide
—136-

whether a reported increase or decrease in an aggregate is a one-time
change that will soon be reversed or the start of a higher or lower
maintained rate of change. Expectations remain rational, but the use
of all available information does not solve the inference problem and
does not eliminate error.
A simple model brings out the source of the permanent-transitory
confusion. It is, of course, only one of many ways in which the
problem can be formulated, but it is the way that has been used in an
application to the problem of stagflation where it produces changes in
prices and employment that resemble the aftermath of the oil shock.6
An observable variable can be divided into two components, a
permanent component. X~, and a transitory component X~. X~and AX~are
normally distributed random variables with mean zero and known, con-
stant variances, ~ and J~q• People cannot observe or but must
infer the permanent value by observing current and past values of X~.
xt = +
The expectation of X~,conditional on all information available in
period t, is X~.
The inability to separate permanent and transitory components
makes the optimal forecast of X a distributed lag of past observations.
Contrary to much of the rational expectations literature,7 we find that
6Brunner, Cukierman and Meltzer (1979). This application con-siders the effects of real shocks. The role of the permanent-transitoryconfusion in the transmission of monetary shocks to real variablesintroduces additional problems.
7Benjamin Friedman (1979) is an exception.
—137—

using a distributed lag of past observations is an optimal method of
forecasting. The reason is that repetitive observation of an aggregate
are required to learn whether a permanent change has occurred. If per-
manent changes are frequent, and transitory changes are infrequent, a
change in X is more likely to be treated as permanent soon after it
occurs. At the opposite extreme, transitory changes are frequent and
permanent changes are rare, so it is optimal to observe a relatively
long series of observations before concluding that a permanent change
2
has occurred. In more technical terms, the larger the ratio the
xq
faster people correctly infer that a permanent change has occurred; the
smaller the ratio, the larger is the number of observations required to
sustain the inference that a permanent change has occurred.
We can put more content into the terms “frequent” or “infrequent”
by using the computed standard deviations for the two quarter and three-
year moving averages in Tables 1 and 2 to estimate the relative vari-
ance of permanent and transitory components and to find the implied
length of the lag in reaching rational judgments about permanent shocks.
The permanentS van ance of the growth rate of the monetary base is set
equal to the variance of the three-year growth rates. The two quarter
moving average growth rates include both permanent and transitory com-
ponents. We assume that permanent and transitory variances are inde-
pendent and compute the transitory variance by subtracting the variance
of the twelve quarter average from the variance of the two quarter
average. Muth (1960, pp. 302-4) shows that the best (minimum variance)
linear estimator of the permanent value of a variable can be computed
from past actual values using the variances of the permanent and
-138-

transitory components. For the problem at hand, the calculations for
the three periods of relatively constant growth of the monetary base
show that the relative variances of the growth rates of the base are:
1955—60 1964-71 1973—78
.04 .19 .14
These ratios imply very different lags in the adjustment of the
expected growth of the base. In 1955—60, only 55% of the adjustment of
expectations occurs within three years. The reason is that the very low
variance around the three—year average growth of base money obscures
the change in the maintained rate of growth, when it occurs. Rational
individuals interpret most of the permanent change as transitory and
fail to adjust fully for several years. In the two remaining samples,
the variance of the permanent component is higher relative to the
variance of the transitory component. Expectations adjust more quickly;
more than 95% of the full adjustment occurs in the first three years.8
Expectations of inflation are related to the growth of money that
individuals expect to be maintained. The expected growth of base money
can be reduced permanently only if the actual growth of base money is
reduced. The speed of adjustment of expected to actual growth can be
reduced, also, if the variability of the growth rate of the base is re-
duced. For example, if the Federal Reserve reduces the variance of the
two quarter growth rate to equal the variance of the twelve quarter
BtTransitory1 variances are computed from two quarter moving
averages, so two quarters are used as one period when computing thelags.
—139—
growth rate, 85% of the adjustment of expectations about the permanent
growth occurs in the first year. Expectations of inflation respond
more rapidly to monetary policy; the length of the lag of inflation be-
hind money growth declines.
It is, no doubt, a mistake to use these numbers as precise esti-
mates of the expected length of the lag. Fortunately, the principal
implications do not depend on the precision with which we measure the
speed of adjustment of expectations. If short—tern policies are less
variable, the speed of adjustment increases. Faster adjustment of ex-
pectations lowers the length of time between changes in the growth rate
of the monetary base and changes in the expected growth of the base
and, therefore, in the expected rate of inflation. The shorter the
lag, the smaller, ceteris p jbus, is the persistence of inflation.
A related, but distinct, implication explains why short—term
changes in the growth rate of the base have little effect on maintained
inflation. The larger the transitory variance of the growth rate of the
base, given the long-term or permanent variance, the longer is the lag.
Short—tern reductions in the growth rate of the base have little effect
on long-term expectations if the short—tern growth of the base is
highly variable. The real costs of reducing inflation are higher,
under these circumstances. The costs take the form of recession and
rising unemployment. Recession encourages the Federal Reserve to shift
to a policy of monetary expansion thereby reinforcing expectations that
the maintained average growth rate of the base will not be reduced.
Chart 1, above, shows that past periods of anti—inflation policy have,
in fact, had little effect on the maintained growth rate of the base.
-140-

The calculations in Tables 1 and 2 imply that the lag in the
formation of expectations is shorter now than in the fifties. The data
suggest, however, that the reason for the shorter lag is the increase
in the measured variance of the permanent component, not a reduction in
the measured variance of the transitory component.
THE POLICY PROBLEM
The Federal Reserve can reduce the short-term variance of the
growth of the monetary base by adopting targets expressed in terms of
the base. Reserves and currency, the uses of the base, are approxi-
mately equal to the sun of reserve bank credit and international re-
serves. With floating (or adjustable) exchange rates, the Federal
Reserve can control the two quarter growth rate of the base by control-
ling the stock of Reserve bank credit. To control the base the Federal
Reserve need not solve an impossible or even a difficult problem. All
they must do is control the asset side of their balance sheet.
As is well-known, the Federal Reserve cannot control both inter-
est rates and the growth rate of the base. By specifyinq short—term
targets in terms of values (or ranges) of the Federal funds rate, the
Federal Open Market Comittee surrenders control of short—tern changes
in the base. The problem of separating permanent and transitory
changes helps to explain how loss of short—term control of the base
contributes to persistent movements of the base even if the dominant
shocks in the economy are real, not nominal shocks.
To illustrate the problem. I use the three equation, equilibrium
model based on Brunner, Cukierman and Meltzer (1979). All variables
-141-

are natural logarithms. Production or output, ~ is given by a neo-
classical production function
(1) ~ = ut +
with ~ the number of man hours of labor and ut a productivity shock;
6 is the elasticity of output with respect to labor. Real aggregate
spending is always equal to output, ~ and depends on expected or per—
nanent incone, y~,on the real rate of interest and on shocks to ag-
gregate demand, c~. The anticipated rate of inflation is the differ-
ence between the iogarithns of the price level anticipated for next
period ~t~t+i~and today’s prices ~ The market rate of interest
is i~.
(2) ~ = a+by~+ c[it - ~ +
b>0;ccO
Equation (3) equates the current stock for base money, B + to the
denand for base money, where is the shock to the level of nominal
money balances.9 Some part of the shock to spending, ct. affects the
demand for money; the rest affects the demand for bonds and the supply
of labor. Increases in spending are financed by reducing the demand
for money so a is positive and increases in c reduce the demand for
money.
(3) B + = + + ~ + y~+ y ~ -
8<0
1 > y, a > 0
9The analysis can be cast in terms of growth rates of money bynaking minor adjustnents.
-142—

The three equations form an augmented IS—LM model. The principal
novelties are the distinction between permanent and current income and
the introduction of permanent and transitory shocks. The three shocks,
~ ~ and have permanent and transitory components, but people are
not able to distinguish the permanent and transitory components when
observing the shocks. For example, u~= u~with known variances
ci~ and ci~q~ normal distributions and expected values Eu~and EAu~
equal to zero.
Substituting eq. (1) into (2) and (3) and solving for i~reduces
the system to two equilibrium relations. The money market equilibrium
or LM, in eq. (4) and the IS curve, eq. (5) relate i~to the three
shocks, to the price level and to other variables. For the current
analysis, I treat y~and i~as given and independent of the shocks.~0
(4) si~= B + - - yu~+ SEt - ~ - (l-1)y~ - a
(5) cit = c(tpt+1_pt) + ut - Ct + ai~- b y~- a
During most of its existence, the Federal Reserve used the market
interest rate (or some surrogate like the level of free reserves) as
the operating target. Suppose the Federal Reserve sets the target in-
terest rate at i and supplies or absorbs base money to keep i~= i.
10A full solution is given in Brunner, Cukierman and Meltzer(1979) by specifying the labor market equations. The additional detailwould not alter the conclusions of this discussion. The principal dif-ferences that have been neglected are the dependence of 4 on the ex-pected values of the real shocks and the dependence of 1 on the actualvalues of the real shocks. The reader who is disturbed ~y the partialsolutions can substitute permanent and actual values of shocks -— realshocks -- for y~and ~ For the analysis that follows what matters isthat the responses of IS and LM to the shocks cause i~to differfrom i
0
-143-

The stock of base money B + ~ changes only as required to maintain the
interest rate at i, which is to say that the stock of money now de-
pends on the real shocks.
(6) ~t ~(et~ ut)
Equations (4) and (5) are shown as solid lines in Figure 1. The
slope of LM from eq. (4) is positive in the i, p plane. The slope of
IS is -1. The price level is p. The policy of fixing interest rates,
temporarily at i, makes the interest rate pre—determined at i. Mone-
tary policy keeps the interest rate constant by changing money. When-
ever there are real shocks to productivity or to spending and the
demand for money, the Federal Reserve changes the stock of money enough
to hold interest rates fixed until it decides that the shock is per-
manent.
Consider the effect of a negative productivity shock, dut < 0.
From (4) and (5) we compute the elasticities
> 0 and ~t = 1
tILM dut cIS
A negative shock shifts both the LM curve and the IS curve to the right
in Figure 1. If ~ is small, the demand for money changes very little,
and interest rates rise. The Federal Reserve offsets the rise in in-
terest rates by increasing the money stock.
dit 1
= < 0
-144-

i
\\ /I2~12
12
‘11.
0
\\ is
2
Is I
p0p1 p2 P3
p
FIGURE 1
-145-

If the negative productivity shock is transitory, Federal Reserve
policy eliminates any effect on interest rates but increases the price
level by more than the increase resulting from the transitory decline
in productivity. The dotted lines 151 and LM1 in Figure 1 show the
effect of the transitory change in u~. Prices and interest rates rise;
is the log of the price level at the intersection of IS1 and LM1,
and i1 is the interest rate. Federal Reserve policy shifts the LM
curve further to the right, shown by LM2, restoring the interest rate
i and increasing the price level to p2 p2 - p1 is the relative rate
of change in the price level resulting from Federal Reserve policy, and
— p is the rate of price increase caused by the decline in produc—
t iv i ty.
The mean values of the transitory shocks are zero so the effect
of Federal Reserve’s response to transitory shocks is on the variance
of rates of price change and not on their average over time. A policy
of pegging interest rates increases the variability of the measured
rates of price change resulting from transitory shocks. Our earlier
finding that the variance of the rate of price change rose during the
period in which there were oil shocks is consistent with this impli-
cation 11
Suppose, however, that the negative productivity shock is per-
manent, or persistent, not transitory. In this case, the price level
fluctuates around p2 following the increase in money to LM2. Because
permanent and transitory shocks cannot be observed separately, or
~There are, of course, other causes of variability including theshocks to spending and the demand for money (Ct) and the FederalReserve’s response to these shocks.
-145-

separated reliably, people must decide whether the observed rate of
price increase, p2 — p, the change in money, s’~, and other changes
have caused a one-time price change or a persistent change in the rate
of price change. If the inferences drawn from available information
lead people to believe that some part of the change in the measured
rates of price change and money are persistent changes in the rates of
change, instead of one-time changes in level, the IS curve shifts
further to the right. The size of the shift depends on the degree to
which the anticipated rate of inflation, ~ - ~ rises.12
The Federal Reserve policy of fixing the interest rate at i
sustains the inference that the observed changes in prices and money
reflect a persistent increase in rates of change, not a one-time change
in levels. The reason is that, when IS shifts to the right the policy
of fixing interest rates requires the Federal Reserve to again increase
the money stock, shifting LM further to the right.
The additional changes in money and prices reinforce beliefs
about the persistence of the changes in money and prices. As the per-
ceived and measured rates of inflation rise, anticipated inflation
rises, and there is a further rightward shift in IS. Additional in-
creases in money are now required to hold the market interest rate at i
Each increase in the stock of money reinforces the belief that
there has been a persistent change in the rate of money growth. Each
increase in the equilibrium price level reinforces the belief that the
run of transitory, negative shocks to productivity produces a
similar result. is today’s expectation of next period’s price.
The rational expectation takes the form of a distributed lag, as indi-
cated earlier, so expectations adjust gradually.
—147—
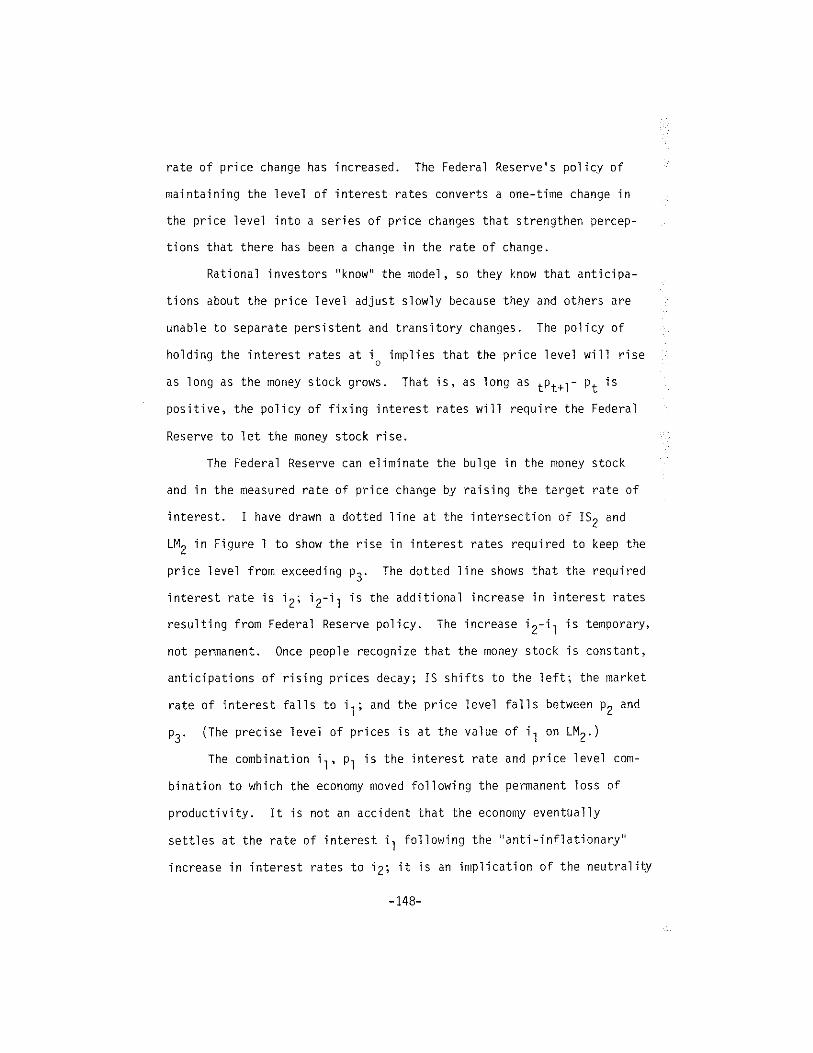
rate of price change has increased. The Federal Reserve’s policy of
maintaining the level of interest rates converts a one—tine change in
the price level into a series of price changes that strengthen percep-
tions that there has been a change in the rate of change.
Rational investors “know” the model, so they know that anticipa-
tions about the price level adjust slowly because they and others are
unable to separate persistent and transitory changes. The policy of
holding the interest rates at i implies that the price level will rise
as long as the money stock grows. That is, as long as ~ Pt ‘~
positive, the policy of fixing interest rates will require the Federal
Reserve to let the money stock rise.
The Federal Reserve can eliminate the bulge in the money stock
and in the measured rate of price change by raising the target rate of
interest. I have drawn a dotted line at the intersection of IS2 and
LM2 in Figure 1 to show the rise in interest rates required to keep the
price level from exceeding p3. The dotted line shows that the required
interest rate is i2 i2—i1 is the additional increase in interest rates
resulting from Federal Reserve policy. The increase i2—i1 is temporary,
not permanent. Once people recognize that the money stock is constant,
anticipations of rising prices decay; IS shifts to the left; the market
rate of interest falls to i1 and the price level falls between p2 and
p3. (The precise level of prices is at the value of i1 on LM2.)
The combination i1, p1 is the interest rate and price level com-
bination to which the econony moved following the permanent loss of
productivity. It is not an accident that the economy eventually
settles at the rate of interest i1 following the “anti—inflationary”
increase in interest rates to i2 it is an implication of the neutrality
-148-

of money. Monetary policy, at first, allowed the money stock to rise,
then held the money stock constant, eliminated the anticipation of
rising prices and allowed the interest rate to decline. The lasting
effect of the interest rate policy is a higher price level. The amount
of increase depends, of course, on the speed with which the Federal
Reserve abandons the interest rate target i~= i.
This discussion of policy has neglected many complicating fea-
tures. The adjustment of prices and interest rates has been analyzed
as if these changes occur without real effects. The gradual adjust-
ment of employment when rational individuals cannot distinguish per-
manent and transitory productivity changes has not been emphasized.
The case for fixing the level of interest rates is not strengthened by
these omitted effects.
A principal result of the policy of fixing market interest rates
is that additional changes in prices (and output) are induced by mone-
tary policy. People are forced to decide how much of the observed
change in money is persistent amd how much is transitory. The deter-
mination of the mew permanent price level is made more difficult.
The permanent decline in productivity produces a temporary in-
crease in unemployment and a permanent loss of real income. Unemploy-
ment rises because people do not recognize instantly that the shock is
permanent. Hence, they do not instantly adjust their real incomes (and
real wages) to the level they eventually reach. Monetary policy can
reduce this cost of adjustment only if the monetary authority cam suc-
ceed in reducing real wages to their new, permanent level without set~
ting off anticipations of rising prices. The monetary authority must
have superior information on the speed with which people recognize the
-149-

permanent loss of real income and the speed with which anticipations of V
price changes form and decay. There is no reason to believe that mone-
tary authorities have information of this kind or are able to set mar-
ket interest rates in a way that minimizes the cost of adjusting to
real shocks. On the contrary, monetary policy produced persistently
higher rates of price change following the productivity shocks of this
decade.
THE CASE FOR GRADUALISM
Reliance on market interest rates as the operating target of
monetary policy produced high rates of growth of the monetary base and
sustained inflation. The low variance of the long-term average growth
of the base suggests that the 8.5% growth rate of the base is perceived
as a “permanent” rate of change. To end inflation the rate of growth
of the base must be reduced.
If expectations form and decay quickly in the presence of new
information, the problem of ending inflation is made easier. A credi-
ble policy to stop inflation causes prompt revision of expectations.
Revised expectations, and slower growth of base money bring inflation
to an end. Rational individuals recognize that sunk costs or contracts
must be forgotten, so as contracts are revised, they enter into agree-
ments or commitments that reflect their revised expectations. Even in
this case, there are benefits to gradualism if costs of adjustment can
be reduced by permitting people to learn about the new environment.
The analysis in the preceding section suggests some of the diffi-
culties people face when forming judgments about the persistent rate of
change of money. Some of these difficulties cam be reduced if policy
—‘SD—

makers announce the intended rate of money growth. Announcements are
not sufficient to change anticipations permanently. A principal reason
is that policymakers statements are not entirely credible. Past
promises to slow money growth and reduce inflation have been followed
within a few quarters by renewed expansion. Consequently, rational
individuals treat any initial reduction in money growth (or budget ex-
penditures) as temporary, not permanent, changes. An announced reduc-
tion in the growth of money, initially, will not be interpreted as a
reduction in the maintained rate of money growth.
Gradual reduction in money growth can reduce the cost of lowering
the rate of inflation in three ways. First, maintaining the growth of
the base at a steady rate lowers the variance of the transitory com-
ponent and reduces the lag in the formation of expectations. Second,
the maintained average rate of money growth falls gradually, so people
have time to adjust future commitments to reflect revised expectations.
Third, if costs of adjusting to a lower rate of inflation are not
proportional to the total adjustment but increase with the rate per
period, costs of adjustment are reduced by lowering the rate per
period.
If the rate of adjustment of money growth is very low, the vari-
ance of the permanent component is low, so the lag in adjustment of
expectations increases. If the rate of adjustment of money growth is
rapid, the variance of the transitory component increases, so costs of
adjustment rise. The optimum rate of adjustment is achieved by in-
creasing the variance of the permanent component and reducing the vari-
ance of the transitory component of money growth. This is equivalent
to finding the minimum lag in the formation of anticipations.
-151—

The policy of gradual, pre-announced reductions In money growth
advocated by the Shadow Open Market Committee did not emerge as a sol-
ution to the problem of finding an optimal lag. The choice of am
optimal policy depends on information that is not yet available. Our
proposal, like most policies, depends more on empirical judgments about
the length of lags and costs of adjustment than on hard evidence. I
have no doubt that future research will find a better path.
SOME FINAL SPECULATIONS
The chief difficulty in the policy of gradualism is the length of
time required to reach the rate of growth consistent with mom-infla-
tionary growth in the economy. If we use the long—run growth of real
output as a guide, the rate of base money growth must fall from the
current rate of 8% to no more than 3%. If payments technology con-
tinues to improve, base velocity will rise in the future as it has for
at least the past quarter century. The non—inflationary rate of base
money growth is then no more than 1 or 2%.
Is a seven year program of sustained reductions in money growth
the best that can be done? I expect not. There is reason to believe
that policymakers cam increase their credibility by meeting pre—
announced targets. Increased credibility permits policymakers to lower
the maintained growth rate while lowering the relative variance of the
transitory component of money growth. Credible announcenents mean that
individuals distinguish permanent changes closer to the time they occur
by using announcements of proposed changes as a reliable indicator of
future money growth.
—152—

No one can be very certain about these issues. The evidence on
which we rely comes from experience in Germany, Switzerland, the United
Kingdom and our own experience in the middle seventies. Each of these
experiences suggests that within two to three years at most, the antic-
ipated rate of inflation declines. The rate of price and wage change
falls; long-term interest rates decline, and real output rises or
accelerates.
Those who desire “incomes policies” to reduce the lag for adjust-
pnent might find pre—announced monetary policies more attractive than
either the failed incomes policies of the past or present, or compli-
cated, inefficient programs to tax wage and price changes. Instead of
announcing the rate of price and wage changes that the government
favors, the government can announce the rates of monetary and fiscal
expansion that the government intends to maintain. These announcements,
if they are credible, help individuals to form expectations about
future rates of inflation.
Analysis of the length of the lag in the adjustment of antici-
pations relates these adjustments to the adjustment of pennanent values
or maintained rates of change. The evidence we have is neither incon-
sistent with the theory of expectations that I have sketched nor more
consistent with any other explanaion I have seen. This is not a strong
claim, but it is considerably better founded than the belief that In-
flation is intractable.
-153—

REFERENCES
Brunner, Karl, Alex Cukierman and Allan H. Meltzer (1g79) Stagflatiom,Persistent Unemployment and the Permanence of Economic Shocks,”multilithed, C- ‘negie—Mellon University.
Cukierman, Alex (1979) Relative Price Variability, Inflation and theAllocative Efficiency of the Price System, multilithed, Carneqie-Mellon University.
Lucas, Robert E. (1975) “An Equilibriun Model of the Business Cycle,’Journal of Political Economy, 83 (December) pp. 1113-44.
Meltzer, Allan H. (1977) Anticipated Inflation and Unanticipated PriceChange’ Journal of Money, Credit, and Banking, g pt. 2 (February),pp. 182—205.
Muth, John F. (1960) ‘Optimal Properties of Exponentially WeightedForecasts,’ Journal of American Statistical Association, 55(June) pp. 299—306.
Muth, John F. (1961) “Rational Expectations and the Theory of PriceMovements,” Econometrica, 23 (July) pp. 315—35.
Perry, George L. (1978) ‘Slowing the Wage—Price Spiral: The Macro-economic View,” Chapter 2 in Okun and Perry (eds.) Curing ChronicInflation, Washington: Brookings Institution.
—154-