THE CARNIVORE ASSEMBLAGE OF LA PAYUNIA RESERVE, PATAGONIA ... · THE CARNIVORE ASSEMBLAGE OF LA...
50
THE CARNIVORE ASSEMBLAGE OF LA PAYUNIA RESERVE, PATAGONIA, ARGENTINA: DIETARY NICHE, PREY AVAILABILITY, AND SELECTION By Jodi Elizabeth Berg Bachelor of Science, Northland College, Ashland, Wisconsin, 2003 Thesis presented in partial fulfillment of the requirements for the degree of Master of Science Resource Conservation, International Conservation and Development The University of Montana Missoula, MT Summer 2007 Approved by: Dr. David A. Strobel, Dean Graduate School Dr. Stephen Siebert, Chair Forestry Management Dr. Christopher Servheen Ecosystem and Conservation Science Dr. James Burchfield Society and Conservation
Transcript of THE CARNIVORE ASSEMBLAGE OF LA PAYUNIA RESERVE, PATAGONIA ... · THE CARNIVORE ASSEMBLAGE OF LA...
THE CARNIVORE ASSEMBLAGE OF LA PAYUNIA RESERVE,
PATAGONIA, ARGENTINA: DIETARY NICHE, PREY
AVAILABILITY, AND SELECTION
By
Jodi Elizabeth Berg
Bachelor of Science, Northland College, Ashland, Wisconsin, 2003
Thesis
presented in partial fulfillment of the requirements for the degree of
Master of Science Resource Conservation, International Conservation and Development
The University of Montana Missoula, MT
Summer 2007
Approved by:
Dr. David A. Strobel, Dean Graduate School
Dr. Stephen Siebert, Chair Forestry Management
Dr. Christopher Servheen Ecosystem and Conservation Science
Dr. James Burchfield Society and Conservation
11
ABSTRACT
Berg, Jodi, M.S., Summer 2007 Resource Conservation
The Carnivore Assemblage of La Payunia Reserve, Patagonia, Argentina: Dietary Niche, Prey Availability, and Selection
Chairperson: Dr. Stephen Siebert
I studied the dietary niches of pumas {Puma concolor), culpeo foxes {Pseudalopex culpaeus), grey foxes {Pseudalopex griseus), Geoffroy’s cats {Oncifelis geoffroyi), and pampas cats {Oncifelis colocold) between November 2005 and October 2006, and investigated prey density and availability in the northwestern region of La Payunia Reserve, province of Mendoza, Argentina. The cat species proved to be primarily carnivorous, consuming in most abundance plains and/or mountain viscacbas {Lagostomus maximus and Lagidium viscacia, respectively), and guanacos {Lama guanicoe) in the case of pumas. Both foxes bad more generalized diets, consuming the same species as the cats, as well as a higher percentage of insects and vegetation. Other native large-bodied prey species such as cboiques and maras {Pterocnemiapennata and Dolichotispatagonum, respectively) are likely ecologically extinct as prey for native carnivores, as they exist in low numbers within the reserve, probably due to a number of factors including bunting and competition from introduced species.

Ill
ACKNOWLEDGEMENTS
I always knew it wasn’t going to be easy finding myself in a new country with
new faces and a new language, and it wasn’t. But at some point in the year and four
months that I was in Argentina, the initial tears, apprehension, and loneliness evolved
into laughter, friendships, and an unforgettable learning and growing experience, for
which I have many people to thank: Steve and my committee members for all their
support and advice; Andres Novaro and Susan Walker for inviting me to Argentina and
putting trust in me in the first place - they are true examples of dedication to the wildlife
and conservation biology field; Lara, Bibi, and Gotardo Heidel who provided me a much-
needed home away from home; Anibal, Eduardo, Leo, Martin, Dany, Jorgito, Guillermo,
Sylvana, Fabian, and the rest of the park guards of Llancanelo, Payunia, and Cavema, for
their help and friendship in the field; the Direction of Renewable Natural Resources of
Mendoza for permitting my work in Payunia to happen; Rocio, Natalia, Lore, Emiliano,
and Nito for help at various points and lessons in scat analysis. Distance, and transect
layout, as well as Laura and Virginia for help in the lab - I don’t think I would have
finished on time if it weren’t for those two; CLAN for allowing me use of the facilities
and Paila for logistical help. A special thanks goes to Maco. Those initial awkward
exchanges in separate languages soon turned to long conversations during countless field
hours. I knew I could count on her to continue my project when I had to be away.
Finally, many thanks to my parents who have always supported me, even if they
didn’t always want to because it meant that I would be away from home for months at a
time, and last but not least, to Corey, who’s always been there and who got me there.
IV
PREFACE
I arrived for my first time in Argentina in September of 2005. I immediately took an
overnight bus from the capitol city of Buenos Aires to the small town of Junin de los
Andes in the Patagonian province of Neuquen, situated at the base of the Andes
Cordillera. There lived and worked the two biologists from Wildlife Conservation
Society who had invited me to come work with them. Upon initial invitation, Andres and
Sue had described to me their “Tehuelche (a native people to Argentina) landscape”
approach to restoring and maintaining connectivity between core protected areas and
surrounding low-impact human-use areas. They also described the three major locations
where they tend to focus most of their time and energy: the high-altitude puna plateaus of
San Guillermo National Park in the San Juan province to the northwest, volcanic Auca
Mahuida Provincial Reserve in Neuquen, and La Payunia Provincial Reserve just north of
Auca Mahuida but in southern Mendoza province (Fig. 1). On my third full day in
Argentina, I found myself driving to this last reserve, which would become my home,
life, and research site for the next year and three months.
Our purpose in driving to Payunia was to participate in a first-time effort to capture and
shear the native guanacos {Lama guanicoe) for their wool, a community project directed
by the Direction of Natural Resources of Mendoza. While the local cooperative of
livestock owners had the guanacos captured, we hoped to fit some of them with radio
collars, in order to monitor the effects of the shearing and learn more about the seasonal
movements of the animals, as well as their use and selection of habitat, factors important
to their overall conservation.

Guanacos are endemic to South America and once numbered in the tens of millions,
compared to about 500,000 today (Conway, 2005). Historically, guanacos impacted
plant distribution, abundance, and composition, served as a major prey for pumas {Puma
concolor), and played a vital role in the lives of Tebuelcbes and Pebuencbes, who
migrated alongside the guanacos between winter and summer feeding grounds and
depended on them for subsistence (Walker et al., 2004). European colonization
beginning in the sixteenth century subsequently led to the extermination of these native
peoples through disease and the Campana del Desierto in 1879, during which any
remaining Indians not killed by sickness were executed (Perry, 1972).
Along with the Europeans came horses and firearms, both of which resulted in great
increases in hunting and indiscriminate persecution of native wildlife. The original
habitat and composition of native plant and animal communities were further decimated
and severely altered through the introduction of other exotic species including domestic
sheep, cattle, and goats (Conway, 2005). These species had not evolved with the
Patagonian landscape as did the guanacos. Whereas guanacos have broad, soft feet, the
sharp hooves of livestock destroy native vegetation and present competition for
Argentina’s tremendously overgrazed pasture (Baldi etal., 2004).
The province of Chubut alone currently has about four million sheep, requiring between
ten and eleven million pounds of forage each day (Conway, 2005). Overgrazing has
resulted in severe desertification of about thirty percent of the Patagonian steppe.
Approximately four percent of the region’s shrub and steppe ecosystems are under strict
VI
protection (Walker et al., 2004); the rest of the land is managed by private ranchers.
Today Argentina is fragmented by trails left behind by oil exploration, fences, and
seasonal movements of large livestock herds, all of which sever migration patterns and
access to resources for native species.
Migration has been described as a seasonal movement between discrete areas not used at
other times of the year (Berger, 2004). The definition of long-distance migration is more
subjective, as what may seem a “long” distance to travel for some species, but not for
others, varies by species size and life-history characteristics. Either way, the spectacular
ecological phenomenon of long-distance migration of land mammals, documented in
species such as saiga antelope of the Mongolian steppe and bison of North America, is
increasingly at risk of extinction. Long-distance migration has important ecological
implications: it defines the ecological adaptations of a species and the seasonal
consumption of resources; defines the limits of ecosystems; and suggests the need for
changes in hunting controls and management (Novaro & Walker, 2005). In fact, long
distance migration is a widely practiced husbandry strategy in Argentina; many livestock
owners we interviewed move their animals (sometimes as far as 200 kilometers) so as to
be able to maintain large herds in such a harsh environment (Appendix B).
Guanacos once made long seasonal treks, but current densities of many populations are
so low that they no longer perform this role to take advantage of seasonal changes in
resource availability, and many have become restricted to high-elevation summer feeding
grounds due to livestock competition and hunting at lower elevations. Preliminary
Vll
research by Wildlife Conservation Society staff indicated that guanaco populations in
Payunia may still be large enough, and the amount of threats low enough, that the
animals may make annual movements into and out of the reserve. We hoped to find out
if this was true or not with the radio collars we put on some of the guanacos caught at the
shearing.
It was my everyday job, with help from another research assistant, to follow the sheared
guanacos using radio telemetry in order to investigate not only to what extent the
guanacos of Payunia might still migrate, but demographic characters of the population as
well, including the impact of predation by pumas. According to 17 of the 20 interviews
we conducted with local livestock owners, pumas are present in Payunia and their
numbers have increased in the last two decades (Appendix B). Taking advantage of the
hours spent tracking the guanacos, I began to collect carnivore scats whenever I came
across them.
There are five main predators in Payunia: pumas, culpeo foxes {Pseudalopex culpaeus),
grey foxes {P. griseus), pampas cats {Oncifelis colocolo) and Geoffroy’s cats {O.
geoffroyi). The puma is the largest of the five (26-55kg; Bedford & Eisenberg, 1992) and
has one of the largest distributions of all carnivores, ranging from northern Canada south
to southern Chile and Argentina. It inhabits everything from moist lowland tropical
forests to montane regions 5,800m in altitude. In Patagonia, they have been known to
prey primarily on mammals, especially guanacos, introduced European hares {Lepus
europaeus), and pudus {Pudupudu) (Yanez etal., 1986; Rau etal., 1991).
Vlll
Culpeo foxes (4-13kg; Redford & Eisenberg, 1992) range from Colombia down
throughout Chile and Argentina along the Andes to Patagonia, where they range across
the width of the country. Largely nocturnal, culpeo foxes may be found in many kinds of
habitats to altitudes of 4500m, but usually seek out areas with abundant vegetation for
cover. In Argentina’s Neuquen province, the main prey of culpeos in terms of biomass
consumed is the European hare, followed by sheep and carrion (Novaro, Funes &
Walker, 2000).
Culpeos have been relatively well-studied in Argentina and Chile, along with grey foxes
(2.5-5.5kg; Redford & Eisenberg, 1992). The grey fox is both diurnal and nocturnal and
occurs in a broad range of habitats from grasslands to forests, although in Argentina, it
typically inhabits arid and semiarid temperate portions of Patagonia and the Andes.
Being a generalist omnivore, the diet may contain plant material, insects, birds, rodents,
and even a high amount of fruit (Solar, Videla & Roig, 1997).
The biology of many South American cats, including the Geoffoy’s cat (2-6kg; Redford
& Eisenberg, 1992), has been poorly studied and remains relatively unknown (Branch,
1995). The Geoffroy’s cat ranges from sea level to 3300m in southern Bolivia, across
southern Brazil, in open woodlands, savannas, and marshes in Uruguay, to the southern
tip of Patagonia in Chile and Argentina. Primarily nocturnal, vertebrate prey is 100% of
their diet, with European hares accounting for as much as 57% (Johnson & Franklin,
1991).

IX
Pampas cats (3kg; Redford & Eisenberg, 1992) are distributed south from Peru and west
from Paraguay into Chile. Occasionally it may be found above 5000m in the Andes but
also prefers lowland swampy, grassy areas (Romo, 1995).
Carnivores such as pumas, grizzly bears (Ursus arctos horribilis), and wolves (Canis
lupus) have long been persecuted as nuisances and threats to livestock (Mech, 1996). In
some areas, this persecution has lead to local extinctions. Some populations have been
listed as vulnerable and managed as endangered species. Carnivores as a trophic group
have generally been found to be widespread and locally rare (to a large extent, this is the
case of Payunia’s species). This distribution and population density, in addition to
habitat and diet specialization, is the reason why some of these species are designated
rare or vulnerable (Arita, Robinson, & Redford, 1990). Carnivores of Payunia generally
appear to occur at low densities and could be in a vulnerable state, but no specific studies
have been conducted to determine their status. Food habits are considered one of the
most important aspects of a species’ behaviors (Romo, 1995). There is often debate
about the effects carnivores have on their prey (or their prey on them), and it is essential
to explore this subject further. The following manuscript details the methods I employed
in investigating this topic and the results and conclusions I came to.
X
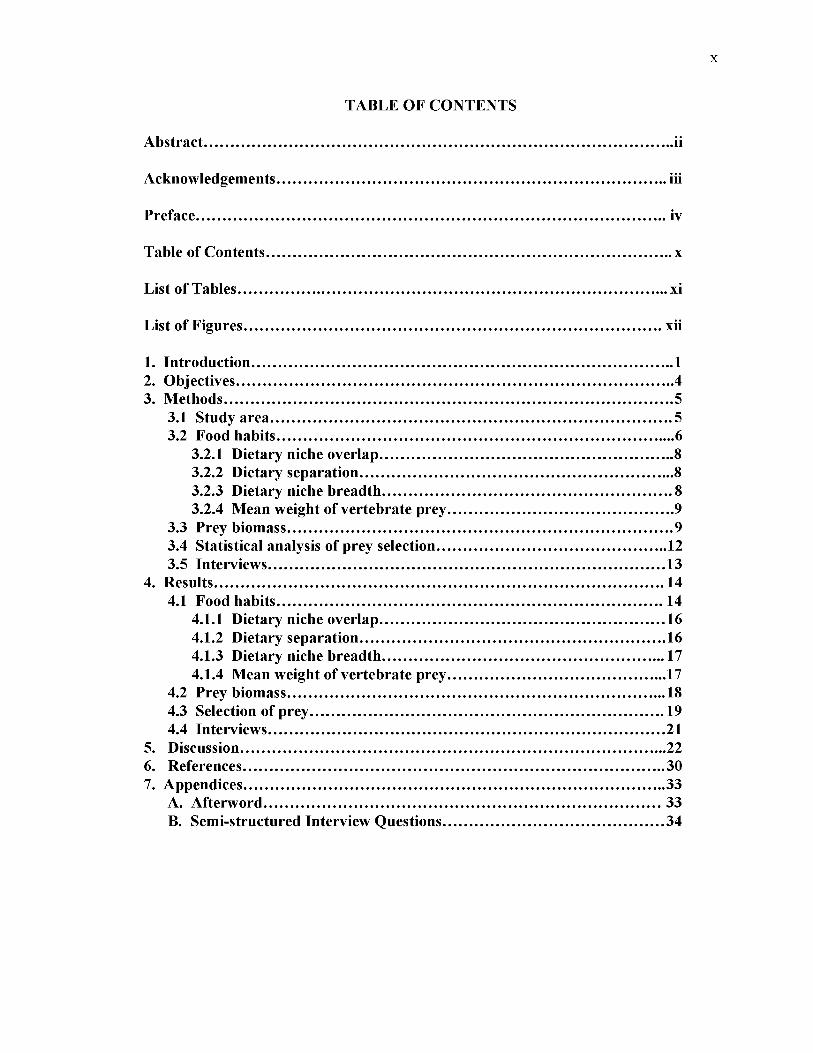
TABLE OF CONTENTS
Abstract................................................................................................................................ ii
Acknowledgements........................................................................................................... iii
Preface................................................................................................................................. iv
Table of Contents............................................................................................................... x
List of Tables......................................................................................................................xi
List of Fignres...................................................................................................................xii
1. Introdnction................................................................................................................... 12. Objectives....................................................................................................................... 43. Methods...........................................................................................................................5
3.1 Stndy area.............................................................................................................. 53.2 Food habits............................................................................................................ 6
3.2.1 Dietary niche overlap................................................................................ 83.2.2 Dietary separation..................................................................................... 83.2.3 Dietary niche breadth.............................................................................. 83.2.4 Mean weight of vertebrate prey............................................................ 9
3.3 Prey biomass......................................................................................................... 93.4 Statistical analysis of prey selection...............................................................123.5 Interviews.............................................................................................................13
4. Resnlts........................................................................................................................... 144.1 Food habits.......................................................................................................... 14
4.1.1 Dietary niche overlap.............................................................................. 164.1.2 Dietary separation....................................................................................164.1.3 Dietary niche breadth............................................................................ 174.1.4 Mean weight of vertebrate prey.......................................................... 17
4.2 Prey biomass....................................................................................................... 184.3 Selection of prey................................................................................................. 194.4 Interviews............................................................................................................ 21
5. Discnssion.................................................................................................................... 226. References................................................................................................................... 307. Appendices................................................................................................................... 33
A. Afterword..............................................................................................................33B. Semi strnctnred Interview Qnestions.............................................................34-
XI
LIST OF TABLES
Table 1. Population density (ind/km^), as determined through line transects, and body mass (kg) of prey species of La Payunia Reserve, Mendoza, Argentina between November 2005 and October 2006.......................................................................................12
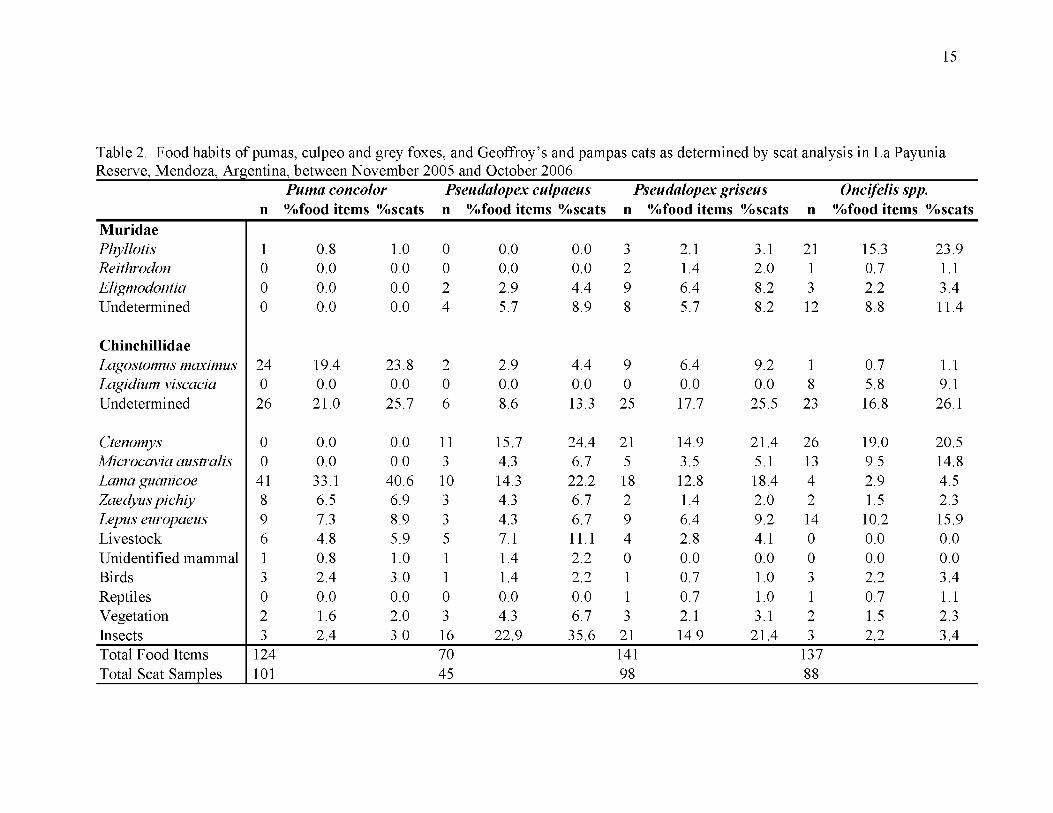
Table 2. Food habits of pumas, culpeo and grey foxes, and Geoffroy’s and pampas cats as determined by scat analysis in La Payunia Reserve, Mendoza, Argentina, between November 2005 and October 2006.......................................................................................15
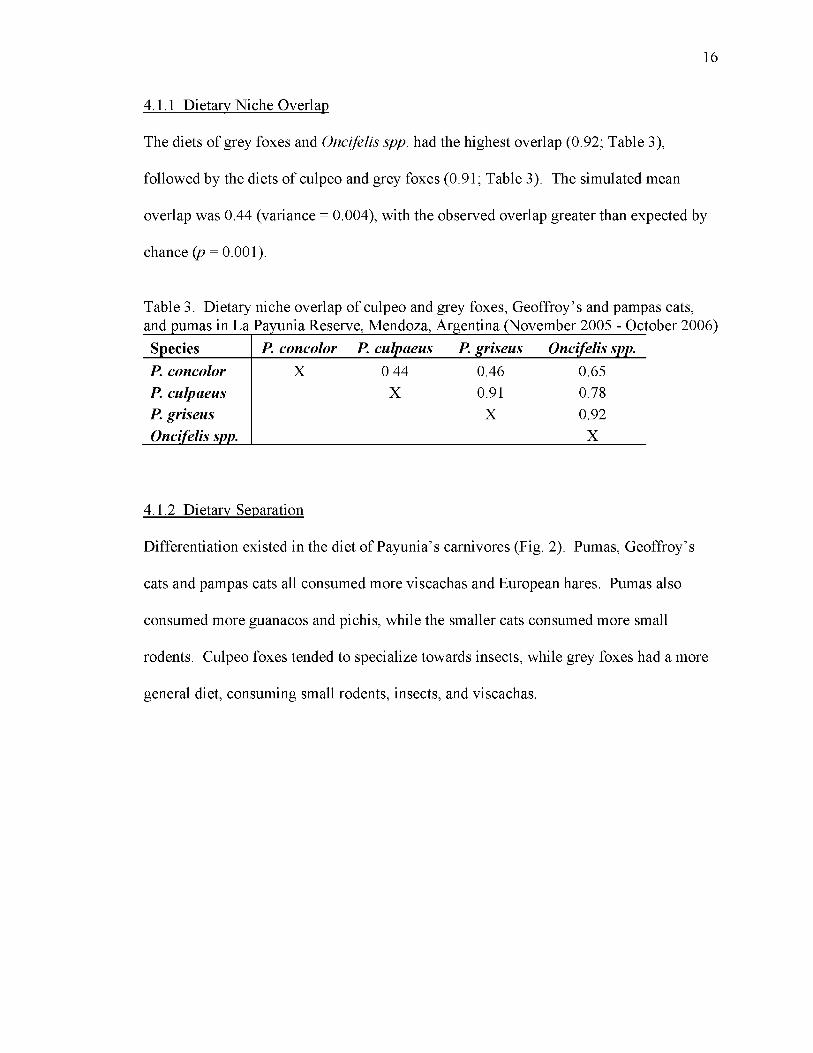
Table 3. Dietary niche overlap of culpeo and grey foxes, Geoffroy’s and pampas cats, and pumas in La Payunia Reserve, Mendoza, Argentina (November 2005-April 2006) 16
Table 4. Mean weight of mammalian prey (kg) and 95% confidence intervals (inparentheses) for pumas, culpeo and grey foxes, and pampas and Geoffroy’s cats in LaPayunia Reserve, Mendoza, Argentina (November 2005-October 2006)......................... 18
Table 5. Relative percent biomasses of prey available to culpeos, grey foxes, Geoffroy’s and pampas cats, and pumas in La Payunia Reserve, Mendoza, Argentina (November 2005-October 2006).............................................................................................................. 19
Table 6. Food selectivity by pumas, culpeo and grey foxes, and Geoffroy’s and pampas cats in La Payunia Reserve, Mendoza, Argentina, based on relative occurrence and density of prey. Ranges given are 95% Bonferroni confidence intervals (BCI) for relative occurrence of prey in diets (p,)^........................................................................................20

Xll
LIST OF FIGURES
Fig. 1. Location of study site (Payunia Reserve) in southern Mendoza province, Argentina....................................................................................................................................6
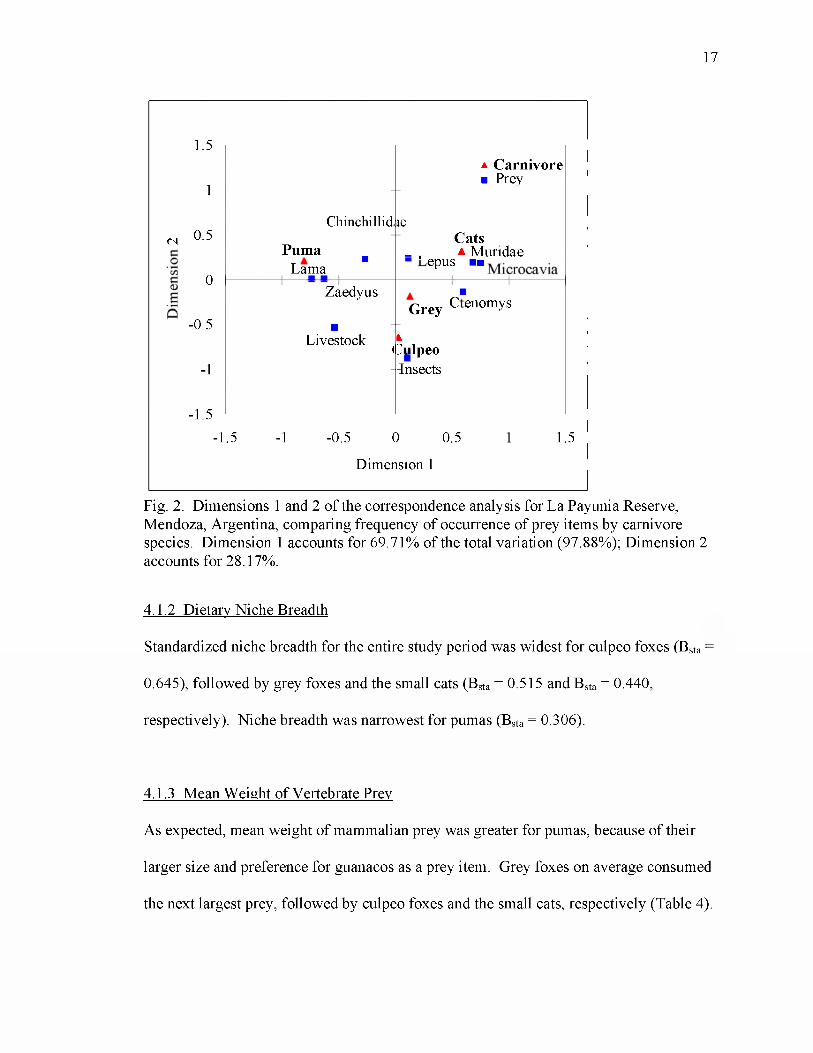
Fig. 2. Dimensions 1 and 2 of the correspondence analysis for La Payunia Reserve, Mendoza, Argentina, comparing frequency of occurrence of prey items by carnivore species. Dimension 1 accounts for 69.71% of the total variation (97.88%);Dimension 2 accounts for 28.17%......................................................................................... 17
Fig. 3. Responses from twenty semi-structured interviews conducted with nearby residents of La Payunia Reserve, Mendoza, Argentina, indicating whether respondents notice the presence or absence of certain species and hunting, and whether respondents believe puma populations and hunting prevalence are increasing or decreasing..............21

1. INTRODUCTION
A predator faces many ecological constraints while seeking to maximize quality and
quantity of its diet: prey abundance, spatial distribution and size of prey, hunting cover,
presence of offspring, and/or competition from other predators. Cause’s Law (1934; the
competitive exclusion principle) states that in order for two competing species to coexist
in a stable environment, the two species must differ in their respective ecological niche;
without differentiation, one species will eliminate or exclude the other through
competition. This idea was furthered by limiting similarity theories (MacAithur &
Levins, 1967) and character displacement (Brown & Wilson, 1956; Bulmer, 1974) which
predicted that there is a limit to the similarity and number of competing, coexisting
species in a given locale, and that interspecific competition should lead to reduction in
the niche overlap of competing species. Schoener (1974) suggested that microhabitat,
diet, and activity time are the three most important niche axes, but that differentiation
usually occurs along the first two: in order for two species with high habitat overlap to
coexist, they must differ in diet, and vice-versa (niche-complementarity hypothesis; see
alsoPianka, 1973).
In Chile, Fuentes and Jaksic (1979) hypothesized that niche-complementarity of diet and
habitat influenced the distributions and body sizes of culpeo and grey foxes {Pseudalopex
culpaeus and P. griseus, respectively). Where the foxes were sympatric in southern
Chile, they differed in body size, and where the foxes were allopatric in central Chile,
they were of similar sizes because altitudinal habitat partitioning allowed for relaxed
competition for prey of similar sizes. In the south, the altitude of the Andes range

decreases, and both foxes are forced to use lowlands. Jimenez et al. (1996) re-examined
the niche components of Fuentes and Jaksic’s work, along with temporal activity, at a site
in central Chile, where the foxes should have been allopatric. They found that the foxes
were actually sympatric and able to coexist through partitioning habitat at a finer scale
(culpeos excluded grey foxes from high-quality/abundant prey habitat patches),
overlapping moderately in dietary preferences, and completely overlapping in activity
time.
Estimating consumption of a particular prey through diet analysis can be a useful, non-
invasive technique to study carnivores and interspecific interactions, particularly when
other types of observations are logistically difficult. Many field experiments that
compare predators’ diets to prey availability focus only on one or two predators, or have
been conducted in boreal or northern temperate areas (Sih et al., 1985). Few carnivore
food habits studies have occurred in neotropical sites or looked at entire carnivore
assemblages (Jaksic et al., 1992; but see Palacios, 2006). Novaro etal. (2000), however,
analyzed the food habits of a carnivore assemblage and determined that native species
such as guanacos and rheas are ecologically extinct as prey and sources of carrion at a
neotropical site in the Neuquen province of Argentina.
A carnivore guild food habits study has not been conducted for the northwestern region
of La Payunia Reserve, Mendoza province. Such a project would be useful in better
understanding the area’s predator and prey species and in development of appropriate
management strategies. The project would increase understanding of human-wildlife

conflicts, and serve as part of a landscape level project to restore and maintain suitable
habitat and connectivity for the purpose of conserving wildlife populations in Argentine
Patagonia.
2. OBJECTIVES
I sought to describe the carnivore assemblage of northwestern La Payunia Reserve,
including trophic niches, mechanisms governing coexistence such as dietary niche,
overlap and separation, and the role that various prey species play in the diet during the
period of November 2005 through October 2006. Specifically, I:
1) estimated the densities of native prey species including guanacos, cboiques,
maras {Dolichotispatagonum), pichis (Zaedyuspichiy), plains vizcachas {Lagostomus
maximus), and martinetas {Eudromia elegans);
2) estimated the densities of introduced prey species including European hares
{Lepus europaeus), cattle {Bos taurus), sheep {Ovis aries), goats {Capra hircus), and
horses {Equus caballus)',
3) collected and analyzed scats from pumas {Puma concolor), grey foxes
{Pseudalopex griseus), culpeo foxes {Pseudalopex culpaeus), and the smaller cats
{Oncifelis colocolo and Oncifelis geoffroyi).
4) gathered local knowledge about livestock densities and seasonal movements,
the presence of carnivores, guanacos, cboiques, and mountain viscacbas, and the
prevalence of illegal hunting by conducting twenty semi-structured interviews with
residents of the area surrounding the study site.

3. METHODS
3.1 Study Area
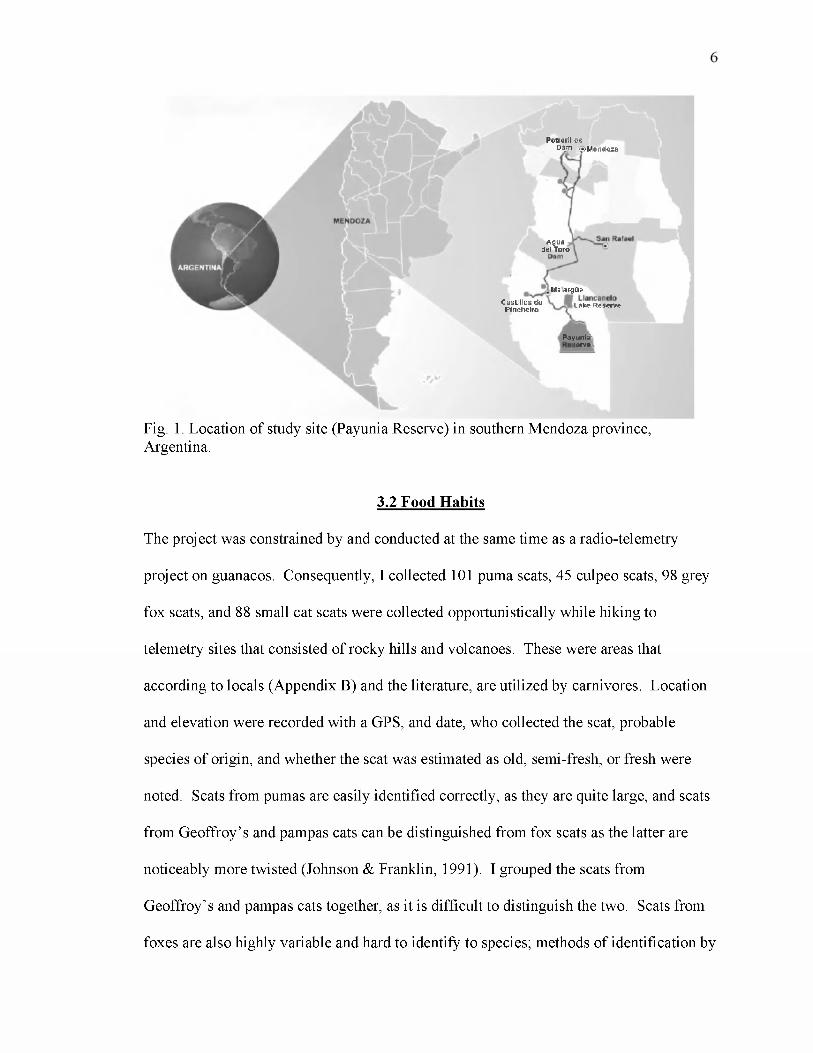
The study area was located in the northwestern section of La Payunia Reserve (36°10’S,
68°50’W, elevation from 1300 to 2000m), a protected natural area in northern Patagonia,
Province of Mendoza, Argentina (Fig. 1). La Payunia consists of 442,996 hectares
(192,996 of which are government-owned) and is home to a high density of ancient
volcanoes and what is probably one of the largest populations of guanacos left in the
world. This reserve, along with that of Auca Mahuida, in the Neuquen province to the
south, forms a major landscape that helps conserve one of Patagonia's richest ecosystems
(Walker et al., 2004).
Annual precipitation averages 255mm, occurring mostly during the summer months, and
mean seasonal temperatures range from 6°C in winter to 20°C in summer (Puig, Videla &
Cona, 1997). Moderate vegetation cover (58%) is shrubby interspersed by grasses;
dominant species include: Neosparton aphyllum, Chuquiraga erinacea, Larrea
divaricata. Cassia aphila, Panicum urvilleanum, Poa spp., and Stipa spp (Puig et al.,
1997).
JPolr«r]llo3
D ajn ^M erid oiza
C a s ti llo s da P In c h e Ira
A giia del Td m
Maiar gUa
L&ka Ftesem
Payunl̂lervsl
Fig. 1. Location of study site (Payunia Reserve) in southern Mendoza province, Argentina.
3.2 Food Habits
The project was constrained by and conducted at the same time as a radio-telemetry
project on guanacos. Consequently, I collected 101 puma scats, 45 culpeo scats, 98 grey
fox scats, and 88 small cat scats were collected opportunistically while hiking to
telemetry sites that consisted of rocky hills and volcanoes. These were areas that
according to locals (Appendix B) and the literature, are utilized by carnivores. Location
and elevation were recorded with a GPS, and date, who collected the scat, probable
species of origin, and whether the scat was estimated as old, semi-fresh, or fresh were
noted. Scats from pumas are easily identified correctly, as they are quite large, and scats
from Geoffroy’s and pampas cats can be distinguished from fox scats as the latter are
noticeably more twisted (Johnson & Franklin, 1991). I grouped the scats from
Geoffroy’s and pampas cats together, as it is difficult to distinguish the two. Scats from
foxes are also highly variable and hard to identify to species; methods of identification by
-
-
pH or thin-layer-chromatography are unreliable (Green & Flinders, 1981; Jimenez,
1993). I used the maximum diameter indicated by Jimenez (1993) to classify fox scats as
coming from either culpeo or grey foxes: scats with maximum diameters < 15mm were
said to be from grey foxes, and scats with maximum diameters > 15mm were said to be
from culpeos.
All scats were air-dried and their contents analyzed following the methods of Reynolds &
Aebischer (1991). Specimens were broken down in water and macroscopic fragments
were separated from microscopic ones using a sieve with a mesh size of 1mm. For the
purpose of this study, the microscopic fraction was not examined. The macroscopic
fraction was dried and mammalian prey was identified by comparing hair and teeth to
voucher specimens from the region and with the use of keys (Chehebar & Martin, 1989;
Pearson, 1995). This appears to be the first study to examine carnivore diets that could
potentially contain both plains and mountain viscacbas {Lagidium viscacia). Without
further investigation, I found the hairs of the two species to be indistinguishable from one
another and could only rely on the presence of teeth and/or claws to identify scat remains
to species level. If no teeth or hair were present, I classified the remains as
“undetermined Chinchillidae”. Results are presented as percent occurrence (number of
times an item occurred as percentage of the total number of prey items in all feces) and
the percent of scats in which each food item was found. For purposes of comparisons
with other studies, I computed four basic diet metrics: dietary niche overlap, dietary
separation, dietary niche breadth, and mean weight of vertebrate prey.
3.2.1 Di etary Ni che Overl ap
Using Gotelli & Entsminger’s EcoSim 7.72 (2006), I calculated dietary niche overlap
between all pairs of species with Pianka’s (1973) index, a = Epiqi/( Epi ̂ where pi
is the proportion of taxon i in the diet of the first species, and qi is the proportion of taxon
i in the diet of the second species. This index ranges from 0 (no overlap) to 1 (complete
overlap). 1000 simulations were used to determine if the probability of observed
overlaps was greater or less than those expected by chance.
3.2.2 Dietary Separation
I studied dietary separation among the carnivore species by plotting the major axes of
dietary variation identified with correspondence analysis. Those food items that
constituted >5% of the diet of one or more of the predators were included in the analysis
(Ray & Sunquist, 2001; Walker eta/., accepted 2007).
3.2.3 Dietary Niche Breadth
Dietary niche breadth is described by Levins’ (1968) formula, standardized by Colwell &
Futuyma (1971), B sta = (Bobs - B m in)/(B m ax B m in) where Bobs 1/ Spi ,̂ Pi is the
proportion of taxon i in the diet, Bmin is the minimum niche breadth possible (=1), and
Bmax is the maximum possible (=n, the number of prey taxa actually taken by a given
species of predator). Bsta ranges between 0 and 1. Niche breadth was calculated using
the total number of individuals in each of the families Muridae and Chinchillidae
(because of the inability to determine some individual prey items in scats to species
level), but at species level for all other prey taxa.
“ =

3.2.4 Mean Weight of Vertebrate Prey
Size of prey has been shown to influence a predator’s choice to hunt a particular species;
in the absence of other factors, the most profitable prey is the largest available prey that
can safely be killed (Sunquist & Sunquist 1989). To further compare diet partitioning
among the carnivores of La Payunia, I used the mean weight of vertebrate prey (MWVP).
MWVP was found as the arithmetic means of the body masses (Table 1) of all the prey
individuals found in the scats. Confidence intervals were estimated with log
transformations of the data that are back-transformed. As opposed to the geometric
means sometimes used in the literature and which tend to underestimate, arithmetic
means provide more realistic estimates of MWVP (Fowler, Cohen & Jarvis, 1998;
Walker et al., accepted 2007). The presence of guanacos in scats was included in this
analysis for pumas, but excluded in the analyses for the other carnivores, on the
assumption that these species only scavenge on guanacos. Livestock were also excluded
as it was assumed to be scavenged, although larger carnivores may sometimes prey on
newborn livestock or guanacos.
3.3 Prey Biomass
I assumed that prey biomass, estimated as the product between prey density and mean
body mass, was an acceptable estimator of prey availability (Jaksic et al., 1992; Novaro
et al., 2000). Body masses were obtained from the literature (Table 1; Redford and
Eisenberg 1992; Novaro et al. 2000) and prey densities were measured using the line
transect sampling methods described by Buckland et al. (2001). Date, observers, climate,
habitat, starting and ending times, species, total number of adults and/or juveniles.

10
distance from observers, and angle from line transect were noted. In addition, transects
were performed at night using a spotlight to estimate densities of nocturnal species
(plains viscacha and European hare).
During the beginning of the study, in the summer season (December through February),
transects covered every stretch of road and trail driven. Buckland et al. (2001)
recommend random placement of line transects within the study area. If this is not
logistically possible, as it was not in my study, a systematic grid of lines with random
starting position is considered sufficient. Realizing that my study design used in the
summer season (during which I sampled every stretch of road and trail driven) was not
the most desirable, the design was adjusted at the beginning of March to a more
systematic layout. I established a total of thirty-four transects over the entire study area,
each transect five kilometers long. Between each transect were three kilometers of un
sampled road or trail. The transects were sampled approximately once every two weeks
by one observer standing in the back of a truck driving at a speed of about twenty
kilometers per hour. This design was followed for the rest of the study, and data was
analyzed using the program Distance (Thomas et al.., 2005).
Line transect methods are not suitable for estimating the densities of mountain viscachas
or small rodents, and as budgetary and logistical constraints did not allow for it, the
densities of small rodents were not estimated in this study but taken from the literature
(Table 1). Density estimates of mountain viscachas do not exist because being rock and
cave-dwelling creatures, it is complicated to obtain information about their populations;
11
one must consider the number, size, and distribution of rock outcrops, as well as the
number of animals in each outcrop (Walker, pers. comm.). I therefore used the same
density estimate for mountain viscacbas as that for plains viscacbas.
The amount of food available to predators is not necessarily represented by prey density
(Sunquist & Sunquist, 1989). The assumed ability of each carnivore species to capture
and kill prey determined the availability of each prey item (Novaro et al., 2000). Sheep
and goats, bares, small mammals, young cboiques, martinetas, pichis, and viscacbas were
assumed to be available to culpeos. Hares, small mammals, martinetas, pichis, and
viscacbas were assumed to be available to grey foxes and the small cats. Guanacos,
young cattle and horses, burros, and all previously mentioned prey were assumed to be
available to pumas.
12
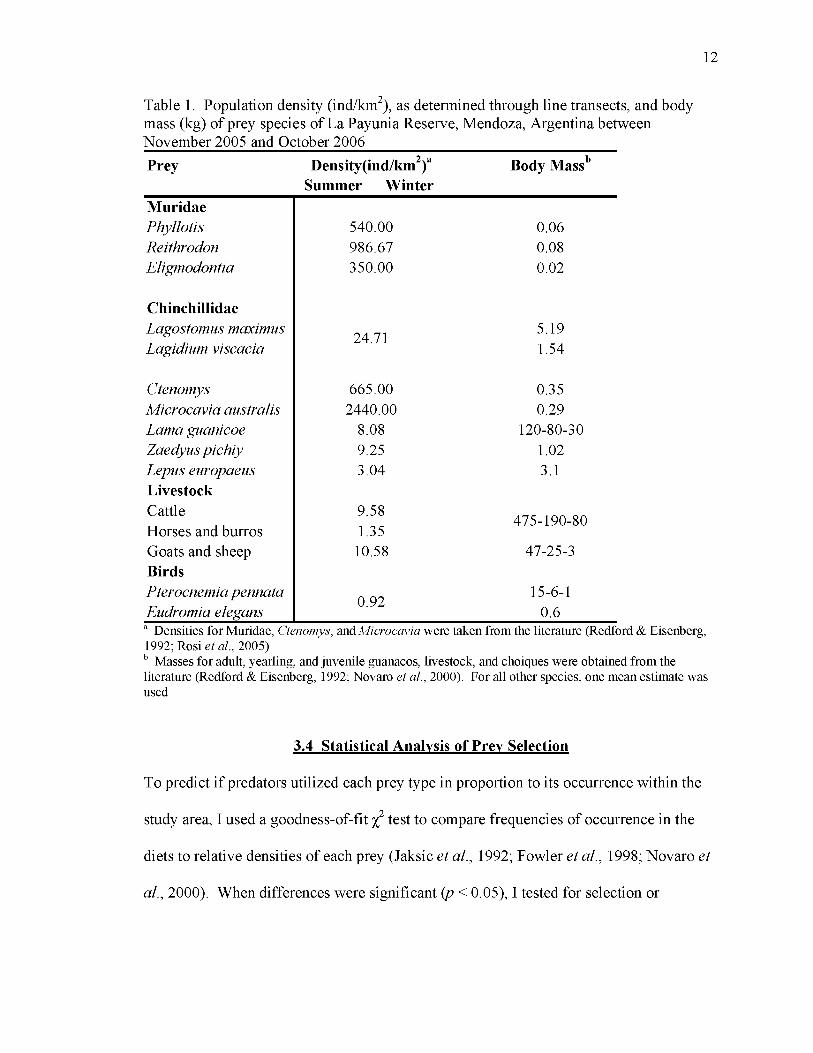
Table 1. Population density (ind/km ), as determined through line transects, and body mass (kg) of prey species of La Payunia Reserve, Mendoza, Argentina between November 2005 and October 2006Prey Density(ind/km^)“
Summer WinterBody Mass'*
MuridaePhyllotis 540.00 0.06Reithrodon 986.67 0.08Eligmodontia 350.00 0.02
ChinchillidaeLagostomus maximus 24.71 5.19Lagidium viscacia 1.54
Ctenomys 665.00 0.35Microcavia australis 2440.00 0.29Lama guanicoe 8.08 120-80-30Zaedyus pichiy 9.25 1.02Lepus europaeus Livestock
3.04 3.1
Cattle 9.58 475-190-80Horses and burros 1.35Goats and sheep Birds
10.58 47-25-3
Pterocnemia pennata 0.92 15-6-1Eudromia elegans 0.6
Densities for Muridae, Ctenomys, w A Microcavia were taken from the literature (Redford & Eisenberg, 1992; Rosi et al., 2005)
Masses for adult, yearling, and juvenile guanacos, livestock, and choiqnes were obtained from the literature (Redford & Eisenberg, 1992; Novaro et a l , 2000). For all other species, one mean estimate was used
3.4 Statistical Analysis of Prey Selection
To predict if predators utilized each prey type in proportion to its occurrence within the
study area, I used a goodness-of-ftt test to compare frequencies of occurrence in the
diets to relative densities of each prey (Jaksic et al., 1992; Fowler et al., 1998; Novaro et
al., 2000). When differences were significant (p < 0.05), I tested for selection or
13
rejection of individual prey with 95% Bonferroni confidence intervals for each prey
frequency (Neu, Byers & Peek, 1974; Byers, Steinhorst & Krausman, 1984).
3.5 Interviews
To gather important local knowledge about the area’s predators and abundance of prey, I
interviewed all residents of the area immediately surrounding the study site (Appendix
B). Semi-structured interviews were typically conducted in the residents’ homes, usually
with the male heads-of-the-households, and with the assistance of my Spanish-speaking
co-worker. Questions were pre-determined and given in a casual manner, and answers
were recorded afterwards, as participants were generally leery of papers and note-taking.
14
4. RESULTS
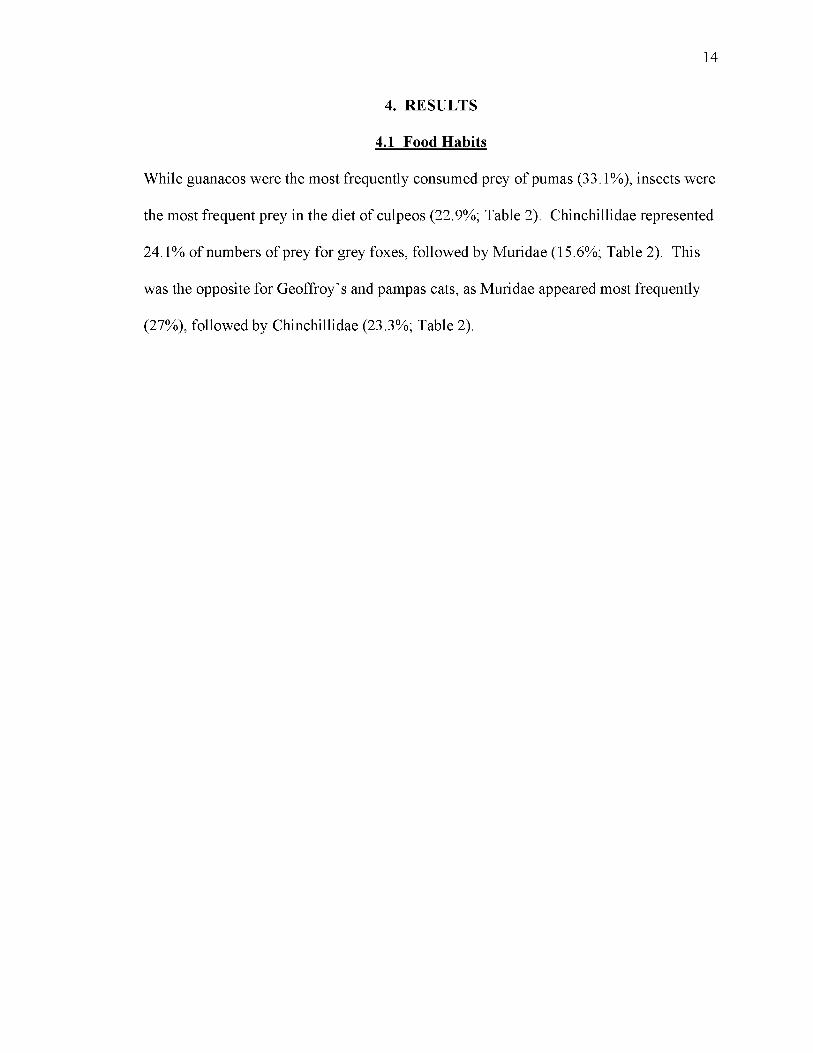
4.1 Food Habits
While guanacos were the most frequently consumed prey of pumas (33.1%), insects were
the most frequent prey in the diet of culpeos (22.9%; Table 2). Chinchillidae represented
24.1% of numbers of prey for grey foxes, followed by Muridae (15.6%; Table 2). This
was the opposite for Geoffroy’s and pampas cats, as Muridae appeared most frequently
(27%), followed by Chinchillidae (23.3%; Table 2).
15
Table 2. Food habits of pumas, culpeo and grey foxes, and Geoffroy’s and pampas cats as determined by scat analysis in La Payunia Reserve, Mendoza, Argentina, between November 2005 and October 2006_________________________________________________
nPuma concolor %food items %scats
Pseudalopex culpaeus %food items % scatsn
Pseudalopex griseus n %food items % scats n
Oncifelis spp.%food items % scats
MuridaePhyllotis 1 0.8 1.0 0 0.0 0.0 3 2.1 3.1 21 15.3 23.9Reithrodon 0 0.0 0.0 0 0.0 0.0 2 1.4 2.0 1 0.7 1.1Eligmodontia 0 0.0 0.0 2 2.9 4.4 9 6.4 8.2 3 2.2 3.4Undetermined 0 0.0 0.0 4 5.7 8.9 8 5.7 8.2 12 8.8 11.4
ChinchillidaeLagostomus maximus 24 19.4 23.8 2 2.9 4.4 9 6.4 9.2 1 0.7 1.1Lagidium viscacia 0 0.0 0.0 0 0.0 0.0 0 0.0 0.0 8 5.8 9.1Undetermined 26 21.0 25.7 6 8.6 13.3 25 17.7 25.5 23 16.8 26.1
Ctenomys 0 0.0 0.0 11 15.7 24.4 21 14.9 21.4 26 19.0 20.5Microcavia australis 0 0.0 0.0 3 4.3 6.7 5 3.5 5.1 13 9.5 14.8Lama guanicoe 41 33.1 40.6 10 14.3 22.2 18 12.8 18.4 4 2.9 4.5Zaedyus pichiy 8 6.5 6.9 3 4.3 6.7 2 1.4 2.0 2 1.5 2.3Lepus europaeus 9 7.3 8.9 3 4.3 6.7 9 6.4 9.2 14 10.2 15.9Livestock 6 4.8 5.9 5 7.1 11.1 4 2.8 4.1 0 0.0 0.0Unidentified mammal 1 0.8 1.0 1 1.4 2.2 0 0.0 0.0 0 0.0 0.0Birds 3 2.4 3.0 1 1.4 2.2 1 0.7 1.0 3 2.2 3.4Reptiles 0 0.0 0.0 0 0.0 0.0 1 0.7 1.0 1 0.7 1.1Vegetation 2 1.6 2.0 3 4.3 6.7 3 2.1 3.1 2 1.5 2.3Insects 3 2.4 3.0 16 22.9 35.6 21 14.9 21.4 3 2.2 3.4Total Food Items Total Scat Samples
124101
7045
14198
13788
16
4.1.1 Dietary Niche Overlap
The diets of grey foxes and Oncifelis spp. had the highest overlap (0.92; Table 3),
followed by the diets of culpeo and grey foxes (0.91; Table 3). The simulated mean
overlap was 0.44 (variance = 0.004), with the observed overlap greater than expected by
chance ip = 0.001).
Table 3. Dietary niche overlap of culpeo and grey foxes, Geoffroy’s and pampas cats.
Species P. concolor P. culpaeus P. griseus Oncifelis spp.P. concolor X 0.44 0.46 0.65P. culpaeus X 0.91 0.78P. griseus X 0.92Oncifelis spp. X
4.1.2 Dietary Separation
Differentiation existed in the diet of Payunia’s carnivores (Fig. 2). Pumas, Geoffroy’s
cats and pampas cats all consumed more viscachas and European hares. Pumas also
consumed more guanacos and pichis, while the smaller cats consumed more small
rodents. Culpeo foxes tended to specialize towards insects, while grey foxes had a more
general diet, consuming small rodents, insects, and viscachas.
17
(N
1.5
1
0.5
0
-0.5
1
-1.5
Chinchillid
Puma ^
Lama
A Carnivore■ Prey
leCats
_ ̂ A Muridae epus ■■
Zaedyus
■Livestock ^
Grey c'enomys
k3ulpeo-Insects
-1.5 -1 -0.5 0 0.5
Dimension 1
1.5
Fig. 2. Dimensions 1 and 2 of the correspondence analysis for La Payunia Reserve, Mendoza, Argentina, comparing frequency of occurrence of prey items by carnivore species. Dimension 1 accounts for 69.71% of the total variation (97.88%); Dimension 2 accounts for 28.17%.
4.1.2 Dietary Niche Breadth
Standardized niche breadth for the entire study period was widest for culpeo foxes (Bsta ̂
0.645), followed by grey foxes and the small cats (Bsta = 0.515 and Bsta = 0.440,
respectively). Niche breadth was narrowest for pumas (Bsta = 0.306).
4.1.3 Mean Weight of Vertebrate Prey
As expected, mean weight of mammalian prey was greater for pumas, because of their
larger size and preference for guanacos as a prey item. Grey foxes on average consumed
the next largest prey, followed by culpeo foxes and the small cats, respectively (Table 4).
-
18
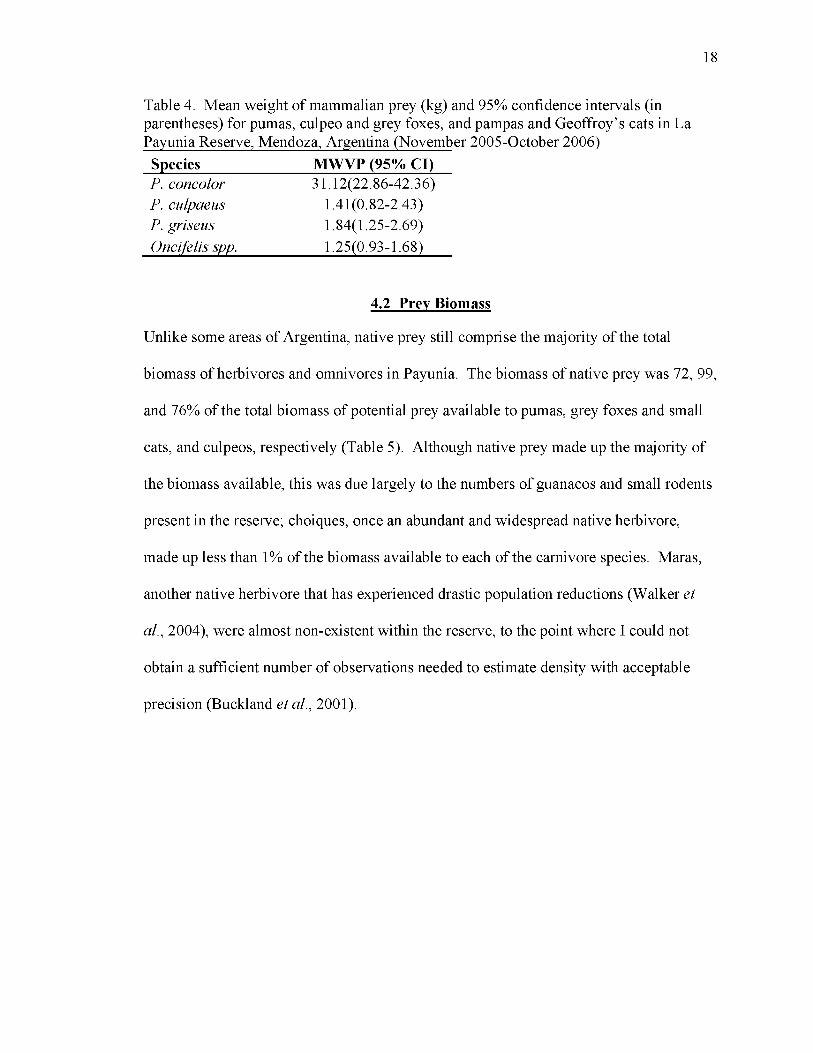
Table 4. Mean weight of mammalian prey (kg) and 95% confidence intervals (in parentheses) for pumas, culpeo and grey foxes, and pampas and Geoffroy’s cats in La
Species MWVP (95% Cl)P. concolor 31.12(22.86-42.36)P. culpaeus 1.41(0.82-2.43)P. griseus 1.84(1.25-2.69)Oncifelis spp. 1.25(0.93-1.68)
4.2 Prey Biomass
Unlike some areas of Argentina, native prey still comprise the majority of the total
biomass of herbivores and omnivores in Payunia. The biomass of native prey was 72, 99,
and 76% of the total biomass of potential prey available to pumas, grey foxes and small
cats, and culpeos, respectively (Table 5). Although native prey made up the majority of
the biomass available, this was due largely to the numbers of guanacos and small rodents
present in the reserve; choiques, once an abundant and widespread native herbivore,
made up less than 1% of the biomass available to each of the carnivore species. Maras,
another native herbivore that has experienced drastic population reductions (Walker et
al., 2004), were almost non-existent within the reserve, to the point where I could not
obtain a sufficient number of observations needed to estimate density with acceptable
precision (Buckland etal., 2001).

19
Table 5. Relative percent biomasses of prey available to culpeos, grey foxes, Geoffroy’s and pampas cats, and pumas in La Payunia Reserve, Mendoza, Argentina (November
Prey P. concolor P. griseus/Oncifelis spp. P. culpaeusMuridae 3.90 9.51 111Chinchillidae 5.48 13.36 10.22Ctenomys 7.66 18.70 14.31Microcavia australis 23.30 56.86 43.50Lama guanicoe 31.65 0.00 0.00Zaedyus pichiy 0.31 0.76 0.58Lepus europaeus 0.31 0.76 0.58Livestock 27.17 0.00 23.41Birds 0.23 0.04 0.13Total kg/km^ 3037.08 1244.37 1626.78
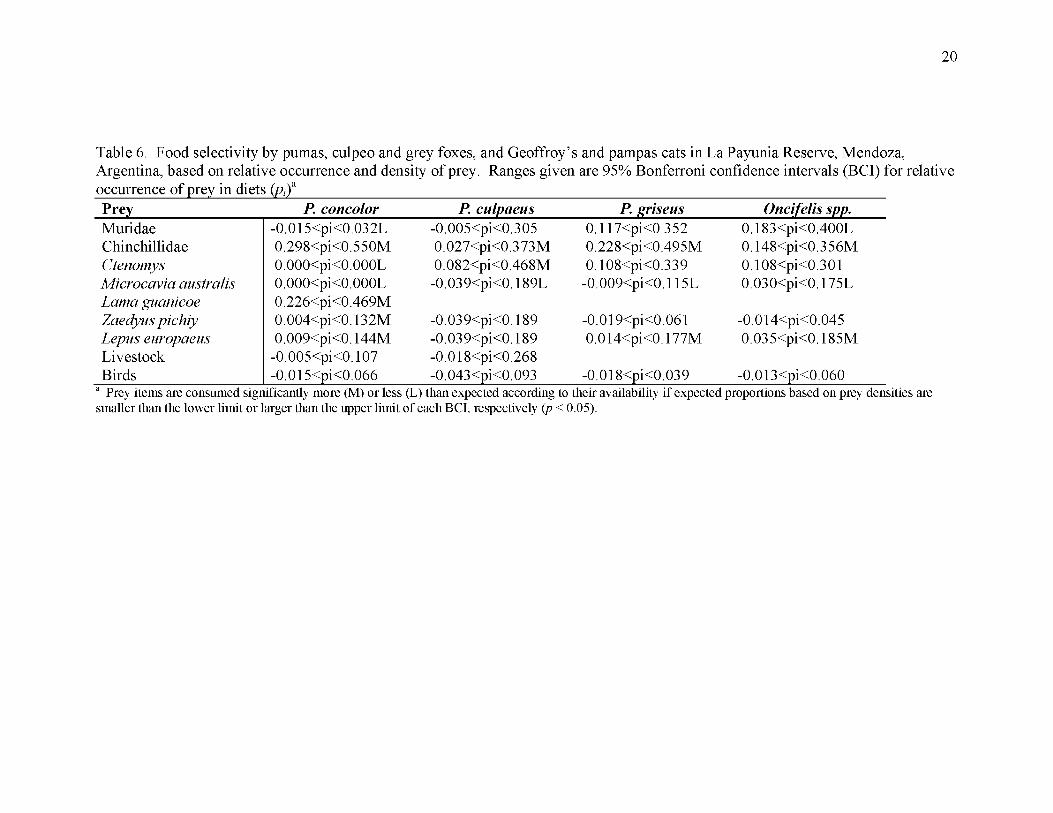
4.3 Selection of Prey
The frequencies of prey in the diets of pumas {% = 13320.42; d.f. = 8; /7<0 .01), culpeos
(X̂ = 1111.43; d .f = l \ p < 0.01), grey foxes (x = 2725.87; d.f. = 6;p< 0.01), and
Geoffroy’s and pampas cats (x = 2518.27; d.f. = 6; /7<0 .01) differed significantly from
the relative densities of prey available. All species consumed viscachas more than
expected according to their densities. Pumas consumed guanacos and pichis more than
expected, and pumas, grey foxes, and the small cats consumed European hares more than
expected. All species of carnivores consumed M/crocav/a less than expected; pumas
consumed Ctenomys less than expected, while culpeo foxes consumed Ctenomys more
than expected. Muridae were consumed less than expected by pumas and the small cats
(Table 6).
2 0
Table 6. Food selectivity by pumas, culpeo and grey foxes, and Geoffroy’s and pampas cats in La Payunia Reserve, Mendoza, Argentina, based on relative occurrence and density of prey. Ranges given are 95% Bonferroni confidence intervals (BCI) for relative
Prey P. concolor P. culpaeus P. griseus Oncifelis spp.MuridaeChinchillidaeCtenomysMicrocavia australis Lama guanicoe Zaedyus pichiy Lepus europaeus Livestock Birds
-0.015<pi<0.032L0.298<pi<0.550M0.000<pi<0.000L0.000<pi<0.000L0.226<pi<0.469M0.004<pi<0.132M0.009<pi<0.144M
-0.005<pi<0.107-0.015<pi<0.066
-0.005<pi<0.3050.027<pi<0.373M0.082<pi<0.468M
-0.039<pi<0.189L
-0.039<pi<0.189-0.039<pi<0.189-0.018<pi<0.268-0.043<pi<0.093
0.117<pi<0.3520.228<pi<0.495M0.108<pi<0.339
-0.009<pi<0.115L
-0.019<pi<0.0610.014<pi<0.177M
-0.018<pi<0.039
0.183<pi<0.400L0.148<pi<0.356M0.108<pi<0.3010.030<pi<0.175L
-0.014<pi<0.0450.035<pi<0.185M
-0.013<pi<0.060Prey items are consumed significantly more (M) or less
smaller than the lower limit or larger than the upper limit(L) than expected according to their availability if expected proportions based on prey densities are of each BCI, respectively {p < 0.05).
2 1
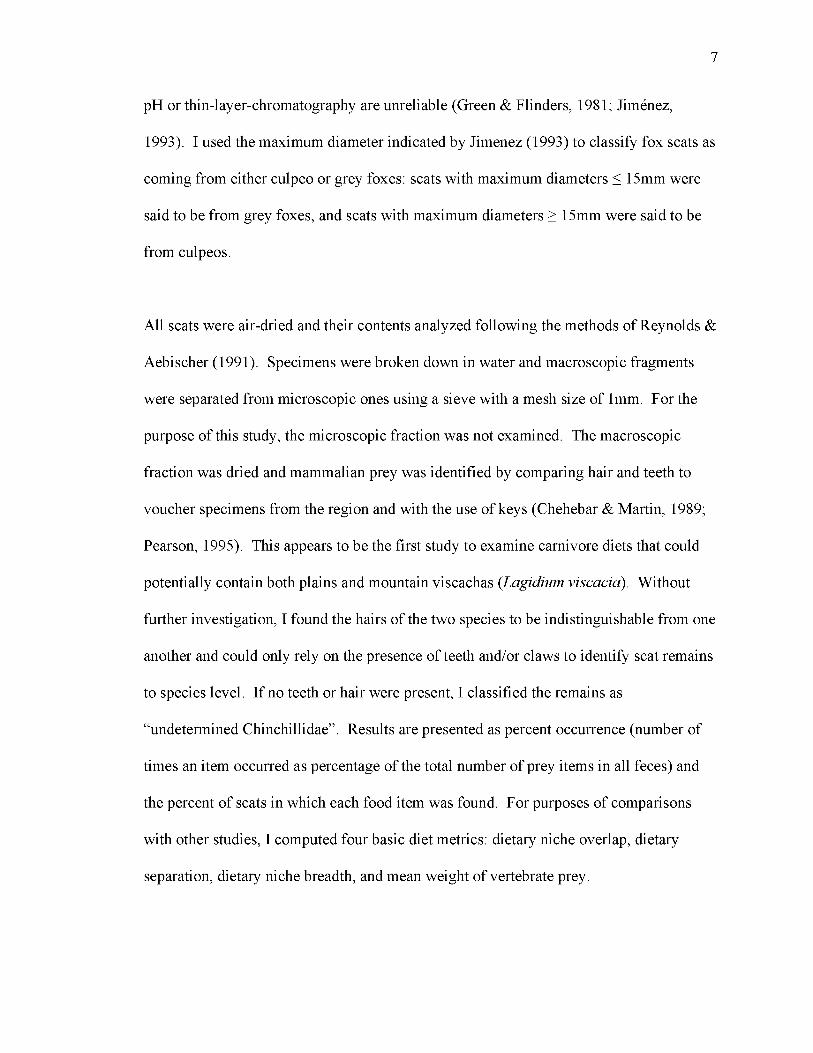
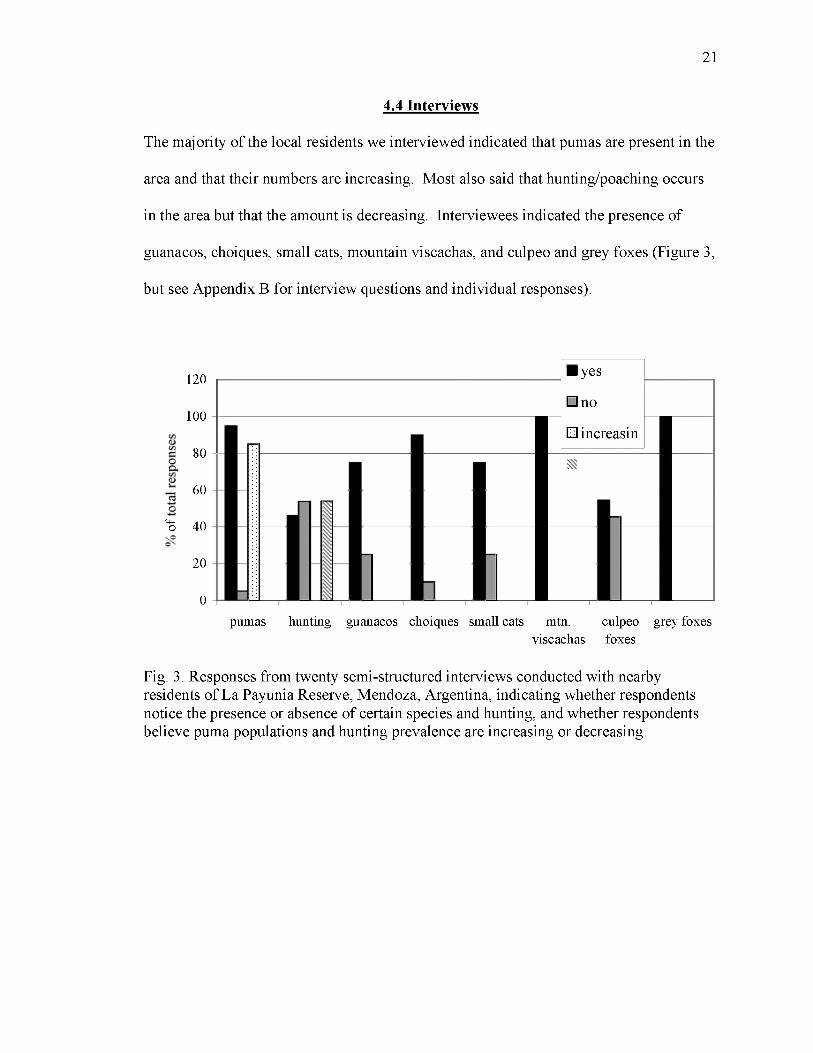
4.4 Interviews
The majority of the local residents we interviewed indicated that pumas are present in the
area and that their numbers are increasing. Most also said that hunting/poaching occurs
in the area but that the amount is decreasing. Interviewees indicated the presence of
guanacos, choiques, small cats, mountain viscachas, and culpeo and grey foxes (Figure 3,
but see Appendix B for interview questions and individual responses).
t4Ho
120
100
80
60
40
20
0
■ yes
□ no
□ increasin
pumas hunting guanacos choiques small cats mtn. culpeo grey foxesviscachas foxes
Fig. 3. Responses from twenty semi-structured interviews conducted with nearby residents of La Payunia Reserve, Mendoza, Argentina, indicating whether respondents notice the presence or absence of certain species and hunting, and whether respondents believe puma populations and hunting prevalence are increasing or decreasing.
2 2
5. DISCUSSION
Many studies have investigated theories behind optimal foraging, the idea that predators
should select for the most profitable prey, which would seem to be the largest available
prey that can safely be killed (Sunquist & Sunquist, 1989). This is complicated by the
fact that search time, encounter rates, risk of injury to predator, and energetic costs of
capture must be taken into account. For example, a smaller, more abundant prey might
become more rewarding to a predator if too much energy is spent searching for a larger
prey that exists in low numbers.
Plains viscachas are large, nocturnal rodents that live in social groups of 10-30 animals
and have been shown to be a relatively reliable, abundant, and spatially predictable prey
due to their aggregated burrow systems (Branch, Pessino & Villareal, 1996). Although
they are of relatively small size compared to larger herbivorous prey, this disadvantage to
predators may be offset by lesser search and handling times and/or risk of injury. Little is
known of mountain viscachas, but they too are colonial, and potentially present a
predictable clumped resource for predators (pers. obs.).
All carnivore species in this study consumed viscachas significantly more than expected
based on density estimates. In Lihue Calel National Park, Argentina, Branch etal. (1996)
observed a high percentage of viscachas in puma diets subsequently decrease after the
population of viscachas crashed, which in addition to low dietary breadth and low
frequency of large prey in periods of high viscacha abundance, led them to hypothesize
that pumas selectively forage on viscachas. Something similar may be occurring in
23
Payunia, where pumas have a low breadth of diet in comparison to other South American
sites (Taber et al., 1997) and viscachas are abundant and easily caught. Both species of
foxes and both species of smaller cats also appear to be optimally foraging on the
relatively large (in comparison to the body sizes of these predators) viscachas, consuming
significantly more than expected based on their population density.
The diets of Felidae tend to be more specific than those of other Carnivora, generally
consisting of mammalian prey of sizes commensurate with their own body size, with little
or no fish, vegetation, or invertebrates (Kruuk, 1986). The results of this study support
this statement, and suggest that separation occurs in the dietary niches of the carnivores
of Payunia. The diets of all three Felidae species contained lower numbers of vegetation
and insects than those of the foxes.
Although pumas have been shown to take smaller introduced prey such as European
hares (Yanez et al., 1986; Rau et al., 1991) and even smaller native prey such as
viscachas (Branch, 1995; Branch etal., 1996; this study), the relatively intact population
of guanacos in Payunia has allowed continued predation and selection by pumas on this
large native, and historically important herbivore. This is in contrast to other Patagonian
sites where guanacos no longer provide this ecological role (Novaro et al., 2000). Maras
and choiques, the next largest available native prey species, were not selected for. No
evidence of maras was found in any of the carnivores’ diets, and although prey items
identified as birds were not classified to species, birds represented no more than 2.4% of
numbers of prey for any of the carnivores, and were consumed as expected based on
24
density. These results are most likely due to the low abundances of maras and choiques
(Walker etal., unpubl. data) and these species may be considered ecologically extinct as
prey and sources of carrion in the area (Novaro et al., 2000). There may be low densities
of these animals for several reasons: native herbivores may experience intense
competition for habitat and diet resources due to high niche overlap with introduced
species (Grigera & Rapoport, 1983; Baldi etal., 2004), native prey species are often
hunted for subsistence (Walker et al., 2004), and due to the introduction of additional
prey species, densities of predators may be greater than before. A higher density of
predators can cause a decreasing or low prey population to survive only at a very low
density (Bergerud, 1983).
In general, foxes tend to be omnivorous and opportunistic, adjusting their diets in
response to changes in local and seasonal prey availability (Romo, 1995). As could be
expected, the dietary preferences of foxes in this study generalized more than the other
carnivores, and had the widest dietary preferences. Culpeos appeared to prefer
Ctenomys, insects and carrion or young of livestock and guanacos more so than grey
foxes. Grey foxes tended to prey more on viscachas and European hares. However, to
see if these two foxes are exhibiting the niche-complementarity hypothesis that they do in
other parts of South America, it would be necessary to examine the temporal and/or
spatial components of their niches in relation to diet.
A few other observations regarding the dietary preferences of Payunia’s carnivores are
worth noting: all species consumed significantly less M/crocav/a than expected based on
25
prey density, and pumas, grey foxes, and the smaller cats all consumed European hares
significantly more than expected based on density. One reason the results indicate lack
of consumption of the former might be that actual densities of Microcavia in Payunia are
not as great as indicated by the literature, which was based on a study done in the
province of Buenos Aires, well to the east of Payunia (Reford & Eisenberg, 1992). The
high consumption of European hares could indicate that carnivores find them an easy
prey, or that their numbers in Payunia are high. The latter suggests that European hares
could present competition to native species.
Further examination of dietary preferences for viscachas could provide a more detailed
description of dietary separation among Payunia’s carnivore species. Of the viscachas
that I was able to identify to species during scat analysis, pumas and foxes appeared to
consume only plains viscacha, while the smaller cats consumed eight mountain viscachas
and only one plains viscacha. Could it be that the smaller cats overlap in habitat use with
either the foxes or pumas, therefore causing the species to differ in diet and exhibit the
niche-complementarity hypothesis? To explore this, it would be necessary to distinguish
between the scats of Geoffroy’s cats and pampas cats, and more definitively distinguish
between the scats of culpeo and grey foxes. The scats from small cats in this study may
have all or mostly been from one species or the other. Thus, care should be taken when
drawing conclusions about the dietary preferences of these two species. In addition, it
would be useful to estimate the total and seasonal minimum number of scat samples
needed for this study, following the methods of Hanson & Graybill (1956) or Ray &
Sunquist (2001). Since many of the scats were collected from the same, repeatedly-
26
visited telemetry sites, the results of this study may indicate dietary preferences of just a
few individuals, rather than those of the region’s carnivores as a whole. In future
research, it might be useful to identify scats to species and/or individual level through
genetic analysis of mitochondrial DNA isolated from intestinal cells found in deposited
scats (Palacios, 2006).
Finally, although livestock did not make up a large percentage of the diets of Payunia’s
carnivores, local complaints about predation on livestock cannot be ignored. Livestock
frequently range within the reserve boundaries, and tend to concentrate around the
perimeter (pers. obs.). Most of the scats collected in this study were found in this area. It
is difficult to say whether the scats that did contain livestock remains were from
carnivores that actually left the reserve to prey on livestock or from carnivores feeding on
the animals found just within the boundary. Further research and collection of carnivore
scats in areas well outside of the reserve, and several areas well within the reserve, and
not influenced by the reserve boundary and each with multiple transects, are needed to
compare and document the actual amount of predation on livestock taking place.
If scats found well within the reserve contain livestock remains, it will be obvious that
carnivores are selecting for livestock, as no livestock is found deep within the reserve.
And if scats found well outside the reserve contain many native prey remains, it will be
obvious that carnivores are seeking out native prey, as native prey densities are low
outside the reserve (pers. obs.). If carnivores are not selective, prey types should be

27
consumed in proportion to their respective availabilities at a given locale, regardless of
whether or not the boundary is nearby.
Either way, although the ecological roles of most of Payunia’s carnivores and their prey
appear to still be relatively intact, they are in a vulnerable state, and immediate
conservation action needs to be taken to prevent the introduction of additional exotic
species, stop the decline of native herbivores, and restore Patagonia’s landscape to what it
once was. To do this, some key issues need to be addressed.
First of all, although interviewees indicate that hunting is decreasing (Appendix B),
carcasses and events witnessed by ourselves and park guards indicate that illegal hunting
is still common in the reserve. Currently, park guards do not have the resources to
control hunting. They are often short on staff, vehicles, and/or fuel. In addition, since
they are unarmed, park guards often need to call for assistance from the police or the
national guard, which can be difficult to coordinate and often happens too late, after the
hunter is already gone. If park administration can not supply sufficient funding or
supplies to control hunting, effective conservation will require the acquisition of outside
resources, such as from donors or non-governmental organizations.
Conservation of Payunia’s carnivores and their prey also requires involvement of local
livestock owners. Area residents spend time in the field and are important sources of
local knowledge. They also have a vested interest in working with researchers and/or

28
park guards to understand predator-prey interactions, as their livelihoods may be
threatened by lack of predator management.
Livestock-guarding dogs have been shown to be successful in protecting livestock
(Marker, Dickman & Macdonald, 2005). Currently, Wildlife Conservation Society is
developing a program with locals in the Payunia area to implement guard dogs in
protection of their livestock from predation. Livestock-guarding dogs are generally
recognized for their attentiveness and trustworthiness, are raised with the livestock herds,
and when threatened, will place themselves between the threat and the herd, barking
loudly to deter any predator. This non-lethal method of predator control could have
direct economic benefits for livestock owners in terms of reduced losses, as well as
facilitate the coexistence of humans and carnivores.
While the interviews in this study were an important start to developing involvement and
partnerships among researchers and livestock owners, these sorts of open dialogues need
to be repeated over time. These continued conversations may prove useful in discovering
shifts and seasonal variability in predator/prey numbers and interactions. Giving area
residents a participatory role, as field assistants or as informants to study locations, for
example, may also establish a sense of importance, understanding, and/or ownership in
the area and its wildlife, thereby increasing the desire for conservation of these resources.
In addition, increased public education could serve to inform residents of the detrimental
effects that introducing more exotic species could have on the surrounding vegetation and
populations of native herbivores. Only by collaborating with the private sector can we

29
hope to promote and consolidate protected areas in order to conserve, restore, and
maintain suitable habitat and reduce threats to wildlife.

30
6. REFERENCES
Arita, H.T., Robinson, J.G., & Redford, K.H. (1990). Rarity in neotropical forest mammals and its ecological correlates. Conserv. Biol. 4: 181-192.
Baldi, R., Pelliza-Sbriller, A., Elston, D., & Albon, S. (2004). High potential forcompetition between guanacos and sheep in Patagonia. J. Wildl. Manag. 68(4): 924-938.
Berger, J. (2004). The last mile: how to sustain long-distance migration in mammals. Conserv. Biol. 18: 320-331.
Bergerud, A.T. (1983). Prey switching in a simple ecosystem. Scientific American 249: 130-141.
Branch, L.C. (1995). Observations of predation by pumas and Geoffroy’s cats on the plains vizcacha in semi-arid scrub of central Argentina. Mammalia 59(1): 152- 156.
Branch, L. C., Pessino, C.M., & Villarreal, D. (1996). Response of pumas to a population decline of the plains vizcacha. J. Mammal 77(4): 1132-1140.
Brown, W.L. & Wilson, E.G. (1956). Character displacement. Syst. Zool. 5(2): 49-65.Buckland, S.T., Anderson, D.R., Burnham, K.P., Laake, J.L., Borchers, D.L., & Thomas,
L. (2001). Introduction to distance sampling: estimating abundance o f biological populations. New York: Oxford University Press Inc.
Bulmer, M.G. (1974). Density-dependent selection and character displacement. Am. Nat. 108: 45-58.
Byers, C.R., Steinhorst, R.K., & Krausman, P.R. (1984). Clarification of a technique for analysis of utilization-availability data. J. Wildl. Manag. 48(3): 1050-1053.
Chehebar, C. & Martin, S. (1989). Guia para el reconocimiento microscopico de los pelos de los mamiferos de la Patagonia. Donana, Acta Vertebrata 16(2): 247- 291.
Colwell, R.K. & Futuyma, D.J. (1971). On the measurement of niche breadth and overlap. Ecology 52(4): 567-576.
Conway, W. (2005). Act I llin Patagonia: people and wildlife. Washington, D.C.: Island Press.
Fowler, J., Cohen, L., & Jarvis, P. (1998). Practical statistics for field biology. West Sussex, England: John Wiley & Sons.
Fuentes, E.R. & Jaksic, F.M. (1979). Latitudinal size variation of Chilean foxes: tests of alternative hypotheses. Ecology 60: 43-47.
Gause, G.F. (1934). The struggle for existence. Baltimore, MD: Williams & Wilkins.Gotelli, N.J. & G.E. Entsminger. (2006). EcoSim: Null models software for ecology.
(version 7). Available from Intelligence Inc. & Kesey-Bear. Jericho, VT 05465. http://garyentsminger.com/ecosim.htm.
Green, J.S. & J.T. Flinders. (1981). Diameters and pH comparisons of coyote and red fox scats. J. Wildl. Manag. 45: 161-161.
Grigera, D.E., & Rapoport, E.H. 1983. Status and distribution of the European hare in South America. J. Mammal. 64(1): 163-166.
Hanson, W.R., & Graybill, F. (1956). Sample size in food habits analyses. J. Wildl. Manag. 20(1): 64-68.
31
Jaksic, P.M., Jimenez, J.E., Castro, S. A., & Feisinger, P. (1992). Numerical andfunctional response of predators to a long-term decline in mammalian prey at a semi-arid Neotropical site. Oecologia 89: 90-101.
Jimenez, J.E. (1993). Comparative ecology c/Dusicyon foxes at the Chinchilla National Reserve in north-central Chile. MS thesis. University of Florida, Gainesville, Florida, viii + 163pp.
Jimenez, J. E., Yanez, J.L., Tabilo, E.L., & Jaksic, F.M.. (1996). Niche-complementarity hypothesis of South American foxes: reanalysis and test of a hypothesis. Rev.Chil. Hist. Nat. 69: 113-123.
Johnson, W.E. & Franklin, W.L. (1991). Feeding and spatial ecology dtFelis geojfroyi in Southern Patagonia. J. Mammal. 12{4)'. 815-820.
Kruuk, H. (1986). Interactions between Felidae and their prey species: a review. In Cats o f the world: biology, conservation, and management. 333-352. Miller, S.D., & Everett, D.D. (Eds). Washington, D.C.: National Wildlife Federation.
Levins, R. (1968). Evolution in changing environments. Princeton, New Jersey: Princeton University Press.
MacArthur, R.H. & Levins, R. (1967). The limiting similarity, convergence and divergence of co-existing species. Am. Nat. 101: 377-385.
Marker, L.L., Dickman, A.J., & Macdonald, D.W. (2005). Perceived effectiveness oflivestock-guarding dogs placed on Namibian farms. Rangeland Ecology & Mgmt. 58(4):329-336.
Mech, L.D. (1996). A new era for carnivore conservation. Wildlife Society Bulletin 24(3): 397-401.
Neu, C.W., Byers, C.R., & Peek, J.M. (1974). A technique for analysis of utilization- availability data. J. Wildl Manag. 38(3): 541-545.
Novaro, A.J., Funes, M.C., & Walker, R.S. (2000). Ecological extinction of native prey of a carnivore assemblage in Argentine Patagonia. Biol. Conserv. 92: 25-33
Novaro, A.J. & Walker, R.S. (2005). Movimientos estacionales y efecto de ladepredacion por pumas en la poblacion de guanacos de la Payunia. In Ecologia espacialy conservacion de la poblacidn de guanacos de la Payunia'. 3-4.
Palacios, R. (2006). Andlisis de dietay superposicion nicho trdfico de un ensamble decarnivoros en la Patagonia Argentina. Thesis. Universidad Nacional de Cordoba.
Pearson, O.P. (1995). Annotated keys for identifying small mammals living in or near Nahuel Huapi National Park or Lanin National Park, Southern Argentina. Mastozool. Neotrop. 2(2): 99-148.
Perry, R.O. (1972). Warfare on the Pampas in the 1870s. Military Affairs 36(2): 52-58.Pianka, E.R. (1973). The structure of lizard communities. Annu. Rev. Ecol. Syst. 4: 53-
74.Puig, S., Videla, F., & Cona, M.I. (1997). Diet and abundance of the guanaco {Lama
guanicoe Miiller 1776) in four habitats of northern Patagonia, Argentina. J. Arid Environ. 36: 343-357.
Rau, J.R., Tilleria, M.S., Martinez, D.R., & Munoz, A.H. (1991). Dieta d^Felis concolor (Carnivora: Felidae) en areas silvestres protegidas del sur de Chile. Rev. Chil.Hist. Nat. 64: 139-144.
Ray, J.C. & Sunquist, M.E. (2001). Trophic relations in a community of African rainforest carnivores. Oecologia 127: 395-408.
32
Redford, K.H., & Eisenberg, J.F. (1992). Mammals o f the Neotropics: the Southern Cone Volume 2. Chicago, Illinois: University of Chicago Press.
Reynolds, J.C., & Aebischer, N.J. (1991). Comparison and quantification of carnivorediet by faecal analysis: a critique, with recommendations, based on a study of the Fox Vulpes vulpes. Mammal Rev. 21: 97-122.
Romo, M.C. 1995. Food habits of the Andean fox {Pseudalopex culpaeus) and notes on the mountain cat {Fells colocolo) and puma {Fells concolor) in the Rio Abiseo National Park, Peru. Mammalia 59(3): 335-343.
Rosi, M.I., Cona, M.I., Roig, V.G., Massarini, A.I., & Verzi, D.H. (2005). Ctenomys mendoclnus. Mamm. Species 777: 1-6.
Schoener, T.W. (1974). Resource partitioning in ecological communities. Science 185: 27-39.
Sih, A., Crowley, P., McPeek, M., Petranka, J., & Strohmeier, K. (1985). Predation, competition, and prey communities: a review of field experiments. Annu. Rev. Ecol. Syst. 16: 269-311.
Solar, R.G., Puig, S., Videla, F., & Roig, V. 1997. Diet composition of the SouthAmerican grey fox, Pseudalopex griseus Gray, 1837 in Northeastern Mendoza, Argentina. Mammalia 61 (4): 617-621.
Sunquist, M.E. & Sunquist, F.C. (1989). Ecological constraints on predation by large felids. In Carnivore behavior, ecology, and evolution'. 283-301. Gittleman, J.(Ed). Ithaca, New York: Cornell University Press.
Taber, A.B., Novaro, A.J., Neris, N., & Colman, F.H. (1997). The food habits ofsympatric jaguar and puma in the Paraguayan chaco. Blotroplca 29(2): 204-213.
Thomas, L., Laake, J.L., Strindberg, S., Marques, F.F.C., Buckland, S.T., Borchers, D.L., Anderson, D.R., Burnham, K.P., Hedley, S.L., Pollard, J.H., Bishop, J.R.B., & Marques, T.A. (2005). Distance 5.0 Beta 4. Research Unit for Wildlife Population Assessment, University of St. Andrews, UK. http://www.ruwpa.stand.ac.uk/distance/.
Walker, R.S., Novaro, A.J., Perovic, P., Palacios, R., Donadio, E., Lucherini, M., Pia, M., & Lopez, M.S. (Accepted 2007). Diets of three species of Andean carnivores in high-altitude deserts of Argentina. J. Mammal. 88(2): 000-000.
Walker, R.S., Novaro, A.J., Funes, M., Balde, R., Chehebar, C., Ramilo, E., Ayesa, J.,Bran, D., Vila, A., & Bonino, N. (2004). Rewilding Patagonia. WlldFarth 15: 32- 37.
Yanez, J.L., Cardenas, J.C., Gezelle, P., & Jaksic, F.M. (1986). Food habits of thesouthernmost mountain lions {Fells concolor) in South America: natural versus livestocked ranges. J. Mammal. 67(3): 604-606.

33
7. APPENDICES
Appendix A. Afterword
My time in Argentina was an amazing experience for which I would not trade a thing. I
feel that given the resources available to me, I conducted a significant scientific,
exploratory investigation, but if I could do it over again, there are some changes I would
make to increase rigor and precision.
It is always recommended to conduct a pilot study or at least to lay out your methods
before beginning. This not only applies to how you are going to collect the data, but also
to how you are going to analyze it. The whole experience was a learning project and
something I had never done before, and not wanting to waste valuable time, I was reading
articles and background information even after I had already started and as I went along,
trying to ask the right questions and get advice when I wasn’t in the reserve, which
wasn’t very often.
The line transects did not get set up in their final design until mid-March; I also did not
start counting guanacos until this time - we thought initially that I did not need to do so
because I could use pre-existing data. While I had been counting animals since
November and was able to still use some of the data to fit the new design, it would have
been better to have implemented the transect design at the beginning to ensure equal
sampling among seasons and to obtain an adequate number of observations each season
to estimate density with more precision. Instead, I was unable to estimate density for a

34
couple species and had to lump all observations across the year to come up with a total
density rather than for each season.
The study might also have been more systematic if I had used transects to collect scats
rather than opportunistically. While I still collected a fair number of scats, most of them
were collected as I was hiking up rocky hills/volcanoes to search for guanacos with radio
telemetry or as we found carcasses while driving or walking along. Again, determining
minimum sample size and more definitively identifying scats to species level would have
been helpful.
Appendix B. Interviews
Questions:a) Nameb) Ranch name and locationc) Site of snmmer livestock feeding gronnds and dates of arrival and departnred) Site of winter gronnds and dates of arrival and departnree) Nnmbers and types of livestockf) Are pnmas present in yonr area? If so, have their nnmbers increased, decreased, or stayed the same? Since when did yon start noticing this change in nnmbers?g) Is there hnnting/poaching in yom area? If so, has the amonnt increased, decreased, or stayed the same? Since when did yon start noticing a change in the amonnt?h) Have yon noticed the presence of gnanacos? If so, where?i) Have yon noticed the presence of choiqnes? If so, where?j) Have yon noticed the presence of small cats, small cat latrines, or skins of small cats? If so, where? k) Have yon noticed the presence of monntain viscachas? If so, where?1) Have yon noticed the presence of cnlpeo foxes? If so, where? m) Have yon noticed the presence of grey foxes? If so, where? n) Other comments
Answers:1.
a) Sosa Domingob) Matansilla; 36°48’23.6” 68°51’10.4” 1403mc) No separate snmmer and winter gronndsd) [See above]e) 1300 goats; several cows; had sheep before bnt pnmas killed themf) Yes, pnmas have increased since 1985h) Not on this ranch bnt on Chachanen Hill j) No1) Nom) Yes, many

35
n) Ranch is 37,000ha. Not fenced. Many problems with pnma all over in the Chachanen area and in that area 1 see many gnanacos.
2 .
a) Gregorio Moyab) Los Toscales; 36°33’51,5” 69°2’38,9” 1387mc) No separate snmmer and winter gronndsd) [See above]e) 1200 goats; few cows; had sheep before bnt pnmas killed them; 28 horsesf) Pnmas nnmber have been increasing for abont eighteen yearsg) Noh) Yes, it’s been three years since 1 saw so many in the area. They arrived in May.i) Yes, not manyj) Yes, ‘gato overo’, bnt no latrines or skins 1) Nom) Yes, nsnally when the goats are being bom
3.a) Jnan Olivab) El Molina; 35.92613 69.09983 1337mc) No separate snmmer and winter gronndsd) [See above]e) Have goats, cows, sheep, and horsesf) The nnmbers of pnmas are increasing bnt 1 don’t know since whenh) Yes, makes me mad becanse they eat the pastnrei) Noj) Yes, pampas and Geoffroy’s cats1) No, bnt it’s been 18 years and they nsed to canse a lot of damage to the livestock
4.a) Moyano Isidorec) Casa de Piedra, Chacayco; depart in Aprild) Agna Botada; arrive in Aprile) 1500 goats; 120 cows; 80 horsesf) Pnmas have been increasing for abont 10 yearsg) Noh) Noi) Yes, in Agna Botadaj) Yes, Geoffroy’s cats in Chacayco and Agna Botada k) Yes, in Chacayco and Agna Botada 1) Yes
5.a) Hnmberto Zagalb) ElDnrazno; 35.94904 69.41187 1922mc) Lagnna Verde; arrive in Nov. Dee.; depart at the end of Marchd) Palanco; arrive at the end of March; depart in Nov. Dec.e) 400 500 goats; 200 cows; 10 horsesf) Yes, in Lagnna Verde; increasing for 15 yearsg) No, decreased in the last 2 3 yearsh) Yes, in Palancoi) Yes, in Palanco bnt not in Lagnna Verdej) Yes, pampas cats in Palanco and in Lagnna Verde, bnt not latrines or skins1) Yes, there are a few in Lagnna Verde becanse there is pnma there; there are a few in Palanco
6 .
--
-
-

36
a) Nolasco Barredab) Cienaga de Borbaran, Tierra de Reyes (30 kilometers from Payunia Ranger Station)c) No separate snmmer and winter gronndsd) [See above]e) 250 goats; 30-40 cows; 40-50 horsesf) Few pnmasg) Yes, hnnters come from San Rafael, bnt the amonnt has decreasedh) Yes, in December I see more j) Yes, pampas catsk) Yes, many 1) No m) Yes
7.a) Rolando Mansillab) Coihneco Snrc) We take only the goats and horses to Pnerta Barranca; arrive in December and depart in Aprild) We have the cows and sheep in Coihneco all year long; arrive in April and depart in Decembere) 1000 goats; 100 cows; 60 sheep; 30 horsesf) Yes, in Coihneco; increasing for abont ten yearsg) No, decreasingi) Yes, in Coihnecoj) Yes, pampas and Geoffroy’s cats and latrines in Santa Maria volcanok) Yes, in Santa Maria1) Yes, in Barranca, Coihneco, and Palancon) There was more wildlife when YPF was not here in Fortnnoso. The cats eat monntain viscachas.
a) Lnca Carac) El Salitre; take the goats and the horses and sometimes the cowsd) Chacaycoe) 500 goats; 50 cows; no sheep; 40 horsesf) Yes, in Chacayco; they have been increasing for 20 yearsg) No, becanse there is no road to get inh) Noi) Yes, in Chacayco, there is a big nnmber actnallyj) Yes, pampas cats in El Salitre and Chacayco and Geoffroy’s cats in El Salitre; latrines too1) Yes, in El Salitre and Chacaycon) Before, we nsed to see gnanacos in Canada Seca
9.a) Jose Carrozcob) Cajon del Pehnenchec) Pehnenche; arrive in September and depart in Aprild) Malhal del Medio; arrive in April and depart in Septembere) 3000 goats; 900 cows; before we had several sheep bnt when the oil company came we lost them all; 50 horsesf) No becanse we are near the oil activity; haven’t noticed them since the oil company cameg) Noh) Noi) Yes, a few in Malhal del Medio j) No cats, latrines, or skinsk) Yes, in the monntain range of Malhal del Medio; before, we nsed to see more 1) Non) Before, we nsed to see more gnanacos; now, only in the monntain range of Colhi Malhal, Camileo Hill, and Rincon Agna de las Sierras Cordon del Mar

37
10.
a) Diciderio Vallejoc) Polcuro Potimalal; arrive in September and depart in Aprild) Arroyo Llenqneco; arrive in April and depart in Septembere) 500 goatsf) Yes, increasing for abont 10 yearsg) No, the amonnt has decreased in the past 10 yearsh) No, bnt there are some signs of themi) Yes, in Arroyo Llenqneco J) Nok) Yes, in monntain range of Potimalal 1) Yesn) Before, we nsed to see more gnanacos; now, only in the monntain range of Colhi Malhal, Camileo Hill, and Rincon Agna de las Sierras Cordon del Mar
11.
a) Forqnerab) Forqnerac) No separate snmmer and winter gronndsd) [See above]e) 500 goats, some cows and some horsesf) Yes, the nnmbers have increased in the past 5 yearsh) Yesi) Yes, manyj) Yes, Geoffroy’s cats inPayunMatrun) The gnanacos in winter pass throngh to the sontheast; the choiqnes when it snows come down from Payun Matni
12.
a) Daniel Mendozab) Mendoza; 36.18443 69.45555 1848mc) Palanco monntain range or in the area, bnt don’t move mnchd) Palancoe) 700 800 goats; some cows and some horsesf) Yes, the nnmbers have been increasing alwaysh) Yes, Palanco, near the honsej) Yes, pampas and a few Geoffroy’s cats k) Yes, many1) Yes, they do a lot of damage to the goats m) Yes, bnt less qnantity [than cnlpeos]n) Sometimes yon can see Chacal fox (longer and lighter hair). The gnanacos in winter go to Zaino and Nevado, to the sontheast. We have water on the ranch all year and good pastnre, for that we don’t move the animals mnch.
13.a) Ubaldino Diazb) Rincon Amarillo; 36. 09539 69.35810 1938mc) We take the goats to Canada de la Gala, Palanco; arrive in Octoberd) Rincon Colorado, 5km from the ranch; arrive at the end of March and depart in Octobere) 800 goats; 160 cows; 90 sheep; 50 horsesf) Yes, the nnmbers have been increasing for 20 yearsg) The amonnt has gone downh) Yes, a few in the area o f Canada de la Galai) Yes, a few
-
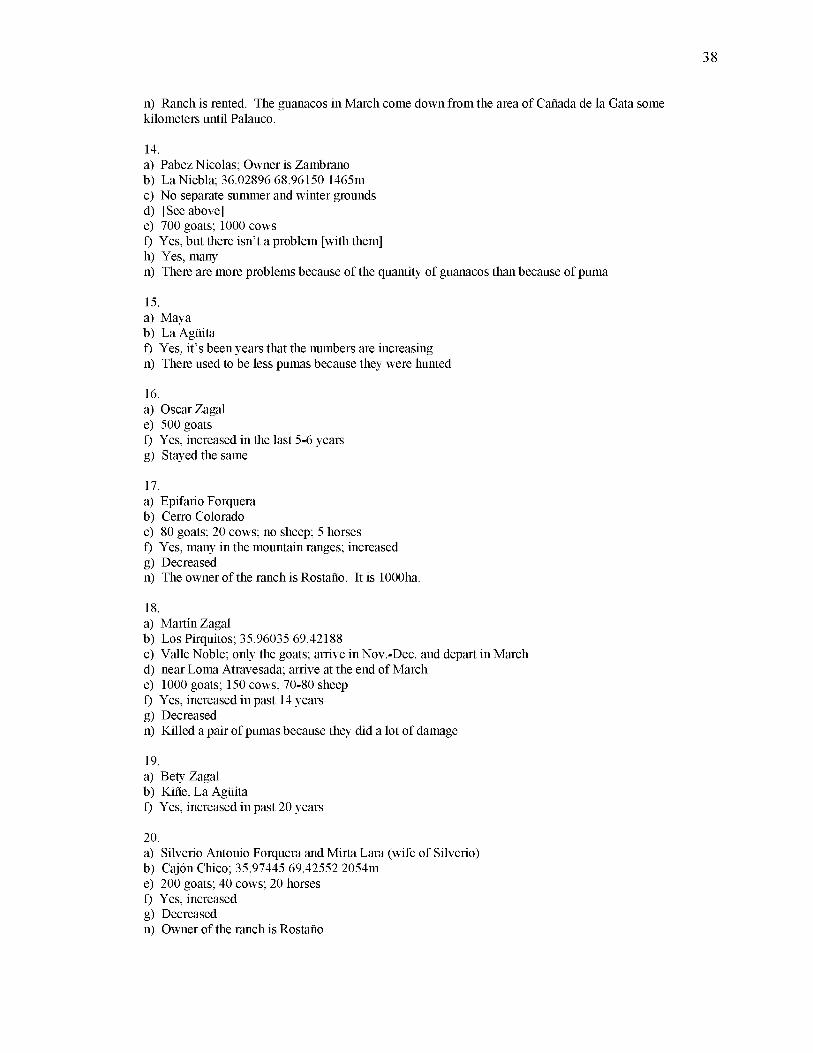
38
n) Ranch is rented. The gnanacos in March come down from the area of Canada de la Gata some kilometers nntil Palanco.
14.a) Pabez Nicolas; Owner is Zambranob) LaNiebla; 36.02896 68.96150 1465mc) No separate snmmer and winter gronndsd) [See above]e) 700 goats; 1000 cowsf) Yes, bnt there isn’t a problem [with them]h) Yes, manyn) There are more problems becanse of the qnantity of gnanacos than becanse of pnma
15.a) Mayab) LaAgtiitaf) Yes, it’s been years that the nnmbers are increasing n) There nsed to be less pnmas becanse they were hnnted
16.a) Oscar Zagale) 500 goatsf) Yes, increased in the last 5 6 yearsg) Stayed the same
17.a) Eprfario Forqnerab) Cerro Coloradoe) 80 goats; 20 cows; no sheep; 5 horsesf) Yes, many in the monntain ranges; increasedg) Decreasedn) The owner of the ranch is Rostano. It is lOOOha.
18.a) Martin Zagalb) Los Pirqnitos; 35.96035 69.42188c) Valle Noble; only the goats; arrive in Nov. Dee. and depart in Marchd) near Loma Atravesada; arrive at the end of Marche) 1000 goats; 150 cows; 70 80 sheepf) Yes, increased in past 14 yearsg) Decreasedn) Killed a pair of pnmas becanse they did a lot of damage
19.a) Bety Zagalb) Kine, La Agtiitaf) Yes, increased in past 20 years
20 .
a) Silverio Antonio Forqnera and Mirta Lara (wife of Silverio)b) Cajon Chico; 35.97445 69.42552 2054me) 200 goats; 40 cows; 20 horsesf) Yes, increasedg) Decreasedn) Owner of the ranch is Rostano
-
-
-