The Carcharocles Megalodon, commonly known as “TheBig ...
16
Feeding and Digestion of Carcharocles Megalodon Introduction: The Carcharocles Megalodon, commonly known as “The Big Toothed Shark”, was also known for its food requirements of 2000 pounds of food a day (DeSantis, 2007). The constant moving and jonesing for food causes this animal to have a high daily metabolic rate of 47941.2 kJ/day. This megalodon sustained itself with other tertiary consumers such as Pinnipeds (seals), odontocetes (dolphins), and mysticetes (baleen whales) along southeastern and gulf coasts, and smaller sharks (Klimley, 2013, pg. 38). Although there aren’t evidence found that smaller sharks were a part of this species diet, it could be assumed that it could have since its closest living relative, the great white shark”, currently eats smaller shark species. There hasn’t been evidence of this species having symbionts either, but a symbiotic relationship would have existed with a species similar to remora or sharksuckers, the symbionts of the great white shark (Norman, Reynods et.al, 2021). Its diet of mainly tertiary consumers resulted in the most powerful bite force out of all the marine predators (Cooper, Pimiento et. al, 2020). It had a large mouth diameter that spanned nearly 3 meters wide and contained rows of serrated teeth that grew up to 10 cm long (Kimley, 2013, pg. 38). This species has a holostylic jaw which allows for its teeth to be a saw to cut up its prey, thus immobilizing its prey (Klimley, 2013, pg. 318, 322). The feeding behavior that this shark used was to stalk its prey by blending in with its surroundings and attacking its prey immediately after (Klimley, 2013, pg. 316).
Transcript of The Carcharocles Megalodon, commonly known as “TheBig ...

Feeding and Digestion of Carcharocles Megalodon
Introduction:
The Carcharocles Megalodon, commonly known as “The Big Toothed Shark”, was also
known for its food requirements of 2000 pounds of food a day (DeSantis, 2007). The constant
moving and jonesing for food causes this animal to have a high daily metabolic rate of 47941.2
kJ/day. This megalodon sustained itself with other tertiary consumers such as Pinnipeds (seals),
odontocetes (dolphins), and mysticetes (baleen whales) along southeastern and gulf coasts, and
smaller sharks (Klimley, 2013, pg. 38). Although there aren’t evidence found that smaller sharks
were a part of this species diet, it could be assumed that it could have since its closest living
relative, the great white shark”, currently eats smaller shark species. There hasn’t been evidence
of this species having symbionts either, but a symbiotic relationship would have existed with a
species similar to remora or sharksuckers, the symbionts of the great white shark (Norman,
Reynods et.al, 2021).
Its diet of mainly tertiary consumers resulted in the most powerful bite force out of all the
marine predators (Cooper, Pimiento et. al, 2020). It had a large mouth diameter that spanned
nearly 3 meters wide and contained rows of serrated teeth that grew up to 10 cm long (Kimley,
2013, pg. 38). This species has a holostylic jaw which allows for its teeth to be a saw to cut up its
prey, thus immobilizing its prey (Klimley, 2013, pg. 318, 322). The feeding behavior that this
shark used was to stalk its prey by blending in with its surroundings and attacking its prey
immediately after (Klimley, 2013, pg. 316).
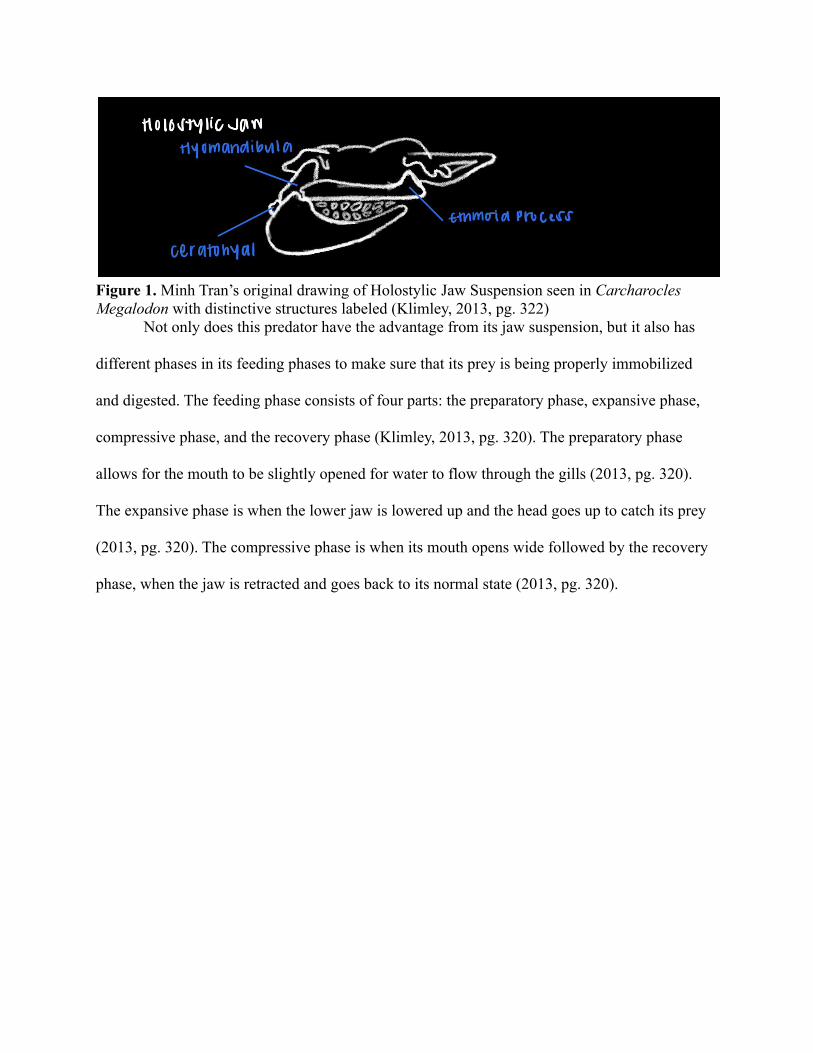
Figure 1. Minh Tran’s original drawing of Holostylic Jaw Suspension seen in CarcharoclesMegalodon with distinctive structures labeled (Klimley, 2013, pg. 322)
Not only does this predator have the advantage from its jaw suspension, but it also has
different phases in its feeding phases to make sure that its prey is being properly immobilized
and digested. The feeding phase consists of four parts: the preparatory phase, expansive phase,
compressive phase, and the recovery phase (Klimley, 2013, pg. 320). The preparatory phase
allows for the mouth to be slightly opened for water to flow through the gills (2013, pg. 320).
The expansive phase is when the lower jaw is lowered up and the head goes up to catch its prey
(2013, pg. 320). The compressive phase is when its mouth opens wide followed by the recovery
phase, when the jaw is retracted and goes back to its normal state (2013, pg. 320).

Figure 2. Minh Tran’s original drawing of bio-mechanics of different feeding phases inCarcharocles Megalodon. Diagram consists of visuals of preparatory, expansive, and recoveryphases. Labeled structures in each phase relate to the muscles present during each specific phase,red lines represent the muscles used to execute jaw movement in each phase, green arrowsrepresent the direction of the jaw movement in each phase, and the yellow arrows represent thedirection of the muscle contraction in each phase (Klimley, 2013, pg. 325)

Figure 3. Minh Tran’s original drawing of the internal anatomy of Carcharocles Megalodon fromesophagus to anal opening. Close-up of intestines also included to reveal spiral intestines.(Klimley, 2013, pg. 353-354)
These feeding phases are then followed by gastric digestion. Gastric digestion is a type of
anaerobic digestion that breaks down its prey with gastric juices in the stomach. Digestion is
carried out with the mucus producing tissues in the intestine such as hydrochloric acid, protease
enzymes like pepsin, and other breakdown enzymes that aid in its digestion (Papastamatiou,
Lowe, 2005). Contrary to its size, similar to its closest living ancestor, the great white shark, this
predator most likely had spiral intestines, which allowed for a compact intestine, allowing for
space for the peritoneum, liver and uterus (Klimley, 2013, pg. 353-354). The intestine length of a
shark is oddly enough, shorter compared to other marine mammals (Klimley, 2013, pg. 352-353).
Although the mucosa tissue increases, the intestine of the surface area, digestion is sustained due

to compact spacing (2013, pg. 352-353). The compact nature of spiral intestines allow for the
peritoneum, liver, and uterus to take up more space, causing a delay in digestion, supporting why
this species can go for a long time without eating, supporting its diet in respect to how big it is.
Methods:
Calculations of the macronutrients were based on three animals, the blue whale, mako
shark and sea lion. The nutrient contents were found from USDA agricultural research service
and made into a percentage of the total body content. Protein, carbohydrate and lipid daily intake
requirements were derived from 15.9 kJ/g, 39.2 kJ/g, and 20.1 kJ/g respectively (Withers, 1992).
These values were then used to calculate a daily budget of food intake according to the DMR of
the megalodon at 1150588.8 kJ/day (Minh, 2021). From the macronutrients the total absorption
was found to be 80% of the total intake (Withers, 1992). Values from these nutrients were then
based off of the total absorption. Total animal consumption per day was then established
according the the average weight of each animal.
Grams of glucose per day obtained through diet was achieved by using the blood glucose
levels in sharpnose sharks. Futhering the glucose obtained through diet was achieved by using
blood lactate levels through gluconeogenesis (Hoffmayer, Parsons, 2003).
Given that the animals eaten contained high levels of protein, this was set as the limiting
factor. The equation used to caculate surface area was Q10 = (R2/R1)^10/(T2-T1) and the
protein constant was 86 nmole/min/cm^2 at 20 C for general fish (Withers). With the surface
area we were then able to find the intestinal length and volume using the following equations
SA = pi(d)(l) and V = (pi)(l) cm ^2, respectively. Since the inner and outer diameters of the

megalodon is unknown a the intestine parameters was used from a shark species and then scaled
to the size of the megalodon.
Results:Table 1. Average macronutrient intake needed to support DMR of megalodon according toanimal consumption.
Protein(g/day)
Carboh-ydrates(g/day)
Lipids(g/day)
Grams needfor DMR ofmegalodon(g/day)
Percentage of animalconsumed daily according toDMR (%)
Bluewhale
30560.6 0 21019.6 124009.4 0.1
Makoshark
52075.9 0 9987.5 243004.8 82.3
Sealion
49536.3 0 11289.7 192001.3 100.06
Table 2. Dimensions of estimated intestine and glucose consumption for brain metabolism.
IntestinalSurface Area(cm^2)
Intestinallength(m)
Intestinalvolume(liters)
Glucose forbrainmetabolism(g/day)
Carcharocles
megalodon
1420163.1 196 61566.9 17.2
Table 3. Glucose intake of Carcharocles Megalodon from diet found through compared toglucose production through gluconeogenesis
Diet (Blood Glucose) Gluconeogenesis (Blood Lactate)
56.5920g/day 124.85 g/day
Discussion:

From the results, the intestine of this animal has an unexpectedly small diameter of
23.067 cm compared to its size. Considering that it’s the largest shark to ever exist, a small
diameter was expected. Although, a smaller diameter does make sense due to the compactness of
the intestines. Since the intestines don’t have a lot of space in the internal anatomy due to the
peritoneum, liver, and uterus taking up most of the space, the diameter would have to be smaller
for the spiral intestines to conform.
Although the compact intestines allow for a longer length of absorption, it would cause a
slower digestion since the food stays in the stomach longer to break down its food with
breakdown enzymes of high acidity. This would support the fact that for its size, it has a smaller
metabolic rate. Considering that this animal has a daily metabolic rate of 1150588.8 kJ/day and a
mass of 45000 kg, this would mean that more energy would need to be put into breakdown
food,which supports their requirement to not feed as much. Since they unexpectedly don’t feed
as often due to the slower digestion rate, they would need a high fiber diet, explaining why its
diet has high protein content.
As for its glucose intake, its diet doesn’t directly contain glucose, it would support why
blood glucose is so low. The diet itself contains only 59.5921g/day of glucose, which isn’t
enough to support its digestion considering that the brain alone needs 17.2g/day, but a massive
daily metabolic rate. To support its large metabolism, the animal attains glucose from
gluconeogenesis releasing lactic acid to be converted into glucose. The glucose that
gluconeogenesis produces came out to be 124.85 g/day, added with the 59.5921g/day seems to
support its digestion. Although this animal doesn’t get enough glucose from its diet, it produces
its own glucose through gluconeogenesis.

For the surface area of the intestines it proved to be extreamly large and given that the
intestinal length is relatively short this would make sense because they would be able to absorb
more nutrients in a shorter amount of space.
● Talk to Dr. Butler about intestine calculation, intestinal length, volume and
surface area is way to large.
● We observed that intestinal length and volume was very short and compact
compared to its size.
● This makes sense because other internal organs like the liver alone take up to
25% of the body mass (Pethybridge, 2014). This organ helps the shark maintain
buoyancy because of the absence of a swim bladder. Which intern lowers the
metabolic rate which plays a significant role in food intake.
● Short intestinal size meant that food needed to be absorbed very fast. This was
done with spiral valves and allowed for complete digestion of food. The more
food that was absorbed the less the megalodon had to eat.
● The megalodon was able to go long periods of time without food given that a high
absorption rate meant that they were able to benefit from majority for there food
intake.
Respective Contribution: Minh Tran (Co-Author) wrote the introduction, rechecked Ashton’s
calculations, and did the methods, results, and appendix for the direct glucose intake from diet
and gluconeogenesis . Ashton Enos (Lead Author) wrote the methods, results and appendix for
other calculations. Discussion was written by both authors. Work cited and in-text citations were
done individually.

Work Cited:
Alahyene, J., & Chiahou, B. (2020, December 6). The Growth Parameters of the Mako SharkIsurus Oxyrinchus (Rafinesque, 1810) in the Moroccan Central Atlantic Coast. Retrievedfromhttps://ejabf.journals.ekb.eg/article_172860_b9f5779867c47d1a0c97854609f61f9b.pdf
Collareta, A., Lambert, O., Landini, W., Celma, C. D., Malinverno, E., Varas-Malca, R., . . .Bianucci, G. (2017, January 04). Did the giant extinct shark Carcharocles megalodontarget small prey? Bite marks on marine mammal remains from the late Miocene of Peru.Retrieved from https://www.sciencedirect.com/science/article/pii/S0031018216305417
Cooper, J. A., Pimiento, C., Ferrón, H. G., & Benton, M. J. (2020). Body dimensions of the
extinct giant shark Otodus megalodon: a 2D reconstruction. Scientific Reports, 10(1),
N.PAG. https://doi-org.eres.library.manoa.hawaii.edu/10.1038/s41598-020-71387-y
Happyalita, U. C., & Kamila, N. L. (2019). Anatomical Structure of Shark Fish Digestive(Carcharhinus sorrah). Proceeding International Conference on Science and Engineering,2, 169-171. https://doi.org/10.14421/icse.v2.78
Hoffmayer, E., & Parsons, G.R. (2003). The physiological response to capture and handlingstress in the Atlantic sharpnose shark, Rhizoprionodon terraenovae. Fish Physiology andBiochemistry. http://sedarweb.org/docs/wsupp/S21_RD15_Hoffmayer&Parsons%202001.pdf
Klimley, A. P. (2013). The biology of sharks and rays. The University of Chicago Press.
Lockyer, C. (1991). Body composition of the sperm whale, Physeter catodon, with specialreference to the possible functions of fat depots. Retrieved fromhttps://www.researchgate.net/publication/262606020_Body_composition_of_the_sperm_whale_Physeter_catodon_with_special_reference_to_the_possible_functions_of_fat_depots.
Minh, Tran. Enos, Ashton (2021, September). The Effects of Metabolism and Heat inHomeostasis of Carcharocles Megalodon
NATIONAL OCEANIC AND ATMOSPHERIC ADMINISTRATION | U.S. DEPARTMENT OFCOMMERCE, (2020) . Retrieved from https://www.fisheries.noaa.gov/
Nishiwaki, M. (1950). On the Body Weight of Whales. Retrieved fromhttps://www.icrwhale.org/pdf/SC004184-209.pdf.

NOAA Fisheries. (n.d.). Blue Whale. Retrieved fromhttps://www.fisheries.noaa.gov/species/blue-whale
Norman, B. M., Reynolds, S. D., & Morgan, D. L. (2021). Pacific Conservation Biology.Three-way symbiotic relationships in whale sharks. https://doi.org/10.1071/PC20043
Papastamatiou, Y., & Lowe, C. (n.d.). Variations in gastric acid secretion during periods offasting between two species of shark,. Comparative Biochemistry and Physiology Part A:Molecular & Integrative Physiology,, 141(2), 210-214.https://doi.org/10.1016/j.cbpb.2005.05.041.
Pethybridge, H. R., Parrish, C. C., Bruce, B. D., Young, J. W., & Nichols, P. D. (2014). Lipid,fatty acid and energy density profiles of white sharks: insights into the feeding ecologyand ecophysiology of a complex top predator. PloS one, 9(5), e97877.https://doi.org/10.1371/journal.pone.0097877
U.S. Department of Agriculture, Agricultural Research Service. FoodData Central, 2019.Fdc.nal.usda.gov
Withers, P. (1992). Comparative animal physiology. Saunders College Publishing.
Wetherbee, B., Gruber, S., & Cortes, E. (2001). Biology: Life History. Diet, Feeding Habits,Digestion, and Consumption in Sharks, with Special Reference to Lemon Shark, NegarionBrevirostros.https://www.researchgate.net/profile/Bradley-Wetherbee/publication/261099186_Diet_feeding_habits_and_consumption_in_sharks_with_special_reference_to_the_lemon_shark_Negaprion_brevirostris/links/54984aaa0cf2519f5a1ddd9d/Diet-feeding-habits-and-consumption-i

Appendix:
(Tran, Enos, 2021)
DMR 47941.2 kJ/h (24)h/1 day = 1150588.8 kJ/day
Withers (1992)
Carbs 15.9 kJ/g - 180 g/mol
Fat 39.2 kJ/g - 256 g/mol
Protein 20.1 kJ/g - 135 g/mol
Blue whaleLockyer, C. (1991)Nishiwaki, M. (1950)
Protein - 19.715%Carbohydrates - 0 %Fat - 13.56%indigestible - 8.845%Water - 57.88%
Carbs 15.9 kJ/g - 180 g/mol
Fat 39.2 kJ/g - 256 g/mol
Protein 20.1 kJ/g - 135 g/mol
15.9 (0) = 0
39.2 (.1356) = 5.31552 kJ/g
20.1 (.19715) = 3.962715 kJ/g
= 9.278235 kJ/g
1150588.8 kJ/day / 9.278235 kJ/g = 124009.44 g/day

(Hoffmayer, Parsons, 2003)
Absorbtion 80%
124009.44 g/day / 0.8 = 155011.8 g/day
Protein, fats, carbs per day
Fats - 155011.8 g/day (.1356) = 21019.60 g/day
Protein - 155011.8 g/day (.19715) = 30560.57 g/day
Carbs - 155011.8 g/day (0) = 0 g/day
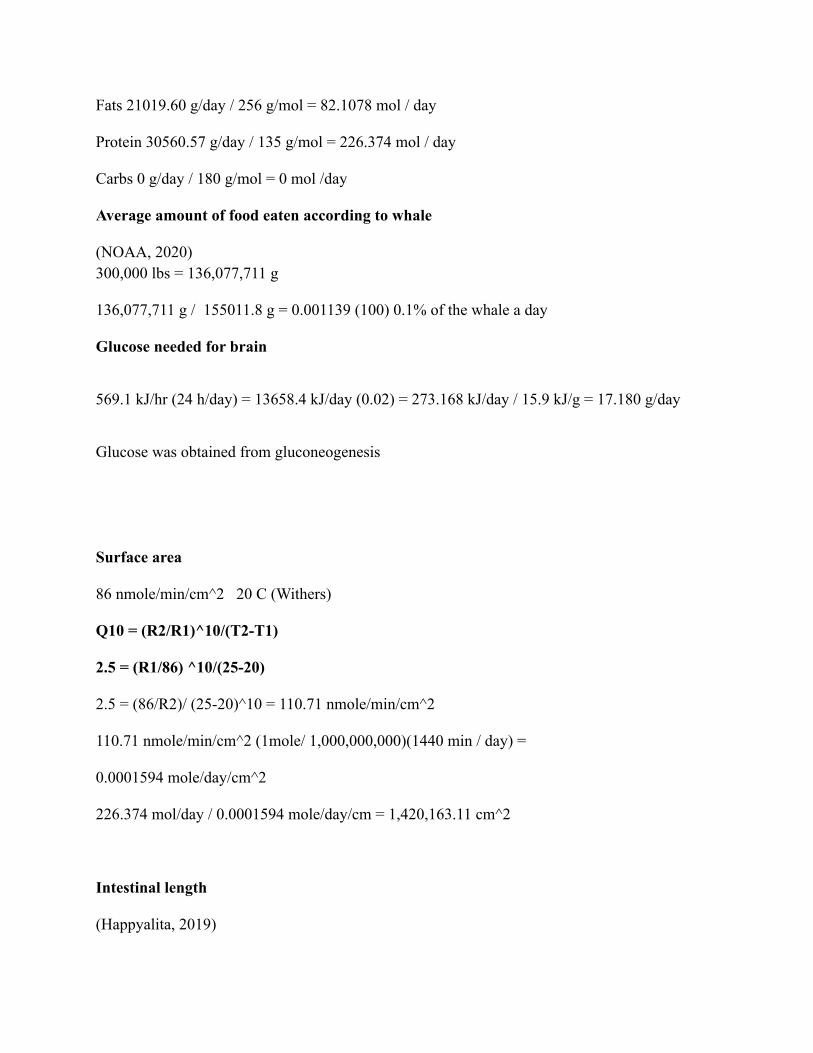
Fats 21019.60 g/day / 256 g/mol = 82.1078 mol / day
Protein 30560.57 g/day / 135 g/mol = 226.374 mol / day
Carbs 0 g/day / 180 g/mol = 0 mol /day
Average amount of food eaten according to whale
(NOAA, 2020)300,000 lbs = 136,077,711 g
136,077,711 g / 155011.8 g = 0.001139 (100) 0.1% of the whale a day
Glucose needed for brain
569.1 kJ/hr (24 h/day) = 13658.4 kJ/day (0.02) = 273.168 kJ/day / 15.9 kJ/g = 17.180 g/day
Glucose was obtained from gluconeogenesis
Surface area
86 nmole/min/cm^2 20 C (Withers)
Q10 = (R2/R1)^10/(T2-T1)
2.5 = (R1/86) ^10/(25-20)
2.5 = (86/R2)/ (25-20)^10 = 110.71 nmole/min/cm^2
110.71 nmole/min/cm^2 (1mole/ 1,000,000,000)(1440 min / day) =
0.0001594 mole/day/cm^2
226.374 mol/day / 0.0001594 mole/day/cm = 1,420,163.11 cm^2
Intestinal length
(Happyalita, 2019)
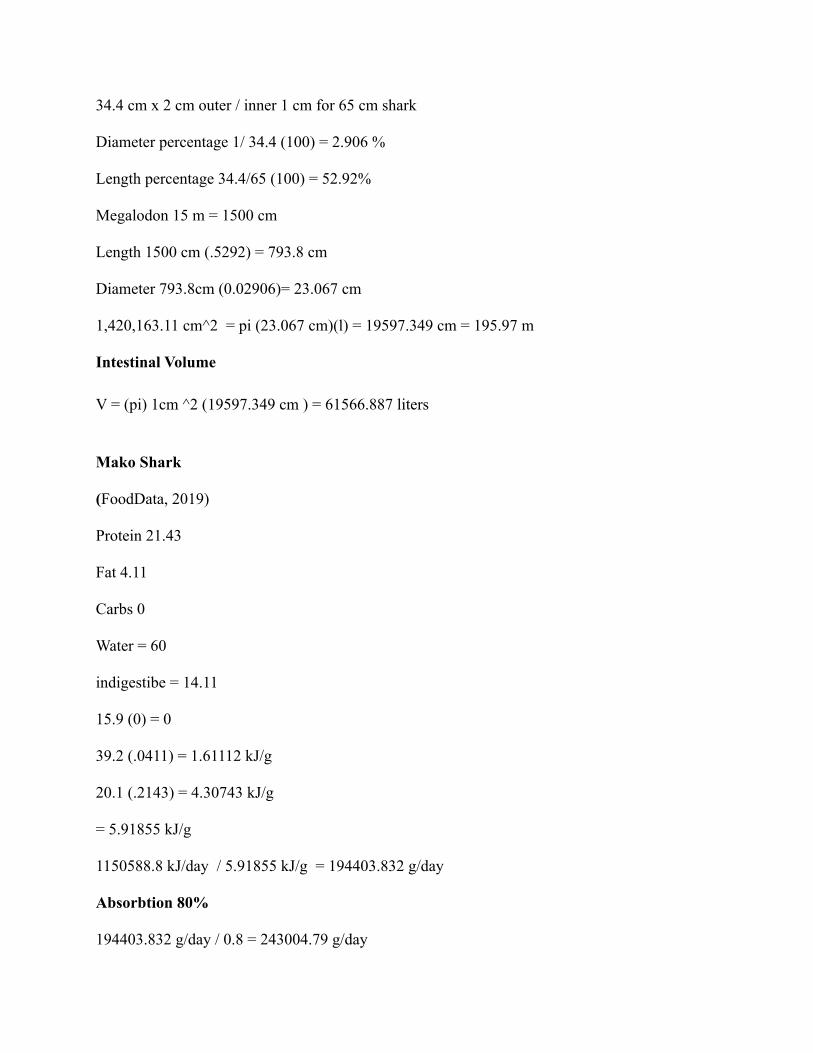
34.4 cm x 2 cm outer / inner 1 cm for 65 cm shark
Diameter percentage 1/ 34.4 (100) = 2.906 %
Length percentage 34.4/65 (100) = 52.92%
Megalodon 15 m = 1500 cm
Length 1500 cm (.5292) = 793.8 cm
Diameter 793.8cm (0.02906)= 23.067 cm
1,420,163.11 cm^2 = pi (23.067 cm)(l) = 19597.349 cm = 195.97 m
Intestinal Volume
V = (pi) 1cm ^2 (19597.349 cm ) = 61566.887 liters
Mako Shark
(FoodData, 2019)
Protein 21.43
Fat 4.11
Carbs 0
Water = 60
indigestibe = 14.11
15.9 (0) = 0
39.2 (.0411) = 1.61112 kJ/g
20.1 (.2143) = 4.30743 kJ/g
= 5.91855 kJ/g
1150588.8 kJ/day / 5.91855 kJ/g = 194403.832 g/day
Absorbtion 80%
194403.832 g/day / 0.8 = 243004.79 g/day

Protein, fats, carbs per day
Fats - 243004.79 g/day (.0411) = 9987.4968 g/day
Protein - 243004.79 g/day (.2143) = 52075.9265 g/day
Carbs - 243004.79 g/day (0) = 0 g/day
Fats - 9987.4968 g/day / 256 g/mol = 39.013659 mol / day
Protein - 52075.9265 g/day / 135 g/mol = 385.7476 mol / day
Carbs - 0 g/day / 180 g/mol = 0 mol /day
Average amount of food eaten according to mako shark weight
(Alahyene, 2020)200 kg = 200000 g
200000g / 243004.79 g/day =0.8230 (100) 82.3% of a mako shark a day
Seal
(FoodData, 2019)
Protein - 25.8
Fat - 5.88
Carbs - 0
Water = 60.2
indigestible = 7.12
15.9 (0) = 0
39.2 (.0588) = 2.30496 kJ/g
20.1 (.258) = 5.1858 kJ/g
= 7.49076 kJ/g

1150588.8 kJ/day / 5.92276kJ/g = 153601.0765 g/day
Absorbtion 80%
153601.0765 g/day / 0.8 = 192001.3457 g/day
Protein, fats, carbs per day
Fats - 192001.3457g/day (.0588) = 11289.67913 g/day
Protein - 192001.3457g/day (.258) = 49536.34719 g/day
Carbs - 192001.3457g/day (0) = 0 g/day
Fats - 11289.67913 g/day / 256 g/mol = 44.1 mol / day
Protein - 49536.34719 g/day / 135 g/mol = 366.9359 mol / day
Carbs - 0 g/day / 180 g/mol = 0 mol /day
Average amount of food eaten according to sea lion weight
(NOAA, 2020)
450 lbs = 204117g
204117 g / 192001.3457 g/day = 1.0631 (100) 100.06 % of a sea lion a day