THE CAPITAL BUDGETING DECISIONS OF SMALL BUSINESSES...
24
THE CAPITAL BUDGETING DECISIONS OF SMALL BUSINESSES Abstract This paper analyzes the capital budgeting practices of small firms using survey data com- piled by the National Federation of Independent Business. Unlike large firms, which tend to rely on the discounted cash flow calculations favored by finance texts, many small firms evaluate projects using the payback period or ‘gut feel’. The use of these relatively unsophisticated pro- ject evaluation tools appears to be due in part to the limited educational background of some small business owners, small staff sizes, and liquidity concerns.
Transcript of THE CAPITAL BUDGETING DECISIONS OF SMALL BUSINESSES...

THE CAPITAL BUDGETING DECISIONS OF SMALL BUSINESSES
Abstract
This paper analyzes the capital budgeting practices of small firms using survey data com-piled by the National Federation of Independent Business. Unlike large firms, which tend to rely on the discounted cash flow calculations favored by finance texts, many small firms evaluate projects using the payback period or ‘gut feel’. The use of these relatively unsophisticated pro-ject evaluation tools appears to be due in part to the limited educational background of some small business owners, small staff sizes, and liquidity concerns.

THE CAPITAL BUDGETING DECISIONS OF SMALL BUSINESSES
This paper analyzes the capital budgeting practices of small firms. Small businesses (de-
fined by the U.S. Small Business Administration as firms with less than 500 employees) are esti-
mated to produce about 50 percent of private GDP in the U.S., and employ 60 percent of the pri-
vate sector labor force.1 Many of these businesses are service oriented, but over 50 percent are in
agriculture, manufacturing, construction, transportation, wholesale, and retail—all industries re-
quiring substantial capital investment.2
Although capital investments in the small business sector are important to individual
firms and the overall economy, capital budgeting surveys published in the finance literature over
the past 40 years have focused on the investment decisions of large firms.3 The most prominent
exception is a study by Graham and Harvey (2001), which compares the capital budgeting prac-
tices of small and large firms. However, many of the ‘small’ firms in their study are quite large,
as Graham and Harvey use a revenue threshold of $1 billion to separate firms by size. Indeed,
less than 10 percent of their sample report revenues below $25 million. In contrast, 83 percent of
the firms in the Board of Governor’s 1993 Survey of Small Business Finance report sales under
$1 million. Thus, Graham and Harvey’s results do not directly address the investment decisions
of very small firms.
There are several reasons why small and large firms might use different criteria when
evaluating projects. First, small-business owners may balance the goal of wealth maximization
(the goal of a firm in capital budgeting theory) against other objectives—such as maintaining the
1 See U.S. Small Business Administration Office of Advocacy (www.sba.gov/advoc). Although 500 em-ployees is the threshold at the SBA, 80 percent of all firms have 20 employees or less. 2 Bureau of the Census, 1997 Economic Census. 3 Scott and Petty (1984) summarize the results of 21 early studies of large firm capital budgeting practices. The selection criteria in these studies include membership in the Fortune 500/1000, a minimum level of capital expenditures, size, or stock appreciation in excess of certain benchmarks. In more recent studies, Moore and Reichardt (1983) surveyed 298 Fortune 500 firms, Bierman (1993) looked at 74 Fortune 100 firms, and Graham and Harvey (2001) investigated the behavior of 392 firms chosen from the membership of the Financial Executives Institute and the Fortune 500.

2
independence of the business (Ang, 1992, Keasey and Watson, 1993)—when making investment
decisions. Second, small firms lack the personnel resources of larger firms, and therefore may
not have the time or expertise to analyze proposed projects in the same depth as larger firms
(Ang, 1992). Finally, some small firms face capital constraints (Peterson and Rajan, 1994, and
Danielson and Scott, 2004), making project liquidity a more important concern for small firms
than it is for larger entities. Because of these differences, survey results describing the capital
budgeting decisions of large firms should not be generalized to the small firm sector.
To document the capital budgeting practices of small businesses (defined in this paper as
those with fewer than 250 employees), we use survey data collected for the National Federation
of Independent Business (NFIB) Research Foundation by The Gallup Organization. In addition
to typical questions about investment evaluation tools, the survey asks about the types of invest-
ments the firm makes (e.g., replacement versus expansion), its use of other planning tools (e.g.,
cash flow projections, capital budgets, and tax planning activities), and the owner’s willingness to
finance projects with debt. The survey also includes demographic variables, allowing us to exam-
ine the relations between capital budgeting practice and firm characteristics such as size, sales
growth, industry, owner age, owner education level, and business age.
The results confirm that small firms and large firms evaluate projects differently. Unlike
large firms, which tend to rely on the discounted cash flow calculations favored by finance texts
(Graham and Harvey, 2001), we find that the two capital budgeting metrics identified most fre-
quently as the primary project evaluation tool by small firms are ‘gut feel’ and the payback pe-
riod. Less than 15 percent of the firms listed discounted cash flow analysis as their primary deci-
sion metric, and over 30 percent of the firms do not estimate cash flows when making investment
decisions.
Certainly a lack of sophistication contributes to these results, as over 50 percent of the
small-business owners surveyed do not have a college (graduate or undergraduate) degree. How-
ever, the results also highlight some unique characteristics of small firms that influence their in-

3
vestment decisions. For, example, 45 percent of the sample would delay a promising investment
until it could be financed with internally generated funds, suggesting the firms face real (or self-
imposed) capital constraints.4 In addition, the smallest of the surveyed firms (i.e., firms with 3
employees or less) are significantly less likely to make cash flow projections, perhaps because
time constraints limit the depth of the investment analysis these firms can perform. Finally, the
most important class of investments is ‘replacement’ for almost 50 percent of the firms. Dis-
counted cash flow calculations may not be required to justify these investments if the owner is
committed to maintaining the firm as a going concern, and if the firm has limited options about
how and when to replace equipment.
The remainder of the paper is organized as follows. Section I summarizes the capital
budgeting literature as it applies to small firms. Section II describes the survey data used in this
study. Section III discusses the survey results and Section IV concludes.
I. Capital Budgeting Theory and Small Firms
Capital budgeting theory, as described in most finance texts, relies on two assumptions.
First, the primary goal of the firm’s shareholders is to maximize firm value. Second, the firm
operates in perfect financial markets and thus can finance all value-enhancing projects. Because
of these assumptions, capital budgeting theory recommends that firms separate investment and
financing decisions, and encourages firms to invest in all positive net present value projects. If
these assumptions are met, there is no need to consider alternative metrics such as payback period
and accounting rate of return when making investment decisions (Brealey and Myers, 2003).
There are at least three reasons why the applicability of this literature to small firms can
be questioned. First, shareholder wealth maximization may not be the objective of every small
4 Survey participants were asked: “Suppose you had the opportunity to make an investment in your busi-ness that would allow earnings to rise 25 percent within the next two years. The project had minimal risk, but you did NOT have the cash right then to make the investment. Would you most likely . . . ?” The choices given to participants included wait until you accumulate enough cash, borrow the money and make the investment, seek an outside investor, and other. Forty-five percent of the respondents selected wait until you accumulate enough cash.

4
firm. As Keasey and Watson (1993, p. 228) point out, an entrepreneur may establish a firm as an
alternative to unemployment, as a way to avoid employment boredom (i.e., as a life-style choice),
or as a vehicle to develop, manufacture, and market inventions. In each of these cases, the pri-
mary goal of the entrepreneur may be to maintain the viability of the firm, rather than to maxi-
mize its value.
Second, small firms may not have the in-house expertise required to evaluate projects us-
ing discounted cash flows. As Ang (1992) notes, the management teams of some small firms are
not complete, and often lack expertise in the areas of finance and accounting. Because of this
deficiency, Keasey and Watson (1993) observe that small firms may have difficulty making
meaningful cash flow estimates. Providing some support for this conjecture, Graham and Harvey
(2001) find that the small firms in their survey are more likely than large firms to use less sophis-
ticated methods of analysis, such as the payback period. However, as already mentioned, the
small firms in the Graham and Harvey study have up to $1 billion in annual revenues. Thus, it is
likely that many of these firms have more complete management teams than the small firms envi-
sioned by Ang or Keasey and Watson. In contrast, we evaluate the capital budgeting policies of
very small firms—our sample includes only firms with less than 250 employees, and over 80 per-
cent of the firms have less than 10 employees—where the problem of incomplete management
teams is likely to be most severe.
Finally, capital market imperfections constrain the financing options of small firms. For
example, some cannot obtain bank loans, because of their information-opaqueness and lack of
strong banking relationships (e.g., Peterson and Rajan, 1994 and 1995, and Cole, 1998). Simi-
larly, Ang (1992) observes that access to public capital markets can be expensive for certain small
firms, and impossible for others. These capital constraints can make it essential for small firms to
maintain sufficient cash balances, so that they can invest in potentially profitable investments as
they become available (Almeida, Campello, and Weisbach, 2004). Thus, capital constraints pro-
vide small privately-held firms with a legitimate economic reason to be concerned about how

5
quickly a project will generate cash flows (i.e., the payback period).
Because of these three reasons, it would not be surprising if small firms evaluate projects
using different techniques than large firms. However, as Keasey and Watson (1993) note, evi-
dence about these differences is largely anecdotal. One of the goals of this paper is to fill this gap
in the finance literature.
II. Description of Data
The use of survey data to document capital budgeting practices has a long history in the
finance literature.5 However, as Graham and Harvey (2001, p. 189) note, survey results should be
interpreted with caution because surveys measure manager beliefs, not necessarily their actions;
survey participants may not be representative of the defined population of firms; and survey ques-
tions may be misunderstood by some participants. Nonetheless, surveys are valuable because
they provide information that cannot be readily gleaned from financial statements. In particular,
survey results can shed light on how firms make investment and financing decisions, and why
they use these approaches.
The data for this study were collected for the NFIB Research Foundation by the Gallup
Organization. The interviews for this survey were conducted in April and May 2003 from a sam-
ple of small firms, defined as a business employing at least one individual in addition to the
owner(s), but no more than 249. The sampling frame for the survey was drawn at the NFIB’s
direction from the files of the Dun & Bradstreet Corporation. Because the distribution of small
businesses is highly skewed when ranked by the number of employees, interview quotas were
used to increase the number of larger firms in the sample. Once the data were compiled, the re-
sponses were weighted to reflect population proportions based on U.S. Census data, yielding a
sample of 792 observations.
The demographic characteristics of the sample—industry, sales growth, business age,
5 Ibid, fn. 3.

6
employment, owner education, and owner age—are summarized in Table 1. For each attribute,
we group responses into three to five categories. Our goal was to ensure that each grouping con-
tains enough responses so that we can draw inferences about how firm behavior differs across the
categories.
Insert Table 1 here
Table 1 shows 72 percent of the sample firms are in construction, manufacturing, retail,
or wholesale, all industries requiring substantial capital investments. Service industries, where
capital expenditures may have less importance, account for 20 percent of the sample.
The sample is distributed evenly across four real sales growth categories. The high
growth category is defined as a cumulative (not annualized) increase of 20 percent or more over
the past two years, and includes 24 percent of the sample firms. At the other extreme, 24 percent
of the firms report two-year sales declines of 10 percent or more. This distribution implies that
approximately 75 percent of the sample firms have experienced an average annualized growth
rate of 10 percent or less over the last two years. Thus, many of the capital budgeting decisions
of small firms may be focused more on maintaining current levels of service and quality, rather
than on expansion.
Similarly, the sample is distributed fairly evenly across four business age categories,
ranging from six years in business or less (23 percent of the sample), to 21 years in business or
more (27 percent of the sample). The number of years in business could influence the type of
investments a firm will make or the firm’s planning process. For example, firms in business
longer may have more equipment in need of replacement. Or, if a business has a limited operat-
ing history, the firm may not be able to obtain bank loans unless it can demonstrate that it has
appropriate planning processes in place.
The median number of total employees is 4 (mean = 9). Sixteen percent of the firms have
only one employee, and only 18 percent have 10 or more total employees. Thus, it is likely that
many sample firms do not have complete management teams, as Ang (1992) argues. In addition,

7
firms with few employees may not have adequate personnel resources to fully analyze capital
budgeting alternatives.
The data in Table 1 also suggests that the educational background of owners could influ-
ence how the firm makes capital budgeting decisions. Over 50 percent of the sample firms do not
have (at least) a four year college degree, and only 13 percent have an advanced or professional
degree. Therefore, many of the small-business owners may have an incomplete (or incorrect)
understanding of how capital budgeting alternatives should be evaluated.
Finally, 63 percent of the business owners are at least 45 years old, and 32 percent are 55
or older. There is at least some prior evidence (e.g., Graham and Harvey, 2001) that capital
budgeting sophistication is lower in subsets of older executives.
III. Survey Results
We use the NFIB survey to address three questions concerning the capital budgeting ac-
tivities of small firms. We first consider the question of whether the investment and financing
activities of small firms conform to the assumptions underlying capital budgeting theory. Then,
we look at the overall planning activities of small firms—use of business plans, consideration of
tax implications, etc.—and identify firm characteristics that tend to be present when more sophis-
ticated practices are in place. Finally, we provide evidence about the specific project evaluation
techniques small firms use (e.g., payback period, discounted cash flow methods, etc.). We report
on the results of these procedures in Tables 2 through 5. In Tables 2, 3, and 4, we identify sig-
nificant differences between the average responses in various subsets of firms and the overall
sample averages using a binomial Z-score. In Table 5, we use multinomial logit to evaluate how
the choice of investment evaluation tools is related to the sophistication of a firm’s overall plan-
ning environment and other firm characteristics.
A. Investment Activity
Table 2 describes the investment activities of sample firms. The table identifies the

8
firms’ most important type of investment over the past 12 months, and reports the percentage of
firms that will delay a potentially profitable investment until the firm has enough internally gen-
erated cash to fund the project (see footnote 4).
Insert Table 2 here
Table 2 shows that the most important type of investment is ‘replacement’ for 46 percent
of the sample firms. Firms in service industries were more likely than the average sample firm to
select this response, while those in construction and manufacturing were less likely. Firms with
the highest growth rates and those in business less than 6 years were less likely than the average
sample firm to report replacement activity as the primary investment type. Finally, the impor-
tance of replacement activity increases with the age of the business owner, and is significantly
less than the overall sample mean when the business owner is younger than 44.6
Projects to extend existing product lines were listed as the primary investment activity by
21 percent of the sample firms. The percentage of firms selecting this response was higher than
the overall sample average for construction and manufacturing firms. The remaining sub-sample
averages were not significantly different than the overall sample averages (at the 5 percent sig-
nificance level).
Investments in new product lines were reported as the most important investment type for
23 percent of the sample firms. Firms in the service industry were less likely than the average
sample firm to select this response. Firms with the highest growth rates were more likely (than
the overall sample average) to be expanding into new product lines, while those with the lowest
growth rate were less likely. The oldest firms were also less likely than the average firm to be
6 The significance of the sub-sample entries in Tables 2 through 4 depend on the difference between the sub-sample mean and the overall sample mean in a given column, and on the number of observations in the sub-sample (most of these numbers appear in Table 1). Thus, it is possible for two sub-samples to have similar response percentages, with one being significant and the other not. For example, 54 percent of the service firms identify replacement as the primary investment type, while 55 percent of the firms in the ‘other’ industry category selected this investment type. However, this response percentage is significantly different from the overall sample average for service firms, but not for the ‘other’ firms. As shown in Ta-ble 1, the service industries contain over twice as many firms as the ‘other’ category.

9
attempting to expand into new product lines.
Table 2 also suggests that many small firms face real (or self-imposed) capital con-
straints. Forty-five percent of the sample firms report that they would delay a promising invest-
ment until it could be financed with internally generated funds (wait for cash). Firms most
likely to wait for cash include the youngest firms (less than 6 years old), the smallest firms (one
employee), and those where the owner does not have a college (or advanced) degree. As these
firms are likely to face capital market constraints, this result supports the prediction in Almeida,
Campello, and Weisbach (2004) that capital constraints will increase a firm’s propensity to save
cash. Firms with older owners are also slightly more likely to wait for cash than are firms with
younger owners.
These results suggest three reasons why small firms might not follow the prescriptions of
capital budgeting theory when evaluating investments. First, it is noteworthy that replacement
activity is the most important type of capital investment for almost half of the sample firms. If
replacing old equipment is necessary for the firm to remain in business, the owner’s capital budg-
eting decision is essentially a choice between replacing the machine and staying in business, or
closing the business and finding employment elsewhere. In this case, maintaining the viability of
the firm as a going concern, rather than maximizing its value, might be the owner’s primary ob-
jective.
Second, the results suggest that many small firms place internal limits on the amount they
will borrow. Thus, many small firms cannot (or choose not to) separate investment and financing
decisions, which is in conflict with capital budgeting theory.
Finally, the results suggest that the personal financial planning considerations of business
owners may affect the investment and financing decisions of small firms, with older owners being
more conservative in their strategies than younger owners (i.e., older owners focus more on re-
placement activity and are more likely to report that they will wait for cash). These results con-
flict with the assumptions underlying capital budgeting theory, where the transferability of own-

10
ership interests (at low cost) allows managers to separate the planning horizon of a business from
the planning horizon of its owners.
B. Planning Activity
Table 3 analyzes three dimensions of each firm’s planning environment. In particular,
the table identifies how frequently firms estimate cash flows when making capital budgeting de-
cisions, whether they have written business plans, and if they consider tax implications when
making capital budgeting decisions.
Insert Table 3 here
Table 3 reports that only 31 percent of the firms have a written business plan in place.
Over 30 percent of the sample firms do not estimate future cash flows when making investment
decisions, and 26 percent of the firms do not consider the tax implications of investment deci-
sions. Thus, many small firms do not have a formal planning system in place to guide their capi-
tal budgeting decisions.
Table 3 reveals that firms with the highest growth rates (over 20 percent growth) are
more likely to use each of these planning tools. The response rates are significantly higher than
the overall sample mean for written business plans and the consideration of tax effects. Similarly,
firms that extend existing product lines or invest in new lines of business engage in more plan-
ning activities than the average sample firm. As firms expand, they use up more of their borrow-
ing capacity, reducing their future financial flexibility (assuming that they face capital con-
straints). For these firms, it may be essential to plan ahead, so the firm is not forced to bypass
promising opportunities in the future.
Newer firms (less than 6 years old) and younger owners (younger than 45) are more
likely than the average firm to use written business plans. This is an expected result if banks re-
quire evidence of planning sophistication before extending credit to firms with limited operating
histories.
The smallest firms (3 or less employees) are less likely to make cash flow projections,

11
while firms with 10 or more employees are more likely to make these estimates. This finding
supports conjectures made by Ang (1992) and Keasey and Watson (1993) that personnel con-
straints (incomplete management teams) may limit the ability of small firms to engage in plan-
ning activities.
The planning activities of small firms are also strongly related to the educational back-
ground of the business owner. If the business owner does not have a college degree, the firm is
less likely than the average firm to make cash flow projections or to use written business plans.
However, if the business owner has an advanced/professional degree, the firm is more likely to
engage in such activities.
C. Project Evaluation Methods
Table 4 summarizes responses to the survey question asking firms to identify the primary
tool used to assess a project’s financial viability. The evaluation methods included in the survey
were payback period, the accounting rate of return, discounted cash flow analysis, gut feel, or
combination.
Insert Table 4 here
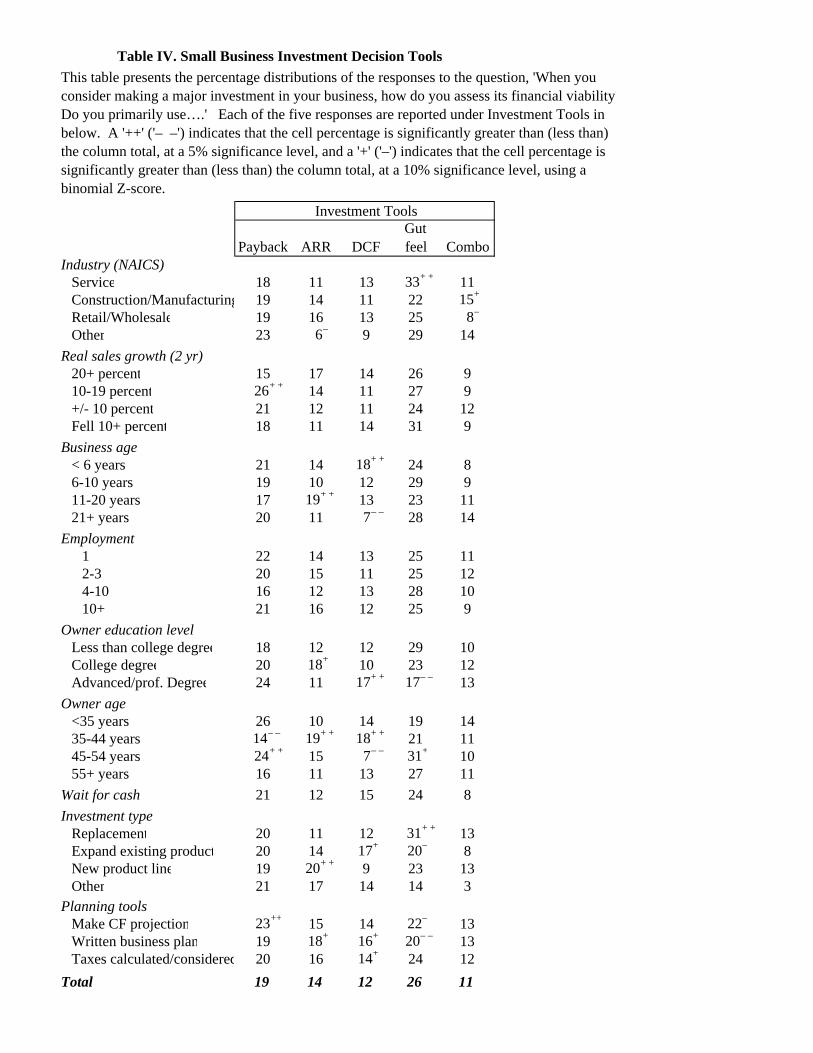
Table 4 reveals that the most common tool is the least sophisticated: ‘gut feel.’ This
method of analysis was selected by 26 percent of the sample firms.7 The use of gut feel is
strongly related to the business owner’s educational background. Those owners without a college
degree use this method most frequently, while owners with advanced degrees are less likely to
use this method. The use of gut feel is also inversely related to a firm’s use of planning tools. In
particular, firms with written business plans and those that make cash flow projections are sig-
nificantly less likely to rely on gut feel when making investment decisions. Thus, the use of gut
feel as an investment evaluation tool is concentrated in the least sophisticated of the small firms:
those where the business owner does not have a formal education, and firms without an overall
7 Similarly, Vos and Vos (2000) find that ‘intuition’ is the most frequently used project evaluation tech-nique in a survey of 238 small New Zealand businesses.

12
planning system in place.
However, Table 4 also shows that gut feel is widely used by firms that primarily make
replacement investments. A firm may have limited options when replacing equipment, and esti-
mating future cash flows (i.e., incremental maintenance costs or efficiency gains) for each avail-
able option might be difficult. In addition, if the investment is necessary for the firm’s survival
(and the owner is committed to maintaining the business as a going concern), the maximization of
firm value may not be the business owner’s primary objective when making this type of invest-
ment. Instead, the owner may simply look for the alternative promising the required level of per-
formance at the most reasonable cost. Thus, it is not surprising to find that small business owners
use relatively unsophisticated methods of analysis when evaluating replacement options.
Gut feel is also used extensively by firms in the service industry. Although some service
firms make substantial capital expenditures, the investments of other service firms might be lim-
ited to business vehicles (e.g., delivery trucks) or office equipment. Because a firm’s primary
considerations when evaluating this type of purchase decision might be cost, reliability, and
product features, structuring a discounted cash flow analysis of these investments can be difficult.
The second most common response was the payback period, selected by 19 percent of the
sample. Although the use of the payback period is not strongly related to most firm characteris-
tics, three items are worth mentioning. First, the payback period is used slightly more often by
those firms who will wait for cash, as expected. Second, firms using the payback period are sig-
nificantly more likely than other firms to estimate future cash flows (because cash flow estimates
are required for this calculation). Finally, the use of the payback period appears to increase with
the formal education of the business owner. These results suggest that the payback period con-
veys important economic information in at least some circumstances. For example, the payback
period can be a rational project evaluation tool for small firms facing capital constraints (i.e.,
firms that do not operate in the perfect financial markets envisioned by capital budgeting theory).
In this case, projects that return cash quickly could benefit a firm by easing future cash flow con-

13
straints.
The accounting rate of return was next, identified by 14 percent of the firms as their pri-
mary evaluation method. The use of accounting rate of return increases with the firms’ growth
rates, and is significantly greater than the sample mean for those firms entering new lines of busi-
ness. Each of these characteristics can indicate high borrowing needs. Therefore, the accounting
rate of return is especially important if a firm must provide banks with periodic financial state-
ments, or is required to comply with loan covenants based on financial statement ratios.
The most theoretically correct method—discounted cash flow analysis—is the primary
investment evaluation method of only 12 percent of the firms. Not surprisingly, owners with ad-
vanced/professional degrees are most likely to use this method, with 17 percent of these firms
identifying it as their primary evaluation tool. Firms with written business plans and those that
consider the tax implications of investments are also significantly more likely to use discounted
cash flow techniques. Thus, firms using this project evaluation method are among the most so-
phisticated of the small firms. Another noteworthy finding is that 18 percent of the firms in busi-
ness less than six years use this method, the most of any age group. Although younger firms are
less likely to have complete management teams in place, it is also possible that banks encourage
younger firms to demonstrate that adequate planning (and project evaluation) procedures are in
place before extending credit.
Of the specific evaluation techniques firms could choose from, ‘combination’ was se-
lected least often, by 11 percent of the firms. The use of this method does not appear to be
strongly related to any of the firm characteristics listed in Table 4.
The results in Table 4 stand in stark contrast to those in Graham and Harvey (2001). In
their study, approximately 75 percent of the firms evaluate projects using estimates of project net
present value or internal rate of return. In addition, the vast majority of the firms in their study
appear to consider multiple measures of project value when making investment decisions. How-
ever, the smaller firms in their study are much larger than the firms in the NFIB survey, and are

14
thus more likely to have complete management teams in place. For this reason, it is not surpris-
ing that the firms in their study use more sophisticated methods of project analysis than the firms
in the NFIB sample.
D. Multivariate Analysis
To provide a multivariate perspective on how small firms make investment decisions, we
use multinomial logit to jointly identify factors influencing the choice of a project evaluation tool.
This technique is appropriate when an unordered response (the set of project evaluation tools) has
more than two outcomes. Table 5 reports the results of this exercise, with gut feel as the omitted
category. Thus, the coefficients listed in Table 5 should be interpreted as the increase (for a posi-
tive coefficient) or the decrease (for a negative coefficient) in the log odds between the evaluation
tool shown and gut feel.
Insert Table 5 here
The results in Table 5 show that firms using any of the formal investment evaluation
tools (payback period, accounting rate of return, discounted cash flows, or combination) are more
likely to make cash flow projections than firms using gut feel. In addition, firms using the ac-
counting rate of return, discounted cash flows, or combination are more likely to consider tax im-
plications when evaluating potential projects. These results corroborate those in Table 4—firms
using gut feel to evaluate projects have much weaker overall planning environments than other
firms.
Table 5 also identifies factors that differentiate between firms attaching primary impor-
tance to the various investment evaluation tools. Most notably, Table 5 suggests that capital con-
straints and growth strategies can influence how firms evaluate projects.
The wait for cash coefficient is positive and significant for both payback period and dis-
counted cash flow analysis. These results suggest that firms committed to funding projects inter-
nally (i.e., they will wait for cash) are not necessarily irrational or unsophisticated. Instead, the

15
decision to wait for cash might be an acknowledgement that the firm does not operate in perfect
financial markets, and faces capital constraints. Because the firm knows that it may not be able to
fund all valuable projects, it will evaluate projects using the payback period (to help it allocate
investment funds over a multi-year horizon) or discounted cash flow analysis (to help it identify
the best projects).
The accounting rate of return and discounted cash flow analysis are favored by firms pur-
suing growth strategies. The coefficients for both expanding product lines and entering new
product line are positive and significant for accounting rate of return.
As a firm grows, it may need to raise new capital, either by obtaining a bank loan or by attracting
new equity investors. In either case, the firm’s historical and projected financial statements will
be used to communicate information about the firm to investors. The accounting rate of return
can be valuable to firms pursuing growth strategies because it provides information about how a
project will affect a firm’s financial statements (and its ability to meet accounting-based loan
covenants).
The importance of discounted cash flow analysis depends on the type of growth the firm
is pursuing. The coefficient for expanding an existing product line is positive and significant for
discounted cash flows, but the coefficient for new product line is not. Firms will use discounted
cash flows to evaluate projects extending existing product lines because future cash flow esti-
mates can be based on past performance in this case. But, if it is entering a new product line,
where obtaining future cash flow estimates can be difficult, the firm is less likely to use a dis-
counted cash flow method of analysis.
IV. Conclusions
Using survey data, we document the capital budgeting practices of small firms, defined as
those with less than 250 employees. We find that these firms analyze potential investments using
much less sophisticated methods of analysis than those recommended by capital budgeting theory

16
and those employed by larger firms (Graham and Harvey, 2001). In particular, discounted cash
flow analysis is employed less frequently than gut feel, payback period, and accounting rate of
return.
Because many small-business owners have limited formal education, a lack of financial
sophistication is certainly an important reason why the capital budgeting practices of small firms
differ so dramatically from the recommendations of finance texts. However, we also propose two
more substantive reasons why small firms do not rely on the theoretically correct tools when
evaluating projects.
First, many small firms face capital constraints, and thus do not operate in the perfect
capital markets required by capital budgeting theory. Many of the firms in our sample are very
small (i.e., have less than 10 employees), have limited operating histories (almost half have been
in business for less than 10 years), and have owners without a college education. These charac-
teristics may limit the amount of bank credit the firms can obtain. If so, the firms may be re-
quired to finance some future investments using internally generated funds, and it is not surpris-
ing that measures of project liquidity (such as the payback period) are evaluated before making
investments.
Second, many of the investments made by small firms cannot easily be evaluated using
the discounted cash flow techniques recommended by capital budgeting theory. Many invest-
ments by small firms are not optional (i.e., the firm must make a specific investment or go out of
business) and future incremental cash flows (other than direct purchase costs) can be difficult to
isolate. For example, if a firm must replace a delivery truck, it may be difficult for the firm to
estimate differences in the future annual operating costs of two replacement vehicles under con-
sideration. Thus, it is not surprising that gut feel is frequently used by small firms to analyze cer-
tain investments.
These results suggest that capital budgeting theory does not provide small firms with
adequate guidance when making investment decisions. If a firm faces capital constraints, the

17
payback period and the accounting rate of return can provide managers with useful (albeit incom-
plete) information about the value of a project. However, the capital budgeting literature is silent
about how this information should be used to supplement a discounted cash flow analysis. The
small business literature (i.e, Ang 1992 and Keasey and Watson 1993) describes some of the spe-
cific capital budgeting challenges small firms face, but a fully integrated capital budgeting the-
ory—identifying the conditions under which discounted cash flow analysis must be supplemented
with other information—has yet to be developed. The question of how to better tailor the pre-
scriptions of capital budgeting theory for small firms remains an important topic for future re-
search.
References
Almeida, H., M. Campello, and M. Weisbach, 2004. The cash flow sensitivity of cash, Journal of Finance, 59, 1777-1804.
Ang, J., 1992. On the theory of finance for privately held firms, The Journal of Small Business
Finance 1 : 1-13. Bierman, H., 1993. Capital budgeting in 1992 : A survey, Financial Management, 22, 24. Brealey R. and S. Myers, 2003. Principles of Corporate Finance, New York, NY, McGraw-
Hill/Irwin. Cole, R., 1998. The importance of relationships to the availability of credit, Journal of Banking
and Finance 22, 959–977. Danielson, M. and J. Scott, 2004. Bank loan availability and trade credit demand, Financial Re-
view 39, 579-600. Graham J. and C. Harvey, 2001. The theory and practice of corporate finance: evidence from the
field, Journal of Financial Economics 60, 187-243. Keasey K. and R. Watson, 1993. Small Firm Management: Ownership, Finance and Perform-
ance, Oxford: Blackwell. Moore J. and A. Reichert, 1983. An analysis of the financial management techniques currently
employed by large U.S. corporations, Journal of Business Finance and Accounting 10, 623-645.
Petersen, M. and R. Rajan, 1994. The benefits of firm-creditor relationships: Evidence from small
business data, Journal of Finance 49, 3–37.

18
Petersen, M. and R. Rajan, 1995. The effect of credit market competition on lending relation-ships, Quarterly Journal of Economics 60, 407–444.
Scott, D. Jr., and W. Petty II, 1984. Capital budgeting practices in large American firms: A retro-
spective analysis and synthesis, Financial Review, 19: 111-123. Vos, A. and E. Vos, 2000. Investment decision criteria in small New Zealand businesses, Small
Enterprise Research, 8: 44-55.

No. of Obs % of TotalIndustry
Service 155 20Construction 194 24Retail/Wholesale 378 48Other 65 8
792 100Real Sales Growth (2 yr)
20+ percent 194 2410-19 percent 179 23+/- 10 percent 200 25Fell 10+ percent 187 24DK/NA 32 4
792 100Business age
< 6 years 183 236-10 years 173 2211-20 years 213 2721+ years 216 27DK/NA 7 1
792 100Employment
1 127 162-3 233 294-10 287 3610+ 145 18
792 100Owner Education Level
Less than college degree 415 52College degree 260 33Advanced/prof. Degree 105 13DK/NA 12 2
792 100Owner age
< 35 years 81 1035-44 years 194 2445-54 years 244 3155+ years 255 32DK/NA 18 2
792 100
The weighted distributions of the responses to the National Federation of Independent Business' Reinvesting in the Business Survey conducted by the Gallup Organization. The raw sample was drawn from Dun & Bradstreet files (firms with under 250 employees). Because the distribution of small firms is highly skewed (when ranked by size), interview quotas were established to ensure enough larger respondents. The final sample was weighted to reflect Bureau of Census population proportions by employment, industry and region.
Table I. NFIB Reinvesting In the Business Sample Description

Table II. Small Business Investment Activity
Replace
Expand Existing Product
New Product
Line OtherWait for
cashIndustry (NAICS)
Service 54++ 21 16– – 3 42Construction/Manufacturing 30– – 31++ 28+ 1– – 42Retail/Wholesale 49 18 24 5 45Other 55 12– 22 9++ 56
Real sales growth (2 yr)20+ percent 37– – 24 31++ 5 4510-19 percent 52 21 21 3 50+/- 10 percent 50 22 23 3 35Fell 10+ percent 47 20 16– – 5 47
Business age< 6 years 38– – 23 26 4 526-10 years 40 27+ 27 2 4411-20 years 51 16– 24 3 3821+ years 51 20 17– – 6 45
Employment1 47 20 20 5 582-3 47 20 21 4 434-10 42 25+ 26 2– 4310+ 48 19 23 5 37
Owner education levelLess than college degree 44 21 23 4 49College degree 45 20 23 4 38Advanced/prof. Degree 53 22 23 1 44
Owner age<35 years 33– – 23 29 9++ 4235-44 years 38– – 23 28 4 3845-54 years 49 21 23 1– – 4955+ years 51 20 19 4 47
Total 46 21 23 4 45
Type of Investment Recently Made
Percentage distributions are presented for the question, 'Measured in dollars, what was the purpose of the largest share of the investments made in your business in the last 12 months?' The last column presents the percent of firms that answered that they do not feel it is appropriate to borrow for any business investment. A '++' ('– –')indicates that the cell percentage is significantly greater than (less than) the column total, at a 5% significance level, and a '+' ('–') indicates that the cell percentage is significantly greater than (less than) the column total, at a 10% significance level, using a binomial Z-score.

Make CF projections
Written business plan
Taxes calculated/con-
sideredIndustry (NAICS)
Service 71 34 72Construction/Manufacturing 68 32 71Retail/Wholesale 70 30 75Other 67 27 83+
Real sales growth (2 yr)20+ percent 74 38++ 79+
10-19 percent 66 29 75+/- 10 percent 68 28 74Fell 10+ percent 70 29 68
Business age< 6 years 80+ + 46+ + 79+
6-10 years 71 28 7211-20 years 71 28 7221+ years 58– – 23– – 74
Employment1 61– – 35 752-3 64– 24– – 774-10 72 33 7210+ 81++ 36 74
Owner education levelLess than college degree 65– 27– 73College degree 73 35 75Advanced/prof. Degree 81++ 38 83++
Owner age<35 years 80 40+ 7335-44 years 73 37+ 7845-54 years 69 34 7355+ years 66 21– – 74
Wait for cash 69 32 77Investment type
Replacement 67 23– – 72Expand existing product 71 37+ 76New product line 74 42+ + 80+
Other 81 49+ 83Total 69 31 74
This table presents the responses to three questions related to planning tools used in the evaluation of capital investmentsThe first, 'Make CF projections', presents the percentage of respondents answering 'Yes' to the question, 'Do you typically make cash flow projections prior to making major investments in your business?' The second, 'Written business plan,' presents the percentage of respondents answering yes to the question, 'Do you have a written business plan projecting the major investments you plan to make in your business over the next few years?' The third, 'Taxes calculated/considered,' presents the percentage of respondents reporting 'calculate' or 'consider' to the question, 'Do you typically calculate the tax implications, consider the tax implications, or ignore the tax implications prior to making a major investment in your business?' A '++' ('– –') indicates that the cell percentage is significantly greater than (less than) the column total, at a 5% significance level, and a '+' ('–') indicates that the cell percentage is significantly greater than (less than) the column total, at a 10% significance level, using a binomial Z-score.
Planning Tools
Table III. Small Business Investment Planning Tools
Payback ARR DCFGut feel Combo
Industry (NAICS)Service 18 11 13 33+ + 11Construction/Manufacturing 19 14 11 22 15+
Retail/Wholesale 19 16 13 25 8–
Other 23 6– 9 29 14Real sales growth (2 yr)
20+ percent 15 17 14 26 910-19 percent 26+ + 14 11 27 9+/- 10 percent 21 12 11 24 12Fell 10+ percent 18 11 14 31 9
Business age< 6 years 21 14 18+ + 24 86-10 years 19 10 12 29 911-20 years 17 19+ + 13 23 1121+ years 20 11 7– – 28 14
Employment1 22 14 13 25 112-3 20 15 11 25 124-10 16 12 13 28 1010+ 21 16 12 25 9
Owner education levelLess than college degree 18 12 12 29 10College degree 20 18+ 10 23 12Advanced/prof. Degree 24 11 17+ + 17– – 13
Owner age<35 years 26 10 14 19 1435-44 years 14– – 19+ + 18+ + 21 1145-54 years 24+ + 15 7– – 31+ 1055+ years 16 11 13 27 11
Wait for cash 21 12 15 24 8Investment type
Replacement 20 11 12 31+ + 13Expand existing product 20 14 17+ 20– 8New product line 19 20+ + 9 23 13Other 21 17 14 14 3
Planning toolsMake CF projection 23++ 15 14 22– 13Written business plan 19 18+ 16+ 20– – 13Taxes calculated/considered 20 16 14+ 24 12
Total 19 14 12 26 11
Investment Tools
This table presents the percentage distributions of the responses to the question, 'When you consider making a major investment in your business, how do you assess its financial viability?Do you primarily use….' Each of the five responses are reported under Investment Tools in below. A '++' ('– –') indicates that the cell percentage is significantly greater than (less than) the column total, at a 5% significance level, and a '+' ('–') indicates that the cell percentage is significantly greater than (less than) the column total, at a 10% significance level, using a binomial Z-score.
Table IV. Small Business Investment Decision Tools

Coeff Std Err Coeff Std Err Coeff Std Err Coeff Std ErrIndustry
Manufacturing/construction 0.221 0.332 0.512 0.383 0.040 0.399 0.512 0.379Retail/wholesale -0.063 0.287 0.621 0.333 * 0.259 0.334 -0.505 0.362Service/other (omitted)
2-Year Real Sales Growth10% or higher (omitted)No change (+/- 10%) 0.374 0.296 -0.142 0.336 0.347 0.360 0.250 0.35610% or lower -0.330 0.305 -0.420 0.338 0.226 0.342 -0.252 0.366
Business ageUnder 6 years (omitted)6-10 years 0.151 0.362 -0.216 0.411 -0.179 0.400 0.349 0.48911-20 years 0.451 0.381 0.924 0.391 ** 0.314 0.403 1.404 0.485 ***
20+ years 0.604 0.384 0.442 0.422 -0.482 0.461 1.671 0.499 ***
EmploymentUnder 4 (omitted)4-10 -0.666 0.278 ** -0.570 0.310 * -0.346 0.321 -0.838 0.336 **
Over 10 -0.503 0.331 -0.336 0.358 -0.243 0.397 -1.067 0.418 **
Owner education levelCollege (BA or AA) 0.251 0.268 0.299 0.287 -0.206 0.322 0.085 0.327Graduate school 0.915 0.388 ** 0.059 0.461 0.683 0.439 1.104 0.472 **
No college (omitted)Owner age
Under 35 1.367 0.486 *** 0.249 0.578 0.448 0.551 1.712 0.603 ***
35-44 0.448 0.371 0.881 0.374 ** 0.565 0.378 0.803 0.441 *
45-54 0.432 0.296 0.164 0.336 -0.845 0.384 ** 0.089 0.37055 up (omitted)
Wait for cash 0.426 0.241 * -0.084 0.269 0.593 0.280 ** -0.452 0.305Investment type
Expand product line 0.381 0.313 0.640 0.339 * 0.880 0.343 ** -0.018 0.395New product line 0.255 0.305 0.637 0.322 ** 0.031 0.377 0.334 0.361Replacement (omitted)
Planning toolsCash flow projection made 1.297 0.286 *** 0.635 0.296 ** 0.731 0.323 ** 1.157 0.357 ***
Written business plan -0.041 0.275 0.363 0.297 0.422 0.308 0.397 0.322Taxes ignored 0.047 0.274 -0.744 0.344 ** -1.020 0.394 *** -0.762 0.388 **
Constant -3.836 1.512 ** -1.849 1.646 -0.461 1.738 -3.402 1.898 *
Table V. Multinomial Logit Results of Project Evaluation Tool Selection
This table presents the mulitnomial logit estimates for factors influencing the choice of a project evaluation tool. All of the dependent variables are 1/0 variables that take a value of 1 if the firm relies on a specific project evaluation tool when evaluating major investments. The omitted choice is 'gut feel'; thus the significance of the coefficients should be interpreted as the effect on the log odds of the evaluation tool choice relative to 'gut feel'. In each case where there is a set of 1/0 variables for the independent variable, the omitted variable is identified and significance should be interpreted relative to this omitted variable. *** indicates significance at the .01 level, ** significance at the .05 level and * significance at the .10 level. The observations included in these estimates are limited to those respondents reporting one of the five investment analysis techniques, which limits the sample size to 583 observations.
CombinationPayback Rate of Return DCF